Article

Remote-Sensing Estimation of Upwelling-Frequent Areas in the Adjacent Waters of Zhoushan (China)

1
School of Marine Sciences, Nanjing University of Information Science and Technology, Nanjing 210044, China
2
School of Electronics & Information Engineering, Nanjing University of Information Science and Technology, Nanjing 210044, China
3
SANYA Oceanographic Laboratory, Sanya 572000, China
4
Jiangsu Tidal Flat Research Center, Nanjing 210036, China
5
Department of Applied Social Sciences, The Hong Kong Polytechnic University, Hong Kong 999077, China
6
Department of Architecture and Civil Engineering, City University of Hong Kong, Hong Kong 999077, China
*
Author to whom correspondence should be addressed.
J. Mar. Sci. Eng. 2024, 12(7), 1085; https://doi.org/10.3390/jmse12071085
Submission received: 3 June 2024 / Revised: 25 June 2024 / Accepted: 25 June 2024 / Published: 27 June 2024
(This article belongs to the Special Issue New Advances in Marine Remote Sensing Applications)

Abstract

:
Upwelling, which mixes deep and surface waters, significantly enhances the productivity of surface waters and plays a critical role in marine ecosystems, especially in key fishing areas like Zhoushan. This study utilized merged sea surface temperature data and an upwelling edge detection algorithm based on temperature gradients to analyze the characteristics of upwelling in Zhoushan and the Yangtze River Estuary over the past 28 years. The results indicate that upwelling in Zhoushan begins in April, peaks in July, gradually weakens, and disappears by October. The phenomenon is most pronounced during the summer months (June to August), with significant spatial distribution differences in April and September. Notably, high probability values of upwelling centers and core areas are mainly concentrated near Ma’an Island, Zhongjieshan Island, and Taohua Island. In these areas, upwelling remains stable during the summer, forming a unique “footprint” distribution pattern, and these are also the locations of the Zhoushan National Marine Ranch. From April to August, the extent of the upwelling area gradually decreases and stabilizes. These findings emphasize the frequent upwelling activity around Zhoushan and its significant contribution to the formation of local fisheries. Additionally, considering that the formation of natural upwelling in the East China Sea depends on the southern monsoon, the study suggests establishing artificial upwelling systems during periods unfavorable for natural upwelling, based on high probability areas, to enhance fishery yields and support the development of local fisheries.

1. Introduction

There are many types of seawater movement in the ocean, which together maintain the ecological balance of the ocean. Upwelling is one of these, which contributes greatly to the vertical mixing of deep water and surface water with a weak vertical velocity (10−6 to 10−4 m/s). When upwelling occurs in a certain place, the deep-sea water rich in nutrients exchanges and mixes with the surface sea water, which promotes the reproduction of plankton, increases the primary productivity of this sea area, and provides abundant food for fish and other marine organisms, attracting them to stay and breed [1]. The upwelling along the coast of Somalia and the eastern part of the Arabian Peninsula is one of the strongest in the world, and this area is considered one of the richest in fishery resources in Africa [2]. The strong upwelling along the coast of Peru also makes this sea area the world’s largest anchovy producer, and breeds large seabirds. There are also upwellings in the coastal waters of Taiwan and Zhejiang in China and the outer sea of the Yangtze River estuary (YRE). Both Zhoushan waters along the coast of Zhejiang and the outer sea of the YRE have important fishing grounds, and the Zhoushan fishing ground’s large yellow croaker and small yellow croaker are precious fishery resources. Upwelling is undoubtedly a key factor in the formation of fishing grounds.
The waters around Zhoushan are known for their upwelling and their unique geographical location, which have drawn much attention. Mao Hanli [3] was the first to point out the existence of upwelling in the Zhoushan sea area. Pan [4] and Xu [5] successively investigated and studied the coastal upwelling in Zhejiang, and believed that upwelling could also occur at the western boundary of the ocean. They obtained relevant evidence and characteristics of the coastal upwelling in Zhejiang through the analysis of temperature, salinity, density, and other factors. Later studies have demonstrated that this upwelling varies seasonally in summer and winter, and also fluctuates on other timescales [6,7]. The phenomenon starts in late May, intensifies in June, reaches its peak during July and August, and slowly diminishes from September to October [7]. Besides the significant seasonal variability, satellite data indicate that this upwelling exhibits both interannual and short-period variability [8,9].
Different opinions exist in the literature about the factors that contribute to the Zhoushan upwelling [10]. Upwelling usually occurs in coastal areas. Ekman [11] pointed out that the high productivity and low temperature water along the continental shelf is the result of wind stress. Jing et al. used quickscat wind field data to simulate the structure and seasonal variation of upwelling along the coast of Zhejiang and Fujian in the East China Sea (ECS), and believed that wind field is an important factor affecting Zhoushan upwelling [12]. In the northern hemisphere, coastal wind mainly drives the sea surface water by blowing it and adding the Coriolis force, resulting in a transport effect of 90° to the right of the wind direction. At the same time, the continuity of seawater forces the deep seawater to replenish upward, and upwelling is thus generated. In addition, according to the Ekman suction principle, when wind stress curl is positive, Ekman suction will also cause upwelling. According to Yin’s study, wind field is one of the causes of upwelling in Zhoushan waters. When the coastal wind stress curl is positive, upwelling occurs, and changes in the curl generally align with changes in the intensity of the upwelling [13]. Zhoushan upwelling is also affected by the erosion of coastal circulation. Lü et al. studied the causes of Zhoushan upwelling by the numerical simulation method; he believed that Taiwan’s warm current is the main factor in Zhoushan upwelling formation and that about 40% of upwelling is related to Taiwan’s warm current [14]. He pointed out in another article that tides also contribute to Zhoushan upwelling [15]. In previous studies, YRE upwelling has been considered to be mainly influenced by tidal mixing, Yangtze River discharge, Taiwan warm current, and topography. In addition, the studies on YRE upwelling also focus on its chlorophyll, plankton, nutrients, and other aspects [14,15,16,17,18,19].
Generally speaking, aside from the water that rises due to high temperature and low density, the sea water temperature in upwelling areas is lower than that of the surrounding waters because deep water itself is cold. Thus, areas of upwelling always display a low-temperature state in satellite imagery, making sea surface temperature (SST) an important research subject for characterizing upwelling [20]. From SST data, Hu [7] discovered that the upwelling zone in the Zhoushan marine area has an average temperature difference of 1.4 °C from the non-upwelling zone. Consequently, the SST in upwelling areas is significantly lower than that in nearby areas, forming a spatially footprint-shaped cold-water patch in satellite imagery of the sea surface (Figure 1). Based on the positive feedback of sea surface temperature on upwelling, as well as the successful outcomes of previous studies using temperature [21,22,23], this paper also employs sea surface temperature data to study upwelling. Although research on upwelling in Zhoushan began early, many scholars mentioned concepts like the upwelling center when studying upwelling [15,24,25], but early data limitations meant little statistical analysis of these structural features. Building on the research on Zhoushan upwelling, this paper, utilizing the distribution pattern of sea surface temperature in upwelling areas, develops a temperature-gradient-based upwelling edge detection algorithm. It extracts and statistically analyzes the surface structural features of upwelling, calculating probabilities using 28 years of daily data to analyze the characteristics of Zhoushan upwelling across multiple time scales. This aims to provide references for the site selection of artificial upwelling and marine ranching in Zhoushan, supporting the development of local fisheries.

2. Materials and Methods
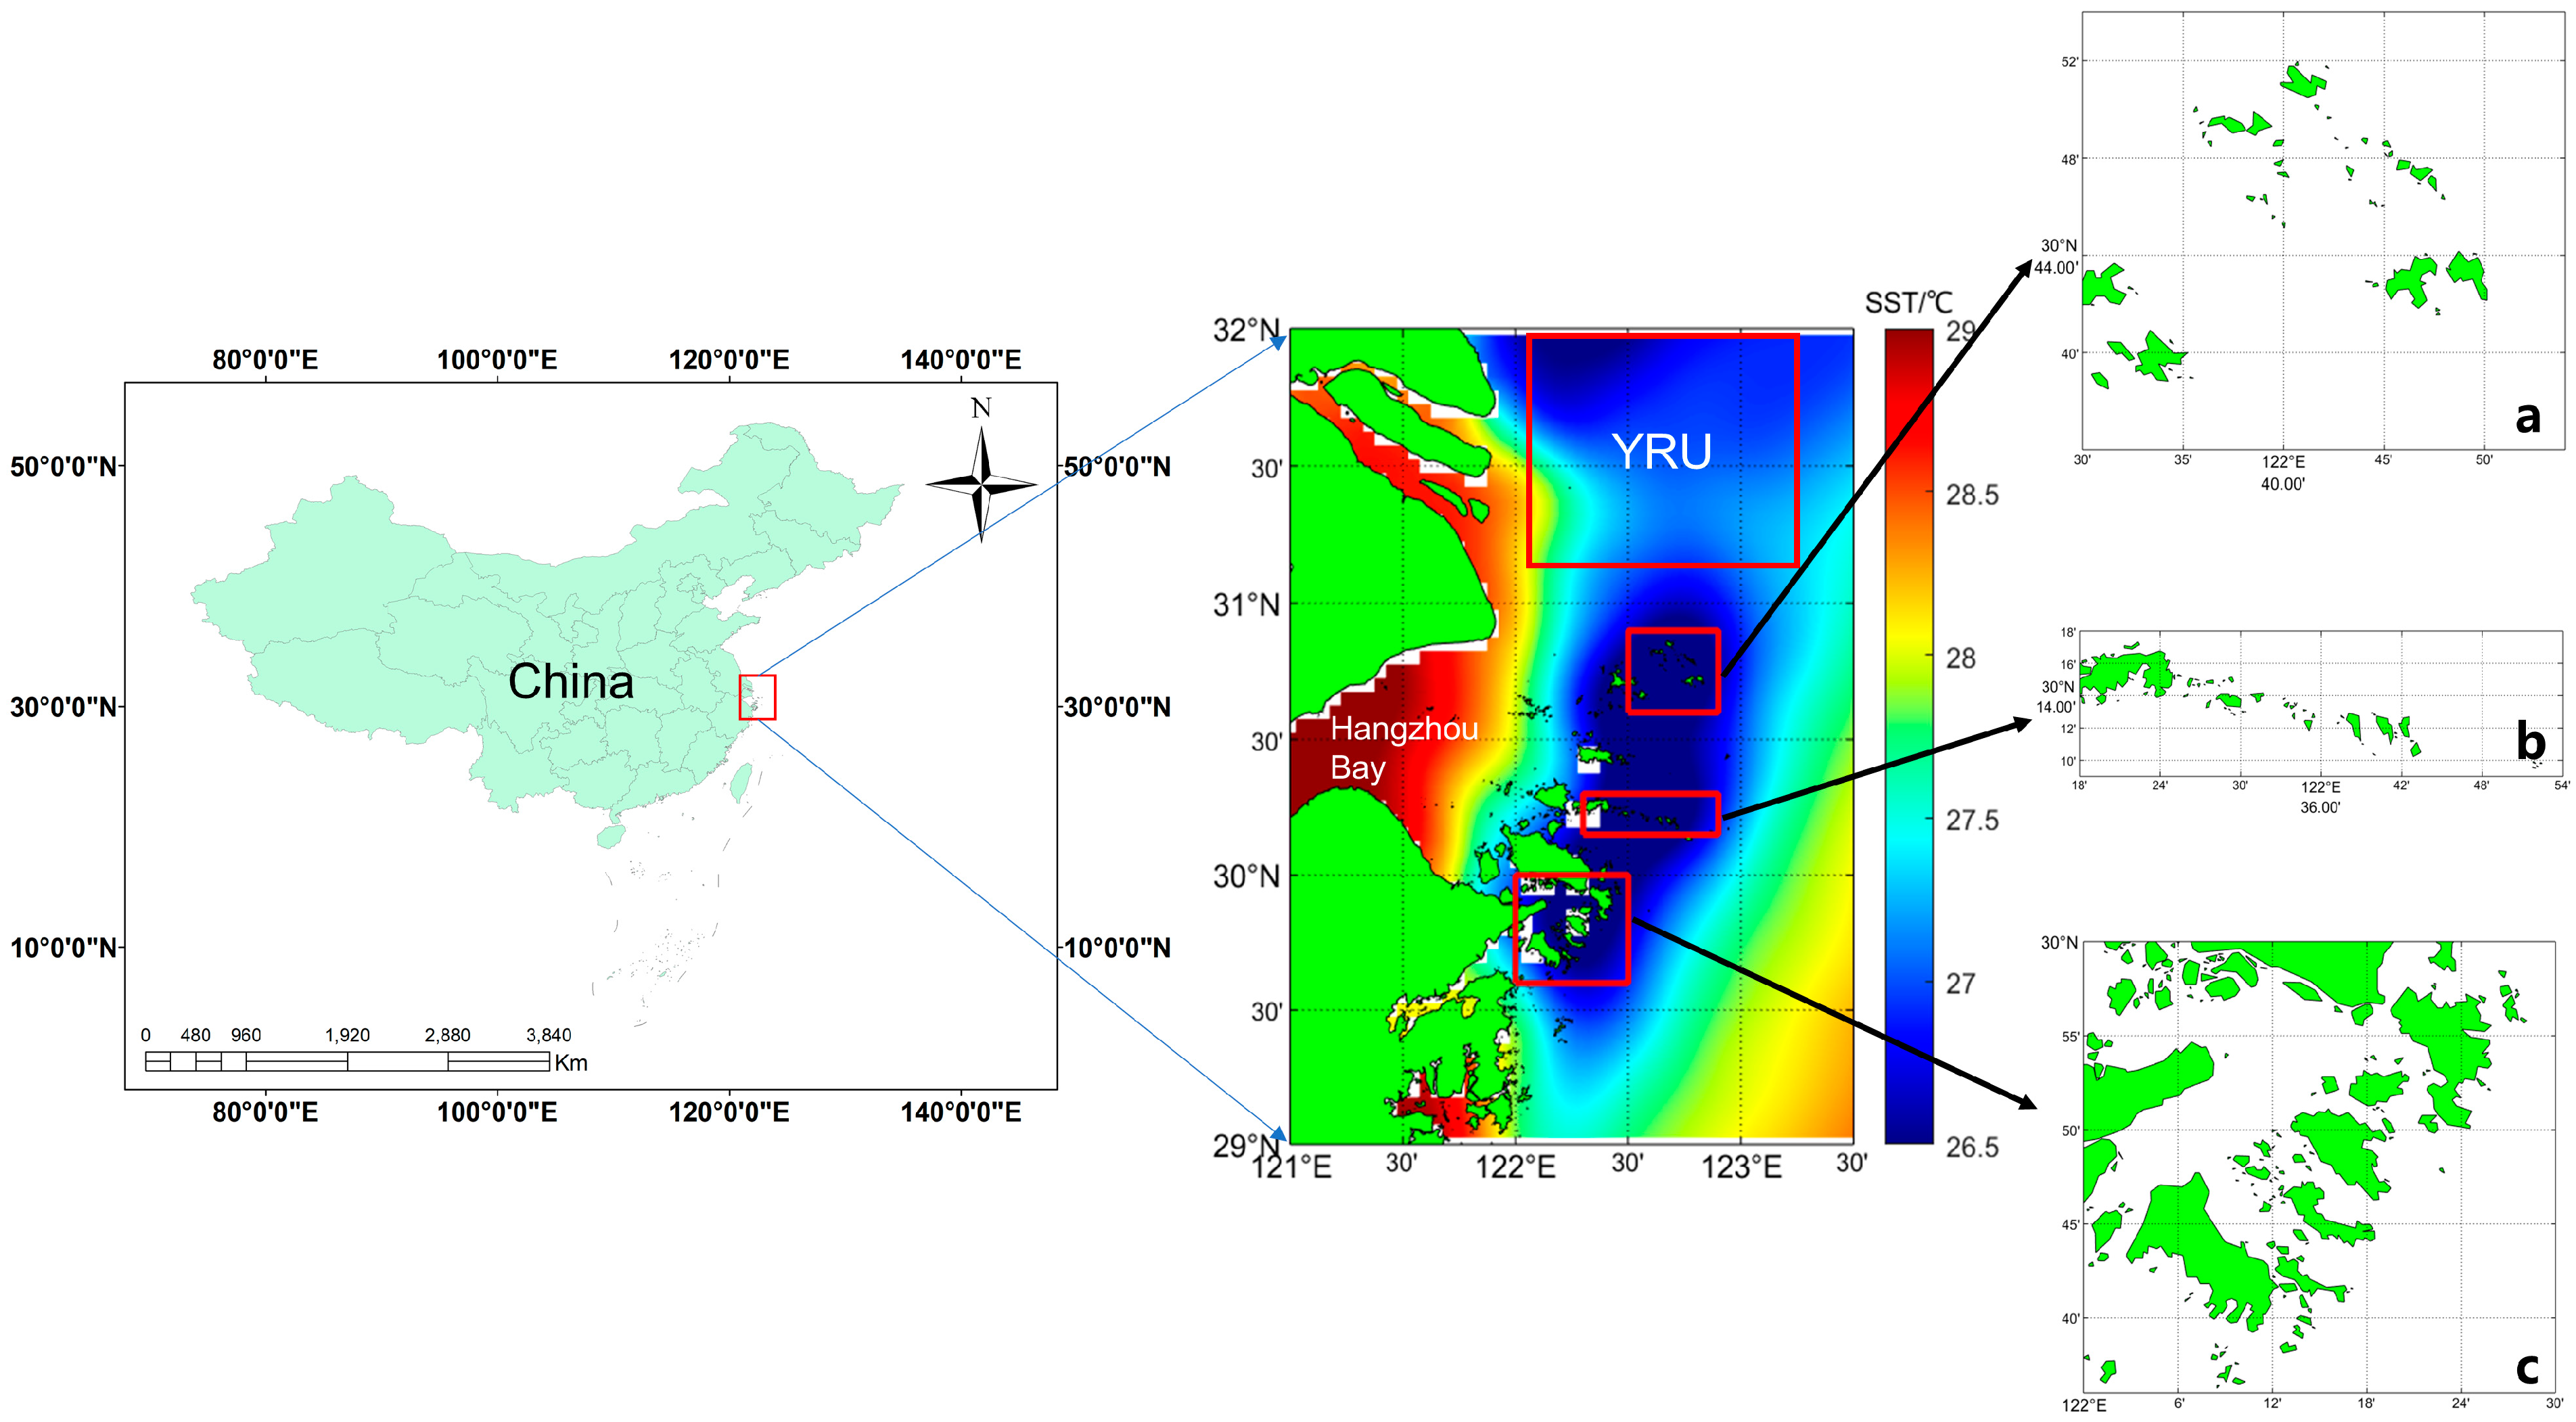
2.1. Study Area

The investigation in this paper encompasses the Zhoushan Sea area (29° N–31° N, 121.5° E–123.5° E) and the YRE sea area (31° N–32° N, 121.5° E–123.5° E). Positioned on the ECS continental shelf, to the east of Hangzhou Bay and southeast of the YRE, the Zhoushan Islands form the southwestern marginal sea area of the ECS. They represent the largest archipelago in China, consisting of a dense cluster of islands, situated within the subtropical monsoon climate zone, and are known for their strong seasonality. This region hosts China’s largest fishing grounds and several national-level marine ranches. The YRE, the world’s third-largest estuary, is sited in the ECS coast in eastern China, where the Yangtze River meets the sea [26]. The waters of the YRE are influenced by various marine water masses, characterized by complex and variable temperature conditions, rich nutrients, and high productivity. Human activities have had a negative impact on the ecological environment of the YRE sea area. Research has shown that 75% of China’s red tide occurrences are in the YRE sea area [27], highlighting the significance of research in these areas. The four regions labeled a, b, c, and YRU in Figure 1 correspond to Ma’an Island, Zhongjieshan Island, Taohua Island, and the Yangtze River Upwelling, respectively, which are the main focus of this study.

2.2. Data

2.2.1. ESA SST

The ESA SST data used in this paper are provided by the E.U. Copernicus Marine Service. The CCI and C3S global SST utilizes satellite data from various sensors, including (A)ATSRs, SLSTR, and AVHRR, to produce daily, gap-free maps of average SST at a depth of 20 cm, with a horizontal grid resolution of 0.05° × 0.05° [28]. These data are obtained by fusing multiple satellite data (the same as free maps) through the OSTIA system [29]. The temporal resolution is daily data, and the spatial resolution is 0.05° × 0.05° (about 5 km). Since statistical methods are needed, the data quantity should be large. The data time range used in this paper is 1989–2016, and the download address is: https://data.marine.copernicus.eu/product/SST_GLO_SST_L4_REP_OBSERVATIONS_010_024/download?dataset=ESACCI-GLO-SST-L4-REP-OBS-SST_202211, accessed on 31 March 2023. This fusion product only uses satellite data, so it is very stable.

2.2.2. GHRSST and MODIS SST
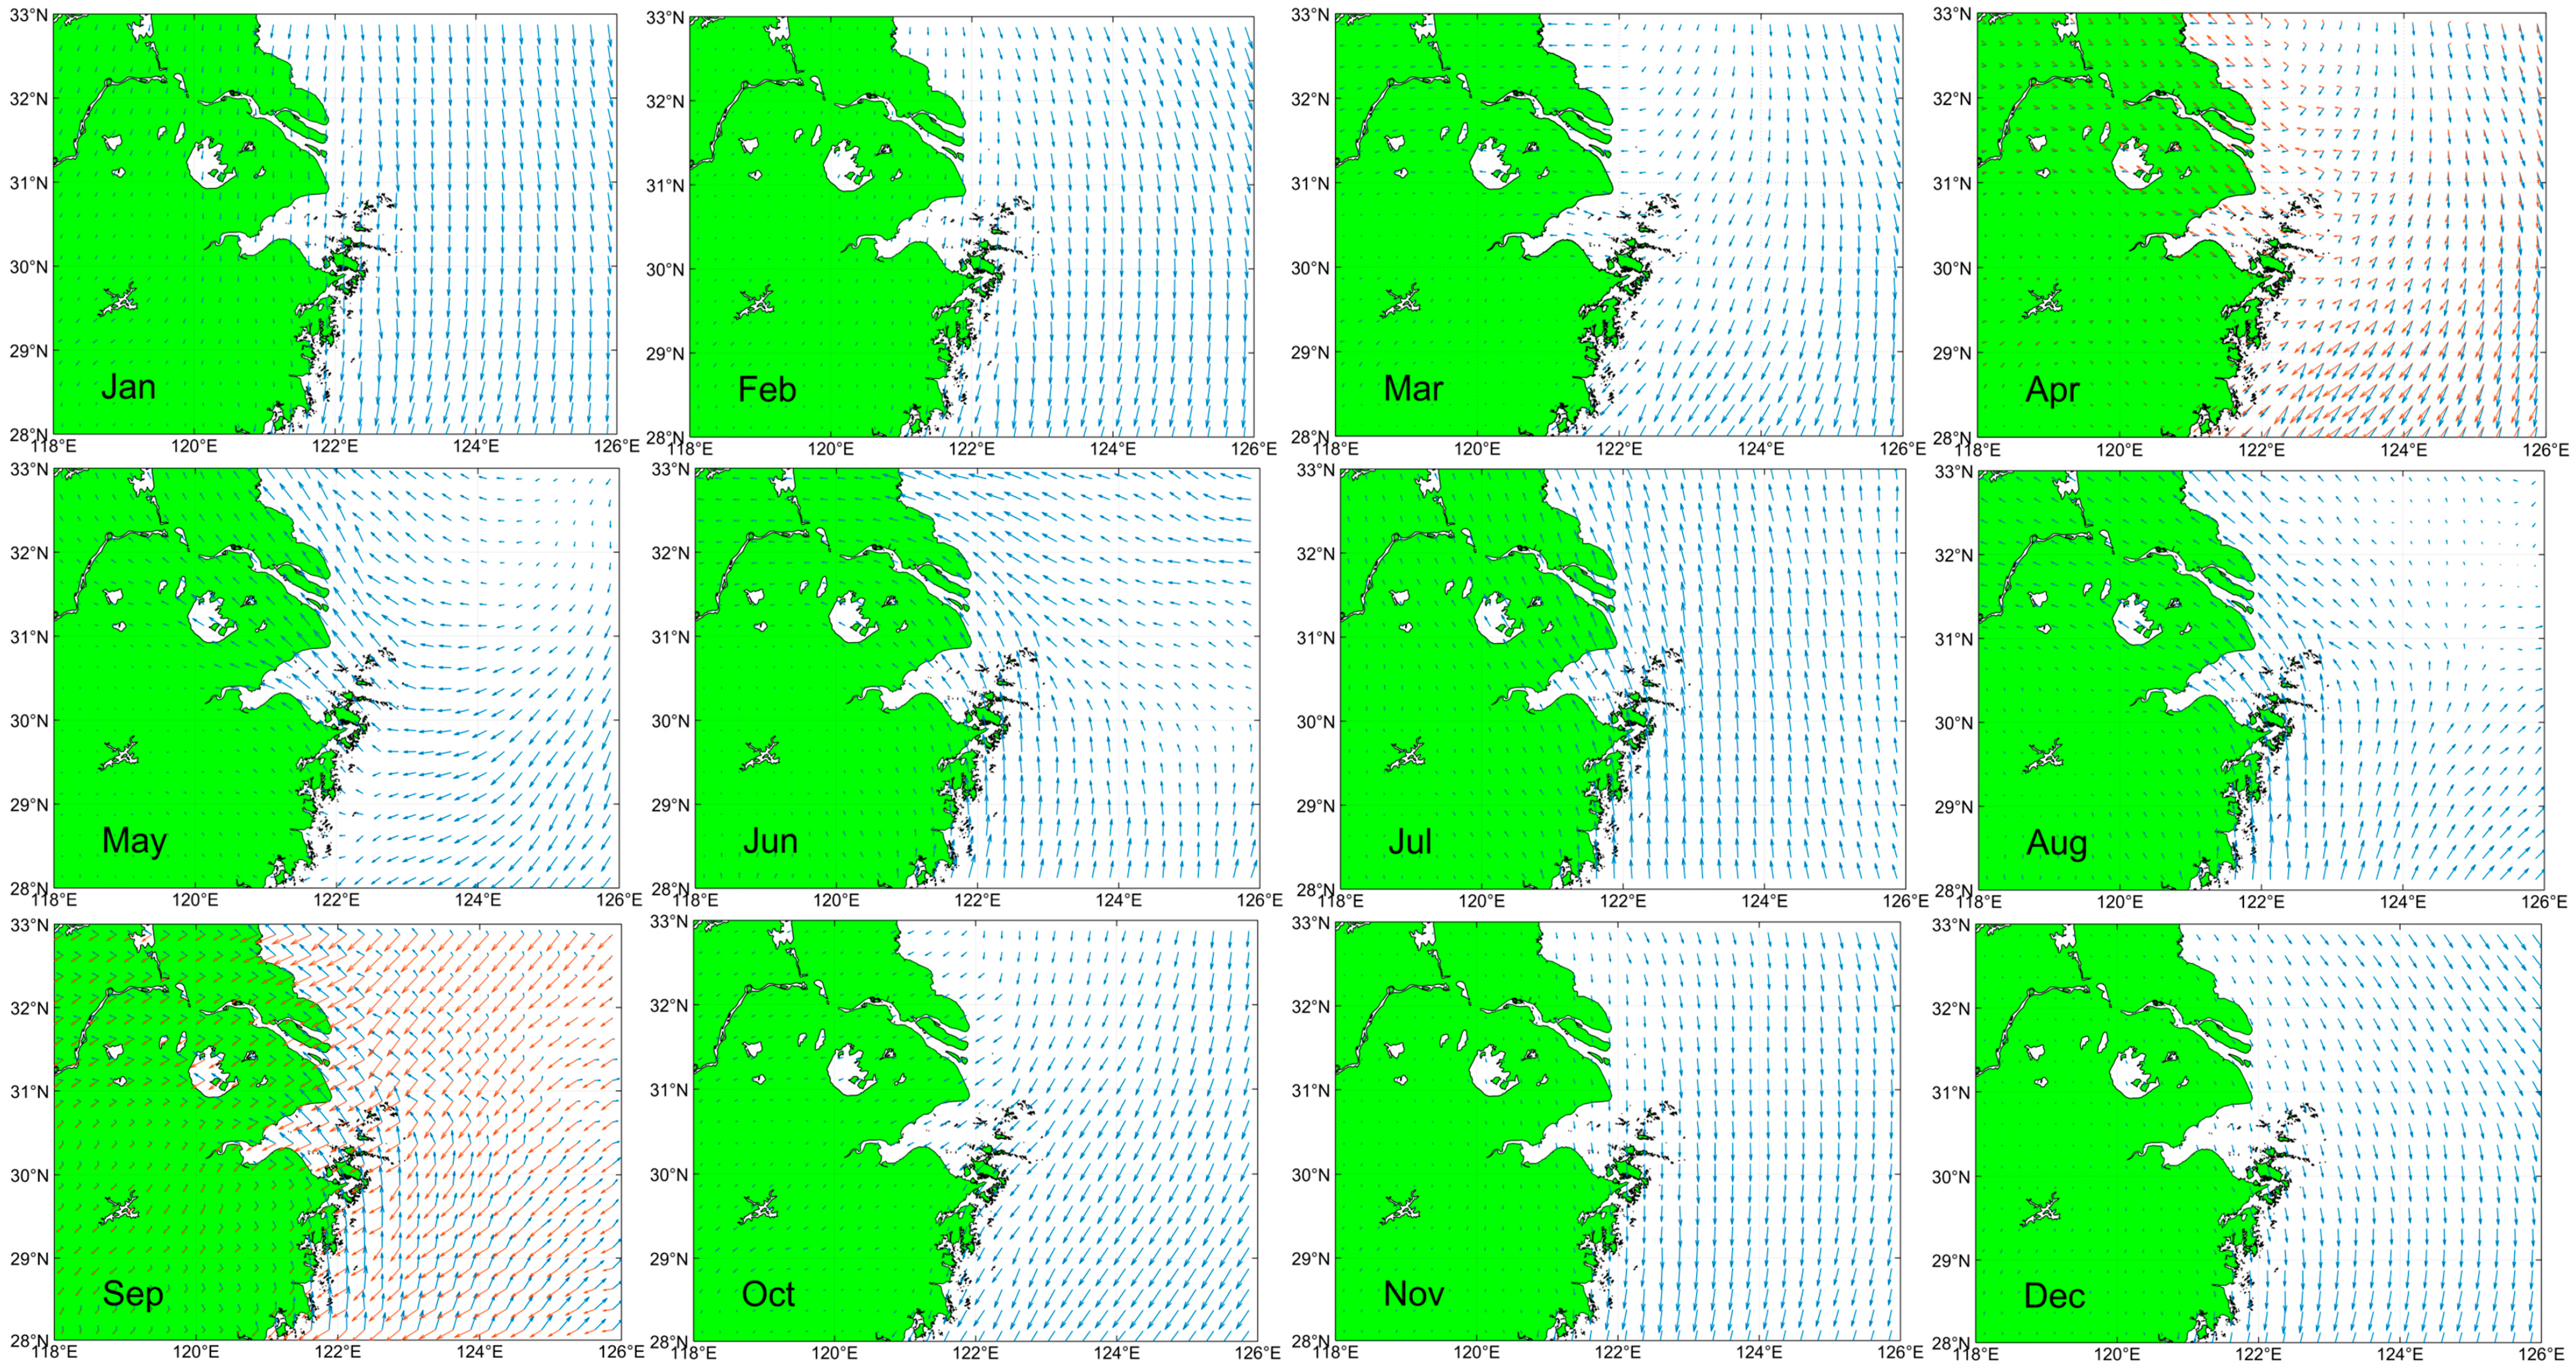
The second part of the SST data utilizes the NOAA/AVHRR global daily average high-resolution SST data (GHRSST), which originates from the NASA JPL Data Center. The data are available for the time range from 2003 to 2017, with a temporal resolution of daily and a spatial resolution of 0.01° × 0.01° (download address: https://podaac.jpl.nasa.gov/dataset/MUR-JPL-L4-GLOB-v4.1, accessed on 11 November 2023). Additionally, the Moderate-resolution Imaging Spectroradiometer (MODIS) SST data are sourced from NASA Ocean Color, with a spatial resolution of 0.04° × 0.04°. Due to the scarcity of effective data in the Zhoushan sea area for this product, 8-day daily data (0801, 0812, 0813, 0814, 0815, 0817, 0820, and 0829) for August 2013 were downloaded. The download address is: https://oceancolor.gsfc.nasa.gov/l3/order/, accessed on 14 December 2023.

2.2.3. Wind Data

The wind field data come from the Koninklijk Netherlands Meteorological Institute (KNMI), downloaded from the Copernicus website (https://doi.org/10.48670/moi-00181, accessed on 31 March 2022). The product is monthly average data, with a spatial resolution of 0.25° × 0.25°. The product is based on the monthly average ECMWF ERA5 reanalysis field, and uses all available level 3 scatterometer observations from the Metop-A, Metop-B, and Metop-C ASCAT satellite instruments to correct persistent biases, thus obtaining the wind field data.

2.3. Method

2.3.1. An Upwelling Edge Detection Algorithm Based on Temperature Gradient

The downloaded SST data can only meet part of the work requirements. We need to process the data to obtain sub-data necessary for other work aspects. The sub-data include the position of the SST lowest-temperature center (defined as the Upwelling Center, UPC, Figure 2), the position cluster of the low-temperature water mass (defined as the Upwelling Core Area, Figure 2), and the temperature difference between the average temperature of the core area and the outer boundary (SST(r) in Figure 2, defined as the Upwelling Intensity Index, UPI), among other elements.
For the low-temperature sea area caused by upwelling, it usually shows a low-temperature state on the satellite image, and the temperature difference with the surrounding seawater is relatively obvious. We cannot intuitively see the position of the lowest temperature value from the satellite image, nor can we judge the boundary of seawater with different temperatures. Therefore, we need to design a reasonable discrimination and extraction method based on the temperature distribution pattern of this sea area. As can be seen (Figure 2), the circular surface in the figure represents an idealized upwelling sea area, and the center of the circle represents the upwelling center and also the position of the lowest temperature value. The temperature increases continuously from the center to the outside along the radius, and when it rises to the sea area outside the upwelling (① in Figure 2), the temperature gradually becomes uniform and stable. This rise in temperature is not linear, so in the process of rising, the temperature gradient is also changing constantly. Based on the temperature gradient change curve (Figure 2), we developed an upwelling edge detection algorithm based on temperature gradient. The so-called edge detection is to determine and extract the temperature values of the low-temperature water core and the outer boundary of the upwelling sea area [22].
First, the position with the lowest temperature within the latitude range of 29.5° N to 31° N and the longitude range of 121.75° E to 123.25° E is identified as the upwelling center. After pinpointing the low-temperature center, a circle with a radius of 150 km centered on this point is drawn, marking 360 discrete points uniformly along the circumference. Each discrete point is connected to the center, forming a detection line for obtaining temperature gradients. The point with the maximum temperature gradient (y in Figure 2) is selected as the sampling point for the core area boundary, and the point with the minimum temperature gradient (r in Figure 2) is chosen as the sampling point for the boundary of the transition water area. Among the 360 detection lines, only those with more than 70% of valid temperature values (non-NAN values) are considered effective. After all the sampling points for the boundaries of the core area and transition water area are obtained on these detection lines, the temperatures at the corresponding positions in the temperature field are recorded as boundary temperature sampling points. The average temperature of all the sampling points is calculated to determine the temperature value of the core area boundary. The same method is applied to determine the temperature value of the transition water area boundary. This boundary is essentially a temperature contour line.

2.3.2. The Statistical Method and Probability Calculation for the Upwelling Centers and Core Area in Zhoushan Upwelling

(1) The longitude and latitude of the upwelling center points will be counted into arrays, respectively. The longitude and latitude will be divided into 0.05° × 0.05° pixels, and then the longitude and latitude of the upwelling will be determined. When the longitude and latitude of a center point belong to a certain pixel area, the number of upwelling centers contained in this pixel will be increased by one. By this method, all the positions will be determined, and finally the number of upwelling centers corresponding to all pixels will be obtained. (2) There is one center point position information every day, but the core area contains several pieces of position information every day. The determination method is the same as that of the upwelling center, but the difference is that the statistical workload of the core area is larger. Dividing the number of positions of each pixel by the total number of days counted can obtain the probability value of the corresponding pixel area [30].
UPP ( Upwelling   probability ) = N upwellingpoints N days
Nupwellingpoints is the number of positions in each pixel area, and Ndays is the total count of days counted.
Since the data spatial resolution is 0.05° × 0.05°, one position is equivalent to an area of 25 km2. The core area can be obtained by converting the count of positions contained in the core area into area. The number of positions contained in the a, b, and c areas (Figure 1) are extracted, respectively, and the count of center points in the area is obtained.

3. Results

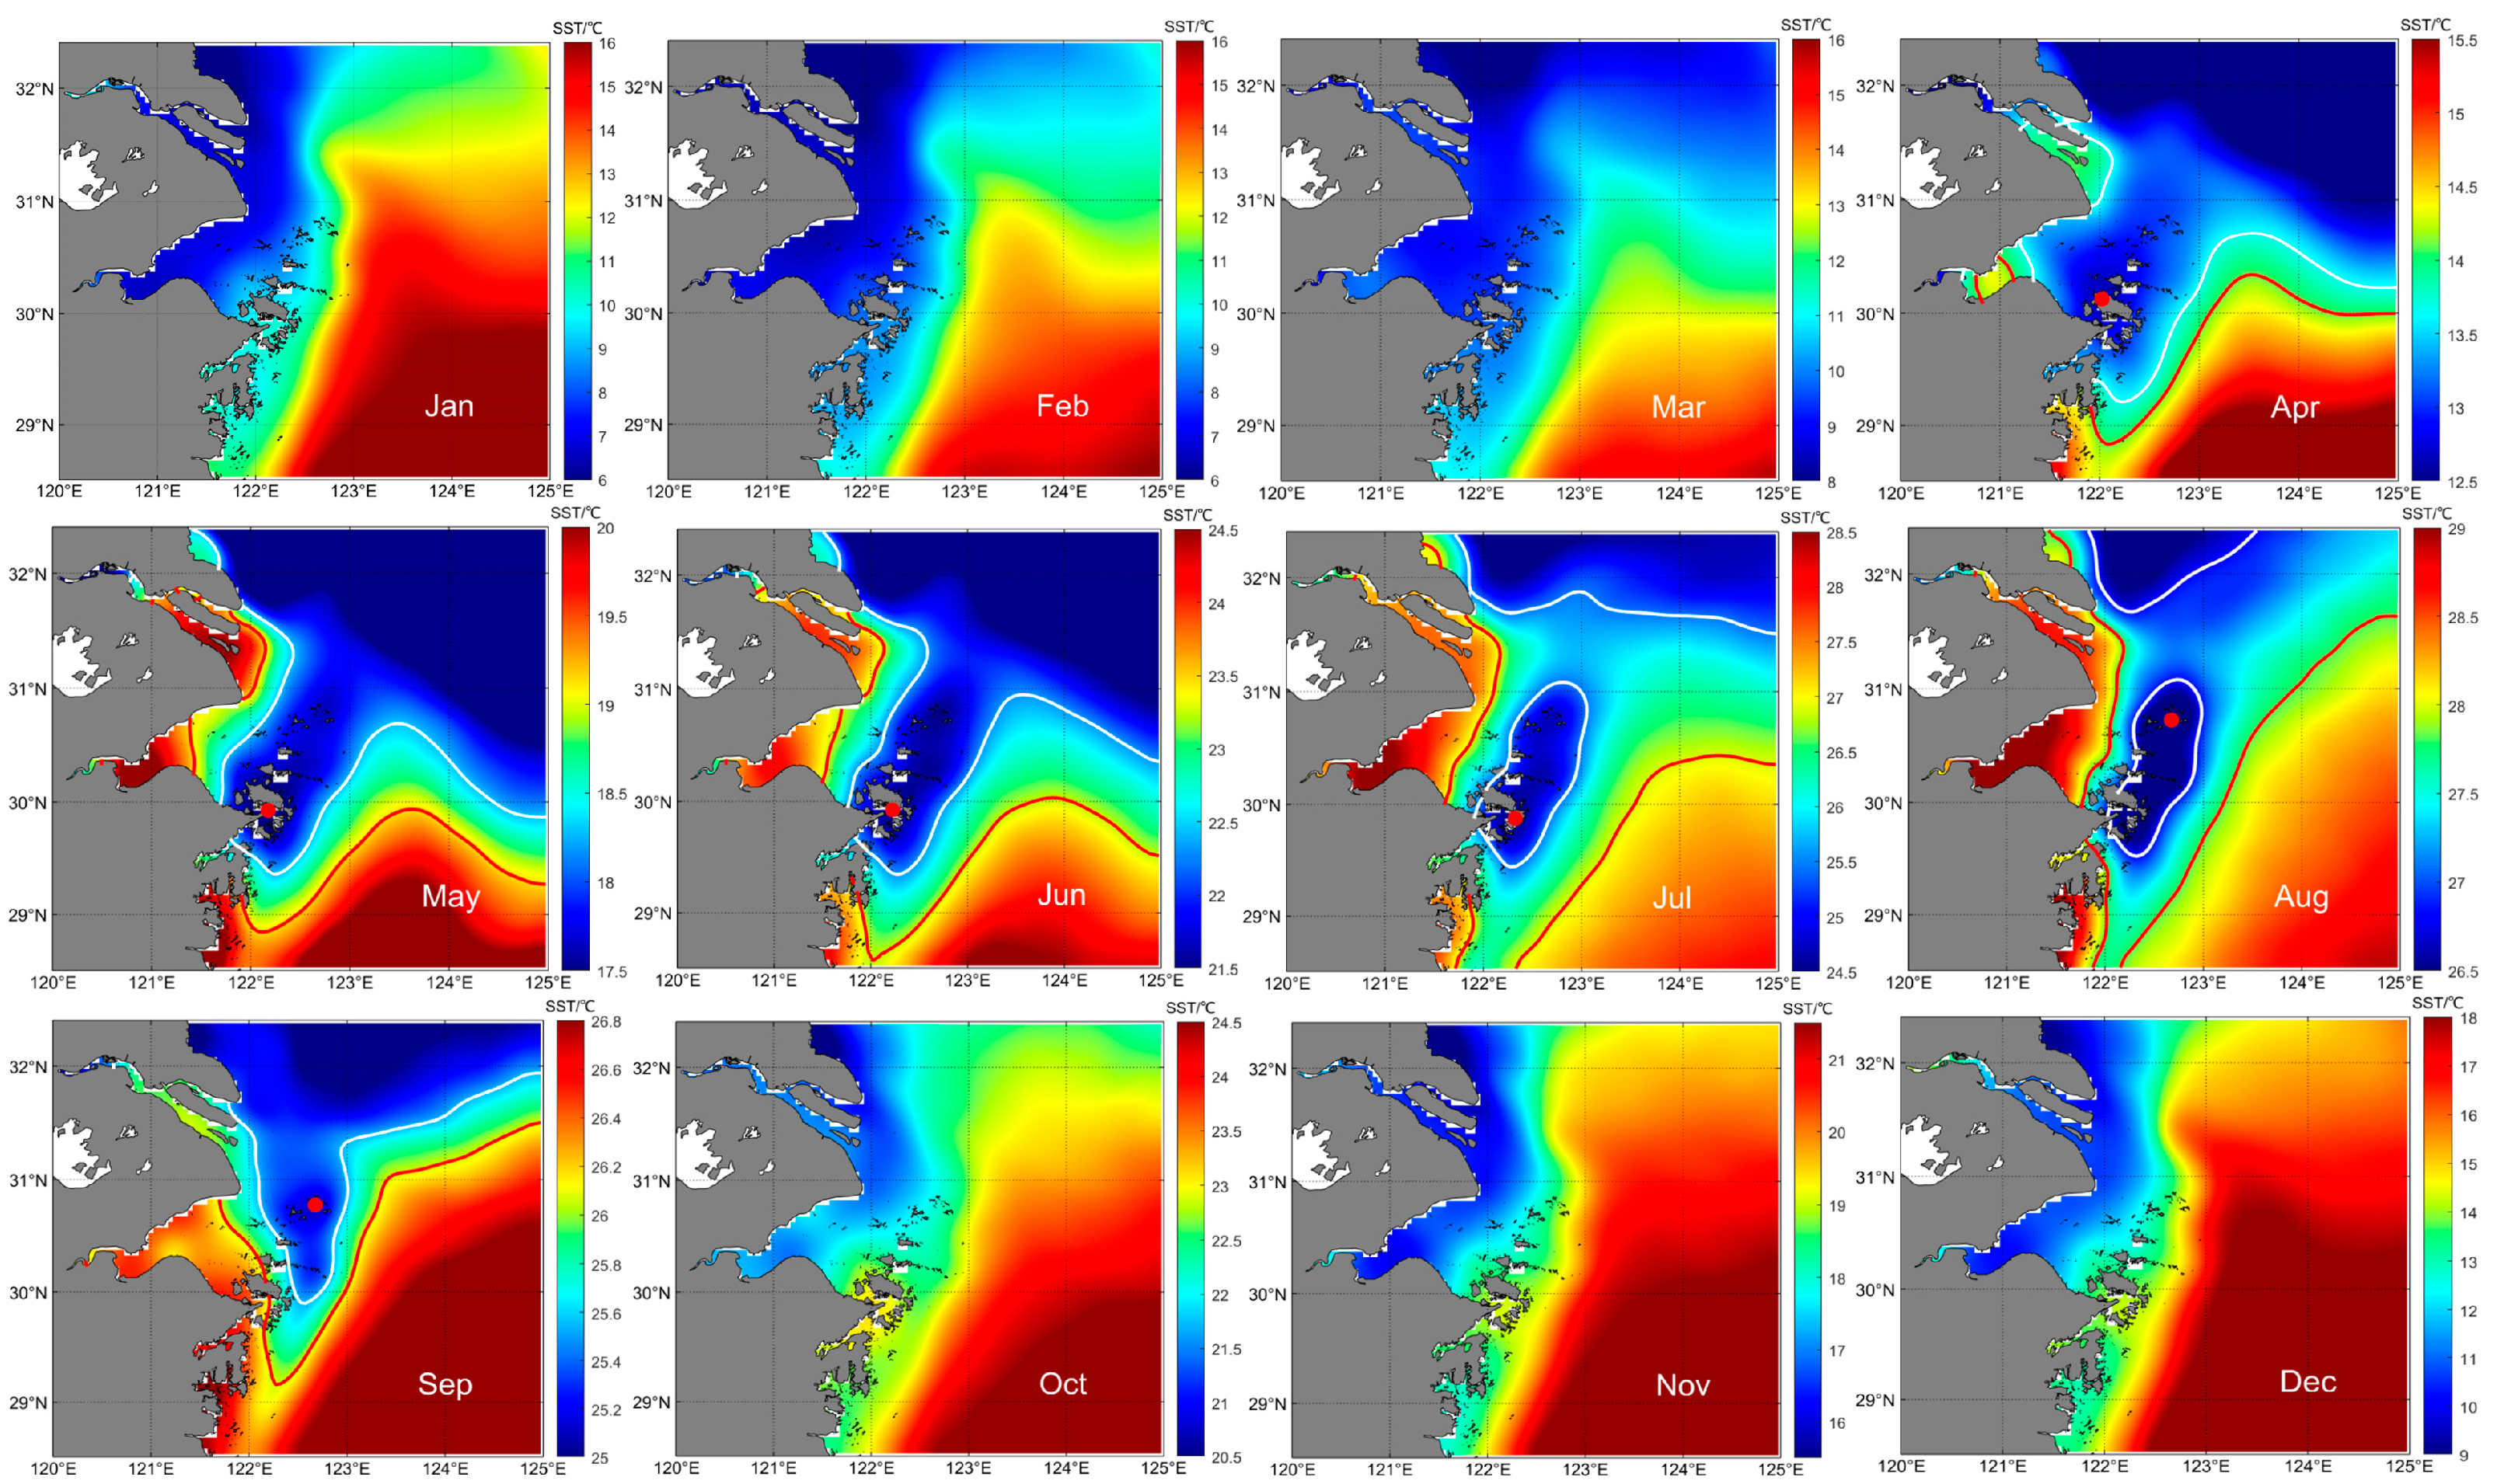
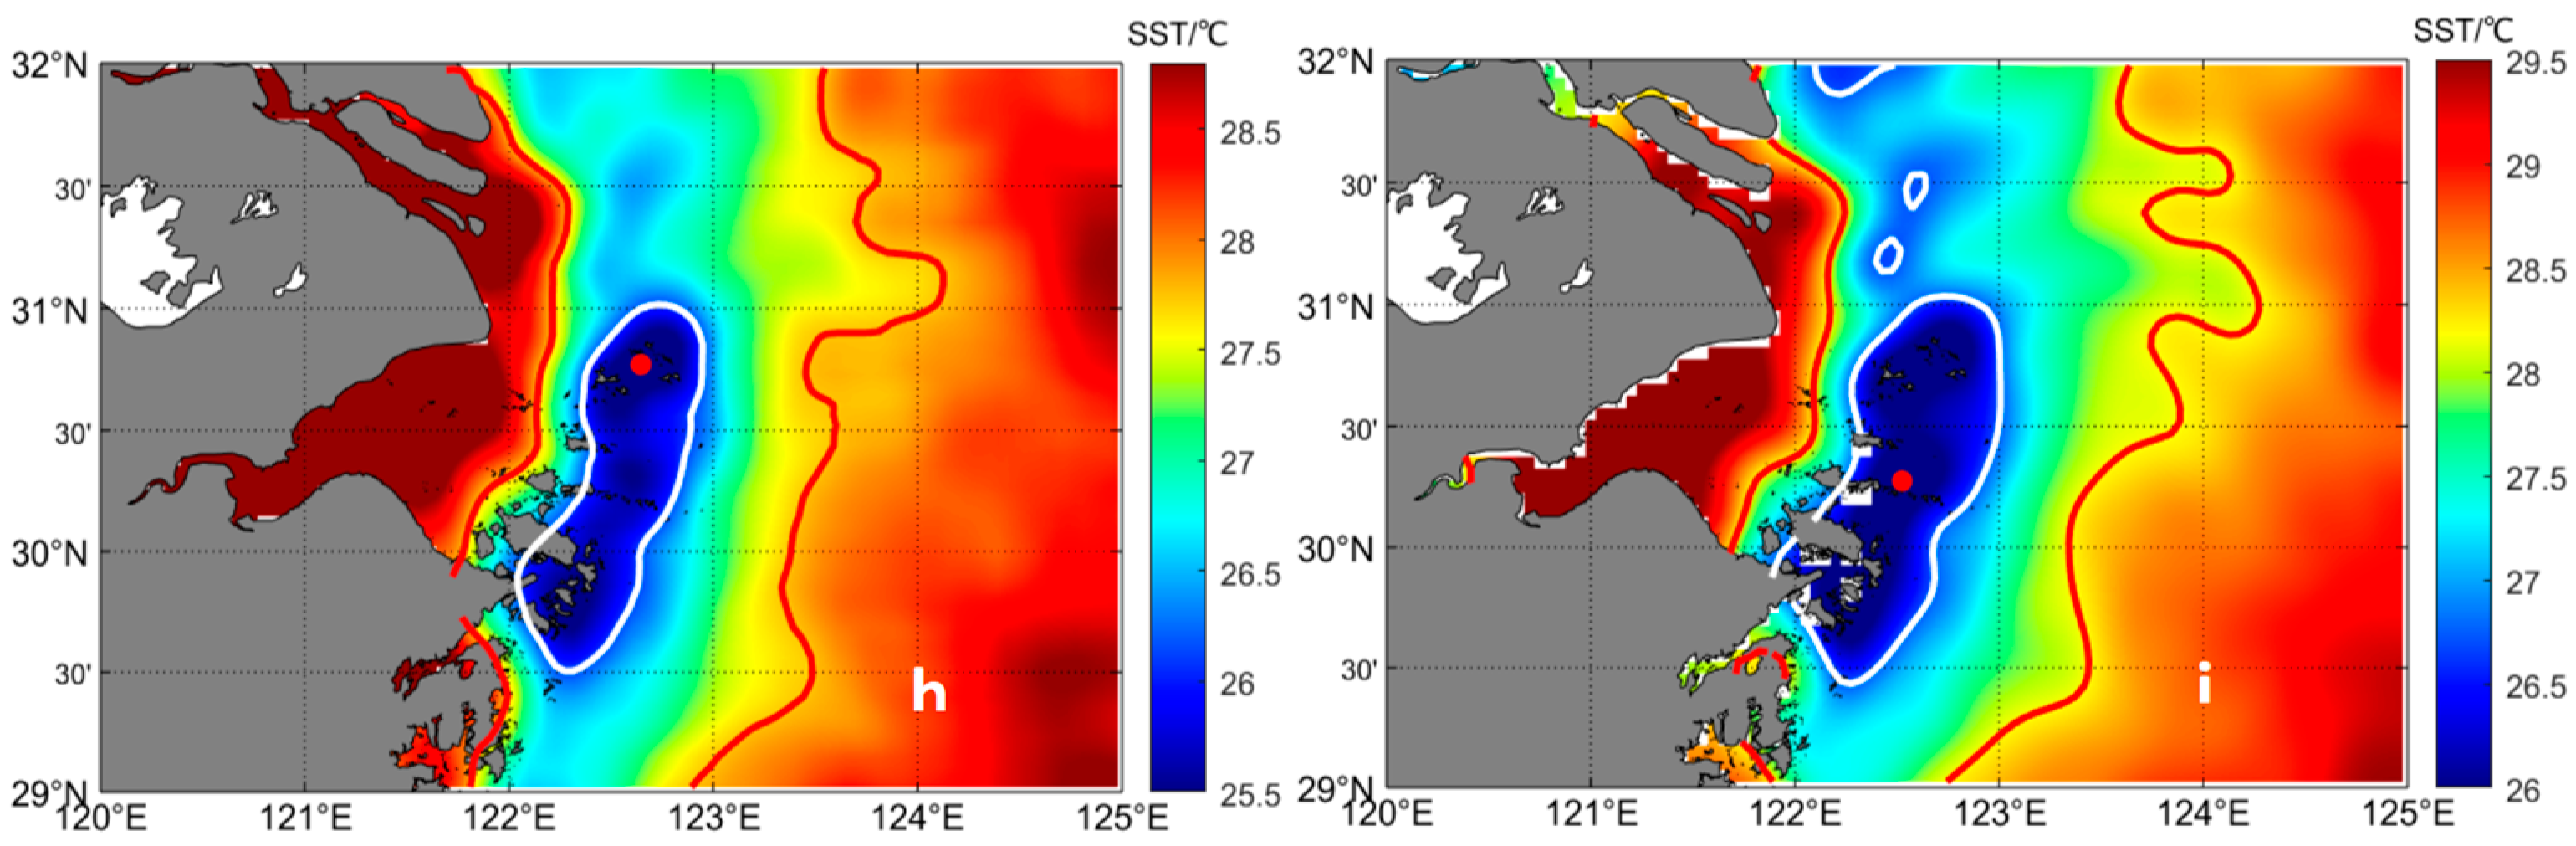
3.1. 28-Year Average SST Distribution

It’s evident that a substantial cold-water mass appeared in April, as depicted in Figure 3. Compared to the distribution of low-temperature seawater from May to September, the cold water in April intruded into Hangzhou Bay, nearing the coast. Although the southward monsoon, which facilitates upwelling formation, had just emerged, as a transitional month for the monsoon shift, the residual cold water along the coast before April also influenced the distribution of low-temperature water. Under the joint influence of both factors, the shape of the cold-water mass in April was significantly different from other months, with the upwelling center (30.1250° N, 122.0250° E) close to Hangzhou Bay. From May to August, the cold-water mass presented a “footprint” shape, and the upwelling became more concentrated and stable over time. The shape of the upwelling in September differed from other months; the “heel” part of the “footprint” disappeared, and the upwelling dissipated in October. The process of formation, development, and dissipation of the Zhoushan upwelling is consistent with the numerical simulation and observational results of Huang et al. [31]. This low-temperature phenomenon is likely caused by vertical seawater exchange, having little to do with advection from the surrounding warmer regions. From the white line wrapping state, it can be seen that in April, May, June, and September the core area boundary line extracted from the Zhoushan sea area can be extended to higher latitudes, wrapping the cold-water mass of the YRE. The two mix together and are distributed in a slanting strip between 29.5° N and 31.5° N. The upwelling in Zhoushan is strong and stable from July to August, less affected by mixing.

3.2. 1989–2016, 28-Year UPI Change

Figure 4 shows the changes in the upwelling intensity index for the periods 1989–1998, 1999–2008, and 2009–2016 (from left to right) from April to September. The results indicate that the intensity index is lowest in most years in April and September, peaks from April to July, and gradually declines from July to September, with different values each year indicating interannual variability in upwelling intensity. Table 1 shows the average intensity for each period, consistent with the change pattern in most years. One of the reasons for this phenomenon is the effect of wind field forcing. In the Northern Hemisphere, if coastal seawater is pushed northward by surface winds, it results in the phenomenon of deep-sea water replenishing the surface, known as upwelling. Therefore, the direction of the wind field affects the formation of upwelling. The monthly average wind field map from January to December 2008 shows that from January to March and October to December, the Zhoushan sea area is dominated by north or northerly winds, which impedes the formation of upwelling. This also accounts for the absence of a significant cold-water mass (Figure 3) in these six months. The wind field map (see Figure 5) for April showcases the wind fields in March and April, with blue arrows indicating March and red arrows for April. It can be observed that the wind direction transitions from the March wind field to the April wind field. Almost all wind directions undergo clockwise changes, particularly in the Zhoushan Islands area, with the change angle typically exceeding 30°, shifting from northeast wind to southeast wind. Southeast wind favors upwelling formation. The wind field map in September includes the wind fields for August (blue arrow) and September (red arrow), with the wind direction deflection between August and September being substantial, almost entirely showing a counterclockwise change of more than 90°, transitioning from southward wind to northward wind. This is also one of the reasons for the contraction and weakening of upwelling range and intensity in September.

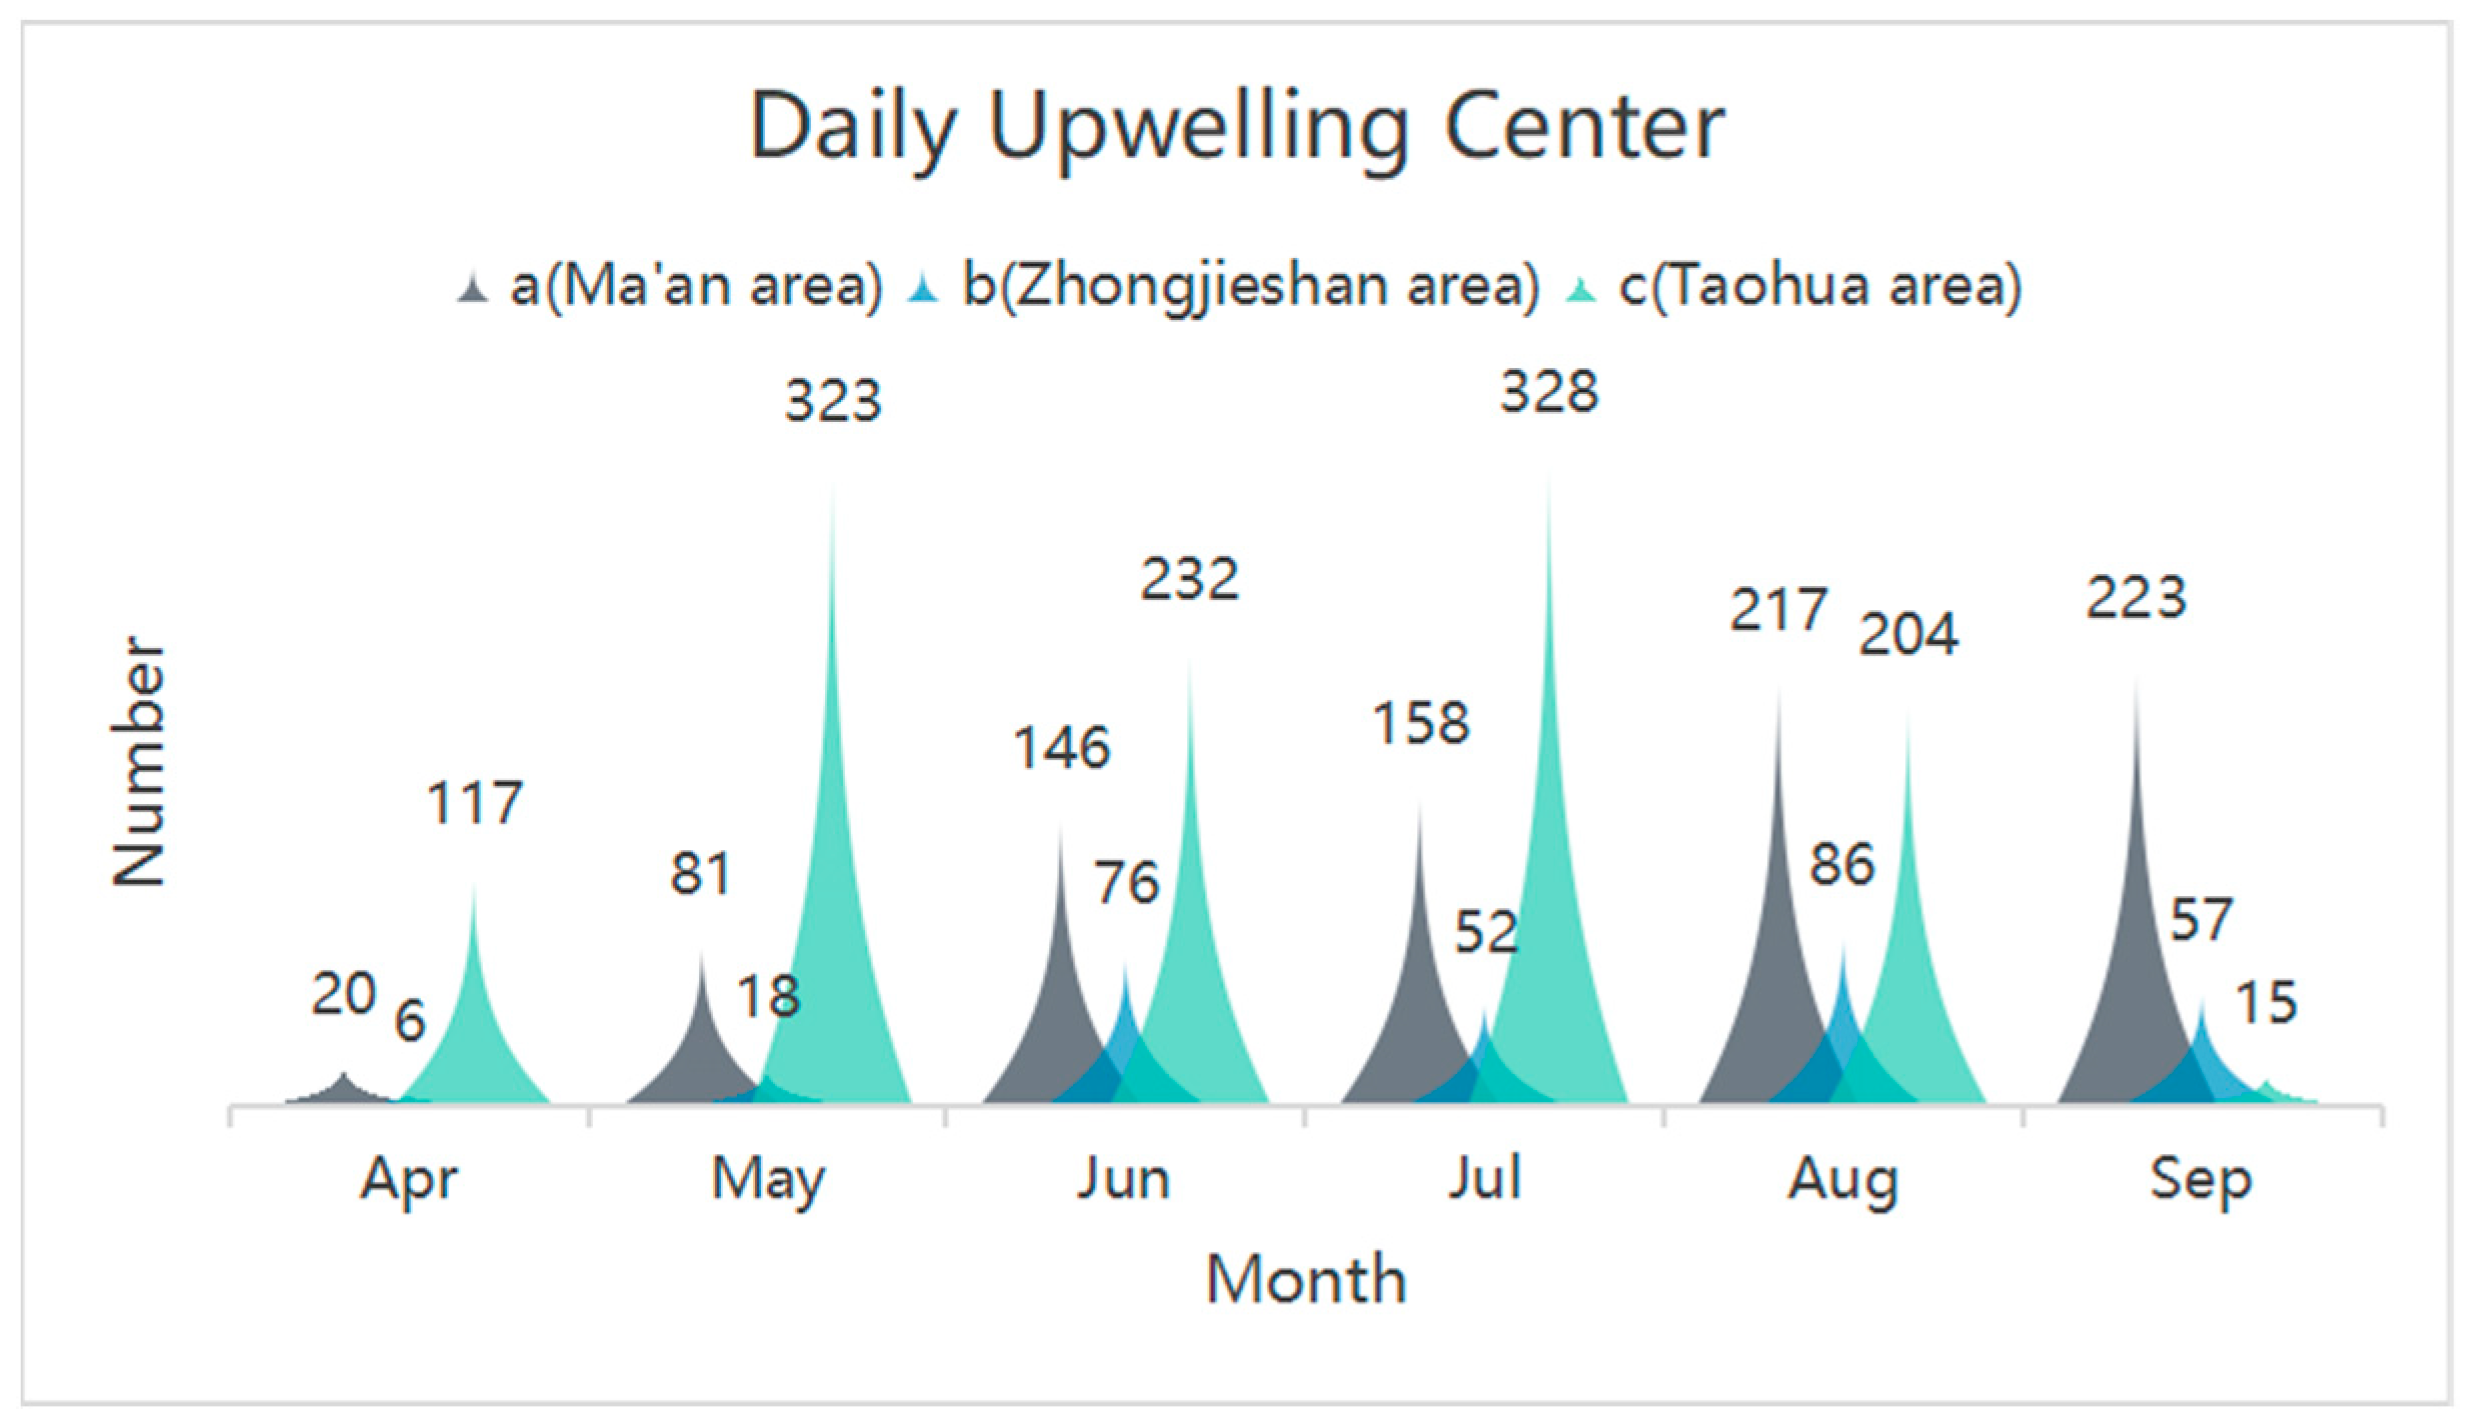
3.3. 28-Year Monthly Average Upwelling Center

In Figure 6a, the positions of the upwelling centers in April are partially close to Hangzhou Bay, with others scattered in various locations. By May, the upwelling centers are concentrated in sea area c. In June, July, and August, they are concentrated in three areas (a, b, and c in Figure 1), with almost all the upwelling centers falling within these areas. By September, the upwelling center in area c is not detected, and the center positions are highly concentrated in area a and partly in area b. The concentrated distribution of upwelling centers indicates frequent occurrence of upwelling. This distribution pattern is related to the distribution of sea temperature. For example, in April, there are bulges of low-temperature seawater near Hangzhou Bay, which is consistent with the presence of some average monthly center points near Hangzhou Bay in April. In September, the disappearance of low-temperature seawater in area c also matches the zero count of upwelling centers in area c. These phenomena could be related to the legacy of winter cold water and the turning of the monsoon.

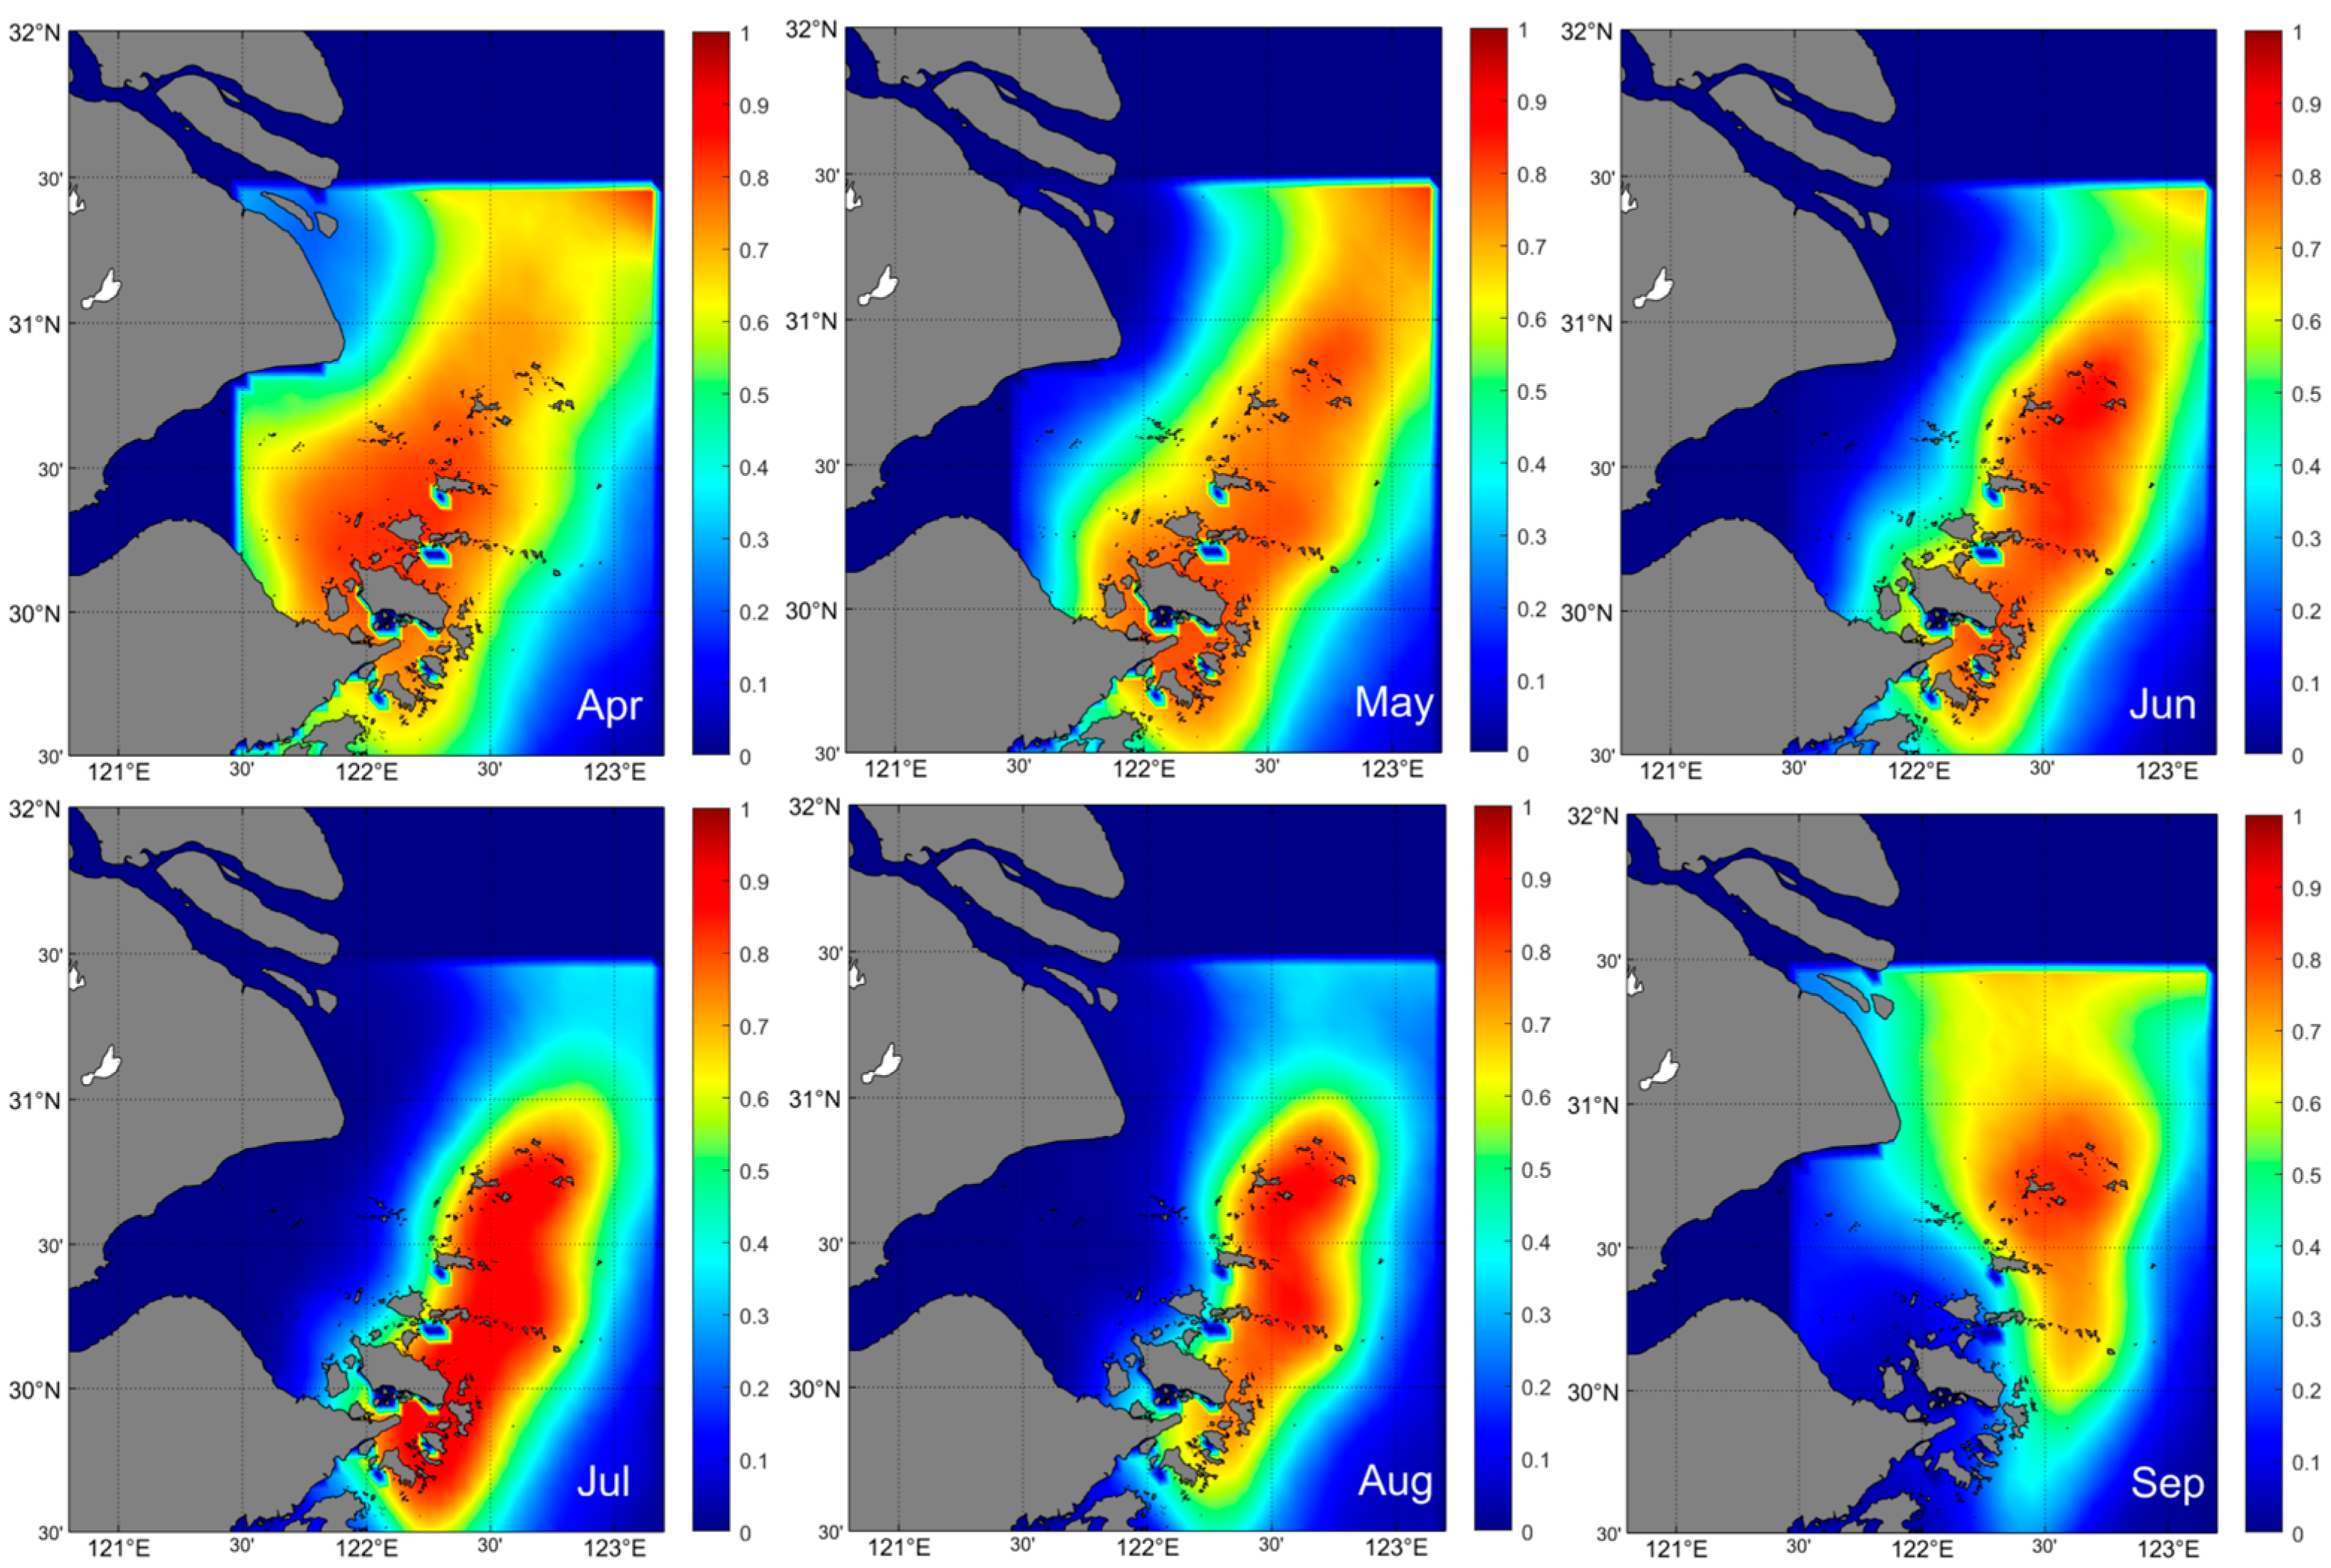
3.4. The Probability of Daily Center Position and Core Area Position for Each Month from April to September in 28 Years

In Figure 7 and Figure 8, the probability of occurrence of upwelling centers in Hangzhou Bay and near area c in April is slightly higher, with area c experiencing 117 occurrences, while areas a and b almost have few of upwelling centers. The probability distribution in September is essentially the opposite of April, with the number of central points in area an increasing by 203, in area b by 51, and in area c decreasing by 102. From May to August, the distribution gradually concentrates in these three areas, with area b being relatively less. From June to August, the probability values of the upwelling centers in the three areas are higher, stabilizing at 6–8 × 10⁻³. This is close to the results of Yin and Xiao et al. [13,30].
This paper considers the lowest point of sea surface temperature in a marine area as the center of upwelling and assumes that upwelling always occurs around this center. As a result, the distribution of the core area closely matches the distribution of the center position. The superimposed distribution state of the multi-year daily core area shown in Figure 9 is similar to the sea temperature distribution from April to September shown in Figure 3. The multi-year statistical results show that from May to August, the shape of upwelling in the Zhoushan sea area always resembles “footprints”, and the colors of areas a, b, and c are always darker, corresponding to higher probability values. In April, the core area is mainly distributed near Hangzhou Bay and area c with high probability values, while areas a and b have lower probabilities. By September, the probability in area c drops to zero, consistent with the characteristics of area c in Figure 3 and Figure 7. The more often a position is covered by the upwelling core area, the higher the probability of upwelling occurring at this position. This also inspires us to flexibly adjust the layout according to the shape of the upwelling core area in each month when developing fishery resources in the Zhoushan sea area, to plan the resources reasonably. The changes in the area of the upwelling core zone at each stage described in Table 2 are generally consistent. In April, influenced by the low-temperature waters along the coast and the YRE, the area is the largest. From May to August, the upwelling gradually stabilizes, and its area progressively decreases, with signs of contraction in area c in August. The area values in August are generally around 10,000 square kilometers, which aligns with the upwelling area given by Yin when discussing the short-term variations of the Zhoushan upwelling [13]. Although area c has dissipated by September, as the cold water gradually mixes with the cold water from the YRE, the area is larger than in August.

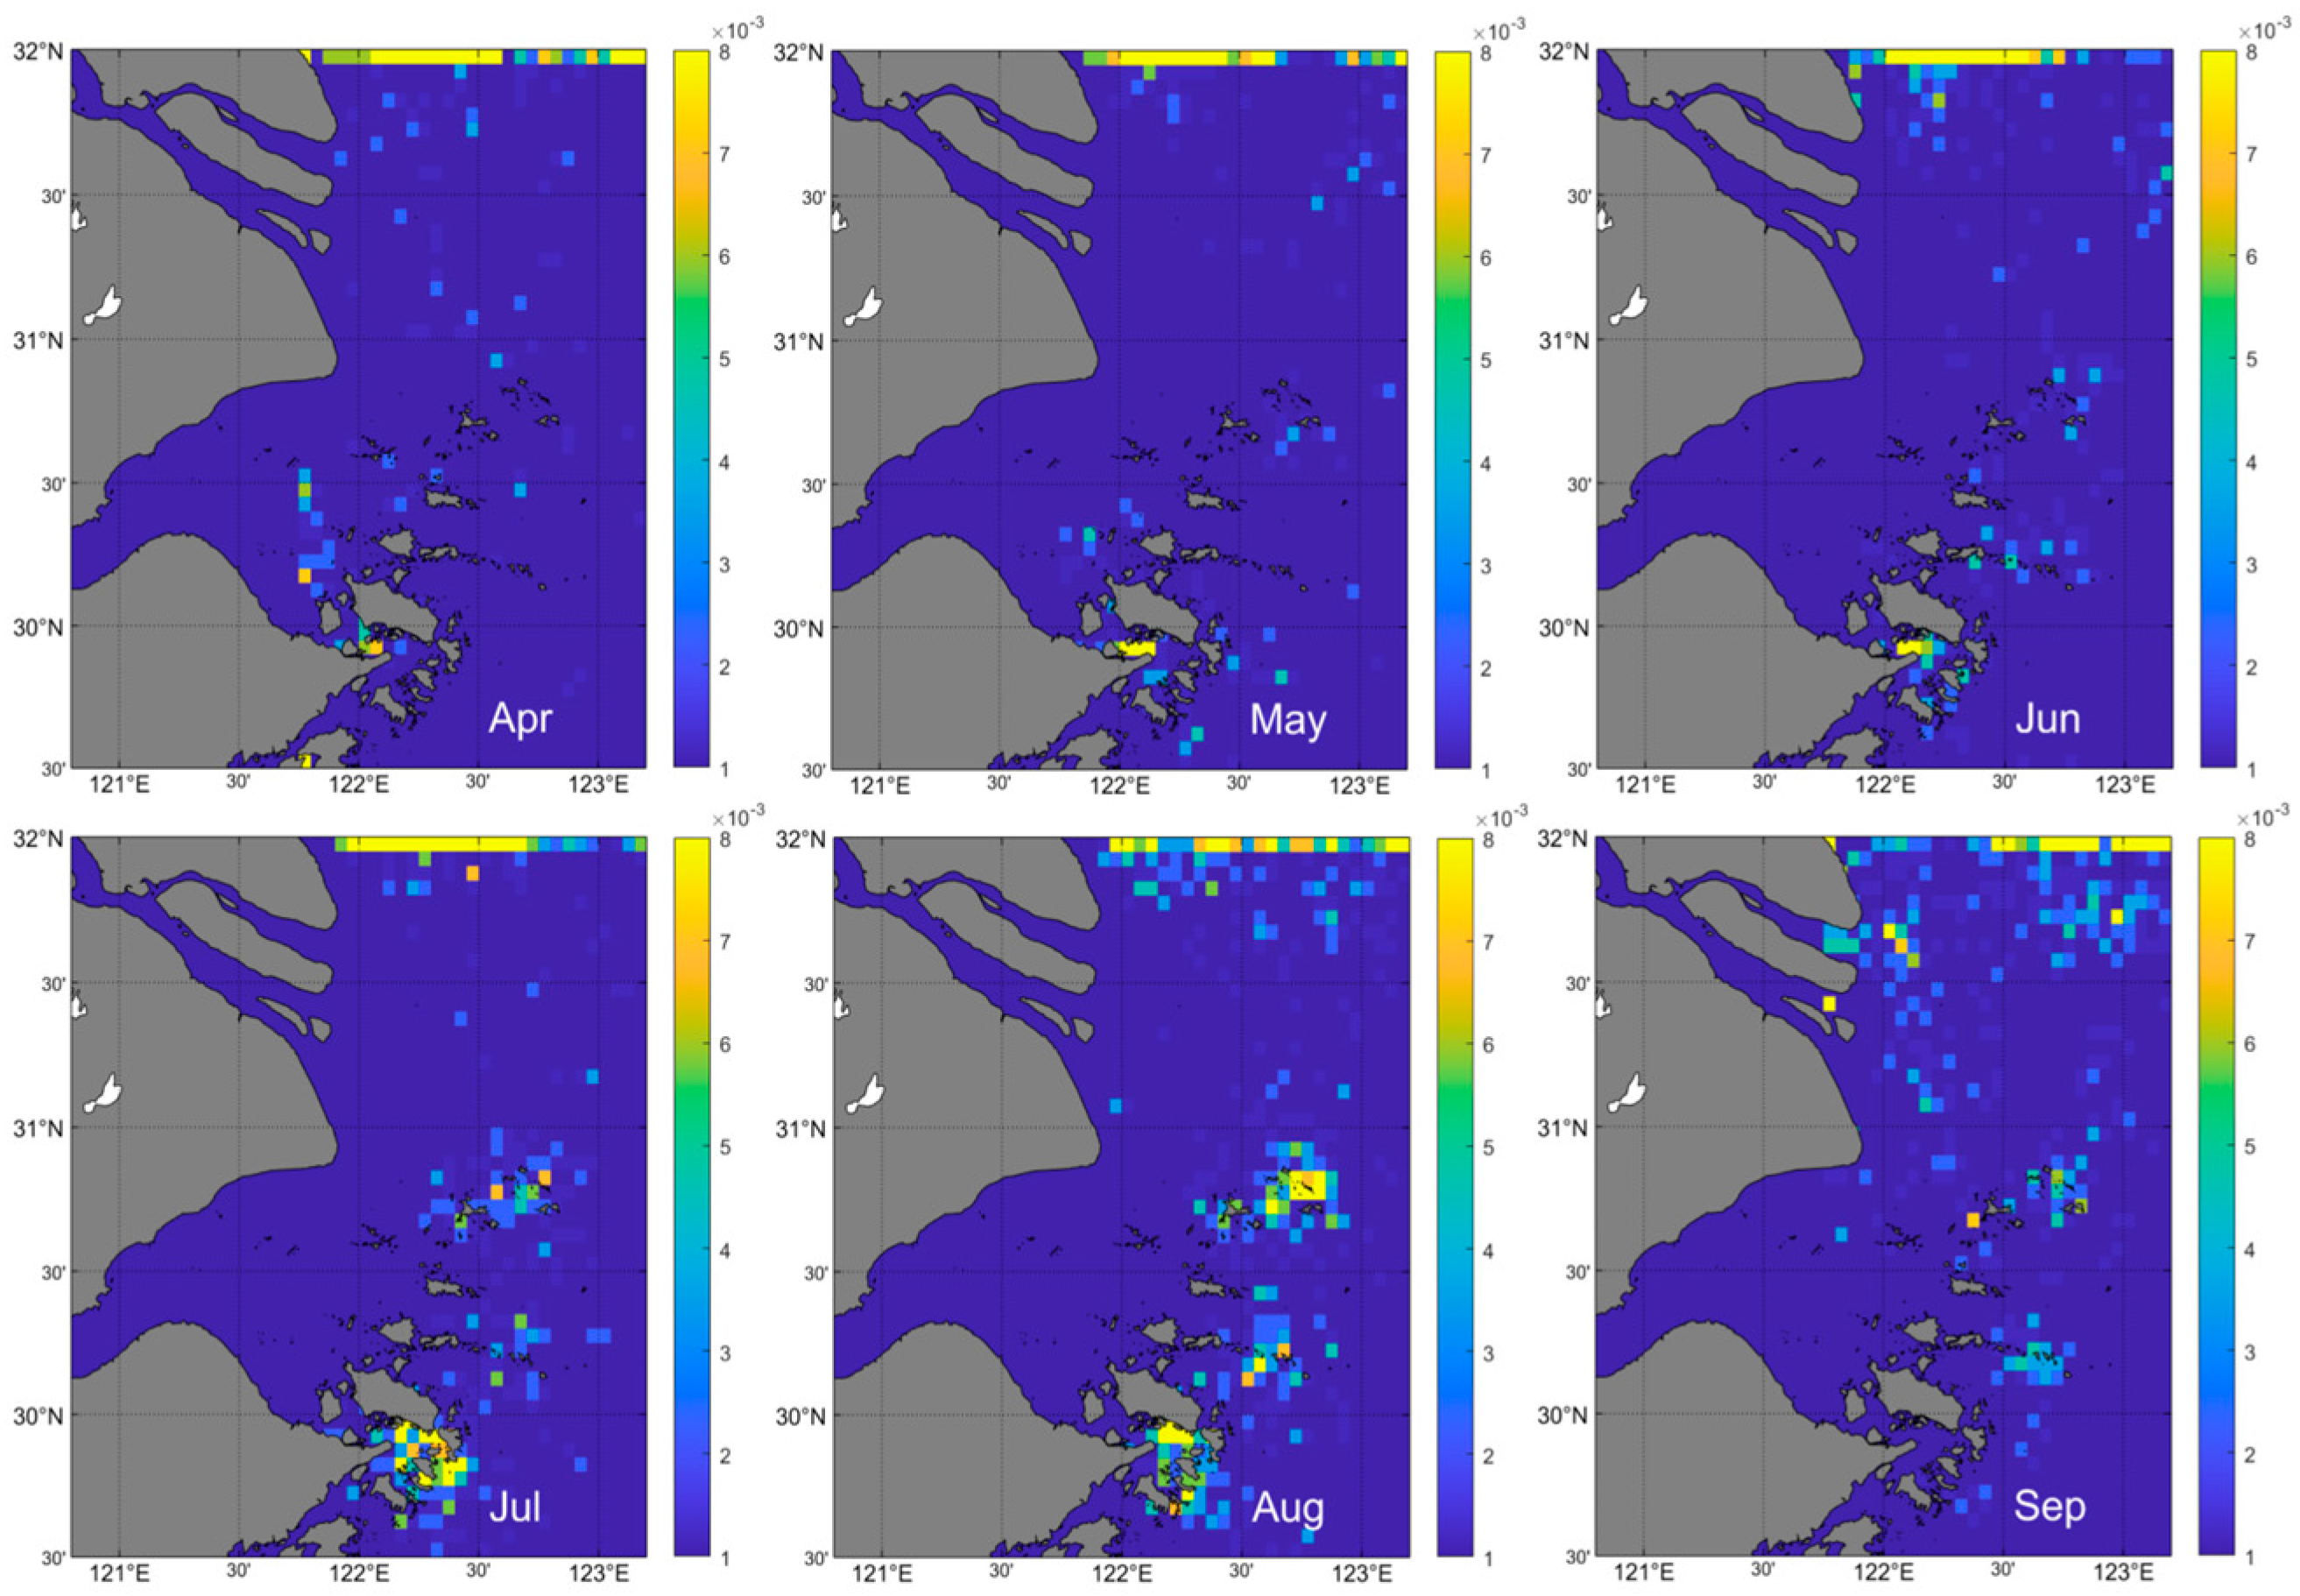
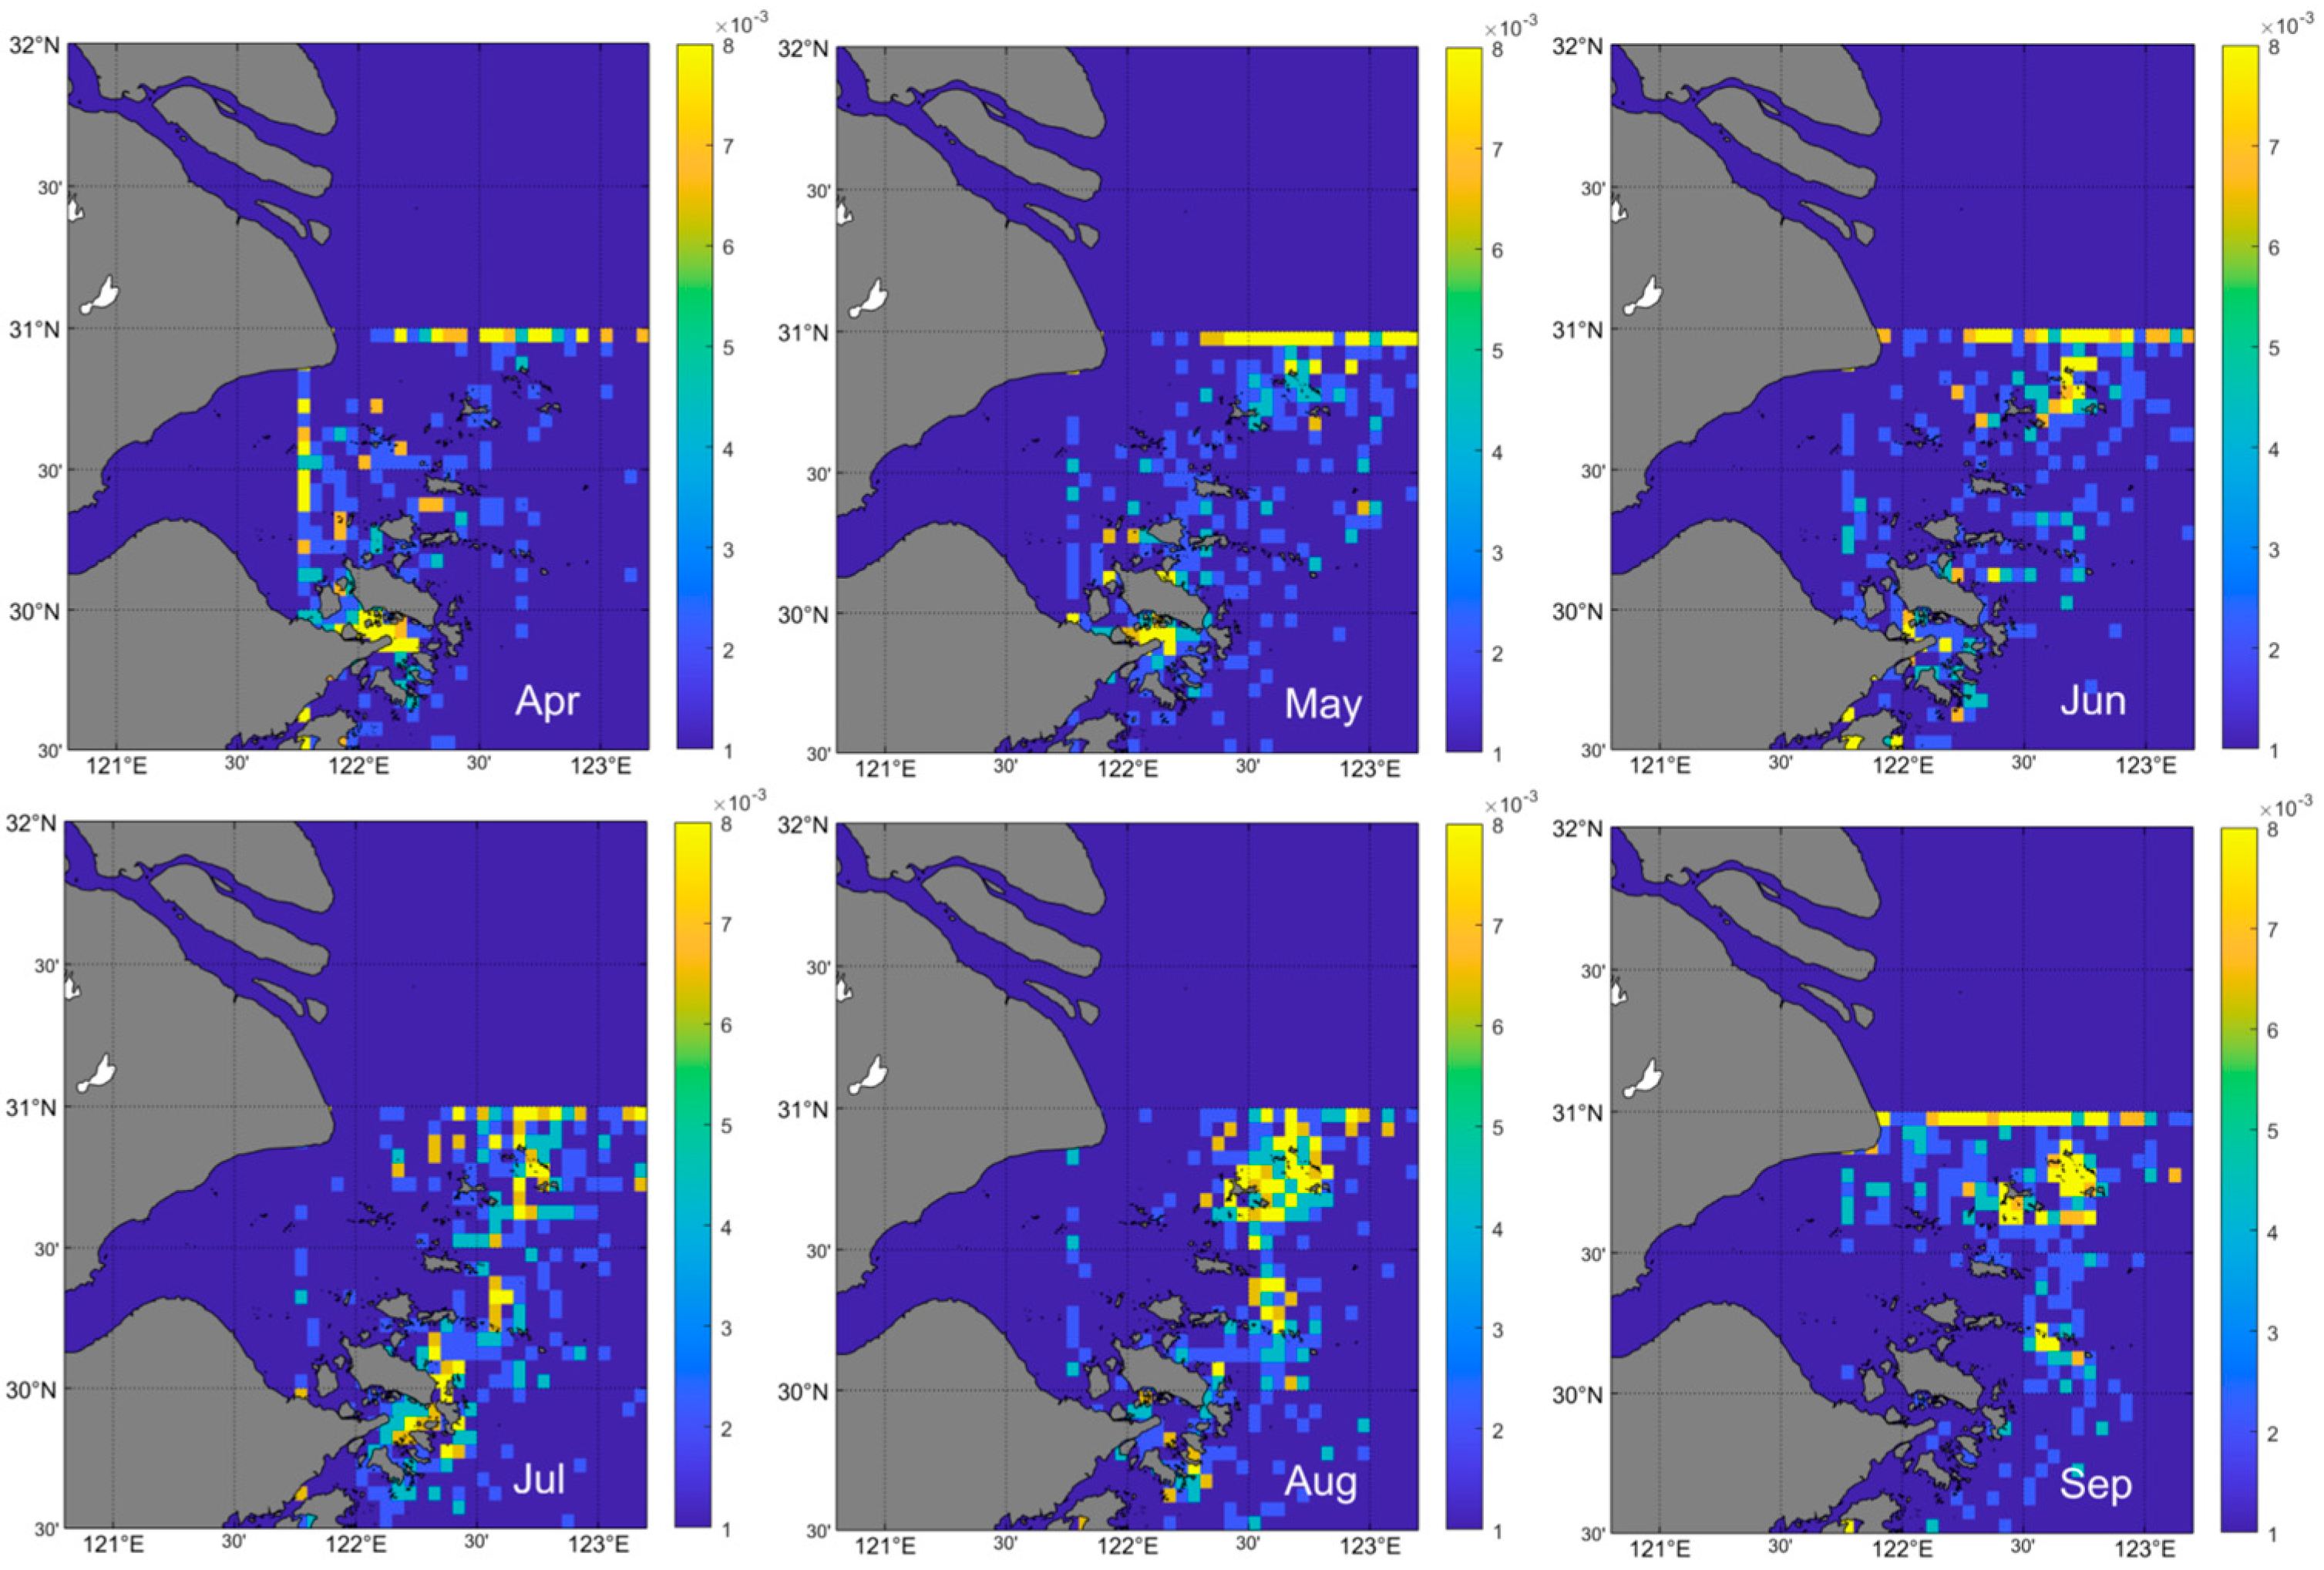
3.5. 28-Year Daily Center Position and Core Area Position Probability

Figure 10, by integrating the data points from Figure 7 and Figure 9, displays the probability distribution of the upwelling centers and core areas over 28 years on a daily basis. It can be observed from Figure 10 that areas a, b, and c consistently exhibit high probability values in both Figure 10a,b, indicating that from April to September, upwelling frequently covers these three regions. The figure does not show the high-value areas near Hangzhou Bay, nor does it reflect the disappearance of upwelling in area c in September. This strongly demonstrates the stable presence of upwelling in the Zhoushan sea area, specifically in the areas of Ma’an Archipelago, Zhongjieshan Archipelago, and Taohua Island. The action of monsoons facilitates vertical water exchange in these areas, while changes in the direction of the monsoons affect the shape of the upwelling. These findings suggest that due to the frequent occurrence of upwelling, the marine productivity in areas a, b, and c could be exceptionally high. In fact, these three regions correspond to the national marine pastures of Ma’an Island, Zhongjieshan Islands, and Taohua Island, making the research findings particularly reasonable. The concentration of chlorophyll-a is often associated with productivity. According to the research by Tang et al., the chlorophyll-a concentration in multiple datasets shows high values in these three pasture areas, which coincides with the high probability values presented in this study [32].

4. Discussion

4.1. Winter Upwelling

In Figure 3, we deduce that the upwelling occurs from April to September based on the presence and absence of the cold-water region. The subsequent work is also carried out according to this time range, including the detection of the center point, the core area, etc. Most people’s research also focuses on the summer upwelling. It cannot be denied that there is also upwelling in winter. Qiao [33] believes that the vertical distribution of temperature, salinity, dissolved oxygen, and nutrients in each section of the ECS is dome-shaped, indicating that the seawater has an upward trend in winter. Hu [34] also thinks that there is upwelling in winter after analyzing the dynamic structure of the upwelling. The distribution of sea water temperature in winter is different from that in summer. The low-temperature sea water exists along the Zhejiang coast, which does not match well with the theoretical three-layer structure of the upwelling. Therefore, there are difficulties in identification and extraction. This low-temperature distribution is considered to be related to the Yangtze River plume. In winter, the low-salinity Yangtze River diluted water flows along the Zhejiang coast, forming a low-salinity layer on the surface. The low-salinity layer then hinders vertical convection mixing, causing low-temperature fresh water to stay in the upper layer and form a plume. The research by Wu et al. indicates that the Yangtze River plume follows two primary routes, with the Zhejiang coast being one of them [35]. Fernández-Nóvoa believes that the water brought by the Yangtze River plume lowers the coastal water temperature compared to the seawater farther from the coastline [36].

4.2. Comparison of Upwelling Feature Extraction Results from MODIS and ESA SST Data Based on Algorithms

Since ESA SST is merged data, to explore the universality of the extraction algorithm developed in this article for data and the rationality of the Zhoushan upwelling extraction results, the study selected 8 days of MODIS daily SST data from the same date. Initially, these data were averaged, and then an upwelling edge detection algorithm based on temperature gradients was used to extract upwelling features from the 8-day average SST for both data types. The results show that, despite differences in sea surface temperature values and upwelling center, the extracted upwelling boundary shapes are quite consistent (Figure 11). The upwelling intensity from MODIS data is 2.0137 °C, while that from ESA data is 2.0103 °C, with a minimal difference of only 0.0034 °C. Therefore, the structural characteristics of the Zhoushan upwelling are genuinely present, and the extraction results of the Zhoushan upwelling through ESA SST are reasonable, proving that the algorithm can adapt to different types of data.

4.3. Zhoushan Upwelling and Yangtze River Estuary Upwelling

Most previous studies have focused either on the Zhoushan upwelling or on the YRE upwelling alone, with few considering both. In Figure 7, upwelling centers near 31° N can also be observed, with the core areas surpassing 31° N in all months except July and August, mixing with the cold water from the YRE. Therefore, this paper extends the detection range of upwelling centers to 32° N to compare with the distribution state of upwelling centers when excluding the YRE area.
Here, the detected upwelling center is termed the merged upwelling center, representing the strongest upwelling position. From Figure 12, it’s observed that from April to September, there is a certain reduction in both the number and probability of low-temperature center locations, shifting towards the YRE waters. However, the Zhoushan area still maintains its original spatiotemporal distribution characteristics. The high probability distribution of the YRE upwelling center indicates that, during the study period, there were times when the low-temperature center of the YRE cold water mass was lower than in areas a, b, and c. Despite many center locations having shifted to the YRE, the three marine ranch areas in Zhoushan remain high-frequency upwelling areas, providing strong support for the findings of this paper.
When using GHRSST data for statistics, similar distribution changes are also observed (Figure 13 and Figure 14). The high probability areas of the Zhoushan marine upwelling center maintain their distinctive characteristics, particularly from July to September, under the filtering effect of the low temperature area at the YRE.

5. Conclusions

This study analyzes the phenomenon of upwelling in the Zhoushan area over a period of 28 years. The findings indicate that the upwelling occurs from April to September. The intensity of the upwelling is significantly influenced by the monsoon, increasing from April to July, reaching 1.78–1.85 °C, and gradually decreasing from July to September, with noticeable interannual variations each year. The area of upwelling initially decreases and then increases over time. The centers and core areas with high probability values are mainly located around Ma’an Island, Zhongjieshan Island, and Taohua Island, all national-level marine ranches. During the monsoon transition periods, specifically in April and September, the spatial distribution of upwelling shows significant differences from the summer season. To enhance the contribution of upwelling to fishery resources, it is recommended to deploy artificial upwelling devices in key areas when wind conditions are insufficient or unfavorable, to promote the formation of upwelling, strengthen fishery development, and plan marine ranches.

Author Contributions

Conceptualization, T.X. and Y.Z.; methodology, J.F., T.X., R.T. and Z.Q.; validation, K.W. and Y.Z.; formal analysis, T.X., A.Z., Z.Q. and J.F.; investigation, T.X., J.F. and Z.Q.; resources, J.Y.T.; data curation, T.X. and J.F.; writing—original draft preparation, T.X. and J.F.; writing—review and editing, Y.Z. and K.W.; visualization, T.X., J.F. and Y.Z.; supervision, Z.Q. and Y.Z.; project administration, J.Y.T. and Z.Q.; funding acquisition, Z.Q. All authors have read and agreed to the published version of the manuscript.

Funding

This study was supported by the National Natural Science Foundation (U1901215), the National Natural Science Foundation of China (41976165), the Marine Special Program of Jiangsu Province in China (JSZRHYKJ202007), and the Natural Scientific Foundation of Jiangsu Province (BK20181413).

Institutional Review Board Statement

Not applicable.

Informed Consent Statement

Not applicable.

Data Availability Statement

Data can be available from the Copernicus Marine Environment Monitoring Service (CMEMS, http://marine.copernicus.eu/, accessed on 31 March 2023) for SST and sea surface wind. Data can be available from the JPL MUR MEaSUREs Project. 2015. GHRSST Level 4 MUR Global Foundation Sea Surface Temperature Analysis. Ver. 4.1. PO.DAAC, CA, USA. (https://doi.org/10.5067/GHGMR-4FJ04, accessed on 11 November 2023) for SST.

Acknowledgments

We thank the Copernicus Marine and Environmental Monitoring Service (CMEMS) and the NASA Physical Oceanography and Ocean Biology Distributed Active Archive Center for the supported datasets. We also thank Wenbin Yin for early discussions in 2022 and 2023, but not further discussions in 2024.

Conflicts of Interest

The authors declare no conflicts of interest. The funders had no role in the design of the study; in the collection, analyses, or interpretation of data; in the writing of the manuscript; or in the decision to publish the results.

References

  1. Ajith Joseph, K.; Jayaram, C.; Nair, A.; George, M.S.; Balchand, A.N.; Pettersson, L.H. Remote sensing of upwelling in the Arabian Sea and adjacent near-coastal regions. In Remote Sensing of the Asian Seas; Springer: Cham, Switzerland, 2019; pp. 467–483. [Google Scholar]
  2. Jebri, F.; Srokosz, M.; Raitsos, D.E.; Jacobs, Z.L.; Sanchez-Franks, A.; Popova, E. Absence of the Great Whirl giant ocean vortex abates productivity in the Somali upwelling region. Commun. Earth Environ. 2024, 5, 20. [Google Scholar] [CrossRef]
  3. Mao, H.L.; Ren, Y.W.; Sun, G.D. Preliminary analysis of summer hydrographic characteristics and water masses in the southern Huanghai Sea and northern East China Sea. Stud. Mar. Sin. 1964, 1, 23–77. [Google Scholar]
  4. Pan, Y.Q.; Cao, X.Z.; Xu, J.P. A preliminary investigation of the cause and characteristics of the upwelling front zone off Zhejiang. Trans. Oceanol. Limnol. 1982, 3, 1–7. [Google Scholar]
  5. Xu, J.P.; Cao, X.Z.; Pan, Y.Q. Evidence for the coastal upwelling off Zhejiang. Trans. Oceanol. Limnol. 1983, 4, 17–25. [Google Scholar]
  6. Lou, X.; Shi, A.; Xiao, Q.; Zhang, H. Satellite observation of the Zhejiang Coastal upwelling in the East China Sea during 2007–2009. In Remote Sensing of the Ocean, Sea Ice, Coastal Waters, and Large Water Regions; SPIE: Bellingham, WA, USA, 2011; Volume 8175, pp. 454–460. [Google Scholar]
  7. Hu, M.N.; Zhao, C.F. Long-time observation of upwelling in the Zhoushan Islands and adjacent seas during the summer season. Period. Ocean Univ. China 2007, 1, 235–240. [Google Scholar]
  8. Yang, J.; Zhang, D.; Chen, Y.; Fan, W.; Liang, H.; Tan, M. Feasibility analysis and trial of air-lift artificial upwelling powered by hybrid energy system. Ocean Eng. 2017, 129, 520–528. [Google Scholar] [CrossRef]
  9. Hu, M.; Zhao, C. Upwelling in Zhejiang coastal areas during summer detected by satellite observations. J. Remote Sens. Beijing 2008, 12, 304. [Google Scholar]
  10. Hu, J.; Wang, X.H. Progress on upwelling studies in the China seas. Rev. Geophys. 2016, 54, 653–673. [Google Scholar] [CrossRef]
  11. Ekman, V.W. On the Influence of the Earth’s Rotation on Ocean-Currents; University Microfilms, INC.: Ann Arbor, MI, USA, 1905. [Google Scholar]
  12. Jing, Z.Y.; Hua, Z.L.; Qi, Y.Q.; Cheng, X.H. Numerical study on the coastal upwelling and its seasonal variation in the East China Sea. J. Coast. Res. 2007, 50, 555–563. [Google Scholar] [CrossRef]
  13. Yin, W.; Ma, Y.; Wang, D.; He, S.; Huang, D. Surface Upwelling off the Zhoushan Islands, East China Sea, from Himawari-8 AHI Data. Remote Sens. 2022, 14, 3261. [Google Scholar] [CrossRef]
  14. Lü, X.; Qiao, F.; Xia, C.; Zhu, J.; Yuan, Y. Upwelling off Yangtze River estuary in summer. J. Geophys. Res. Ocean. 2006, 111, C11S08. [Google Scholar] [CrossRef]
  15. Lü, X.; Qiao, F.; Xia, C.; Yuan, Y. Tidally induced upwelling off Yangtze River estuary and in Zhejiang coastal waters in summer. Sci. China. Earth Sci. 2007, 50, 462. [Google Scholar] [CrossRef]
  16. Zhu, J. Dynamic mechanism of the upwelling on the west side of the submerged river valley off the Changjiang mouth in summertime. Chin. Sci. Bull. 2003, 48, 2754–2758. [Google Scholar] [CrossRef]
  17. Pei, S.; Shen, Z.; Laws, E.A. Nutrient Dynamics of the Upwelling Area in the Changjiang Estuary. In Studies of the Biogeochemistry of Typical Estuaries and Bays in China; Springer: Berlin/Heidelberg, Germany, 2020; pp. 105–124. [Google Scholar]
  18. Pei, S.; Shen, Z.; Laws, E.A. Nutrient dynamics in the upwelling area of Changjiang (Yangtze River) estuary. J. Coast. Res. 2009, 25, 569–580. [Google Scholar] [CrossRef]
  19. Tseng, Y.F.; Lin, J.; Dai, M.; Kao, S.J. Joint effect of freshwater plume and coastal upwelling on phytoplankton growth off the Changjiang River. Biogeosciences 2014, 11, 409–423. [Google Scholar] [CrossRef]
  20. Budiman, A.S.; Bengen, D.G.; Nurjaya, I.W.; Arifin, Z.; Ismail, M.F.A. A comparison of the three upwelling indices in the South Java sea shelf. CMU J. Nat. Sci 2022, 21, e2022044. [Google Scholar] [CrossRef]
  21. Yang, S.; Mao, X.; Jiang, W. Interannual variation of coastal upwelling in summer in Zhejiang, China. Period. Ocean Univ. China 2020, 50, 1–8. [Google Scholar]
  22. Yin, W.; Huang, D. Short-term variations in the surface upwelling off northeastern Taiwan observed via satellite data. J. Geophys. Res. Ocean. 2019, 124, 939–954. [Google Scholar] [CrossRef]
  23. Varela, R.; Rodríguez-Díaz, L.; de Castro, M.; Gómez-Gesteira, M. Influence of Canary upwelling system on coastal SST warming along the 21st century using CMIP6 GCMs. Glob. Planet. Chang. 2022, 208, 103692. [Google Scholar] [CrossRef]
  24. Xu, Q.; Zhang, S.; Cheng, Y.; Zuo, J. Interannual feature of summer upwelling around the Zhoushan Islands in the East China Sea. J. Coast. Res. 2017, 33, 125–134. [Google Scholar] [CrossRef]
  25. Wong, G.T.; Hung, C.C.; Gong, G.C. Dissolved iodine species in the East China Sea—A complementary tracer for upwelling water on the shelf. Cont. Shelf Res. 2004, 24, 1465–1484. [Google Scholar] [CrossRef]
  26. Cai, L.; Yu, M.; Yan, X.; Zhou, Y.; Chen, S. HY-1C/D Reveals the Chlorophyll-a Concentration Distribution Details in the Intensive Islands’ Waters and Its Consistency with the Distribution of Fish Spawning Ground. Remote Sens. 2022, 14, 4270. [Google Scholar] [CrossRef]
  27. Chen, C.; Zhu, J.; Beardsley, R.C.; Franks, P.J. Physical-biological sources for dense algal blooms near the Changjiang River. Geophys. Res. Lett. 2003, 30, 1515. [Google Scholar] [CrossRef]
  28. Merchant, C.J.; Embury, O.; Bulgin, C.E.; Block, T.; Corlett, G.K.; Fiedler, E.; Good, S.A.; Mittaz, J.; Rayner, N.A.; Berry, D.; et al. Satellite-based time-series of sea-surface temperature since 1981 for climate applications. Sci. Data 2019, 6, 223. [Google Scholar] [CrossRef] [PubMed]
  29. Good, S.; Fiedler, E.; Mao, C.; Martin, M.J.; Maycock, A.; Reid, R.; Roberts-Jones, J.; Searle, T.; Waters, J.; While, J.; et al. The current configuration of the OSTIA system for operational production of foundation sea surface temperature and ice concentration analyses. Remote Sens. 2020, 12, 720. [Google Scholar] [CrossRef]
  30. Xiao, T.; Yin, W.; Feng, J.; Liu, Y.; Wong, K.; Tsou, J.Y.; Zhang, Y. Satellite-Based Analysis of Surface Upwelling in the Sea Adjacent to Zhoushan Islands in China. J. Mar. Sci. Eng. 2023, 11, 511. [Google Scholar] [CrossRef]
  31. Huang, Q.; Xu, Q.; Zhang, S.; Cheng, Y. Study of coastal upwelling around Zhoushan Islands based on satellite measurements and numerical model. In Proceedings of the 2016 Progress in Electromagnetic Research Symposium (PIERS), Shanghai, China, 8–11 August 2016; pp. 4764–4768. [Google Scholar]
  32. Tang, R.; Cai, L.; Yan, X.; Ye, X.; Xu, Y.; Yin, J. Study of the Response of Environmental Factors of the Coastal Area in Zhoushan Fishery to Typhoon In-fa Based on Remote Sensing. Remote Sens. 2023, 15, 3349. [Google Scholar] [CrossRef]
  33. Qiao, F.; Yang, Y.; Lü, X.; Xia, C.; Chen, X.; Wang, B.; Yuan, Y. Coastal upwelling in the East China Sea in winter. J. Geophys. Res. Ocean. 2006, 111, C11S06. [Google Scholar] [CrossRef]
  34. Hu, D.X.; Lu, L.H.; Ding, Z.X.; Xiong, Q.C.; Sun, S.C. A study of coastal upwelling off SE China. Kexue Tongbao (Sci. Bull.) 1980, 25, 159–163. [Google Scholar]
  35. Wu, H.; Shen, J.; Zhu, J.; Zhang, J.; Li, L. Characteristics of the Changjiang plume and its extension along the Jiangsu Coast. Cont. Shelf Res. 2014, 76, 108–123. [Google Scholar] [CrossRef]
  36. Fernández-Nóvoa, D.; Costoya, X.; DeCastro, M.; Gómez-Gesteira, M. Influence of the mightiest rivers worldwide on coastal sea surface temperature warming. Sci. Total Environ. 2021, 768, 144915. [Google Scholar] [CrossRef] [PubMed]
Figure 1. August SST of 28-year average from 1989 to 2016: red box a covers the Ma’an Island area (122.5°E ≤ longitude ≤ 122.9° E; 30.6° N ≤ latitude ≤ 30.9° N); red box b covers the Zhongjieshan Island area (122.3° E ≤ longitude ≤ 122.9° E; 30.15° N ≤ latitude ≤ 30.3° N); red box c covers the Taohua Island area (122° E ≤ longitude ≤ 122.5° E; 29.6° N ≤ latitude ≤ 30° N); Yangtze River Upwelling (YRU).
Jmse 12 01085 g001
Figure 2. The ideal seawater temperature distribution in the upwelling area; y represents the boundary of the core seawater area (blue circle), r represents the boundary of the peripheral seawater area (red circle), and the arrow represents the detection path (radius).
Jmse 12 01085 g002
Figure 3. From 1989 to 2016, the 28-year multi-year average sea surface temperature distribution, red dots represent the upwelling center positions in the climatic state, white lines represent the core area boundary lines of the upwelling, and red lines represent the peripheral boundary lines.
Jmse 12 01085 g003
Figure 4. Histogram of UPI change from 1989 to 2016.
Jmse 12 01085 g004
Figure 5. Monthly average wind field distribution from January to December in 2008 (the figures in April and September also contain the wind field distribution of the previous month; red is the current month).
Jmse 12 01085 g005
Figure 6. The distribution of monthly mean upwelling center positions from 1989 to 2016, where one point represents the center position of one month, and points with the same color indicate the same month of different years (a), and the bar chart of the number of center positions in each month within the three main areas of interest (b).
Jmse 12 01085 g006
Figure 7. The probability of daily center position for each month from April to September in 28 (1989–2016) years.
Jmse 12 01085 g007
Figure 8. The number of upwelling centers in different regions for each month.
Jmse 12 01085 g008
Figure 9. The probability of daily core area position for each month from April to September in 28 (1989–2016) years.
Jmse 12 01085 g009
Figure 10. 1989–2016, 28-year daily center (a) and core area (b) probability distribution.
Jmse 12 01085 g010
Figure 11. 8-day average SST upwelling feature extraction results (h represents the results from MODIS, and i represents the results from ESA).
Jmse 12 01085 g011
Figure 12. The probability distribution of the location of the upwelling center after joining the upwelling in the Yangtze River estuary (1989–2016).
Jmse 12 01085 g012
Figure 13. The probability distribution of the location of the upwelling center from GHRSST (2003–2017).
Jmse 12 01085 g013
Figure 14. The probability distribution of the location of the upwelling center after joining the upwelling in the Yangtze River estuary from GHRSST (2003–2017).
Jmse 12 01085 g014
Table 1. The multi-year average upwelling intensity (unit/°C) for three time periods of 10 years, 10 years and 8 years, respectively.
Period/MonthAprMayJunJulAugSep
1989–19980.941.191.271.851.550.96
1999–20081.101.171.311.781.520.89
2009–20161.001.121.031.791.590.87
Table 2. The multi-year average core area areas (unit/km2) for three periods of 10, 10, and 8 years and 28 years, respectively.
Period/MonthAprMayJunJulAugSep
1989–199818,94817,35514,93912,62910,24512,626
1999–200821,16419,75916,03713,04710,38412,957
2009–201619,44817,83013,35213,09812,13913,978
1989–201619,88318,35014,87812,91210,83613,131
Disclaimer/Publisher’s Note: The statements, opinions and data contained in all publications are solely those of the individual author(s) and contributor(s) and not of MDPI and/or the editor(s). MDPI and/or the editor(s) disclaim responsibility for any injury to people or property resulting from any ideas, methods, instructions or products referred to in the content.

