
Numerical Simulation of Gas Production Behavior Using Stepwise Depressurization with a Vertical Well in the Shenhu Sea Area Hydrate Reservoir of the South China Sea

 , ,
, ,
Abstract
1. Introduction
2. Methodology
2.1. Simulation Code
2.2. Model Construction
2.3. Model Initialization and Boundary Conditions
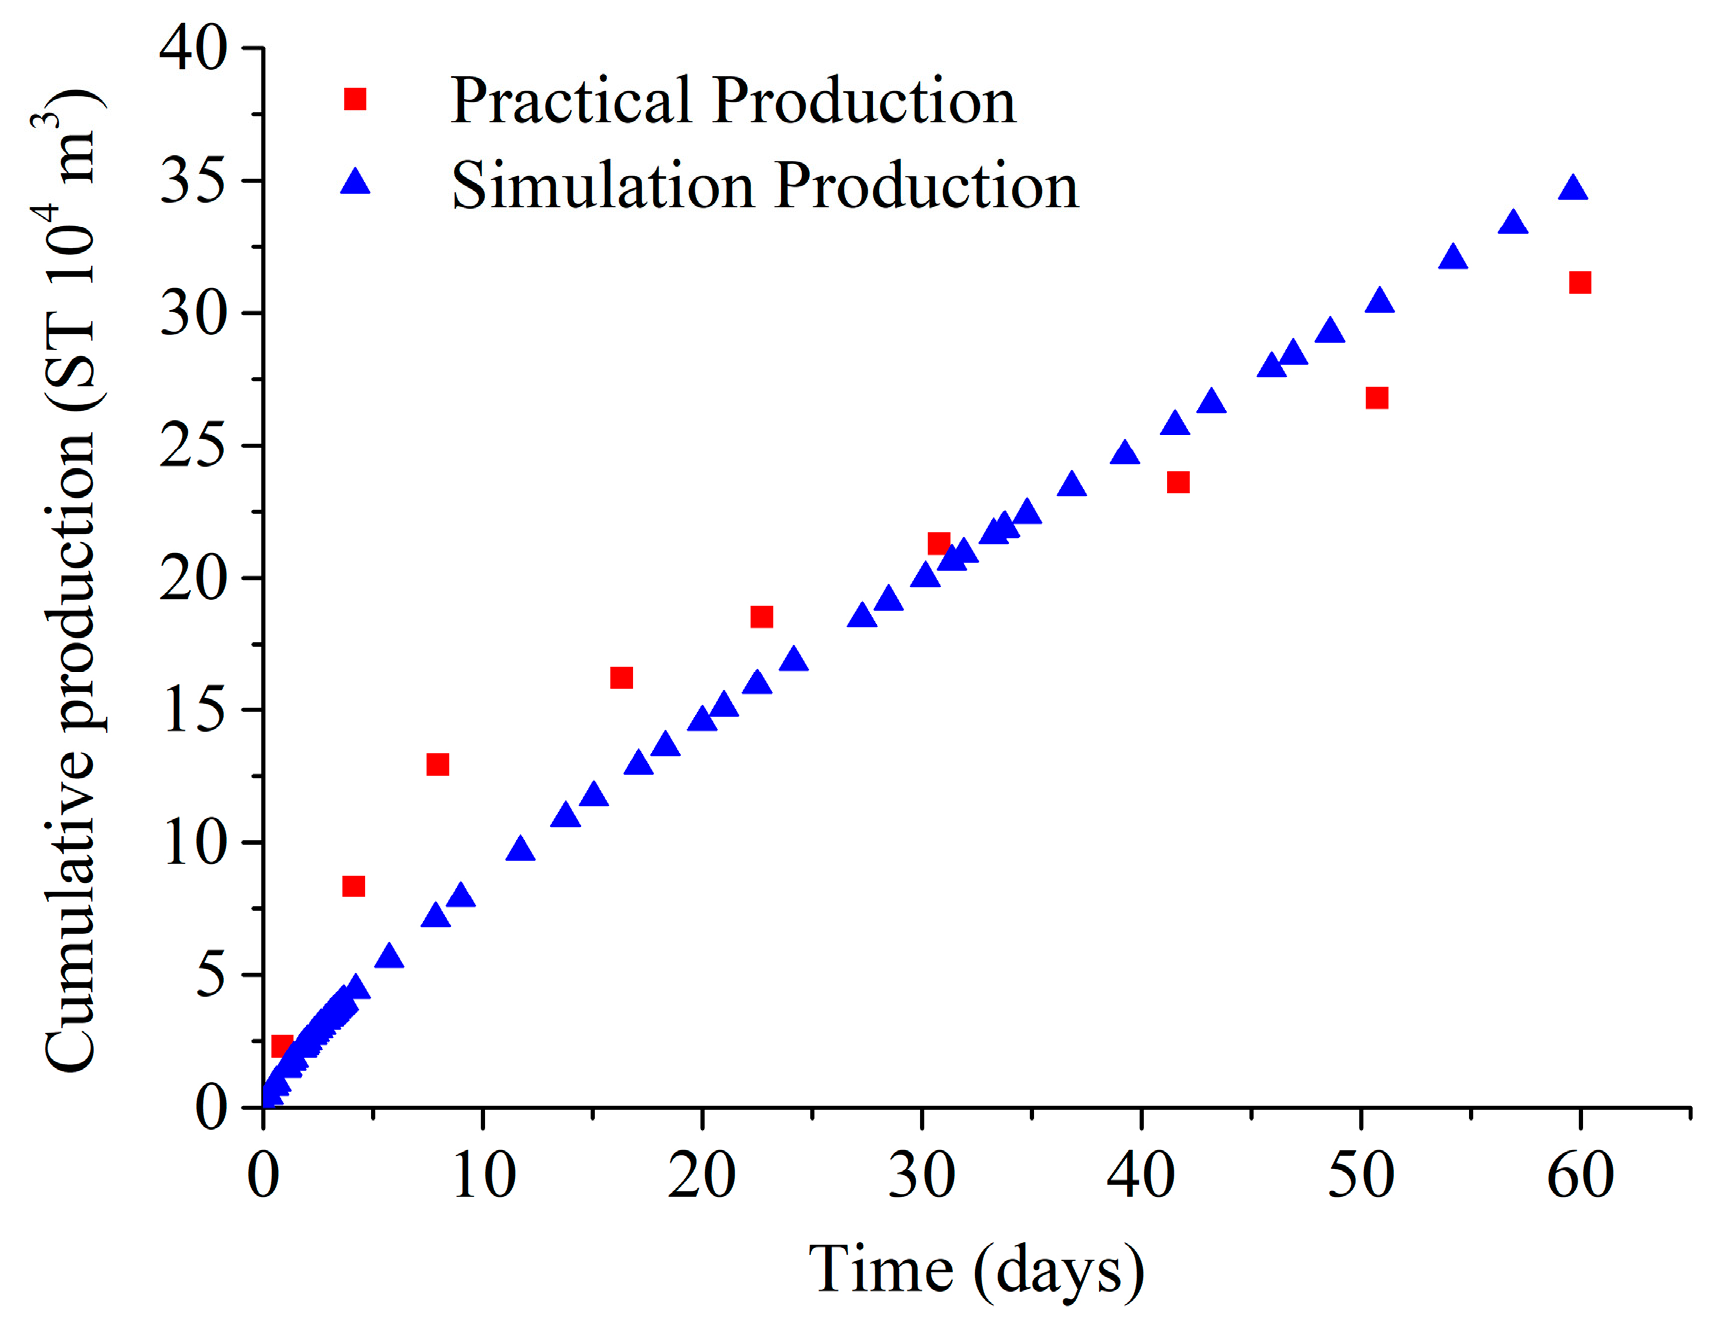
2.4. Model Validation
3. Results and Analysis
3.1. Gas and Water Production
3.2. Physical Properties
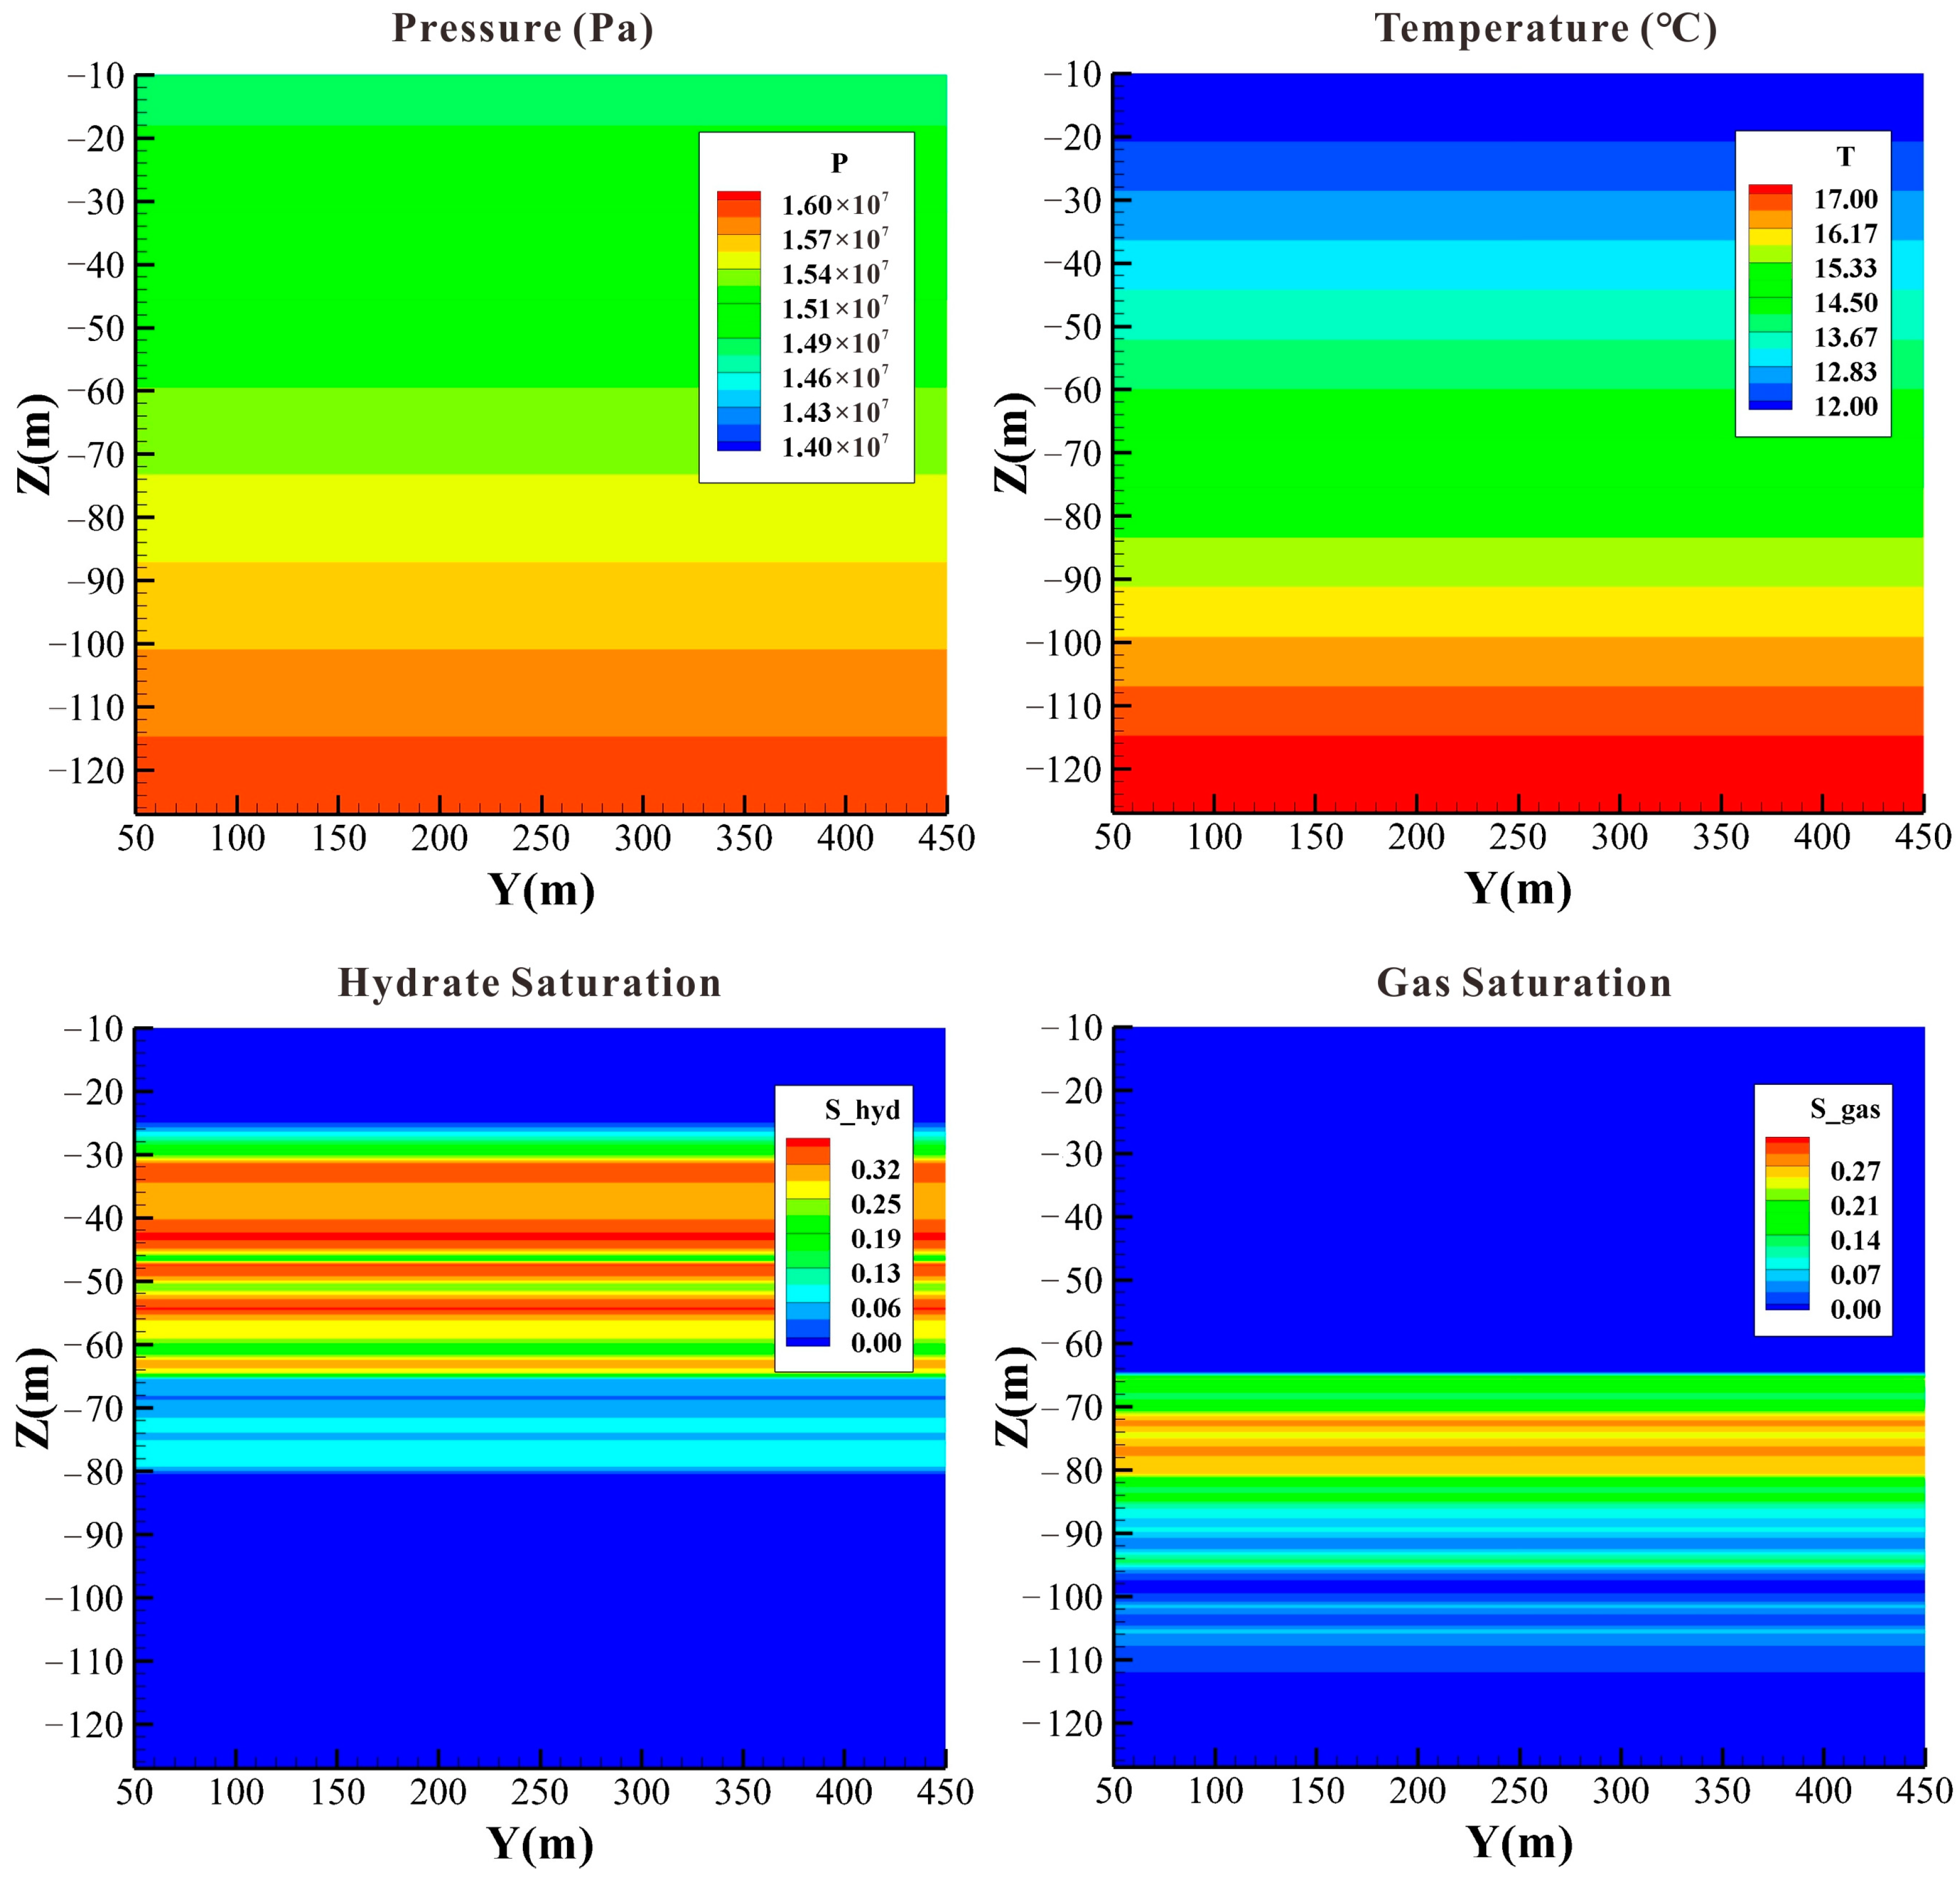
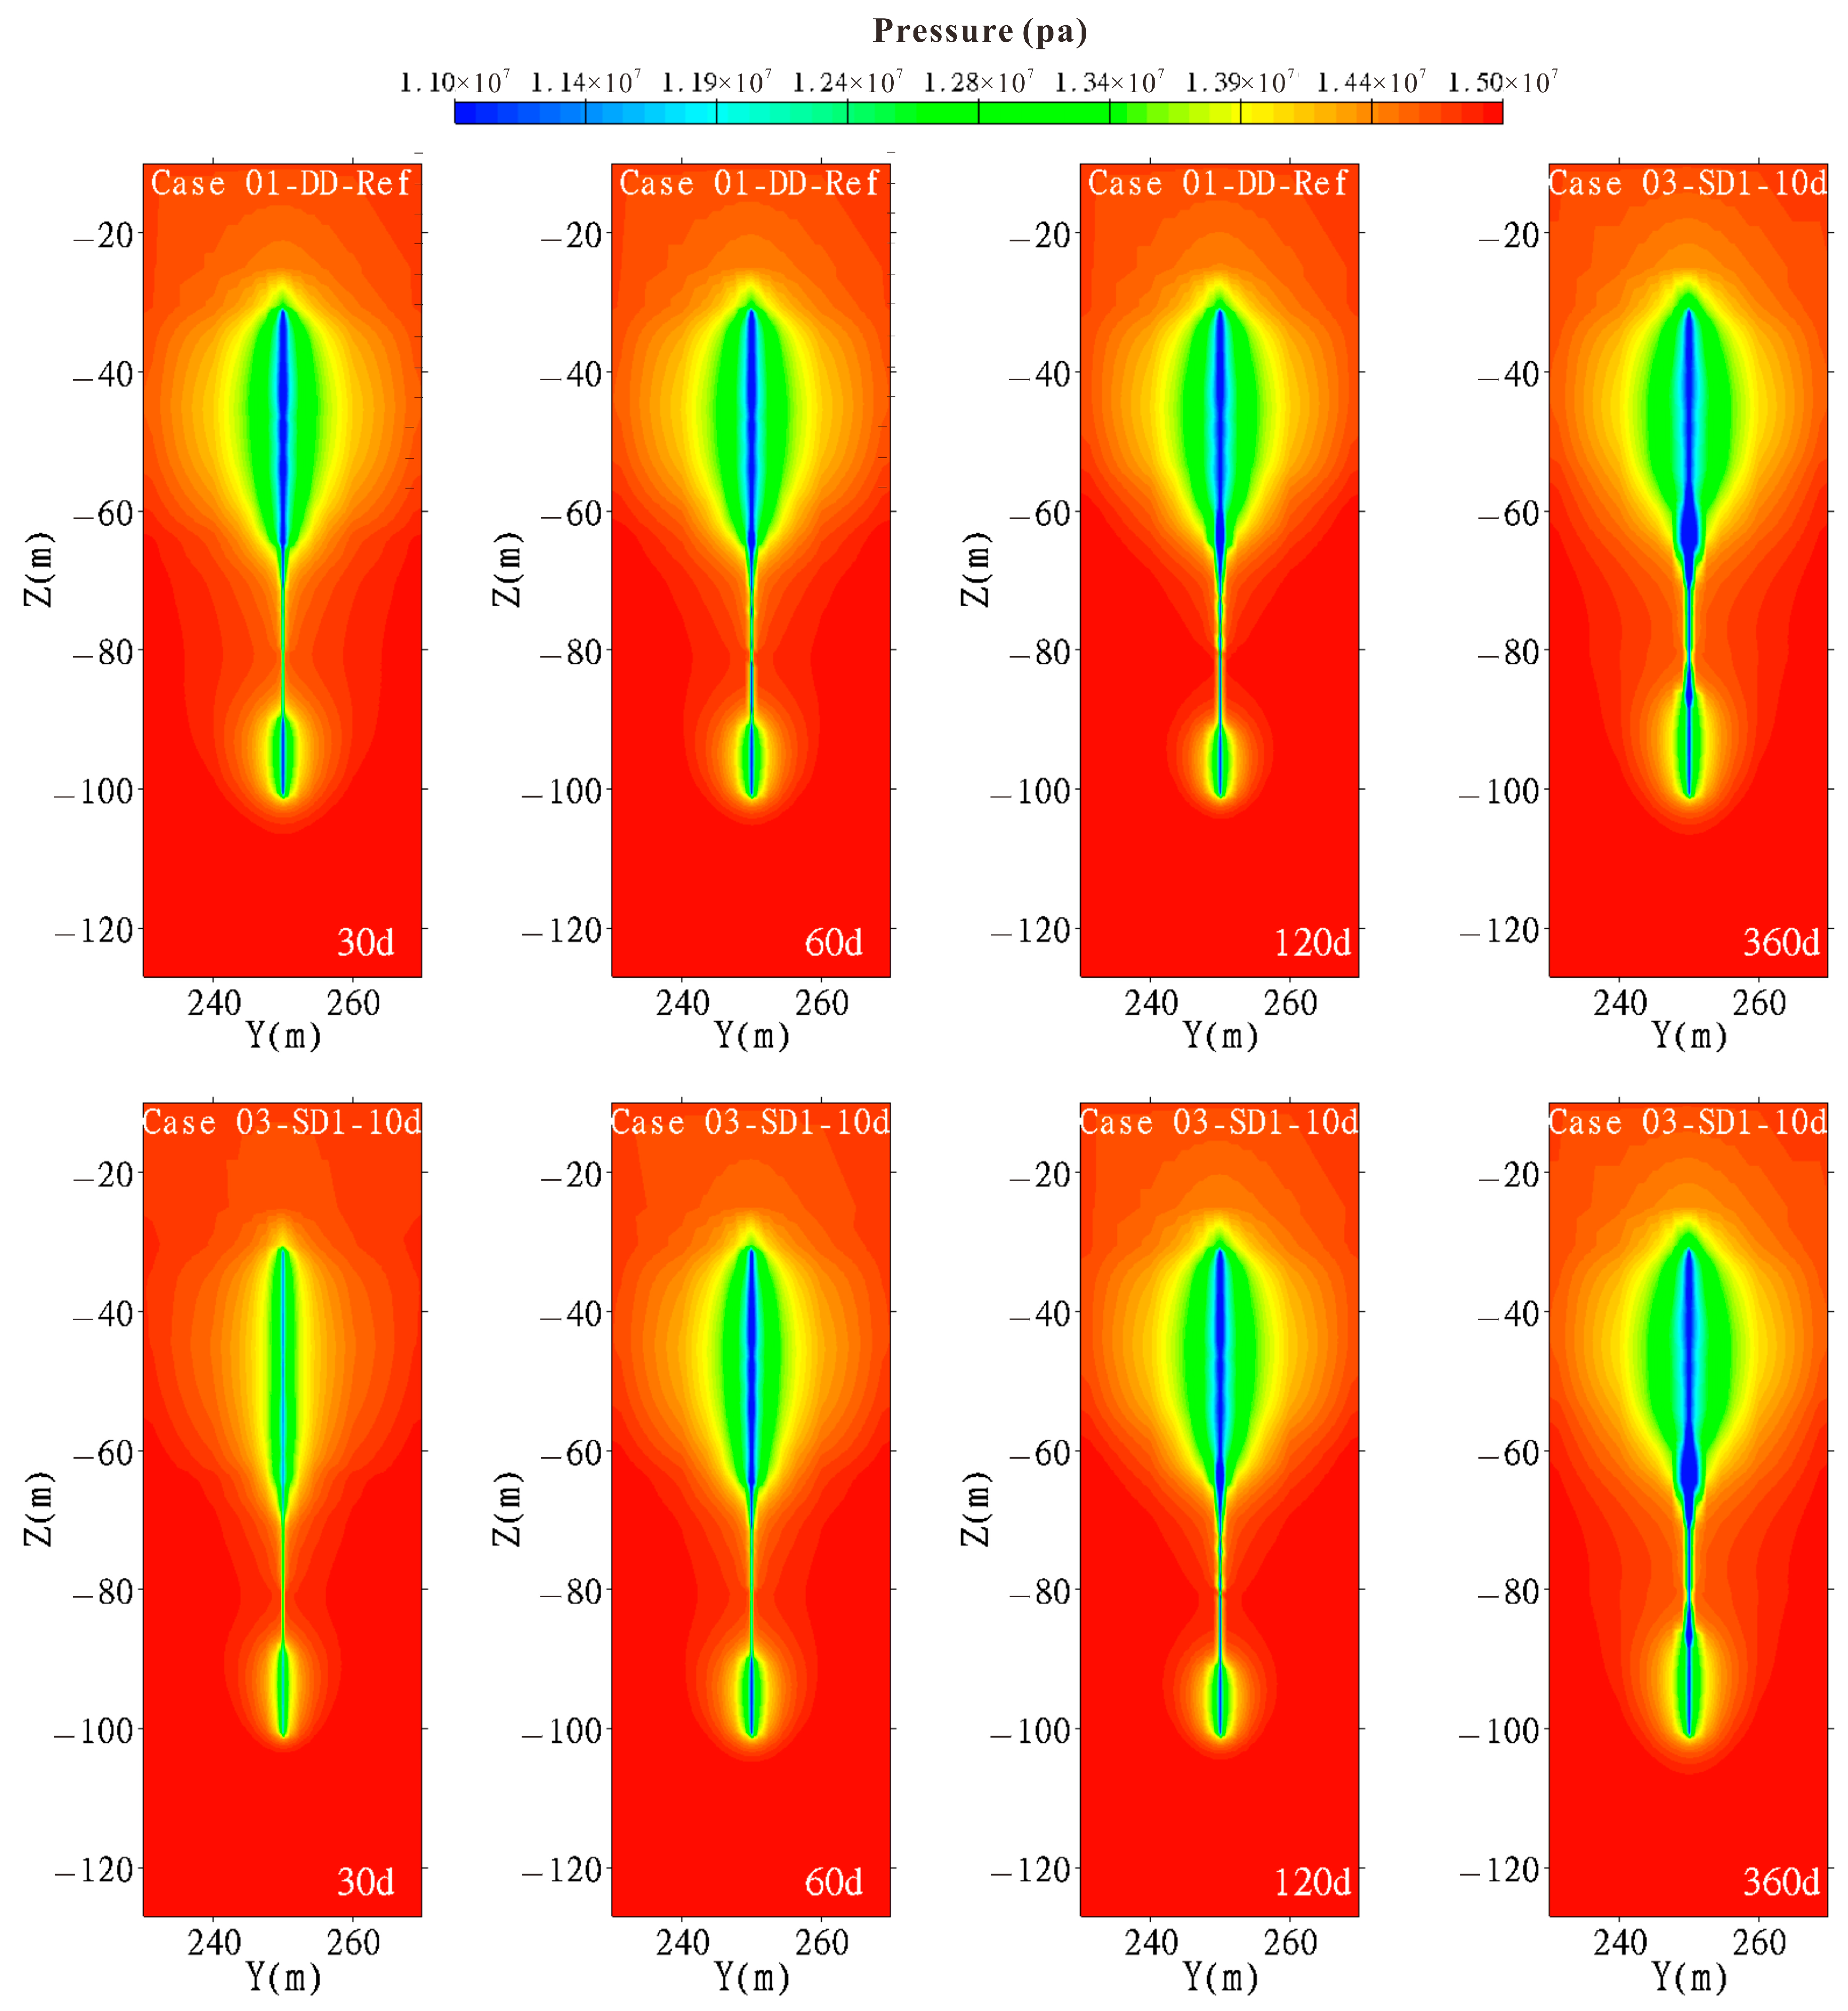
3.2.1. Pressure
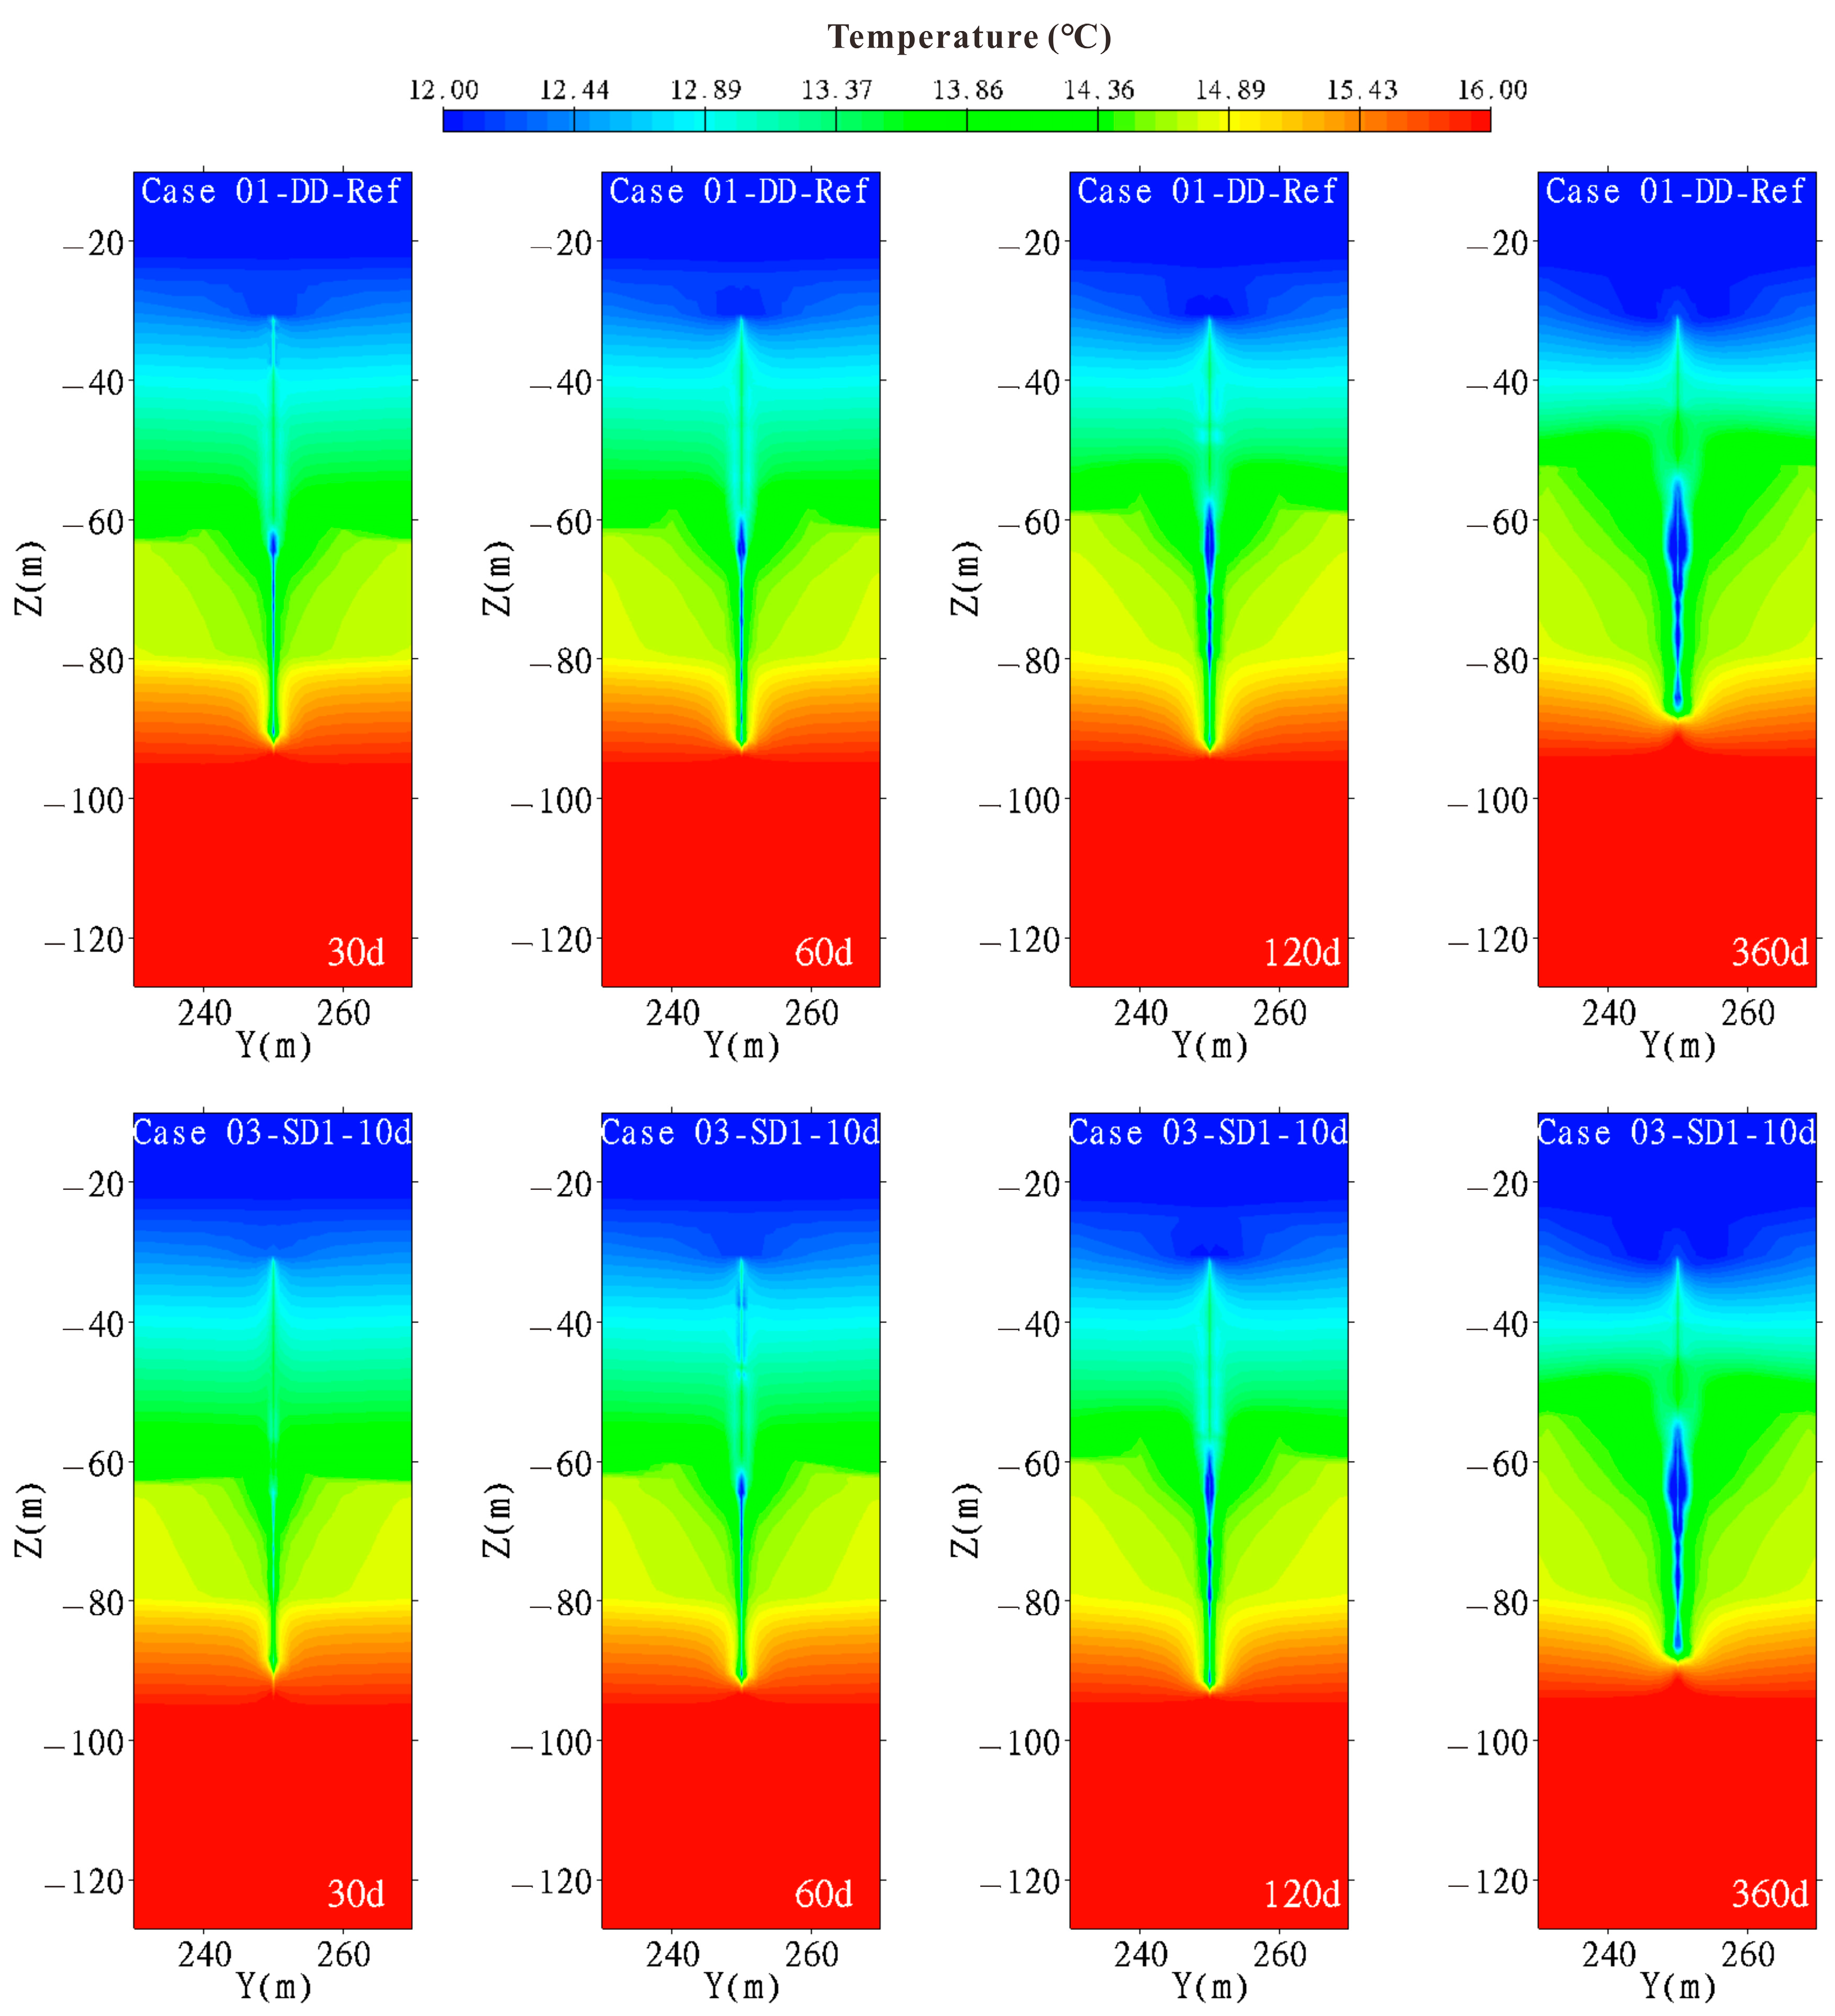
3.2.2. Temperature
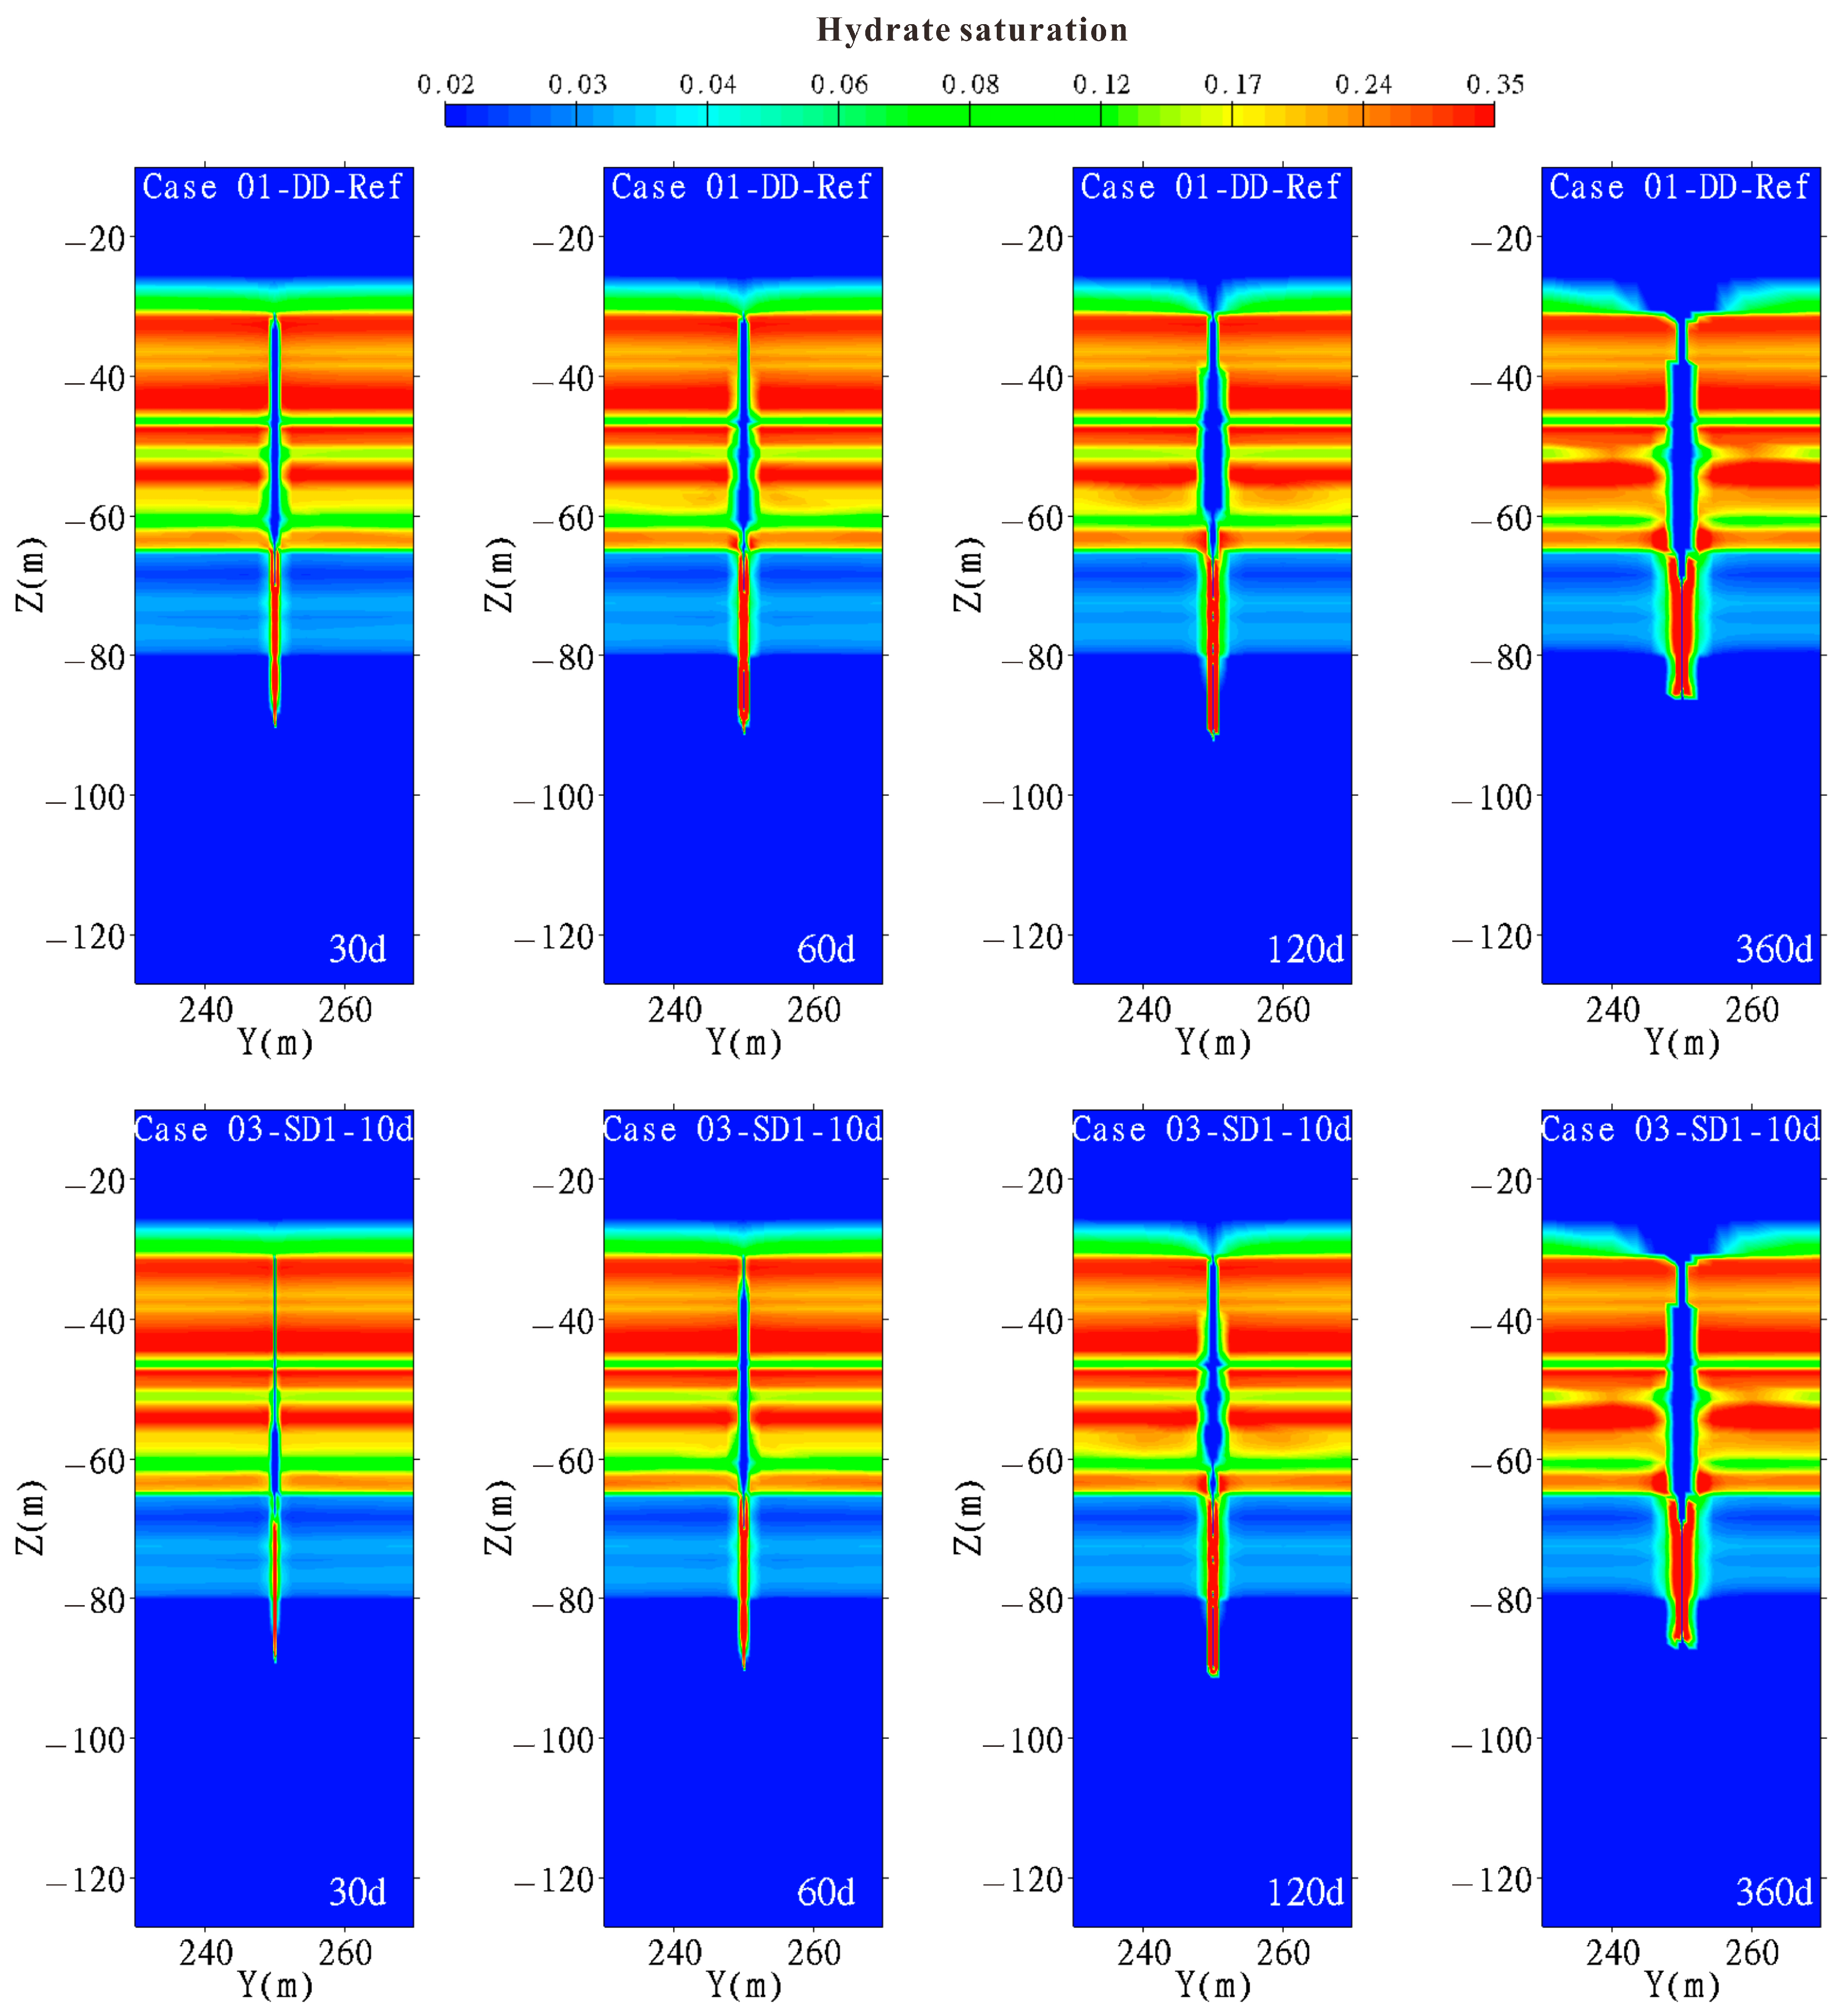
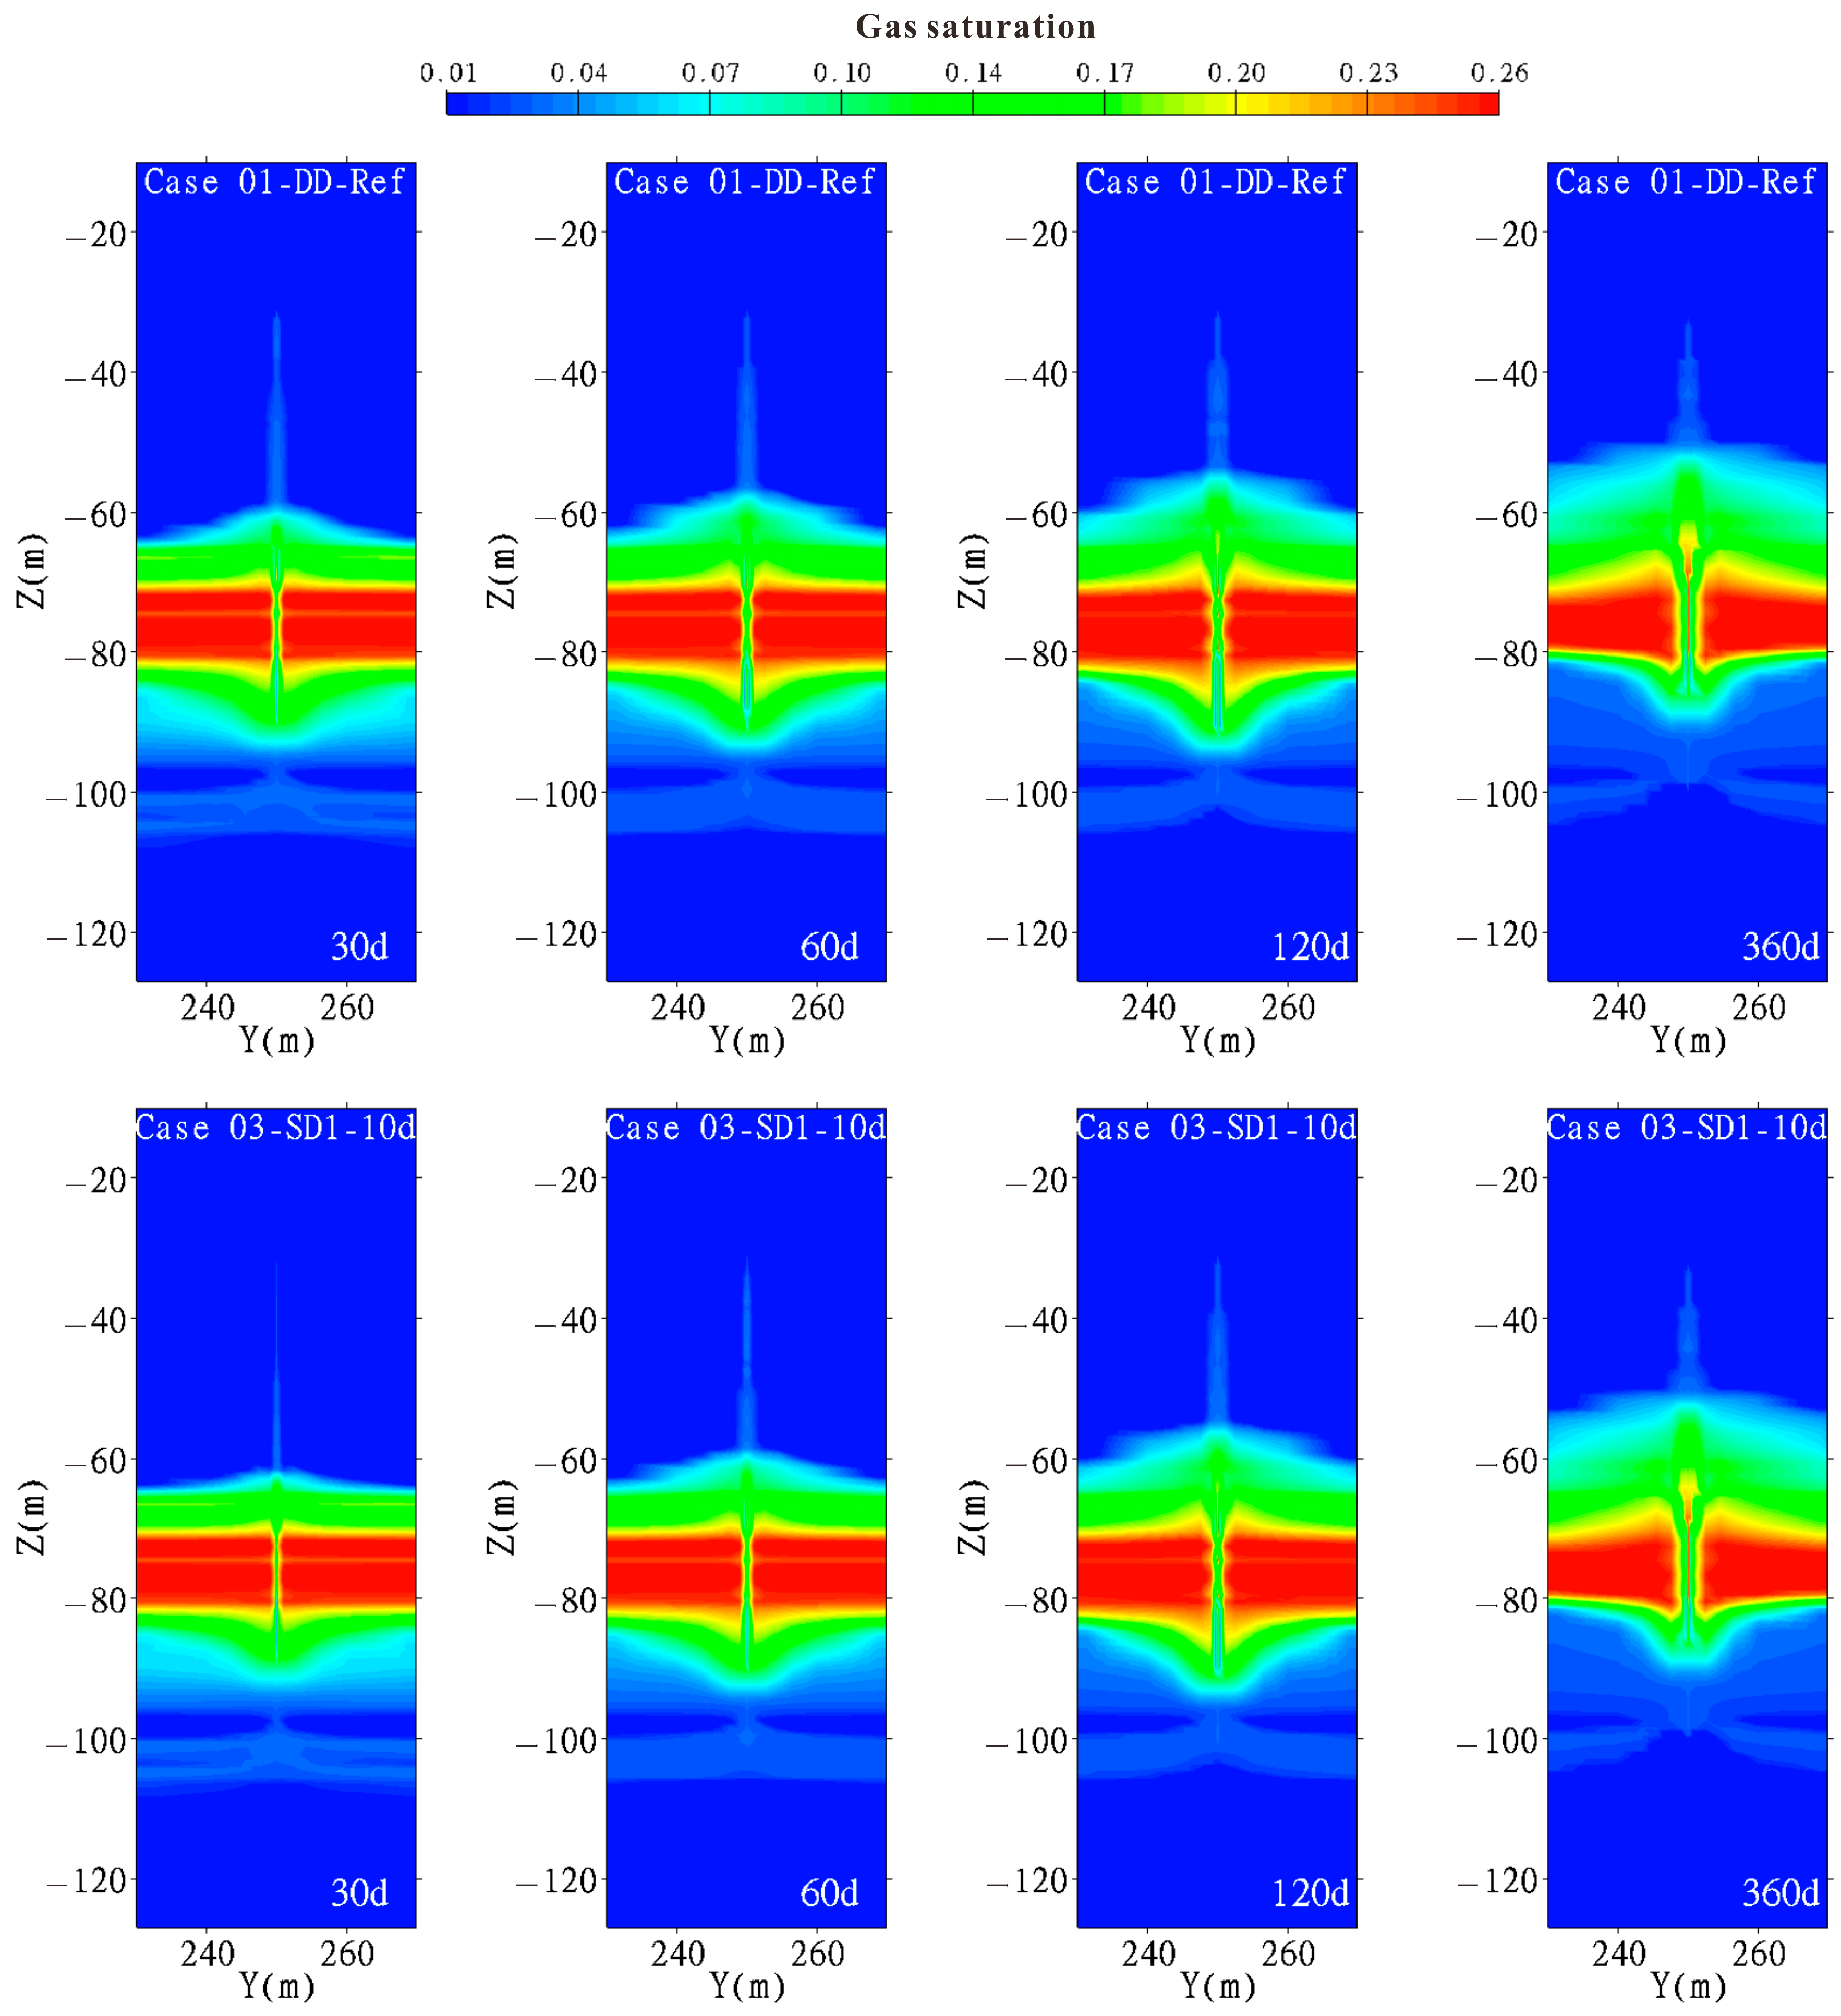
3.2.3. Hydrate and Gas Saturation
4. Discussion
4.1. Effects of Depressurization Gradient
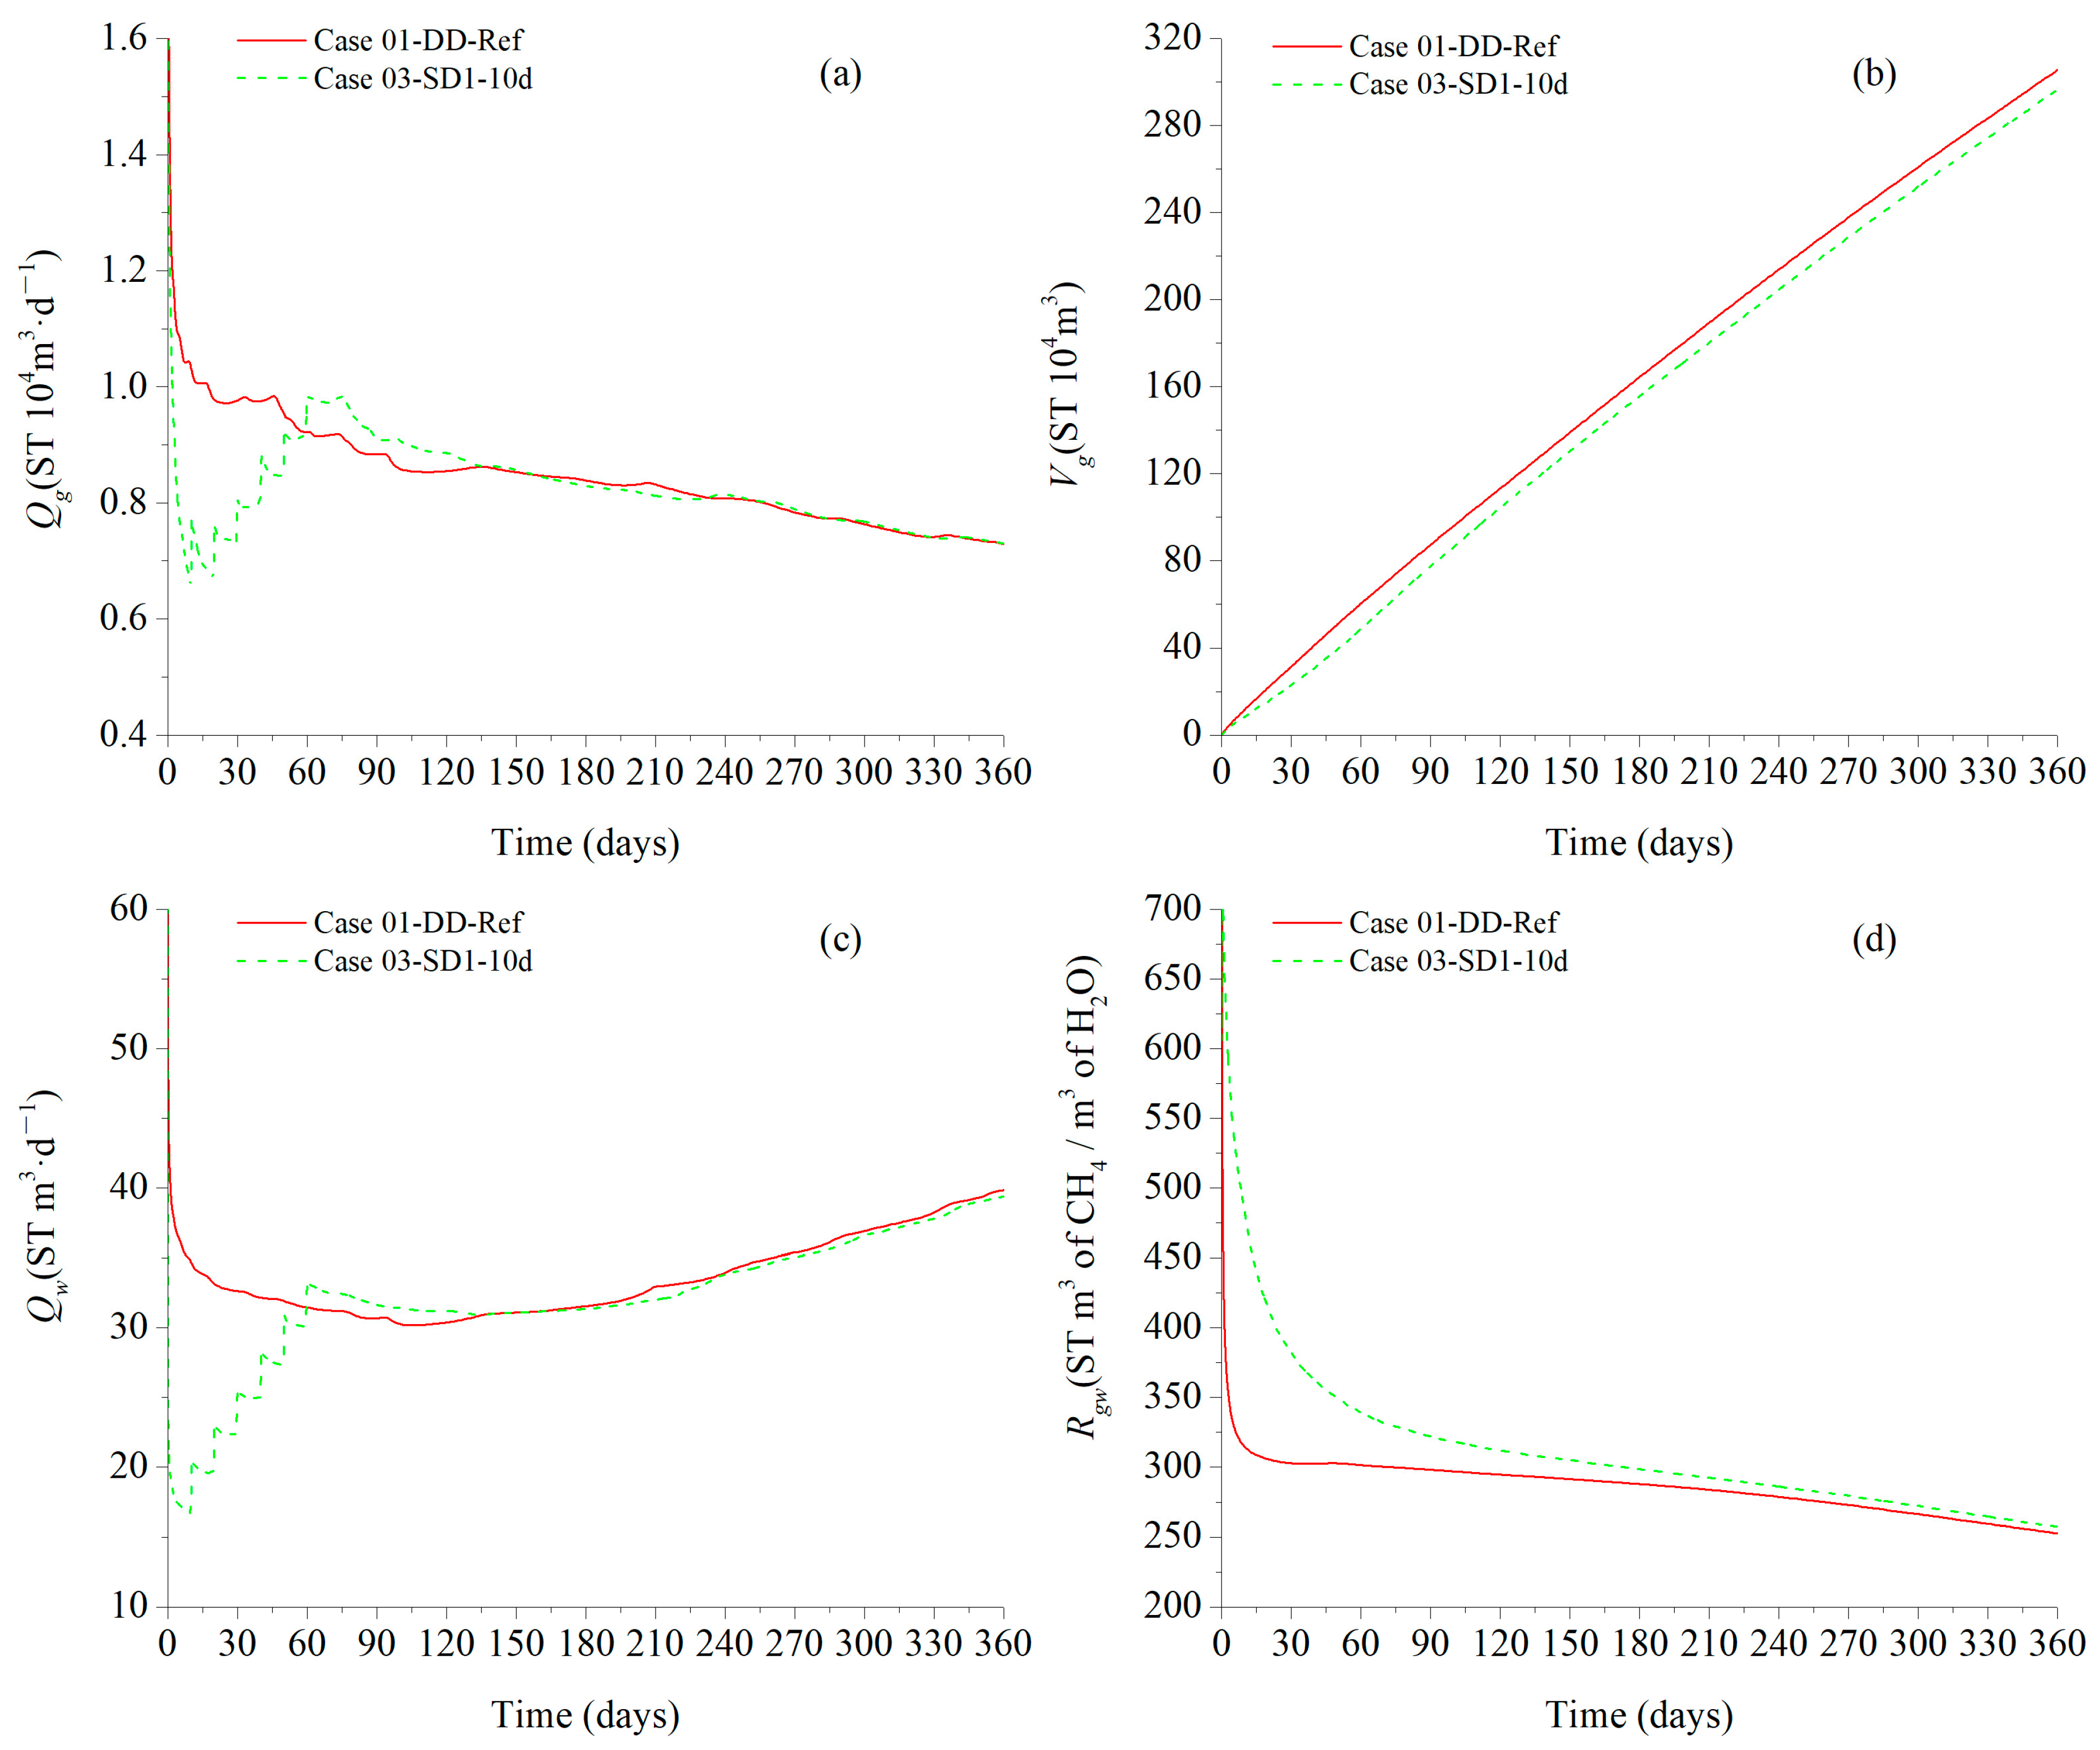
4.2. Effects of Constant Pressure Duration
4.3. Comparison of Production Performance
4.4. Implications and Future Recommendations
5. Conclusions
Author Contributions
Funding
Data Availability Statement
Conflicts of Interest
References
- Collett, T. Energy resource potential of natural gas hydrates. AAPG Bull. 2002, 86, 1971–1992. [Google Scholar]
- Sloan, E. Fundamental principles and applications of natural gas hydrates. Nature 2003, 426, 353–359. [Google Scholar] [CrossRef]
- Boswell, R. Is gas hydrate energy within reach? Science 2009, 325, 957–958. [Google Scholar] [CrossRef]
- Boswell, R.; Collett, T.S. Current perspectives on gas hydrate resources. Energy Environ. Sci. 2011, 4, 1206–1215. [Google Scholar] [CrossRef]
- Chong, Z.; Yang, S.; Babu, P.; Linga, P.; Li, X. Review of natural gas hydrates as an energy resource: Prospects and challenges. Appl. Energy 2016, 162, 1633–1652. [Google Scholar] [CrossRef]
- Makogon, Y. Natural gas hydrates–A promising source of energy. J. Nat. Gas Sci. Eng. 2010, 2, 49–59. [Google Scholar] [CrossRef]
- Burton, Z.; Dafov, L. Testing the sediment organic contents required for biogenic gas hydrate formation: Insights from synthetic 3-D basin and hydrocarbon system modelling. Fuels 2022, 3, 555–562. [Google Scholar] [CrossRef]
- Yamamoto, K.; Terao, Y.; Fujii, T.; Ikawa, T.; Seki, M.; Matsuzawa, M.; Kanno, T. Operational Overview of the First Offshore Production Test of Methane Hydrates in the Eastern Nankai Trough. In Proceedings of the Offshore Technology Conference, Houston, TX, USA, 5–8 May 2014; OnePetro: Richardson, TX, USA, 2014. [Google Scholar]
- Yamamoto, K.; Wang, X.; Tamaki, M.; Suzuki, K. The second offshore production of methane hydrate in the Nankai Trough and gas production behavior from a heterogeneous methane hydrate reservoir. RSC Adv. 2019, 9, 25987–26013. [Google Scholar] [CrossRef]
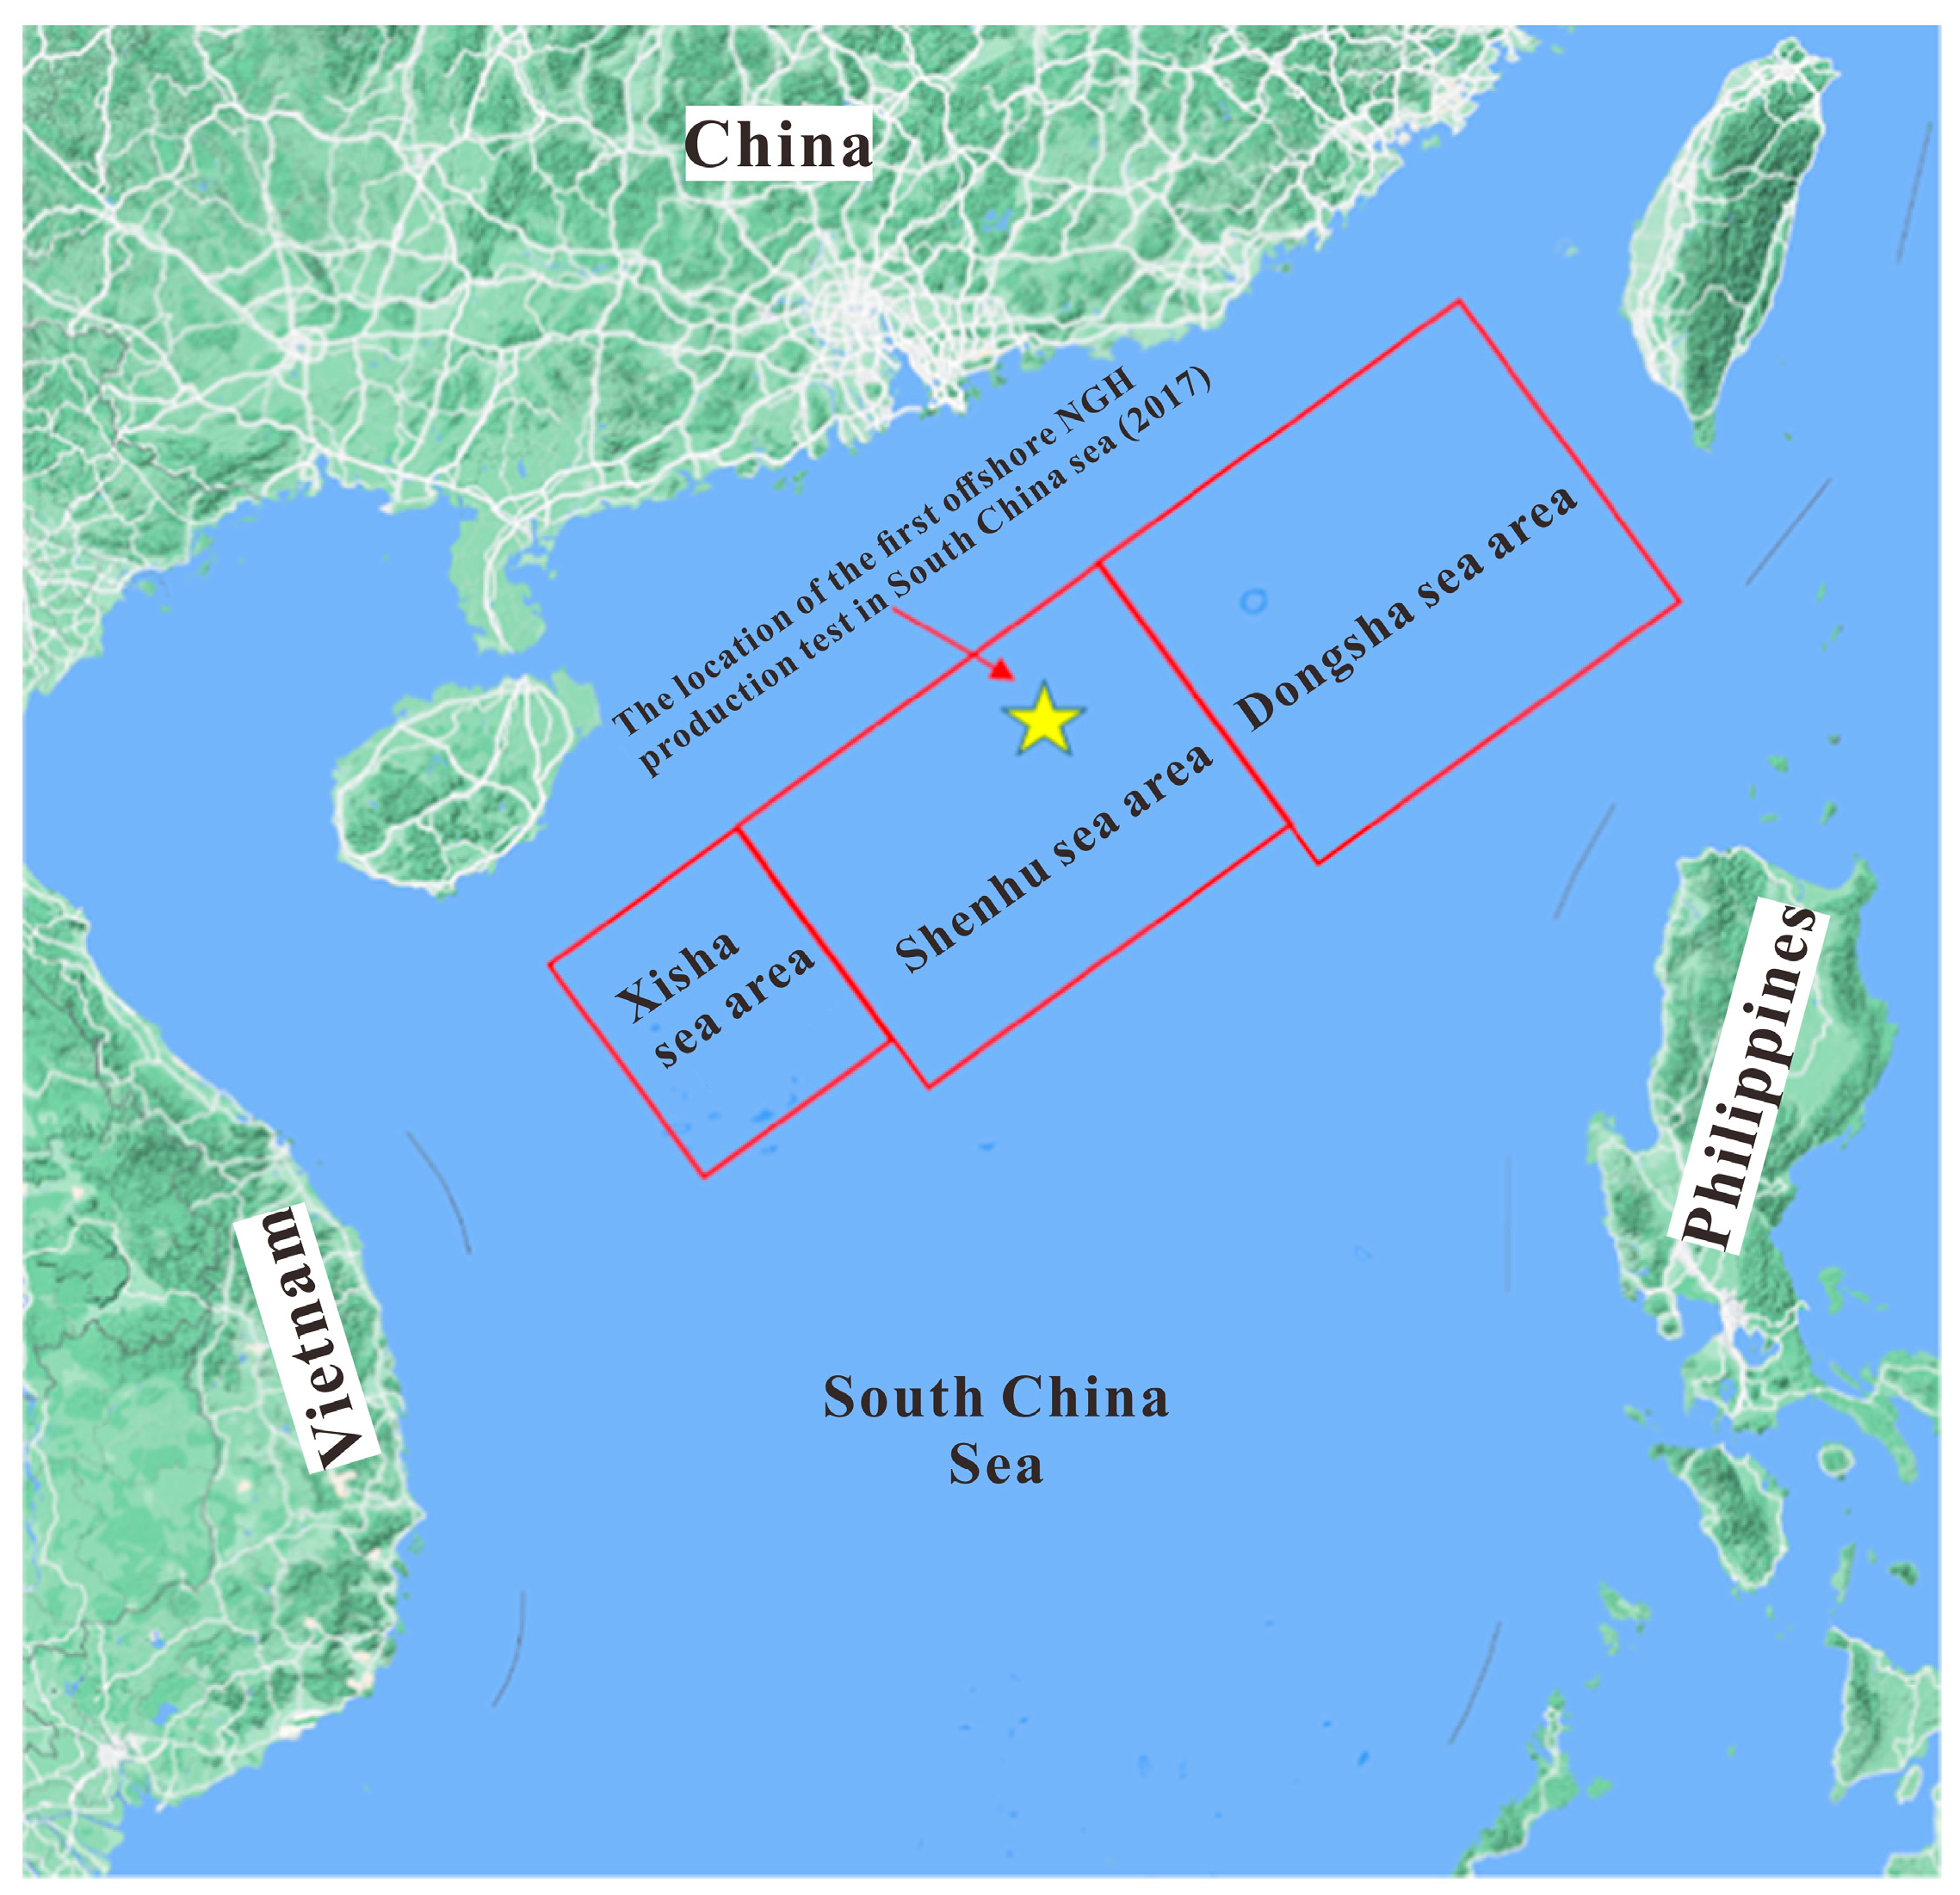
- Li, J.; Ye, J.; Qin, X.; Qiu, H.; Wu, N.; Lu, H.; Xie, W.; Lu, J.; Peng, F.; Xu, Z.; et al. The first offshore natural gas hydrate production test in South China Sea. China Geol. 2018, 1, 5–16. [Google Scholar] [CrossRef]
- Ye, J.; Qin, X.; Xie, W.; Lu, H.; Ma, B.; Qiu, H.; Liang, J.; Lu, J.; Kuang, Z.; Lu, C.; et al. The second natural gas hydrate production test in the South China Sea. China Geol. 2020, 3, 197–209. [Google Scholar] [CrossRef]
- Too, J.; Cheng, A.; Khoo, B.; Palmer, A.; Linga, P. Hydraulic fracturing in a penny-shaped crack. Part II: Testing the frackability of methane hydrate-bearing sand. J. Nat. Gas Sci. Eng. 2018, 52, 619–628. [Google Scholar] [CrossRef]
- Nair, V.; Prasad, S.; Kumar, R.; Sangwai, J. Energy recovery from simulated clayey gas hydrate reservoir using depressurization by constant rate gas release, thermal stimulation and their combinations. Appl. Energy 2018, 225, 755–768. [Google Scholar] [CrossRef]
- Aghajari, H.; Moghaddam, M.; Zallaghi, M. Study of effective parameters for enhancement of methane gas production from natural gas hydrate reservoirs. Green Energy Environ. 2019, 4, 453–469. [Google Scholar] [CrossRef]
- Vedachalam, N.; Ramesh, S.; Jyothi, V.; Ramadass, G.; Atmanand, M.; Manivannan, P. Techno-economic viability studies on methane gas production from gas hydrates reservoir in the Krishna-Godavari basin, east coast of India. J. Nat. Gas Sci. Eng. 2020, 77, 103253. [Google Scholar] [CrossRef]
- Terzariol, M.; Santamarina, J. Multi-well strategy for gas production by depressurization from methane hydrate-bearing sediments. Energy 2021, 220, 119710. [Google Scholar] [CrossRef]
- Wu, N.; Li, Y.; Wan, Y.; Sun, J.; Huang, L.; Mao, P. Prospect of marine natural gas hydrate stimulation theory and technology system. Nat. Gas Ind. B. 2021, 40, 173–187. [Google Scholar] [CrossRef]
- Moridis, G.; Reagan, M. Estimating the Upper Limit of Gas Production from Class 2 Hydrate Accumulations in the Permafrost: 1. Concepts, System Description, and the Production Base Case. J. Pet. Sci. Eng. 2011, 76, 194–204. [Google Scholar] [CrossRef]
- Phillips, S.; Flemings, P.; You, K.; Meyer, D.; Dong, T. Investigation of in situ salinity and methane hydrate dissociation in coarse-grained sediments by slow, stepwise depressurization. Mar. Petrol. Geol. 2019, 109, 128–144. [Google Scholar] [CrossRef]
- Yin, Z.; Wan, Q.; Qiang, G.; Linga, P. Effect of pressure drawdown rate on the fluid production behaviour from methane hydrate-bearing sediments. Appl. Energy 2020, 271, 115195. [Google Scholar] [CrossRef]
- Zhao, J.; Liu, Y.; Guo, X.; Wei, R.; Yu, T.; Xu, L.; Sun, L.; Yang, L. Gas production behavior from hydrate-bearing fine natural sediments through optimized step-wise depressurization. Appl. Energy 2020, 260, 114275. [Google Scholar] [CrossRef]
- Guo, X.; Xu, L.; Wang, B.; Sun, L.; Liu, Y.; Wei, R.; Yang, L.; Zhao, J. Optimized gas and water production from water-saturated hydrate-bearing sediment through step-wise depressurization combined with thermal stimulation. Appl. Energy 2020, 276, 115438. [Google Scholar] [CrossRef]
- Ravesh, R.; Ansari, A.; Mohapatra, S.; Panigrahi, P.; Das, M. Methane Hydrate Dissociation in Porous Media using Multistep Depressurization: An Experimental Study. In Proceedings of the 25th National and 3rd International ISHMT-ASTFE Heat and Mass Transfer Conference (IHMTC-2019), Roorkee, India, 28–31 December 2019; Begel House Inc.: Danbury, CT, USA, 2019. [Google Scholar]
- Yoon, H.; Yoon, S.; Lee, J.; Kim, J. Multiple porosity model of a heterogeneous layered gas hydrate deposit in Ulleung Basin, East Sea, Korea: A study on depressurization strategies, reservoir geomechanical response, and wellbore stability. J. Nat. Gas Sci. Eng. 2021, 96, 104321. [Google Scholar] [CrossRef]
- Li, Y.; He, C.; Wu, N.; Chen, Q.; Liu, C.; Sun, Z.; Jin, Y.; Meng, Q. Laboratory study on hydrate production using a slow, multistage depressurization strategy. Geofluids 2021, 2021, 4352910. [Google Scholar] [CrossRef]
- Yin, F.; Gao, Y.; Zhang, H.; Sun, B.; Chen, Y.; Gao, D.; Zhao, X. Comprehensive evaluation of gas production efficiency and reservoir stability of horizontal well with different depressurization methods in low permeability hydrate reservoir. Energy 2022, 239, 122422. [Google Scholar] [CrossRef]
- Wang, J.; He, J.; Dong, H.; Ge, K. Association between multiphase seepage and exploitation of natural gas hydrate based on the Shenhu area of South China Sea. J. Pet. Sci. Eng. 2022, 209, 109855. [Google Scholar] [CrossRef]
- Yin, F.; Gao, Y.; Chen, Y.; Sun, B.; Li, S.; Zhao, D. Numerical investigation on the long-term production behavior of horizontal well at the gas hydrate production site in South China Sea. Appl. Energy 2022, 311, 118603. [Google Scholar] [CrossRef]
- Xue, K.; Liu, Y.; Yu, T.; Lv, J. Numerical Simulation of Optimized Step-Wise Depressurization for Enhanced Natural Gas Hydrate Production in the Nankai Trough of Japan. Processes 2023, 11, 1812. [Google Scholar] [CrossRef]
- Ge, K.; Zhang, X.; Wang, J.; Cheng, C.; He, J. Optimization of the depressurization rate and stepwise strategy for hydrate exploitation using a genetic algorithm-based depressurization method. Chem. Eng. Sci. 2023, 265, 118218. [Google Scholar] [CrossRef]
- Wang, J.; Zhang, X.; Ge, K.; Yu, W.; Wei, H.; Liu, J. Research on Natural Gas Production Behavior Using Stepwise Depressurization with a Horizontal Well. Energy Fuels 2023, 37, 10367–10382. [Google Scholar] [CrossRef]
- Biastoch, A.; Treude, T.; Rüpke, L.; Riebesell, U.; Roth, C.; Burwicz, E.; Park, W.; Latif, M.; Böning, C.; Madec, G.; et al. Rising Arctic Ocean temperatures cause gas hydrate destabilization and ocean acidification. Geophys. Res. Lett. 2011, 38, L08602. [Google Scholar] [CrossRef]
- Burton, Z.; Kroeger, K.; Hosford Scheirer, A.; Seol, Y.; Burgreen-Chan, B.; Graham, S.A. Tectonic uplift destabilizes subsea gas hydrate: A model example from Hikurangi margin, New Zealand. Geophys. Res. Lett. 2020, 47, e2020GL087150. [Google Scholar] [CrossRef]
- Kim, B.; Zhang, Y. Methane hydrate dissociation across the Oligocene–Miocene boundary. Nat. Geosci. 2022, 15, 203–209. [Google Scholar] [CrossRef]
- Burton, Z.; Dafov, L. Salt Diapir-Driven Recycling of Gas Hydrate. Geochem. Geophys. Geosyst. 2023, 24, e2022GC010704. [Google Scholar] [CrossRef]
- Moridis, G.; Kowalsky, M.; Pruess, K. TOUGH+ Hydrate V1.0 User’s Manual; Report LBNL-0149E; Lawrence Berkeley National Laboratory: Berkeley, CA, USA, 2008. [Google Scholar]
- Piñero, E.; Hensen, C.; Haeckel, M.; Rottke, W.; Fuchs, T.; Wallmann, K. 3-D numerical modelling of methane hydrate accumulations using PetroMod. Mar. Pet. Geol. 2016, 71, 288–295. [Google Scholar] [CrossRef]
- Burton, Z. Sediment organic contents required for gas hydrate formation: A survey of published basin and hydrocarbon system models. Fuels 2022, 3, 580–587. [Google Scholar] [CrossRef]
- Moridis, G.; Reagan, M.; Boyle, K.; Zhang, K. Evaluation of the gas production potential of some particularly challenging types of oceanic hydrate deposits. Transp. Porous Media 2011, 90, 269–299. [Google Scholar] [CrossRef]
- Moridis, G.; Kim, J.; Reagan, M.; Kim, S. Feasibility of gas production from a gas hydrate accumulation at the UBGH2-6 site of the Ulleung basin in the Korean East Sea. J. Pet. Sci. Eng. 2013, 108, 180–210. [Google Scholar] [CrossRef]
- Moridis, G.; Reagan, M.; Queiruga, A.; Boswell, R. Evaluation of the performance of the oceanic hydrate accumulation at site NGHP-02-09 in the Krishna-Godavari Basin during a production test and during single and multi-well production scenarios. Mar. Pet. Geol. 2019, 108, 660–696. [Google Scholar] [CrossRef]
- Su, Z.; Moridis, G.; Zhang, K.; Wu, N. A huff-and-puff production of gas hydrate deposits in Shenhu area of South China Sea through a vertical well. J. Pet. Sci. Eng. 2012, 86–87, 54–61. [Google Scholar] [CrossRef]
- Yin, Z.; Moridis, G.; Chong, Z.; Linga, P. Effectiveness of multi-stage cooling processes in improving the CH4-hydrate saturation uniformity in sandy laboratory samples. Appl. Energy 2019, 250, 729–747. [Google Scholar] [CrossRef]
- Kowalsky, M.; Moridis, G. Comparison of kinetic and equilibrium reaction models in simulating gas hydrate behavior in porous media. Energy Convers. Manag. 2007, 48, 1850–1863. [Google Scholar] [CrossRef]
- Hao, Y.; Yang, F.; Wang, J.; Fan, M.; Li, S.; Yang, S.; Wang, C.; Xiao, X. Dynamic analysis of exploitation of different types of multilateral wells of a hydrate reservoir in the South China sea. Energy Fuels 2022, 36, 6083–6095. [Google Scholar] [CrossRef]
- Zhang, W.; Liang, J.; Lu, J.; Wei, J.; Su, P.; Fang, Y.; Guo, Y.; Yang, S.; Zang, G. Accumulation features and mechanisms of high saturation natural gas hydrate in shenhu area, northern south China sea. Pet. Explor. Dev. 2017, 44, 708–719. [Google Scholar] [CrossRef]
- Su, P.; He, J.; Liang, J.; Zhang, W. Natural gas hydrate migration and accumulation system and its controlling factors on northern deep water slope of the South China Sea. Mar. Geol. Front. 2017, 33, 1–10. [Google Scholar]
- Moridis, G.; Kowalsky, M.; Pruess, K. Depressurization-induced gas production from class 1 hydrate deposits. SPE Reserv. Eval. Eng. 2007, 10, 458–481. [Google Scholar] [CrossRef]
- Yu, T.; Guan, G.; Wang, D.; Song, Y.; Abudula, A. Numerical investigation on the long-term gas production behavior at the 2017 Shenhu methane hydrate production site. Appl. Energy 2021, 285, 116466. [Google Scholar] [CrossRef]
- Sun, J.; Zhang, L.; Ning, F.; Lei, H.; Liu, T.; Hu, G.; Lu, H.; Lu, J.; Liu, C.; Jiang, G.; et al. Production potential and stability of hydrate-bearing sediments at the site GMGS3-W19 in the South China Sea: A preliminary feasibility study. Mar. Pet. Geol. 2017, 86, 447–473. [Google Scholar] [CrossRef]
- Yuan, Y.; Xu, T.; Xin, X.; Xia, Y. Multiphase Flow Behavior of Layered Methane Hydrate Reservoir Induced by Gas Production. Geofluids 2017, 2017, 7851031. [Google Scholar] [CrossRef]
- Zhang, J.; Yin, Z.; Li, Q.; Li, S.; Wang, Y.; Li, X. Comparison of fluid production between excess-gas and excess-water hydrate-bearing sediments under depressurization and its implication on energy recovery. Energy 2023, 282, 128315. [Google Scholar] [CrossRef]
- Feng, Y.; Chen, L.; Suzuki, A.; Kogawa, T.; Okajima, J.; Komiya, A.; Maruyama, S. Enhancement of gas production from methane hydrate reservoirs by the combination of hydraulic fracturing and depressurization method. Energy Convers. Manag. 2019, 184, 194–204. [Google Scholar] [CrossRef]
- Moridis, G.; Reagan, M.; Kim, S.; Seol, Y.; Zhang, K. Evaluation of the Gas Production Potential of Marine Hydrate Deposits in the Ulleung Basin of the Korean East Sea. Spe J. 2007, 14, 759–781. [Google Scholar] [CrossRef]
- Li, G.; Li, X.; Zhang, K.; Li, B.; Zhang, Y. Effects of Impermeable Boundaries on Gas Production from Hydrate Accumulations in the Shenhu Area of the South China Sea. Energies 2013, 6, 4078–4096. [Google Scholar] [CrossRef]
- Sun, Y.; Ma, X.; Guo, W.; Jia, R.; Li, B. Numerical simulation of the short- and long-term production behavior of the first offshore gas hydrate production test in the South China Sea. J. Pet. Sci. Eng. 2019, 181, 106196. [Google Scholar] [CrossRef]
- Ma, X.; Sun, Y.; Liu, B.; Guo, W.; Jia, R.; Li, B.; Li, S. Numerical study of depressurization and hot water injection for gas hydrate production in China’s first offshore test site. J. Nat. Gas Sci. Eng. 2020, 83, 103530. [Google Scholar] [CrossRef]
- Cao, X.; Sun, J.; Qin, F.; Ning, F.; Mao, P.; Gu, Y.; Li, Y.; Zhang, H.; Yu, Y.; Wu, N. Numerical analysis on gas production performance by using a multilateral well system at the first offshore hydrate production test site in the Shenhu area. Energy 2023, 270, 126690. [Google Scholar] [CrossRef]
- Qin, X.; Liang, Q.; Yang, L.; Qiu, H.; Xie, W.; Liang, J.; Lu, J.; Lu, C.; Lu, H.; Ma, B.; et al. The response of temperature and pressure of hydrate reservoirs in the first gas hydrate production test in South China Sea. Appl. Energy 2020, 278, 115649. [Google Scholar] [CrossRef]
- Wang, H.; Liu, W.; Wu, P.; Pan, X.; You, Z.; Lu, J.; Li, Y. Gas recovery from marine hydrate reservoir: Experimental investigation on gas flow patterns considering pressure effect. Energy 2023, 275, 127482. [Google Scholar] [CrossRef]
- Zhou, S.; Li, Q.; Zhu, J.; Gu, Q.; Wang, L.; Wu, Z. Experimental Study on Permeability of Methane Hydrate Clayey Interbedded Sediments Considering Effective Stress and Hydrate Dissociation. Energy Fuels 2023, 37, 11113–11124. [Google Scholar] [CrossRef]
- Wu, Z.; Gu, Q.; Wang, L.; Li, G.; Shi, C.; He, Y.; Li, Q.; Li, Y. Experimental Study on Permeability and Gas Production Characteristics of Montmorillonite Hydrate Sediments Considering the Effective Stress and Gas Slippage Effect. SPE J. 2024, 29, 2525–2544. [Google Scholar] [CrossRef]
- Uchida, S.; Klar, A.; Yamamoto, K. Sand production model in gas hydrate-bearing sediments. Int. J. Rock Mech. Min. Sci. 2016, 86, 303–316. [Google Scholar] [CrossRef]
- Wu, N.; Li, Y.; Chen, Q.; Liu, C.; Jin, Y.; Tan, M.; Ding, L.; Hu, G. Sand production management during marine natural gas hydrate exploitation: Review and an innovative solution. Energy Fuels 2021, 35, 4617–4632. [Google Scholar] [CrossRef]
- Deng, F.; Huang, B.; Li, X.; Liu, J.; Li, G.; Xu, Y.; Yin, B. Review of Sand Control and Sand Production in a Gas Hydrate Reservoir. Energy Fuels 2022, 36, 11712–11723. [Google Scholar] [CrossRef]
- Zhu, H.; Xu, T.; Yuan, Y.; Feng, G.; Xia, Y.; Xin, X. Numerical analysis of sand production during natural gas extraction from unconsolidated hydrate-bearing sediments. J. Nat. Gas Sci. Eng. 2020, 76, 103229. [Google Scholar] [CrossRef]
- Magoon, L.B.; Dow, W.G. The petroleum system. In The Petroleum System—From Source to Trap; Magoon, L.B., Dow, W.G., Eds.; American Association of Petroleum Geologists Memoir: Tulsa, OK, USA, 1994; Volume 60, pp. 3–24. [Google Scholar]
- Burton, Z.; Moldowan, J.; Sykes, R.; Graham, S. Unraveling petroleum degradation, maturity, and mixing and addressing impact on petroleum prospectivity: Insights from frontier exploration regions in New Zealand. Energy Fuels 2018, 32, 1287–1296. [Google Scholar] [CrossRef]
- Burton, Z.; Moldowan, J.; Magoon, L.; Sykes, R.; Graham, S. Interpretation of source rock depositional environment and age from seep oil, east coast of New Zealand. Int. J. Earth Sci. 2019, 108, 1079–1091. [Google Scholar] [CrossRef]
- Jang, J.; Waite, W.; Stern, L. Gas hydrate petroleum systems: What constitutes the “seal”? Interpretation 2020, 8, T231–T248. [Google Scholar] [CrossRef]
- Almashwali, A.; Bavoh, C.; Lal, B.; Khor, S.; Jin, Q.; Zaini, D. Gas hydrate in oil-dominant systems: A review. ACS Omega 2022, 7, 27021–27037. [Google Scholar] [CrossRef]


| Scenarios | Production Pressure Difference Regulation Process (MPa) | Depressurization Gradient (MPa) | Constant Pressure Duration (Day) |
|---|---|---|---|
| Case 01-DD-Ref | 6.0 | None | None |
| Case 02-SD1-20d | 3.0→3.5→4.0→4.5→5.0→5.5→6.0 | 0.5 | 20 |
| Case 03-SD1-10d | 3.0→3.5→4.0→4.5→5.0→5.5→6.0 | 0.5 | 10 |
| Case 04-SD1-05d | 3.0→3.5→4.0→4.5→5.0→5.5→6.0 | 0.5 | 5 |
| Case 05-SD2-20d | 3.0→4.0→5.0→6.0 | 1.0 | 20 |
| Case 06-SD2-10d | 3.0→4.0→5.0→6.0 | 1.0 | 10 |
| Case 07-SD2-05d | 3.0→4.0→5.0→6.0 | 1.0 | 5 |
| Case 08-SD3-20d | 3.0→4.5→6.0 | 1.5 | 20 |
| Case 09-SD3-10d | 3.0→4.5→6.0 | 1.5 | 10 |
| Case 10-SD3-05d | 3.0→4.5→6.0 | 1.5 | 5 |
| Layer | Parameter | Value and Unit |
|---|---|---|
| OB [55,56,57,58,59] | Thickness | 30 m |
| Porosity | 0.30 | |
| Initial permeability | 2.0 mD | |
| GHBL [10,56,57,58,59] | Thickness | 35 m |
| Porosity | 0.35 | |
| Initial permeability | 2.9 mD | |
| Initial hydrate saturation | Extracted from logging curve | |
| TPL [10,56,57,58,59] | Thickness | 15 m |
| Porosity | 0.33 | |
| Initial permeability | 1.5 mD | |
| Initial hydrate saturation | Extracted from logging curve | |
| FGL [10,56,57,58,59] | Thickness | 27 m |
| Porosity | 0.32 | |
| Initial permeability | 7.4 mD | |
| Initial free gas saturation | Extracted from logging curve | |
| UB [55,56,57,58,59] | Thickness | 30 m |
| Porosity | 0.30 | |
| Initial permeability | 2.0 mD |
| Parameter | Value and Unit |
|---|---|
| Wellbore radius [56,57,58,59] | 0.1 m |
| Salinity [56,57,58,59] | 3.5% |
| Grain density [56,57,58,59] | 2600 kg/m3 |
| Geothermal gradient [56,57,58,59] | 43.653 °C/km |
| Gas composition [56,57,58,59] | 100% CH4 |
| Grain specific heat [56,57,58,59] | 1000 J·kg−1·K−1 |
| Dry thermal conductivity [56,57,58,59] | 1.0 W·m−1·K−1 |
| Wet thermal conductivity [56,57,58,59] | 3.1 W·m−1·K−1 |
| Capillary pressure model [56,57,58,59] | , |
| SmxA (maximum water saturation) | 1 |
| λ (porosity distribution index) | 0.45 |
| P0 (initial capillary pressure) | 104 Pa |
| Relative permeability model [56,57,58,59] | KrA = [(SA − SirA)/(1 − SirA)]nA, KrG = [(SG − SirG)/(1 − SirA)]nG |
| nA (aqueous phase permeability reduction index) | 3.5 |
| nG (gas phase permeability reduction index) | 2.5 |
| SirG (residual gas saturation) | 0.03 |
Disclaimer/Publisher’s Note: The statements, opinions and data contained in all publications are solely those of the individual author(s) and contributor(s) and not of MDPI and/or the editor(s). MDPI and/or the editor(s) disclaim responsibility for any injury to people or property resulting from any ideas, methods, instructions or products referred to in the content. |
© 2024 by the authors. Licensee MDPI, Basel, Switzerland. This article is an open access article distributed under the terms and conditions of the Creative Commons Attribution (CC BY) license (https://creativecommons.org/licenses/by/4.0/).
Share and Cite
Wan, T.; Li, Z.; Lu, H.; Wen, M.; Chen, Z.; Tian, L.; Li, Q.; Qu, J.; Wang, J. Numerical Simulation of Gas Production Behavior Using Stepwise Depressurization with a Vertical Well in the Shenhu Sea Area Hydrate Reservoir of the South China Sea. J. Mar. Sci. Eng. 2024, 12, 1169. https://doi.org/10.3390/jmse12071169
Wan T, Li Z, Lu H, Wen M, Chen Z, Tian L, Li Q, Qu J, Wang J. Numerical Simulation of Gas Production Behavior Using Stepwise Depressurization with a Vertical Well in the Shenhu Sea Area Hydrate Reservoir of the South China Sea. Journal of Marine Science and Engineering. 2024; 12(7):1169. https://doi.org/10.3390/jmse12071169
Chicago/Turabian StyleWan, Tinghui, Zhanzhao Li, Hongfeng Lu, Mingming Wen, Zongheng Chen, Lieyu Tian, Qi Li, Jia Qu, and Jingli Wang. 2024. "Numerical Simulation of Gas Production Behavior Using Stepwise Depressurization with a Vertical Well in the Shenhu Sea Area Hydrate Reservoir of the South China Sea" Journal of Marine Science and Engineering 12, no. 7: 1169. https://doi.org/10.3390/jmse12071169
APA StyleWan, T., Li, Z., Lu, H., Wen, M., Chen, Z., Tian, L., Li, Q., Qu, J., & Wang, J. (2024). Numerical Simulation of Gas Production Behavior Using Stepwise Depressurization with a Vertical Well in the Shenhu Sea Area Hydrate Reservoir of the South China Sea. Journal of Marine Science and Engineering, 12(7), 1169. https://doi.org/10.3390/jmse12071169