Abstract
The Bohai Rim region constitutes the third prominent “growth pole” in China’s economic landscape, wherein the Bohai Rim multi-port system, encompassing Tianjin Port, Dalian Port, and Qingdao Port, engages in intense competition to establish itself as the foremost shipping hub in northern China. This study compares the ternary diagram method and employs the comprehensive concentration index (CCI), Lerner index (LI), and spatial shift-share analysis (SSSA) methods to delve into the intricacies of concentration, inequality, and evolving competitive dynamics within the Bohai Rim multi-port system over the four decades spanning from 1981 to 2023. The aim is to analyze the evolutionary trajectory and underlying dynamic mechanisms of this multipartite port system. The analysis delineates the development trajectory of the system into three stages: the dominant stage of Tianjin Port from 1981 to 1990, the efficiency competition stage from 1991 to 1996, and the ascendancy of Qingdao Port from 1997 to 2023. The results indicate that: (i) the Bohai Rim multi-port system exhibits a relatively low level of concentration, ensuring balanced growth within a non-monopolistic competitive environment; (ii) the internal competitiveness of the Bohai Rim multi-port system has gradually shifted from Tianjin Port to Qingdao Port, with Dalian Port experiencing steady development in its container transport capabilities. (iii) Dalian Port has witnessed a decline in container throughput since 2015, indicating a weakening competitive posture. These revelations suggest that Qingdao Port is a viable candidate for development into the northern China shipping center, leveraging its increasing competitiveness and strategic location. The method applied in this study may also prove beneficial for similar multi-port systems elsewhere.
1. Introduction
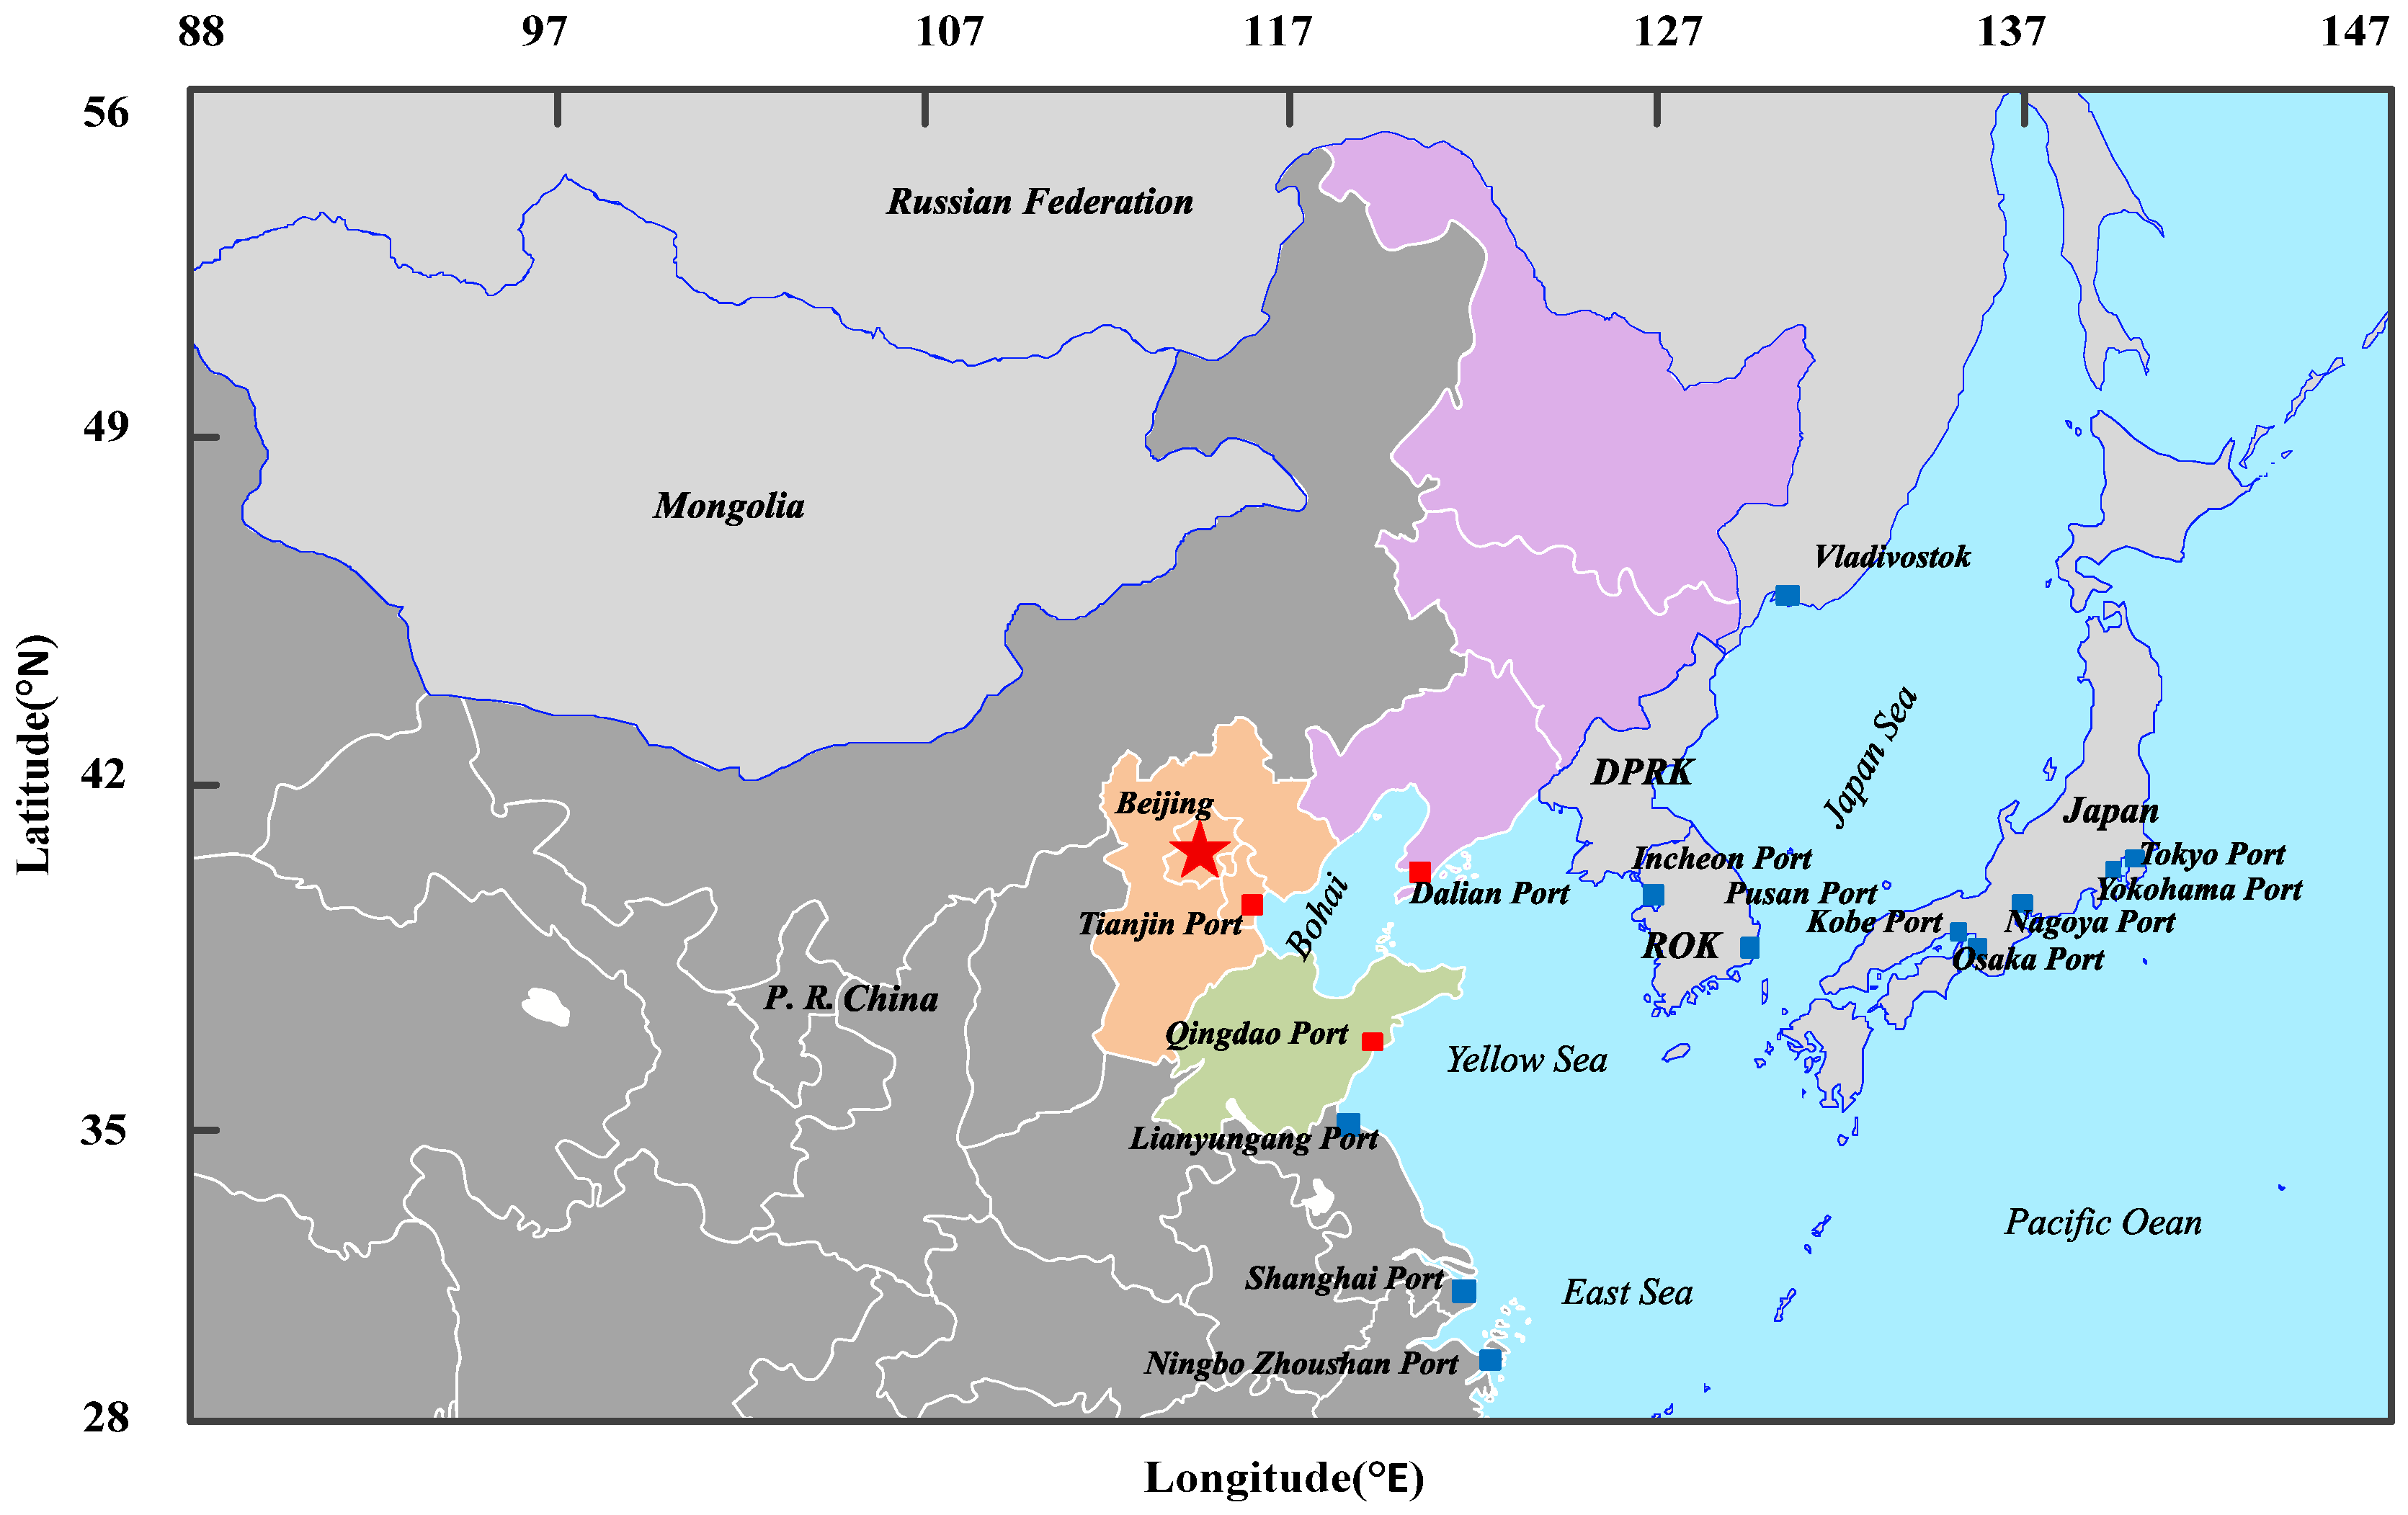
Located in northern China, the Bohai Rim port group serves as the principal cargo seaport in the region. Geographically, the Bohai Rim area finds itself situated at the core of the Northeast Asian economic circle, functioning as a pivotal node that radiates outwards to diverse economic regions and countries, thereby exhibiting exceptional regional advantages [1]. From the perspective of composition, the Bohai Rim area comprises three sub-economic zones: Beijing–Tianjin–Hebei, the Liaodong Peninsula, and the Shandong Peninsula (see Figure 1). This composite economic zone accounts for approximately 35.4% of China’s GDP and ranks third in China’s GDP from 2019 to 2022 [2,3]. As the regional economy continues to thrive, the Bohai Rim multi-port system has witnessed substantial growth in container throughput.

Figure 1.
Location of the Bohai Rim multi-port system and map of gateway ports in Northeast Asia.
In 2023, China’s coastal cargo throughput reached 108.35 billion tons, with Bohai accounting for 43.02%. The national container throughput stood at 310 million TEU, with the container throughput of the Bohai Rim multi-port system accounting for 27.4% (Sourced from: https://xxgk.mot.gov.cn/2020/jigou/zhghs/202406/t20240614_4142419.html, accessed on 15 May 2024). However, a comparative analysis reveals that the development of this system lags behind its counterparts in the Yangtze River Delta and Pearl River Delta, which accounted for 38.3% and 28.3% of the national container throughput in 2023, respectively. The intensifying competition posed by international ports such as Pusan, Kobe, and Yokohama poses a significant threat, potentially relegating the ports within the Bohai Rim multi-port system to the role of feeder ports for foreign entities [4]. Concurrently, Tianjin Port, Dalian Port, and Qingdao Port in the Bohai Rim multi-port system are competing for the shipping market, resulting in disorderly competition and resource wastage. Therefore, it is necessary to devise forthcoming development strategies to alter this situation, achieve regional port integration, and promote sustainable regional economic development.
Nearly 75% of the container throughput in the Bohai Rim multi-port group is managed by the top three ports. Given the critical role these three ports play in driving economic growth in northern China, it is paramount to study the evolution of the status of Tianjin Port, Dalian Port, and Qingdao Port in the Bohai Rim multi-port system. The formation and evolution of the port system have been a research focus for scholars since the 1960s, leading to the development of numerous classical models to systematically study the evolution of the port system [5,6,7,8,9]. By 2021, Chinese ports had secured seven positions among the world’s top ten container ports; the evolutionary progress of these ports has garnered increasing scholarly attention. Some research [10,11,12] has considered the development process of the Pearl River Delta and Hong Kong Port, respectively. Some scholars [13,14] have analyzed the evolution of the status of Shanghai Port and Ningbo Port in the Yangtze River Delta multi-port system, respectively. Due to the escalating influence of ports on local economies, local governments have pursued aggressive port expansion initiatives. However, in the context of a sluggish global economy and saturated port resources, this focus has led to increasingly fierce disorderly competition among regional ports [15]. Therefore, great attention needs to be paid to sustainable regional port governance [16].
Establishing a shipping center, designating a hub port, and reducing disorderly competition constitute a strategic approach to regional port governance. For instance, taking the Shanghai International Shipping Centre as an example, Wang, J.J., Slack, B. [17] researched China’s port governance and believed that establishing a shipping center, hub ports, and branch ports could mitigate disorderly competition among ports with similar functions and enhance the overall competitiveness of the port system; Huang, Y. [18] discussed how developing an international shipping center in Shanghai can stimulate the hinterland economy and improve the global shipping network. Obviously, a port selected from Tianjin Port, Dalian Port, and Qingdao Port as the major container port and a northern China shipping center can reduce disorderly competition among the three major ports with similar port attributes and geographical locations, improving the competitiveness of the Bohai Rim multi-port system. The critical question remains: which port should be developed as the northern shipping center?
Following the introduction, Section 2 introduces an overview of multi-port systems. Section 3 introduces the data used and the methods of the ternary diagram. Section 4 reports the results, followed by a discussion of the different stages of development and their underlying reasons. Section 5 summarizes the role evolution process of Tianjin Port, Dalian Port, and Qingdao Port in the Bohai Rim multi-port system and analyzes the final winner of the northern China shipping center contest.
2. Literature Review
Studying the evolution of multi-port systems can provide policymakers and managers with references and help them comprehensively understand the development and evolution of port systems [19]. Numerous scholars have studied the evolution of port systems in different countries and regions, such as Latin America and the Caribbean [20,21], Maghreb [22], Mediterranean [23], Korea [24], Mexico [25], etc. Despite the extensive body of research on port evolution, the topic of evolution remains significant due to geographical location and port background limitations.
The study of port evolution focuses on the interaction and competition among multiple ports. Dynamic analysis is used to study the stability of the intersection of competition and collaboration [26]. The extensive growth model of reform and opening up has led to structural overcapacity and slow development in China’s port industry; coupled with the impact of the global shipping market, the Chinese government has sparked a wave of port integration [27]. The Chinese Ministry of Transport issued the “Guiding Opinions on Promoting Port Transformation and Upgrading” in 2014, supporting the integration of resources and achieving regional port integration.
The determining factors of port competitiveness include operating costs, processing efficiency, geographical location, transportation convenience, infrastructure level, service quality, and port reputation [28]. The competitiveness of ports is complex and highly nonlinear, often resulting in unstable or even chaotic outcomes [29]. Cuong, T. N., Kim, H. S., Long, L. N. B., and You, S. S. [30] analyzed the basic mechanism of port economic activities from the perspective of the transportation chain and found that an overall port management system can reduce operating costs and improve profitability, thereby enhancing competitiveness. Good transportation accessibility in ports is accompanied by higher competitiveness [31].
The evolution of the multi-port system also focuses on the study of concentration. Grifoll, M., Ortego, M. I., and Egozcue, J. J. [32] studied the transportation share evolution of container throughput and its temporal evolution in the Mediterranean port system, taking into account the hierarchical clustering and concentration index. The concentration of container ports on the east and west coasts of the United States was studied through concentration indexes (CR4, CR8), the Herfindahl-Hirschman index (HHI), the Gini coefficient, and the Lorentz curve, as well as through a shift-share analysis (SSA) [33]. The HHI, CR1 and CR3, Gini coefficient, Lorentz curve, and SSA methods were used to study the development trends of container terminals in northern Vietnam [34].
China also conducted a series of studies on the evolution of ports. The evolution of multi-port systems in the Yangtze River Delta has emerged as a research hotspot [35,36,37]. Studies have analyzed the competitiveness of Shanghai Port and Ningbo Zhoushan Port within the Yangtze River Delta port group [38]. Correspondingly, the top three ranked container ports in the Greater Bay Area have formed a tripartite and vicious competition among Hong Kong, Shenzhen, and Guangzhou [39]. The CR, HHI, Gini coefficient, Lorentz curve, and SSA were used to explore the concentration level of the Bohai Rim port group [40]. The multiple logit regression method was applied to analyze the dynamics and interrelationships of cluster competition among ports in Dalian, Qingdao, and Tianjin [41]. Improving the transportation accessibility of the Bohai port group has a positive effect on the spatiotemporal changes and economic connectivity among the eight ports within the group [42].
This literature review highlights a substantial body of well-established research pertaining to the evolutionary model of port systems. Research efforts directed towards the Chinese port system have been primarily concentrated on the Yangtze River Delta and the Pearl River Delta regions, with the port system encircling the Bohai Rim area receiving comparatively scant attention. Previous studies have shown that research on the Bohai Rim port group has focused on studying a specific port, such as Dalian, Qingdao, or Tianjin Port. Few scholars have analyzed the development of individual ports from the perspective of the whole port group. The geographical locations and port backgrounds of these ports are similar and share an overlapping hinterland. Both local competition and common development among the three ports compete against other port groups. These features have sparked our interest in the evolution of the Bohai Rim port group.
The present study delves into the intricate dynamics of competition and cooperation among Tianjin Port, Dalian Port, and Qingdao Port, meticulously examining aspects such as concentration, inequality, and competition through the utilization of the comprehensive concentration index (CCI), the Lerner index (LI), spatial shift-share analysis (SSSA), and the ternary diagram. This study provides a comprehensive overview of the evolutionary process of the Bohai Rim multi-port system and studies the evolution of the northern China shipping center on this basis. The contributions are as follows: Firstly, we studied the evolution of the multi-port system in the Bohai Sea Rim port group from multiple perspectives and discussed the results. Secondly, we compared and analyzed the concentration, inequality, and competitiveness of three well-known indicators and used the ternary diagram to verify the accuracy of the results. Thirdly, our research provides a basis for selecting a northern shipping center.
3. Materials and Methods
3.1. Data
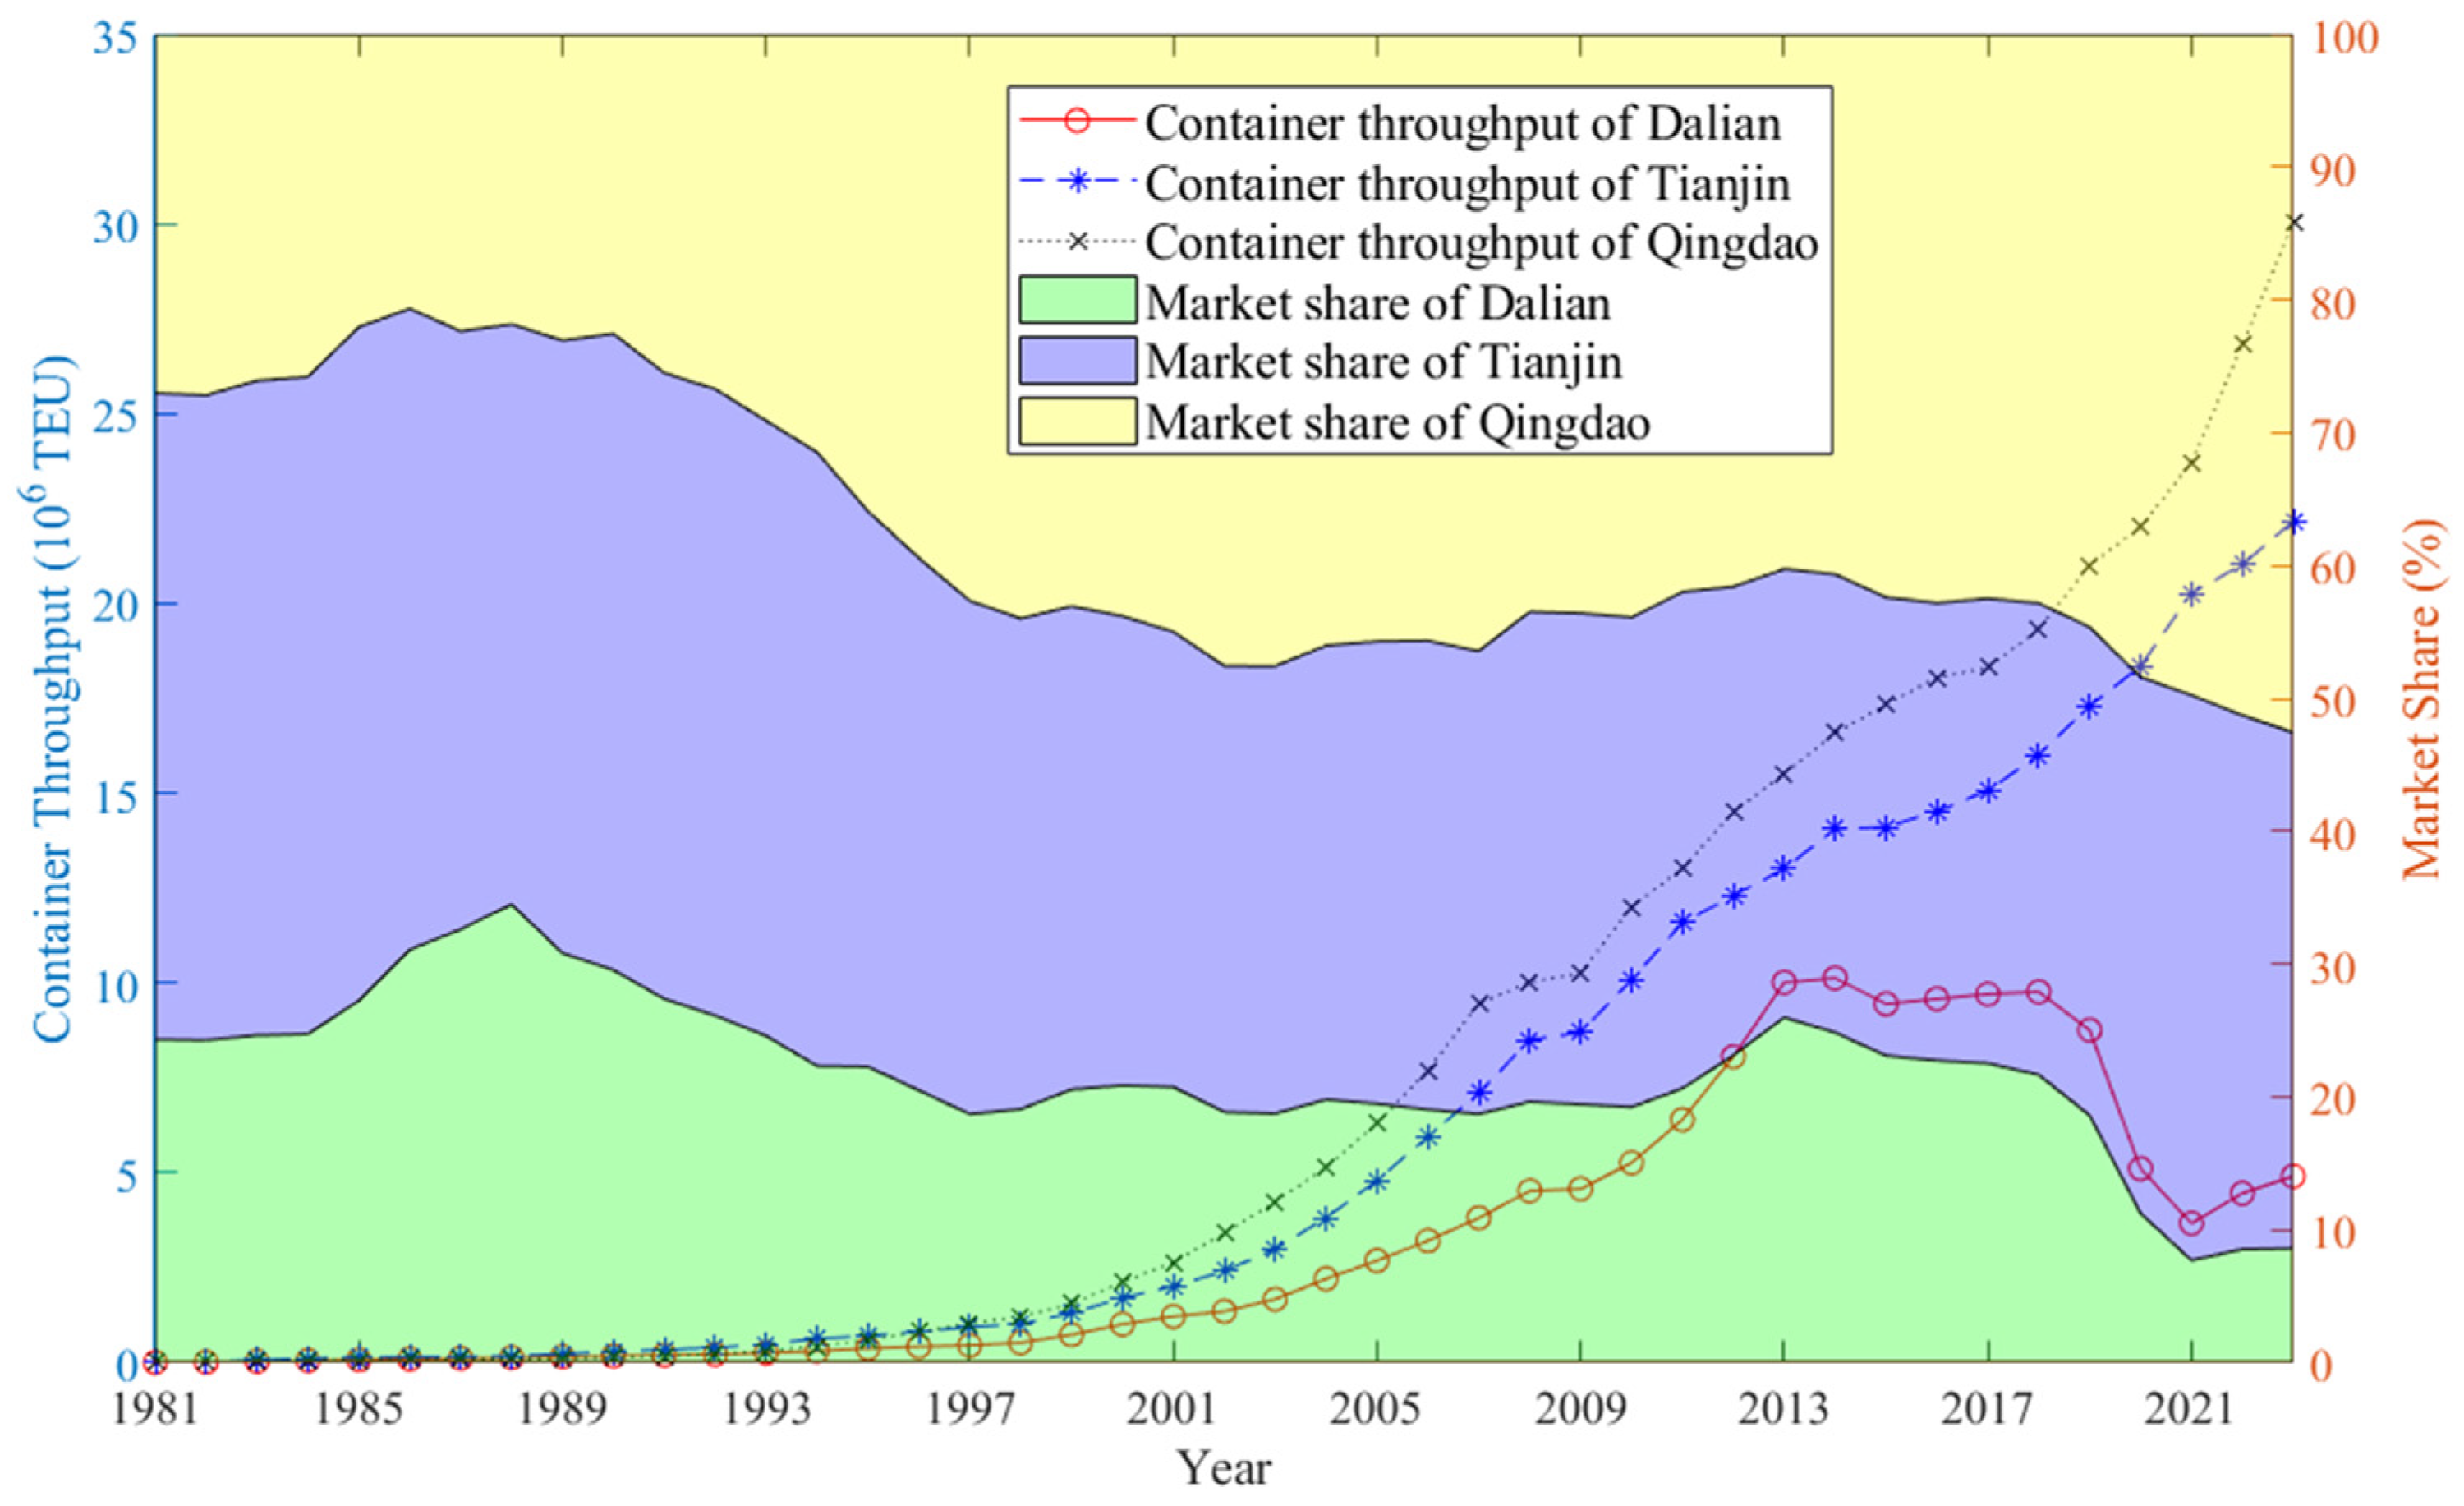
The data used in this paper (see Figure 2), the container throughput for 1990–2018, was mainly obtained from the China Port Yearbook; that of 2019–2023 was obtained from public information on the website of the Chinese Ministry of Transport. The authors compile data for 1981–1989 from various sources. Figure 2 shows the traffic evolution of the Bohai Rim ports during the period of 1981–2023. We find that the container throughput of Qingdao Port and Tianjin Port represents sustainable growth. The market share of Qingdao Port began to surpass that of Tianjin in 1997, while the decline of Dalian Port is obvious. Container throughput has not exceeded 10 million TEU since the first negative growth in 2015.
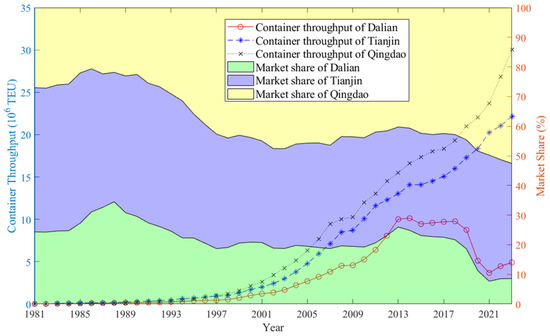
Figure 2.
Container throughput and traffic share of Dalian Port, Tianjin Port, and Qingdao Port from 1981 to 2023.
3.2. Methods
Figure 3 illustrates the basic framework of the method employed in this study, and the conclusions are drawn through a comparative analysis of the three indicators and three well-known indexes in the ternary chart.
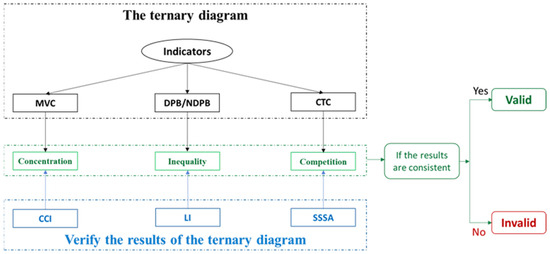
Figure 3.
Framework and workflow for the method that compares the ternary diagram with three widely used indexes.
3.2.1. Comprehensive Concentration Index (CCI)
The CCI was first presented by Horvarth [43] in 1970. It is an indicator that represents the market share of the highest ranked port in the port group, and the market share of the top port is directly proportional to CCI. CCI is specifically represented as:
The number of ports is expressed as i to n. is the port traffic of port i, and is the port traffic of the port with the highest container throughput. When the value of CCI approaches 1, the port with the largest container throughput is at an absolute advantage in a multiple port system. When it is less than 0.5, the critical role of the port decreases as the CCI value decreases. CCI can visually present the market share of ports with high market share but cannot objectively reflect all market forms in a multi-port system.
3.2.2. Lerner Index (LI)
The Lerner index (LI) reflects the discretion and inequality of the multi-port system, which varies between 0 and 1, and the value of LI is inversely proportional to the dispersion of the market. If n ports are of the same scale, n approaches infinity, and LI tends to 0.
where P is the container throughput, MC is the marginal cost, ε is the L price demand elasticity.
The LI can reflect the strength of monopolistic forces in a multi-port system, but it relies heavily on historical data and cannot predict future changes. A larger value of “L” indicates greater competitiveness among ports, a lower likelihood of price markups, and marginal profits for ports, reflecting a lower degree of monopoly. To determine the price elasticity of demand for container transportation demand, the indicators “container throughput (T)” and “market share (a)” are selected to replace the basic variables of demand and price variables in container transportation. The logarithmic model is used to empirically analyze the relationship between the throughput and interval proportion as follows:
By differentiating Formula (3), the following formula can be obtained:
The regression coefficient is the demand price elasticity ε of the container throughput in the i port.
3.2.3. Spatial Shift-Share Analysis (SSSA)
Notteboom, T. E. [44] employed SSA to assess the multiple port system, and the definitions for variables S and A are elucidated as follows:
where is the total shift of port j from time to , and m refers to the number of ports.
SSA compares and classifies ports, determines the overall structure and competitiveness of the region, and identifies competitive ports. The analysis is based on the assumption that all ports in the region will grow at the same proportion. If the actual growth of ports deviates from the assumption, it will result in significant errors.
SSA has traditionally focused on studying changes in a specific region over time. However, the significance of spatial structures and the geographical location of a given region as influential factors are often ignored in the analysis. However, there is a discernible correlation between regions within the same geographical area. Isard, W. [45] emphasized the importance of examining a particular region in the context of its neighboring regions, as changes in neighboring regions can impact the dynamics of the target region. In fact, no target area operates independently of other regions, and the economic performance of a specific region can be significantly influenced by the economic environment of the surrounding areas. By incorporating spatial geographic location and using regional GDP as an indicator of geographic economics, an extended spatial shift-share analysis (SSSA) is presented as follows:
where represents the geographical weight indicator of port j, is the geographical shift of port j from time to , and m refers to the number of ports.
3.2.4. Basic Framework of the Ternary Diagram
A ternary diagram is a visualization tool. Feng et al. [46] first introduced the ternary diagram into the field of port and shipping research. Its basic frame consists of points and lines. Each point in the ternary graph is composed of three components: A, B, and C (see Figure 4). A, B and C represent the market share of three major ports in the multi-port system, with the three ports accounting for the share of the market 100%. For easier analysis, let A + B + C = 1.
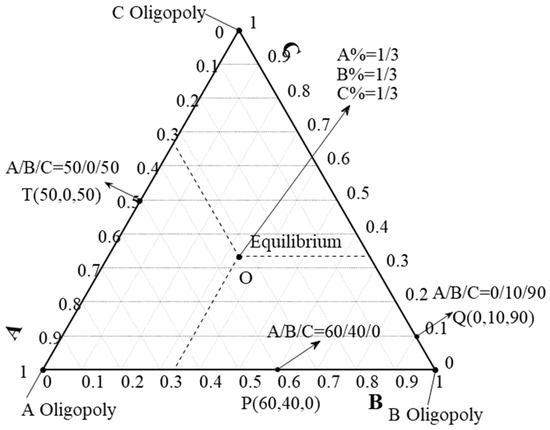
Figure 4.
Definition of corners, sides, and the barycenter.
The points in a ternary diagram that are located at angles, sides, and barycenters have special meanings. The coordinates of the three corners in the ternary diagram are (0, 0, 1), (1, 0, 0), and (0, 1, 0), which means that the point is composed of only one component, that is, the market of the multi-port system is completely monopolized by port A, port B, or port C (see Figure 4).
The point on the side of the ternary diagram means that the point is composed of two components, that is, the market share of the port group is composed of two ports. For instance, when the point is on the side of AB, the market share of the port group only consists of ports A and B.
When the point O is at the center of the barycenter, the coordinate is (1/3, 1/3, 1/3), which means that the market share of the multi-port system is equally divided among the three ports; that is, there is absolute balance and maximum competition in the multi-port system.
3.3. Ternary Diagram
The evolution index of the multi-port system was proposed by researchers [46,47,48], that is, the concentration calculated by the CCI and the maximum value of the component (MVC), the inequality computed using the LI and distance of a point to the barycenter (DPB), and the SSSA adding the change of the three components (CTC) are proposed to describe the competition of the multi-port system.
The MVC calculation formula is:
where A, B, and C are the market shares of ports A, B, and C, respectively. When the value of Port A exceeds 0.5, it means that the port has the largest market share, exceeding 50%. Therefore, the market is expected to be dominated by Port A. When the market share of each port is less than 50%, it is in the “Efficiency Competition” area, which means that no port can absolutely dominate the market [46].
The DPB calculation formula is:
where A, B, and C are the market shares of the three ports, respectively. The normalized DPB (NDPB) is introduced more intuitively to see the change in the inequality of the multi-port system. The NDPB is calculated according to the following formula:
The value range of the NDPB is [0, 1]. When the NDPB is greater than 0.5, it means that the inequality of the multi-port system is high; otherwise, it is low [47].
The CTC calculation formula is:
where ΔA1, ΔB, and ΔC reflect the change of market shares of port A, port B, and port C, respectively. ΔA, ΔB, and ΔC are obtained by the following formula [48]:
where t is the time; At, Bt, and Ct are the market shares of ports A, B, and C at time t, respectively; and At+1, Bt+1, and Ct+1 are the market shares of ports A, B, and C at time t + 1, respectively.
4. Results
This section presents the analysis results of the ternary graph indicators, namely MVC, DPB, and CTC, as well as three methods including CCI, LI, and SSSA. The effectiveness of the method is verified by comparing MVC and CCI, DPB and LI, and CTC and SSSA.
4.1. MVC and CCI
As shown in Figure 2, from 1981 to 1996, the container throughput of Tianjin Port was the largest in the Bohai Rim multi-port system; the container throughput of Qingdao Port surpassed that of Tianjin Port in 1997, making Qingdao Port the port with the largest container market share among the Bohai Rim multi-port system. Figure 5 (right) shows that the MVCs from 1981 to 1990 fell in line with or were close to the “Tianjin Port Dominating” area; since 1991, Qingdao Port’s share of the container market has steadily increased year after year. In 1991–1996, the value of MVCs was in the “Efficiency Competition” area. Therefore, this study divides the evolution stage of the Bohai Rim multi-port system into “the stage of Tianjin’s leading (1981–1990)”, “the stage of efficiency competition (1991–1996)”, and “the stage of Qingdao’s rising (1997–2023)”.
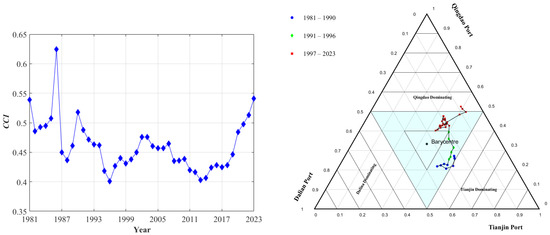
Figure 5.
CCI (left) and MVC (right) of the Bohai Rim multi-port system during 1981–2023.
Figure 5(left) shows that the CCI of the Bohai Rim terminal system has steadily declined from 0.486 to 0.401 between 1981 and 1996, indicating that the market moved from having an absolute advantage in ports to a loss in core key ports. After a period of stable increase from 1996 to 2003, the CCI gradually declined from below 0.403. Since 2013, the CCI value has been rapidly approaching the value of 0.544 in 2023, indicating that the development trend of a certain port that is on the verge of having an absolute advantage is becoming more and more obvious.
Figure 5(right) plots the evolutionary pathways of container throughput in Dalian, Tianjin, and Qingdao from 1981 to 2023. From 1981 to 1990, the values of MVCs slowly decreased from 0.49 to 0.46. During 1991–1996, the MVCs declined rapidly from 0.48 to 0.40. Since 1997, the MVCs have been slowly increasing from 0.43 to 0.52 in 2023.
As shown, the values of MVCs were close to or equal to 0.5 in 1981–1983, indicating that Tianjin Port was in a dominant position during this period. The MVCs began to slowly decline in 1984 to 0.46 in 1990, indicating that although Tianjin Port is no longer in the leading position, its market share is still the largest. During the years 1991 to 1996, the MVCs were always below 0.5, meaning that the competition of the Bohai Rim multi-port system was in the “Efficiency Competition” area during this period. Figure 2 shows that in 1997, the container throughput of Qingdao Port surpassed that of Tianjin Port for the first time. Since then, Tianjin Port has been lagging behind Qingdao Port. The MVCs have gradually increased since 1997 to 0.52 in 2023, meaning that Qingdao Port has become the new leading port of the Bohai Rim multi-port system. Comparing the two figures, it was found that the MVC in the ternary graph is consistent with the CCI.
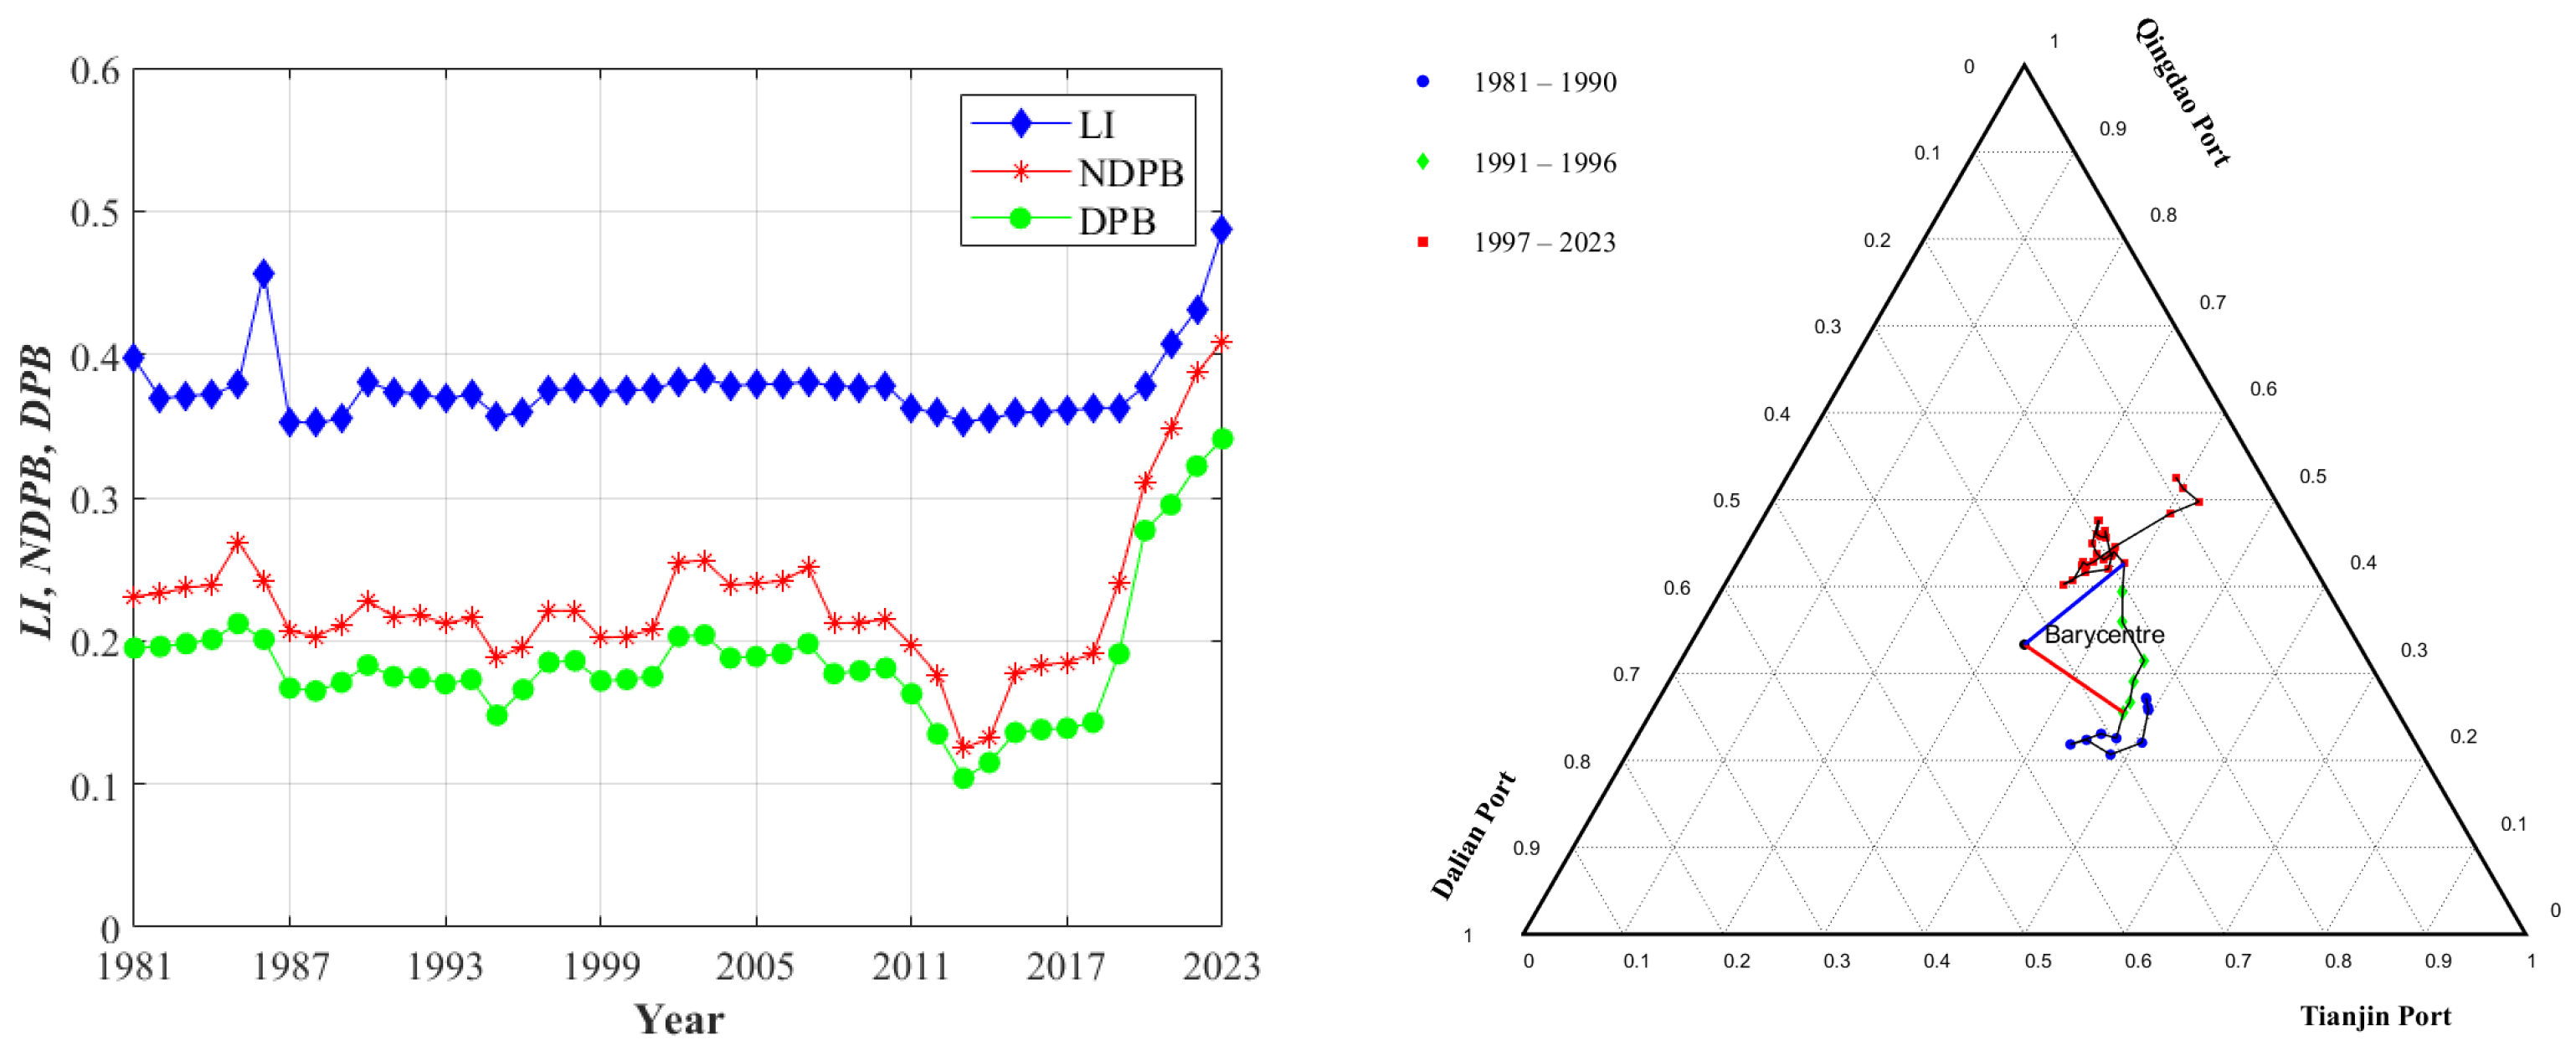
4.2. DPB Analysis
Figure 6 shows that the values of the NDPB were below 0.4 during the period of 1981–2023, and the change in values is relatively stable. This indicates that the Bohai Rim multi-port system was equal and stable during this period. The NDPB fluctuated by 0.23 between 1981 and 1996, with a small fluctuation range. From 1997 to 2023, the NDPB rose slowly from 0.22 to 0.41. From 1981 to 2023, the overall values of the NDPB showed an increasing trend, which means that the degree of decentralization in the Bohai Rim multi-port system was in a decreasing state, was stable in the initial stage, and gradually decreased in the latter stage.
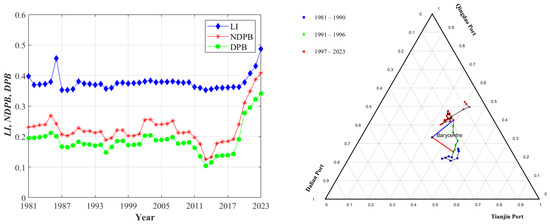
Figure 6.
The LI, DPB, and NDPB (left) and the value of the DPB and NDPB in the ternary diagram (right) of the Bohai Rim multi-port system, 1981–2023.
The continuous decline in LI from 1980 to 2023 is presented in Figure 6. The LI fluctuated slightly around 0.36 and began to grow rapidly in 2019, reaching a peak of 0.49 in 2023. The closer LI tends toward zero, the closer the market share of all ports is to equal. It was preliminarily inferred that there are significant inequalities in container throughput in the multi-port system around Bohai Bay and that one certain port is gradually evolving into a northern shipping center. In Figure 6, we can observe the visual consistency between the DPB and LI curves. In this case, the correlation coefficient between the NDPB and LI is 0.9946, indicating the validity of the verified hypothesis.
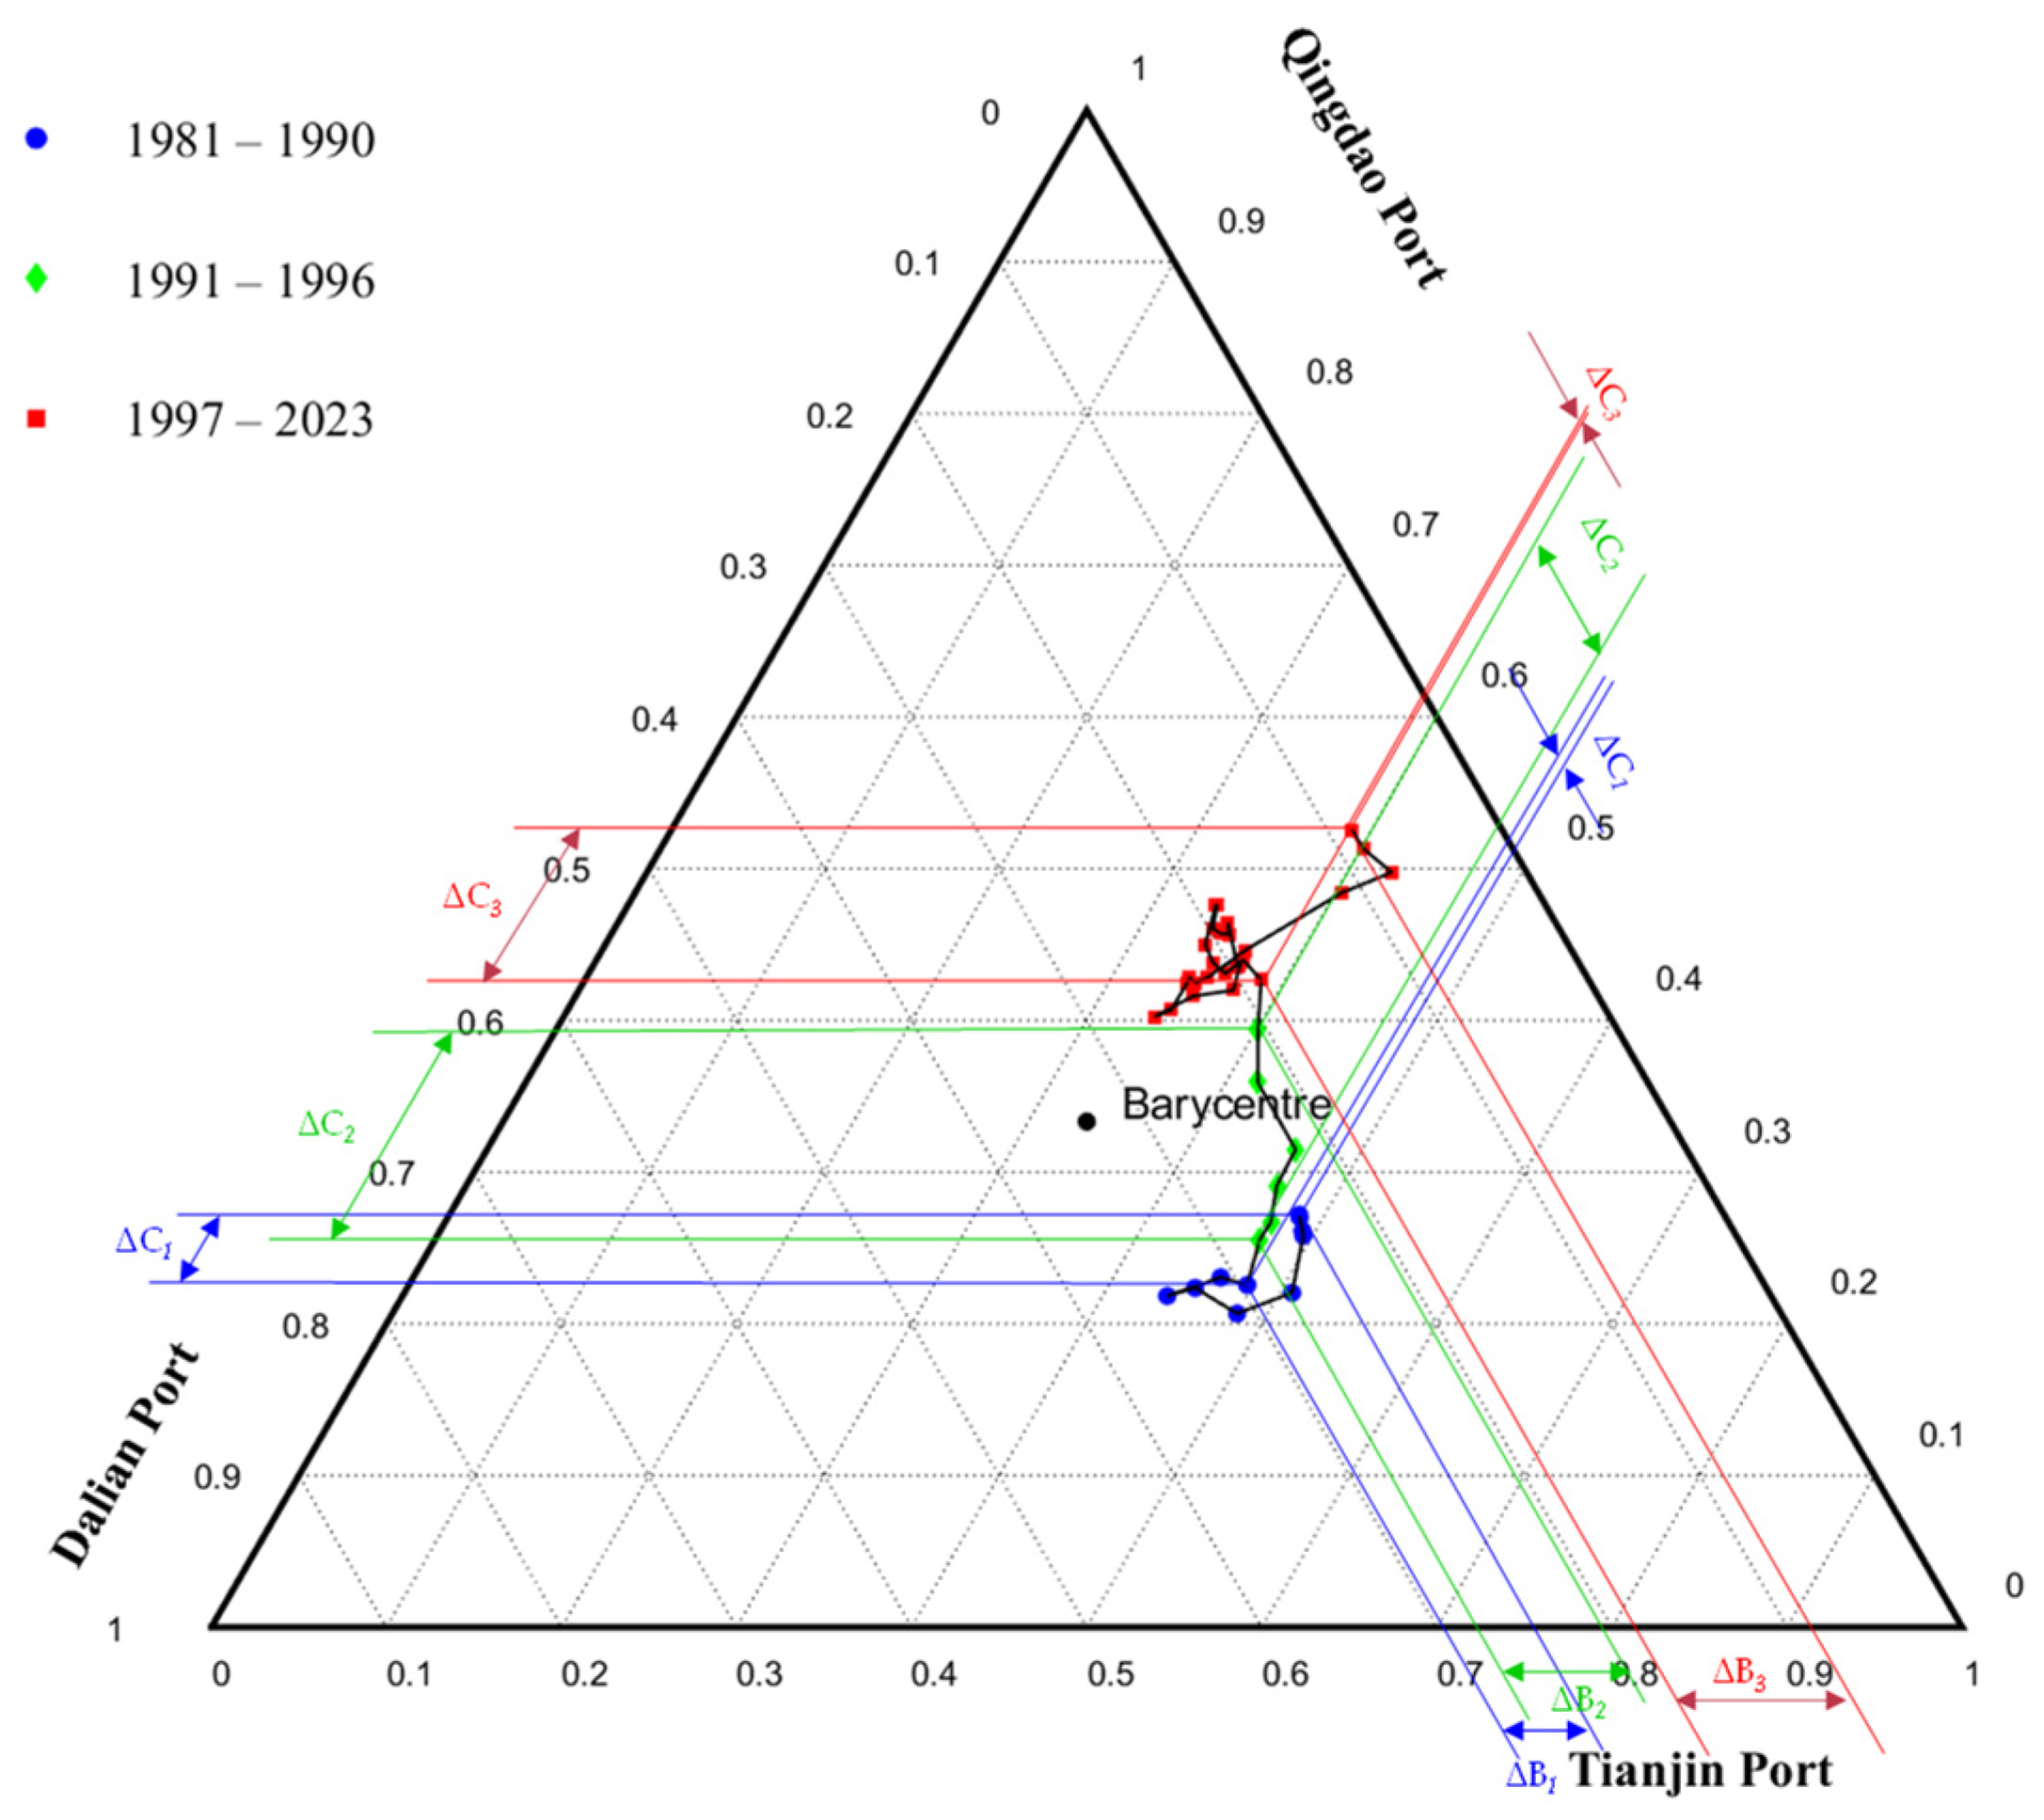
4.3. CTC Analysis
The above results have shown an evident evolution of the traffic composition in the Bohai Rim multi-port system. As exhibited in Section 3.1, although the change range of the MVCs is small, the MVCs of 1990 and 1997 in the Bohai Rim multi-port system were 0.46 and 0.43, respectively. The maximum market share was Tianjin Port and Qingdao Port in 1990 and 1997, which means that the leading ports of the Bohai Rim port group have changed. The years 1990 and 1997 can be regarded as two significant points in the ternary diagram (see Figure 5). Therefore, the evolution of the Bohai Rim multi-port system is divided into three stages: from 1981 to 1990, from 1991 to 1996, and from 1997 to 2023.
Figure 7 shows the values of CTC and Table 1 shows the value of SSSA during the periods 1981–1990, 1991–1996, and 1997–2023. According to the results of the CTC analysis, from 1981 to 1990, the market shares of Tianjin Port and Qingdao Port were −0.03 and −0.02, respectively, which were in a negative growth state, while the market shares of Dalian Port continued to grow positively and were 0.06. From 1991 to 1996, the shares of Dalian Port and Tianjin Port increased by −0.09 and −0.08, respectively, while the market share of Qingdao Port expanded by 0.17 during this period. From 1997 to 2023, the shares of Tianjin Port and Qingdao Port both grew positively by 0.05 and 0.09, respectively, while Dalian Port grew negatively. Obviously, Dalian Port was the biggest winner and Tianjin Port was the main loser from 1981 to 1990. After 1991, Qingdao Port was the main winner, while Dalian Port was the biggest loser.
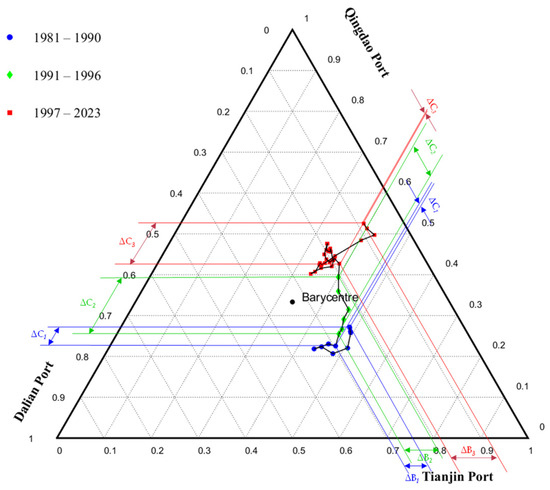
Figure 7.
CTC of the Bohai Rim multi-port system, 1981–2023.

Table 1.
CTC of the Bohai Rim multi-port system, 1981–2023.
As shown by SSSA, Dalian Port has lost the competitive advantage position that it enjoyed before 1990. Since 1991, it has been at the bottom of the competition with corresponding SSSA values of −0.0112 from 1991 to 1996 and −0.1492 from 1997 to 2023. On the contrary, Qingdao Port has strengthened its competitiveness and has been in the most competitive position since 1991, with values of 0.0002 and 0.0632, respectively. Tianjin Port has transitioned from its worst competitive state before 1990 to a strong competitive status after 1991, with values of −0.0086 and 0.0101.
5. Discussion
To analyze the evolution of the Bohai Rim multi-port system, we calculated the values of the MVC, DPB, and CTC of the Bohai Rim multi-port system during the period of 1981–2023 and found that its concentration, inequality, and competition had changed significantly.
5.1. Period I: The Dominant Stage of Tianjin Port (1981–1990)
In Figure 5, the data points from 1981 to 1985 almost fell on the side of the “Efficiency Competition” area close to the leading area of Tianjin Port, and the values of the MVCs and CCI were close to or equal to 0.5, which means that Tianjin Port was in the leading position of the Bohai Rim multi-port system during this period. The main reason for this is that the construction of the port is ahead of other ports in the Bohai Rim region. Tianjin Port is the first port engaged in container transport in mainland China [49]. Tianjin Port began unloading international containers in 1973, and in 1981, a professional container terminal in Tianjin Port was completed and put into operation, the first dedicated special container terminal designed and constructed by the mainland of China. In 1984, Tianjin Port took the lead in implementing the port system reform, and construction of a container terminal for the expressway began. Since 1986, the MVCs have gradually decreased to 0.47 in 1990, indicating that the competitiveness of Tianjin Port has gradually decreased, while the competitiveness of Dalian Port and Qingdao Port has gradually increased. The reason for breaking the stranglehold of Tianjin Port is that Qingdao Port and Dalian Port started container operations in 1980. After a period of development, they gradually divided the market with Tianjin Port in the Bohai Rim region.
The overall fluctuation of the NDPBs and LI decreased slightly, and the values were small, with the fluctuation range of the NDPB between 1981 and 1990 was 0.19 to 0.26, and the fluctuation range of LI was 0.36 to 0.38, indicating that the inequality of the Bohai Rim multi-port system was small during this period. On the whole, the development trend of the three ports was relatively equal.
In 1981–1990, the CTC of Tianjin Port, Dalian Port, and Qingdao Port were −0.03, 0.06, and −0.02, respectively. The container market shares of Tianjin Port and Qingdao Port showed negative growth, indicating that Dalian Port was the main winner in the competition of the Bohai Rim multi-port system during this period. The SSSA values including spatial factors were 0.07957, 0.0188, and 0.0215, showing growth. Considering that this period represented the rapid development stage of China’s reform and opening up, the economy in each region experienced explosive growth, resulting in positive SSSA values. Among them, the change in Dalian’s GDP had the largest share in the value of SSSA, while Tianjin Port had the smallest share.
Overall, during the specified period, the inequality within the Bohai Rim multi-port system remained minimal, with Tianjin Port maintaining a prominent position prior to 1986. Since 1986, while the competitiveness of Dalian Port and Qingdao Port has exhibited significant growth, Tianjin Port has consistently retained the largest share of the container market and has sustained the highest degree of competitiveness.
5.2. Period II: The Stage of Efficiency Competition (1991–1996)
As shown in Figure 5, the data points from 1991 to 1996 were in the “Efficiency Competition” area, and the MVCs declined rapidly from 0.47 in 1991 to 0.40 in 1996, along with the CCI value also decreasing from 0.48 to 0.4, indicating that the competition between the Bohai Rim multi-port system is intensifying. The three ports have all passed the construction period and have entered into a mature development phase, with competition entering a white-hot stage. The LI fluctuated slightly and was always maintained at 0.36. The NDPBs were stable at around 0.2 and fluctuated slightly, meaning that the degree of decentralization of the Bohai Rim multi-port system was high and stable during this period. In the period of 1991–1996, the CTCs of Tianjin Port, Qingdao Port, and Dalian Port were −0.08, 0.17, and −0.09, respectively, with corresponding SSSA values of −0.0112, −0.0086, and 0.0002, respectively. The results show that Qingdao Port is the main winner in the competition of the Bohai Rim multi-port system and that Qingdao Port has become the most competitive port in the Bohai Rim multi-port system. Despite the rapid development of container transport in Qingdao Port, the overall development of Tianjin Port, Dalian Port, and Qingdao Port in this period is still relatively balanced, and the Bohai Rim multi-port system is in the situation of a “Tripartite confrontation” of Tianjin Port, Dalian Port, and Qingdao Port.
During this period, Qingdao Port was in an advantageous position, which was closely related to its vigorous development. After 1991, the construction of the Qingdao Port Container Terminal began, and Qingdao Port opened the first international container shipping route—the direct trunk line of container transport to East America. In 1994, Qingdao had successively opened container routes to Japan and the West Coast of the United States. In 1995, the overseas container business operated by COSCO headquarters was relocated to Qingdao Port, making Qingdao Port the first international container transshipment port in mainland coastal ports [50]. Qingdao Port has developed from a domestic container feeder port to an international container trunk port and an international container transshipment port. At the same time, Qingdao Port accelerated scientific and technological innovation and opened the electronic data interchange (EDI) system for container transportation in 1996 to achieve the integration of container transportation information management with international standards.
Meanwhile, the construction of Dalian Port commenced more than a decade after Tianjin and Qingdao. Furthermore, although the economy maintained a stable development, the overall growth rate during this period was 3% lower than the national average, impeding the growth of foreign trade in Dalian Port and resulting in sluggish container throughput expansion [51].
5.3. Period III: The Rising Stage of Qingdao Port (1997–2023)
In Figure 5, the values of CCI and MVCs in the Bohai Rim multi-port system from 1997 to 2023 were in the “Efficiency Competition” area. The MVCs reached their maximum in 2020 and 2023, close to 0.5, and the same situation also occurred with CCI, which means that Qingdao Port experienced rapid container shipping development during this period, with the largest market share, and has occupied a leading position since 2020. The NDPBs were less than 0.5 from 1997 to 2023 (see Figure 6) and remained stable at 0.2 from 1997 to 2010. The fluctuation began to increase in 2011 and began to increase after dropping to a minimum of 0.12 in 2013, until approaching 0.41 in 2023. Consequently, from 1997 to 2013, the LI fluctuated around 0.36 and reached its lowest point of 0.34 in 2013, followed by a slight increase to 0.37 in 2019 and a significant increase to 0.41 and 0.49 in 2020 and 2023, respectively. This means that the degree of decentralization of the Bohai Rim multi-port system is relatively high. Due to the growth of Qingdao Port, the concentration of the Bohai Rim multi-port system will reach the maximum in 2023. From 1997 to 2023, the market shares of Tianjin Port, Dalian Port, and Qingdao Port were 0.05, −0.14, and 0.09 in CTC and −0.1492, 0.0101, and 0.0632 in SSSA, respectively, indicating that Qingdao Port was the most competitive port in the Bohai Rim multi-port system during this period and was the main winner, while Dalian Port was the biggest loser.
The container throughput of Tianjin Port has grown at an average annual growth rate of 13.7% since 1997, although the growth rate was slightly slower compared with the 14% of Qingdao Port. The main reason is that the handling capacity of the container terminal is seriously insufficient. In this context, Tianjin Port has increased its investments in port construction. In 2010, Tianjin Port achieved a container throughput of 10.086 million TEU, exceeding the 10 million TEU mark for the first time, making it one of the largest container ports in the world. At the same time, the berth utilization rate reached 84.8%, which shows that the container terminal supply in Tianjin Port is basically consistent with the import and export demand. After 2010, the negative effects of the CNY 4 trillion stimulus package completely emerged [52]. Tianjin’s GDP growth rate from 2012 to 2015 was 11.3%, 10.1%, 7.5%, and 6.9%, respectively. The economic slowdown led to a decline in the import and export volumes. Correspondingly, the growth rate of container throughput at Tianjin Port decreased to 6.1%, 5.8%, 8.1%, and 0.4%, respectively. The period of rapid development of Tianjin Port came to an end. In 2023, the container throughput of Tianjin Port will reach 22.19 million TEU. The average annual growth rate during this period was 5.5%, and the containers in Tianjin Port entered a period of moderate growth.
Since 1997, Qingdao Port has successively opened scheduled international express boutique routes with fully refrigerated containers, exceeding 1 million TEU for the first time and having an annual growth rate of 28%. At the end of 2002, 18 new routes were added with the opening of the Huangdao Port area of Qingdao Port. The economic hinterland of Qingdao Port continued to expand, and the number of containers rapidly increased. By the end of 2010, the container throughput of Qingdao Port had reached 12.01 million TEU. This period represents the period of rapid development in Qingdao Port, with an average annual growth rate of 20.7%. In 2019, China (Shandong) Pilot Free Trade Zone Qingdao was launched, promoting the development of container transportation in Qingdao Port by simplifying the transport process and reducing costs [2]. The Pilot Free Trade Zone delivered rapid growth in 2020 and 2023, causing Qingdao Port to now become the real shipping center of Northeast Asia. During this period, the average annual growth rate of Qingdao Port was 11.9%, and the containers in Qingdao Port entered a stage of moderate growth.
Due to the Asian financial crisis, the GDP growth rate of Dalian Port dropped to 10.1% in 1997, which led to the container throughput of Dalian Port being 453,000 TEU with an annual growth rate of 7.6%, a new historical low point. The government implemented a series of measures to quickly restore the economy. With the commissioning of the new container berths in 1999 and 2000, the annual handling capacity of Dalian Port has a growth rate of 37.2%, exceeding the growth rate of 31.2% of Tianjin Port and almost equal to the growth rate of 37.5% of Qingdao Port. In 2007, the Dayaowan Bonded Port area of Dalian Port was officially put into operation. At the end of 2010, the container throughput of Dalian Port was 5.262 million TEU. This period represents the stage of rapid development of Dalian Port, with an average annual growth rate of 20.8%. Since 2011, the GDP growth of the three northeastern provinces of China has declined. In 2015, the GDP growth of Heilongjiang Province, Jilin Province, and Liaoning Province had dropped to 5.7%, 6.5%, and 3.0%, respectively, which is 6.5, 7.2 and 9.1 percentage points lower than that of 2011. As the direct hinterland of Dalian Port, the GDP growth rate fell to 5.5% and 4.1% in 2014 and 2015, respectively. The economic downturn led to a reduction in the import and export of container goods. In 2015, Dalian Port completed a container throughput of 9.583 million TEU, with a growth rate of −1.4%, showing negative growth for the first time. At the same time, the rapid development of Yingkou Port also brings pressure to Dalian Port. Dalian Port and Yingkou Port have the same hinterland, but compared with Dalian Port, the distance from the northeast inland of China to Yingkou Port has been shortened by 190 km, greatly reducing land logistics costs. By 2023, the container throughput of Dalian Port was only 3.67 million TEU, 18% and 15.5% of the container throughput of Tianjin Port and Qingdao Port, respectively. During this period, the average annual growth rate of Dalian Port was −5.4%. As a result, the container traffic at Dalian Port has entered a period of negative growth.
6. Conclusions
Tianjin Port, Dalian Port, and Qingdao Port in the Bohai Rim multi-port system have been ranked among the top ten ports in terms of national throughput for many years, with each port possessing its own advantages and disadvantages as well as fierce competition. This paper explores the concentration, inequality, and competition of the Bohai Rim multi-port system from 1981 to 2023, highlights the evolution of the Bohai Rim multi-port system, and provides recommendations for the establishment of the northern China shipping center.
The findings are shown in Table 2 and indicate a significant shift in the dominance of the Bohai Rim multi-port system from Tianjin Port to Qingdao Port. In addition, the concentration of the system development has remained relatively low, and the three ports have not been fully monopolized. The Chinese government is guiding the integration of port resources and the development of port groups while also planning to establish the northern economic center. Tianjin Port, Dalian Port, and Qingdao Port are competing fiercely for the position of the northern China shipping center. In particular, Dalian Port has experienced sluggish container shipping growth with declining throughput for several years, indicating weak competitiveness and a challenging domestic and international environment.
Table 2.
The evolution of the Bohai Rim multi-port system, 1981–2023.
At present, container transportation in Dalian Port is slowly developing, with container throughput declining for several years. This weak competitiveness, coupled with the serious domestic and international challenges faced by the port, suggests that the future prospects for Dalian Port remain unimpressive. Dalian Port should break the existing pattern and seek new development, such as upgrading its transportation network and port infrastructure, strengthening cooperation with inland areas, and developing into a regional key international trade docking window to enhance the port’s international competitiveness. In contrast, as the first port to introduce container transport in mainland China, Tianjin Port has experienced a period of sluggish development since being overtaken by Qingdao Port in container throughput in 1997. Qingdao Port, as a rising port, has full momentum in development and is at the peak of development. In order to promote the coordinated development of port clusters, the Dalian, Tianjin, and Qingdao ports need to establish a division of labor and cooperation mechanism to reduce vicious competition. Rather than blindly expanding their transportation capacity and increasing container throughput in search of breakthroughs, the three ports should collaborate and divide the market according to customer market, vessel type, load capacity, and cargo type and establish a northern shipping center. The shipping center is responsible for unified scheduling and plays a leading role in the northern shipping market.
After analyzing the concentration, inequality, and competition of the Bohai Rim multi-port system from the perspective of the ternary diagram compared with the other three well-known indicators, we conclude that the northern China shipping center should be located in Qingdao Port. This strategic positioning aims to maximize the utilization of social resources and foster seamless integration among regional ports, thereby better driving the development of the Bohai Rim multi-port system and the role of stimulating the regional economy.
The ternary diagram method proposed in this study is obviously more suitable for multi-port systems with only three ports. It can also be applied to analyze similar three-port systems, but it lacks the versatility required to address systems with two ports, four ports, and other quantities of ports and is highly sensitive to the number of variables. Future research will aim to develop more widely applicable analytical methods.
Author Contributions
Methodology, M.G. and H.F.; Validation, Q.L., M.G. and P.Z.; Investigation, Q.L.; Data curation, Q.L.; Writing—original draft, Q.L.; Writing—review & editing, M.G., P.Z. and H.F.; Funding acquisition, H.F. All authors have read and agreed to the published version of the manuscript.
Funding
This achievement is partially funded by the “Research Base on Digital Economy Innovation and Linkage with Hub Free Trade Zones”, a key research base of philosophy and social sciences in Ningbo; and by the National Social Science Foundation of China (No. 19BJL041).
Institutional Review Board Statement
Not applicable.
Informed Consent Statement
Not applicable.
Data Availability Statement
Data are contained within the article.
Conflicts of Interest
The authors declare no conflicts of interest.
References
- Lin, B.; Zhu, B. Efficiency Evaluation of Main Ports in the Bohai Rim Region Based on Data Envelopment Analysis. In 2020 International Conference on Data Processing Techniques and Applications for Cyber-Physical Systems: DPTA 2020; Springer: Singapore, 2021; pp. 539–546. [Google Scholar]
- Jin, L.; Chen, J.; Sheu, J.B.; Zhou, H.; Jian, Y.; Yu, B. Impacts of national strategies on gateway ports: An empirical study in the Bohai Rim. Transp. Policy 2022, 117, 1–11. [Google Scholar] [CrossRef]
- Sui, Y.; Hu, J.; Zhang, N.; Ma, F. Exploring the dynamic equilibrium relationship between urbanization and ecological environment--A case study of Shandong Province, China. Ecol. Indic. 2024, 158, 111456. [Google Scholar] [CrossRef]
- Ito, H.; Hanaoka, S.; Sugishita, K. Structural changes in the cruise network by ship size in Northeast Asia. Asian J. Shipp. Logist. 2022, 38, 207–221. [Google Scholar] [CrossRef]
- Woo, S.H.; Pettit, S.; Beresford, A.; Kwak, D.W. Seaport Research: A Decadal Analysis of Trends and Themes Since the 1980s. Transp. Rev. 2012, 32, 351–377. [Google Scholar] [CrossRef]
- Taaffe, E.J.; Morrill, R.L.; Gould, P.R. Transport Expansion in Underdeveloped Countries: A Comparative Analysis. Geogr. Rev. 1963, 53, 503–529. [Google Scholar] [CrossRef]
- Pujats, K.; Golias, M.; Konur, D. A review of game theory applications for seaport cooperation and competition. J. Mar. Sci. Eng. 2020, 8, 100. [Google Scholar] [CrossRef]
- Hayuth, Y. Containerization and the Load Center Concept. Econ. Geogr. 1981, 57, 160–176. [Google Scholar] [CrossRef]
- Notteboom, T.E.; Rodrigue, J.-P. Port regionalization: Towards a new phase in port development. Marit. Policy Manag. 2005, 32, 297–313. [Google Scholar] [CrossRef]
- Liu, L.; Wang, K.Y.; Yip, T.L. Development of a container port system in Pearl River Delta: Path to multi-gateway ports. Transp. Geogr. 2013, 28, 30–38. [Google Scholar] [CrossRef]
- Song, D.-W. Regional container port competition and co-operation: The case of Hong Kong and South China. Transp. Geogr. 2002, 10, 99–110. [Google Scholar] [CrossRef]
- Yang, Z.; Xiu, Q.; Chen, D. Historical changes in the port and shipping industry in Hong Kong and the underlying policies. Transp. Policy 2019, 82, 138–147. [Google Scholar] [CrossRef]
- Cullinane, K.; Teng, Y.; Wang, T.-F. Port competition between Shanghai and Ningbo. Marit. Policy Manag. 2005, 32, 331–346. [Google Scholar] [CrossRef]
- Wang, Y.; Yeo, G.-T. Transshipment hub port selection for shipping carriers in a dual hub-port system. Marit. Policy Manag. 2019, 46, 701–714. [Google Scholar] [CrossRef]
- Wu, S.; Yang, Z. Analysis of the case of port co-operation and integration in Liaoning (China). Res. Transp. Bus. Manag. 2018, 26, 18–25. [Google Scholar] [CrossRef]
- Lam, J.S.L.; Ng, A.K.Y.; Fu, X. Stakeholder management for establishing sustainable regional port governance. Res. Transp. Bus. Manag. 2013, 8, 30–38. [Google Scholar] [CrossRef]
- Wang, J.J.; Slack, B. Regional governance of port development in China: A case study of Shanghai International Shipping Center. Marit. Policy Manag. 2004, 31, 357–373. [Google Scholar] [CrossRef]
- Huang, Y. The growth of global hub port cities under globalisation: The case of Shanghai international shipping centre. Int. Dev. Plan. Rev. 2009, 31, 423–444. [Google Scholar] [CrossRef]
- Nguyen, P.N.; Woo, S.H.; Beresford, A.; Pettit, S. Competition, market concentration, and relative efficiency of major container ports in Southeast Asia. J. Transp. Geogr. 2020, 83, 102653. [Google Scholar] [CrossRef]
- Wilmsmeier, G.; Monios, J.; Pérez-Salas, G. Port system evolution—The case of Latin America and the Caribbean. J. Transp. Geogr. 2014, 39, 208–221. [Google Scholar] [CrossRef]
- Wilmsmeier, G.; Monios, J. Institutional structure and agency in the governance of spatial diversification of port system evolution in Latin America. J. Transp. Geogr. 2016, 51, 294–307. [Google Scholar] [CrossRef]
- Mohamed-Chérif, F.; Ducruet, C. Regional integration and maritime connectivity across the Maghreb seaport system. J. Transp. Geogr. 2016, 51, 280–293. [Google Scholar] [CrossRef]
- Grifoll, M.; Karlis, T.; Ortego, M.I. Characterizing the Evolution of the Container Traffic Share in the Mediterranean Sea Using Hierarchical Clustering. J. Mar. Sci. Eng. 2018, 6, 121. [Google Scholar] [CrossRef]
- Song, D.W.; Lee, S.W. Port governance in Korea: Revisited. Res. Transp. Bus. Manag. 2017, 22, 27–37. [Google Scholar] [CrossRef]
- Villa, J.C. Port reform in Mexico: 1993–2015. Res. Transp. Bus. Manag. 2017, 22, 232–238. [Google Scholar] [CrossRef]
- Ngoc, C.T.; Xu, X.; Kim, H.-S.; Nguyen, D.A.; You, S.-S. Container port throughput analysis and active management using control theory. Proc. Inst. Mech. Eng. Part M J. Eng. Marit. Environ. 2022, 236, 185–195. [Google Scholar] [CrossRef]
- Zhou, Y.; Li, Z.; Duan, W.; Deng, Z. The impact of provincial port integration on port efficiency: Empirical evidence from China’s Coastal Provinces. J. Transp. Geogr. 2023, 108, 103574. [Google Scholar] [CrossRef]
- Martínez Moya, J.; Feo Valero, M. Port choice in container market: A literature review. Transp. Rev. 2017, 37, 300–321. [Google Scholar] [CrossRef]
- Cuong, T.N.; Kim, H.S.; You, S.S.; Nguyen, D.A. Seaport throughput forecasting and post COVID-19 recovery policy by using effective decision-making strategy: A case study of Vietnam ports. Comput. Ind. Eng. 2022, 168, 108102. [Google Scholar] [CrossRef]
- Cuong, T.N.; Kim, H.S.; Long, L.N.B.; You, S.S. Seaport profit analysis and efficient management strategies under stochastic disruptions. Marit. Econ. Logist. 2024, 26, 212–240. [Google Scholar] [CrossRef]
- Nguyen, P.N.; Woo, S.H. Port connectivity and competition among container ports in Southeast Asia based on Social Network Analysis and TOPSIS. Marit. Policy Manag. 2022, 49, 779–796. [Google Scholar] [CrossRef]
- Grifoll, M.; Ortego, M.I.; Egozcue, J.J. Compositional data techniques for the analysis of the container traffic share in a multi-port region. Eur. Transp. Res. Rev. 2019, 11, 12. [Google Scholar] [CrossRef]
- Constantinos, C.; Theodore, S. Concentration of container flows in the port phase: The case of the U.S West and East Coast port ranges. Issues Bus. Manag. Econ. 2019, 7, 1–13. [Google Scholar]
- Pham, T.Y.; Jeon, J.W.; Dang, V.L.; Cha, Y.D.; Yeo, G.T. A longitudinal analysis of concentration developments for container terminals in Northern Vietnam. Asian J. Shipp. Logist. 2016, 32, 157–164. [Google Scholar] [CrossRef]
- Feng, H.; Grifoll, M.; Zheng, P.; Martin-Mallofre, A.; Murphy, F.; Li, S. Evolution and container traffic prediction of Yangtze River Delta multi-port system (2001–2017). Int. J. Shipp. Transp. Logist. 2021, 13, 44–69. [Google Scholar] [CrossRef]
- Huang, D.; Grifoll, M.; Feng, H.; Ortego, M.I.; Zheng, P. Characterizing the evolution of the Yangtze River Delta multi-port system using compositional data techniques. Marit. Policy Manag. 2022, 49, 667–684. [Google Scholar] [CrossRef]
- Yang, D.; Wang, K.Y.; Xu, H.; Zhang, Z. Path to a multilayered transshipment port system: How the Yangtze River bulk port system has evolved. J. Transp. Geogr. 2017, 64, 54–64. [Google Scholar] [CrossRef]
- Feng, H.; Grifoll, M.; Zheng, P. From a feeder port to a hub port: The evolution pathways, dynamics and perspectives of Ningbo-Zhoushan port (China). Transp. Policy 2019, 76, 21–35. [Google Scholar] [CrossRef]
- Li, S.; Haralambides, H.; Zeng, Q. Economic forces shaping the evolution of integrated port systems—The case of the container port system of China’s Pearl River Delta. Res. Transp. Econ. 2022, 94, 101183. [Google Scholar] [CrossRef]
- Liu, S.; Nguyen, T.H.; Yeo, G.T. The evolution of container port group in Bohai Rim of China. J. Digit. Converg. 2018, 16, 107. [Google Scholar] [CrossRef]
- Yang, J.; Wang, G.W.; Li, K.X. Port choice strategies for container carriers in China: A case study of the Bohai Bay Rim port cluster. Int. J. Shipp. Transp. Logist. 2016, 8, 129–152. [Google Scholar] [CrossRef]
- Wang, Z.; Xu, G.; Bao, C.; Xu, J.; Sun, F. Spatial and economic effects of the Bohai Strait Cross-Sea Channel on the transportation accessibility in China. Appl. Geogr. 2017, 83, 86–99. [Google Scholar] [CrossRef]
- Horvath, J. Suggestion for a comprehensive measure of concentration. South. Econ. J. 1970, 36, 446–452. [Google Scholar] [CrossRef]
- Notteboom, T.E. Concentration and load centre development in the European container port system. J. Transp. Geogr. 1997, 5, 99–115. [Google Scholar] [CrossRef]
- Isard, W. The scope and nature of regional science. Pap. Reg. Sci. 1960, 6, 9–34. [Google Scholar] [CrossRef]
- Feng, H.; Grifoll, M.; Yang, Z.; Zheng, P.; Martin-Mallofre, A. Visualization of container throughput evolution of the Yangtze River Delta multi-port system: The ternary diagram method. Transp. Res. Part E Logist. Transp. Rev. 2020, 142, 102039. [Google Scholar] [CrossRef]
- Fu, Y.; Lin, Q.; Grifoll, M.; Lam, J.S.L.; Feng, H. Investigating the evolution of the Guangdong-Hong Kong-Macao Greater Bay Area (GBA) multi-port system: The multi-faced perspectives. Ocean Coast. Manag. 2023, 233, 106450. [Google Scholar] [CrossRef]
- Solak Fiskin, C. Inter-Port Evolutions and Prospects of Three Major Port Hubs in Europe: A Visualization Perspective Using Ternary Diagram Method. Appl. Spat. Anal. Policy 2024, 17, 521–545. [Google Scholar] [CrossRef]
- Wang, J. Tianjin Port: The Cradle of China’s Mainland Container Transport. Trade Union Inf. 2014, 29, 45–46. (In Chinese) [Google Scholar]
- Huang, D.; Grifoll, M.; Sanchez-Espigares, J.A.; Zheng, P.; Feng, H. Hybrid approaches for container traffic forecasting in the context of anomalous events: The case of the Yangtze River Delta region in the COVID-19 pandemic. Transp. Policy 2022, 128, 1–12. [Google Scholar] [CrossRef]
- Yan, P.; Qian, W.; Mitcham, C. Taking Responsible Innovation to China: The Dalian Port Development Case. Sci. Eng. Ethics 2022, 28, 4. [Google Scholar] [CrossRef]
- Feng, H.; Grifoll, M.; Yang, Z.; Zheng, P. Latest challenges to ports in public-private partnership: Case of Dandong Port (China)’s bankruptcy. Transp. Policy 2021, 110, 293–305. [Google Scholar] [CrossRef]


Disclaimer/Publisher’s Note: The statements, opinions and data contained in all publications are solely those of the individual author(s) and contributor(s) and not of MDPI and/or the editor(s). MDPI and/or the editor(s) disclaim responsibility for any injury to people or property resulting from any ideas, methods, instructions or products referred to in the content. |
© 2024 by the authors. Licensee MDPI, Basel, Switzerland. This article is an open access article distributed under the terms and conditions of the Creative Commons Attribution (CC BY) license (https://creativecommons.org/licenses/by/4.0/).