Abstract
Coastal shellfish aquaculture can influence benthic–pelagic-coupled systems because cultured species consume phytoplankton in the water column and return the captured organic matter and nutrients to the environment as biodeposits, which fall to the seafloor, affecting local sediment characteristics and the benthic community. In 2023, we conducted monthly field surveys to characterize the relationships between shellfish aquaculture and the surrounding environment by examining a range of physical and biological variables along the benthic–pelagic gradient at multiple sampling locations in relation to their distances from the aquaculture facilities in Onagawa Bay, Japan. The abundances of benthic macrofauna were dominated by polychaetes (86.3%), followed by gastropods (4.7%), malacostracans (2.7%), ophiuroids (2.1%), and bivalves (1.5%). Both benthic biomass and biodiversity were markedly higher, but the chlorophyll-a concentration of the water column and the sediment organic matter content were significantly lower at the closest proximity to the aquaculture facilities. Although the physical presence of shellfish aquaculture may effectively enhance pelagic–benthic energy fluxes, such processes may also pose a new challenge under the influence of recent global warming, causing widespread hypoxic conditions due to increased stratification in the water column accompanied by excess organic inputs from the aquaculture.
1. Introduction
Aquaculture will continue to play a crucial role in meeting the increased demand for essential protein and nutrients for food globally, and while the global production of aquatic animals from both capture fisheries and aquaculture reached the highest record of 185 million tonnes in 2022, the production of animal species from aquaculture exceeded that from capture fisheries for the first time, with aquaculture accounting for 51 percent of the total production [1]. The outlook suggests that aquaculture production will increase greatly in the future [1], and the expected increase in aquaculture operations has raised concerns regarding the impacts of the associated activities on local environments [2,3,4,5,6]. Initially, attention was directed to the influence of finfish aquaculture on the environment because chemicals and excess nutrients from food and feces associated with finfish farming may disturb the surrounding area if the operations are intense [2,7,8]. Studies have also shown that aquaculture has a negative impact, to a varying degree, on the environment through changes in the physical, chemical, and biological attributes of the sediments below and the water column around aquaculture installations [2,9,10,11]. The culture of shellfish and other suspended filter-feeders, such as ascidians, is generally considered to have a smaller environmental impact than finfish aquaculture because shellfish are grown at comparatively lower intensities and no external feed is added [6,12,13,14]. However, shellfish farms typically cover a much greater area than finfish farms and may affect the surrounding environment in different ways [14,15,16].
Many towns and villages located along the northern Pacific coast of Japan are renowned for their commercial fishing and aquaculture industries. This region is known as the Sanriku Coast (Figure 1a), and major warm and cold ocean currents converge offshore of the region, providing some of the most productive fishing grounds on earth. Onagawa Bay accommodates one of the major fishing ports in this region, producing a variety of wild-caught and farmed seafood, including flatfish, Pacific cod, salmon, shellfish, and cultured ascidians. In Onagawa Bay alone, there are over 700 long-line systems for culturing scallops, oysters, and edible ascidians, as well as around 80 fish cages for farming salmon, which account for 84.5 and 15.5% of the total area occupied by the respective aquaculture facilities (Figure 1b). The long-line method is widely used to culture filter feeders (e.g., mussels, oysters, scallops, and ascidians), and this method may readily influence the sea bottom below and the surrounding water column through benthic–pelagic processes. This is because cultured shellfish and ascidians feed entirely on naturally occurring phytoplankton with other suspended particles in the water column, and the food and nutrients captured by them can be returned to the environment as undigested waste or feces in the form of biodeposits, which fall to the seafloor and can become important food sources for benthic-deposit feeders [12,13,15]. The suspended filter-feeder aquaculture may therefore enhance the organic material flux to the sediment layer, and populations of benthic invertebrates and microorganisms in turn decompose the biodeposits and thereby control the number of nutrients released to the sediment–water interface [15,17]. Further, an enhanced organic matter flux together with the increased remineralization processes on the bottom layer may lead to increased sediment oxygen uptake by the benthic community and thereby cause hypoxic conditions on the surrounding seafloor [16,17,18].
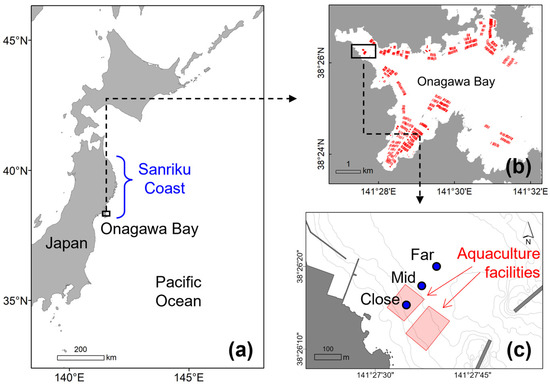
Figure 1.
(a) Location of Onagawa Bay on the Sanriku Coast, Japan; (b) distribution of aquaculture facilities in Onagawa Bay (the red lines represent long-line aquaculture facilities); (c) locations of sampling stations in relation to the position of aquaculture facilities (the blue filled circles indicate the sampling stations).
Shellfish aquaculture facilities provide unique marine habitats in that they not only vertically stretch throughout the water column from the sea surface to the bottom but also occupy substantial areas horizontally in coastal shallow water environments, attracting various marine species ranging from benthic and demersal to pelagic organisms within the system [19,20]. The physical presence of shellfish aquaculture may therefore effectively mediate benthic–pelagic coupling processes through the enhanced biogeochemical cycle of organic matter from the surface to the bottom. However, such processes may also pose a challenge under the influence of recent global warming, causing widespread hypoxic conditions due to increased stratification of the water column accompanied by enhanced sediment oxygen uptake at the sea bottom triggered by the excess organic inputs generated from the pelagic aquaculture operations. The aim of this study was to characterize the relationships between shellfish aquaculture and the surrounding environment by examining a range of physical and biological variables along the benthic–pelagic gradient at multiple sampling locations in relation to their distances from the aquaculture facilities in Onagawa Bay, Japan. This was accomplished by investigating (1) the temporal variation in the community structures of benthic macrofauna observed in the sediment samples across the stations; (2) the temporal variation in the sediment properties observed in the sediment samples across the stations; (3) the temporal variation in the relative abundances of epibenthic megafauna observed in the underwater video data across stations; and (4) the temporal variation in the physical conditions of the water column observed in the CTD monitoring across stations. Based on the quantification of these variables, we discuss the implications of seasonal variability in the influence of coastal aquaculture operations on both benthic–pelagic coupling processes and subsequent shallow aquatic ecosystem dynamics.
2. Materials and Methods
2.1. Data Collection
Onagawa Bay is located on the Sanriku Coast of northern Japan (Figure 1a). The bay is characterized by a naturally sheltered deep-water harbor that is suitable for coastal aquaculture. Regarding farming methods, hanging culture using a long-line system is widely employed to farm organisms such as shellfish (oysters and scallops) and ascidians on vertical ropes, typically down to around 10 to 15 m water depths (Figure 1b). Three sampling stations, namely St. Far, St. Mid, and St. Close, were established in relation to their distances from the nearest aquaculture facilities to monitor a range of physical and biological variables along the benthic–pelagic gradient (Figure 1c, Table 1). At each station, we conducted field observations on board RV Kaisei (1) on a monthly basis between December 2022 and May 2023 (6 months) for sediment (benthic) sampling and (2) on a bi-weekly basis between December 2022 and December 2023 (13 months) for water column (pelagic) and underwater camera monitoring. We conducted sediment sampling for only the first 6 months in this study to monitor the benthic–pelagic coupling processes with particular reference to the influence of the springtime phytoplankton bloom on the benthic zone. We then continued to conduct water column and underwater camera observations to monitor the subsequent benthic–pelagic processes taking place over the rest of the study period.

Table 1.
The geographic location of each sample station along with their mean water depth and relative distance to the nearest aquaculture facility.
2.2. Sediment Sampling for Benthic Macrofauna and Sediment Properties (6 Months)
We sampled a total of 6 sediment samples at each station using the Ekman grab (sampling area of 0.02 m2). For benthic macrofauna, we merged 3 of the full-grab samples and sieved them through a 1.0 mm mesh with filtered seawater on board. All organisms retained were preserved in 70% ethanol for subsequent sorting, species identification, enumeration, and biomass measurements. Species were identified to the lowest possible taxonomic levels, which was mostly the family level, using a stereomicroscope and a compound microscope where necessary, expressing abundance and biomass (wet weight) as ind./m2 and g/m2, respectively [19]. We also used separate sediment subsamples of the top 5 cm to determine both organic matter content and particle size composition, respectively. Organic matter content was measured as a loss on ignition over 8 h at 450 °C after drying the samples at 55 °C until constant weights were reached [21]. Particle size composition was determined using standard laser diffraction analysis (SALD-2300 Laser Diffraction Particle Size Analyzer, SHIMADZU, Kyoto, Japan) and categorized into 6 size classes defined here as “coarse sand” (<2 mm, >0.5 mm), “medium sand” (<0.5 mm, >0.25 mm), “fine sand” (<0.25 mm, >125 µm), “very fine sand” (<125 µm, >62.5 µm), “silt” (<62.5 µm, >3.9 µm), and “clay” (<3.9 µm).
2.3. Water Column and Underwater Camera Monitoring (13 Months)
At each sampling station, we recorded vertical profiles of the water temperature (°C), salinity, chlorophyll-a concentration (µg/L), dissolved oxygen (mg/L), sigma-t (water density: σt), and turbidity (FTU), using a CTD RINKO-Profiler (JFE Advantech Co., Ltd., Nishinomiya, Japan) at 0.5 m intervals from the surface to the bottom [19]. We also used an underwater video camera (FDR-X3000 4K Action Cam, SONY, Tokyo, Japan) with an underwater light to monitor the state of the seafloor by counting the number of epibenthic fauna or associated biological features encountered at each sampling station. During the observation, the video-capturing apparatus was lowered to the seafloor from the boat and kept approximately 60 cm above the bottom for 1 min to obtain continuous video data to count epibenthic fauna with any notable aquatic features or markings.
2.4. Data Analysis
We examined the biological metrics for the observed benthic macrofaunal communities obtained from the sediment samples across the seasons and stations (i.e., abundance, biomass, species richness, Shannon index H′, and evenness index J′). We then conducted a multivariate community analysis in PRIMER v6 [22] to examine the spatial and temporal trends in the benthic macrofaunal community structure across the seasons and stations. Following the fourth-root transformation of macrofaunal counts to down-weight the influence of highly abundant species, we performed cluster analysis (group-average linkage) on a resemblance matrix of the transformed data based on the Bray–Curtis similarity index. Non-metric multidimensional scaling (nMDS) was used to illustrate the degree of similarity among the benthic community structures across the sampling stations and seasons. ANOSIM was performed to test for significant differences among/between the three sampling stations, namely St. Far, St. Mid, and St. Close. SIMPER (similarity percentage) analysis was then performed to identify the species most responsible for the similarity within the stations determined by cluster analysis. All the graphics were constructed using the “ggplot2” package [23] in R version 3.6.1 [24].
3. Results
3.1. Benthic Macrofaunal Community Structure
We collected 18 benthos samples (3 stations × 6 months) and identified a total of 729 individuals comprising 629 from class Polychaeta (86.3%), 34 from class Gastropoda (4.7%), 20 from class Malacostraca (2.7%), 15 from class Ophiuroidea (2.1%), 11 from class Bivalvia (1.5%), and 22 others (2.7%) (Table 2 and Table S1). St. Far consistently showed the highest total abundance over the 6-month period, which was followed by St. Mid, with polychaetes being the most abundant at both stations (Table 2, Figure 2a). St. Close showed the lowest levels of abundance, yet not only polychaetes but also other taxonomic groups such as gastropods and malacostracans were markedly abundant at the station. With respect to polychaetes, St. Far was dominated by species belonging to the family Lumbrineridae, which was followed by other families such as Cirratulidae, Ampharetidae, Capitellidae, and Magelonidae (Figure 3). The abundances of similar polychaeta families also characterized St. Mid except for the family Ampharetidae, exhibiting markedly lower abundance when compared to St. Far (Figure 3). Although St. Close showed higher abundances of both lumbrinerid and cirratulid polychaetes, the site was more characterized by the higher abundance of maldanidae, unlike the other two stations (Figure 3).
Table 2.
Summary data for the abundance of the benthic macrofauna in this study. N indicates the total number of benthic fauna per taxonomic group (ind.) collected over the entire study period.
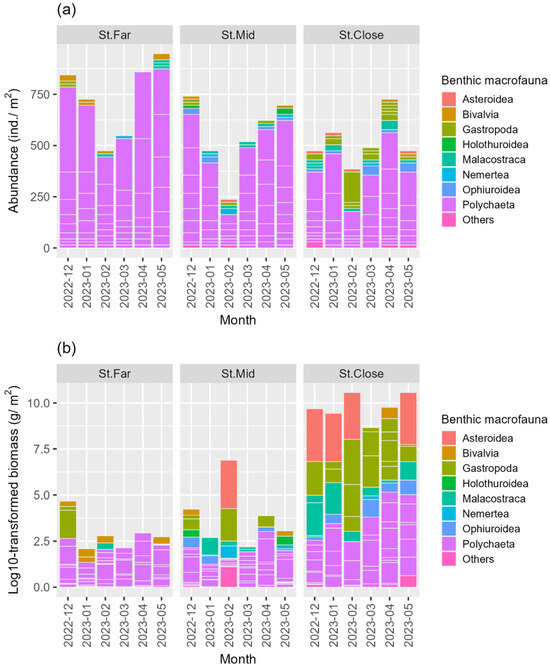
Figure 2.
Temporal changes in (a) total abundance and (b) total biomass of the benthic macrofauna per taxonomic group (class) across sampling stations over the study period.
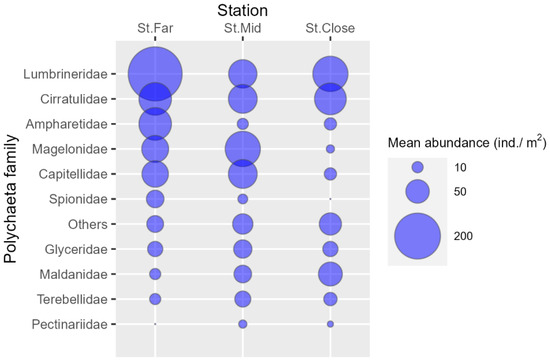
Figure 3.
Mean abundance of polychaeta species collected per family across sampling stations.
In terms of biomass, class Asteroidea showed the highest value (70.3%), which was followed by Gastropoda (16.4%), Polychaeta (8.0%), Malacostraca (3.7%), Ophiuroidea (0.6%), and others (2.7%) (Table 3). Although St. Far maintained the highest macrofaunal abundance, the total biomass was the lowest among the three stations (Table 2 and Table 3 and Figure 2b). St. Mid displayed intermediate amounts of biomass when compared to the other two stations (Table 3, Figure 2b). St. Close exhibited the highest levels of total biomass, which was characterized by the presence of various larger epibenthic megafauna such as asteroids, gastropods, and malacostracans (Table 3, Figure 2b).
Table 3.
Summary data for the biomass of the benthic macrofauna in this study. B indicates the total wet weight of benthic macrofauna per taxonomic group (g) collected over the entire study period.
The cluster analysis and the nMDS plot illustrate the clear separation of the benthic community structures systematically shifting from St. Close through St. Mid to St. Far (Figure 4a,b). The results of ANOSIM showed that the benthic community structures were significantly different among the three stations (ANOSIM: global R = 0.510, p < 0.001) (Table 4). Pairwise comparisons indicated that the community structure at St. Far was significantly different from those at both St. Mid (R = 0.380, p < 0.01) and St. Close (R = 0.872, p < 0.01), respectively, and the community structure at St. Mid was also significantly different from that at St. Close (R = 0.372, p < 0.05) (Table 4). SIMPER analysis revealed that the benthic community structures at St. Far, St. Mid, and St. Close showed an average similarity of 73.2, 59.3, and 58.7%, respectively (Table 5). The families of class Polycaeta such as Lumbrineridae, Cirratulidae, Ampharetidae, Capitellidae, Magelonidae, and Spionidae contributed predominantly to the average similarity at St. Far, whereas Magelonidae, Cirratulidae, Capitellidae, and Lumbrineridae were responsible for the similarity observed at St. Mid (Table 5). In addition to class Polychaeta, other taxonomic groups such as Ophiuroidea, Muricidae (Gastropoda), and Asterinidae (Asteroidea) contributed to the average similarity at St. Close (Table 5). St. Far tended to show the lowest overall values for taxonomic diversity indices, with the April sampling being the lowest for species richness and the Shannon index H′, while the December sampling was the lowest for the evenness index J′ (Figure 5a–c). While St. Mid displayed species richness values similar to those at St. Far, the values for the Shannon index H′ were markedly higher than those at St. Far, showing the highest levels of the evenness index J′ (Figure 5a–c). St. Close typically maintained the highest recorded values for both species richness and the Shannon index H′, showing the highest values for both metrics in April (Figure 5a–c).
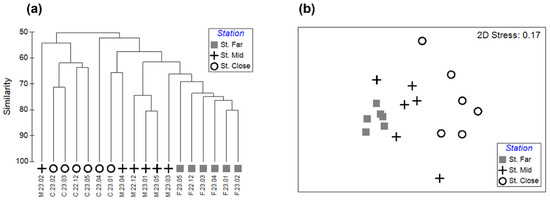
Figure 4.
Results of the multivariate analysis of benthic macrofaunal community across sampling stations and months, showing (a) dendrogram and (b) non-metric multidimensional scaling (nMDS) ordination plot, based on fourth-root transformation and Bray–Curtis similarity and group average clustering.
Table 4.
ANOSIM results comparing variation in the structures of benthic macrofaunal communities between sampling stations.
Table 5.
Results of SIMPER analysis showing percentage contributions of major taxonomic groups that accounted for most of the similarity (>70%) within each station (Code: Av. Sim. = average similarity; Av. Abund. = average abundance; Contrib. = contribution; Cum. = cumulative contribution).
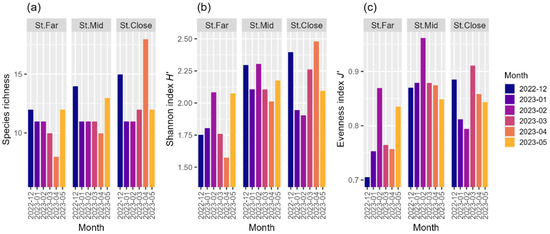
Figure 5.
Temporal changes in (a) species richness, (b) Shannon index H′, and (c) evenness index J′, of the benthic macrofaunal community across sampling stations over the study period.
3.2. Sediment Organic Matter Content and Particle Size Composition
The spatial patterns of sediment organic matter content decreased systematically from St. Far through St. Mid to St. Close as the distance to the nearest aquaculture facility decreased (Figure 6a, Table S2). The highest percentages of sediment organic matter were observed in May for the respective sites, although the increase was more pronounced at St. Far and St. Mid (Figure 6a). In addition, the lowest percentage of sediment organic matter content was observed at the St. Close site in December (Figure 6a).
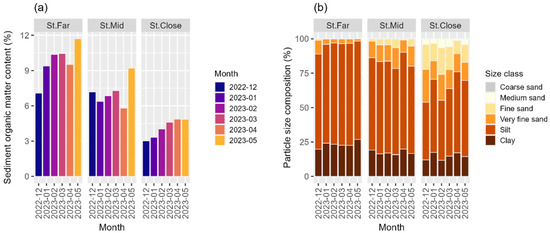
Figure 6.
Temporal changes in (a) sediment organic matter content (%) and (b) particle size composition (%) of the seafloor sediment across sampling stations over the study period.
All three stations had silt as the dominant particle size class (Figure 6b, Table S3). However, sediment fractions of sand (i.e., coarse, medium, fine, and very fine sand) and mud (i.e., silt and clay) varied distinctively between the three stations, with St. Far and St. Close occupying opposite ends of the size composition spectrum (Figure 6b). The sediment particle size at St. Far consistently contained highly elevated proportions of silt, which was followed by clay, with a small fraction of grain sizes larger than fine sand present throughout the study period (Figure 6b). The sediment fractions of both silt and clay decreased, whereas that of larger sand increased systematically from St. Far through St. Mid to St. Close, exhibiting a clear gradient from muddy to sandy substrate as the proximity to the aquaculture facility became closer (Figure 6b).
3.3. Observation of Epibenthic Megafauna Based on the Video Data
The video data revealed that biogenic features such as tubes of polychaete worms, which belong to the family Maldanidae, and other faunal burrows dominated the bottom habitat at St. Far (Figure 7). St. Mid was characterized by more diverse epibenthic invertebrates such as asteroids, crinoids, and holothurians; however, faunal burrows and maldanid worm tubes still remained the conspicuous features recurring throughout the study period (Figure 7). St. Close differed drastically from both St. Far and St. Mid in that the seafloor at St. Close was characterized by a wider range of epibenthic megafauna including asteroids, crinoids, holothurians, echinoids, gastropods, and brachyuran decapods (Figure 7). The underwater camera also observed a variety of fish species in the class Actinopterygii, including gobies Amblychaeturichthys sciistius, Pterogobius zacalles, greenlings Hexagrammos otakii, and pufferfish Takifugu snyderi, most consistently present at St. Close but with the largest abundances occasionally observed at St. Mid (Figure 7). The abundances of the observed epibenthic megafauna and features tended to be the highest in cold months, particularly between February and April around the beginning of the study period across all the three stations. However, these temporal trends shifted to a rather steady decline in the warm months (e.g., between August and November 2023) observed across the three stations, with St. Far showing the most pronounced declining trend.
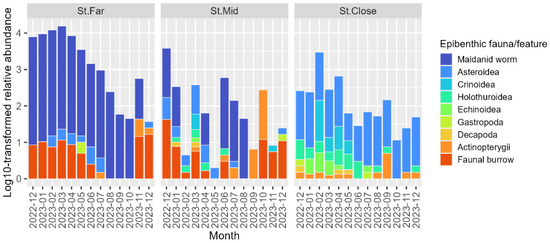
Figure 7.
Temporal changes in the relative abundance of epibenthic fauna/features observed by underwater camera across sampling stations over the study period.
3.4. Observation of the Water Column Based on the CTD-Probe
Patterns of changes in temperature, salinity, and water density (Sigma-t) were almost identical between the three sampling stations, demonstrating clear seasonal patterns within the respective water depth layers (Figure 8a,c,e). For example, temporal changes in water temperature showed the lowest value around March and the highest value around September across all stations (Figure 8a). In terms of vertical trends, temperature values were almost the same among the depth layers during cold months between December and March; however, they gradually diverged, forming the largest stratification in the hottest month in September with higher temperatures always observed at shallower depth layers (Figure 8a). Spatiotemporal changes in density values showed precisely opposite patterns to those in temperature (Figure 8a,e), whereas salinity values exhibited a decreasing trend as the depth layers became shallower, with all three stations forming distinctive stratifications between the depth layers during warm months in the summer (Figure 8c).
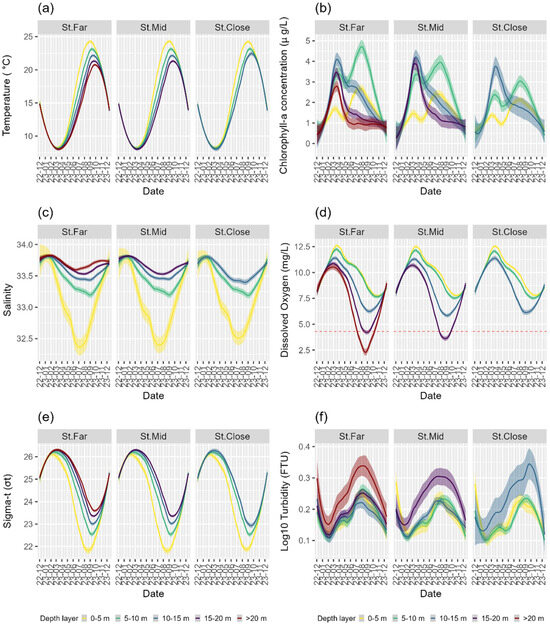
Figure 8.
Temporal changes in environmental variables observed in the water column across sampling stations and depth layers (5 m intervals) for (a) water temperature; (b) chlorophyll-a concentration; (c) salinity; (d) dissolved oxygen; (e) sigma-t (seawater density); and (f) turbidity.
In contrast, patterns of changes in the chlorophyll-a concentration, dissolved oxygen, and turbidity differed to a varying degree between the three stations (Figure 8b,d,f). Temporal changes in the chlorophyll-a concentration displayed similar peaks, once in spring around March at all depth layers and another in summer around August but only at shallower depths (0–10 m) across the three stations (Figure 8b). However, the values at 0–5 m and, particularly, 5–10 m depth layers declined systematically from St. Far through St. Mid to St. Close as the proximity to the nearest aquaculture facility became closer (Figure 1 and Figure 8b). Dissolved oxygen (DO) showed essentially similar patterns between all three stations, exhibiting the highest and the lowest values observed across all depth layers around March and September, respectively. The DO values were also stratified around March and August, with the lowest values consistently observed at the bottom depths across all three stations (Figure 8d). Further, the values observed at depths deeper than 10 m decreased systematically from St. Far through St. Mid to St. Close as the proximity to the nearest aquaculture facility became closer (Figure 8d). Therefore, while the St. Far site exhibited minor anoxic conditions at a depth layer of 15–20 m in September, the St. Mid site displayed more adverse anoxic conditions at the same depth range, lasting a longer duration from August to October (Figure 8d). Finally, turbidity exhibited the lowest value around March and the highest value around August, with the values being very similar at all the depth layers except for the bottom layers, which showed the most turbid conditions across the three stations, with St. Close having the highest variation in turbidity (Figure 8f).
4. Discussion
This study revealed that the community structure of benthic macrofauna significantly changed in relation to the distance from the shellfish aquaculture facilities, and these changes were strongly associated with the variability in sediment properties of the respective seafloors in Onagawa Bay, Japan. While both benthic macrofaunal biodiversity and biomass became markedly higher, the sediment property of the seafloor shifted systematically from muddy to sandy substrate as the proximity to the nearest aquaculture facilities became closer, indicating that the physical presence of the shellfish aquaculture in the pelagic zone influences the bottom habitat below and thereby provides unique environmental gradients to which a variety of benthic fauna respond within a relatively small extent of space.
Polychaetes were the most abundant benthic macrofauna observed throughout the study site. The families Lumbrineridae, Magelonidae, and Cirratulidae showed the highest abundance in this study. Polychaetes are often bioturbators of the seafloor, playing essential roles in the biogeochemical processes by consuming and remineralizing organic matter supplied from the water column above through benthic–pelagic coupling interactions [25,26,27]. Lumbrinerid and magelonid polychaetes primarily inhabit sandy–muddy substrates in shallow coastal waters, actively participating in surface deposit feeding [28,29], whereas cirratulids tend to inhabit intertidal and nearshore soft-bottom seafloor with some living in crevices of hard substrates [30]. In addition, members of the families Capitellidae and Spionidae showed higher abundances at St. Far and St. Mid. They are often known as opportunistic species tolerant of stressful conditions and, hence, are used as bioindicators of an ecosystem’s health [31,32,33]. The dominance of such opportunistic species at these stations may be indicative of the possible association of biological recolonization following a long-term severe hypoxia event in coastal ecosystems [34].
The organic carbon generated by shellfish aquaculture (i.e., biodeposits and detritus) provides substantial food and nutrient sources for these benthic and demersal biota [35]. However, the overall organic matter percentage was highest at St. Far rather than at St Close. A possible reason for this was that St. Close contained species that can readily utilize the organic matter material accumulated on the substrate and, as such, decrease its percentage within the benthic layer. While the video data showed that the tube constructions of polychaete Maldanidae were the most abundant at St. Far, the sediment grab samples revealed that the abundance of the maldanid polychaetes was the highest at St. Close. Bioturbation by maldanid polychaetes through their tube construction and feeding activities may influence sediment characteristics and thereby modify the benthic community structure of the seafloor [32,36]. Further, a certain maldanid species is capable of creating a porous substrate with high water content [37,38], which may have contributed to the formation of sandier sediment and the environmental improvement of the bottom habitat at St. Close.
The seafloor at St. Far was predominantly a muddier substrate and displayed the largest abundance of polychaetes yet lacked the species richness and diversity of other taxonomic groups. In contrast, the lowest abundance of polychaetes with a marked increase in the abundance of other epibenthic megafauna (e.g., starfish, gastropods, malacostracans, and ophiuroids), together with the occurrence of demersal fish, appeared to be responsible for the significant change in the benthic community structure observed at St. Close. In shallow aquatic ecosystems, seafloor conditions such as sediment granulometry critically influence the benthic community [39,40,41,42], and the physical presence of aquaculture facilities at St. Close may affect the seafloor environments through various pathways. For example, both aquaculture facilities (e.g., ropes, buoys, and anchors) and cultivated species (e.g., oysters and scallops) themselves provide unique three-dimensional hard substrates in the water column, which in turn attract a wide range of fouling and reef-associated fauna and flora including macroalgae, hydrozoans, crinoids, bivalves, barnacles, crustaceans, polychaetes, zooplankton, and fish [13]. These associated organisms can be dislodged and fall to the seafloor to form a structurally complex biogenic/shell mound immediately underneath the facilities [13]. Such shell mounds also offer unique sea-bottom habitats for many species, including reef-associated fish and epibenthic megafauna [13,43,44]. In addition, cultivated shellfish produce a substantial number of biodeposits such as undigested waste and feces, which increase the flux of organic matter and nutrients to the seafloor, altering local sediment characteristics and the benthic community composition [2,7,8,12,13,45,46], which may have facilitated the increase in the diversity of benthic infauna and epifauna at St. Close.
The formation of stratification in the water column accompanied by the severe hypoxic condition near the bottom occurred during the August–October sampling events that coincided with the substantial drop in the abundance of epibenthic megafauna observed in the video data across all sampling stations. The physical presence of shellfish facilities is known to impact local phytoplankton community structures [47]. For example, there was a significant decline in chlorophyll-a concentrations at 5–10 m depths at St. Close when compared to the other two stations. This was a clear indication of the enhanced consumption rate of phytoplankton caused by the shellfish aquaculture at the study site. Moreover, an unusually massive phytoplankton bloom occurred in summer, which coincided with the months of record-high temperatures and the development of severe hypoxic conditions in the benthic zone experienced throughout the study site, indicating that the combination of warmer waters and phytoplankton blooms may result in severe ecosystem-related consequences. Stratification of the water column by warm waters indicates that the water column does not mix well vertically, leading to stagnation and less opportunity for oxygen to be circulated to the lower depths. In addition, a higher amount of organic matter generated from the phytoplankton blooms can reach the bottom to fuel benthic fauna, facilitating the further depletion of oxygen and leading to the accelerated formation of anoxic zones [48,49,50]. In the case of our study, there was a strong coincidence between rapidly declining dissolved oxygen and the second phytoplankton bloom observed in August–September. At all three stations, dissolved oxygen levels drastically declined and the depth layers close to the bottom at St. Far and St. Mid reached severe anoxic conditions at the same time as the phytoplankton bloom in August–September. One interesting trend observed was the complete disappearance of any members of echinoids (e.g., sea urchins) beginning in June and lasting until the end of the study period. Echinoids are often important bioturbators that disturb the sediment to feed on organic matter and thereby affect sediment properties, providing complex biogeochemical interactions between the benthic and pelagic zones [51]. With the simultaneous disappearance of these bioturbators across all three stations, the development of the anoxic zone could well have been facilitated faster. The turbidity levels observed in this study also corroborate this linkage as at all three stations, extremely high levels of turbidity occurred during the second phytoplankton bloom, indicating a high amount of particulate matter in suspension (e.g., phytoplankton masses, algal growth, and substrate movement), which can further block sunlight for photosynthesis and other oxygen production-related processes. In a benthic–pelagic system where light cannot penetrate deep enough into the water column (e.g., high turbidity at depth), respiration can exceed the primary production at deeper depths, with low-light conditions leading to hypoxic or anoxic bottom water [52].
Overall, the physical presence of the shellfish aquaculture facilities may well effectively mediate pelagic–benthic energy fluxes. Currently, the benthic zones located close to or underneath the shellfish aquaculture facilities in Onagawa Bay appear to receive an enhanced amount of organic matter and detritus in the form of biodeposits generated from the farmed shellfish species, leading to an enhanced carrying capacity for accommodating larger populations of benthic infauna and megafauna along with demersal fish. However, our study demonstrated that such benthic–pelagic linkages may also pose a new challenge under the influence of recent global warming because it may cause shifts in the timing and magnitude of phytoplankton blooms, thereby causing widespread hypoxic conditions due to increased stratification of the water column accompanied by excess organic inputs from the surface primary production, as well as biodeposits generated from the filter-feeder aquaculture. Under such circumstances, one may well consider that aquaculture operation needs to be deeper at colder depths to avoid the negative impact of global warming. However, in this study, the dissolved oxygen levels observed at deeper layers decreased systematically as the proximity to the nearest aquaculture facility became closer. The possible expansion of aquaculture operation from shallow to deeper sites may therefore exacerbate the current problems caused by the warmer waters and hypoxic conditions. Although the present study only examined three stations situated in a local coastal area of Japan, the results clearly indicated complex interactions between the physical presence of the aquaculture facilities and the benthic–pelagic coupling processes. Given the large extent of marine aquaculture installed along coastal waters globally, there is a need to conduct more systematic and long-term monitoring at a number of locations covering wider geographical regions to identify the true ecological consequences of the expected increase in aquaculture operations in shallow aquatic ecosystems under the ever-increasing influence of global warming.
Supplementary Materials
The following supporting information can be downloaded at: https://www.mdpi.com/article/10.3390/jmse12081293/s1, Table S1: List of all the benthic macrofauna at class and family levels recorded across sampling stations over the study period; Table S2: Results of the sediment organic matter content analysis across sampling stations over the study period; Table S3: Results of the particle size composition analysis across sampling stations over the study period.
Author Contributions
Conceptualization, T.F.; methodology, T.F. and A.D.; validation, T.F. and W.S.-O.; formal analysis, T.F., A.D. and S.K.; investigation, T.F. and A.D.; resources, T.F. and W.S.-O.; data curation, T.F. and S.K.; writing—original draft preparation, T.F. and A.D.; writing—review and editing, A.D., S.K., W.S.-O. and T.F.; supervision, T.F.; project administration, T.F.; funding acquisition, A.D. and T.F. All authors have read and agreed to the published version of the manuscript.
Funding
This research was supported by the Tohoku University Junior Year Program (JYPE) in English 2022–2023 with the JASSO (Japan Student Services Organization) Scholarship. A.D. was supported by the Purdue College of Agriculture Scholarship and the Purdue Semester Abroad in Intercultural Learning (SAIL) Scholarship. T.F. was supported by the JST Grant Number JPMJPF2110 and KAKENHI-PROJECT-23H02230.
Institutional Review Board Statement
Not applicable.
Informed Consent Statement
Not applicable.
Data Availability Statement
Data are contained within the article.
Conflicts of Interest
The authors declare that the research was conducted in the absence of any commercial or financial relationships that could be construed as a potential conflict of interest.
References
- FAO. The State of World Fisheries and Aquaculture 2024; FAO: Rome, Italy, 2024. [Google Scholar] [CrossRef]
- Borja, Á.; Rodríguez, J.G.; Black, K.; Bodoy, A.; Emblow, C.; Fernandes, T.F.; Forte, J.; Karakassis, I.; Muxika, I.; Nickell, T.D.; et al. Assessing the suitability of a range of benthic indices in the evaluation of environmental impact of fin and shellfish aquaculture located in sites across Europe. Aquaculture 2009, 293, 231–240. [Google Scholar] [CrossRef]
- Dumbauld, B.R.; Ruesink, J.L.; Rumrill, S.S. The ecological role of bivalve shellfish aquaculture in the estuarine environment: A review with application to oyster and clam culture in West Coast (USA) estuaries. Aquaculture 2009, 290, 196–223. [Google Scholar] [CrossRef]
- Forrest, B.M.; Keeley, N.B.; Hopkins, G.A.; Webb, S.C.; Clement, D.M. Bivalve aquaculture in estuaries: Review and synthesis of oyster cultivation effects. Aquaculture 2009, 298, 1–15. [Google Scholar] [CrossRef]
- McKindsey, C.W.; Archambault, P.; Callier, M.D.; Olivier, F. Influence of suspended and off-bottom mussel culture on the sea bottom and benthic habitats: A review. Can. J. Zool. 2011, 89, 622–646. [Google Scholar] [CrossRef]
- Barrett, L.T.; Theuerkauf, S.J.; Rose, J.M.; Alleway, H.K.; Bricker, S.B.; Parker, M.; Petrolia, D.R.; Jones, R.C. Sustainable growth of non-fed aquaculture can generate valuable ecosystem benefits. Ecosyst. Serv. 2022, 53, 101396. [Google Scholar] [CrossRef]
- Forchino, A.; Borja, A.; Brambilla, F.; Rodríguez, J.G.; Muxika, I.; Terova, G.; Saroglia, M. Evaluating the influence of offshore cage aquaculture on the benthic ecosystem in Alghero Bay (Sardinia, Italy) using AMBI and M-AMBI. Ecol. Indic. 2011, 11, 1112–1122. [Google Scholar] [CrossRef]
- Tomassetti, P.; Gennaro, P.; Lattanzi, L.; Mercatali, I.; Persia, E.; Vani, D.; Porrello, S. Benthic community response to sediment organic enrichment by Mediterranean fish farms: Case studies. Aquaculture 2016, 450, 262–272. [Google Scholar] [CrossRef]
- Tovar, A.; Moreno, C.; Manuel-Vez, M.P.; Garcia-Vargas, M. Environmental impacts of intensive aquaculture in marine waters. Water Res. 2000, 34, 334–342. [Google Scholar] [CrossRef]
- Sarà, G.; Martire, M.L.; Sanfilippo, M.; Pulicanò, G.; Cortese, G.; Mazzola, A.; Manganaro, A.; Pusceddu, A. Impacts of marine aquaculture at large spatial scales: Evidences from N and P catchment loading and phytoplankton biomass. Mar. Environ. Res. 2011, 71, 317–324. [Google Scholar] [CrossRef]
- Farmaki, E.; Thomaidis, N.; Pasias, I.; Baulard, C.; Papaharisis, L.; Efstathiou, C. Environmental impact of intensive aquaculture: Investigation on the accumulation of metals and nutrients in marine sediments of Greece. Sci. Total Environ. 2014, 485, 554–562. [Google Scholar] [CrossRef]
- Shumway, S.E.; Davis, C.; Downey, R.; Karney, R.; Kraeuter, J.; Parsons, J.; Rheault, R.; Wikfors, G. Shellfish aquaculture–in praise of sustainable economies and environments. World Aquac. 2003, 34, 8–10. [Google Scholar]
- McKindsey, C.W.; Anderson, M.R.; Barnes, P.; Courtenay, S.; Landry, T.; Skinner, M. Effects of Shellfish Aquaculture on Fish Habitat; Canadian Science Advisory Secretariat Research Document 2006/011; Fisheries and Oceans: Ottawa, ON, Canada, 2006; p. 84. [Google Scholar]
- Weise, A.M.; Cromey, C.J.; Callier, M.D.; Archambault, P.; Chamberlain, J.; McKindsey, C.W. Shellfish-DEPOMOD: Modelling the biodeposition from suspended shellfish aquaculture and assessing benthic effects. Aquaculture 2009, 288, 239–253. [Google Scholar] [CrossRef]
- Lee, J.S.; Kim, S.H.; Kim, Y.T.; Hong, S.J.; Han, J.H.; Hyun, J.H.; Shin, K.H. Influence of sea squirt (Halocynthia roretzi) aquaculture on benthic–pelagic coupling in coastal waters: A study of the South Sea in Korea. Estuar. Coast. Shelf Sci. 2012, 99, 10–20. [Google Scholar] [CrossRef]
- Dimitriou, P.D.; Santi, I.; Moraitis, M.L.; Tsikopoulou, I.; Pitta, P.; Karakassis, I. Benthic–Pelagic Coupling in the Oligotrophic Eastern Mediterranean: A Synthesis of the HYPOXIA Project Results. Front. Mar. Sci. 2022, 9, 886335. [Google Scholar] [CrossRef]
- Alonso-Pérez, F.; Ysebaert, T.; Castro, C.G. Effects of suspended mussel culture on benthic–pelagic coupling in a coastal upwelling system (Ría de Vigo, NW Iberian Peninsula). J. Exp. Mar. Biol. Ecol. 2010, 382, 96–107. [Google Scholar]
- Christensen, P.B.; Glud, R.N.; Dalsgaard, T.; Gillespie, P. Impacts of longline mussel farming on oxygen and nitrogen dynamics and biological communities of coastal sediments. Aquaculture 2003, 218, 567–588. [Google Scholar] [CrossRef]
- Fujii, T.; Kaneko, K.; Murata, H.; Yonezawa, C.; Katayama, A.; Kuraishi, M.; Nakamura, Y.; Takahashi, D.; Gomi, Y.; Abe, H.; et al. Spatio-Temporal Dynamics of Benthic Macrofaunal Communities in Relation to the Recovery of Coastal Aquaculture Operations Following the 2011 Great East Japan Earthquake and Tsunami. Front. Mar. Sci. 2019, 5, 535. [Google Scholar] [CrossRef]
- Fujii, T.; Kaneko, K.; Nakamura, Y.; Murata, H.; Kuraishi, M.; Kijima, A. Assessment of coastal anthropo-ecological system dynamics in response to a tsunami catastrophe of an unprecedented magnitude encountered in Japan. Sci. Total Environ. 2021, 783, 146998. [Google Scholar] [CrossRef]
- Pasternack, G.B.; Brush, G.S. Sedimentation cycles in a river-mouth tidal freshwater marsh. Estuaries 1998, 21, 407–415. [Google Scholar] [CrossRef][Green Version]
- Clarke, K.R.; Warwick, R.M. Change in Marine Communities: An Approach to Statistical Analysis and Interpretation; Primer-E: Plymouth, UK, 2001. [Google Scholar]
- Wickham, H. ggplot2: Elegant Graphics for Data Analysis; Springer: New York, NY, USA, 2016. [Google Scholar]
- R Development Core Team. R: A Language and Environment for Statistical Computing; R Foundation for Statistical Computing: Vienna, Austria, 2019. [Google Scholar]
- Herman, P.M.J.; Middelburg, J.J.; Van De Koppel, J.; Heip, C.H.R. Ecology of estuarine macrobenthos. Adv. Ecol. Res. 1999, 29, 195–240. [Google Scholar]
- Meysman, F.J.R.; Middelburg, J.J.; Heip, C.H.R. Bioturbation: A fresh look at Darwin’s last idea. Trends Ecol. Evol. 2006, 21, 688–695. [Google Scholar] [CrossRef] [PubMed]
- Ehrnsten, E.; Norkko, A.; Timmermann, K.; Gustafsson, B.G. Benthic-pelagic coupling in coastal seas–Modelling macrofaunal biomass and carbon processing in response to organic matter supply. J. Mar. Syst. 2019, 196, 36–47. [Google Scholar] [CrossRef]
- Martins, R.; Carrera-Parra, L.F.; Quintino, V.; Rodrigues, A.M. Lumbrineridae (Polychaeta) from the Portuguese Continental Shelf (NE Atlantic) with the Description of Four New Species. Zootaxa 2012, 3416, 1–21. [Google Scholar] [CrossRef]
- Mills, K.; Mortimer, K. Observations on the tubicolous annelid Magelona alleni (Magelonidae), with discussions on the relationship between morphology and behaviour of European magelonids. J. Mar. Biol. Assoc. UK 2019, 99, 715–727. [Google Scholar] [CrossRef]
- Blake, J.A. Bitentaculate Cirratulidae (Annelida, Polychaeta) collected chiefly during cruises of the R/V Anton Bruun, USNS Eltanin, USCG Glacier, R/V Hero, RVIB Nathaniel B. Palmer, and R/V Polarstern from the Southern Ocean, Antarctica, and off Western South America. Zootaxa 2018, 4537, 1–130. [Google Scholar] [CrossRef]
- Dean, H.K. The use of polychaetes (Annelida) as indicator species of marine pollution: A review. Rev. Biol. Trop. 2008, 56, 11–38. [Google Scholar]
- Abe, H.; Kobayashi, G.; Sato-Okoshi, W. Impacts of the 2011 tsunami on the subtidal polychaete assemblage and the following recolonization in Onagawa Bay, northeastern Japan. Mar. Environ. Res. 2015, 112, 86–95. [Google Scholar]
- Hilliard, J.; Hajduk, M.; Méndez, N.; Schulze, A. Capitella (Annelida: Capitellidae) species in the Gulf of Mexico: Delimitation, phylogeography and phylogeny. Zool. Scr. 2024, 53, 461–472. [Google Scholar] [CrossRef]
- Steckbauer, A.; Duarte, C.M.; Carstensen, J.; Vaquer-Sunyer, R.; Conley, D.J. Ecosystem impacts of hypoxia: Thresholds of hypoxia and pathways to recovery. Environ. Res. Lett. 2011, 6, 025003. [Google Scholar] [CrossRef]
- Theuerkauf, S.J.; Barrett, L.T.; Alleway, H.K.; Costa-Pierce, B.A.; St. Gelais, A.; Jones, R.C. Habitat value of bivalve shellfish and seaweed aquaculture for fish and invertebrates: Pathways, synthesis and next steps. Rev. Aquac. 2021, 14, 54–72. [Google Scholar] [CrossRef]
- Levin, L.; Blair, N.; DeMaster, D.; Plaia, G.; Fornes, W.; Martin, C.; Thomas, C. Rapid subduction of organic matter by maldanid polychaetes on the North Carolina slope. J. Mar. Res. 1997, 55, 2237. [Google Scholar] [CrossRef]
- Sanders, H.L.; Goudsmit, E.M.; Mills, E.L.; Hampson, G.E. A study of the intertidal fauna of Barnstable Harbor, Massachusetts. Limnol. Oceanogr. 1962, 7, 63–79. [Google Scholar] [CrossRef]
- Mach, M.E.; Levings, C.D.; McDonald, P.S.; Chan, K.M. An Atlantic infaunal engineer is established in the northeast Pacific: Clymenella torquata (Polychaeta: Maldanidae) on the British Columbia and Washington Coasts. Biol. Invasions 2012, 14, 503–507. [Google Scholar] [CrossRef]
- Constable, A.J. Ecology of benthic macro-invertebrates in soft-sediment environments: A review of progress towards quantitative models and predictions. Aust. J. Ecol. 1999, 24, 452–476. [Google Scholar] [CrossRef]
- Thrush, S.F.; Hewitt, J.E.; Cummings, V.J.; Ellis, J.I.; Hatton, C.; Lohrer, A.; Norkko, A. Muddy waters: Elevating sediment input to coastal and estuarine habitats. Front. Ecol. Environ. 2004, 2, 299–306. [Google Scholar] [CrossRef]
- Reiss, H.; Degraer, S.; Duineveld, G.C.A.; Kröncke, I.; Aldridge, J.; Craeymeersch, J.A.; Eggleton, J.D.; Hillewaert, H.; Lavaleye, M.S.S.; Moll, A.; et al. Spatial patterns of infauna, epifauna, and demersal fish communities in the North Sea. ICES J. Mar. Sci. 2010, 67, 278–293. [Google Scholar] [CrossRef]
- Fujii, T. Climate change, sea-level rise and implications for coastal and estuarine shoreline management with particular reference to the ecology of intertidal benthic macrofauna in NW Europe. Biology 2012, 1, 597–616. [Google Scholar] [CrossRef]
- Fujii, T. Potential influence of offshore oil and gas platforms on the feeding ecology of fish assemblages in the North Sea. Mar. Ecol. Prog. Ser. 2016, 542, 167–186. [Google Scholar] [CrossRef]
- Meyer-Gutbrod, E.L.; Love, M.S.; Claisse, J.T.; Page, H.M.; Schroeder, D.M.; Miller, R.J. Decommissioning impacts on biotic assemblages associated with shell mounds beneath southern California offshore oil and gas platforms. Bull. Mar. Sci. 2019, 95, 683–701. [Google Scholar] [CrossRef]
- Crawford, C.M.; Macleod, C.K.A.; Mitchell, I.M. Effects of shellfish farming on the benthic environment. Aquaculture 2003, 224, 117–140. [Google Scholar] [CrossRef]
- Kalantzi, I.; Rico, A.; Mylona, K.; Pergantis, S.A.; Tsapakis, M. Fish farming, metals and antibiotics in the eastern Mediterranean Sea: Is there a threat to sediment wildlife? Sci. Total Environ. 2021, 764, 142843. [Google Scholar] [CrossRef]
- Han, D.; Chen, Y.; Zhang, C.; Ren, Y.; Xue, Y.; Wan, R. Evaluating impacts of intensive shellfish aquaculture on a semi-closed marine ecosystem. Ecol. Model. 2017, 359, 193–200. [Google Scholar] [CrossRef]
- Rabalais, N.N.; Turner, R.E.; JustiĆ, D.; Dortch, Q.; Wiseman, W.J.; SenGupta, B.K. Nutrient changes in the Mississippi River and system responses on the adjacent continental shelf. Estuaries 1994, 19, 386–407. [Google Scholar] [CrossRef]
- Hagy, J.D.; Boynton, W.R.; Keefe, C.W.; Wood, K.V. Hypoxia in Chesapeake Bay, 1951–2001: Long-term change in relation to nutrient loading and river flow. Estuaries 2004, 27, 634–658. [Google Scholar] [CrossRef]
- Ho, A.Y.; Xu, J.; Yin, K.; Yuan, X.; He, L.; Jiang, Y.; Lee, J.H.; Anderson, D.M.; Harrison, P.J. Seasonal and spatial dynamics of nutrients and phytoplankton biomass in Victoria Harbour and its vicinity before and after sewage abatement. Mar. Pollut. Bull. 2008, 57, 313–324. [Google Scholar] [CrossRef]
- Lohrer, A.; Thrush, S.; Gibbs, M. Bioturbators enhance ecosystem function through complex biogeochemical interactions. Nature 2004, 431, 1092–1095. [Google Scholar] [CrossRef]
- Baustian, M.M.; Hansen, G.J.A.; Kluijver, A.D.; Robinson, K.; Henry, E.N.; Knoll, L.B.; Rose, K.C.; Carey, C. Linking the bottom to the top in aquatic ecosystems: Mechanisms and stressors of benthic-pelagic coupling. In Eco-DAS X Symposium Proceedings; Kemp, P.F., Ed.; Association for the Sciences of Limnology and Oceanography: Washington, DC, USA, 2014; Volume 3, pp. 25–47. [Google Scholar] [CrossRef]
Disclaimer/Publisher’s Note: The statements, opinions and data contained in all publications are solely those of the individual author(s) and contributor(s) and not of MDPI and/or the editor(s). MDPI and/or the editor(s) disclaim responsibility for any injury to people or property resulting from any ideas, methods, instructions or products referred to in the content. |
© 2024 by the authors. Licensee MDPI, Basel, Switzerland. This article is an open access article distributed under the terms and conditions of the Creative Commons Attribution (CC BY) license (https://creativecommons.org/licenses/by/4.0/).