Abstract
This research investigates the integration of Floating Offshore Wind Turbines (FOWTs) with Oscillating Water Columns (OWCs) to enhance sustainable energy generation, focusing on addressing dynamic complexities and uncertainties inherent in such systems. The novelty of this study lies in its dual approach, which integrates regressive modeling with an aero-hydro-elasto-servo-mooring coupled system with a deep data-driven network and implements a proportional-integral-derivative (PID) control mechanism to improve system stability. By employing Artificial Neural Networks (ANNs), the study circumvents the challenges of real-time closed-loop control on FOWT structures using the OpenFAST simulation tool. Data-driven models, trained on OpenFAST datasets, facilitate real-time predictive behavior analysis and decision-making. Advanced computational learning techniques, particularly ANNs, accurately replicate the dynamics of FOWT-OWC numerical models. An intelligent PID control mechanism is subsequently applied to mitigate structural vibrations, ensuring effective control. A comparative analysis with traditional barge-based FOWT systems underscores the enhanced modeling and control methodologies’ effectiveness. In this sense, the experimental results demonstrate substantial reductions in the mean oscillation amplitude, with reductions from 5% to 35% observed across various scenarios. Specifically, at a wave period from 20 s and a wind speed of 5 m/s, the fore-aft displacement was reduced by 35%, exemplifying the PID control system’s robustness and efficacy under diverse conditions. This study highlights the potential of ANN-driven modeling as an alternative to managing the complex non-linear dynamics of NREL 5 MW FOWT models and underscores the significant improvements in system stability through tailored PID gain scheduling across various operational scenarios.
1. Introduction
Offshore wind energy represents a progressive and eco-friendly approach to electricity production, capitalizing on the consistent winds found offshore. Its adoption is on the rise, as it outperforms conventional onshore wind farms in terms of power generation efficiency [1]. Initially confined to shallow waters with fixed bottoms, the advent of advanced technology has paved the way for floating wind turbines. These turbines are moored to the ocean floor with adaptable links, making it feasible to venture into deeper waters [2]. Switching to FOWTs offers several benefits, including access to steadier winds, minimized visual intrusion, and greater compliance flexibility with noise regulations [3]. The proliferation of offshore wind farms can be attributed to technological progress, supportive policies, and significant financial backing, all contributing to increased power output and a decrease in carbon emissions [4].
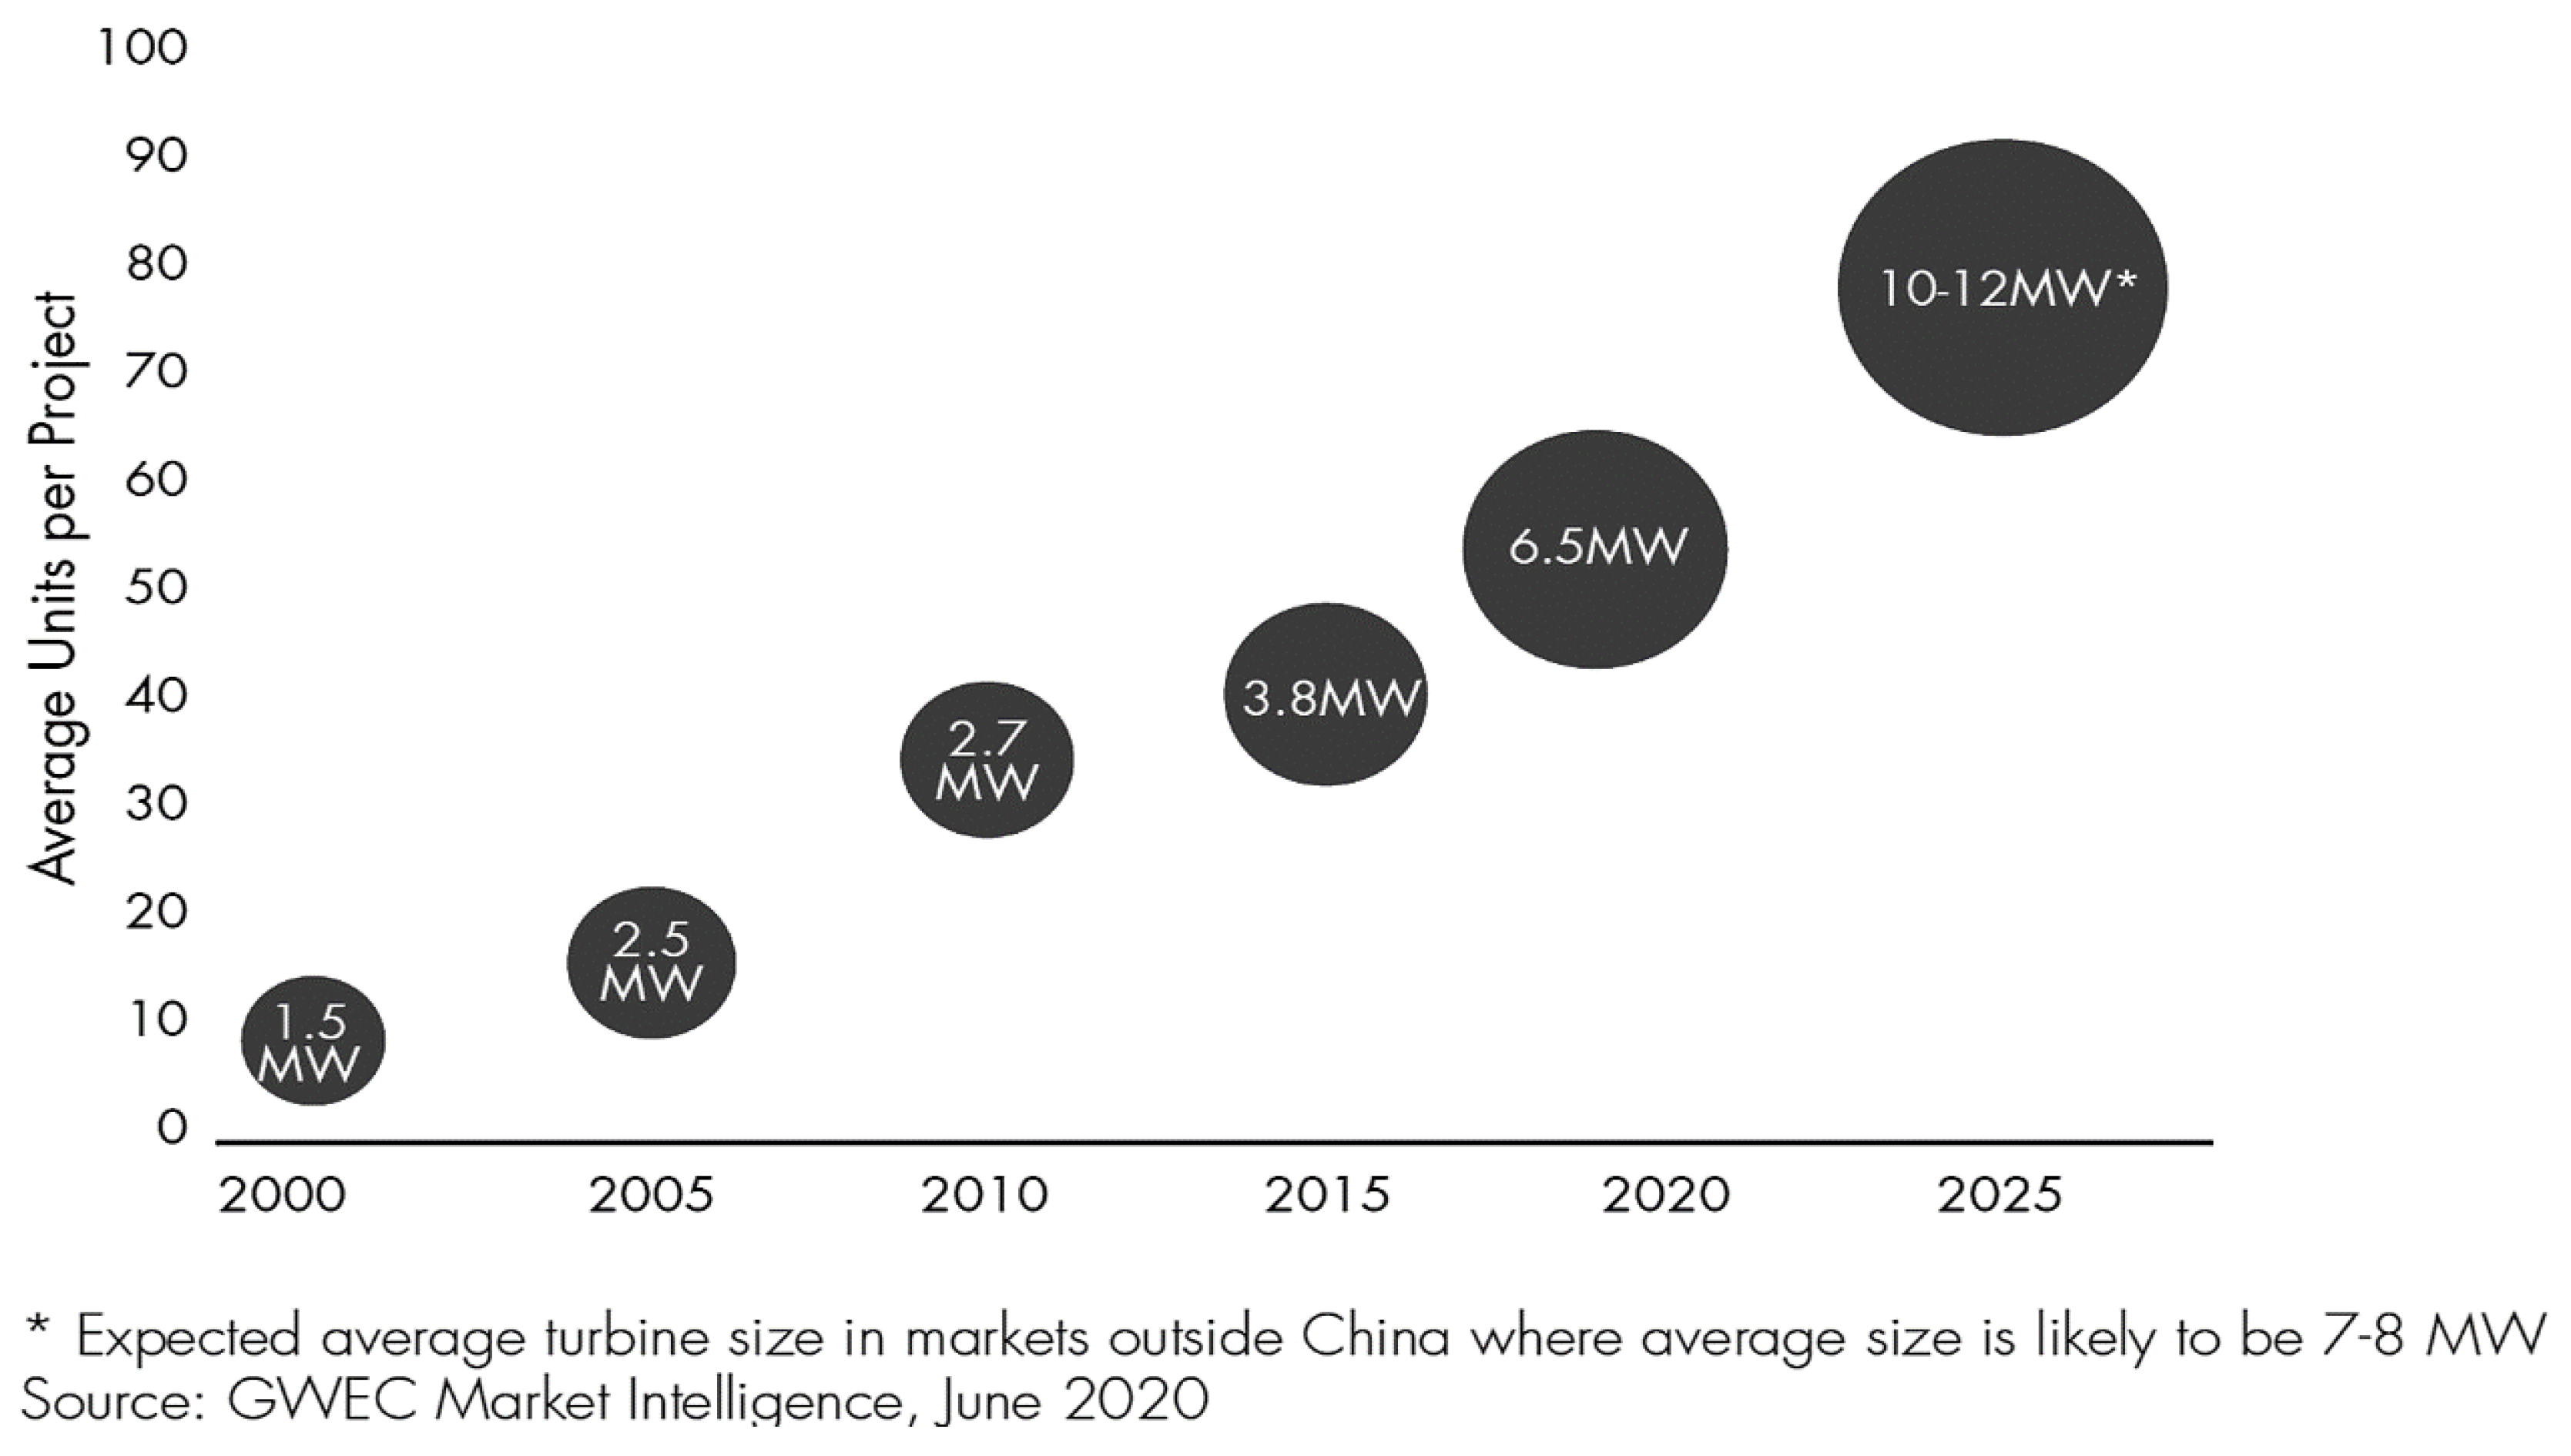
Renewable energy plays a crucial role in global initiatives to address climate change and secure energy supplies. Offshore wind energy, particularly in Europe, has emerged as a front-runner among renewable energy options [5]. As depicted in Figure 1, there has been a notable trend in the growth of the average capacity of offshore wind turbines per project from 2000 to 2025. Initially averaging 1.5 MW at the start of the millennium, the capacity of these turbines is expected to reach between 10 and 12 MW by 2025, underscoring the rapid advancements in turbine technology and the expansion of offshore wind projects. This expected growth trend anticipates a focus on larger capacity units in the industry, particularly in markets outside China where the average size is anticipated to be between 7 and 8 MW [6].

Figure 1.
Evolution of FOWTs and project size in units per project.
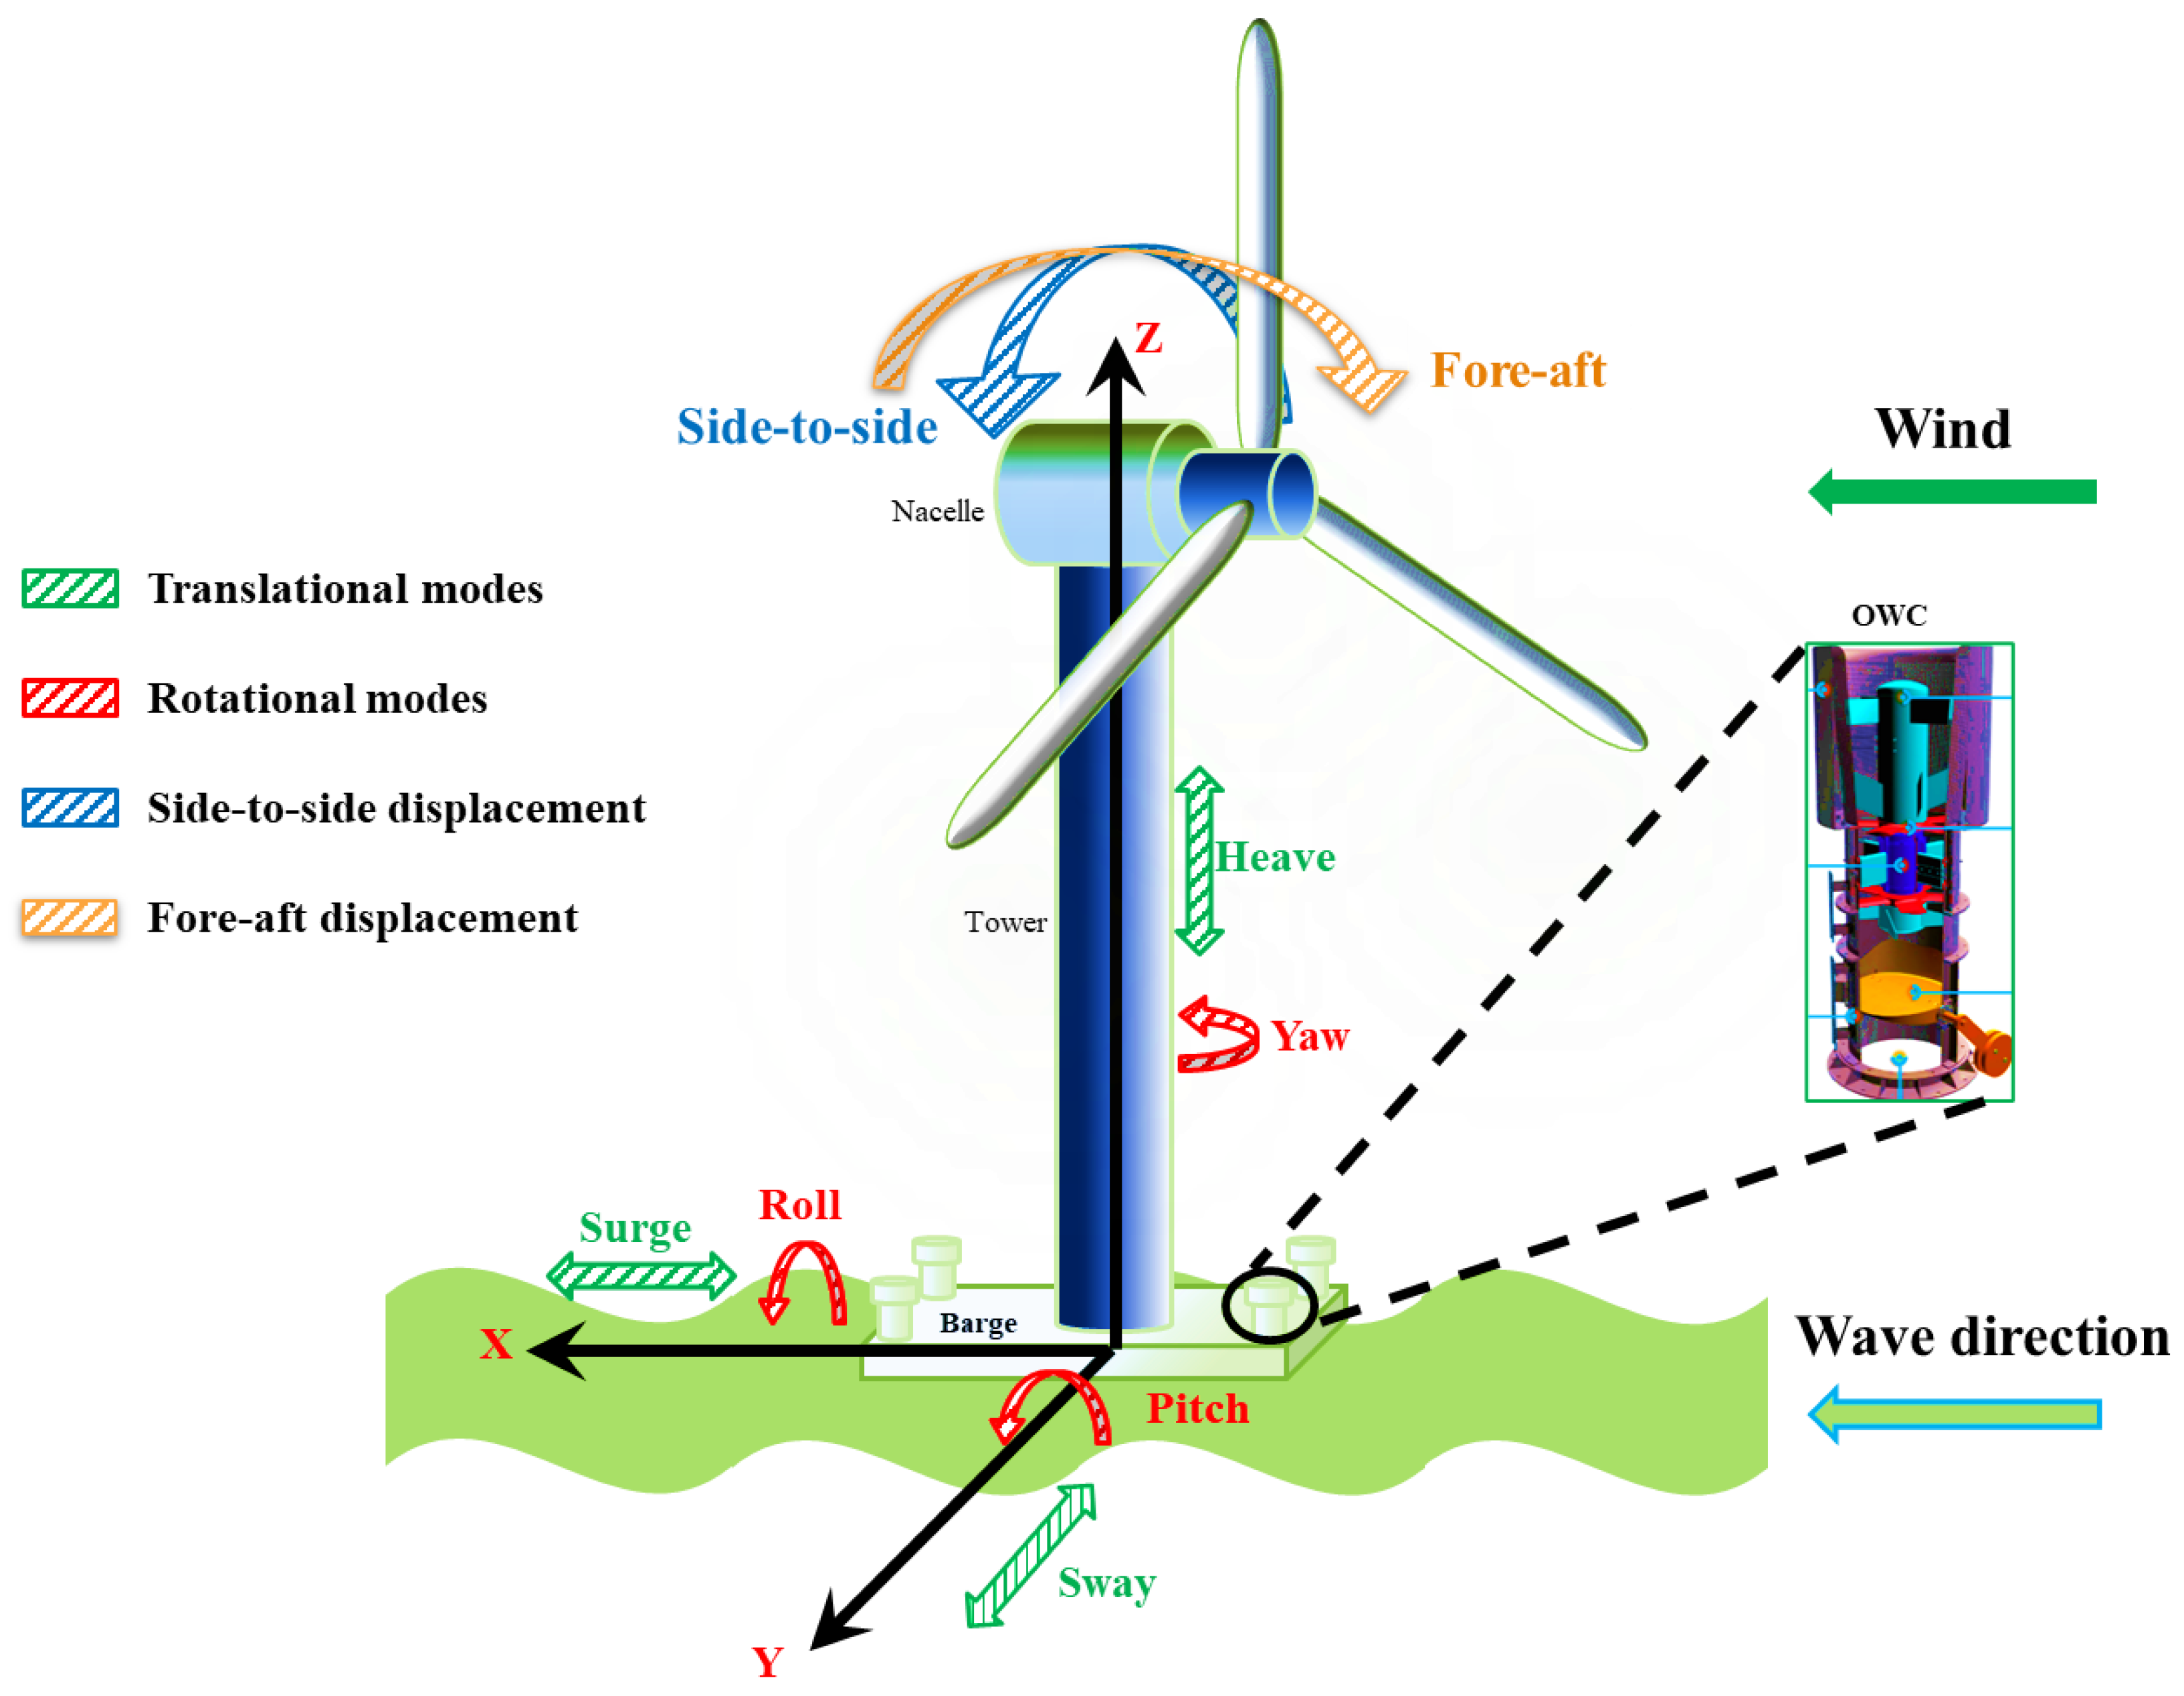
Recent trends in the field include the integration of Wave Energy Converters (WECs) with FOWTs. This hybrid approach, specifically the incorporation of OWCs with FOWTs, has been recognized as a promising strategy for improving renewable energy generation. The combination of FOWTs and OWCs aims to stabilize platforms and improve energy harvest, as shown in Figure 2. The functioning of an OWC is based on a capture chamber with an opening at the bottom, allowing water to flow in response to incoming waves. The motion of water leads to the compression and expansion of air within the chamber, later driving self-rectifying air turbines at the apex of the chamber. Different models of WECs have been implemented across Europe, exemplified by the NEREIDA Wave Power Plant in Spain and the Limpet facility in Scotland, signifying notable advancements in the field of renewable energy [7].

Figure 2.
A novel hybrid system for FOWT-OWCs.
The creation of these hybrid offshore structures encompasses complex dynamics [8]. Noteworthy advancements in modeling and control strategies for FOWTs combined with OWCs have been achieved, with machine learning playing a pivotal role [9]. These developments have significantly enhanced the efficiency and dependability of such systems [10]. The design of hybrid offshore structures presents complexities due to their coupled aero-hydro-servo-elastic dynamics [11]. While bottom-fixed turbines are ideal for shallow waters, floating turbines excel in deeper marine environments. The design of floating wind turbines is categorized into three main types according to their stabilization methods: buoyancy-stabilized (barge platform), mooring-stabilized (tension leg platform), and ballast-stabilized (spar buoy) [12].
Considerable progress has been realized in the development of modeling and control methodologies for FOWTs coupled with OWCs [13]. Research efforts are intensively focused on discovering new strategies to enhance both the efficiency and dependability of these sophisticated systems. The application of machine learning, recognized for its prowess in identifying patterns and forecasting based on extensive data collections, has proven to be an instrumental asset in this area [14]. Utilizing artificial intelligence, machine-learning approaches facilitate the crafting of precise and streamlined models for FOWTs integrated with OWCs.
2. Technical Literature Review
Machine learning is revolutionizing the domain of wind turbine regulation, marking a pivotal shift in research related to wind turbine control and surveillance through the integration of advanced machine learning and deep learning algorithms [15]. A key focus area is the stabilization of FOWTs for marine energy uses, in which deep reinforcement learning (DRL) techniques, including actor-critic networks in conjunction with a globally asymptotically stable observer, are employed to dynamically manage FOWTs across diverse environmental settings [16]. This simulation-driven analysis illustrates the advantage of such methodologies over conventional linear quadratic regulator (LQR) techniques in stabilizing FOWTs. Innovative, model-independent controllers utilizing reinforcement learning (RL) and Bayesian optimization (BO) offer adjustments without dependency on traditional mathematical models, aiming to boost energy production and minimize turbine stress [17]. Additionally, data-oriented predictive control tactics employing deep learning alongside multi-objective optimization tackle the model complexity and the dilemma of conflicting control aims in FOWTs [18]. These approaches enable accurate individual blade adjustment, optimizing the energy yield and ensuring platform steadiness in variable wind scenarios [19]. In the field of FOWT monitoring and safety, deep learning significantly contributes to the analysis of mooring line tension. Through simulations under assorted environmental conditions, it has been discerned that surge movements primarily affect mooring line tension, regardless of the mooring configuration, whereas the elasticity of blades and towers plays a minor role in tension predictions [20].
Gaussian process metamodels have recently been utilized as an innovative approach for encapsulating the hydrodynamic and structural dynamics of FOWTs [21]. These metamodels process inputs such as wave height, forces, and moments at the tower-platform junction to forecast platform movements and rotations. The investigation assesses three varieties of Gaussian process metamodels, showcasing their capability in accurately simulating platform behaviors. Additionally, a multi-criteria decision-making (MCDM) framework for the development of offshore wind farms in Ireland has been introduced, incorporating technical, financial, environmental, and societal factors to evaluate the sustainability of offshore wind locations [22]. Utilizing interval type-2 fuzzy sets and energy economic metrics such as the levelized cost of electricity (LCoC), this framework offers a refined decision-support system [23]. Table 1 summarizes various soft computing techniques employed in FOWT applications, detailing their specific areas of application and the resulting benefits or outcomes. These methods enhance the performance, stability, and efficiency of FOWTs by addressing complex dynamic and control challenges.

Table 1.
Overview of soft computing methods applied to FOWTs.
For the modeling of FOWTs, several innovative methodologies and technologies have been developed to advance their performance. J. Jonkman and collaborators [32] have been at the forefront with the introduction of OpenFAST for wind turbine behavior, a comprehensive tool that integrates fatigue, aerodynamics, structures, and turbulence aspects with a gain-scheduled proportional-integral approach. This simulator is instrumental in deciphering FOWT dynamics and facilitates the creation of robust control algorithms, including a standard collective blade pitch control mechanism [33]. Addressing the critical issue of vibrations in FOWTs, the TORA concept has been developed [34]. TORA is designed to enhance the structural stability of FOWTs, contributing to their smoother and more dependable functioning. Furthermore, M.A. Lackner and his team have introduced FAST-SC, a customized structural control system tailored for FOWTs [35]. This system allows for the meticulous management of the turbine’s structural elements, optimizing its performance comprehensively.
OpenFAST [36] is a pivotal tool in the development of diverse control strategies for FOWTs. It facilitates the exploration of active and passive control methods, including strategies focused on blade, torque, and rotational speed adjustments, and the application of the Tuned Mass Damper (TMD) for enhanced stability. In the pursuit of augmenting platform stability, a novel PID complementary airflow control method has been integrated into Offshore Wind Converters [37]. This technique guarantees consistent performance amidst variable weather conditions. Furthermore, collective torque control is identified as a key factor in the operational efficiency of FOWTs, with PID control systems widely implemented to reduce discrepancies between target and actual values, thus ensuring adequate control over FOWT operations [38].
There are various modeling techniques for FOWT-OWCs with semi-submersible configurations, which examine their dynamics within both time and frequency analytical domains. However, there is a need for intelligent machine learning models and control mechanisms for hybrid system stability. Therefore, this article has two primary novel objectives. The first is to develop novel control-oriented regressive intelligent modeling specifically for the hybrid design of FOWTs and OWCs. The second objective involves utilizing estimated models to implement gain scheduling PID feedback control. This control, aided by numerical tools and air valve control strategies, aims to ensure overall system control and stability. OWCs are utilized in this study primarily for platform stabilization. Consequently, their power output is generally lower compared to that of wind turbines. For instance, the OWC plant at the Mutriku Wave Power Plant in Spain has an installed capacity of 296 kW, while the wind turbines have a capacity of 5 MW [39].
The paper’s structure has been outlined as follows: Section 3 gives a detailed explanation of the subsystems within the FOWT-OWC system, along with their mathematical modeling. Section 4 delves into the proposed designs for the hybrid platform’s geometry and the associated hydrodynamic calculations. Section 5 discusses the proposed PID control for managing platform pitch and mitigating unwanted vibrations. Experimental findings, corroborated through cross-validation, are detailed in Section 6. The paper ends with the final section, offering conclusions and suggestions for future research directions.
3. Theoretical Foundations
3.1. Model of Wave Elevation
A straightforward model of wave elevation is presented as a unidirectional, regular sine wave, with surface dynamics described according to the Airy wave theory [40].
where is defined as the propagation velocity, is the wave amplitude from the Still Water Level (SWL), and λ is calculated by measuring the distance between two consecutive waves. From Equation (1), the temporal fluctuation of a wave is represented as a macroscopic illustration of the oscillatory motion of water molecules at a designated location. To facilitate the application of this oscillatory behavior to any position on the wave’s surface, a new variable that accounts for the spatial dimension along the wave front is introduced. Therefore, Equation (1) is reformulated as follows:
where is the wave number, is the wave height, is the axis in the direction of wave propagation, and represents the wave angle in the direction of the -axis. As explained below, this can be generalized by superposing an n-fold number of waves [38].
where is the number of waves, is the spectral density, is the number of each wave component, and is the angular frequency. The two most widely recognized theoretical wave spectra are the Bretschneider spectrum [41] for fully developed waves and the JONSWAP spectrum for partially developed waves. The generalized representation of the spectrum can be expressed as
where is and , is the wave height, and is the peak angular frequency. Depending on the wave condition, a value between 1 and 5 is chosen for the heat ratio parameter . The value of the standard JONSWAP spectrum is 3.3 [42].
3.2. Wind Turbine
The turbine set up a mechanical system that transforms wind energy into mechanical energy; subsequently, a generator converts this mechanical energy into electrical energy. The output power and torque can be characterized as follows:
where and represent the power and torque coefficients, respectively. denotes the air density and the the wind rotor radius (m). is the blade pitch angle (dgrees). The tip-speed ratio (TSR), , is defined as follows:
where denotes the radius of the turbine’s rotor and specifies the turbine’s rotational speed in radians per second (). The power coefficient, a nonlinear function, is dependent on and can be expressed as
The parametric values of the floating offshore wind turbine considered in this manuscript are presented in [43] Table 2.
Table 2.
NREL 5 MW floating offshore wind turbine (FOWT) specifications.
3.3. Equation of Motion of the Hybrid FOWT-OWCs
This section delineates the theoretical framework for a hybrid model designed to integrate OWC-WECs into a 5 MW floating barge-mounted wind turbine. Frequency-domain numerical tools, based on linear theory, were employed to analyze this design. Incorporating a WEC into the system potentially reduces overall costs by utilizing shared mooring structures and energy generation infrastructure. The model was constructed using MultiSurf for geometry design and WAMIT for computational diffraction-radiation analysis, assuming standard specifications for well and Power-Take-Off (PTO) equipment [43]. The complete nonlinear time-domain motion equations for the 5 MW FOWT with an OWC-equipped platform are presented as follows [44]:
In the equation, and represent the first and second time derivatives of the DOF, respectively. is a component of the inertia mass matrix, which exhibits nonlinear dependence on the system’s DOFs, , time (), and control inputs (). The term on the right side of the equation denotes the generalized external forces impacting the integrated system. These forces include aerodynamic loads on the blades and nacelle, as well as hydrodynamic forces on the platform, encompassing elastic and servo forces associated with the DOF. from Equation (10) is defined as follows:
The generalized linear system of equations of motion within the frequency domain is formulated as follows [44]:
In the frequency domain, ,, and represent the inertia, damping, and stiffness matrices of the FOWT, respectively. The term denotes the aggregate forces attributable to hydrodynamic effects and viscous drag induced by wave interactions, whereas encapsulates the force contributions from the OWCs.
includes the frequency-dependent 8x8 matrix. , and represent the platform added mass, actual platform mass, and tower mass, respectively. The damping matrix is delineated by Equation (14), incorporating and , which pertain to the damping properties of the floating barge platform and the flexible tower, respectively. signifies the nonlinear viscosity effects on the platform, while represents the comprehensive external damping resulting from the power take-off (PTO) system’s operation.
where the stiffness matrix consists of the hydrostatic restoration matrix of the platform obtained by WAMIT , the mooring lines spring stiffness coefficients that give matrix , and the stiffness matrix of the tower .
The internal pressure within the enclosure encompassing the four interconnected OWCs can be postulated to exhibit uniformity, as the internal free surface functions analogously to a piston. In this context, the influence of the OWCs on the overarching dynamic system is characterized, as delineated in reference [23], by an externally applied force:
where represents the pressure differential across the turbine and denotes the area of the internal free surface; the observed variations in air density and pressure due to processes of compression and decompression correspond to an isentropic transformation. Assuming the air behaves as an ideal gas, the temporal variation in air density provides an analytical description of the chamber’s state when at rest, which is defined as
where defines the heat capacity ratio of air. Upon linearizing the time derivative of the air density,
Then, within the chamber, the linearized mass flow can be quantitatively determined using the following formulation:
where is the air volume inside the chamber.
A Wells turbine, characterized by a diameter and rotational velocity , exhibits a linear correlation between the pressure and flow coefficients. This relationship is expressed using the non-dimensional parameters typical of turbomachinery analysis, as outlined in reference [45]:
The pressure and flow coefficients are defined as
The linear relationship can be described by considering the non-dimensional flow rate, under the assumption that the pressure drop is proportional to this flow rate, as follows:
where represents the acceleration due to gravity. Hence, following these formulations, the mass flow through the turbine can be expressed as
Upon integrating Equations (19) and (25), the pressure characterized by a complex amplitude is expressible within the frequency domain as follows:
where denotes the complex amplitude of the oscillatory volume displacement in air, and and represent constants defined by the following relationships:
The total PTO force can be rewritten by combining Equations (16) and (26):
where is the complex relative displacement amplitude. According to Equation (29), the dissipative term becomes proportional to the volume variation. In this context, represents the complex amplitude of the relative displacement. As delineated in Equation (29), the linear load exerted by the PTO includes a dissipative component that is directly proportional to the relative velocity, as well as a reactive component that is induced by the compressed air within the chamber and corresponds to the relative acceleration. Additionally, the dissipative component is proportional to the variation in volume. The reactive term is proportional to the rate of volume change when the damping coefficient and the spring coefficient are normalized by the area of the internal free surface. These PTO damping and spring coefficients are determined as per Equation (26):
Finally, the following results have been derived for the system’s frequency-dominant equations of motion for the 8-DOFs FOWT:
4. Proposed Hybrid FOWT-OWC Model
4.1. Platform Geometry Design
To implement active structural control, four Oscillating Water Columns (OWCs) were integrated into a 5 MW Floating Offshore Wind Turbine (FOWT). The initial phase involves designing the geometry of the hybrid system. This process begins with the architectural design of the hybrid platform. The platform’s geometry has been developed using MultiSurf, a computational tool designed for marine platform design. MultiSurf facilitates the creation of structural elements such as hulls, decks, keels, interiors, and superstructures, as well as the generation of free-form curves and surfaces, as referenced in sources [23,24].
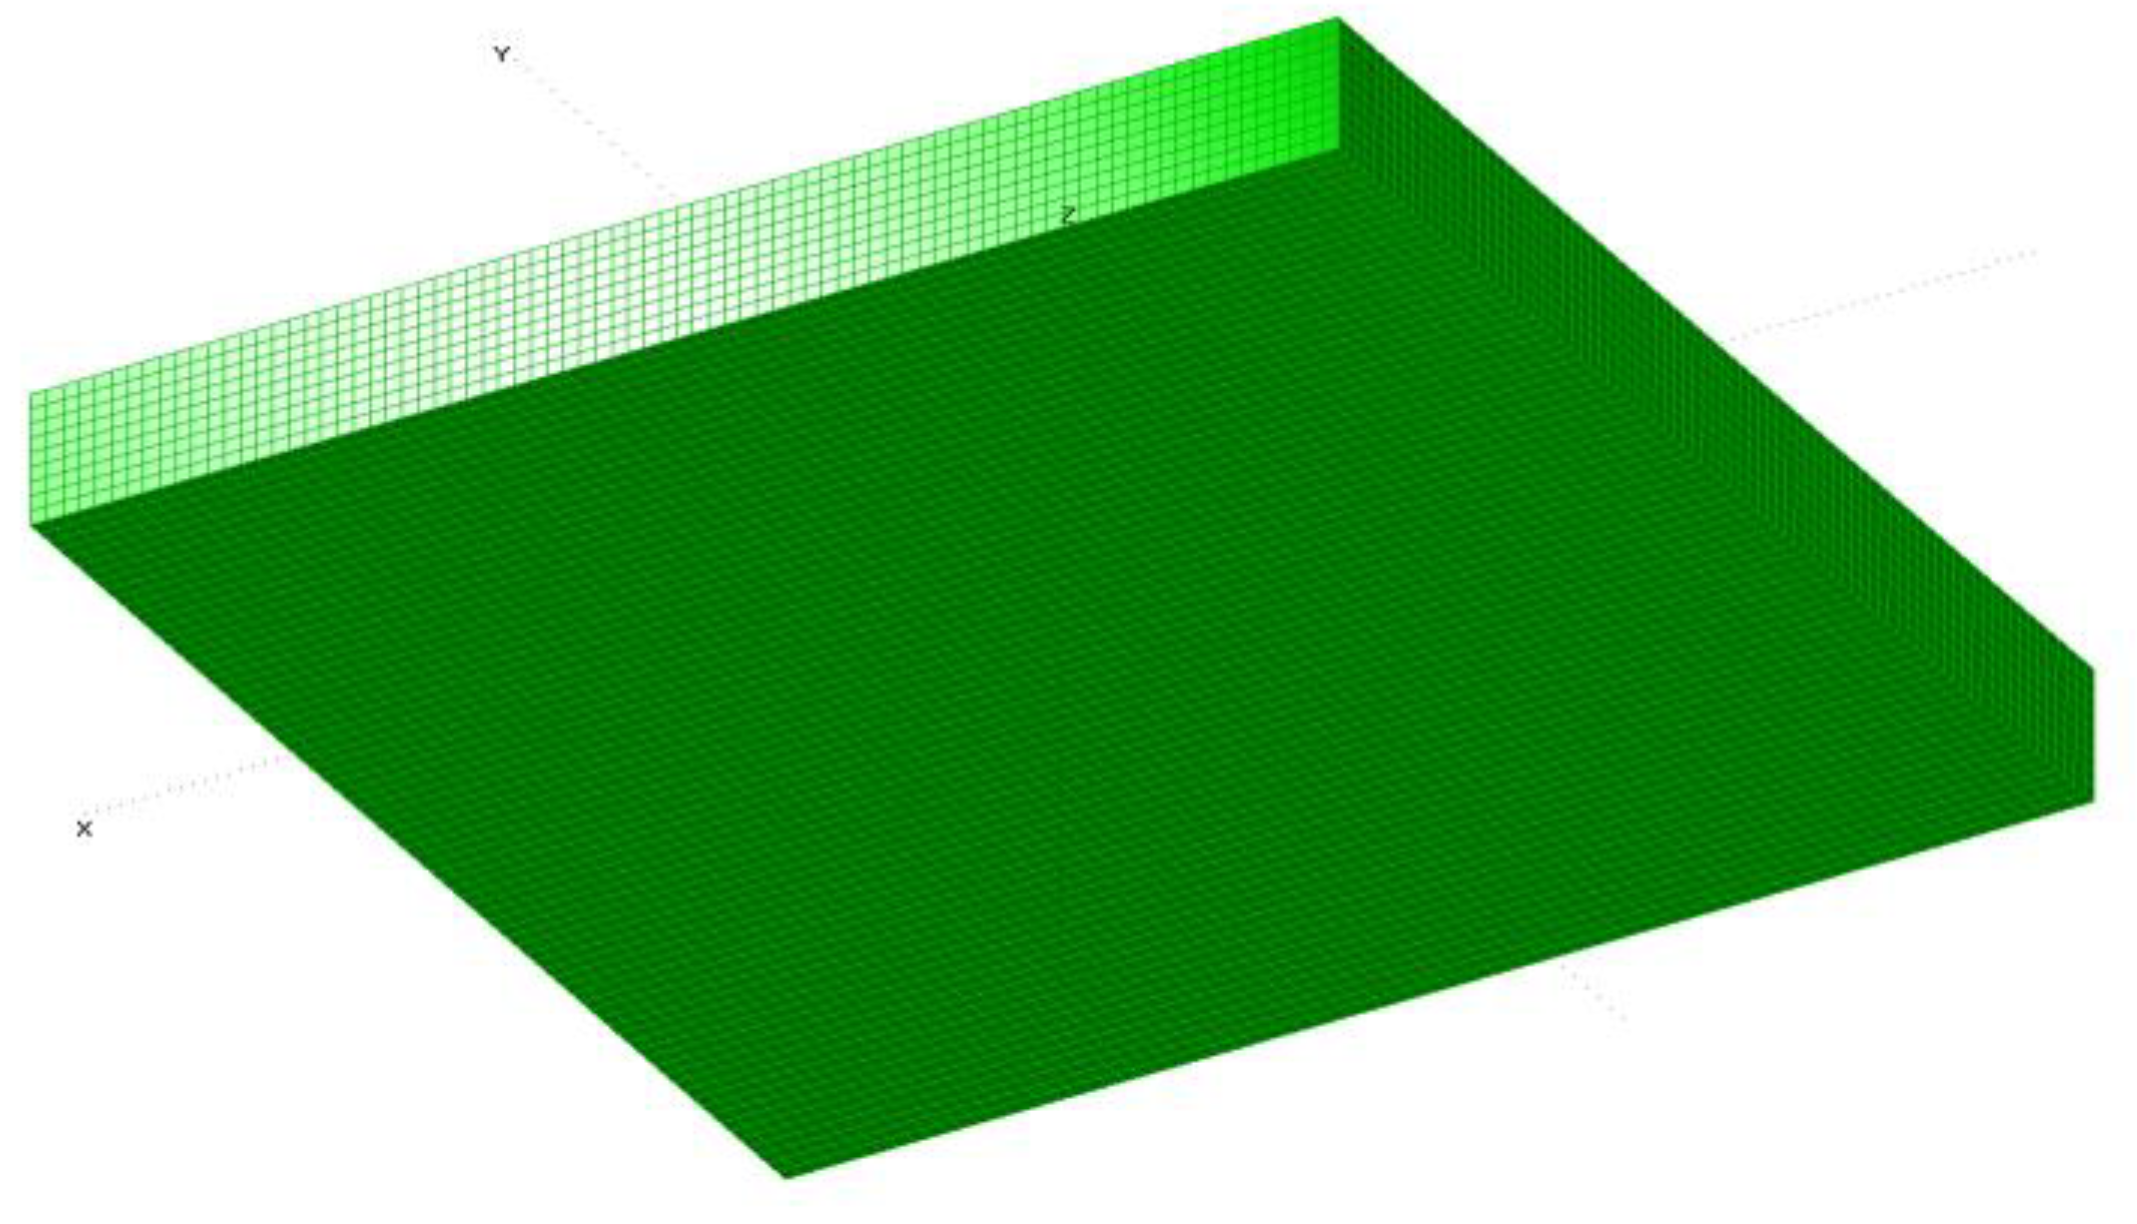
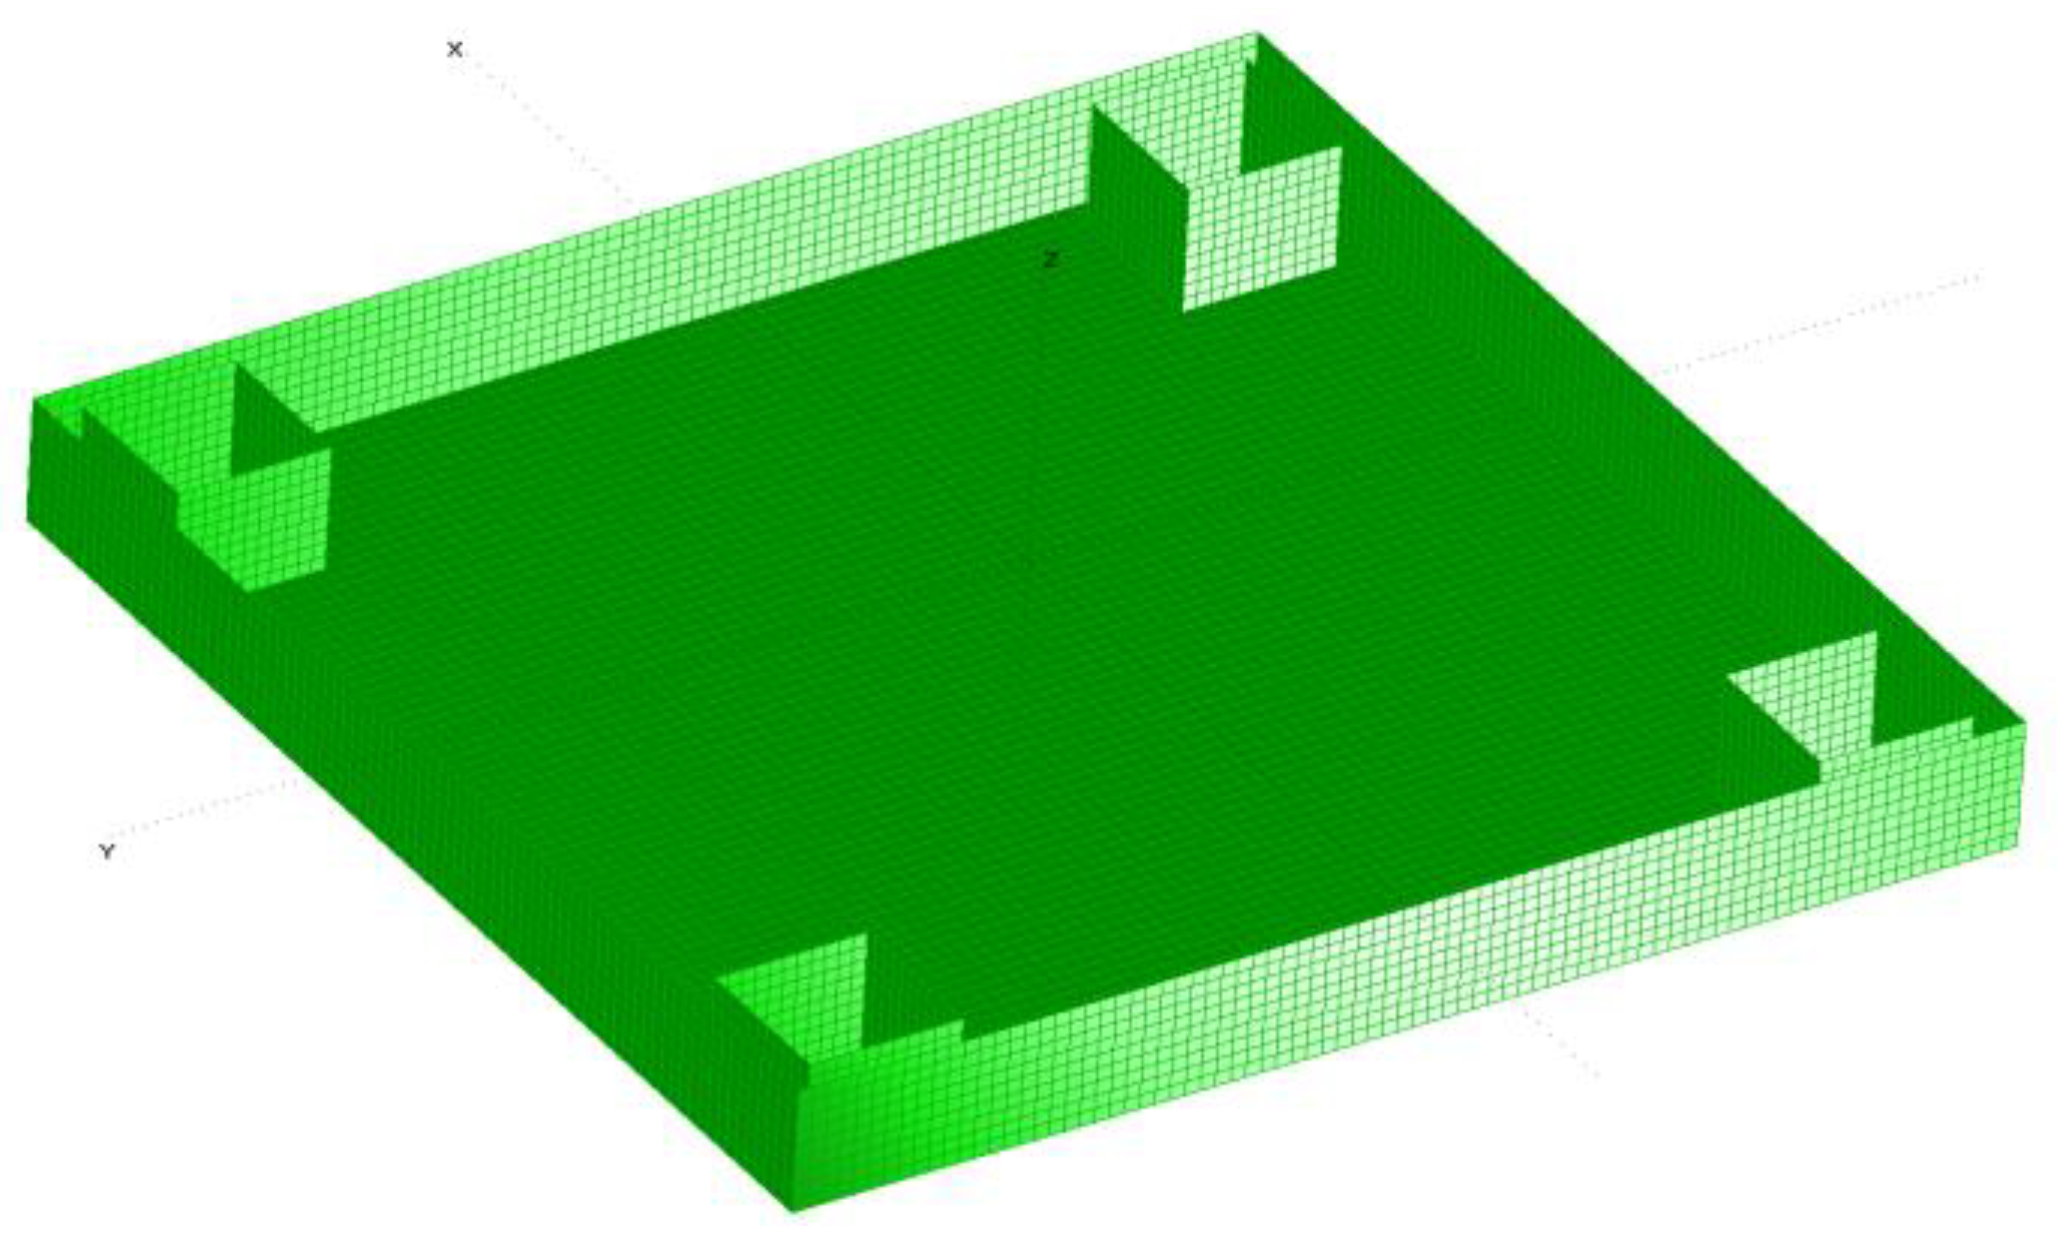
To utilize the geometric buoyant model, the WAMIT tool was interfaced with MultiSurf to compute the hydrodynamic loads exerted by water pressure on wet surfaces. The geometries are illustrated in Figure 3 and Figure 4 using the panel method. This study evaluates two representative platforms to highlight their unique characteristics. Figure 3 shows the first platform, a conventional barge type, which has been meshed with 8960 rectangular panels. The second platform, illustrated in Figure 4, is a barge platform with four corner OWCs. Each OWC measures 5 m × 5 m × 10 m and is meshed with 9840 rectangular panels for configurations with open moonpools and 10,240 rectangular panels for configurations with closed moonpools. The OWCs are positioned 1 m from the sidewalls. Detailed specifications of the barge platform and the four identical OWCs are provided in Table 3.
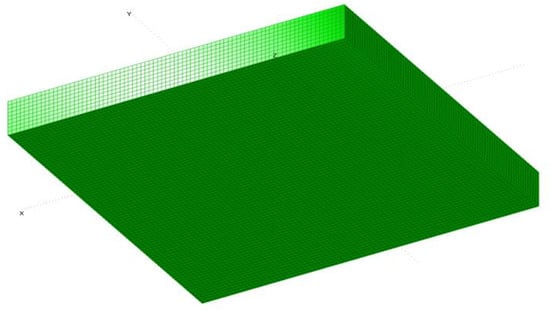
Figure 3.
Standard barge platform WAMIT panels.
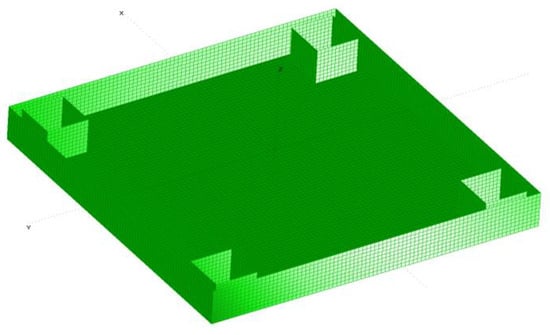
Figure 4.
Standard barge platform equipped with four open moonpools, modeled using WAMIT panels.
Table 3.
Features of the standard barge and the four OWC-based barge platforms [45].
4.2. Advanced Hydrostatic and Hydrodynamic Computations
Evaluating the hydrodynamic and hydrostatic parameters during the geometric design of the proposed quartet of OWC-based barge platforms is crucial. Therefore, detailed assessments of these characteristics were performed using the WAMIT numerical tool. Initially developed for the linear analysis of surface wave interactions with various floating and submerged structures, the WAMIT diffraction panel program facilitates these evaluations. Hydrostatic and hydrodynamic coefficients were calculated by integrating the MultiSurf file directly into WAMIT’s diffraction-radiation module, resulting in the generation of the matrices , , and . All hydrostatic data can be represented as surface integrals over the mean body wetted surface using the Gauss divergence theorem. WAMIT allows us to evaluate all three forms of volume under the assumption that the coordinates of the center of buoyancy are set to zero:
with the center of buoyancy parameters
The hydrostatic and gravitational restoring coefficients can be ascertained through a matrix that is configured with respect to their respective coordinates.
The matrix elements are given by
where is the body mass, and , , and are the center of gravity coordinates. Finally, the following equation describes the added mass and damping coefficients,
where is the imaginary unit, is the frequency, is the density, is the surface of integration, is the component of the normal vector, and is a function of a field component.
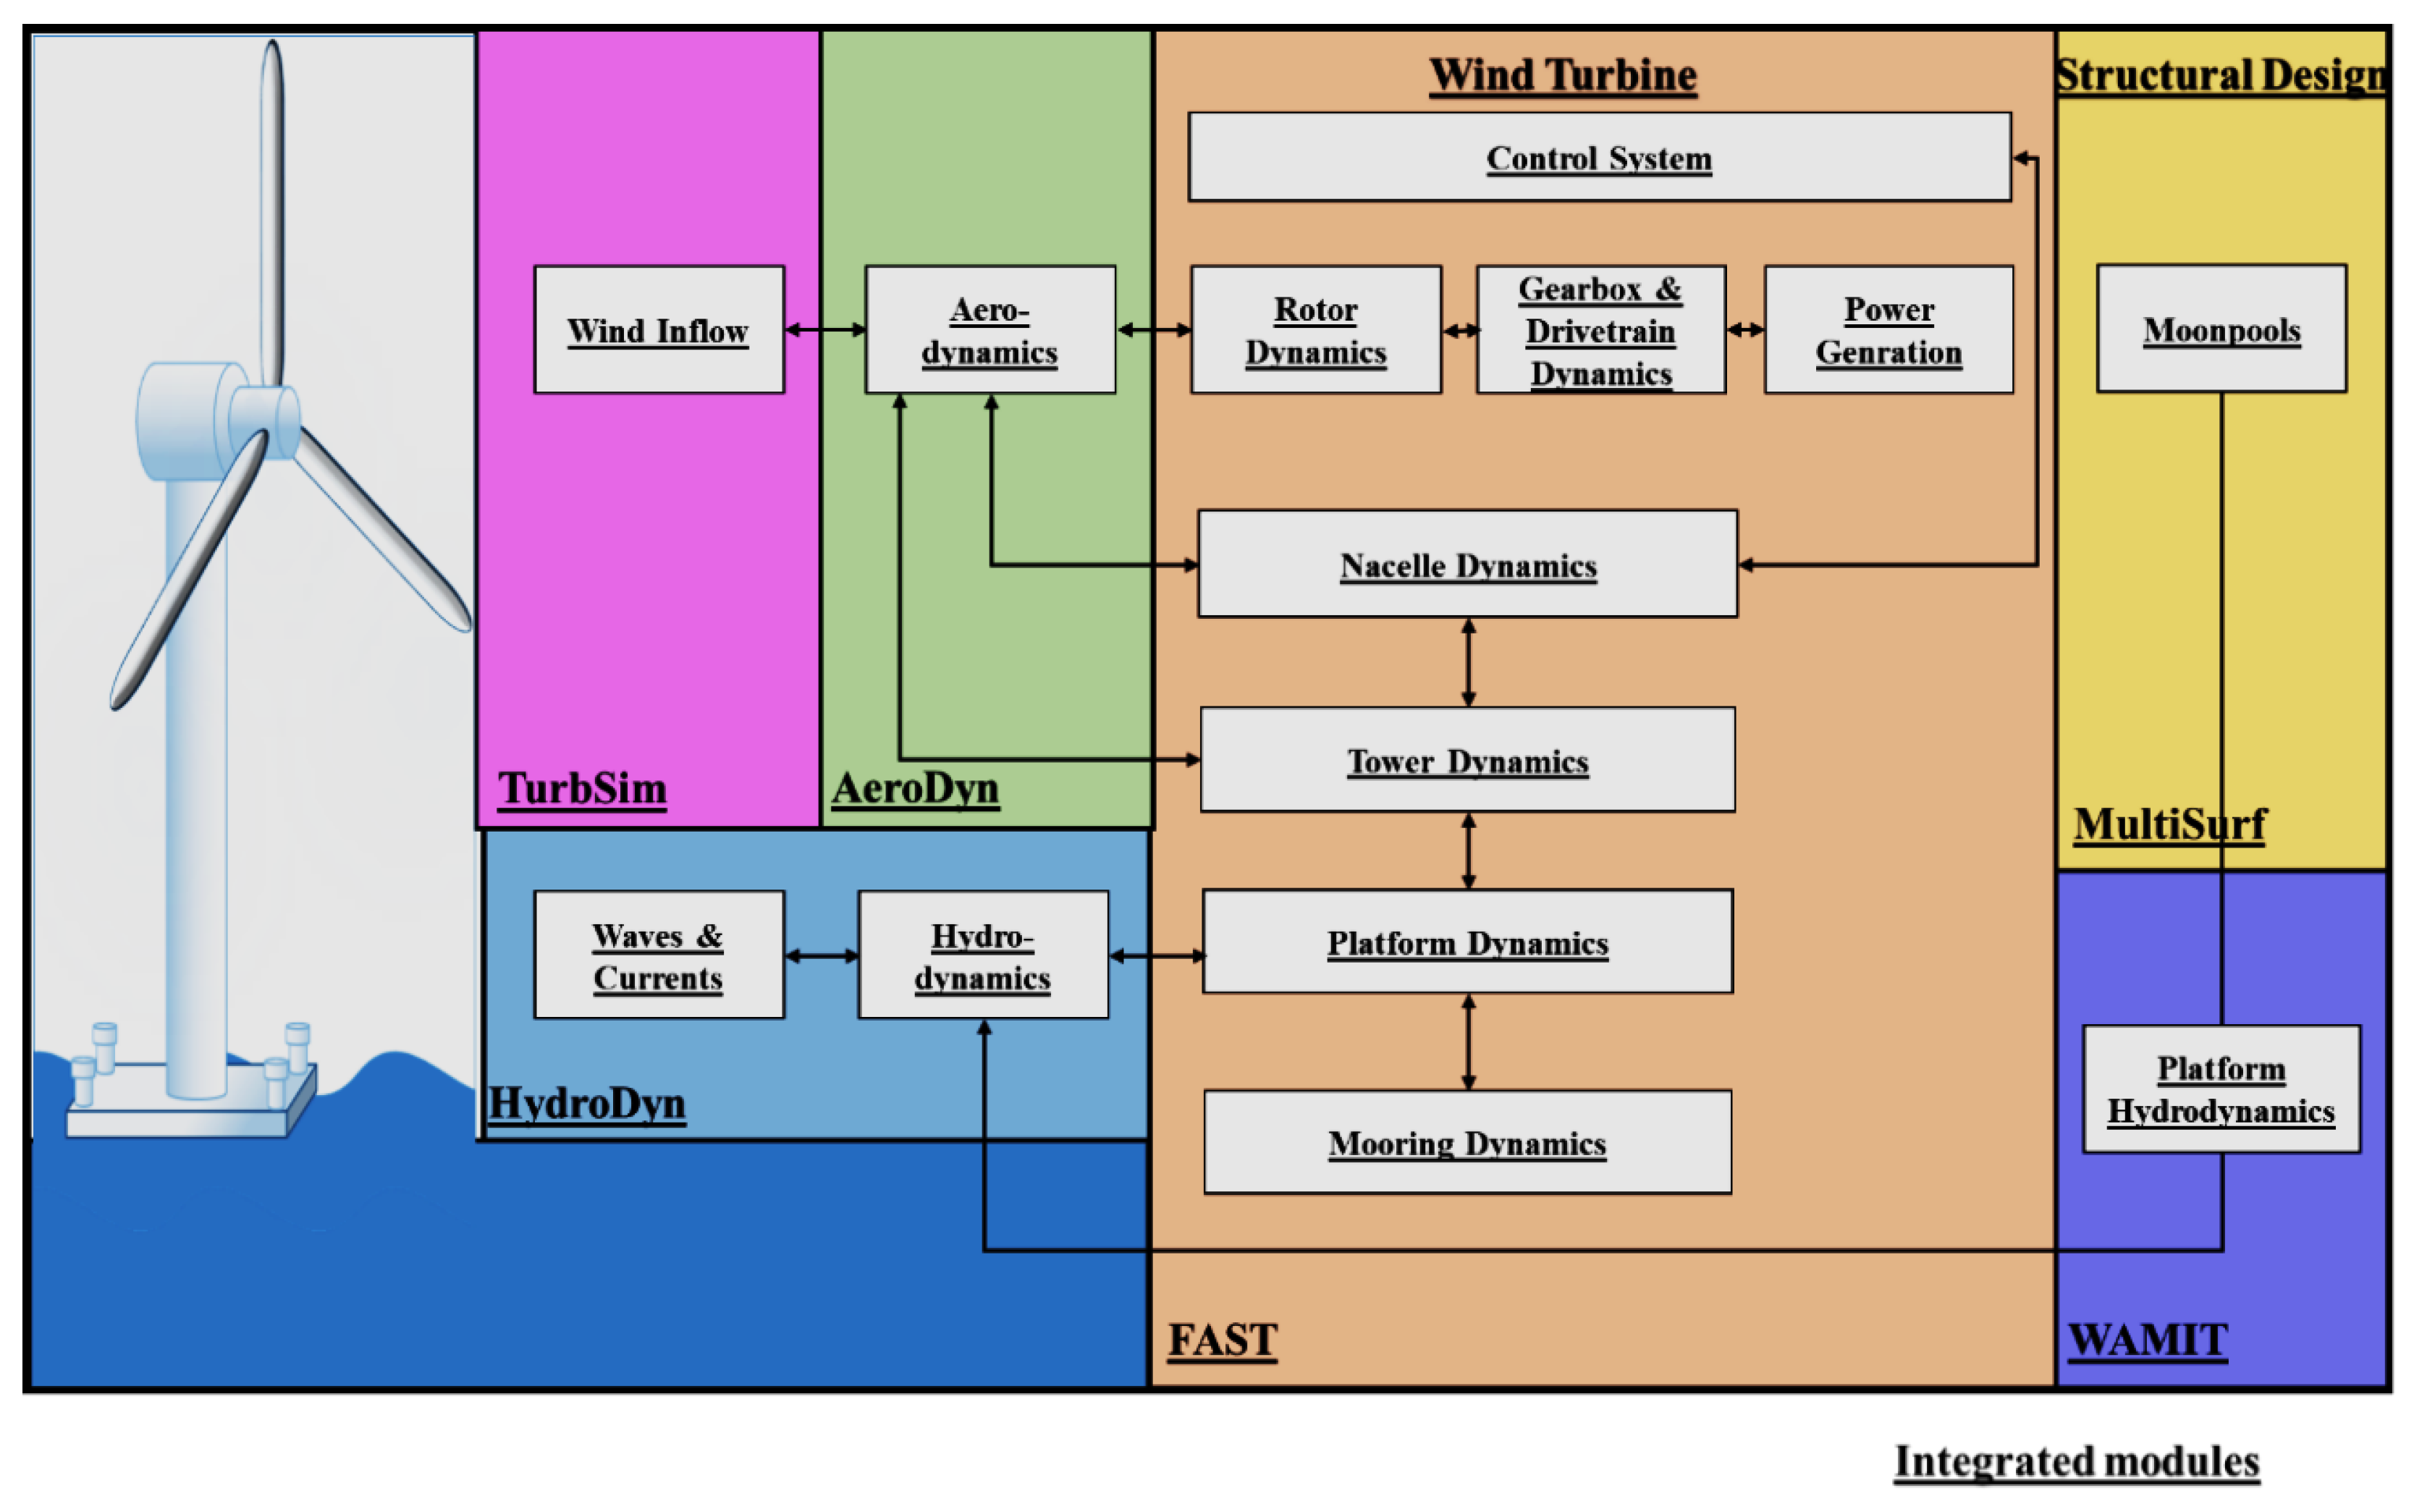
To incorporate the hydrodynamic data and additional mass attributes into OpenFAST, the WAMIT v9 software was utilized. Figure 5 elucidates the methodology for the integration of modules to facilitate the creation of aero-hydro-servo-elastic simulations.

Figure 5.
Integration of essential modules for the simulation of aero-hydro-servo-elastic dynamics.
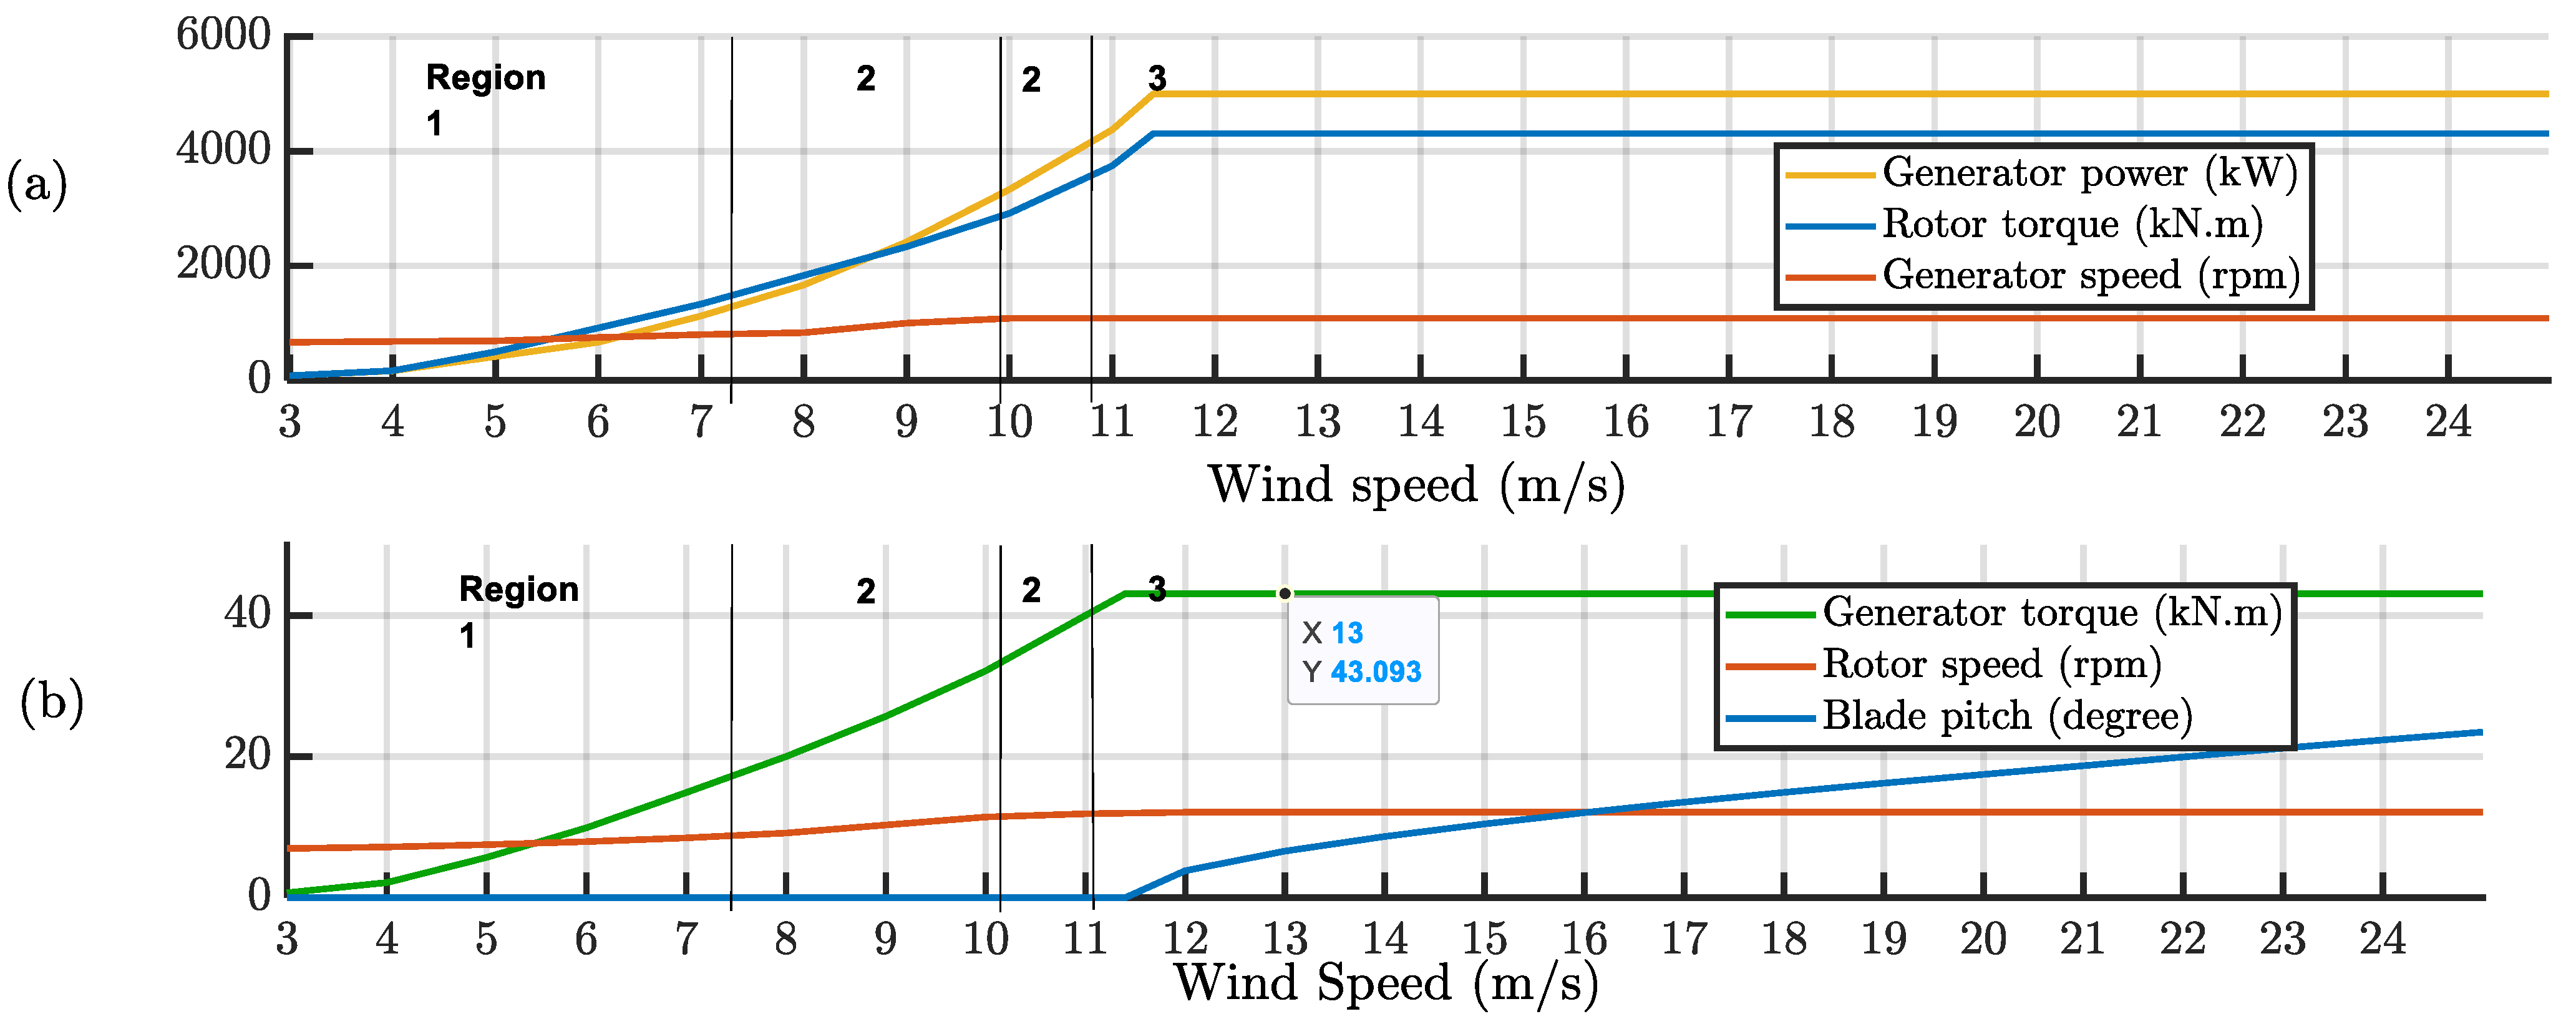
The generator torque is defined as a tabular function of the filtered generator speed, covering five control regions: 1, 2a, 2b, and 3. This methodology conforms to the specifications established for the National Renewable Energy Laboratory (NREL) standard 5 MW wind turbine, as illustrated in Figure 6.

Figure 6.
(a) Power-versus-speed and (b) torque-versus-speed response of the variable-speed controller.
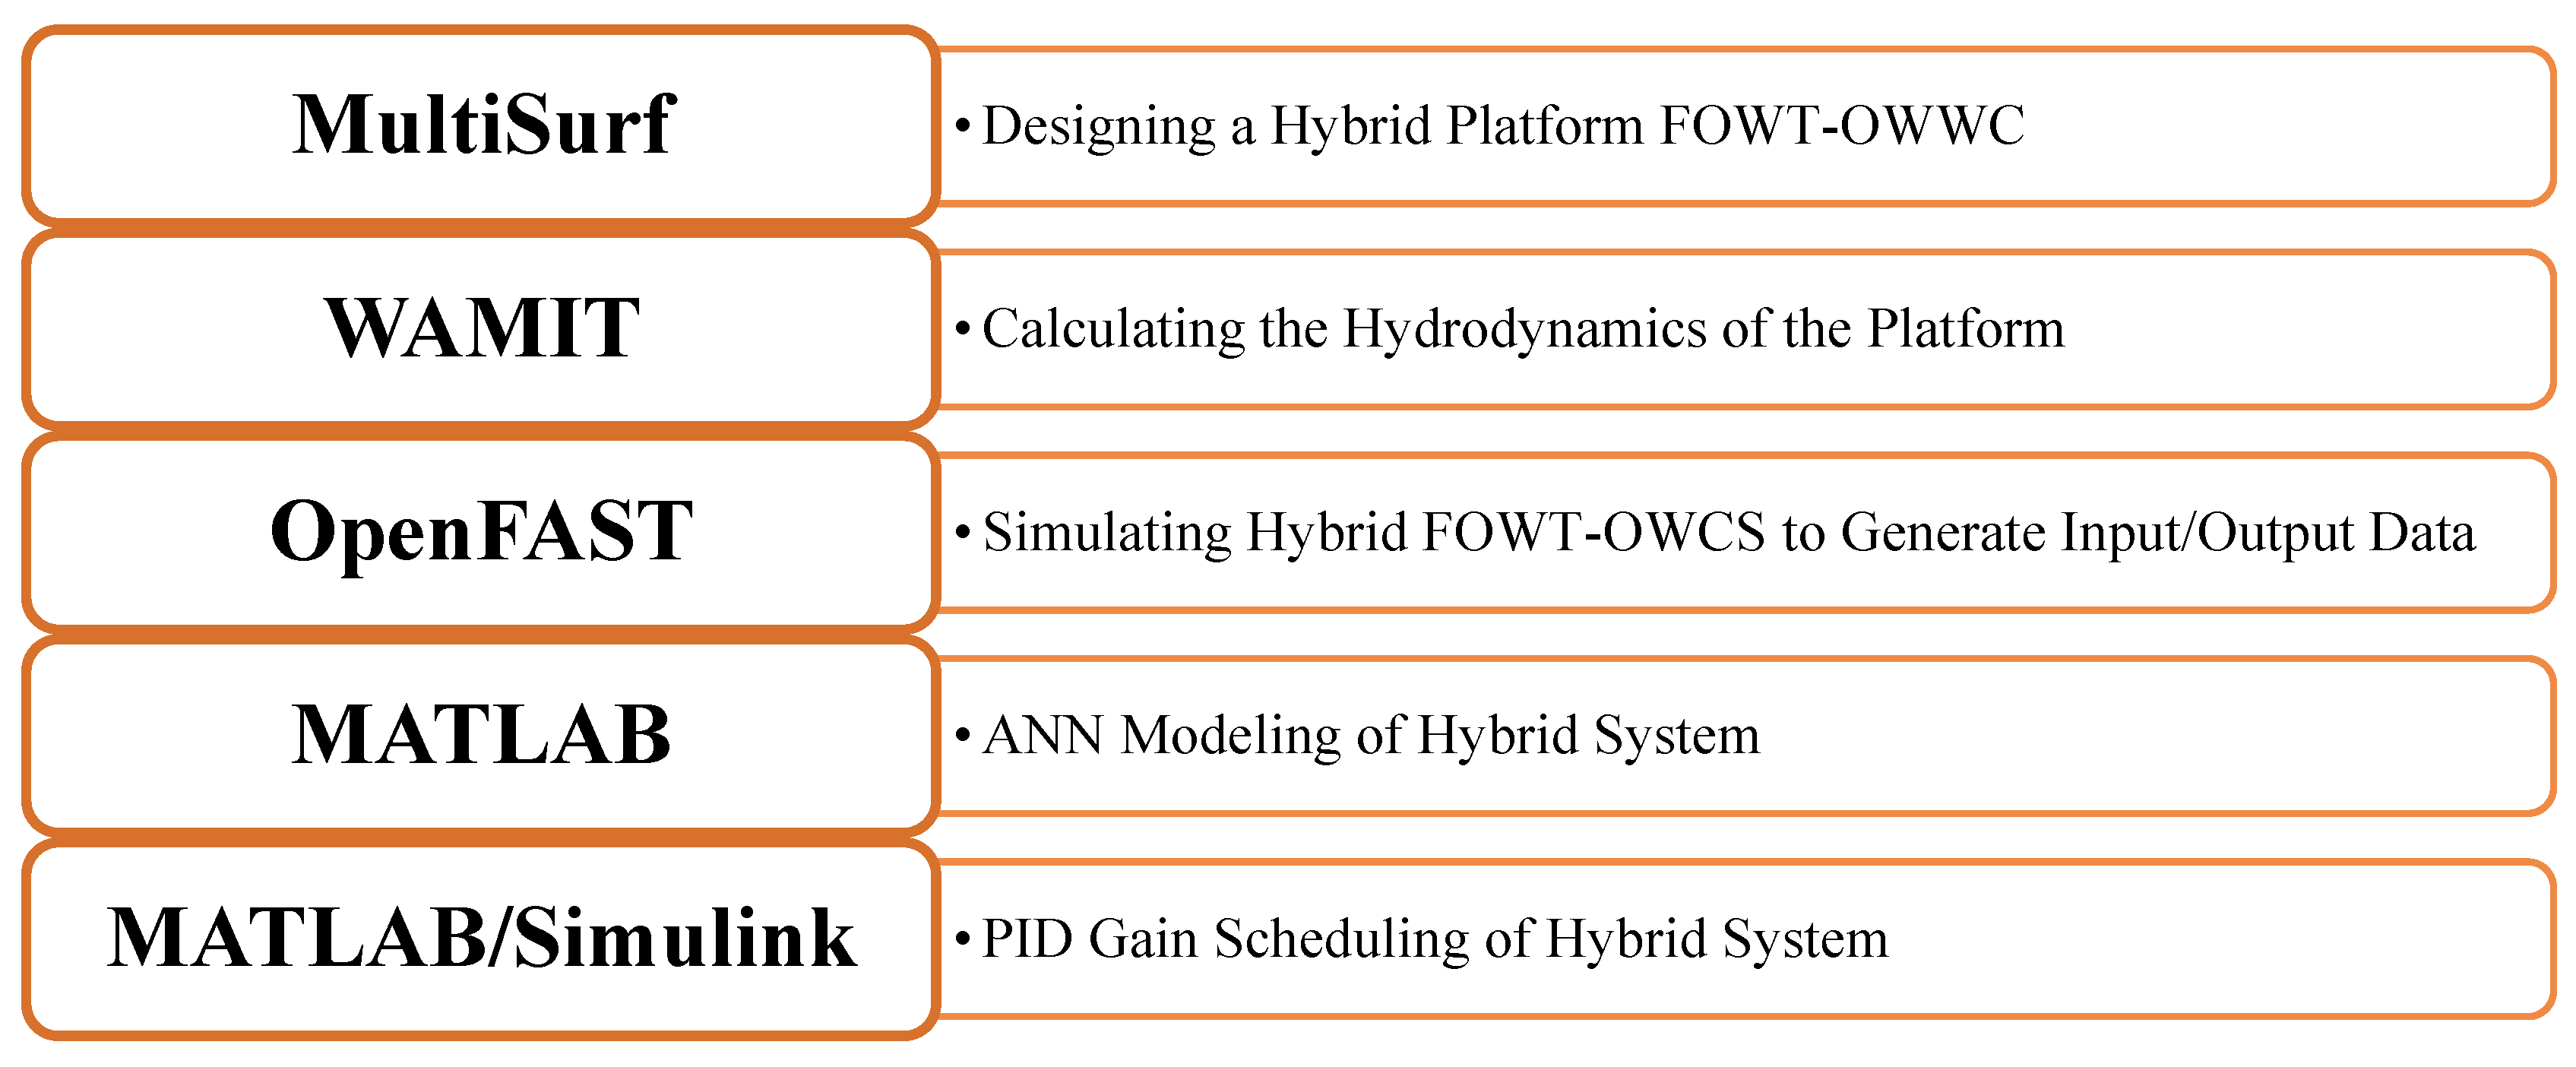
The framework for data collection, simulation, and network development is illustrated in the flow diagram in Figure 7. As depicted in the flowchart, five steps are utilized to establish the modeling and control of the hybrid framework.

Figure 7.
Overview of computational tools and their applications for the design and analysis of a hybrid FOWT-OWC system.
4.3. Advanced Deep Learning-Based Hybrid Modeling for the Hybrid System
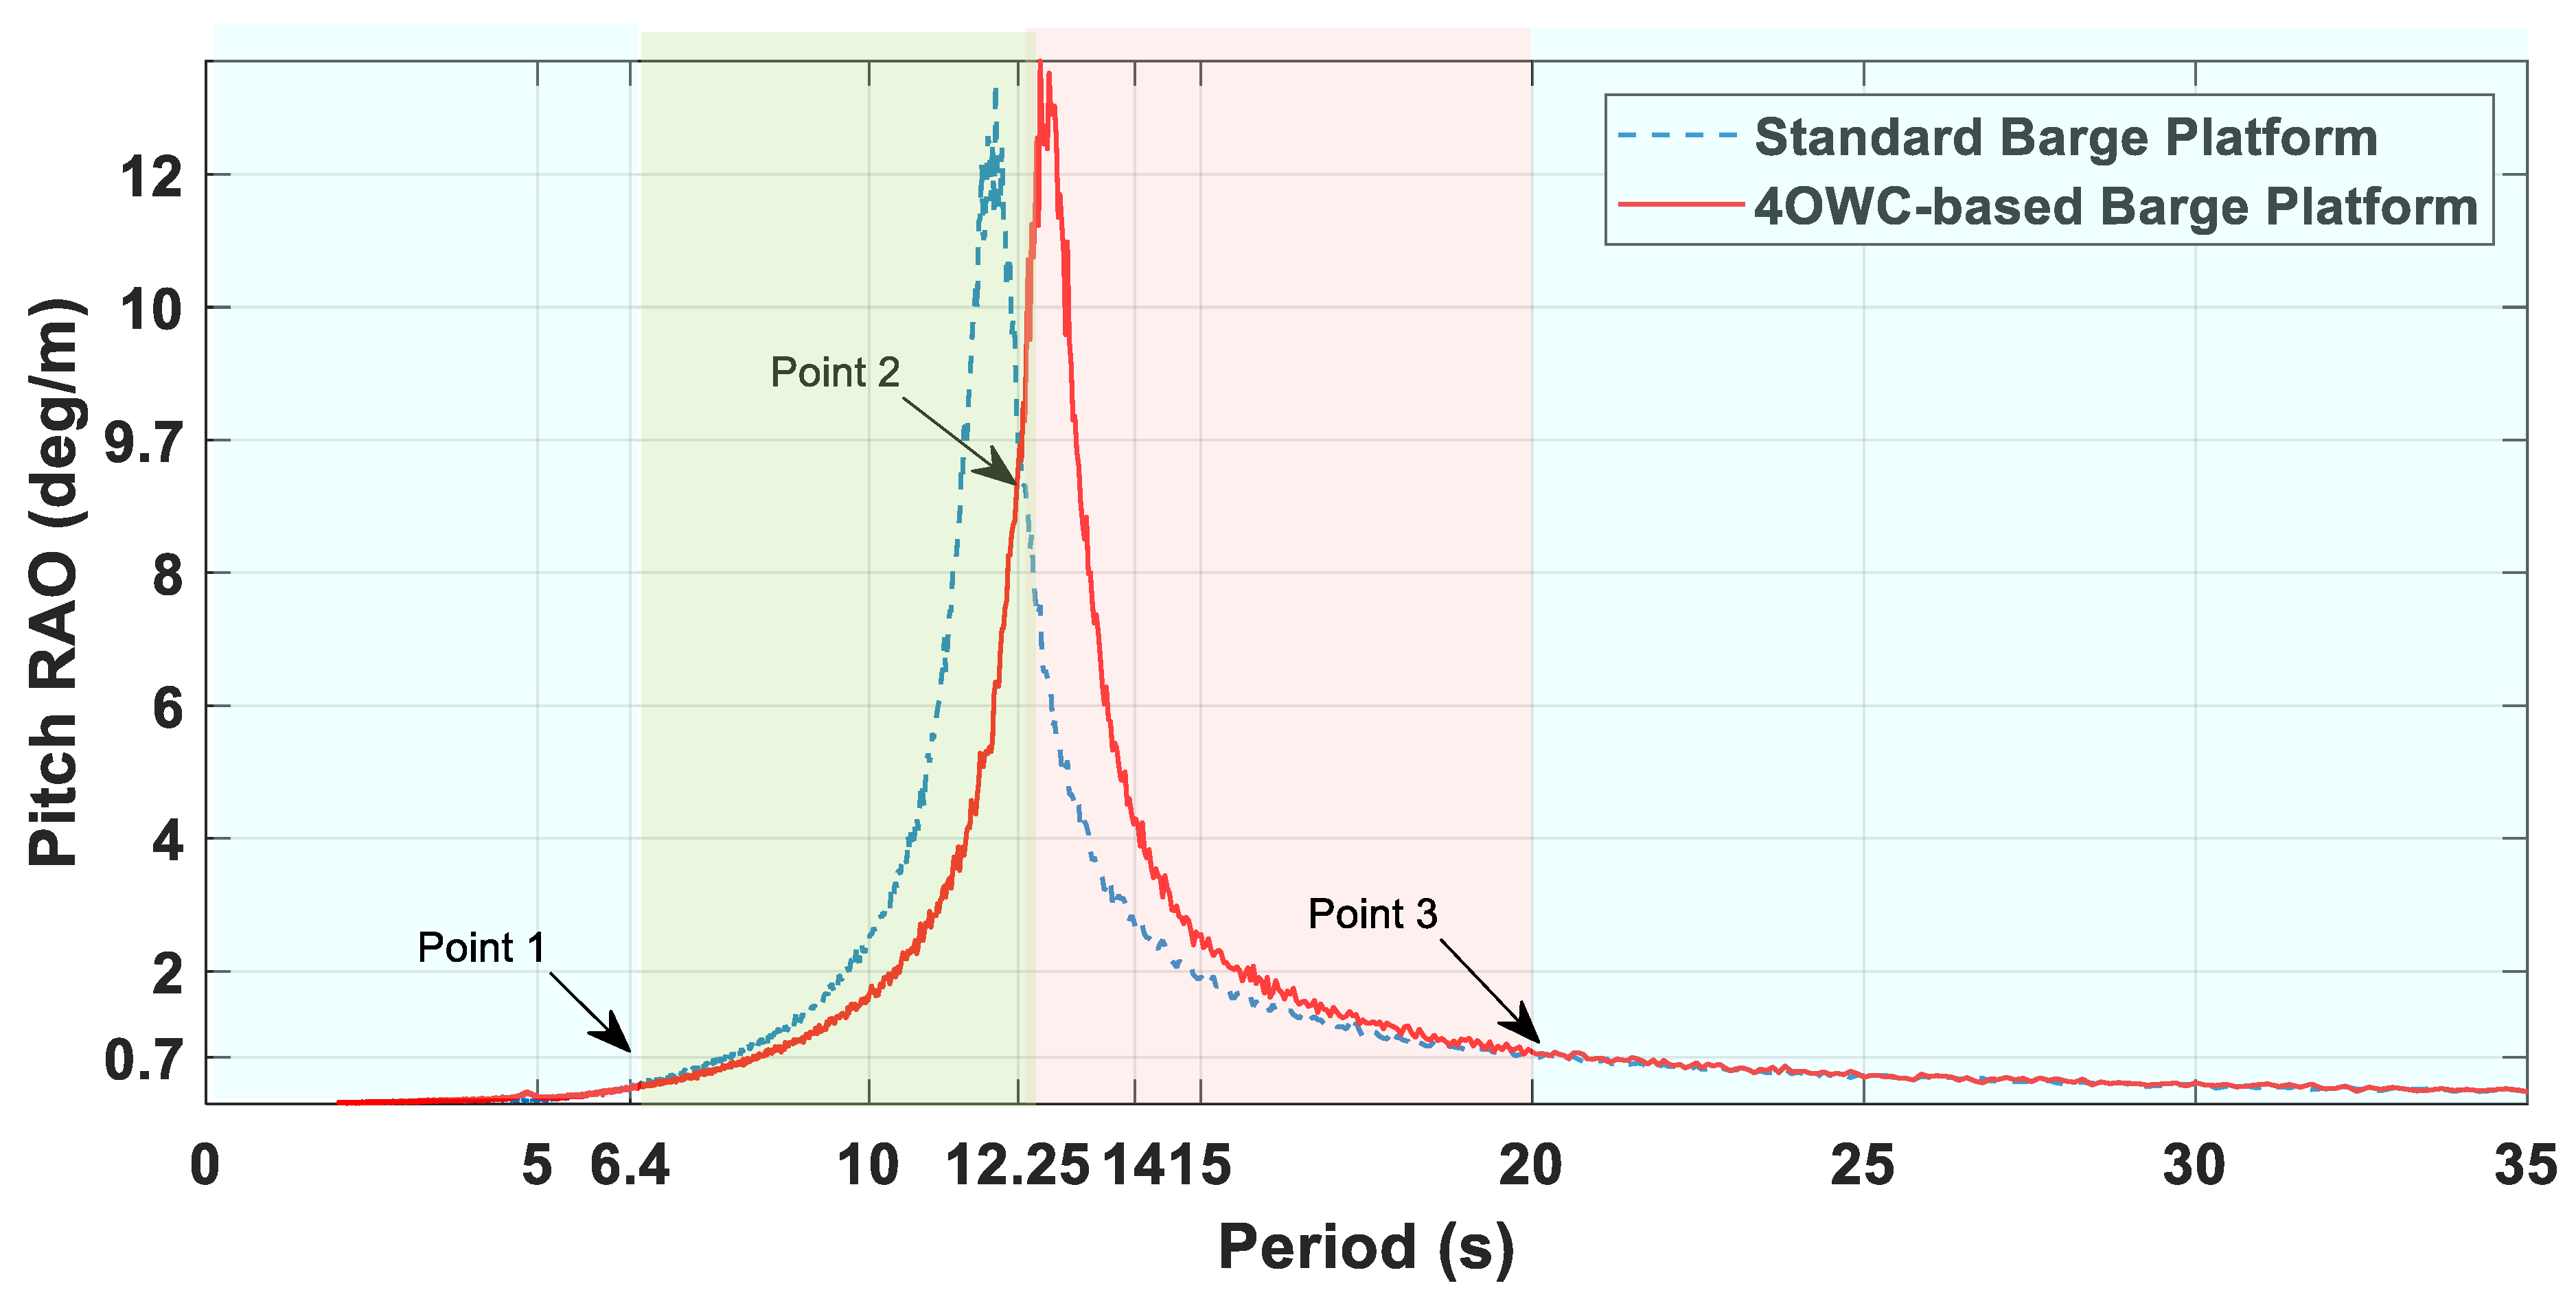
OpenFAST was used multiple times to generate datasets for developing models based on Response Amplitude Operators (RAOs), as depicted in Figure 8. There are four recurrent ANN models that were developed. Each network comprises an input layer, ten hidden layers with ten fully connected neurons each, and an output layer with two neurons for estimating tower fore-aft displacement and platform pitch.

Figure 8.
RAOs of a standard barge platform and 4 OWC-based barge platform pitch.
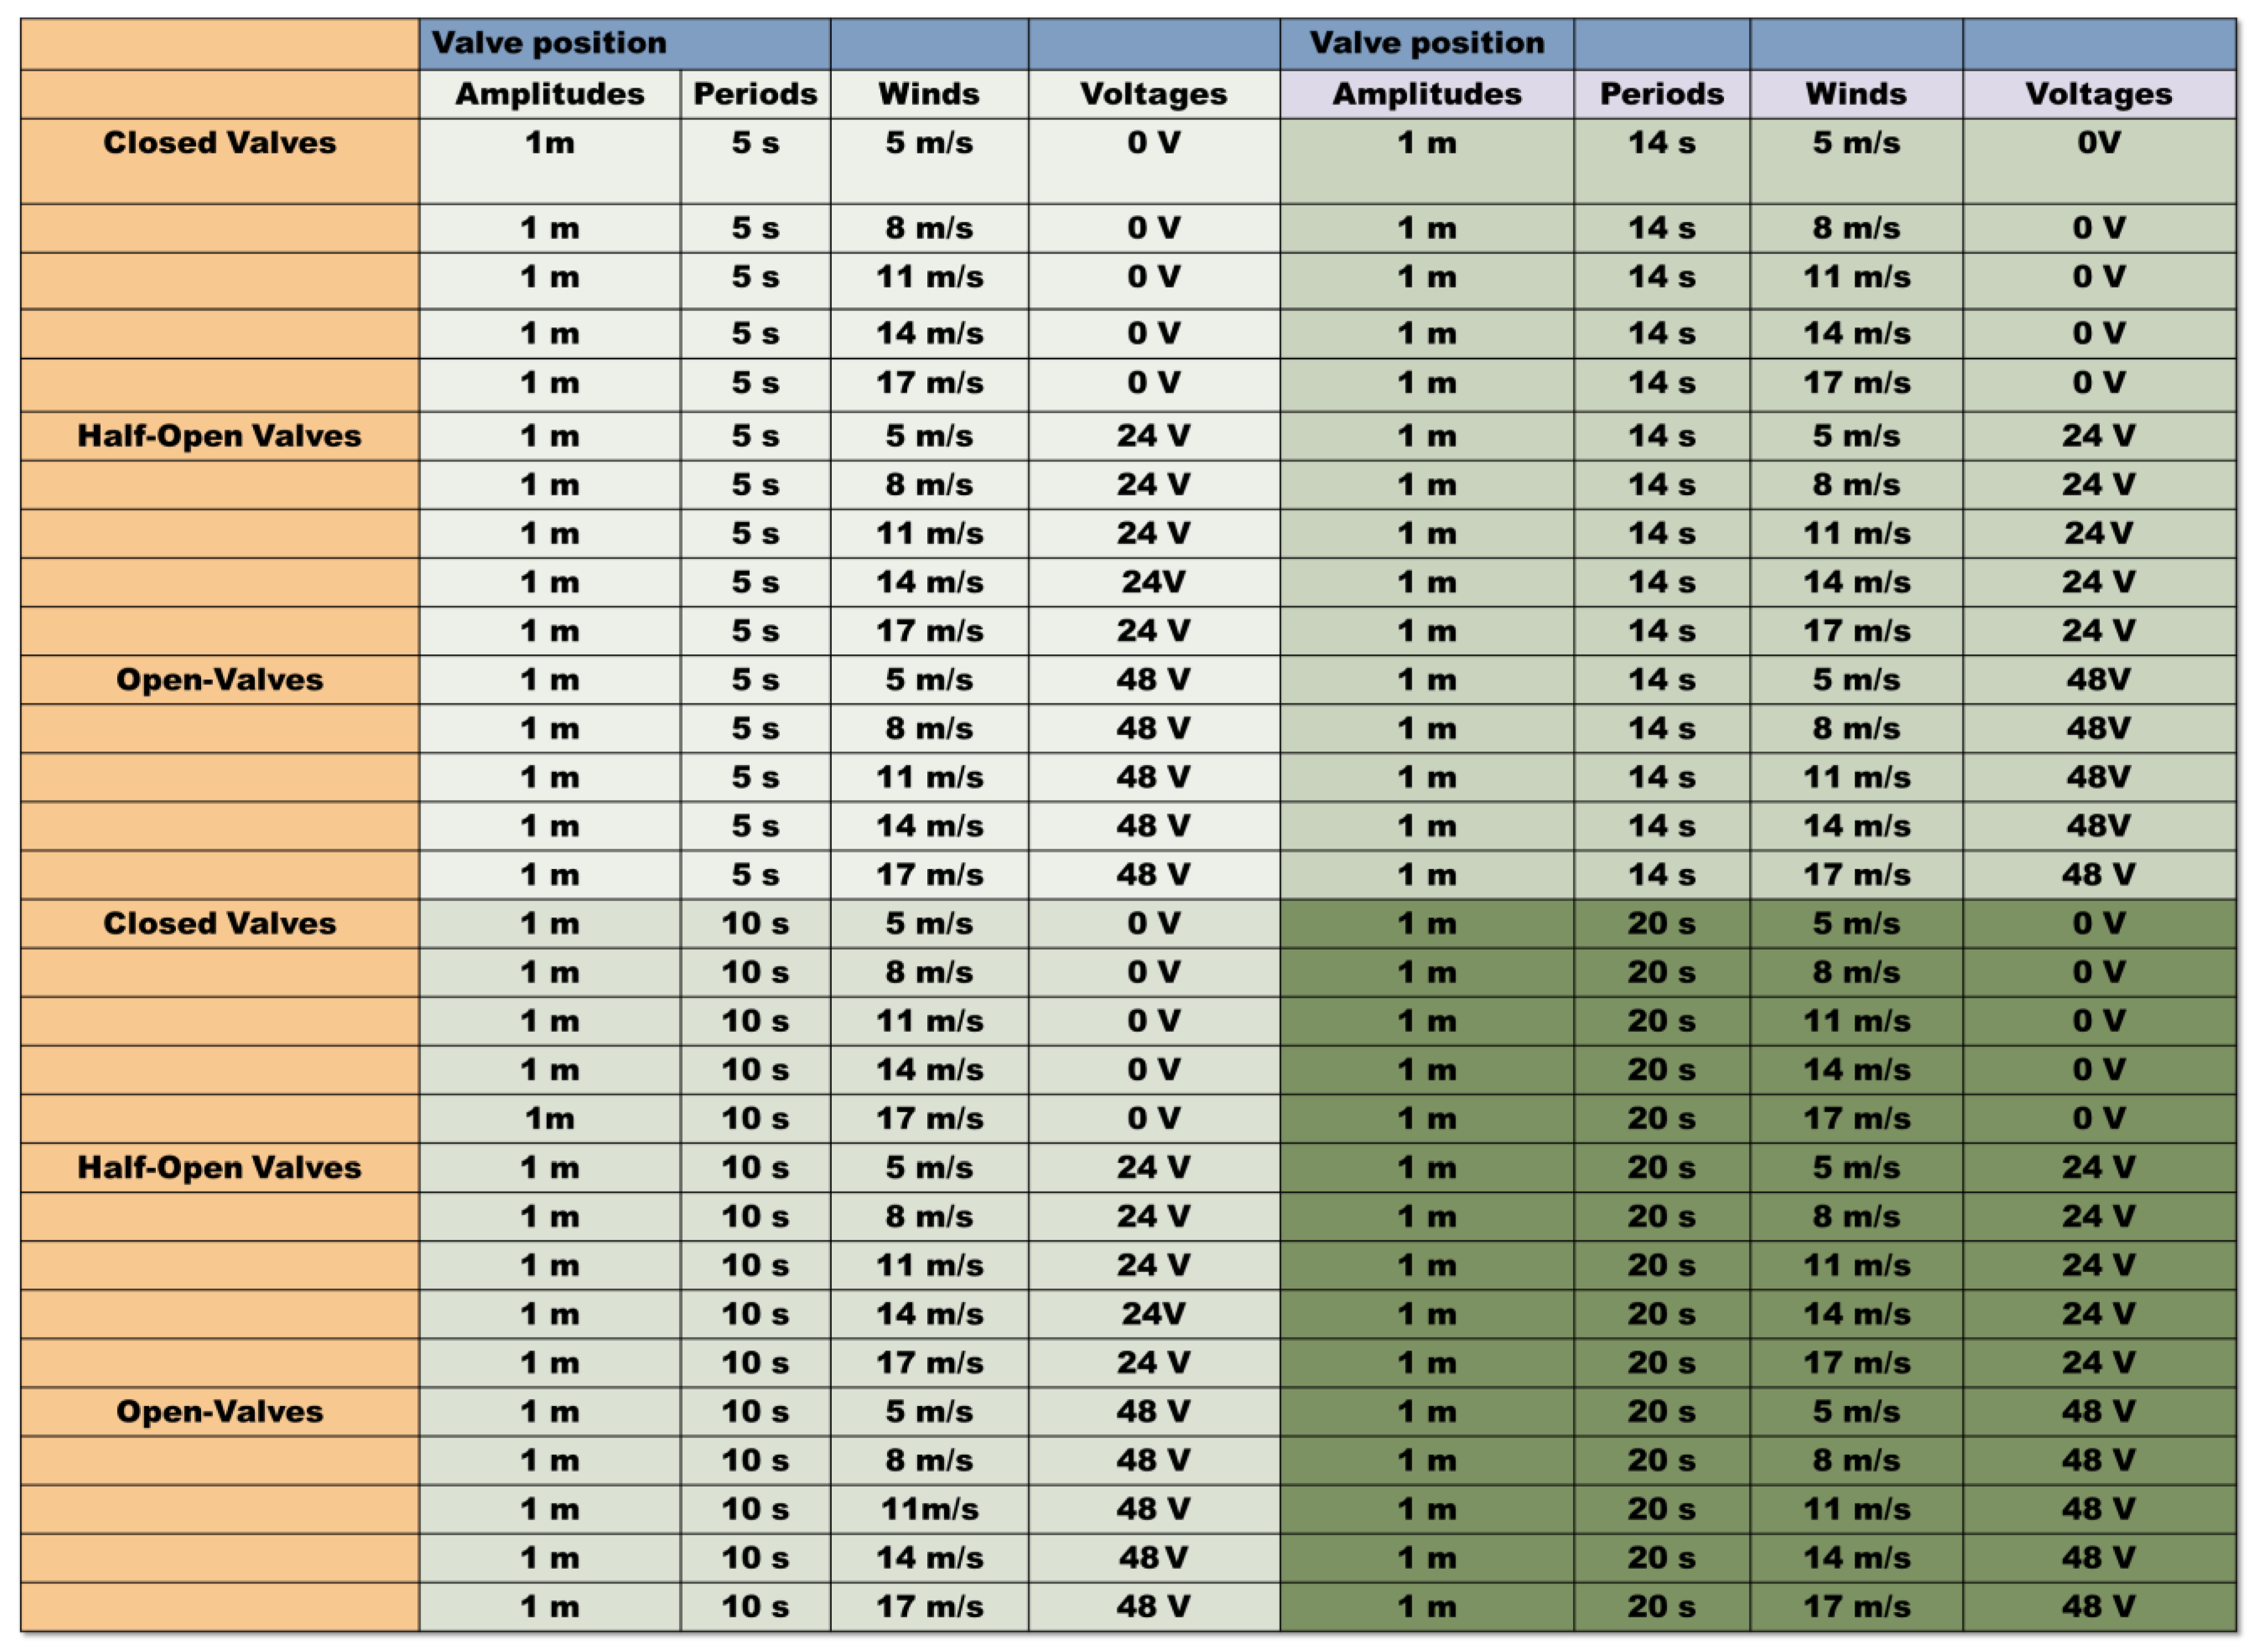
A visual representation of the dataset is shown in Figure 9. The process to determine the optimal number of hidden layers and neurons involved starting with minimal numbers and incrementally increasing them during the training of new network architectures.

Figure 9.
Comprehensive dataset collected from FAST-NERL software for the training.
The outputs can be defined as follows:
where the output of each node can be defined as
where is the input vector, is the wave elevation, denotes wind speed, and is the control input.
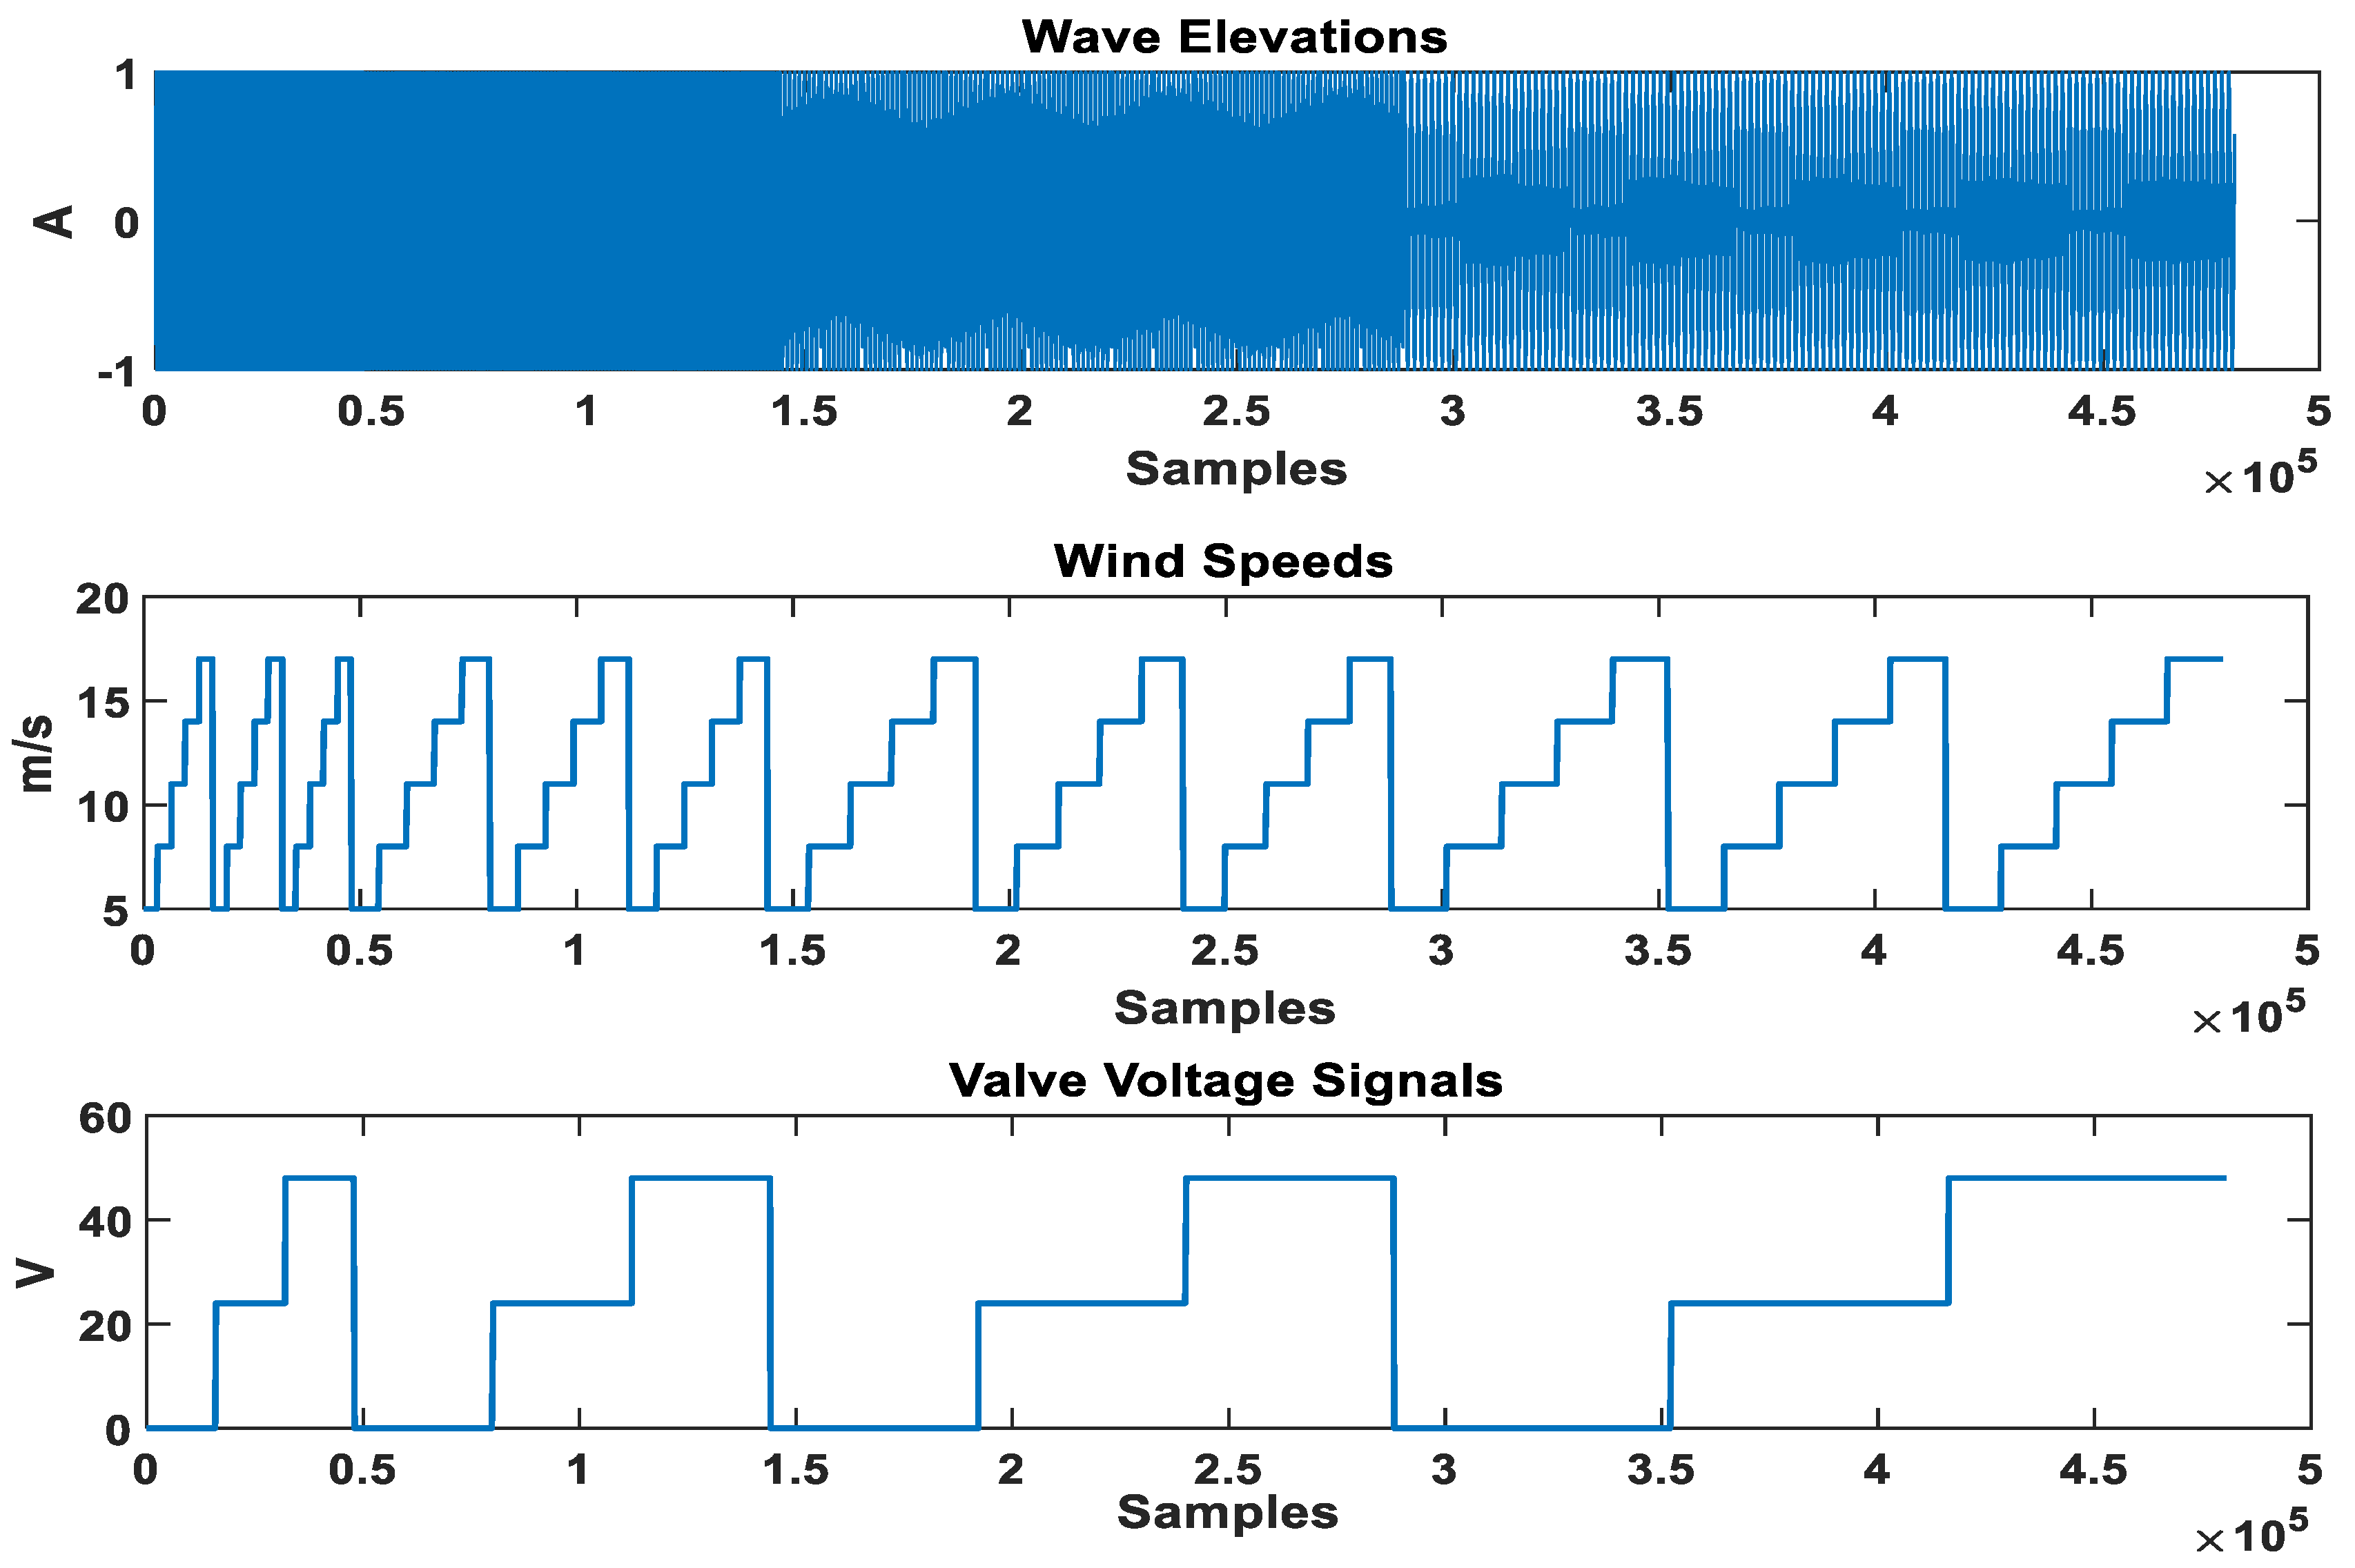
where and are the activation functions of the output and hidden layers, respectively. and are the top-tower displacement and platform pitch. For the training of datasets, the inputs considered are shown in Figure 10. The estimated outputs are shown in Figure 11 and Figure 12.

Figure 10.
Network inputs: wave elevations, wind speeds, and valve voltage signals.
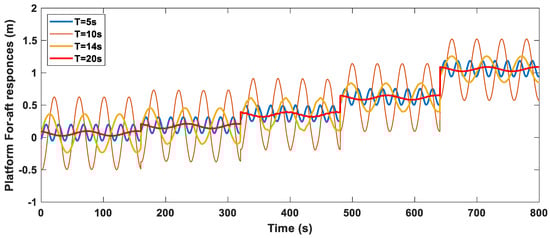
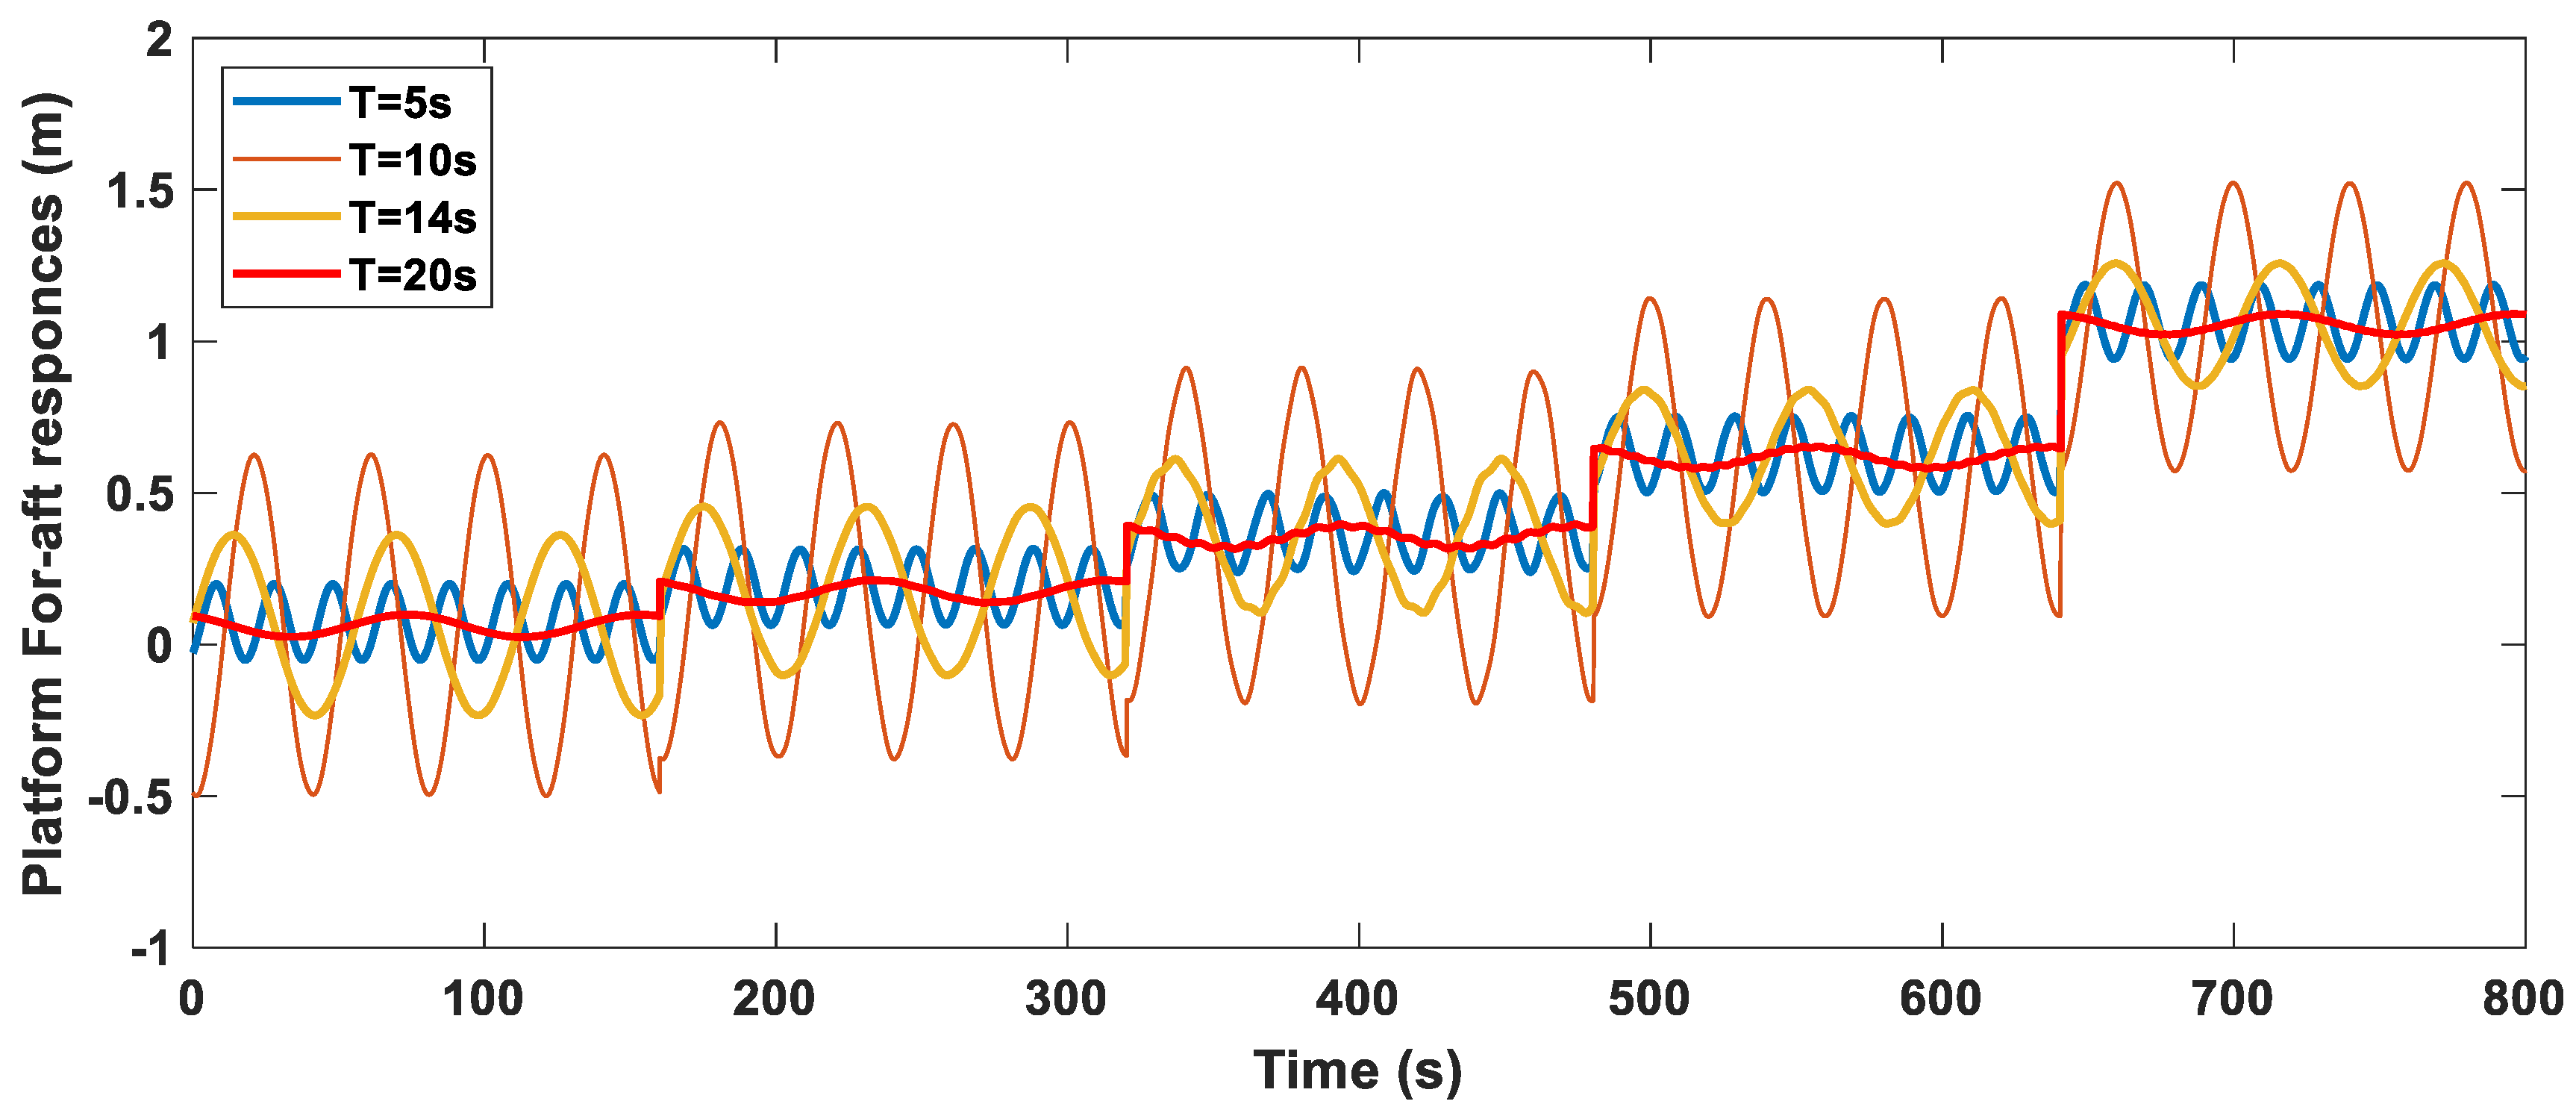
Figure 11.
OpenFAST output of the fore-aft displacement across various wave periods, each with varying wind speeds (5, 8, 11, 14, and 17 m/s) and wave height of 1 m.

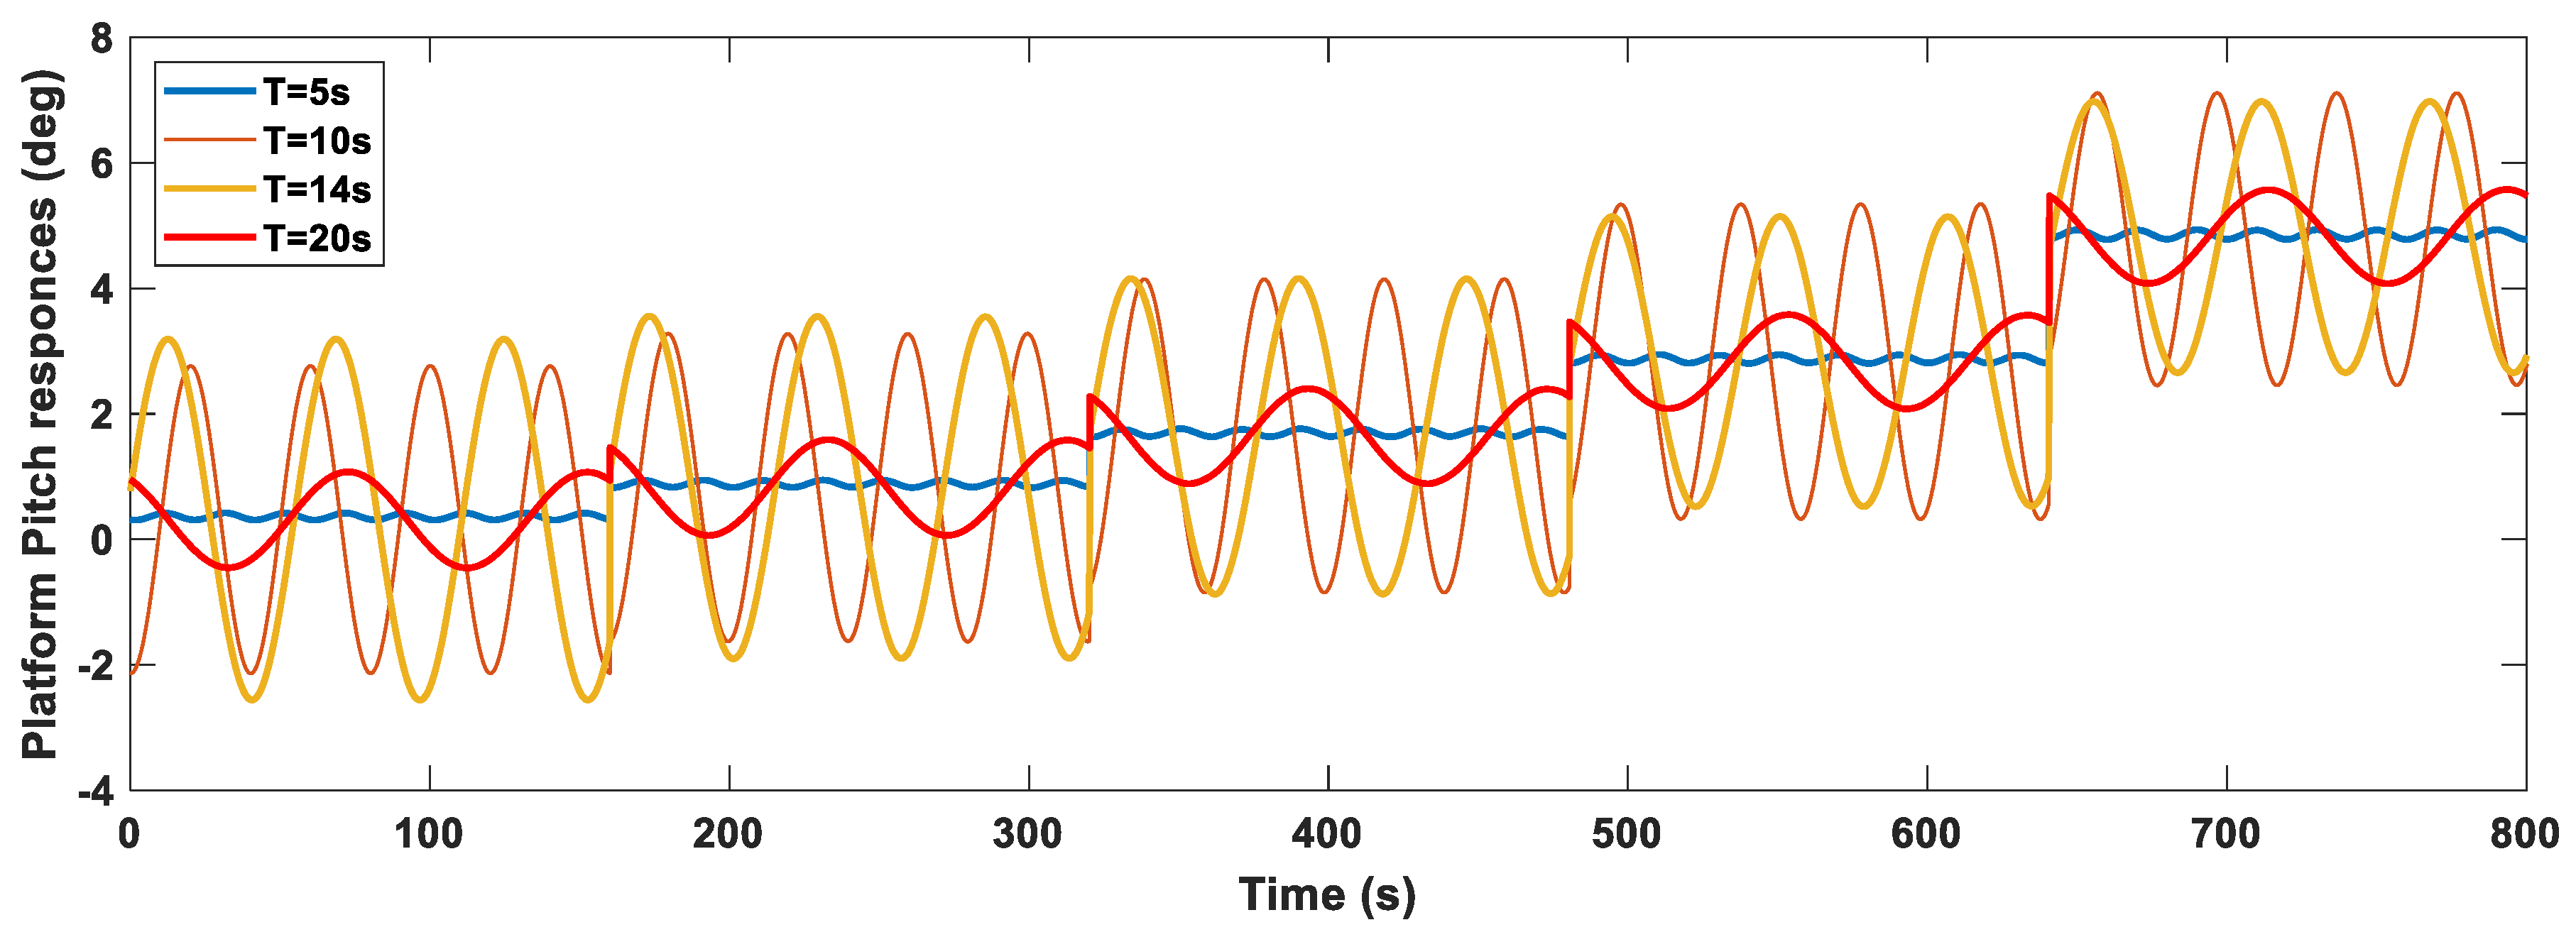
Figure 12.
Pitch responses across various wave periods, each with varying wind speeds (5, 8, 11, 14, and 17 m/s) and wave height of 1 m.
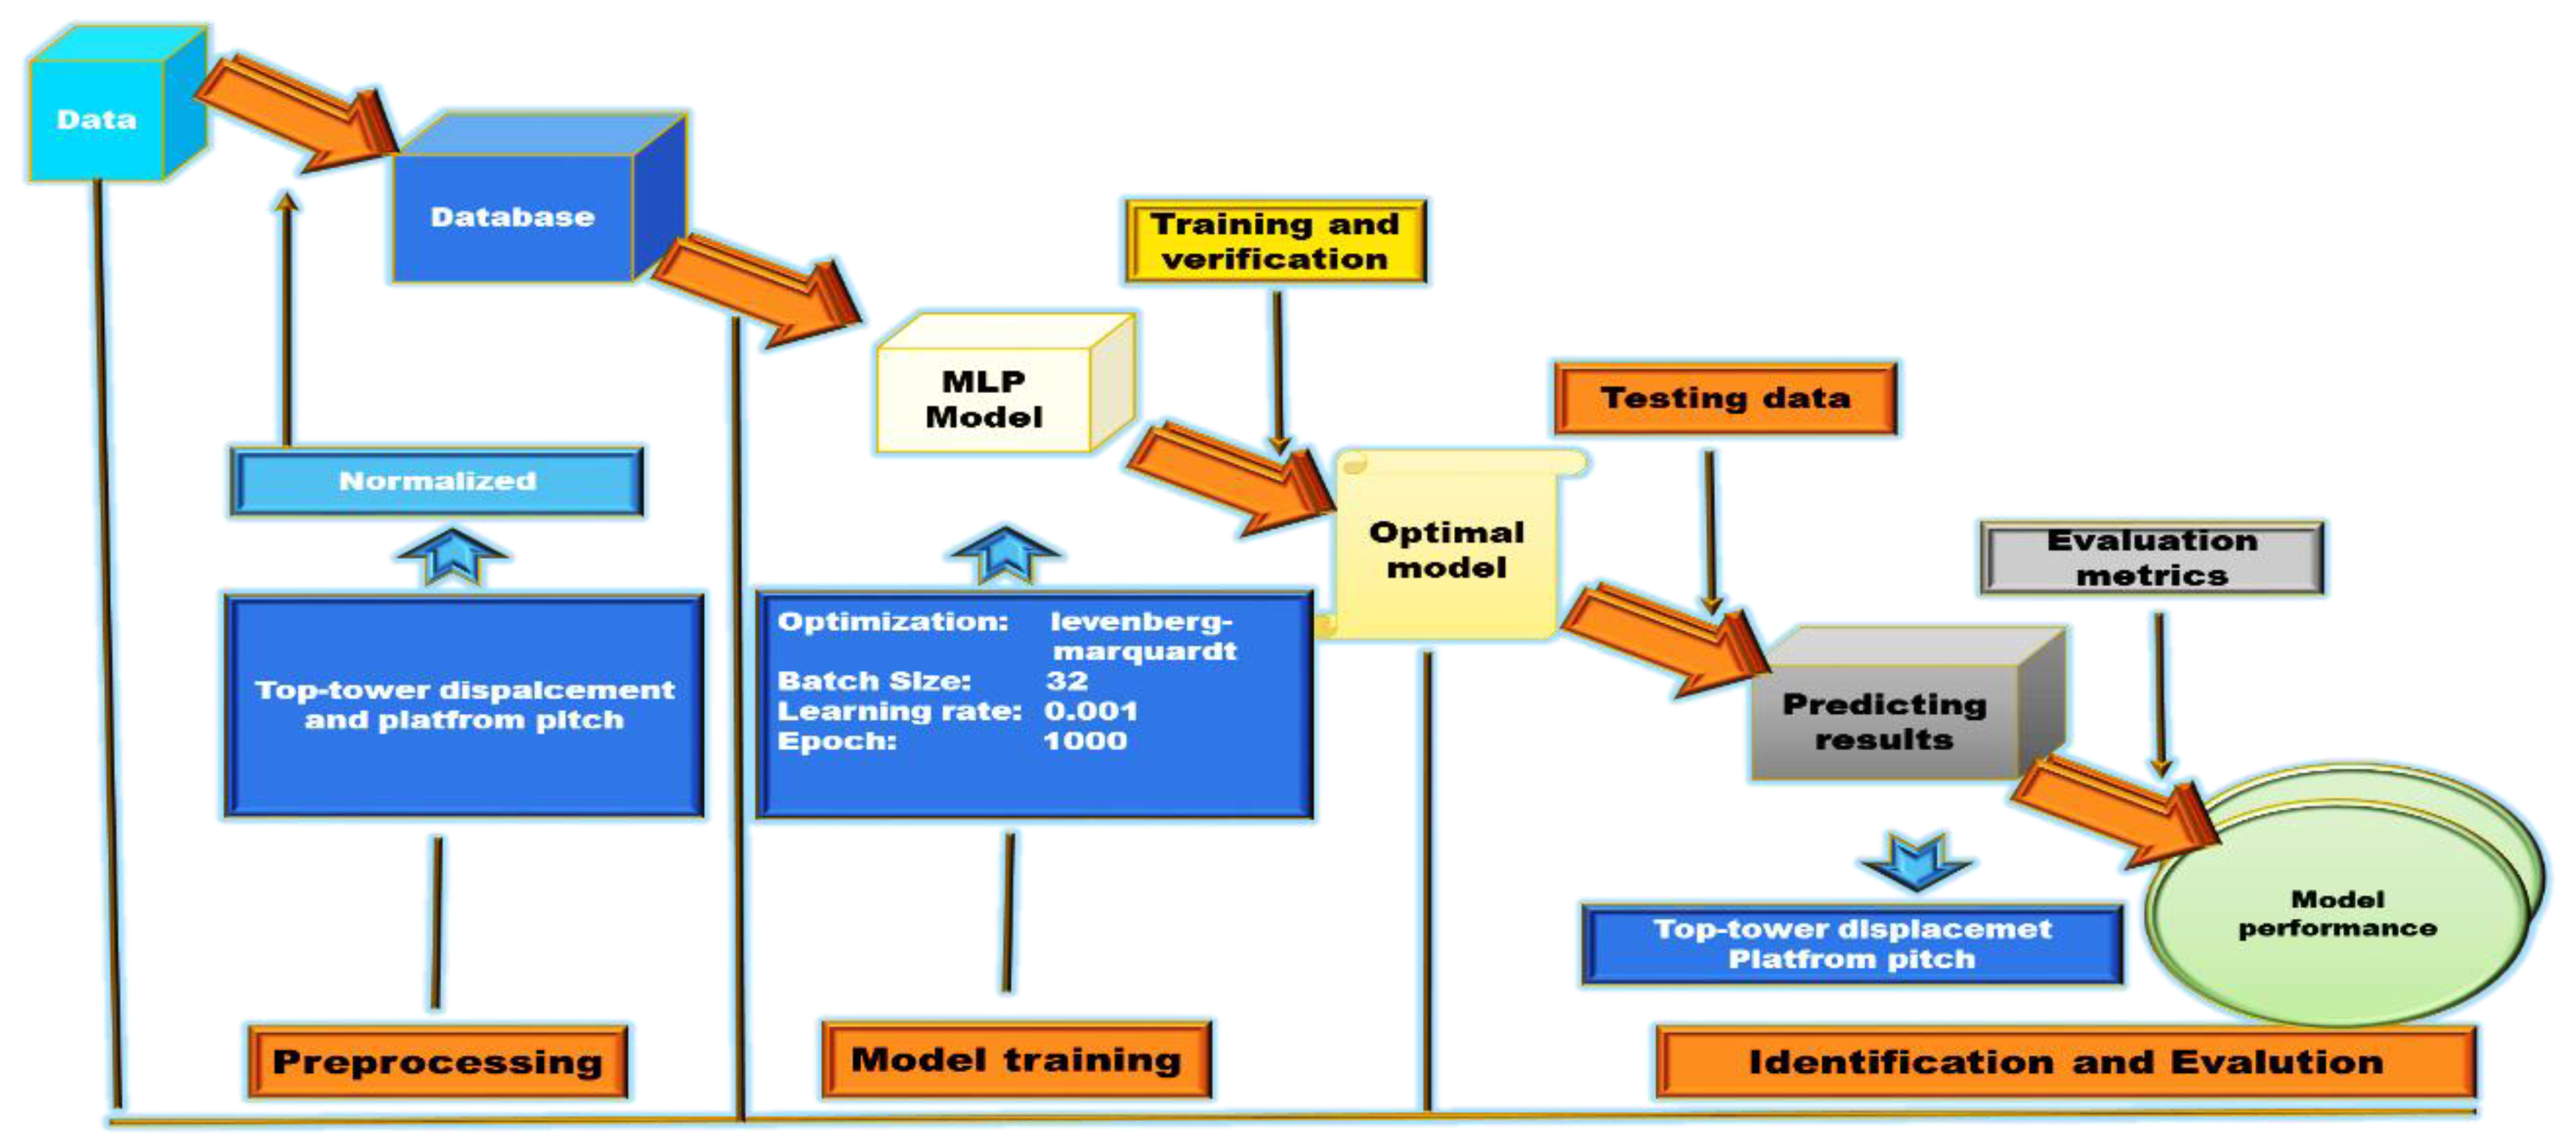
Figure 10 illustrates the input variables used in the training of the computational ANN models, including wave elevations, wind speeds, and valve voltage signals. Figure 11 shows the top tower fore-aft displacement responses of the FOWT-OWC system across various wave periods and wind speeds. It demonstrates how the ANN model can predict displacement under different environmental conditions. Figure 12 depicts the platform pitch responses of the FOWT-OWC system across various wave periods and wind speeds. The diagram shown in Figure 13 outlines the workflow for developing a machine-learning model using a Multilayer Perceptron (MLP) architecture. The process begins with a dataset that undergoes preprocessing, including normalization, to prepare for input into the MLP model. The database contains parameters for top-tower displacement and platform pitch. The model-training phase involves an optimization process using the Levenberg–Marquardt algorithm. This was performed until the lowest Mean Squared Error (MSE) was achieved. Various hyper-parameters were tested, including learning rates (0.01, 0.001, 0.0001) and batch sizes (32, 64, 128), along with different configurations of hidden layers. A configuration with a learning rate of 0.001, a batch size of 32, and an optimal 10 hidden layers of neurons demonstrated effective results. The use of 10 hidden layers was chosen based on extensive empirical testing and optimization, demonstrating that this configuration provides the best trade-off between model complexity and performance, ensuring accurate predictions without overfitting.

Figure 13.
Model processing, training, identification, and evaluation.
This configuration balances computational efficiency and model performance, yielding the best outcomes in terms of prediction accuracy and system stability.
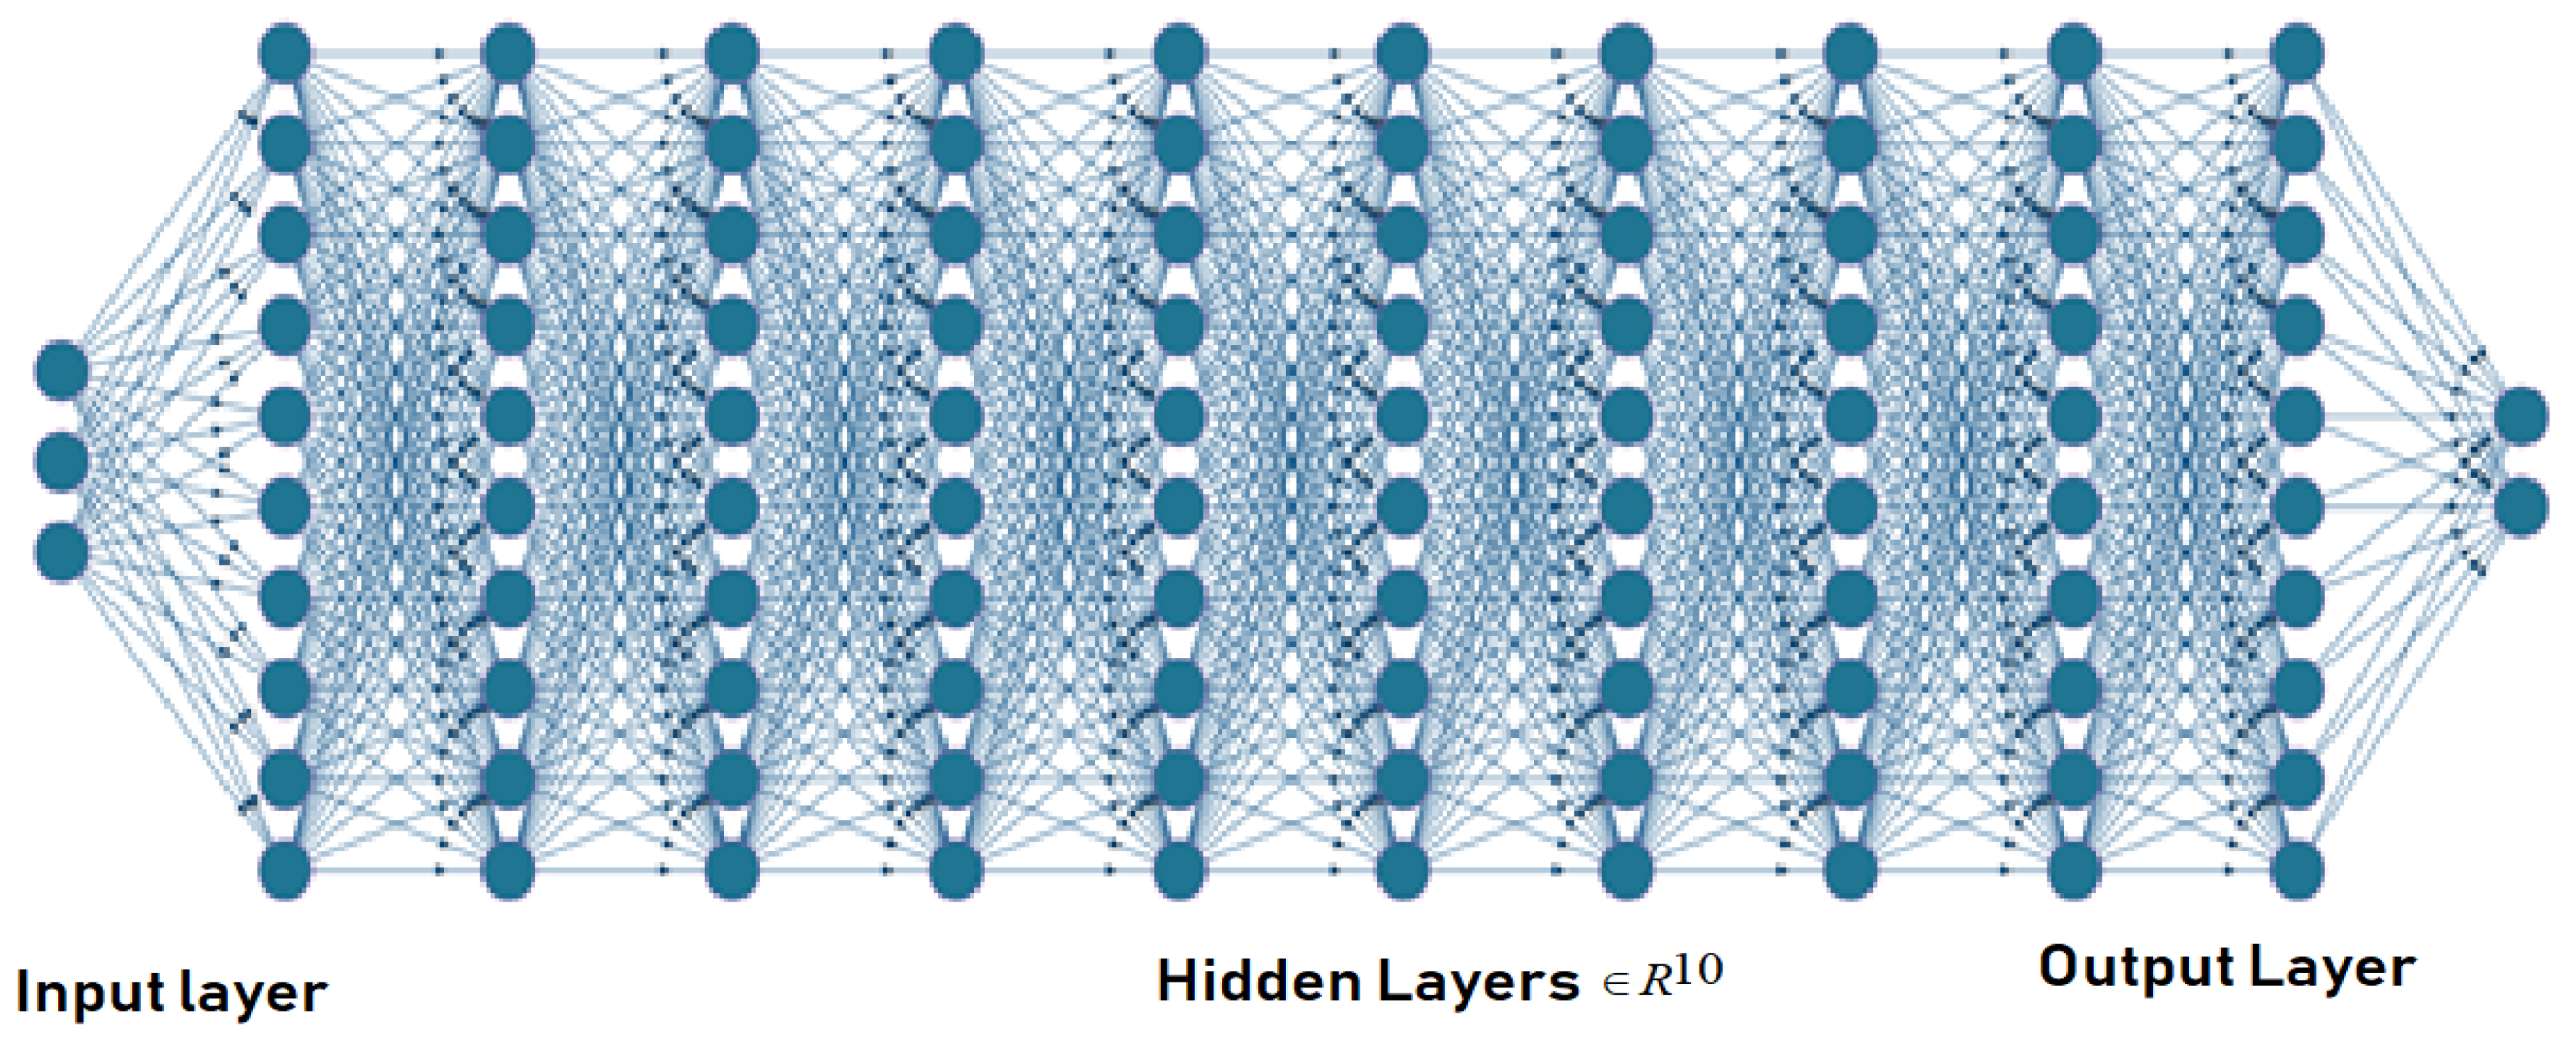
The architecture of an NN model is illustrated in Figure 14. Once training and verification were completed, the model was tested against a separate set of data to determine its accuracy and efficacy. The optimal model was then used to predict results, specifically the top-tower displacement and platform pitch. Evaluation metrics, such as accuracy, precision, and MSE, were applied to assess the model’s performance. The results were fed back into the model for further refinement, ensuring that the predictions aligned as closely as possible with actual measured values. This iterative process was designed to enhance the accuracy of the MLP model for reliable predictive analysis in practical applications.

Figure 14.
Architecture of a NN model with three inputs, ten hidden layers, and two outputs.
Several training functions were examined to train the network. The trainlm function, while requiring more memory, is often the fastest backpropagation method and is recommended as a primary supervised technique. The trainrp function employs resilient backpropagation (Rprop) to update weight and bias variables, mitigating the negative impacts of partial derivative magnitudes. Conjugate gradient algorithms, such as traincgb, initially follow the steepest descent direction and periodically reset the search direction. The traincgb function uses conjugate gradient backpropagation with Powell–Beale restarts to update weight and bias values.
The trainbr function applies Bayesian regularization with Levenberg–Marquardt optimization to update weight and bias variables, balancing squared errors and regularization terms for a generalizable network. The most effective results were achieved using Levenberg–Marquardt optimization techniques, as shown in Table 4.
Table 4.
Error graphs for validation.
4.4. Proposed Control Integration: PID Gain Scheduling Approach
Both platform pitch and tower top displacement rise significantly when exposed to high wind speeds. The control strategy following the development of the four estimated models for FOWT-OWCs incorporated PID gain scheduling across four networks, enhancing system responsiveness and adaptability. This method focuses on precise measurement and scaling of control variables, ensuring accurate input for the PID controllers and optimal system performance under various conditions. PID gain scheduling is a method that adaptively modifies controller gains according to the system’s current operational conditions. Its main objective is to reduce the discrepancy between a predefined setpoint (zero reference) and the actual output of the system, with a special emphasis on managing the platform pitch. This reduction is accomplished by perpetually fine-tuning the control valve signal, which is determined by the measured error. Consequently, PID controllers serve as a crucial stabilizing element, refining the system’s reaction to maintain compliance with specified performance criteria.
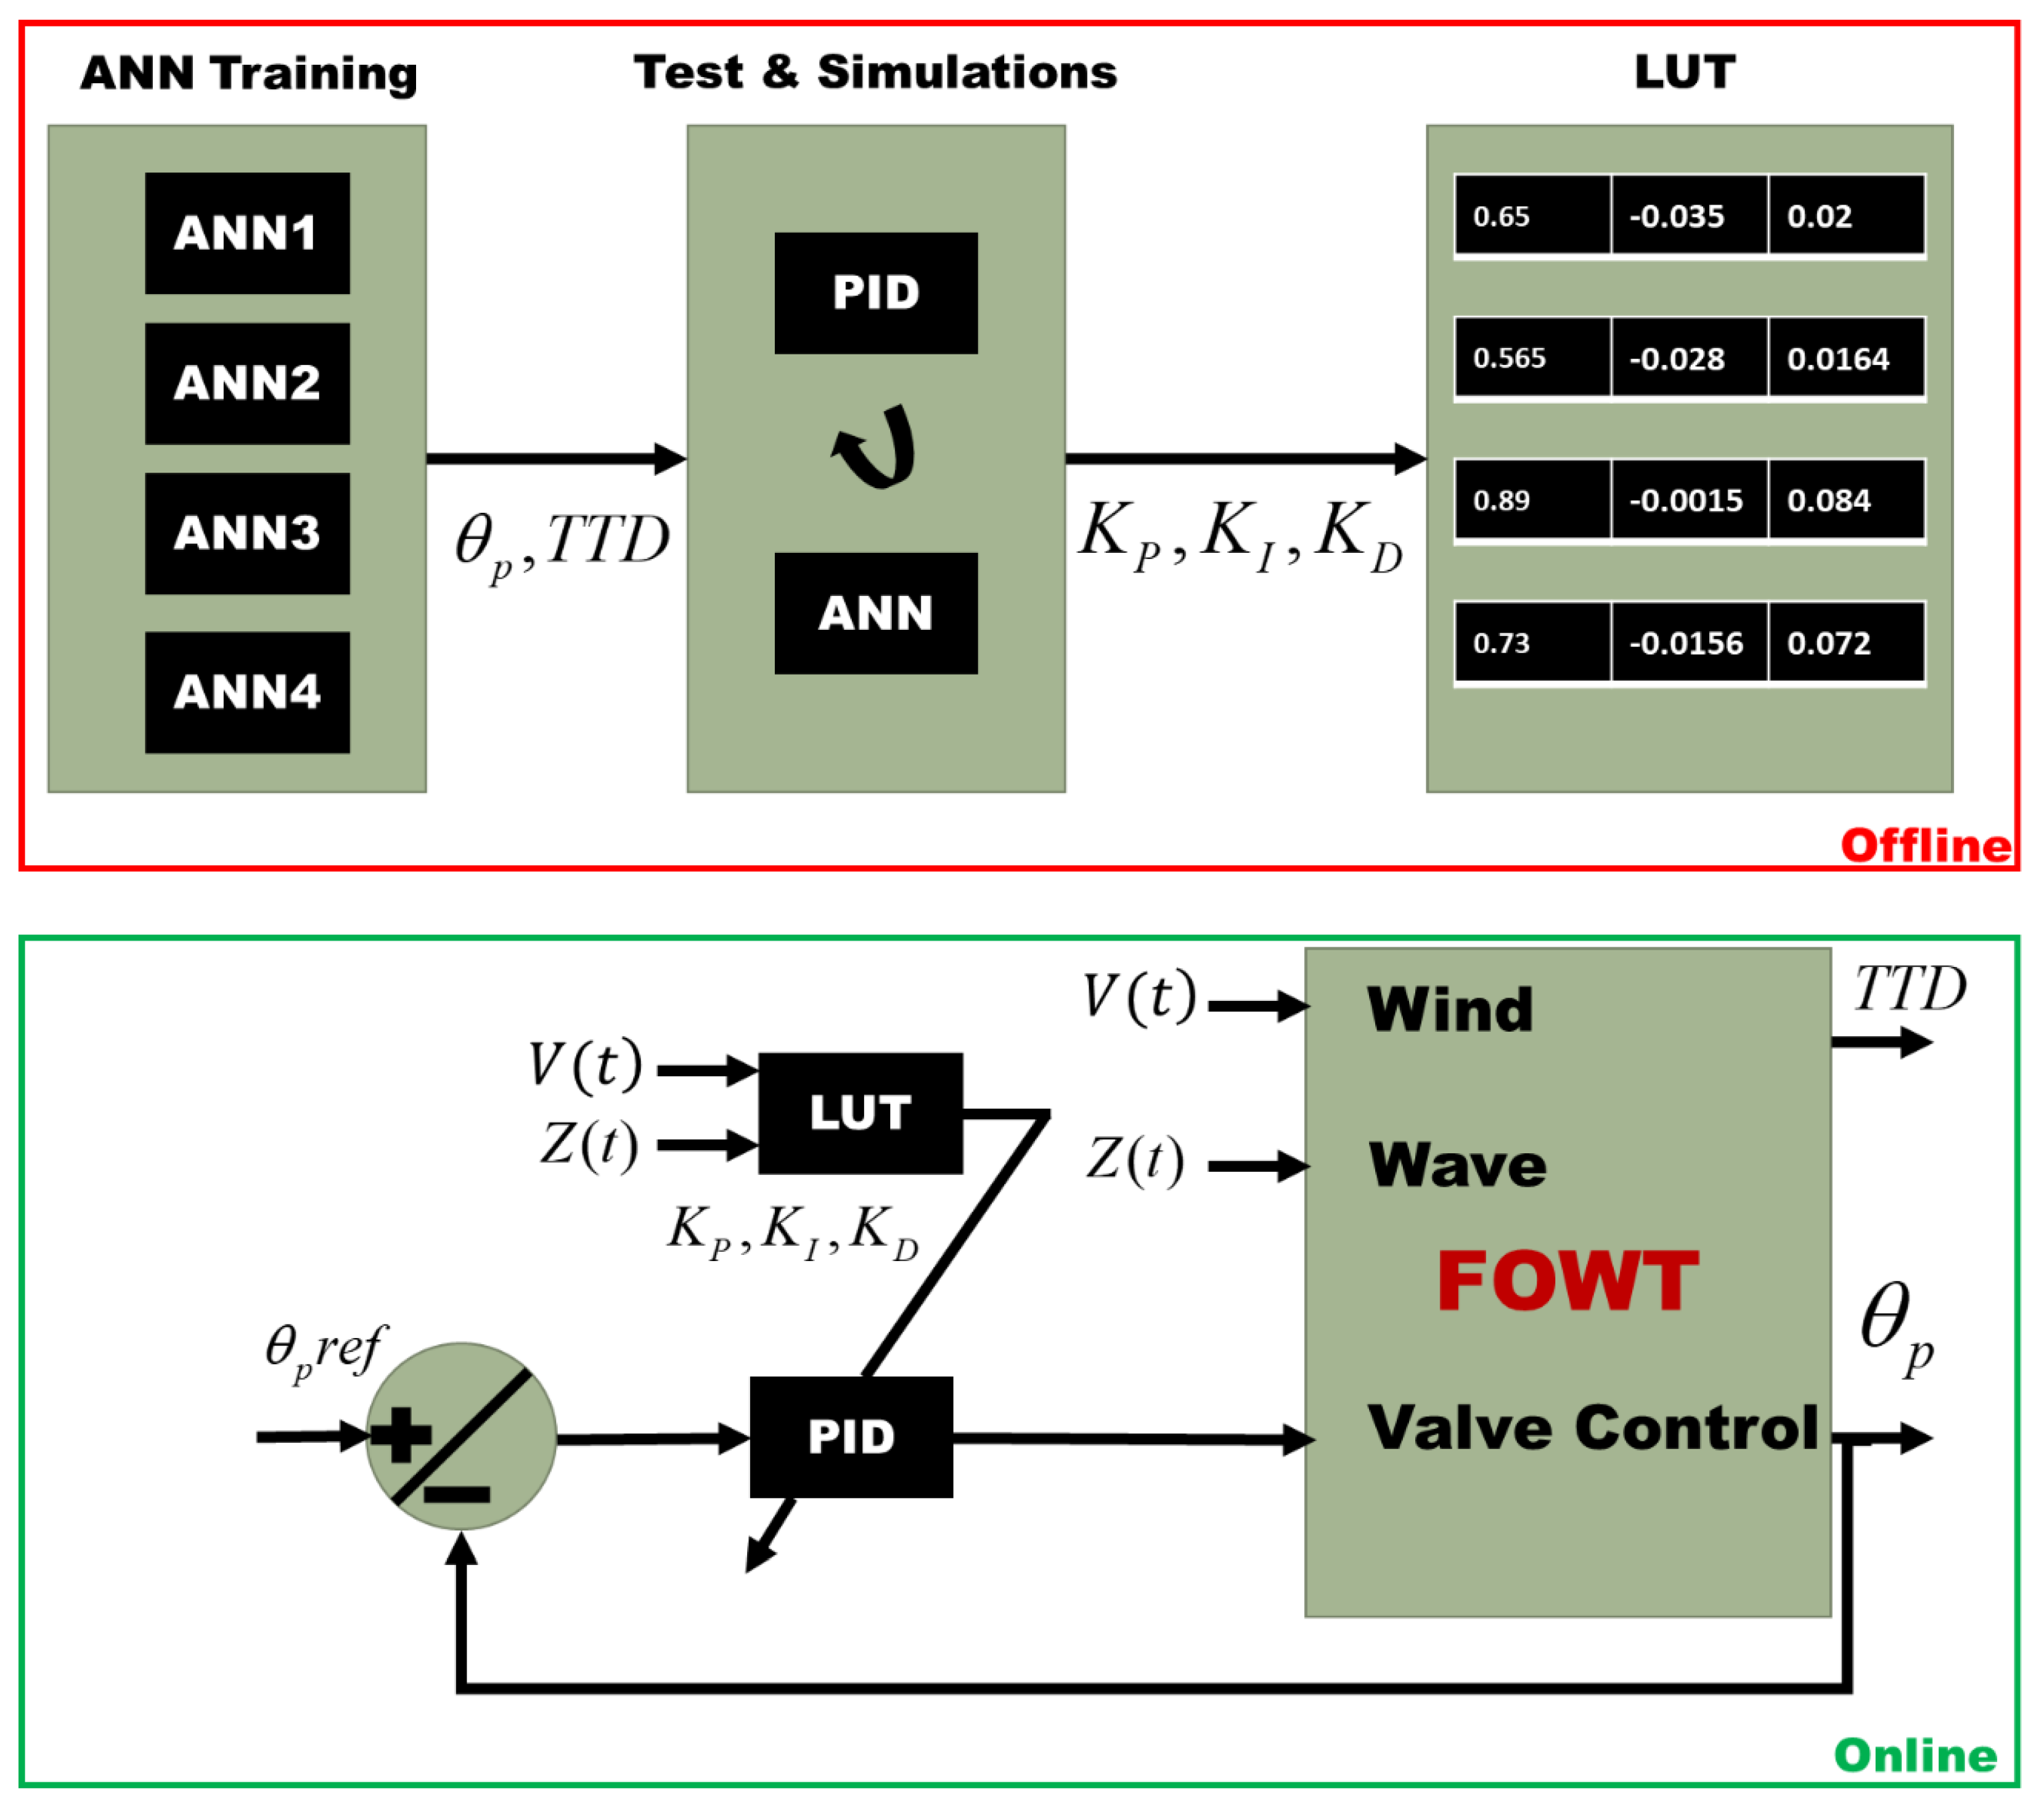
Figure 15 outlines the processes and interactions in a structured and understandable manner by clearly separating the offline and online stages. During the offline stage, the ANN models undergo training to produce the platform pitch and fore-aft top-tower displacement . Subsequently, the ANN_Predict function processes these variables. Following this, the decision logic applies manual decision-making principles to generate control gains , which are then stored in a Look-Up Table (LUT) within the Gain Scheduler.

Figure 15.
Schematic diagram of an adaptive control system utilizing ANNs and PID controller with a gain scheduling mechanism.
In the online stage, real-time wind and wave conditions and are input into the LUT, which provides the appropriate control gains to the PID controller. The PID controller utilizes these gains to adjust the reference pitch angle , generating a control signal for the FOWT. The FOWT system outputs the actual pitch angle and , which are then fed back into the PID controller to maintain the desired pitch angle.
5. Model Validation and Control Results
This section details the simulations conducted to assess the effectiveness of the proposed modeling and control method for the hybrid FOWT-OWC system.
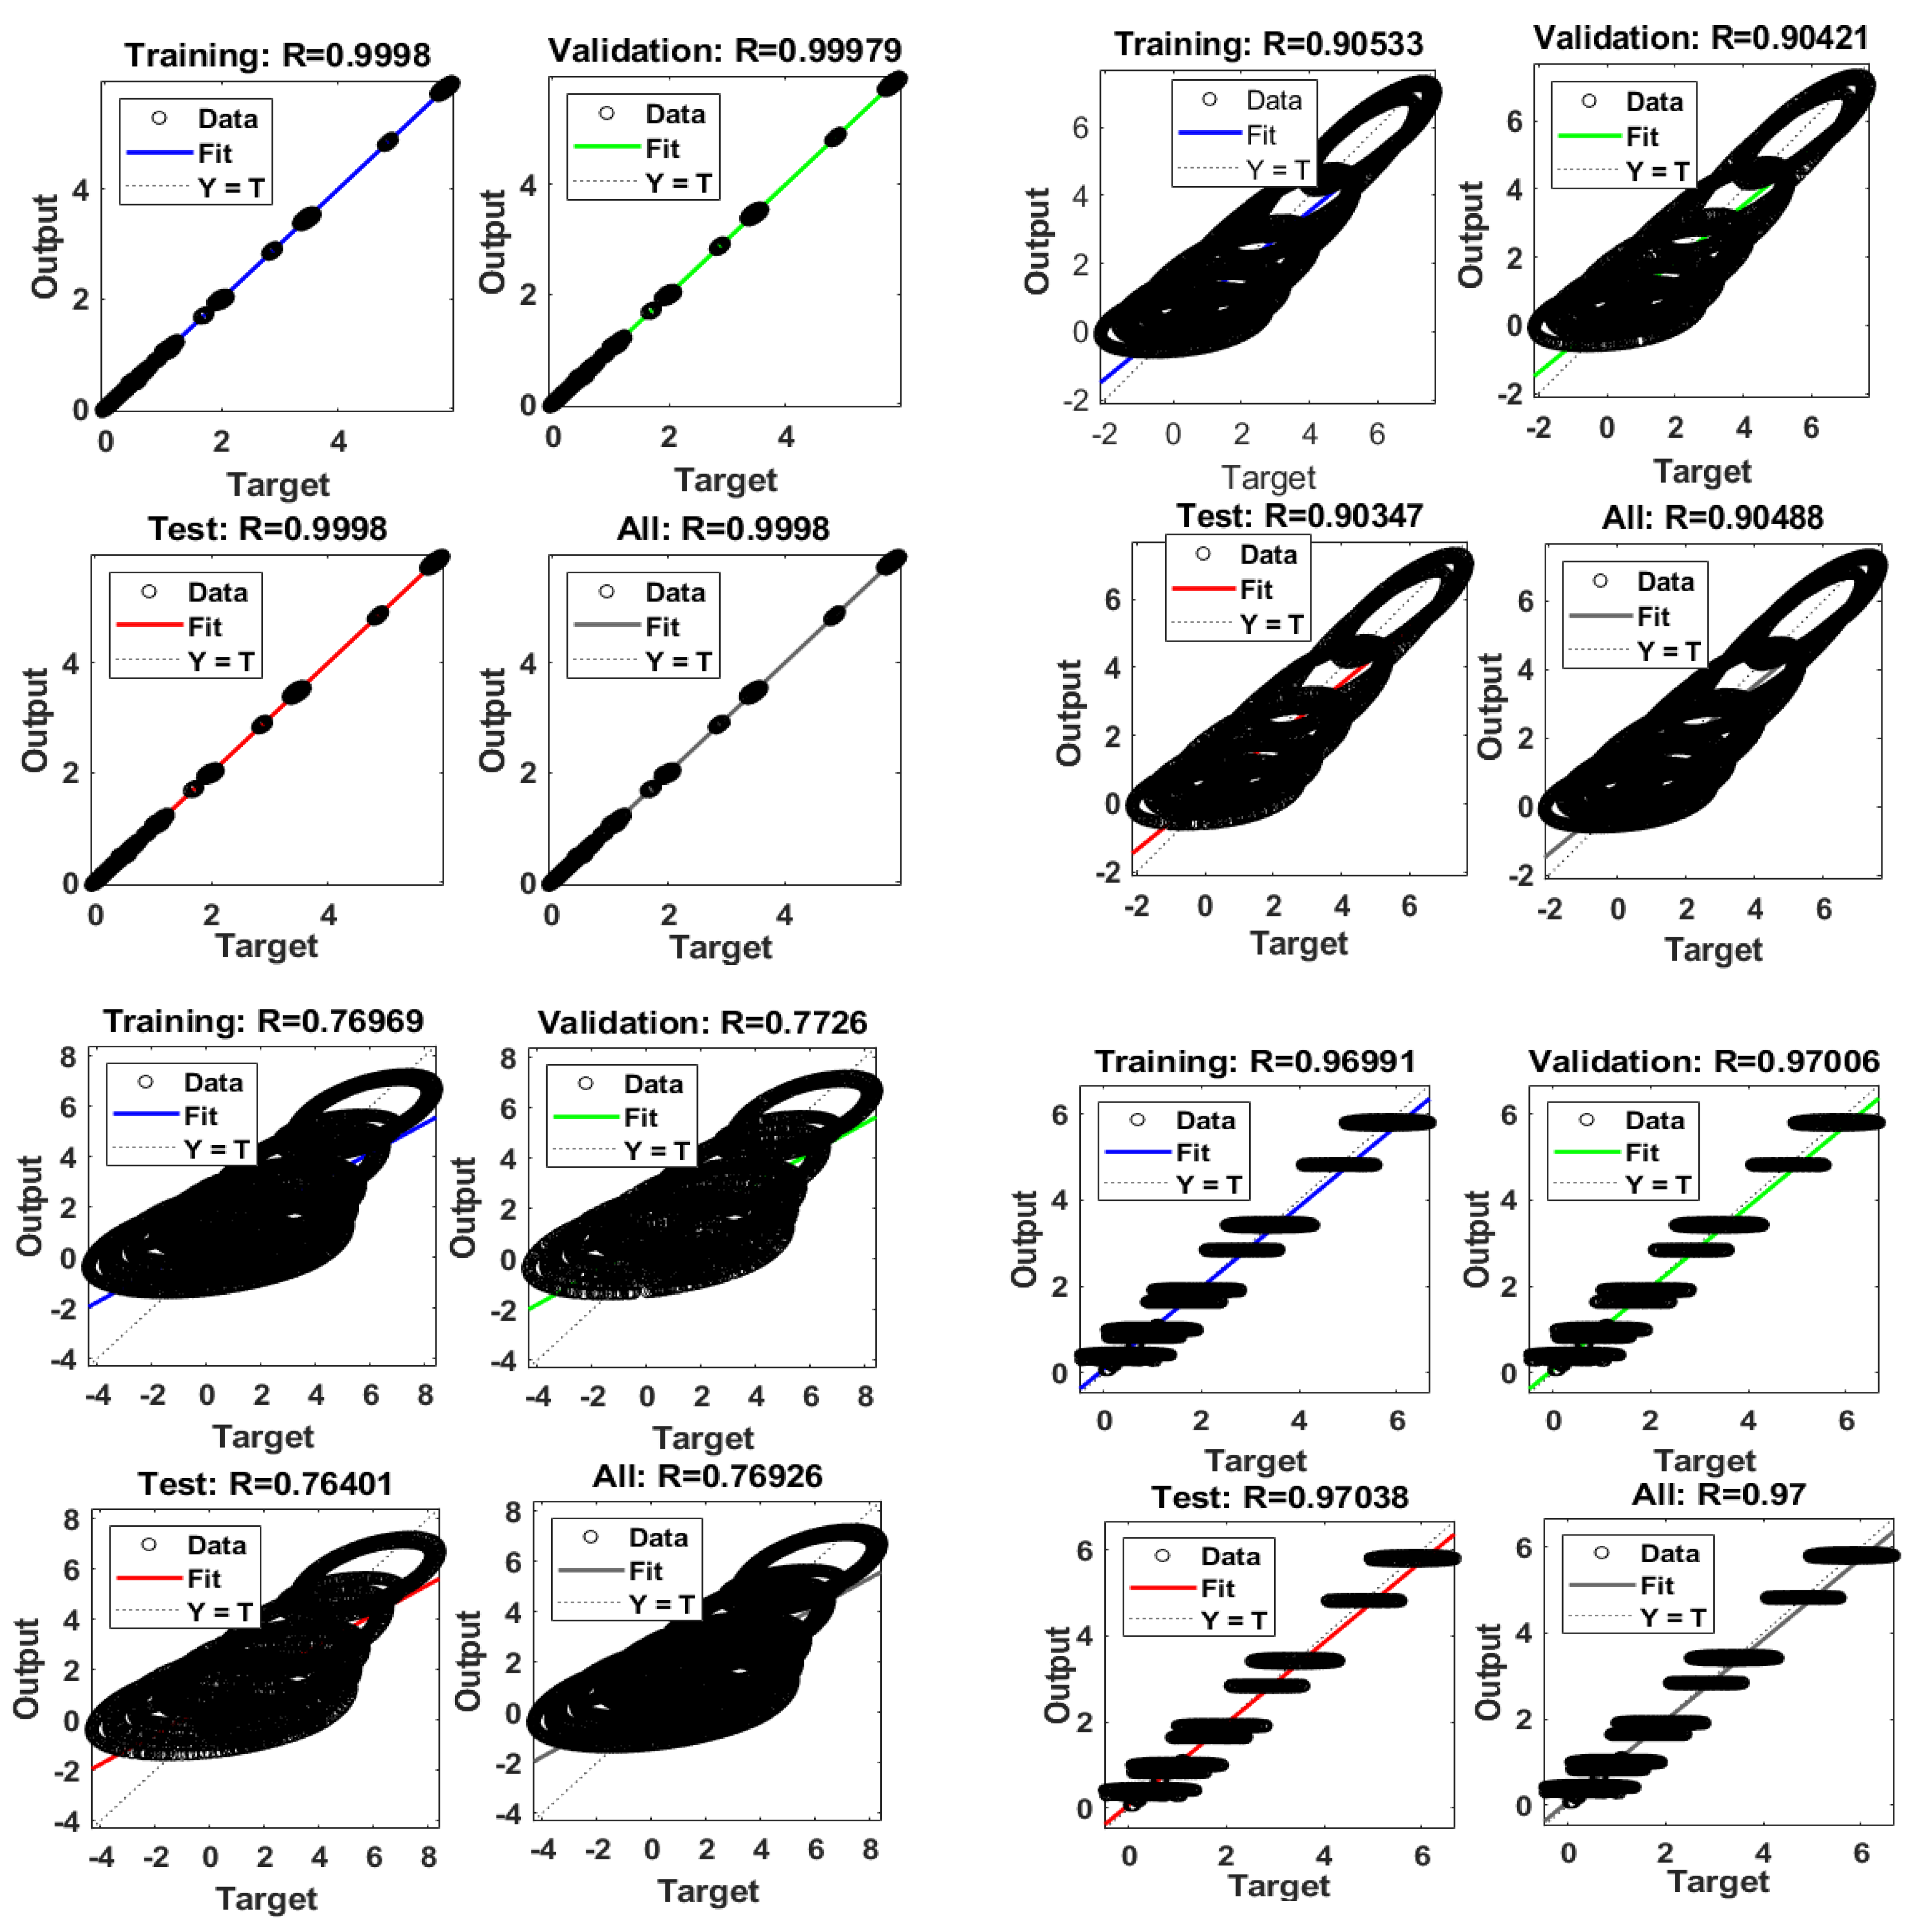
The comprehensive validation process is outlined in Figure 16, and reveals a robust predictive model with exceptional performance metrics. The first figure sets a remarkable precedent, with near-perfect correlation coefficients exceeding 0.9997 across all datasets, showcasing the model’s high correlation with the datasets and the effectiveness of the underlying algorithm. Subsequent figures illustrate a commendable level of generalizability, with correlations consistently around or above 0.90. Such results are indicative of a well-tuned model that has been meticulously trained to translate the complexities of the data while maintaining commendable performance consistency when exposed to new, unseen datasets.

Figure 16.
Performance evaluation of predictive models with regression. Plots for training, validation, and testing of all data sets.
Moreover, the moderate performance depicted in the third figure, with correlations stabilizing between 0.76 to 0.78, underscores the model’s reliability in providing stable predictions despite varying data conditions. The fourth figure reinforces these findings, demonstrating the model’s resilience with high training and overall data correlation coefficients of 0.97, while a slight reduction in the test set correlation suggests a balanced approach to model fitting, avoiding overfitting while still capturing essential data patterns. These results collectively signal a promising direction for future deployment, offering a strong foundation for confident, data-driven decision-making and further affirming the model’s potential for practical application across diverse scenarios.
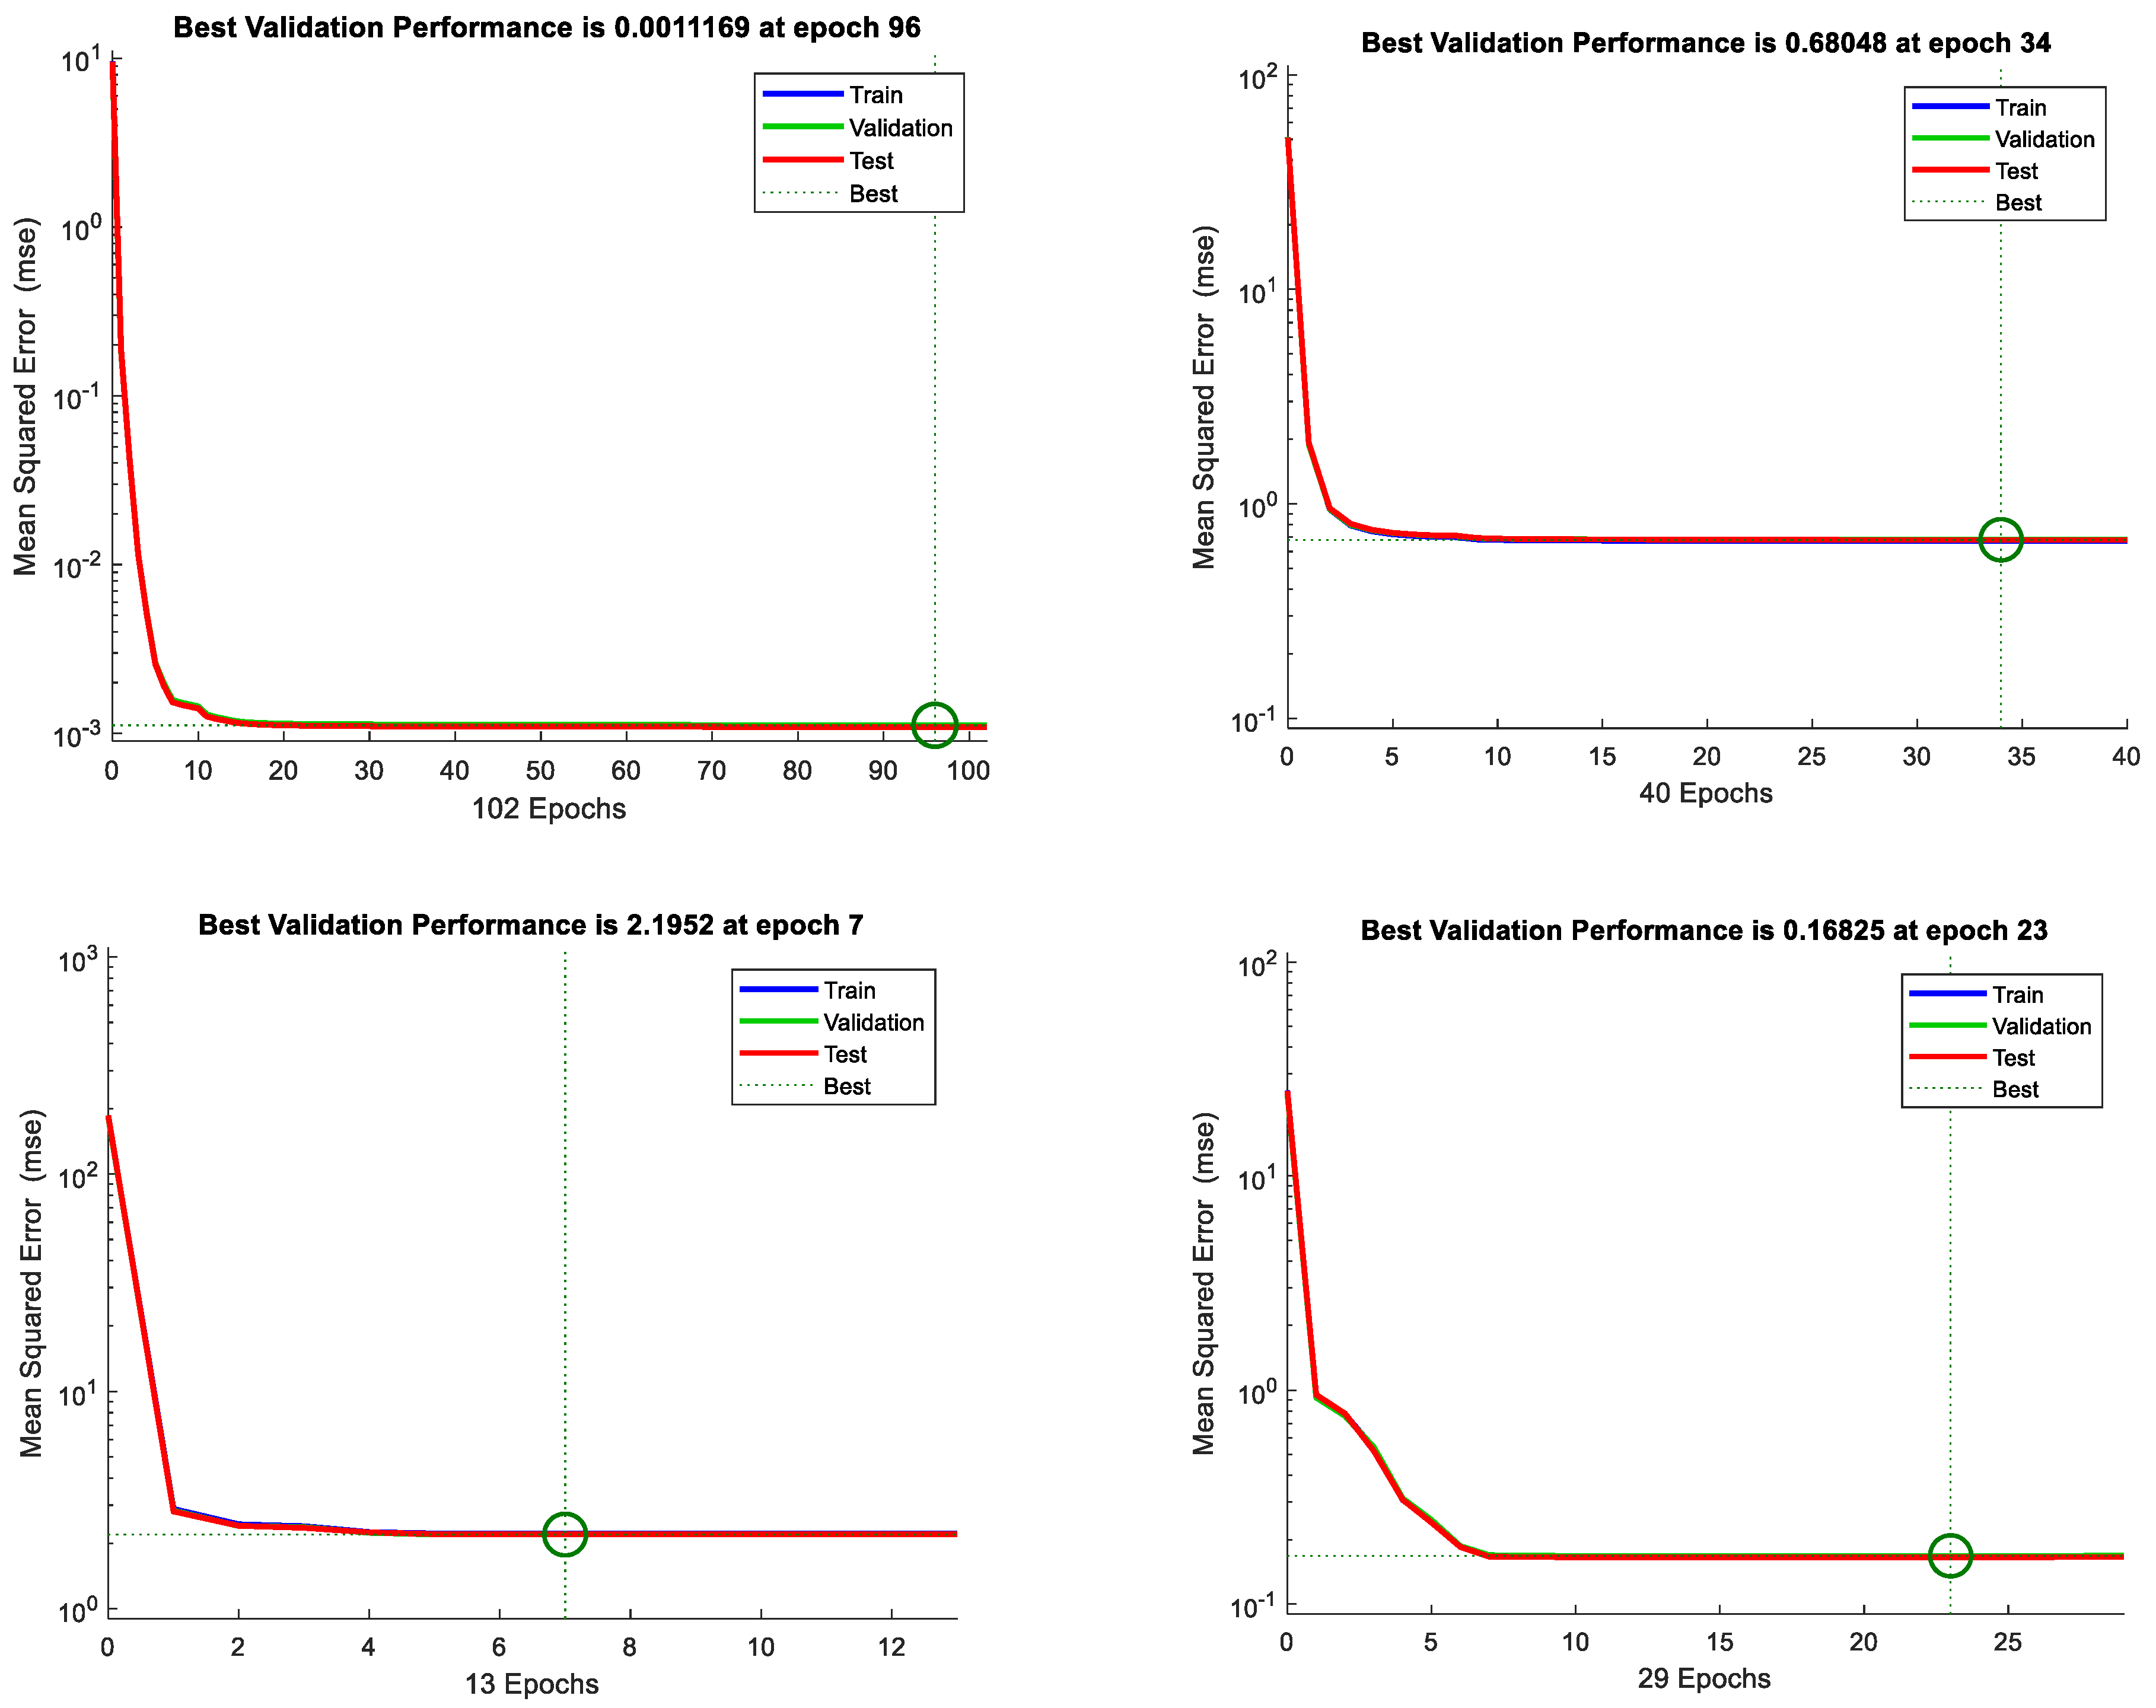
The series of validation graphs shown in Figure 17 demonstrates the robust training model efficiency and predictive accuracy. The blue, green, and red lines represent training, validation, and testing, respectively. The model achieved optimal validation performance, with the best validation MSE remarkably low at 0.001169 by epoch 96, 0.68048 by epoch 34, 2.1952 by epoch 7, and 0.16825 by epoch 23, indicating rapid convergence and a strong learning capability. The MSE on a logarithmic scale swiftly declined from the initial epochs, underscoring the model’s ability to generalize without overfitting, as the test errors closely followed the validation errors. This consistency in low error rates across all phases highlights the model’s well-tuned balance between bias and variance, emphasizing its readiness for real-world application with a high degree of confidence in its predictive stability.
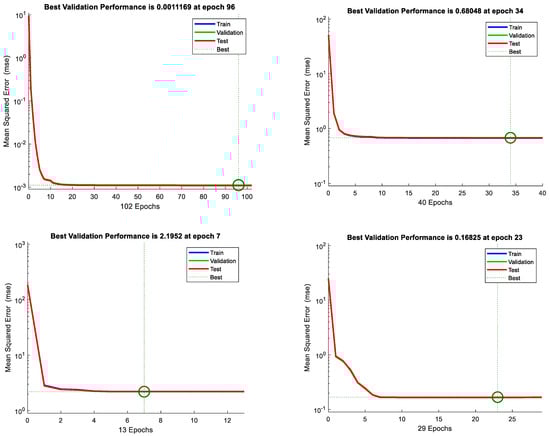
Figure 17.
Performances analysis of four NN models with three inputs, ten hidden layers, and two outputs.
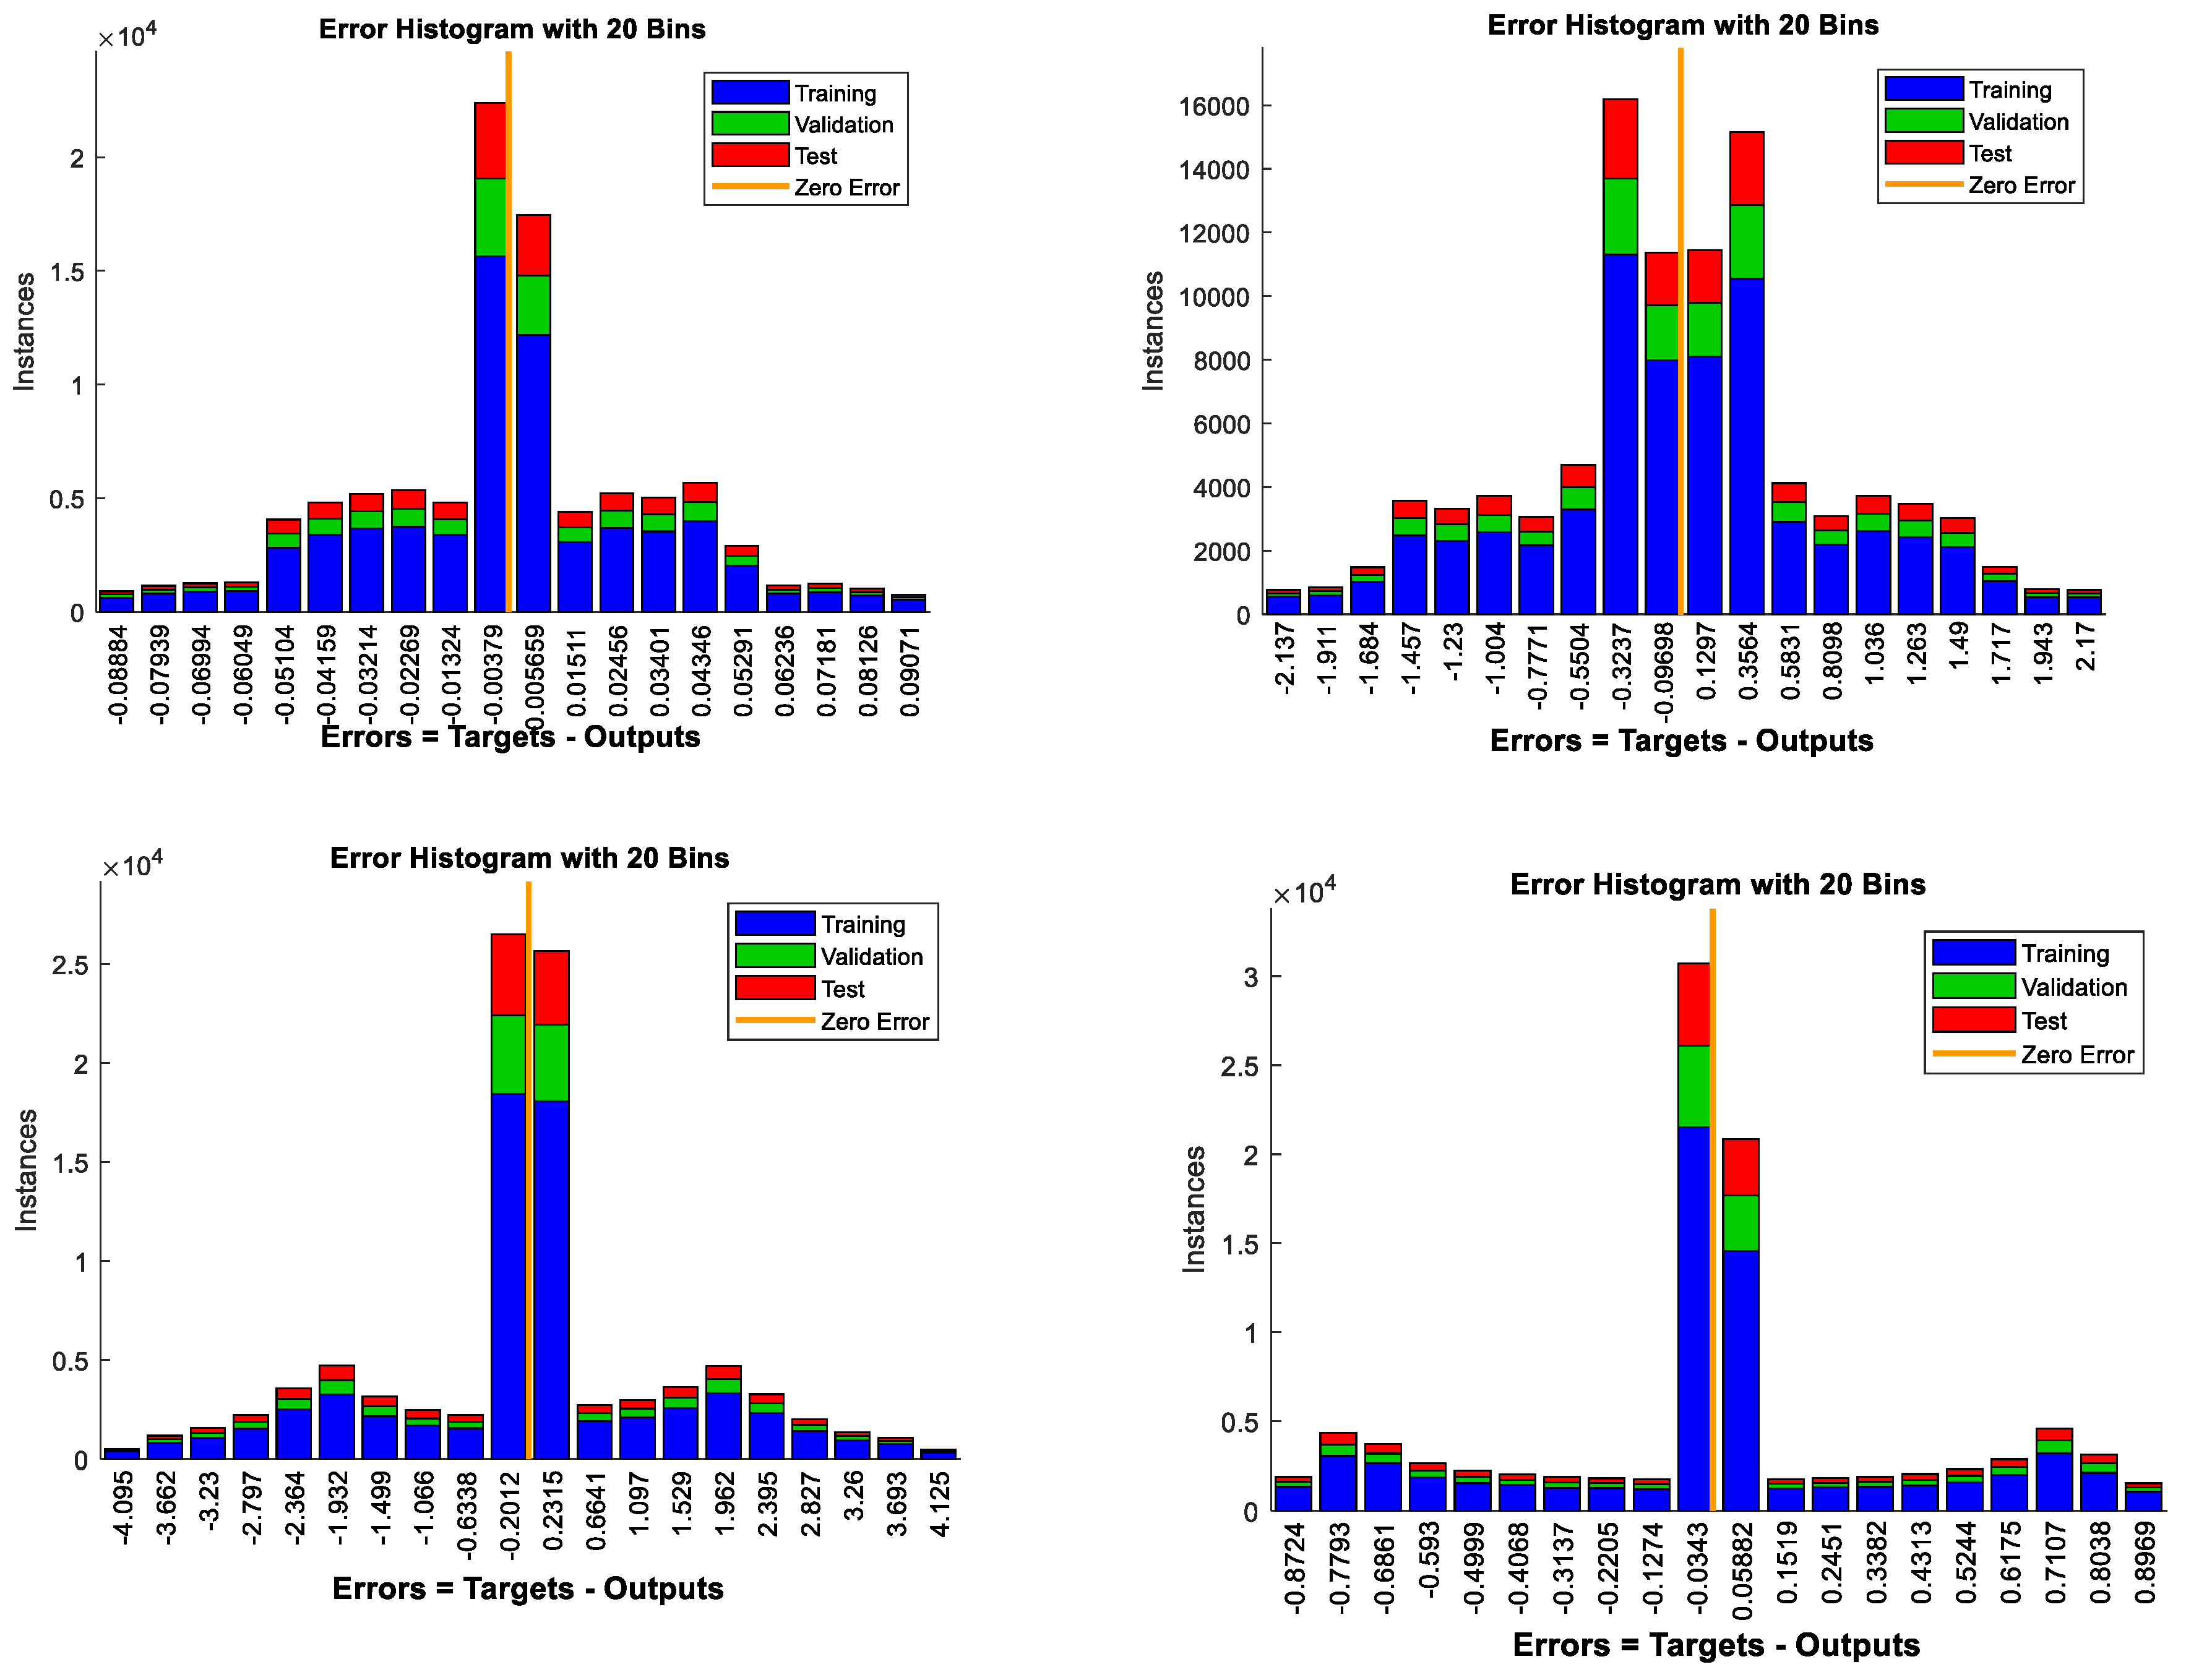
The set of error histograms from the predictive model evaluation provides insightful data on the distribution of prediction errors across training, validation, and test datasets. The histograms are plotted (see Figure 18) with errors calculated as the difference between targets and model outputs, and they are segmented into 20 discrete bins, offering a clear visual representation of the error magnitude and frequency. In each histogram, most errors cluster around the zero-error bin, which is a positive indication of the model’s accuracy. Notably, the concentration of errors in bins close to zero across all datasets suggests that the model predictions are well-aligned with the actual values. The similar error distributions in the training, validation, and test sets imply that the model is not overfitted to the training data and has a consistent error profile when applied to unseen data. The distribution tails are thin, indicating fewer instances of large errors, which enhances the model’s credibility for practical applications.
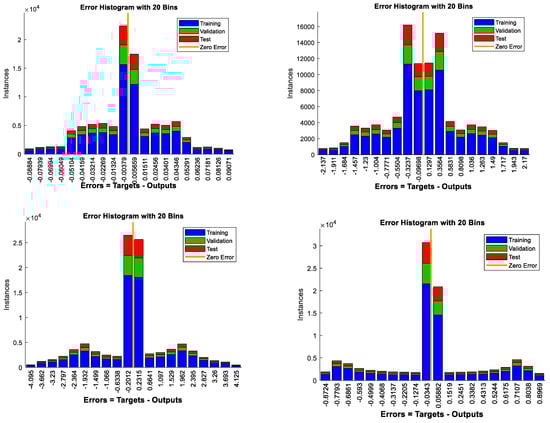
Figure 18.
Error histograms analyzing the distribution of four NN models with three inputs, ten hidden layers, and two outputs.
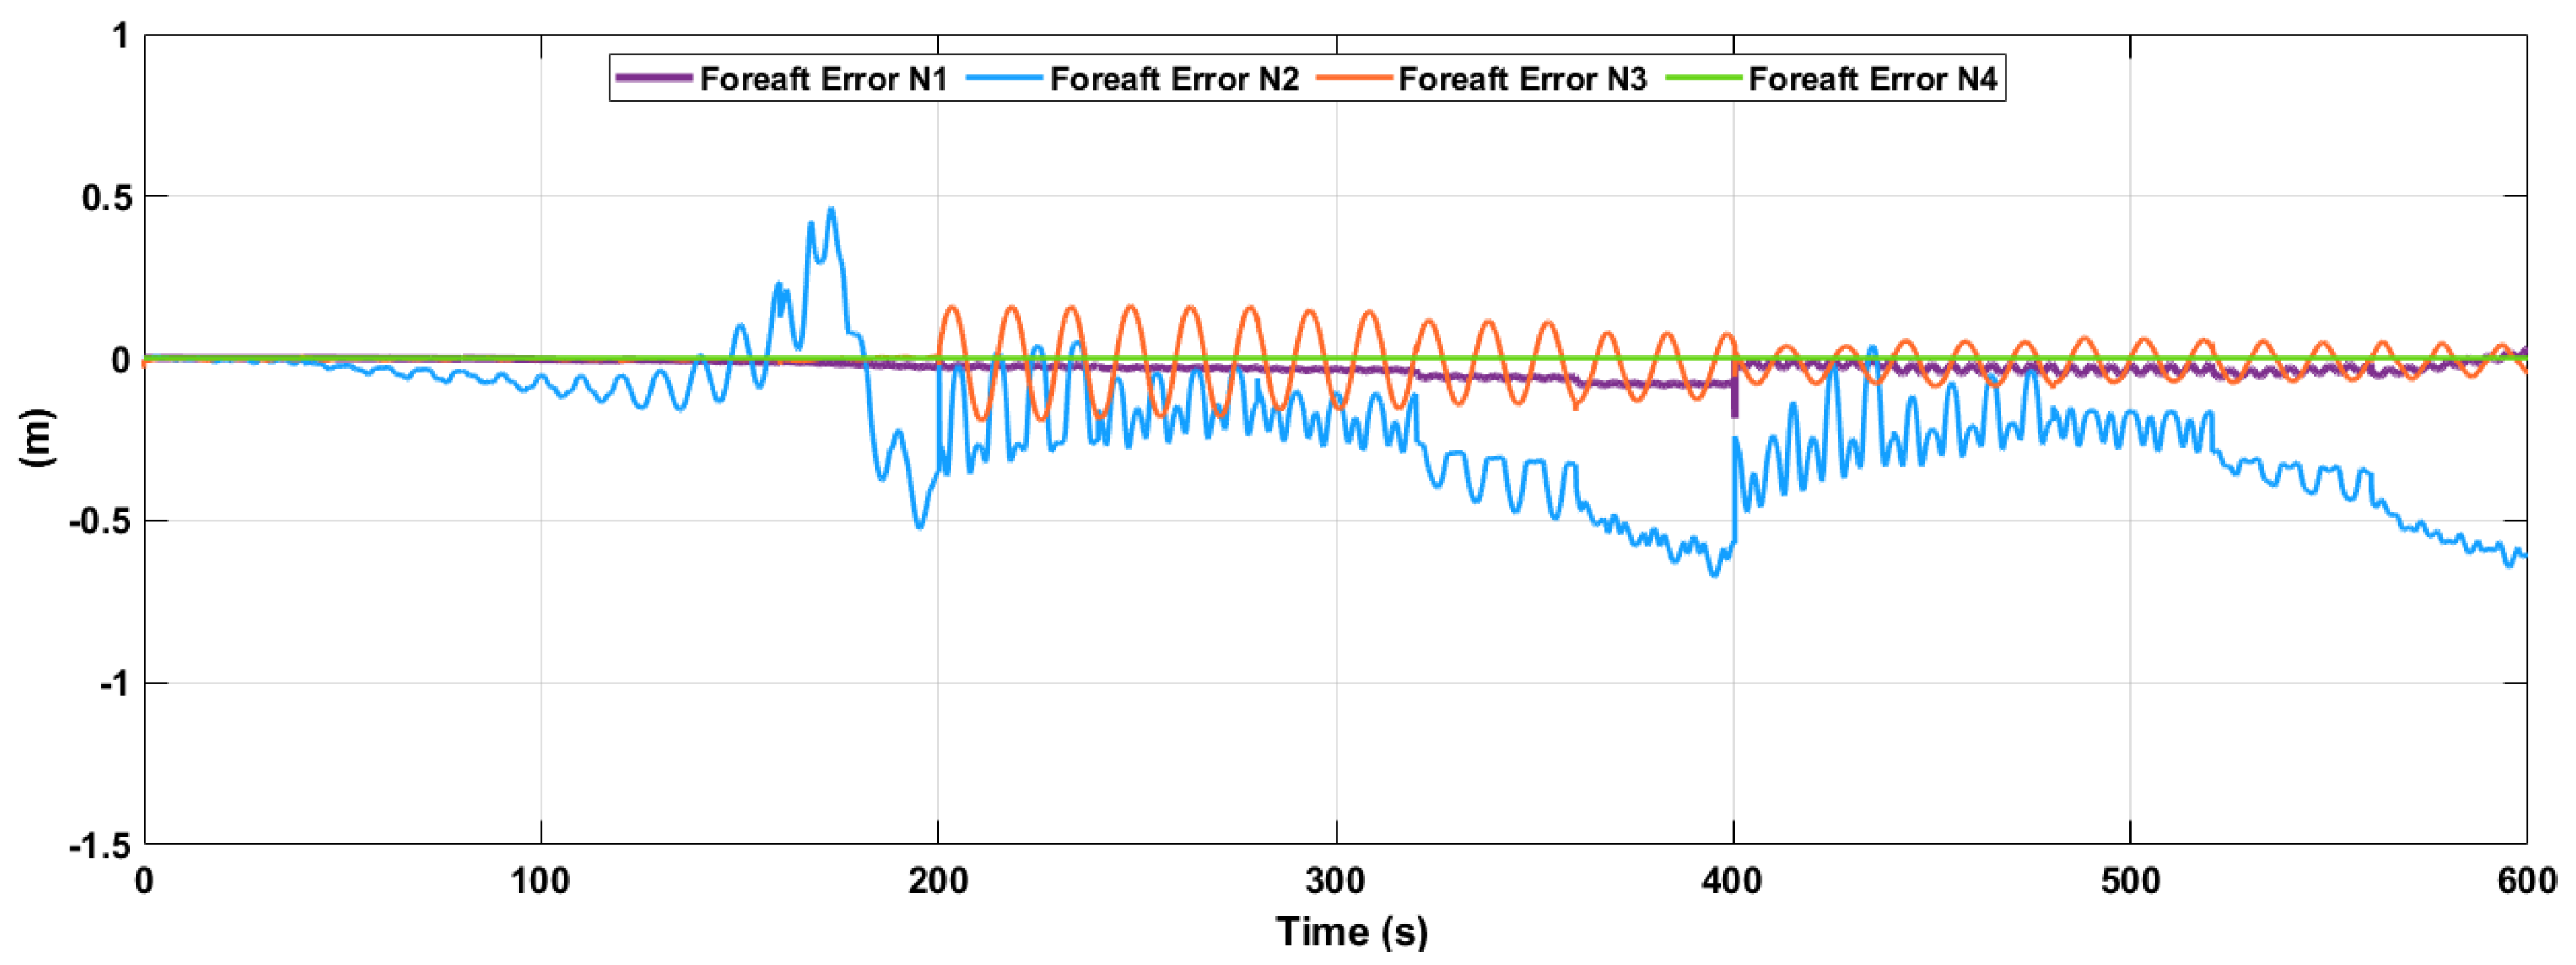
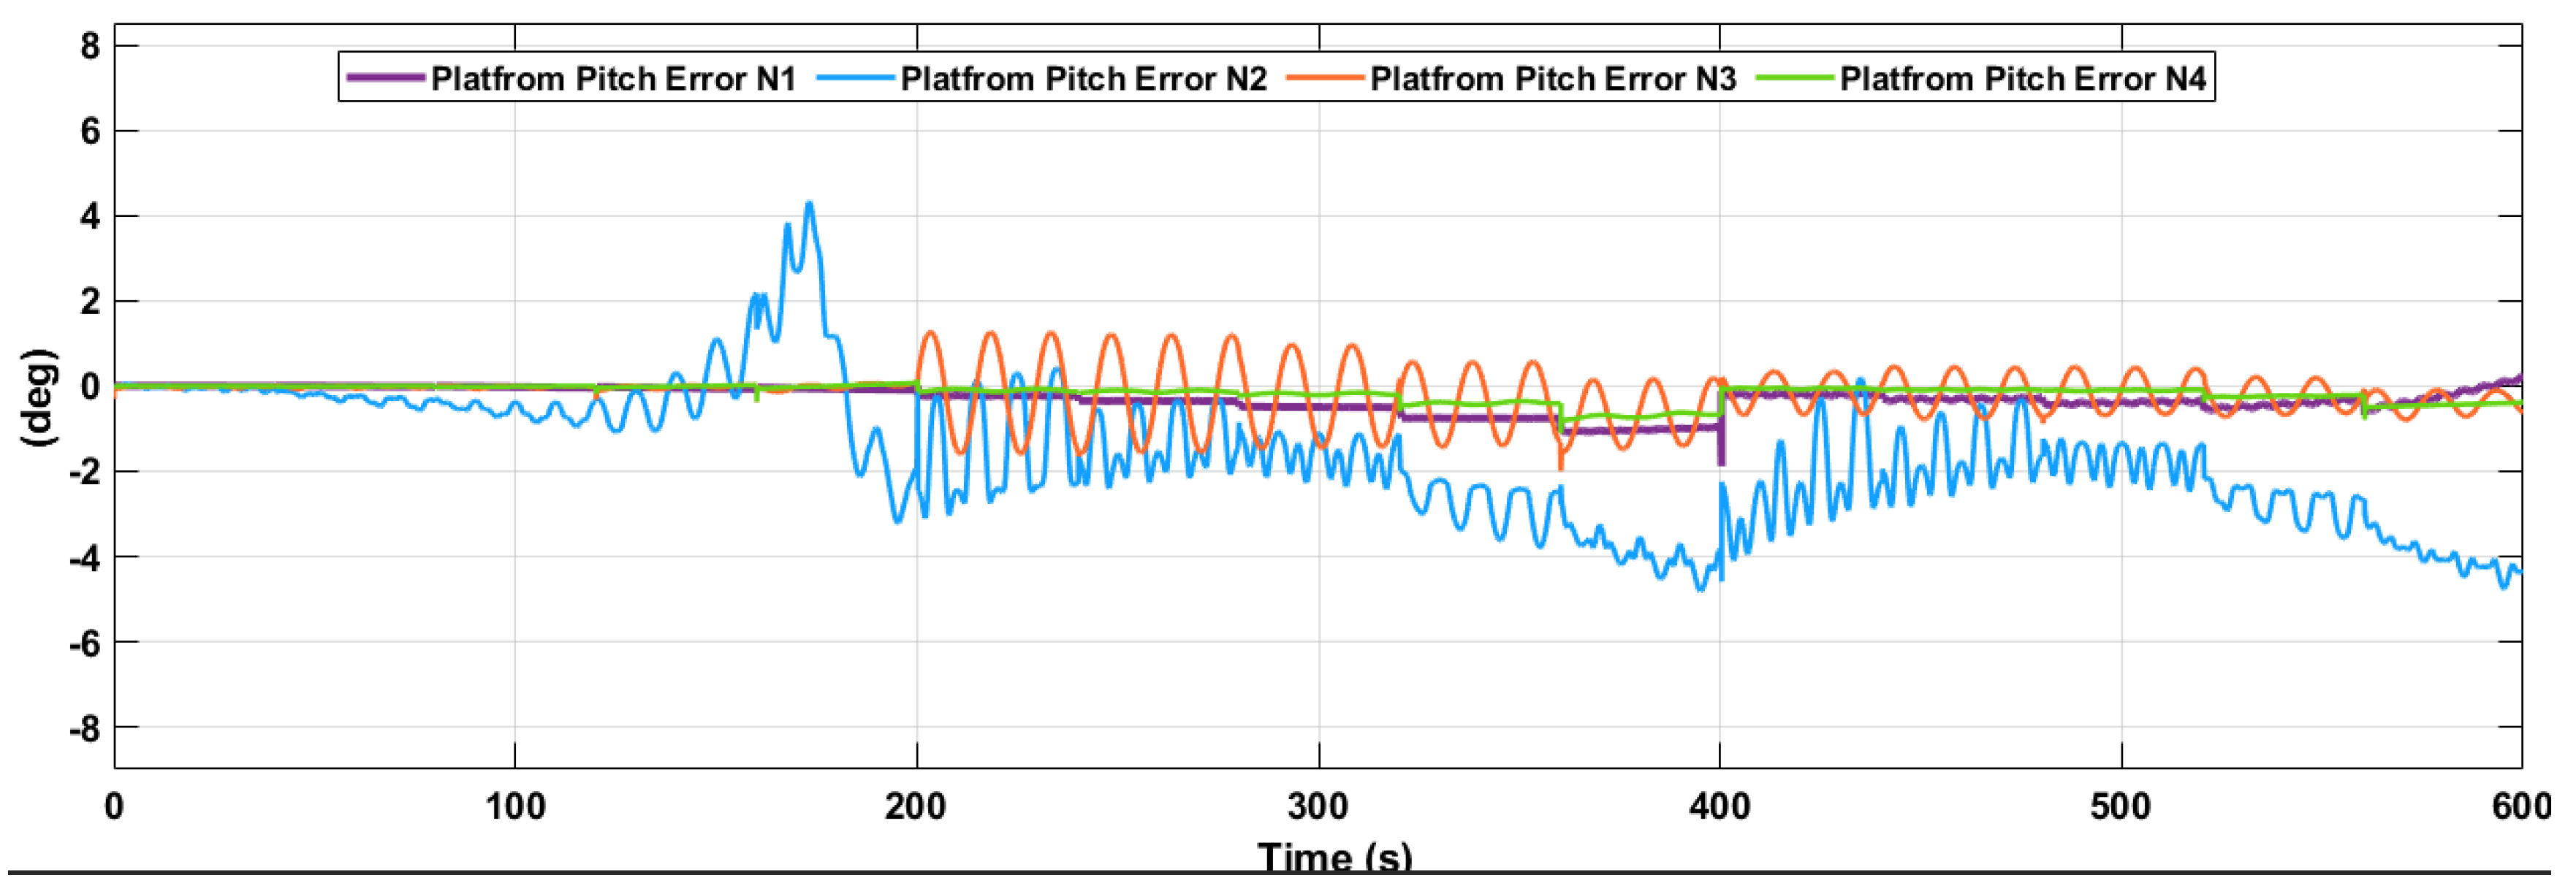
The graphs illustrated in Figure 19 are the errors of four distinct models across a 600-s horizon, with a particular focus on fore-aft and platform pitch errors. Models N1, N2, N3, and N4 exhibit an impressive level of accuracy, as evidenced by their error metrics closely reaching the zero line, indicating predictions that consistently align with the actual values. These models demonstrate exceptional reliability, maintaining a steady course even when faced with the complexities of dynamic forecasting. In general, the collective performance of these models paints a promising picture of predictive accuracy and offers a robust foundation for complex forecasting in dynamic environments.
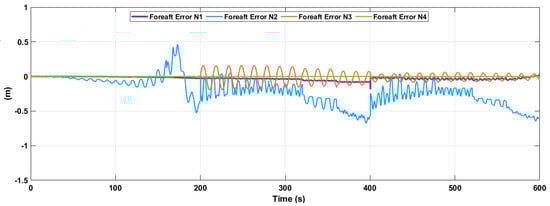
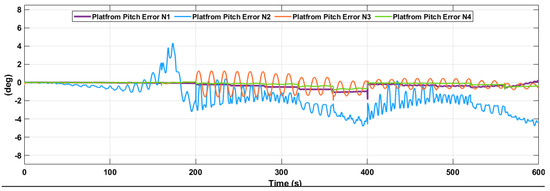
Figure 19.
Comprehensive training errors across four NN models of fore-aft displacement and platform pitch.
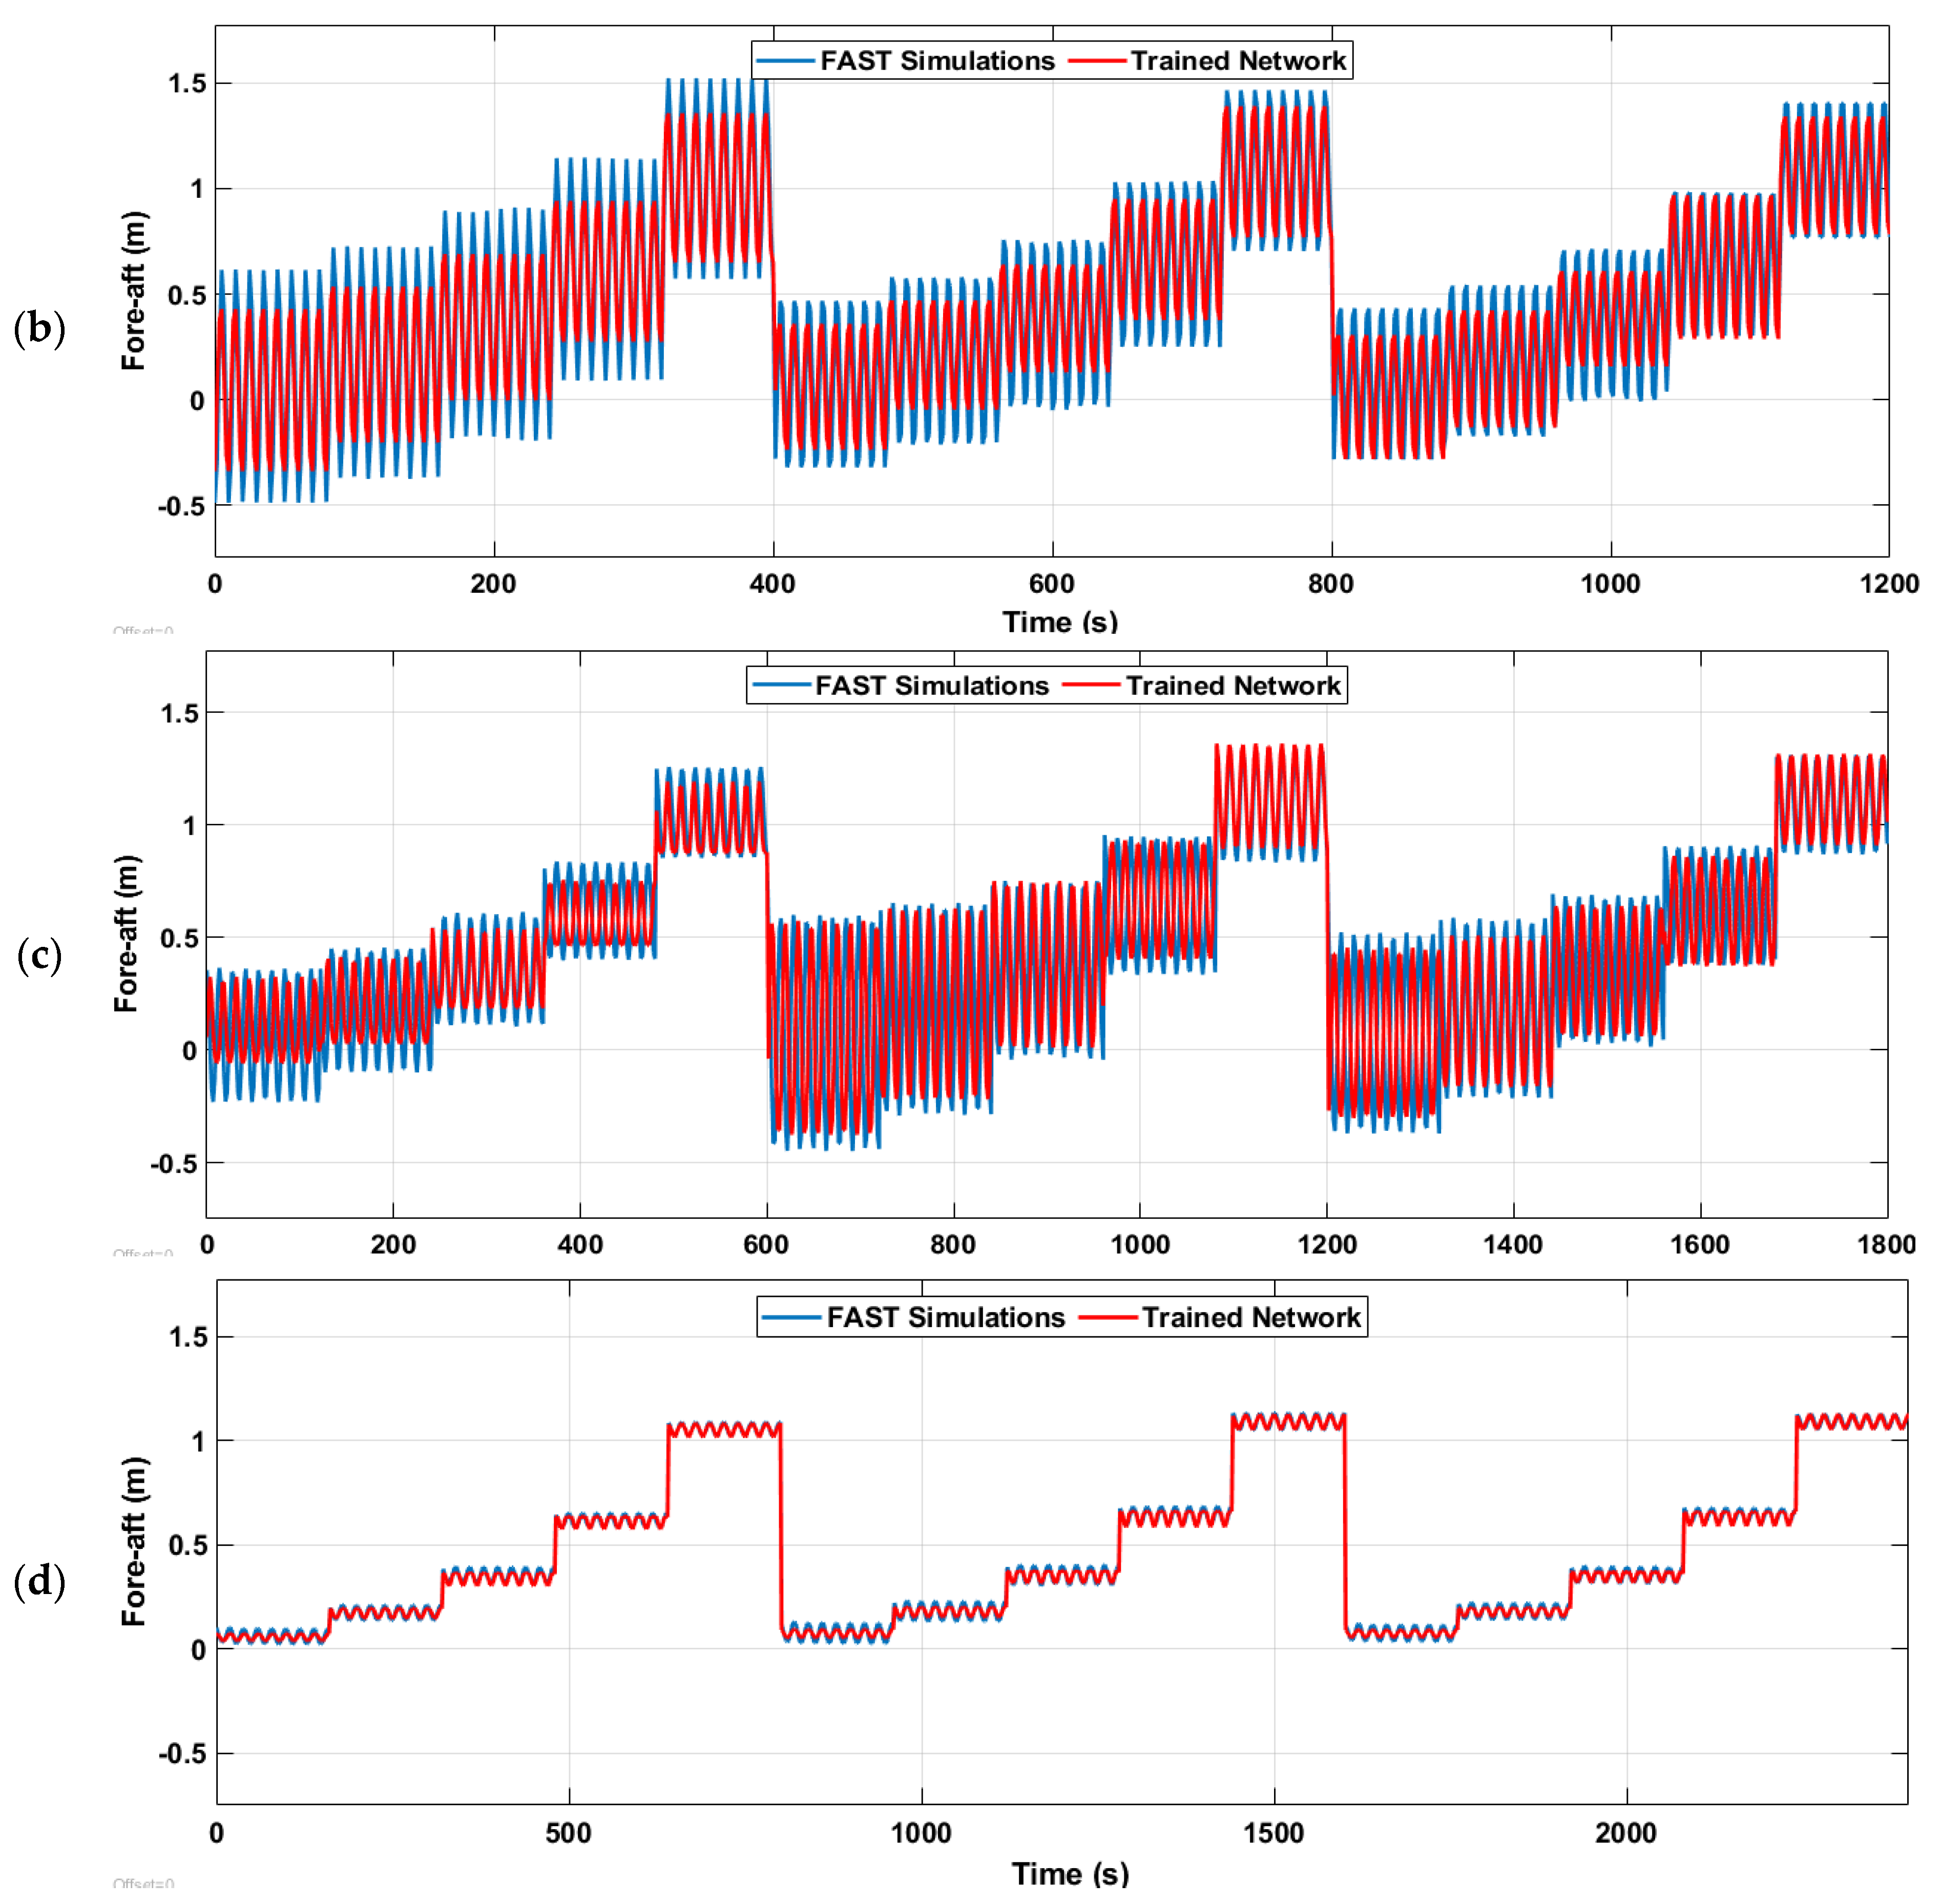
For the top-tower fore-aft displacement (), a set of graphical analyses is presented in Figure 20. A detailed overview of the neural network’s training performance is rigorously compared against FAST simulations across a spectrum of wave periods. For the shortest wave period of 5 s, the trained network demonstrates excellent synchronization with the simulation data, capturing the rapid oscillatory patterns with minimal deviation. As the wave period increases to 10 and 14 s, the network maintains this high level of reliability, despite the longer periods introducing more complex dynamics to the training task. The graphs show that the network adeptly adjusts to these changes, with the error between the simulation and the trained network remaining consistently low. The longest wave period of 20 s tests the limits of the network’s predictive capacity. The corresponding graph indicates that while the overall trend and periodicity are captured, there is a slight increase in the deviation from the FAST simulation data. This is due to the inherent challenges in modeling such extended patterns, or could reflect a need for further training or refinement of the network for these conditions. Across all periods, however, the consistent performance of the trained network, especially in lower frequency waves, is indicative of a robust training regime that has prepared the network to handle a diverse range of scenarios with varying wind speeds. These results are encouraging for the application of the trained network in real-world situations in which adaptability to different environmental conditions has been considered carefully.
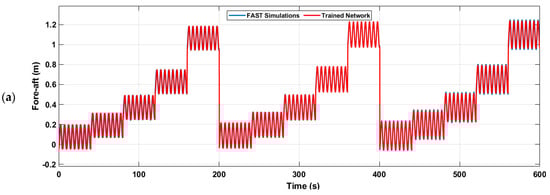
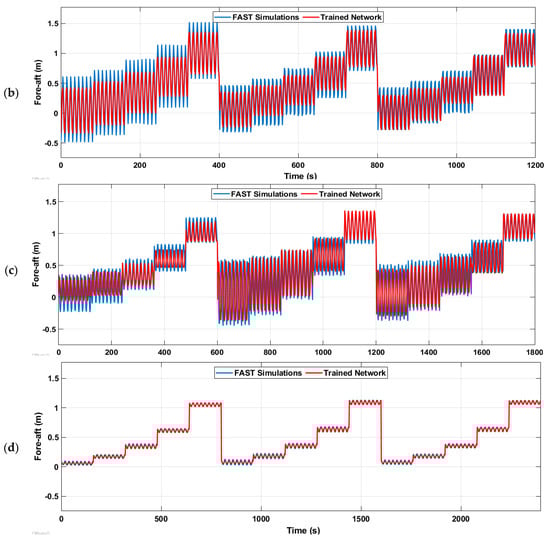
Figure 20.
Comprehensive training results of fore-aft displacement across different wave periods of (a) 5 s, (b) 10 s, (c) 14 s, and (d) 20 s, each with varying wind speeds (5, 8, 11, 14, and 17 m/s) and wave height of 1 m.
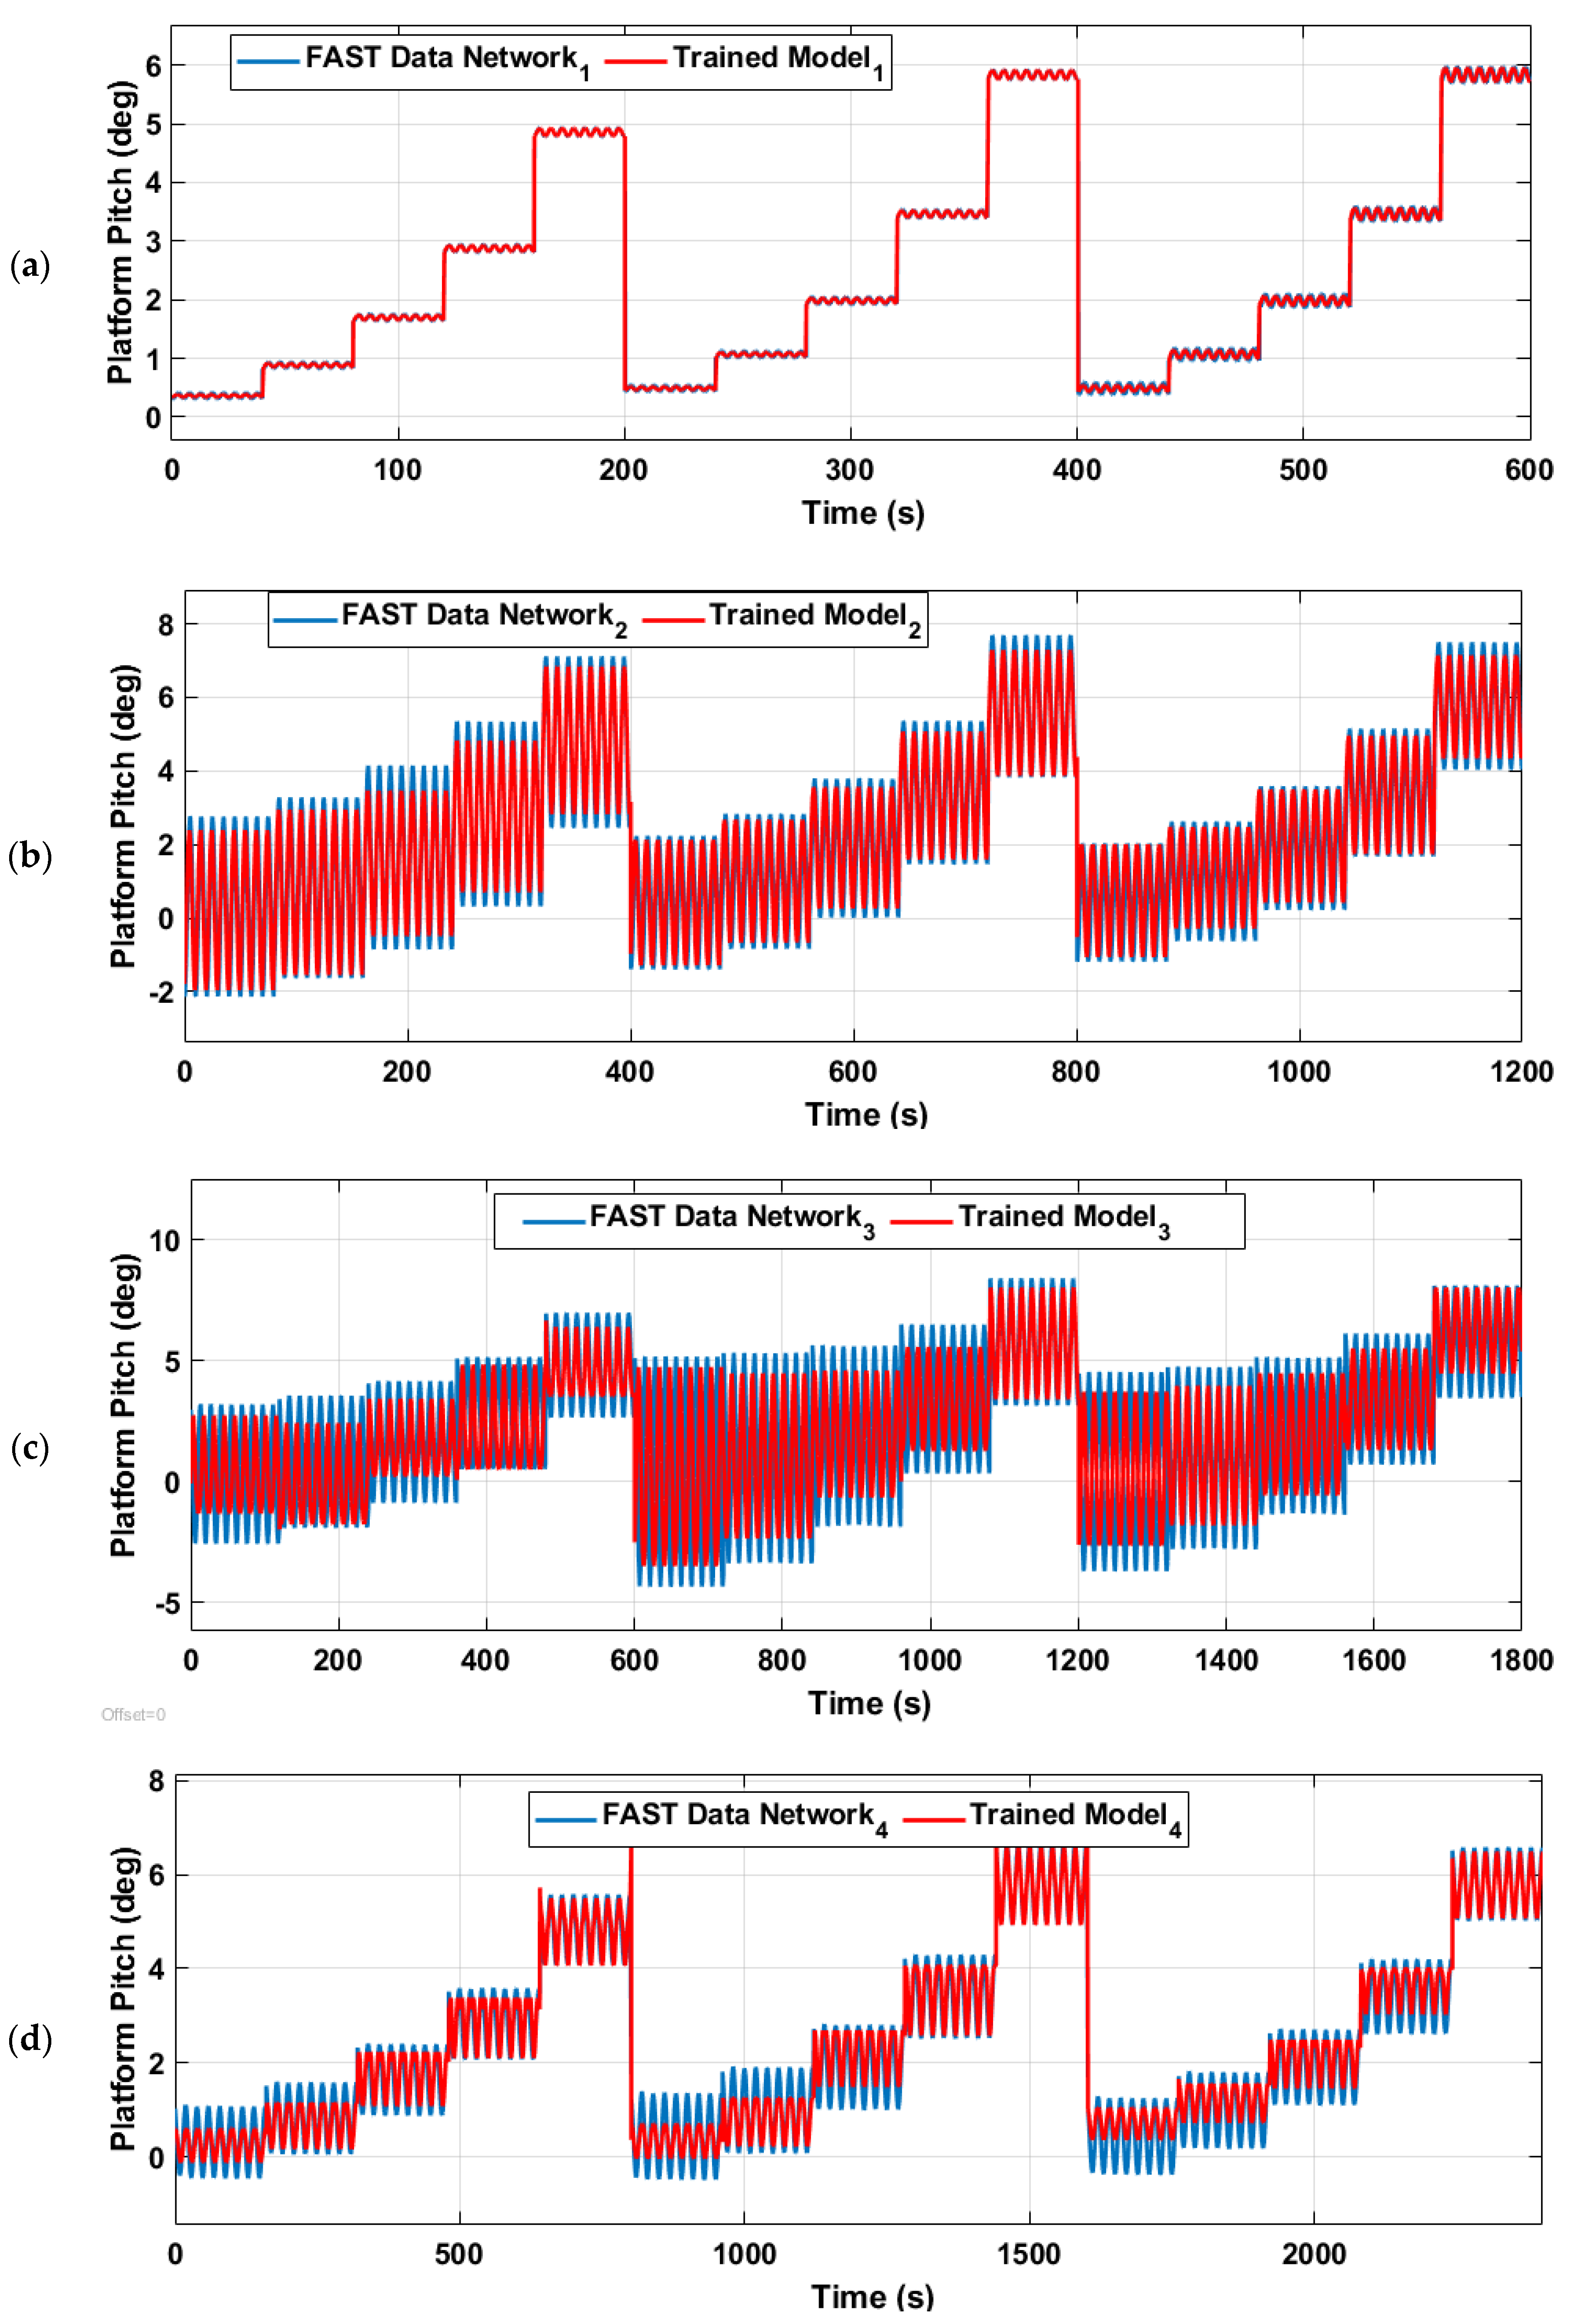
Figure 21 presents the training results of the Trained Model, set against FAST Data Network outputs, and using varying wave periods for the platform pitch. Each graph reveals the model’s performance over extended time frames, capturing the dynamics of platform pitch in response to simulated maritime conditions. The first graph, depicting the scenario with a 5-s wave period, shows an exceptional alignment between the Trained Model and the FAST Data Network, suggesting that the model has effectively internalized the system dynamics within this range. As the wave period increases to 10, 14, and 20 s in subsequent graphs, the Trained Model consistently mirrors the FAST Data Network’s pitch response, albeit with minor variations that become more pronounced with longer wave periods. These discrepancies are due to the increased complexity and potential non-linearities introduced at extended intervals. However, even at a 20-s wave period, the Trained Model demonstrates an impressive ability to replicate the complex patterns of the FAST simulations, exhibiting its robustness and adaptability.

Figure 21.
Comprehensive training results for platform pitch across different wave periods of (a) 5 s, (b) 10 s, (c) 14 s, and (d) 20 s, each with varying wind speeds (5, 8, 11, 14, and 17 m/s) and wave height of 1m.
Overall, the Trained Model’s performance across these varying conditions highlights its refined learning capabilities and potential for real-world application. Despite the challenges posed by longer wave periods and the intricate behaviors they induce, the model shows it can predict with high accuracy, making it a valuable tool for navigating the complexities of maritime environments.
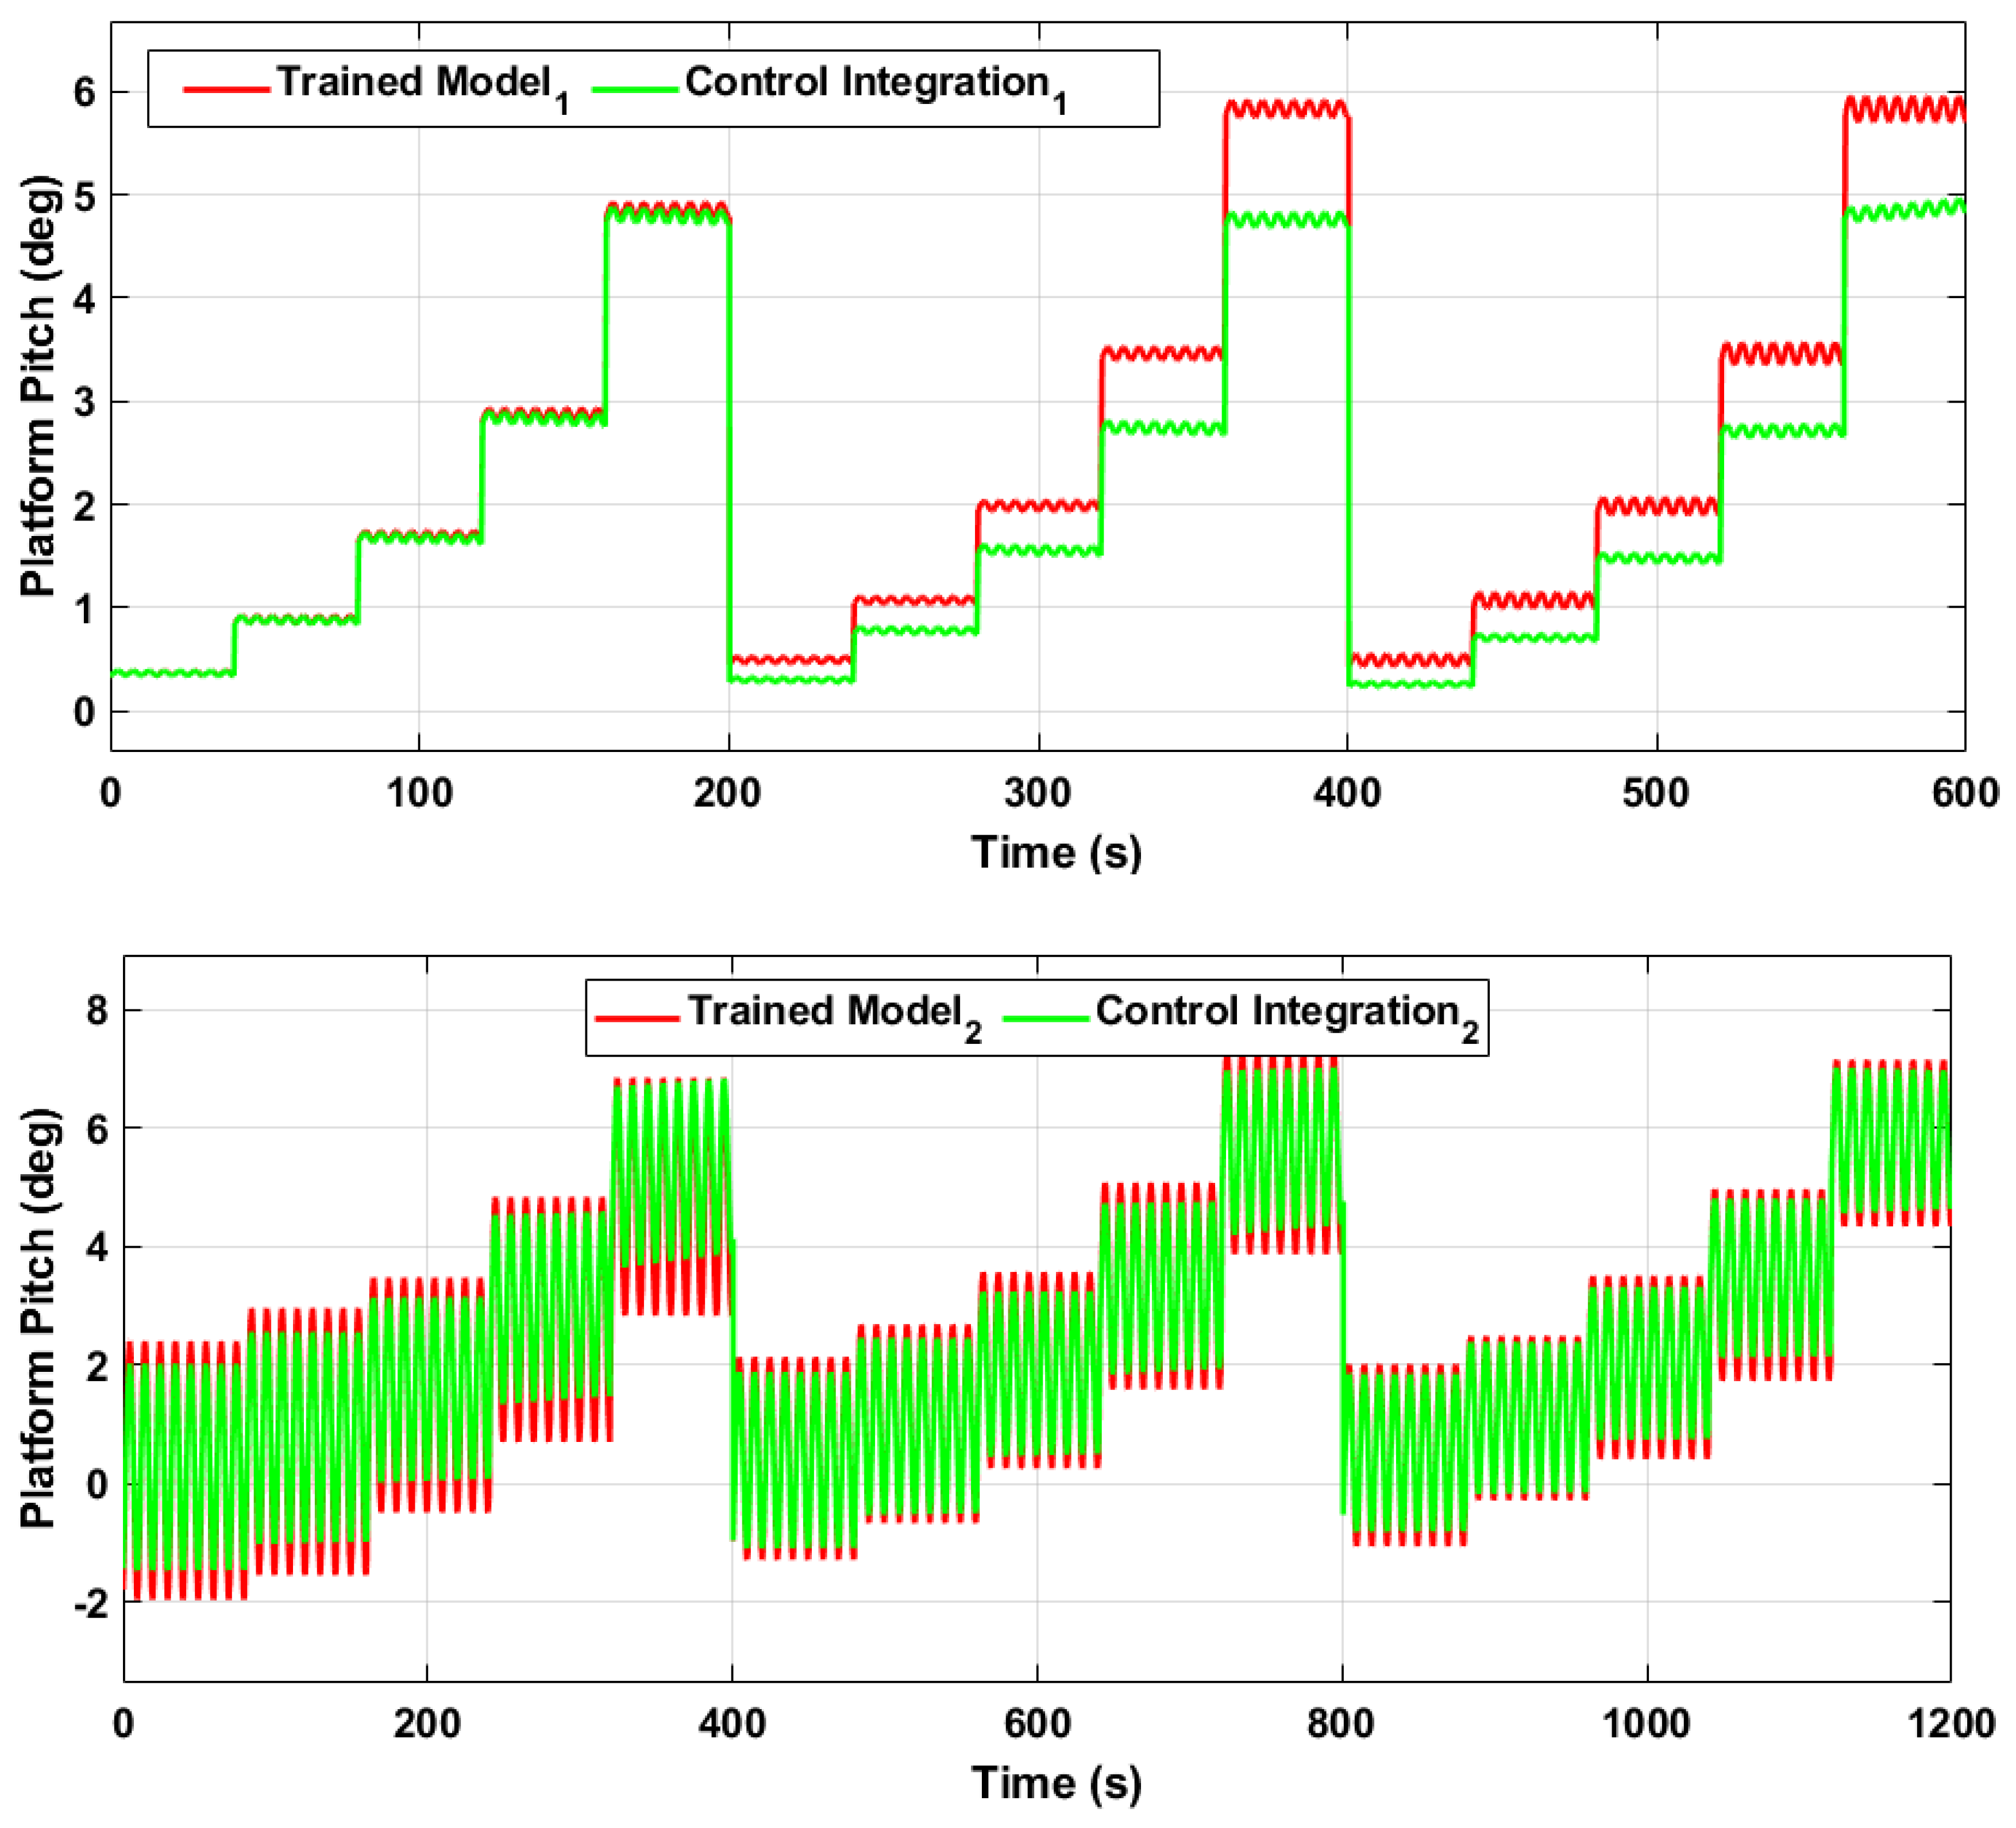
The series of control implementation graphs in Figure 22, demonstrates the performance of a PID-controlled system, in which the green lines represent the control actions and their resulting system stability, indicated by the reduced oscillations. The first graph reveals that the control actions closely follow the predicted model values with minimal oscillations, suggesting that the PID controller is well-tuned for the system’s dynamics within this specific scenario. The small oscillation amplitude indicates a finely adjusted control response that quickly stabilizes the platform pitch. Moving to the second graph, as the system is subjected to what may be a different set of conditions or a longer wave period, there is a slight increase in the oscillation magnitude. Despite this, the control action remains effective, keeping the platform pitch oscillations within a narrow band, indicative of a robust control system that compensates for the increased complexity of the input signal.

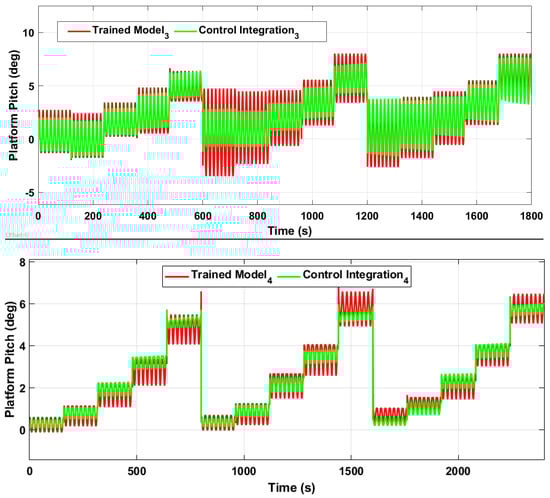
Figure 22.
PID control design for platform pitch across several wave periods (5 s, 10 s, 14 s, and 20 s), each with varying wind speeds (5, 8, 11, 14, and 17 m/s) and wave height of 1 m.
The third graph shows the response of the system to yet another set of conditions, potentially with even longer wave periods. Here, the control action successfully dampens oscillations, although there is a noticeable transient deviation after each significant change in the platform pitch. The transient peaks suggest the system may be approaching the limits of its design parameters, yet it still manages to return to a stable state quickly without prolonged or escalating oscillations. In the fourth graph, despite further complexity due to extended intervals or increased environmental challenges, the PID controller, improved by gain scheduling, demonstrates a commendable job of maintaining stability. The control actions result in bounded oscillations, indicating that the system has a good transient response and can settle within an acceptable range after being subjected to disturbances.
The effectiveness of the PID control system in reducing oscillations across different wave periods is presented in Table 5. The data reveal that the mean oscillation amplitude is significantly reduced when the control system is applied, demonstrating significant reductions in oscillation amplitudes across different conditions. For instance, at a wave period of 20 s and a wind speed of 5 m/s, the fore-aft displacement is reduced by 35%, indicating the control system’s robustness. The consistent reduction in oscillation percentage, ranging from 5% to 35%, underscores the PID system’s capability to enhance stability and control in FOWT-OWC integrated systems under diverse operational scenarios. These findings highlight the potential of the PID control system in practical applications requiring precise oscillation control.
Table 5.
Impact of wave periods, wind speeds, and wave elevations on fore-aft displacement, pitch response, and oscillation reduction with PID control.
Statistically, the lower oscillation amplitudes across all four scenarios suggest that the PID gain scheduling is effectively calibrated. The control system appears to possess both a high degree of precision and an ability to quickly adapt to varying conditions, maintaining the platform pitch within tightly controlled limits. This is consistent with a well-designed control system that can mitigate the risk of instability even when dealing with complex, dynamic environmental inputs.
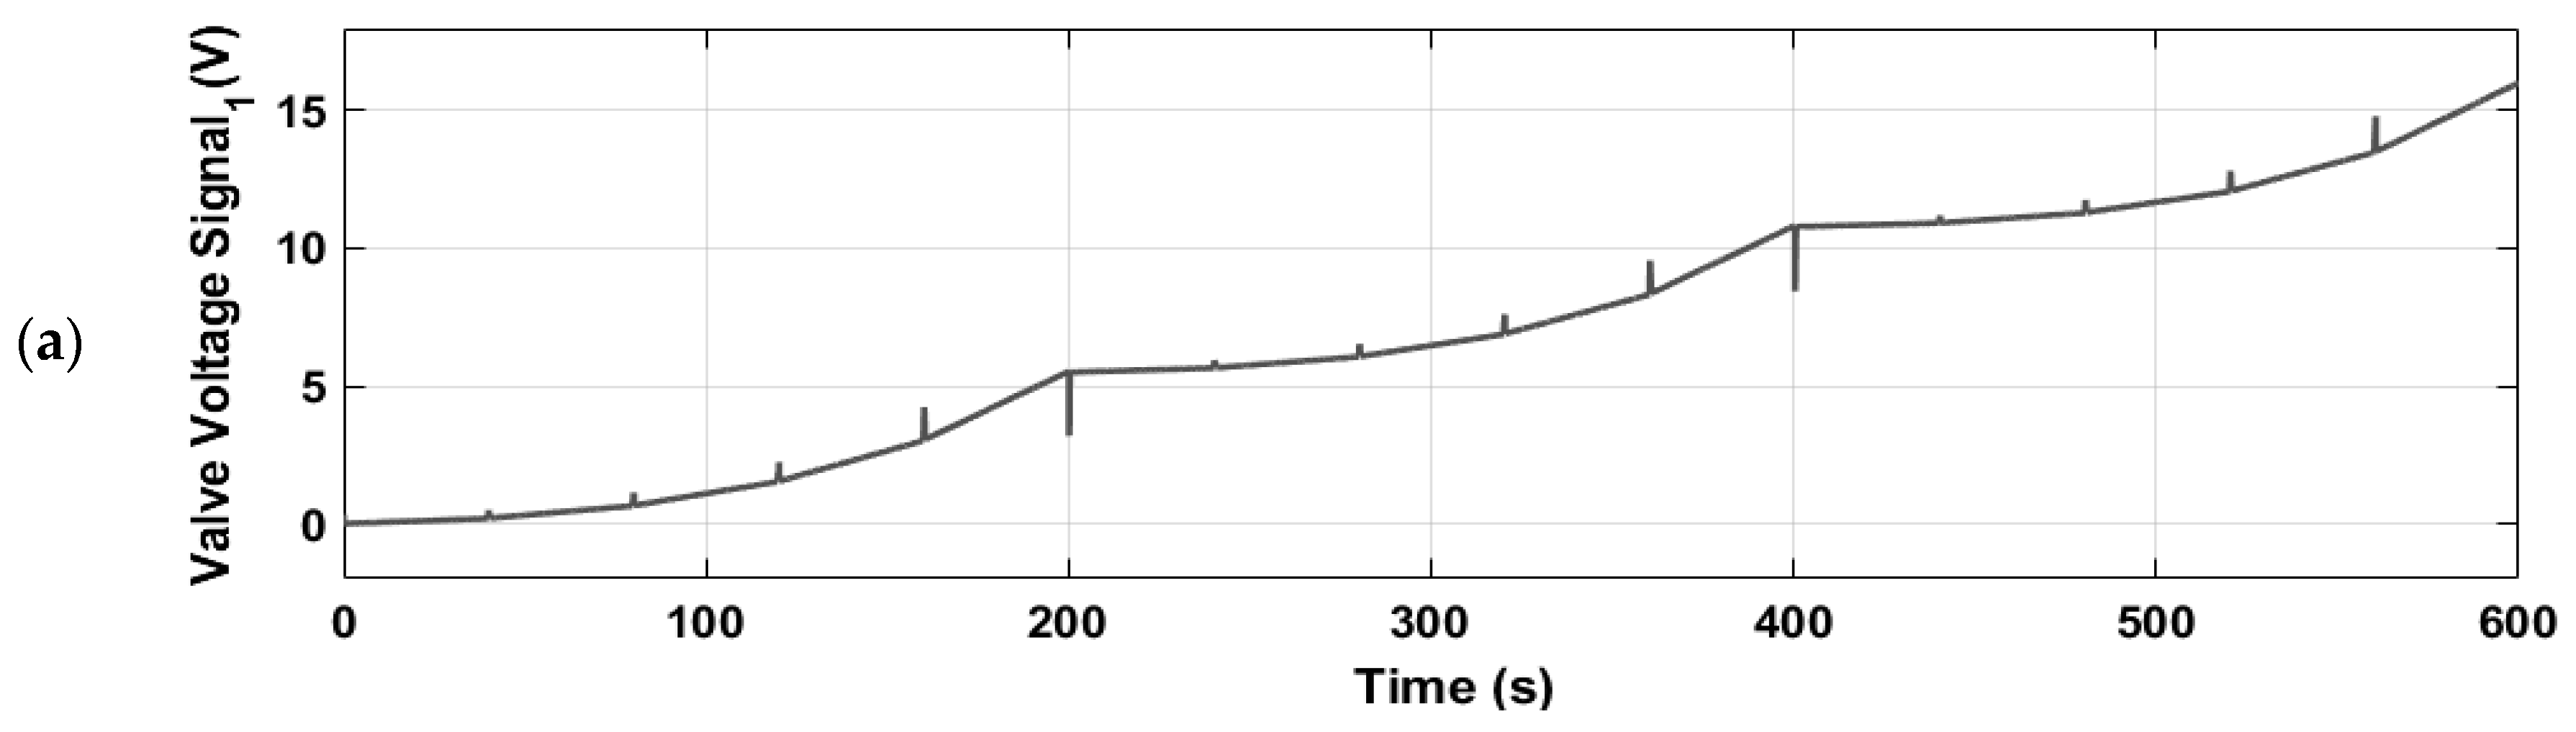
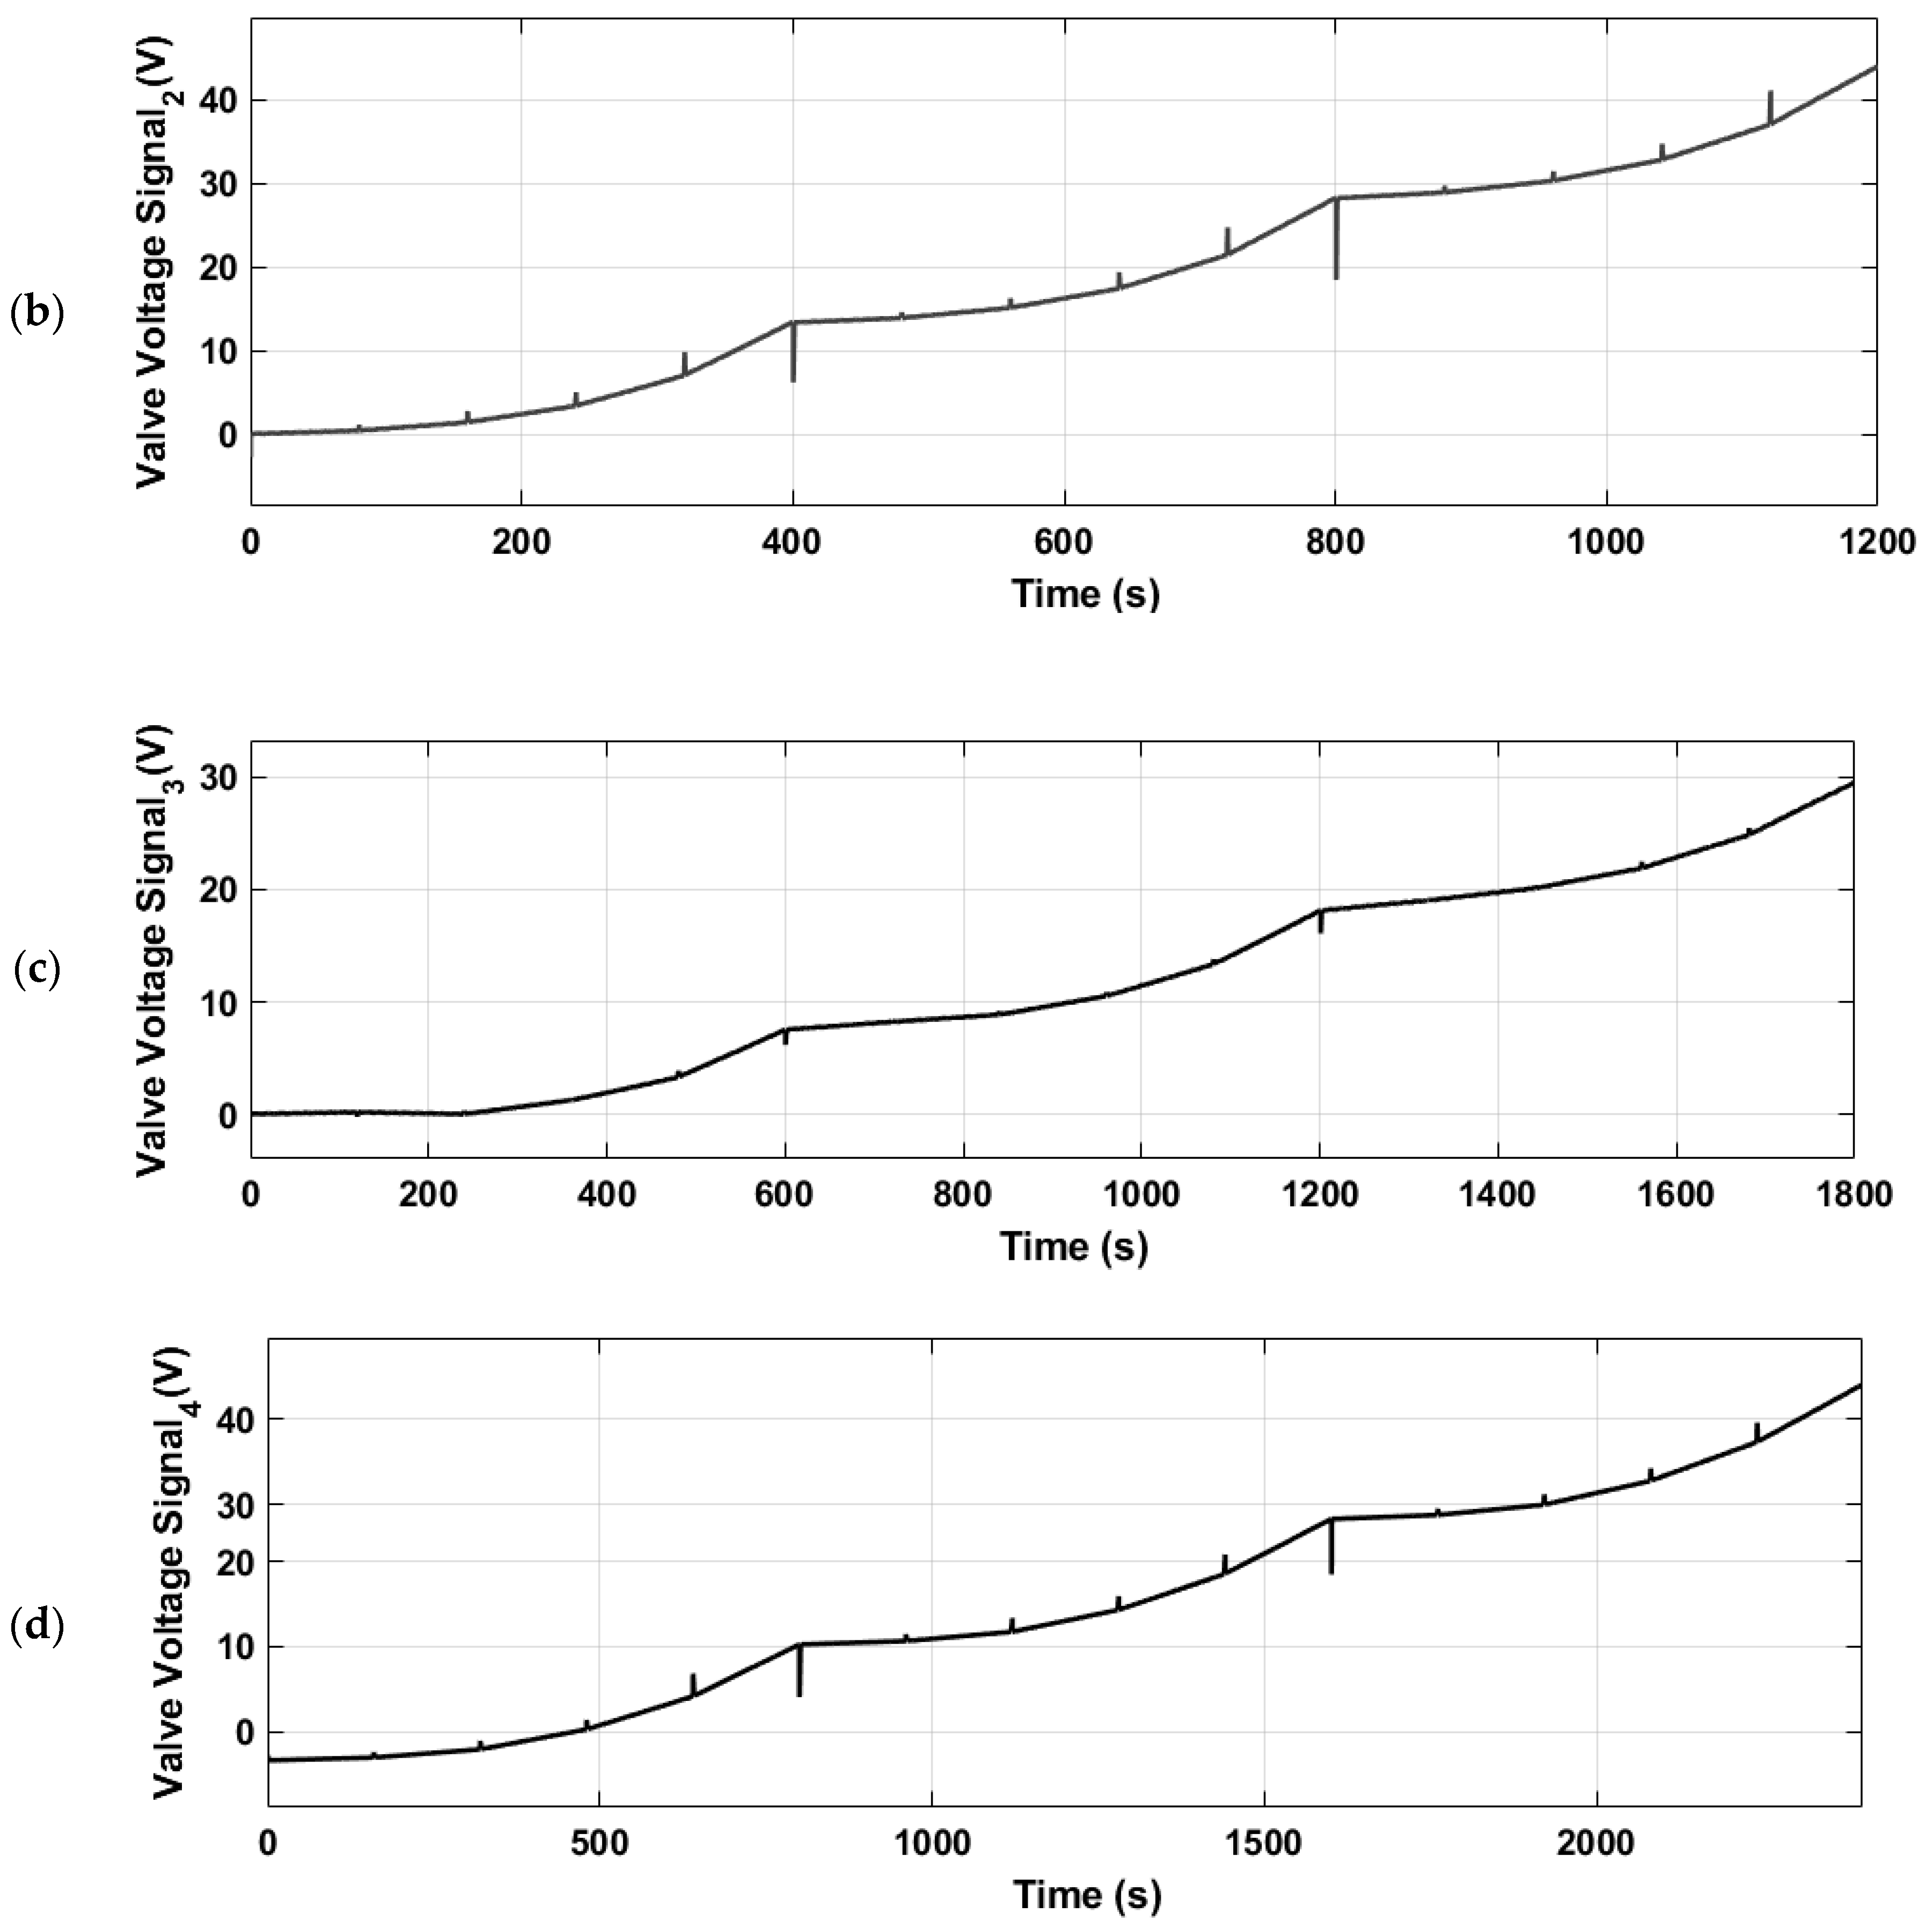
Figure 23 shows the PID controller’s voltage output over time for various wave periods and wind speeds. Specifically, it includes wave periods of 5 s, 10 s, 14 s, and 20 s, each plotted with their respective time scales: 600 s, 1200 s, 1800 s, and 2400 s. These time scales correspond to the selected wave periods, ensuring a comprehensive representation of the controller’s performance. The stepwise increase in voltage across all graphs indicates a controlled and adaptive approach to system regulation, with the gain scheduling effectively modulating the PID gains to manage the dynamic environment.
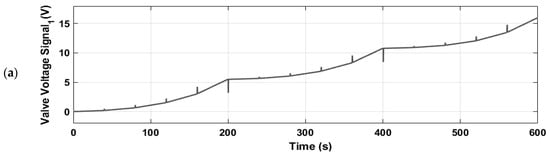

Figure 23.
Control signals for the fore-aft displacement across different wave periods of (a) 5 s, (b) 10 s, (c) 14 s, and (d) 20 s, each with varying wind speeds (5, 8, 11, 14, and 17 m/s) and wave height of 1 m.
In the first graph, the voltage response is moderate, reflecting proportional and deliberate action to minor disturbances. The second graph shows a stronger response, suggesting the controller’s compensation for more significant disturbances. The third and fourth graphs extend this pattern, with the controller addressing sustained or evolving disturbances, maintaining system stability throughout. The consistent valve voltage increase without abrupt fluctuations highlights the PID controller’s effectiveness in ensuring smooth and stable system control over time.
The PID control tuning process was conducted using Simulink MATLAB to ensure precise optimization of the PID parameters. The control design of the FOWT-OWC system was modeled in Simulink, and initial PID parameters were estimated through theoretical and empirical methods. Simulations were run to observe system responses, with iterative adjustments made using Simulink PID Tuner for optimal performance. The tuning process ensured the control system could handle various environmental conditions, maintain stability, and minimize overshoot and settling time. The final PID parameters were validated through extensive testing, demonstrating the control strategy’s effectiveness and reliability in practical applications, as shown in Table 6. These configurations are reflective of strategic adjustments made to ensure optimal system performance across varying maritime conditions. For N1, which operates within a 5-m wave environment, the proportional gain is set at 0.65, indicating a strong responsive action is favored in this scenario. This is complemented by a derivative gain of 0.02, which moderates the rate of change in the system’s response, providing a dampening effect to potential oscillations. N2, adapting to a 10-m wave period, utilizes a slightly lower proportional gain of 0.565, demonstrating a controlled and less aggressive approach to system error correction. The derivative gain here is adjusted to 0.0164, fine-tuning the system’s responsiveness to changes over time. In the case of N3, contending with a 14-m wave period, the proportional gain is increased to 0.89, reflecting a robust control strategy to swiftly address system deviations. The corresponding derivative gain of 0.084 is indicative of a strategy designed to provide stability and counteract the inertia that comes with larger wave impacts. Finally, parameters for N4, a 20-m wave period, show a proportional gain of 0.73, balancing prompt corrective action with the need for stability in more substantial wave conditions. The derivative gain is set at 0.072, suggesting a tailored approach to maintain control without over-dampening the response of system. The integral gains for all networks are notably negative; instead of accumulating positive corrections, they accumulate negative corrections.
Table 6.
Control parameters for four distinct networks.
This unique adjustment offers advantages in these specialized applications, as it implies a reduction of the integral response, which could potentially be beneficial in systems where over-integration of the error could lead to instability or performance issues. Overall, the selection of PID parameters demonstrates a thoughtful approach to achieving a balance between responsiveness and stability, ensuring that each network can effectively cope with the dynamic challenges presented by its specific operational wave period.
The reliance on simulation data poses a challenge, as it may not capture all real-world variabilities. Additionally, assumptions regarding environmental conditions and system parameters can affect the generalizability of the findings. Consequently, there is a necessity for field tests to validate the effectiveness of the proposed ANN models and PID control strategies in practical applications. The authors plan to incorporate Convolutional Neural Networks (CNNs) and Recurrent Neural Networks (RNNs) in future comparative analyses to leverage their advanced spatial and temporal processing capabilities. This strategic expansion is intended to enhance the modeling accuracy and increase the predictive precision of their simulations, thereby broadening the scope and depth of their methodology.
6. Conclusions
This study significantly contributes to offshore renewable energy by integrating FOWTs with OWCs. The dynamic complexities and uncertainties inherent in these systems have been effectively addressed through the innovative application of ANNs for regressive modeling and an advanced proportional-integral-derivative control mechanism. This approach leverages data-driven models trained on OpenFAST datasets to facilitate real-time predictive behavior analysis and decision-making. The results demonstrated a substantial reduction in platform pitch motion across diverse operational conditions, which is vital for improving system reliability and longevity. The deployment of the intelligent control system, tailored for this application, was pivotal in achieving these outcomes. A comparative analysis with ITI-barge-based systems highlighted that the proposed modeling and control approaches significantly enhanced system stability and efficiency, as evidenced by the successful mitigation of platform pitch motion, directly correlating with increased platform stability and overall system performance.
The findings underscore the efficacy of ANN-driven modeling and advanced control strategies as viable alternatives to traditional methods, offering superior performance in managing the intricate dynamics of these systems. This research not only advances the current understanding and methodologies in the field but also sets a robust framework for future innovations in feedback control for renewable energy systems. The introduction of a feedback control mechanism was critical in achieving the observed improvements in system stability, providing a closed-loop system that continuously adjusts based on real-time data to maintain optimal performance. The methodologies and results presented in this study pave the way for significant advancements in offshore renewable energy, marking a critical step towards more sustainable energy solutions. By establishing a model for feedback control and system stability, this research provides a foundation for future work aimed at enhancing the efficiency and resilience of renewable energy technologies.
Author Contributions
Conceptualization, I.A., F.M., P.A., I.G. and A.J.G.; methodology, I.A., F.M., P.A., I.G. and A.J.G.; software, I.A., F.M., P.A., I.G. and A.J.G.; validation, A.J.G.; data curation, I.A., F.M. and P.A.; writing—original draft preparation, I.A., F.M. and P.A.; writing—review and editing, F.M., P.A., I.G. and A.J.G.; supervision, I.G. and A.J.G. All authors have read and agreed to the published version of the manuscript.
Funding
This research work was partially funded by the Basque Government through Grant IT1555-22, MICIU/AEI/10.13039/501100011033 and ERDF/EU through Grants PID2021-123543OB-C21 and PID2021-123543OB-C22, the University of the Basque Country (UPV-EHU) through grant PIF20/299, the UPV-EHU/MIU/Next Generation, EU through Margarita Salas grant MARSA22/09 and the María Zambrano grant MAZAM22/15.
Data Availability Statement
All data generated or analyzed during this study are included in this published article.
Conflicts of Interest
The authors declare that they have no conflicts of interest. This research was conducted in the absence of any commercial or financial relationships that could be construed as a potential conflict of interest.
References
- Jung, C.; Schindler, D. Efficiency and effectiveness of global onshore wind energy utilization. Energy Convers. Manag. 2023, 280, 116788. [Google Scholar] [CrossRef]
- Chen, M.; Li, C.B.; Han, Z.; Lee, J.-B. A simulation technique for monitoring the real-time stress responses of various mooring configurations for offshore floating wind turbines. Ocean Eng. 2023, 278, 114366. [Google Scholar] [CrossRef]
- Zhou, B.; Zhang, Z.; Li, G.; Yang, D.; Santos, M. Review of key technologies for offshore floating wind power generation. Energies 2023, 16, 710. [Google Scholar] [CrossRef]
- Goyal, R. Advancements in Offshore Wind Energy Technology: Challenges and Opportunities for Sustainable Power Generation. J. Sustain. Solut. 2024, 1, 1–4. [Google Scholar]
- Jolly, S.; Steen, M.; Hansen, T.; Afewerki, S. Renewable energy and industrial development in pioneering and lagging regions: The offshore wind industry in southern Denmark and Normandy. Oxf. Open Energy 2023, 2, oiad010. [Google Scholar] [CrossRef]
- Guo, X.; Chen, X.; Chen, X.; Sherman, P.; Wen, J.; McElroy, M. Grid integration feasibility and investment planning of offshore wind power under carbon-neutral transition in China. Nat. Commun. 2023, 14, 2447. [Google Scholar] [CrossRef]
- Garrido, I.; Garrido, A.J.; Lekube, J.; Otaola, E.; Carrascal, E. Oscillating water column control and monitoring. In Proceedings of the OCEANS 2016 MTS/IEEE Monterey, Monterey, CA, USA, 19–23 September 2016; pp. 1–6. [Google Scholar]
- Karimirad, M. Offshore Energy Structures: For Wind Power, Wave Energy and Hybrid Marine Platforms; Springer: Cham, Switzerland, 2014. [Google Scholar]
- Ahmad, I.; M’zoughi, F.; Aboutalebi, P.; Garrido, I.; Garrido, A.J. A regressive machine-learning approach to the non-linear complex FAST model for hybrid floating offshore wind turbines with integrated oscillating water columns. Sci. Rep. 2023, 13, 1499. [Google Scholar] [CrossRef] [PubMed]
- Stetco, A.; Dinmohammadi, F.; Zhao, X.; Robu, V.; Flynn, D.; Barnes, M.; Keane, J.; Nenadic, G. Machine learning methods for wind turbine condition monitoring: A review. Renew. Energy 2019, 133, 620–635. [Google Scholar] [CrossRef]
- Jessen, K.; Laugesen, K.; Mortensen, S.M.; Jensen, J.K.; Soltani, M.N. Experimental validation of aero-hydro-servo-elastic models of a scaled floating offshore wind turbine. Appl. Sci. 2019, 9, 1244. [Google Scholar] [CrossRef]
- Uzunoglu, E.; Karmakar, D.; Guedes Soares, C. Floating offshore wind platforms. In Floating Offshore Wind Farms; Springer: Cham, Switzerland, 2016; pp. 53–76. [Google Scholar]
- Ahmad, I.; M’zoughi, F.; Aboutalebi, P.; Garrido, I.; Garrido, A.J. Fuzzy logic control of an artificial neural net-work-based floating offshore wind turbine model integrated with four oscillating water columns. Ocean. Eng. 2023, 269, 113578. [Google Scholar] [CrossRef]
- Gajendran, M.K.; Kabir, I.F.S.A.; Vadivelu, S.; Ng, E.Y.K. Machine Learning-Based Approach to Wind Turbine Wake Prediction under Yawed Conditions. J. Mar. Sci. Eng. 2023, 11, 2111. [Google Scholar] [CrossRef]
- Memari, M.; Shakya, P.; Shekaramiz, M.; Seibi, A.C.; Masoum, M.A.S. Review on the Advancements in Wind Turbine Blade Inspection: Integrating Drone and Deep Learning Technologies for Enhanced Defect Detection. IEEE Access 2024, 12, 33236–33282. [Google Scholar] [CrossRef]
- Kim, T.; Kim, C.; Song, J.; You, D. Optimal control of a wind farm in time-varying wind using deep reinforcement learning. Energy 2024, 303, 131950. [Google Scholar] [CrossRef]
- Soler, D.; Mariño, O.; Huergo, D.; de Frutos, M.; Ferrer, E. Reinforcement learning to maximize wind turbine energy generation. Expert Syst. Appl. 2024, 249, 131950. [Google Scholar] [CrossRef]
- Lamnabhi-Lagarrigue, F.; Annaswamy, A.; Engell, S.; Isaksson, A.; Khargonekar, P.; Murray, R.M.; Nijmeijer, H.; Samad, T.; Tilbury, D.; Hof, P.V.D. Systems & Control for the future of humanity, research agenda: Current and future roles, impact and grand challenges. Annu. Rev. Control 2017, 43, 1–64. [Google Scholar] [CrossRef]
- Tsai, F.-M.; Kao, S.-L.; Sujanto, R.Y.; Tseng, M.-L.; Hsu, T.-W.; Chou, C.-C. Causality of Risk Assessment Attributes under Uncertainty in Taiwan’s Offshore Wind Farms Development. J. Mar. Sci. Eng. 2023, 11, 225. [Google Scholar] [CrossRef]
- Martinez, A.; Iglesias, G. Global wind energy resources decline under climate change. Energy 2024, 288, 129765. [Google Scholar] [CrossRef]
- Cheng, A.; Low, Y.M. A new metamodel for predicting the nonlinear time-domain response of offshore structures subjected to stochastic wave current and wind loads. Comput. Struct. 2024, 297, 107340. [Google Scholar] [CrossRef]
- Jiang, H.; Wang, H.; Vaz, M.A.; Bai, X. Research on dynamic response prediction of semi-submersible wind turbine platform in real sea test model based on machine learning. Appl. Ocean Res. 2024, 142, 103808. [Google Scholar] [CrossRef]
- Milles, A.; Merabet, E.; Benbouhenni, H.; Debdouche, N.; Colak, I. Robust control technique for wind turbine system with interval type-2 fuzzy strategy on a dual star induction generator. Energy Rep. 2024, 11, 2715–2736. [Google Scholar] [CrossRef]
- Lemmer, F.; Schlipf, D.; Cheng, P.W. Structural optimization of FOWT platforms using genetic algorithms. J. Offshore Mech. Arct. Eng. 2018, 140, 011402. [Google Scholar] [CrossRef]
- Raissi, M.; Perdikaris, P.; Karniadakis, G.E. Hidden physics models: Machine learning of nonlinear partial differential equations. J. Comput. Phys. 2018, 357, 125–141. [Google Scholar] [CrossRef]
- M’zoughi, F.; Garrido, I.; Garrido, A.J.; De La Sen, M. Fuzzy Airflow-Based Active Structural Control of Integrated Oscillating Water Columns for the Enhancement of Floating Offshore Wind Turbine Stabilization. Int. J. Energy Res. 2023, 2023, 4938451. [Google Scholar] [CrossRef]
- Perdomo, O.; Wei, F.S. On the flapping motion of a helicopter blade: Applied Mathematics and Modeling. Appl. Math. Model. 2017, 46, 299–311. [Google Scholar] [CrossRef]
- Wu, M.-Y.; Wu, Y.; Yuan, X.-Y.; Chen, Z.-H.; Wu, W.-T.; Aubry, N. Fast Prediction of Flow Field around Airfoils Based on Deep Convolutional Neural Network. Appl. Sci. 2022, 12, 12075. [Google Scholar] [CrossRef]
- Prantl, L.; Bonev, B.; Thuerey, N. High-dimensional aerodynamic data modeling using a machine learning method based on a convolutional neural network. Adv. Aerodyn. 2017, 1, 15. [Google Scholar]
- Moin, H.; Khan, H.Z.I.; Mobeen, S.; Riaz, J. Airfoil’s Aerodynamic Coefficients Prediction using Artificial Neural Network. In Proceedings of the 2022 19th International Bhurban Conference on Applied Sciences and Technology (IBCAST), Islamabad, Pakistan, 16–20 August 2022; pp. 175–182. [Google Scholar]
- Raissi, M.; Perdikaris, P.; Karniadakis, G.E. Physics-informed neural networks: A deep learning framework for solving forward and inverse problems involving nonlinear partial differential equations. J. Comput. Phys. 2019, 378, 686–707. [Google Scholar] [CrossRef]
- Cordle, A.; Jonkman, J. State of the art in floating wind turbine design tools. In Proceedings of the ISOPE International Ocean and Polar Engineering Conference (ISOPE), Maui, HI, USA, 19–24 June 2011. [Google Scholar]
- Santoni, C.; Khosronejad, A.; Seiler, P.; Sotiropoulos, F. Toward control co-design of utility-scale wind turbines: Collective vs. individual blade pitch control. Energy Rep. 2023, 9, 793–806. [Google Scholar] [CrossRef]
- Shah, S.A.A.; Gao, B.; Ahmed, N.; Liu, C. Advanced robust control techniques for the stabilization of translational oscillator with rotational actuator based barge-type OFWT. Proc. Inst. Mech. Eng. Part M J. Eng. Marit. Environ. 2021, 235, 327–343. [Google Scholar] [CrossRef]
- Stewart, G.M.; Lackner, M.A. The effect of actuator dynamics on active structural control of offshore wind turbines. Eng. Struct. 2011, 33, 1807–1816. [Google Scholar] [CrossRef]
- Aslmostafa, E.; Hamida, M.A.; Plestan, F. Nonlinear control strategies for a floating wind turbine with PMSG in Region 2: A comparative study based on the OpenFAST platform. Ocean Eng. 2024, 300, 117507. [Google Scholar] [CrossRef]
- Danayiyen, Y.; Dinçer, K.; Nuhoğlu, Y. A Novel Fractional Order Proportional Integral-Fractional Order Proportional Derivative Controller Design Based on Symbiotic Organisms Search Algorithm for Speed Control of a Direct Current Motor. Electrica 2024, 24, 327–335. [Google Scholar] [CrossRef]
- Didier, F.; Liu, Y.-C.; Laghrouche, S.; Depernet, D. A Comprehensive Review on Advanced Control Methods for Floating Offshore Wind Turbine Systems above the Rated Wind Speed. Energies 2024, 17, 2257. [Google Scholar] [CrossRef]
- Ibarra-Berastegi, G.; Sáenz, J.; Ulazia, A.; Serras, P.; Esnaola, G.; Garcia-Soto, C. Electricity production, capacity factor, and plant efficiency index at the Mutriku wave farm (2014–2016). Ocean. Eng. 2018, 147, 20–29. [Google Scholar] [CrossRef]
- Komar, P.D.; Gaughan, M.K. Airy Wave Theory and Breaker Height Prediction. In Proceedings of the 13th International Conference on Coastal Engineering, Vancouver, BC, Canada, 10–14 July 1972; pp. 405–418. [Google Scholar]
- Bretschneider, C.L. Wave Variability and Wave Spectra for Wind-Generated Gravity Waves (No. 118). Ph.D. Thesis, Texas A&M University, College Station, TX, USA, 1959. [Google Scholar]
- Mazzaretto, O.M.; Menéndez, M.; Lobeto, H. A global evaluation of the JONSWAP spectra suitability on coastal areas. Ocean Eng. 2022, 266, 112756. [Google Scholar] [CrossRef]
- Chaudhuri, A.; Datta, R.; Kumar, M.P.; Davim, J.P.; Pramanik, S. Energy Conversion Strategies for Wind Energy System: Electrical, Mechanical and Material Aspects. Materials 2022, 15, 1232. [Google Scholar] [CrossRef] [PubMed]
- Aboutalebi, P.; Garrido, A.J.; Garrido, I.; Nguyen, D.T.; Gao, Z. Hydrostatic stability and hydrodynamics of a floating wind turbine platform integrated with oscillating water columns: A design study. Renew. Energy 2024, 221, 119824. [Google Scholar] [CrossRef]
- Kim, D.; Bae, Y.H. Multibody Analysis of Wave Energy Converters and a Floating Platform in the Time Domain. J. Mar. Sci. Eng. 2024, 12, 265. [Google Scholar] [CrossRef]


Disclaimer/Publisher’s Note: The statements, opinions and data contained in all publications are solely those of the individual author(s) and contributor(s) and not of MDPI and/or the editor(s). MDPI and/or the editor(s) disclaim responsibility for any injury to people or property resulting from any ideas, methods, instructions or products referred to in the content. |
© 2024 by the authors. Licensee MDPI, Basel, Switzerland. This article is an open access article distributed under the terms and conditions of the Creative Commons Attribution (CC BY) license (https://creativecommons.org/licenses/by/4.0/).