1. Introduction
Wave energy converters (WECs) are devices that convert the kinetic energy of moving ocean waves into electrical energy. The all-time availability and consistency of the wave power profile is uniquely propositioned to harness wave energy as a valuable resource particularly when deployed in non-shallow settings [
1,
2,
3,
4] unlike solar, wind, and battery energy storages, which are intermittent resources. Marine energy resources, such as tidal, wave, and ocean currents, are consistently available and abundant, showing high-power density, and are complementary to various renewable energy resources. In particular, wave energy converter technologies and developments have continuously gained substantial attention over the last decade due to the vast amount of oceanic kinetic energy that should not be overlooked. In some regions, wave energy is large enough to create a considerable portion of the energy mix. The U.S. Department of Energy estimates that the exploitation of marine renewable energy could produce electricity as high as 64% of total U.S. electricity consumption in 2019 [
3]. Resiliency pull force and decarbonization push force are the key driving forces for emerging energy systems with significant integration of energy electronics. The energy transition toward a net-zero energy system is realized by deploying distributed energy resources (DERs) demanding significant penetration of inverter-based renewable resources (IBRs) [
4,
5,
6]. Considering substantial water testing and proofs of concepts reported over the last decade, marine energy technologies are still in the early stages of technology readiness and have not yet received a commercial success breakthrough. There are multiple pathways to achieve smooth wave energy deployment in real-world fields, but all require sustained innovation across all renewable energy technologies.
The efficient transformation of wave energy into electricity offers enormous benefits to island and shoreline communities during and after the occurrence of natural disasters such as hurricanes and typhoons when the grid supply is interrupted, whereas supporting the blue economy markets [
7,
8] is still necessary. The researchers in [
8] conducted a comprehensive analysis on the effects of a downscaled WEC location on its operational performance for particular area of the Adriatic Sea with respect to variability in the wave energy extraction, power production, and profitability of different kinds of WECs. An interesting study reported in [
9] outlines important factors for acceleration developments of an energy mix in the Croatian part of the Adriatic Sea by comparing the capacity factors of the seasonal and annual levels and the extreme significant wave height for possible offshore wind energy generation and wave energy harvesting under small wave energy periods. The researchers in [
10] studied a novel oscillating float wave energy generation solution through assessing the hydrodynamic performance and energy capture characteristics theoretically and by performing a numerical CFD simulation for different wave time periods and heights. The outcome of this study contributed to the technical engineering basis for studying oscillating float wave power technologies. Furthermore, a thorough analysis of nine different and popular types of WEC technologies was outlined in [
11] for specific locations in the bay of Cádiz, Spain, with the intention of proving energy market potential for wave energy exploitation. The findings of this study provided a power matrix referencing a proper location for the installation of each specific type of WEC in addition to the operating response of those WECs corresponding to each reference location based on various wave heights and peak periods. From the mentioned studies, it is clear that the architecture of the efficient power take-off (PTO) system deployed in any WEC can provide a path to reach to the target wave energy extraction, which is mostly ignored by the research community. This identified gap was a focus area in this research work to bridge the gap.
Despite the realm of successful research studies reported lately [
12,
13,
14,
15,
16,
17,
18,
19,
20,
21,
22,
23,
24,
25,
26], most of the PTO design analyses centered on linearized modeling, idealized power electronics converters, and lossless devices and simply neglected the nonlinear fast transient characteristics, handling the high power density of the ocean waves and the bidirectional power flow capability of the WEC systems. The power density of the wave energy is estimated as 2–3 kW/m
2, showing 5 times and 25 times higher power densities than wind energy and solar energy, respectively [
12]. These new features have imposed new technical, planning, and operational challenges in modern energy systems [
13]. Ignoring physical constraints greatly influences the behavior of power electronics conversions, resulting in discrepancies emerging between theoretical findings, optimization, and experimental outcomes that remain unaddressed in many published studies.
In marine energy technologies, PTO systems are well known as an enabling technology that plays a substantial role in power extraction and energy flexibility improvement. Subsequent research studies [
14,
15,
16,
17] have delved into introducing PTO solutions over the last decade; however, the majority of them relied heavily on the simple assumptions that overlooked the new identified challenges of deployment power electronics alongside advanced control schemes in the PTO designs as explained earlier. This reliance presents practical limitations of using these PTO systems that are prone to malfunction.
Along with the ongoing WEC prototype developments in different technology readiness levels, the holistic analysis of their PTO system considering all components, interoperability considerations, and control designs at the commercialized scale to function in a reliable manner is missing. For instance, in [
18], the topology of the generator was studied to investigate the rotor tooth effects and magnet geometry impacts through experimental validation. Clearly, the PTO system comprises additional components compared with the generator, which were not addressed in that research and could impact the entire operation of the WEC system. Along this research line, the study presented in [
19] developed the WEC model predictive control (MPC) algorithm as an alternative to the existing prediction-based solutions such as [
20], which relied on an explicit wave force forecast, to achieve an optimized response by taking the losses in the PTO and drivetrain systematically into account. However, the study in [
19] did not include the significant nonlinear dynamics of the WEC systems, and solely the simulation verification of the proposed technique for a heaving cylindrical buoy is discussed.
Multiple prototypes of the PTO systems are currently under development based on the two-body floating point absorbers such as the studies reported in [
21,
22,
23,
24,
25,
26]; the float and the spar are coupled via a PTO system, and their relative motion is transferred to the PTO to produce electric power. The PTO is installed inside the spar and utilizes a ball-screw or rack-pinion mechanism to convert the linear rotation, which is normally two-directional to the unidirectional motion conversion for a generator, e.g., a permanent magnet synchronous generator (PMSM). In these hardware prototypes, the PTO system can be either a direct-drive generator with an ultracapacitor as the energy storage device or a hydraulic PTO system as explained in [
26]. This strategy is limited to a certain type of WEC; as such, it cannot be applied to point-absorber WECs, which exploit wave energy in all directions.
The proposed PTO topology introduced in this work placed a big emphasis on modularity, scalability, and energy flexibility in the design to maximize electricity production and efficiency. In this way, the system can be modified based on the geographical and financial needs. If energy needs to be harvested for a beach-side community, then this technology can be implemented on a smaller scale with reduced impact to the surrounding marine life. If power output is the main priority, thanks to its scalability feature, more wave energy converter units can be placed in series to harvest more energy in deeper water. The modularity can be attributed to the modular multilevel converter (MMC) topology, which is a type of converter that has not been implemented in full-scale systems in the marine energy industry sector. This technology, however, has been gaining interest recently due to its operational merits in medium-voltage applications. A modular design offers single cells that can be bypassed and replaced when necessary for a fail-safe mode through the control system. The proposed design provides high power quality of a voltage and load current waveform without placing costly and bulky passive filters, which are common in industry and the majority of the existing solutions reported in the literature [
14,
27].
The deployment of the proposed PTO system and its controls for point-absorber WEC technologies creates opportunities for new marine distribution systems operator (DSO) models to offer equitable access and integration in energy markets to maximize the value of renewable energy assets [
28].
To address the identified open gaps, this study aimed to harness insights through both simulation testing and hardware lab experiments. In this context, we demonstrated a proof of concept of the proposed point absorber WEC using the fabricated 3D plug-and-play mockup prototype to examine the motion characteristics. To experimentally verify the performance of the proposed all-electric PTO system, a set of experiments were conducted using the constructed 1 kW laboratory setup.
The ultimate objective of this research work was twofold: (a) introduce a PTO system adaptable to different types of point-absorbing WECs that offers a possible solution to the identified open gaps and (b) enhance the existing WEC technologies including controls and high-power quality to satisfy the unmet needs by integrating solar and battery energy storage into WEC design. However, this study should make it clear that reaching the target of introducing a WEC system along with its efficient PTO device will take time to develop and yield reliable, resilient, and prosperous results.
The proposed all-electric modular and scalable PTO in this research fits very well in alignment with the upcoming offshore wind and industry outlook as the buoy and generators can be deployed in between the major offshore-wind turbines that are relatively far apart in current real-world fields. Hence, the generated electricity from wave energy could be injected into distribution substation of an existing wind farm either deployed on land or offshore, further reducing the installation cost of the proposed WEC system.
The rest of this paper is organized as follows. In
Section 2, the envisioned WEC device with the proposed PTO system and the principal operation of the MMC converter technology are described.
Section 3 gives the hardware prototype design and implementation of the proposed PTO system.
Section 4 provides the results of the simulation scenarios and experiments using the lab setup for verification analysis. Last,
Section 5 concludes this paper with the key findings from the conducted research work, future improvements of the proposed WEC solution, and prospective technology.
2. Configuration of the Studied Point-Absorber Wave Energy Converter and Its Power Take-Off System
2.1. Description of the Studied Point-Absorber WEC and Its Mechanical Layout
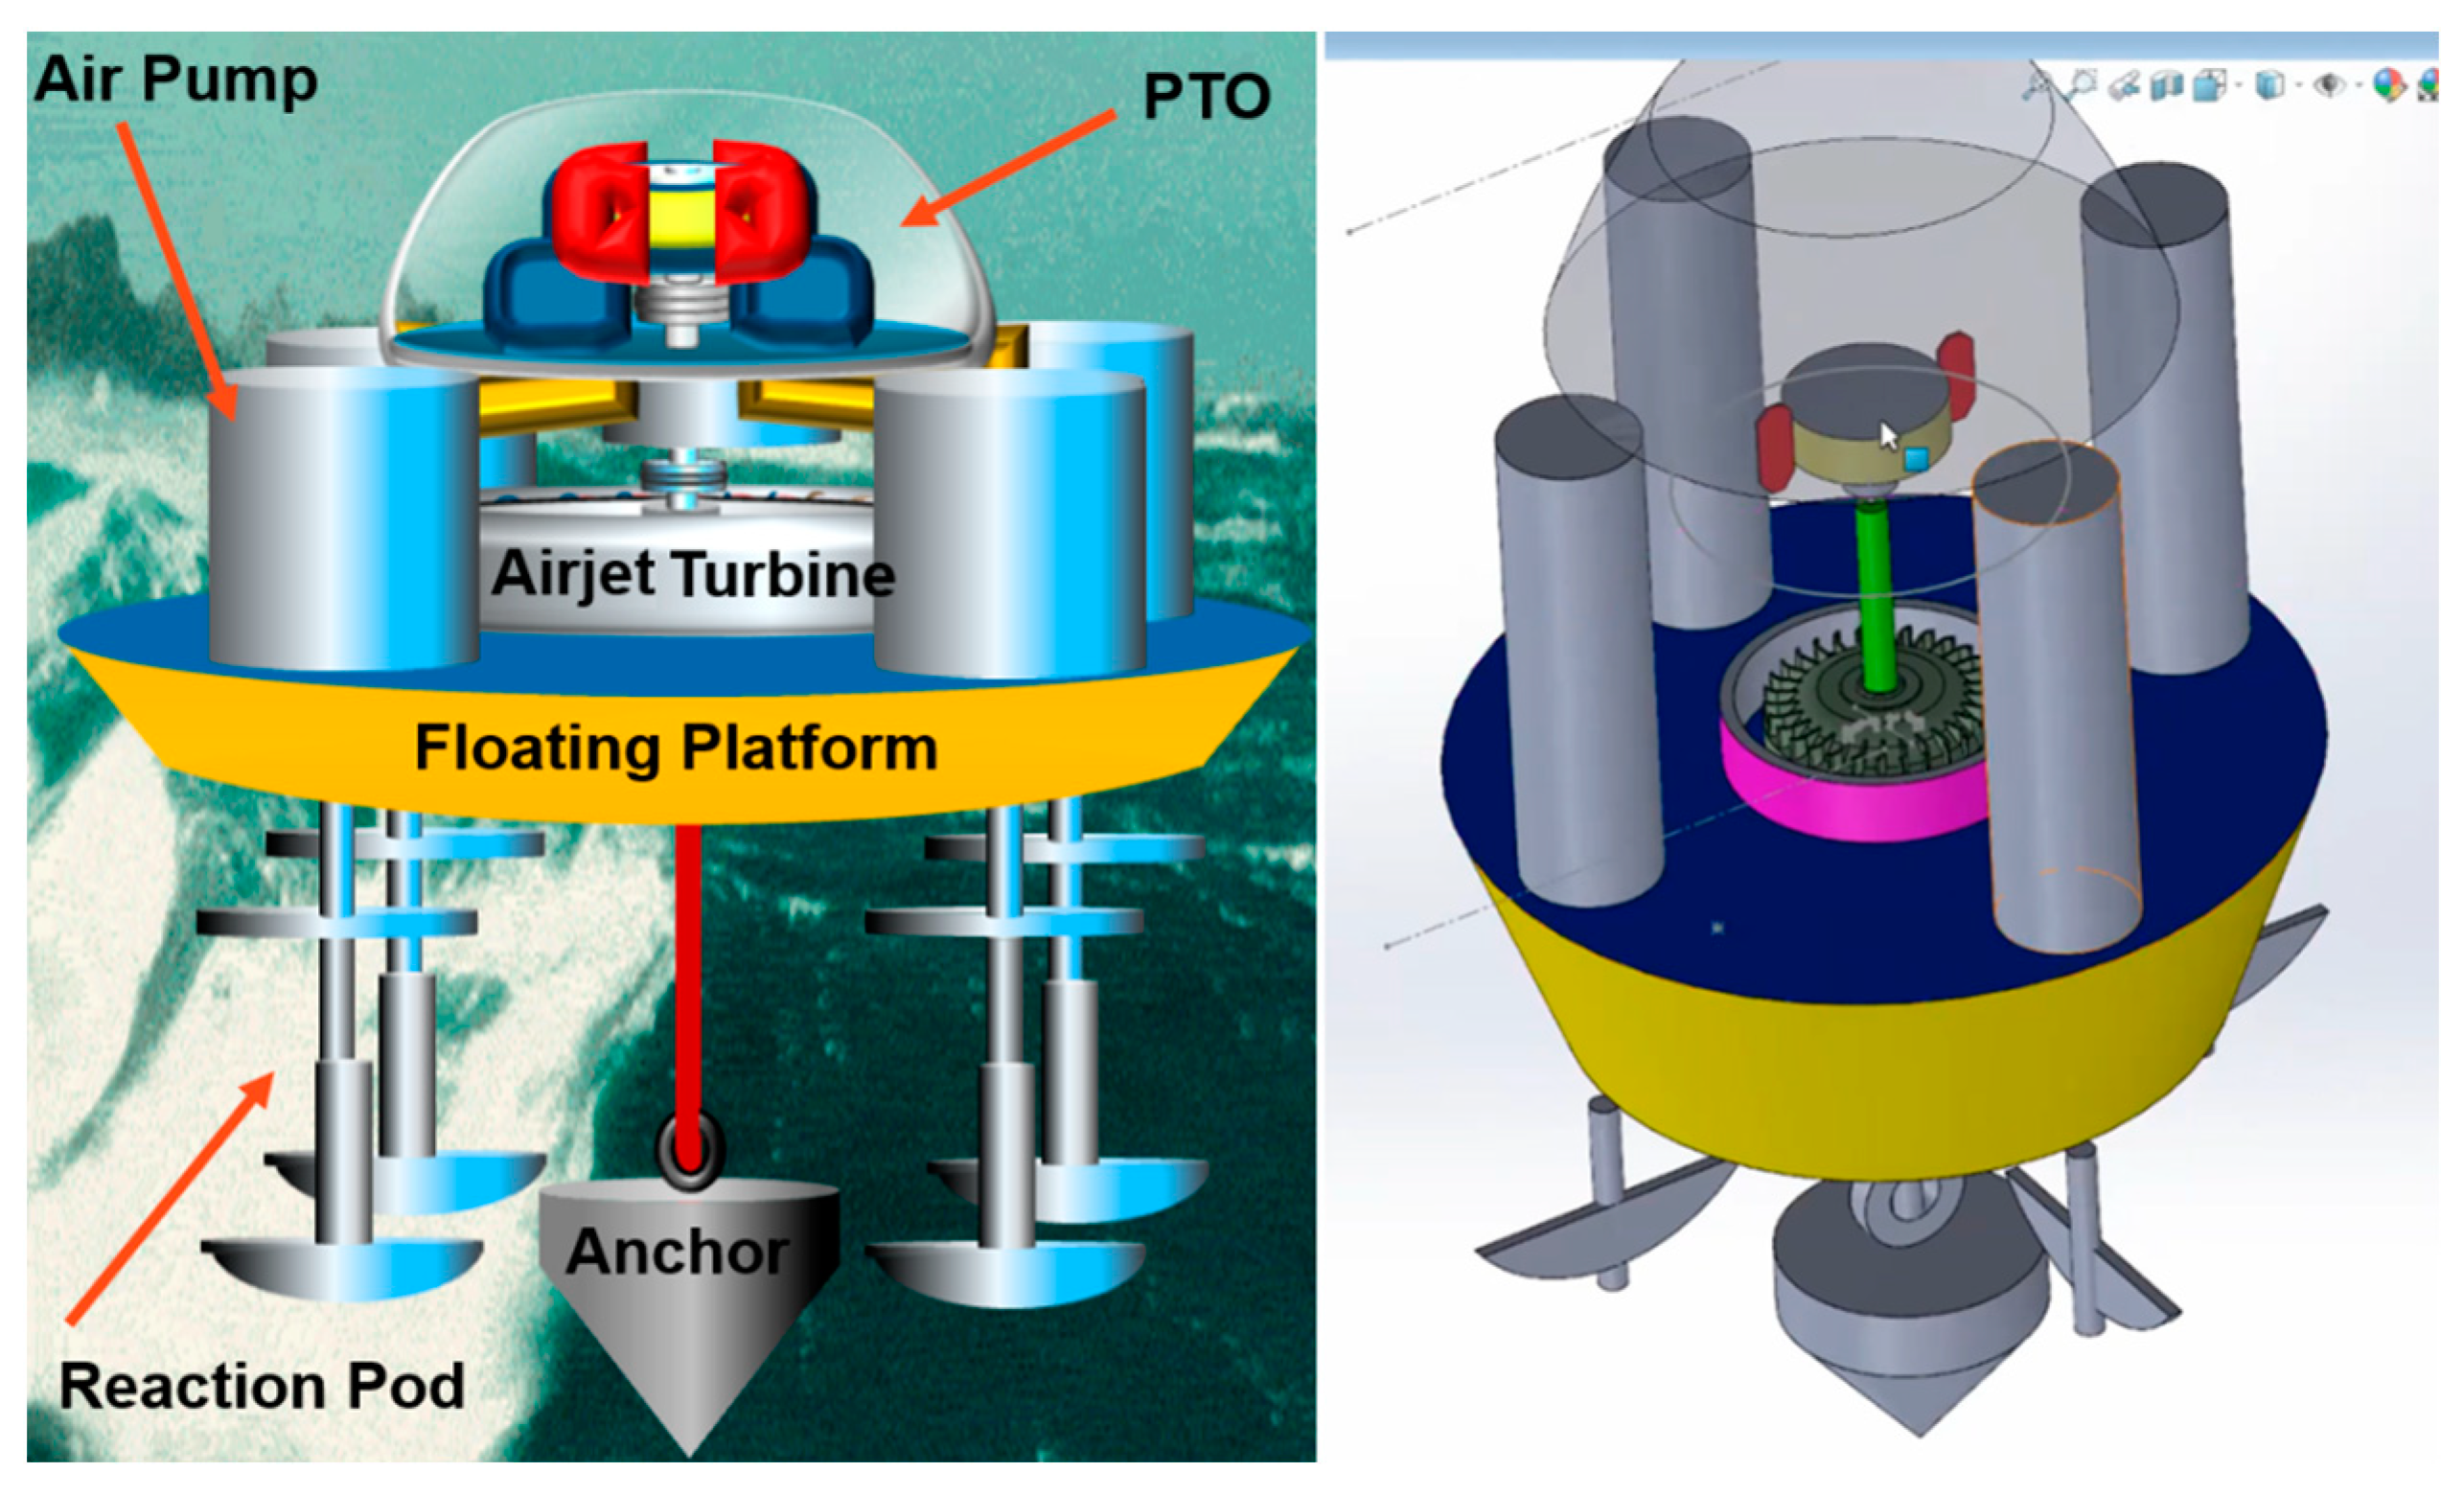
An overview of the studied wave energy converter along with its plug-and-play 3D printing prototype schematic developed in the SolidWorks
® software package is depicted in
Figure 1.
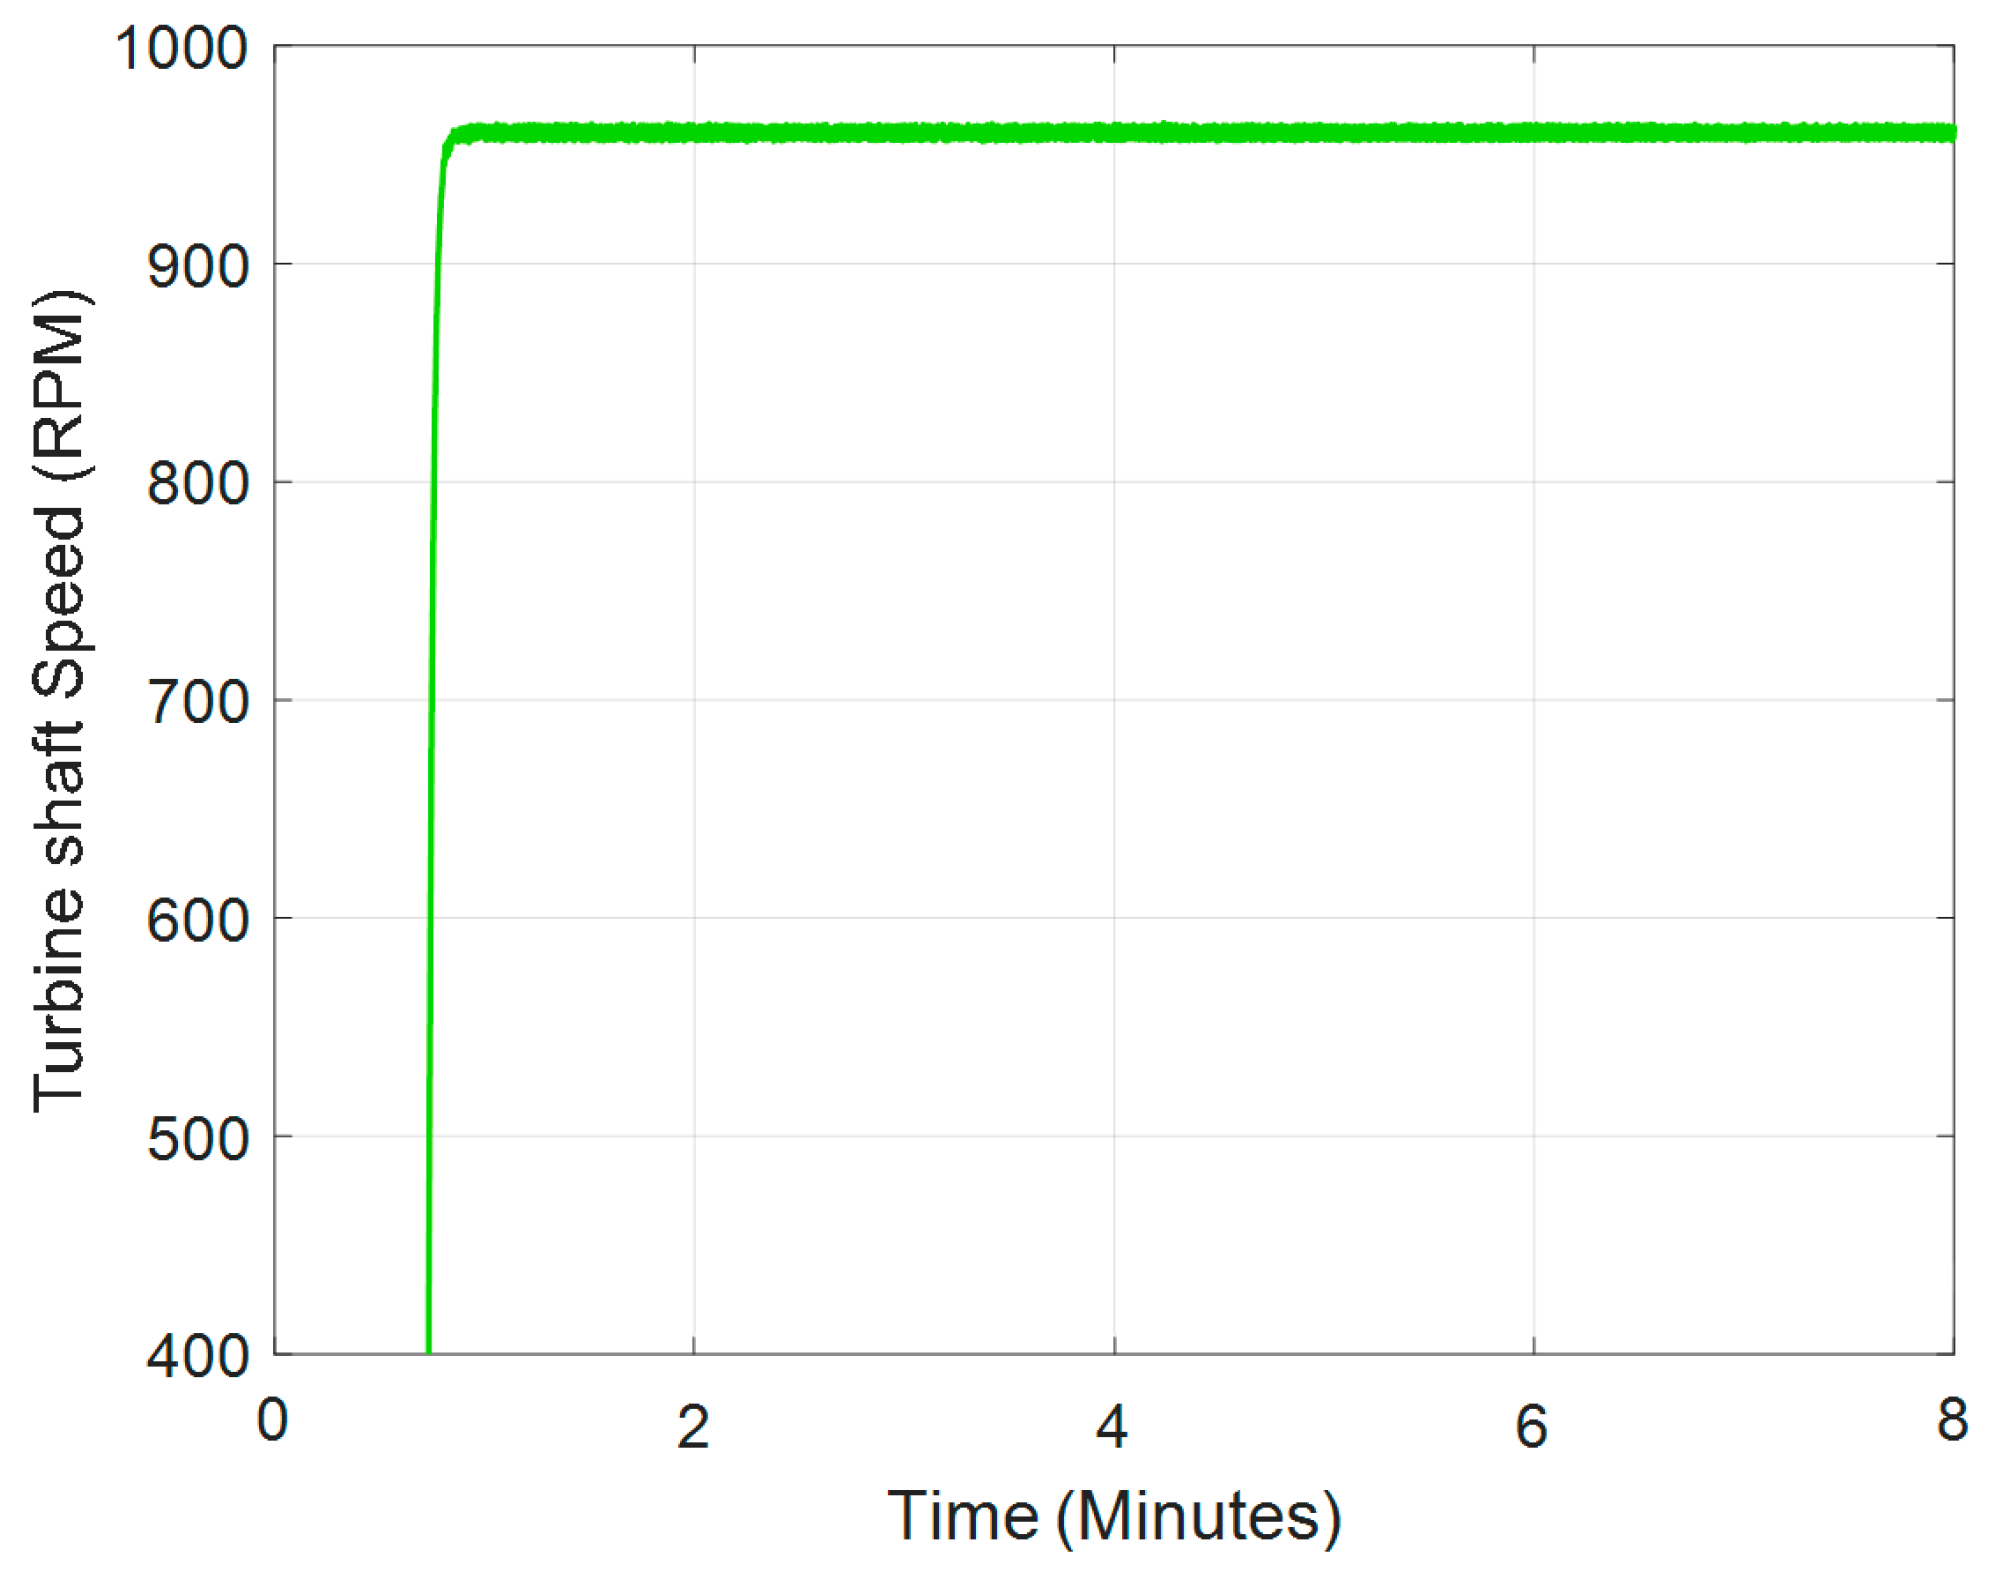
Figure 1 conceptually illustrates the key components realizing the wave energy converter (WEC) device: wave-actuated air pumps supplying an air-jet turbine and enabling a turbine shaft to rotate at nominal speed based on specific project requirements. The WEC comprised four independent air pumps that pumped air (including ambient air) into the turbine at a pressure, velocity, and discharge so that the hydrokinetic energy from ocean waves with significant height and period and with sufficient wave capture width was transferred onto the mechanical rotation/speed. The proposed point-absorber WEC presented a near-constant compressed air supply by the dual actions of an inflated airbag inside air pumps. As the two-stroke pump operated, part of the airflow was directed to inflate the flexible airbag and store compressed air. While the airbag was expanding, the air between the inflatable and outer cylinder was ejected under compression. In the next cycle, as the air was discharged from the airbag and the volume was decreasing, a suction pressure caused air to flow into the external cylinder. Hence, the two-stroke action of the air pump acted as accelerating pulses. Thus, the airflow system kept the rotational velocity of the turbine at its maximum value.
The proposed design featured scalability and modularity, allowing the device to be built for a wide range of power scaling. The modular design provided easy transportation to the deployment site and helped to autonomously utilize the WEC, while its reliability feature implied that a fail-safe operation mode was achieved. Through four standalone operating air pumps, in the case of occurring faults in one or two pumps, the converter continuous operation was expected but with a degraded power output rating. In theory, each air pump generated one-fourth of the rated radiated power, which was about by the waves within the capture width of the device. The capture width was a crucial optimizing parameter, and it was estimated around 3.4 m wave capture width leading to the full-scale nominal 100 kW prototype absorption. Assuming the prototype was firmly anchored and deploying a winch-operated tether allowed the device to heave, sway, and surge within the maximum allowable design limits under harsh ocean conditions.
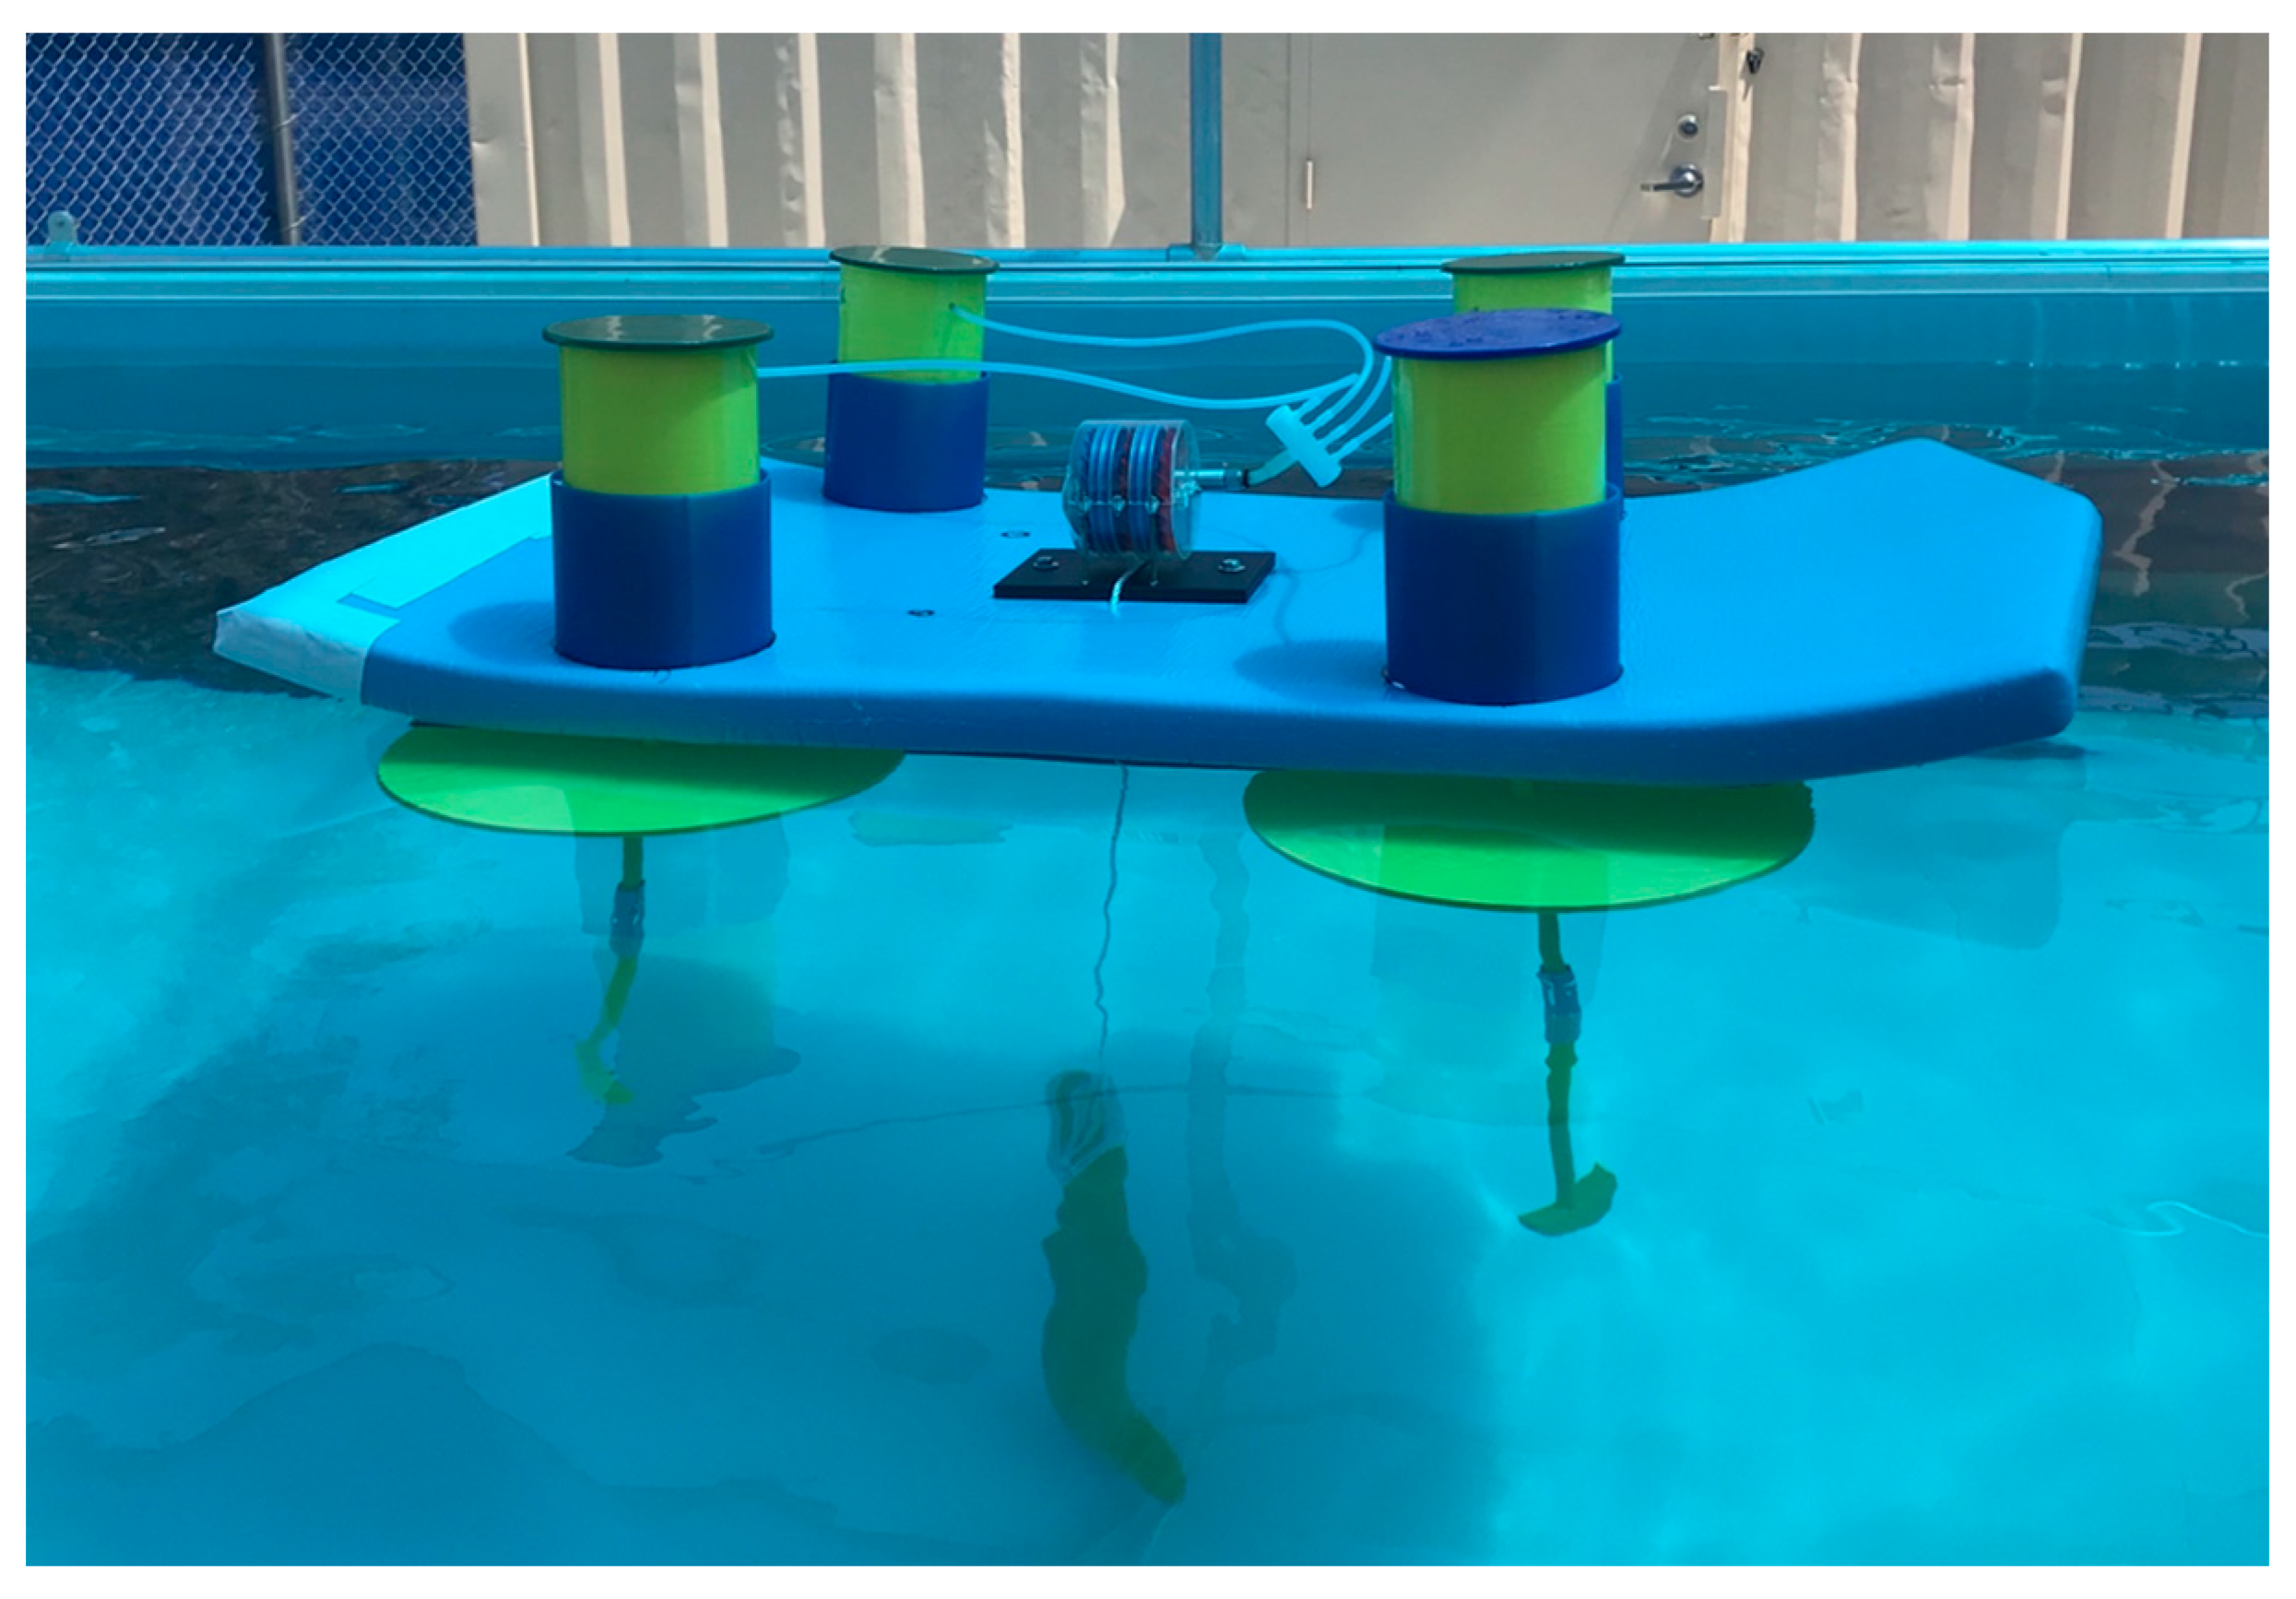
The accessibility of marine research is normally restricted by the manufacturing challenges, engineering costs, and size constraints of the WEC’s requirements to withstand the environmental pressure, in particular at higher water depths. Employing additive manufacturing technologies, such as 3D printing, to fabricate a deep water pressurized container can significantly mitigate those practical limitations. The preliminary outcome of the small-scale prototype was used in the early design process, particularly for component sizing and ratings, geometry of the buoy, and the system integration issues. In doing so, the 3D printing mockup model shown in
Figure 2 was used to fabricate the mock-up prototype that enabled simple research midway experiments to examine motion characteristics, which defined the studied WEC. The experiments using the fully automated pool allowed this work to ascertain the functional behavior of the WEC to refine the design variables, key values, and dimensions. Notably, the capture widths were determined through the analysis of experimental data obtained from testing in water. Furthermore, in this simple built prototype, the displacement of the device due to unexpectedly high wave surges and hence corresponding preventive measures was beyond the scope of this work. The captured energy in the turbine was harnessed by a permanent magnet generator coupled to the shaft of the turbine to produce the intended power at rated speed for the application of interest.
From our initial water testing using the designed buoy, the key component sizes and dimensions are listed in
Table 1. It is noteworthy that these were the estimates empirically obtained for a full-scale nominal 100 kW WEC prototype, and the optimal dimensions were adjusted based on extensive tests in water tank to maximize use of best materials such as carbon fiber materials related to each specific application.
The proposed WEC system was expected to have a stroke length of 80 inches (2 m) as shown in
Table 1, which was chosen to suit the wave climate at the Scripps Institution of Oceanography at the Southern California research site. It was perceived that harnessing higher power production was achieved by the means of the larger stroke length; however, the mechanical complexity challenge and costs compounded further.
2.2. Structure of the Proposed Direct Drive Power Take-Off System
The proposed all-electric PTO system consisted of the key components as follows: a permanent magnet synchronous generator (PMSG), an AC–AC converter based on a modular multilevel converter (MMC), a DC-link capacitor bus, and master and slave controllers.
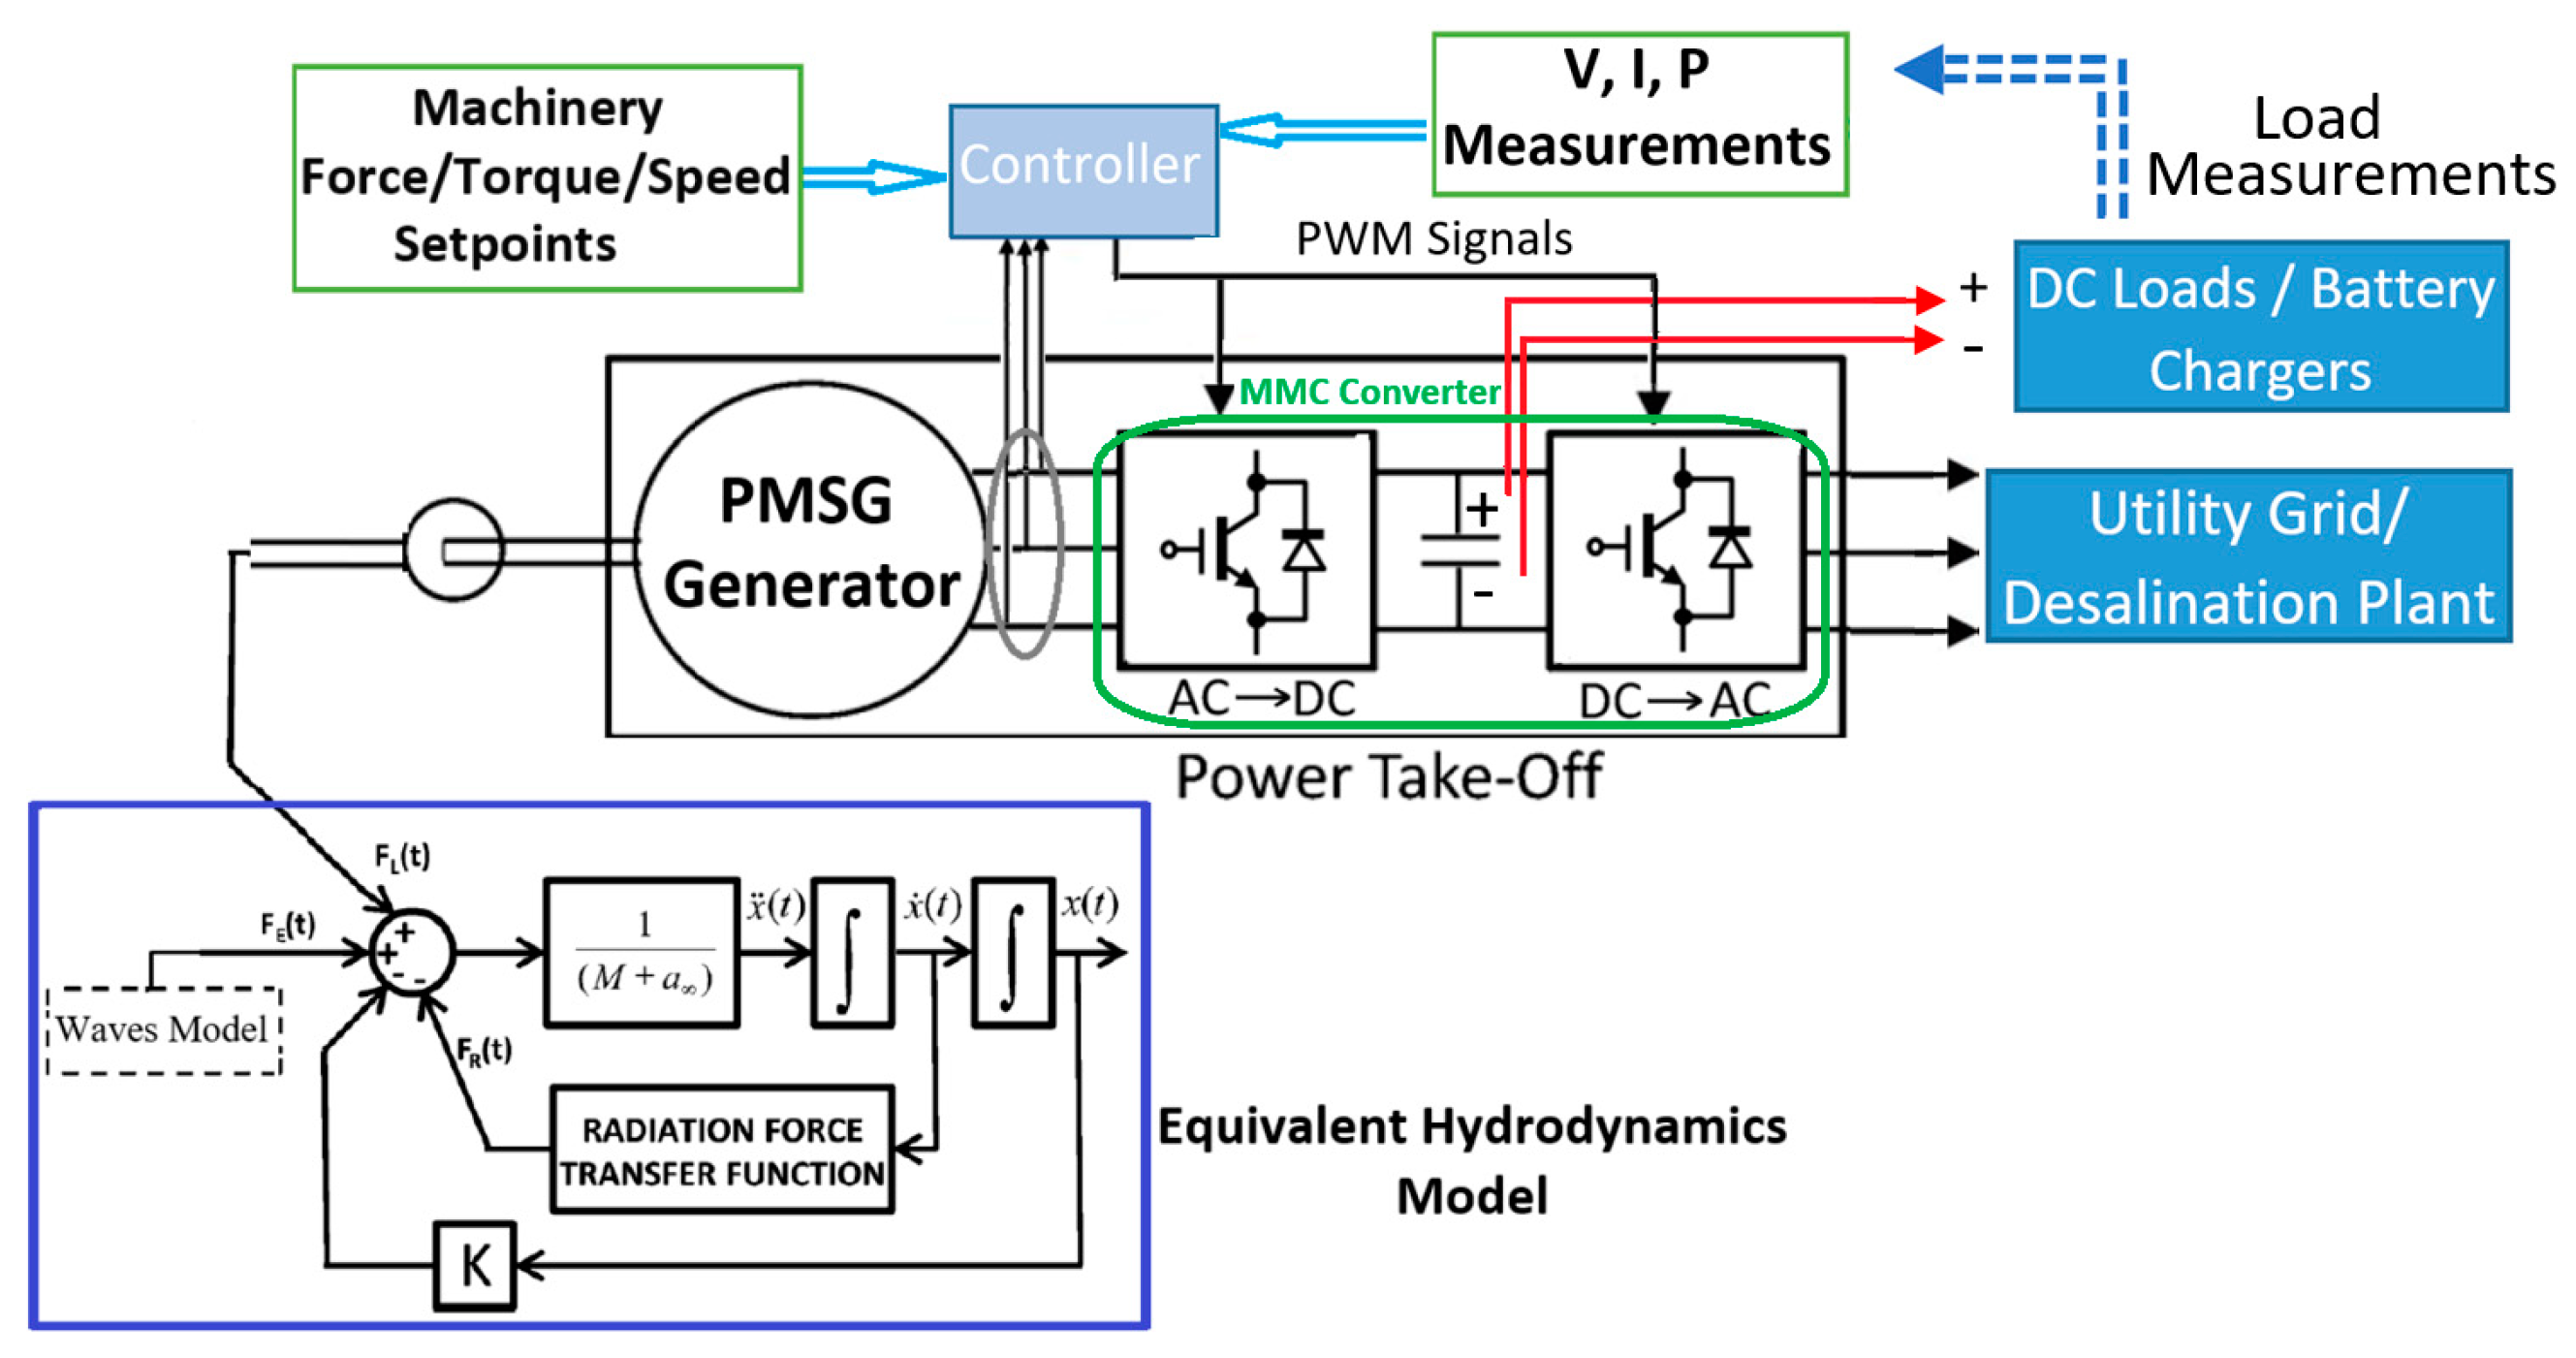
As illustrated in
Figure 3, the back-to-back configuration was realized by two-stage conversion units to interface between the generator/wave side and the load/grid side controls for the considered WEC. The voltage-source pulse width modulation (PWM) rectifier and inverter played an important role in integrating the WEC and the mechanical part with the local loads and/or the utility grid. This configuration decoupled the two side voltages, offering more control flexibility using higher-order degree-of-freedom controller features with bi-directional energy flow.
The modular multilevel converter (MMC) is a voltage source converter that can operate as an AC–AC power converter. The MMC converter has gained the attention of many industry sectors due to its significant advantages. The MMC has excellent output performance, high modularity, easy bypass of faulty cells in case of a fault, and easy scalability of voltage and current, integrating battery energy storage or solar PV into its circuit and providing high quality of output waveforms without placing a physical bulky filter. There are limited research studies and a dearth of prototype testing regarding PTO development utilizing MMC technology. This work intended to explore such possibilities for WECs.
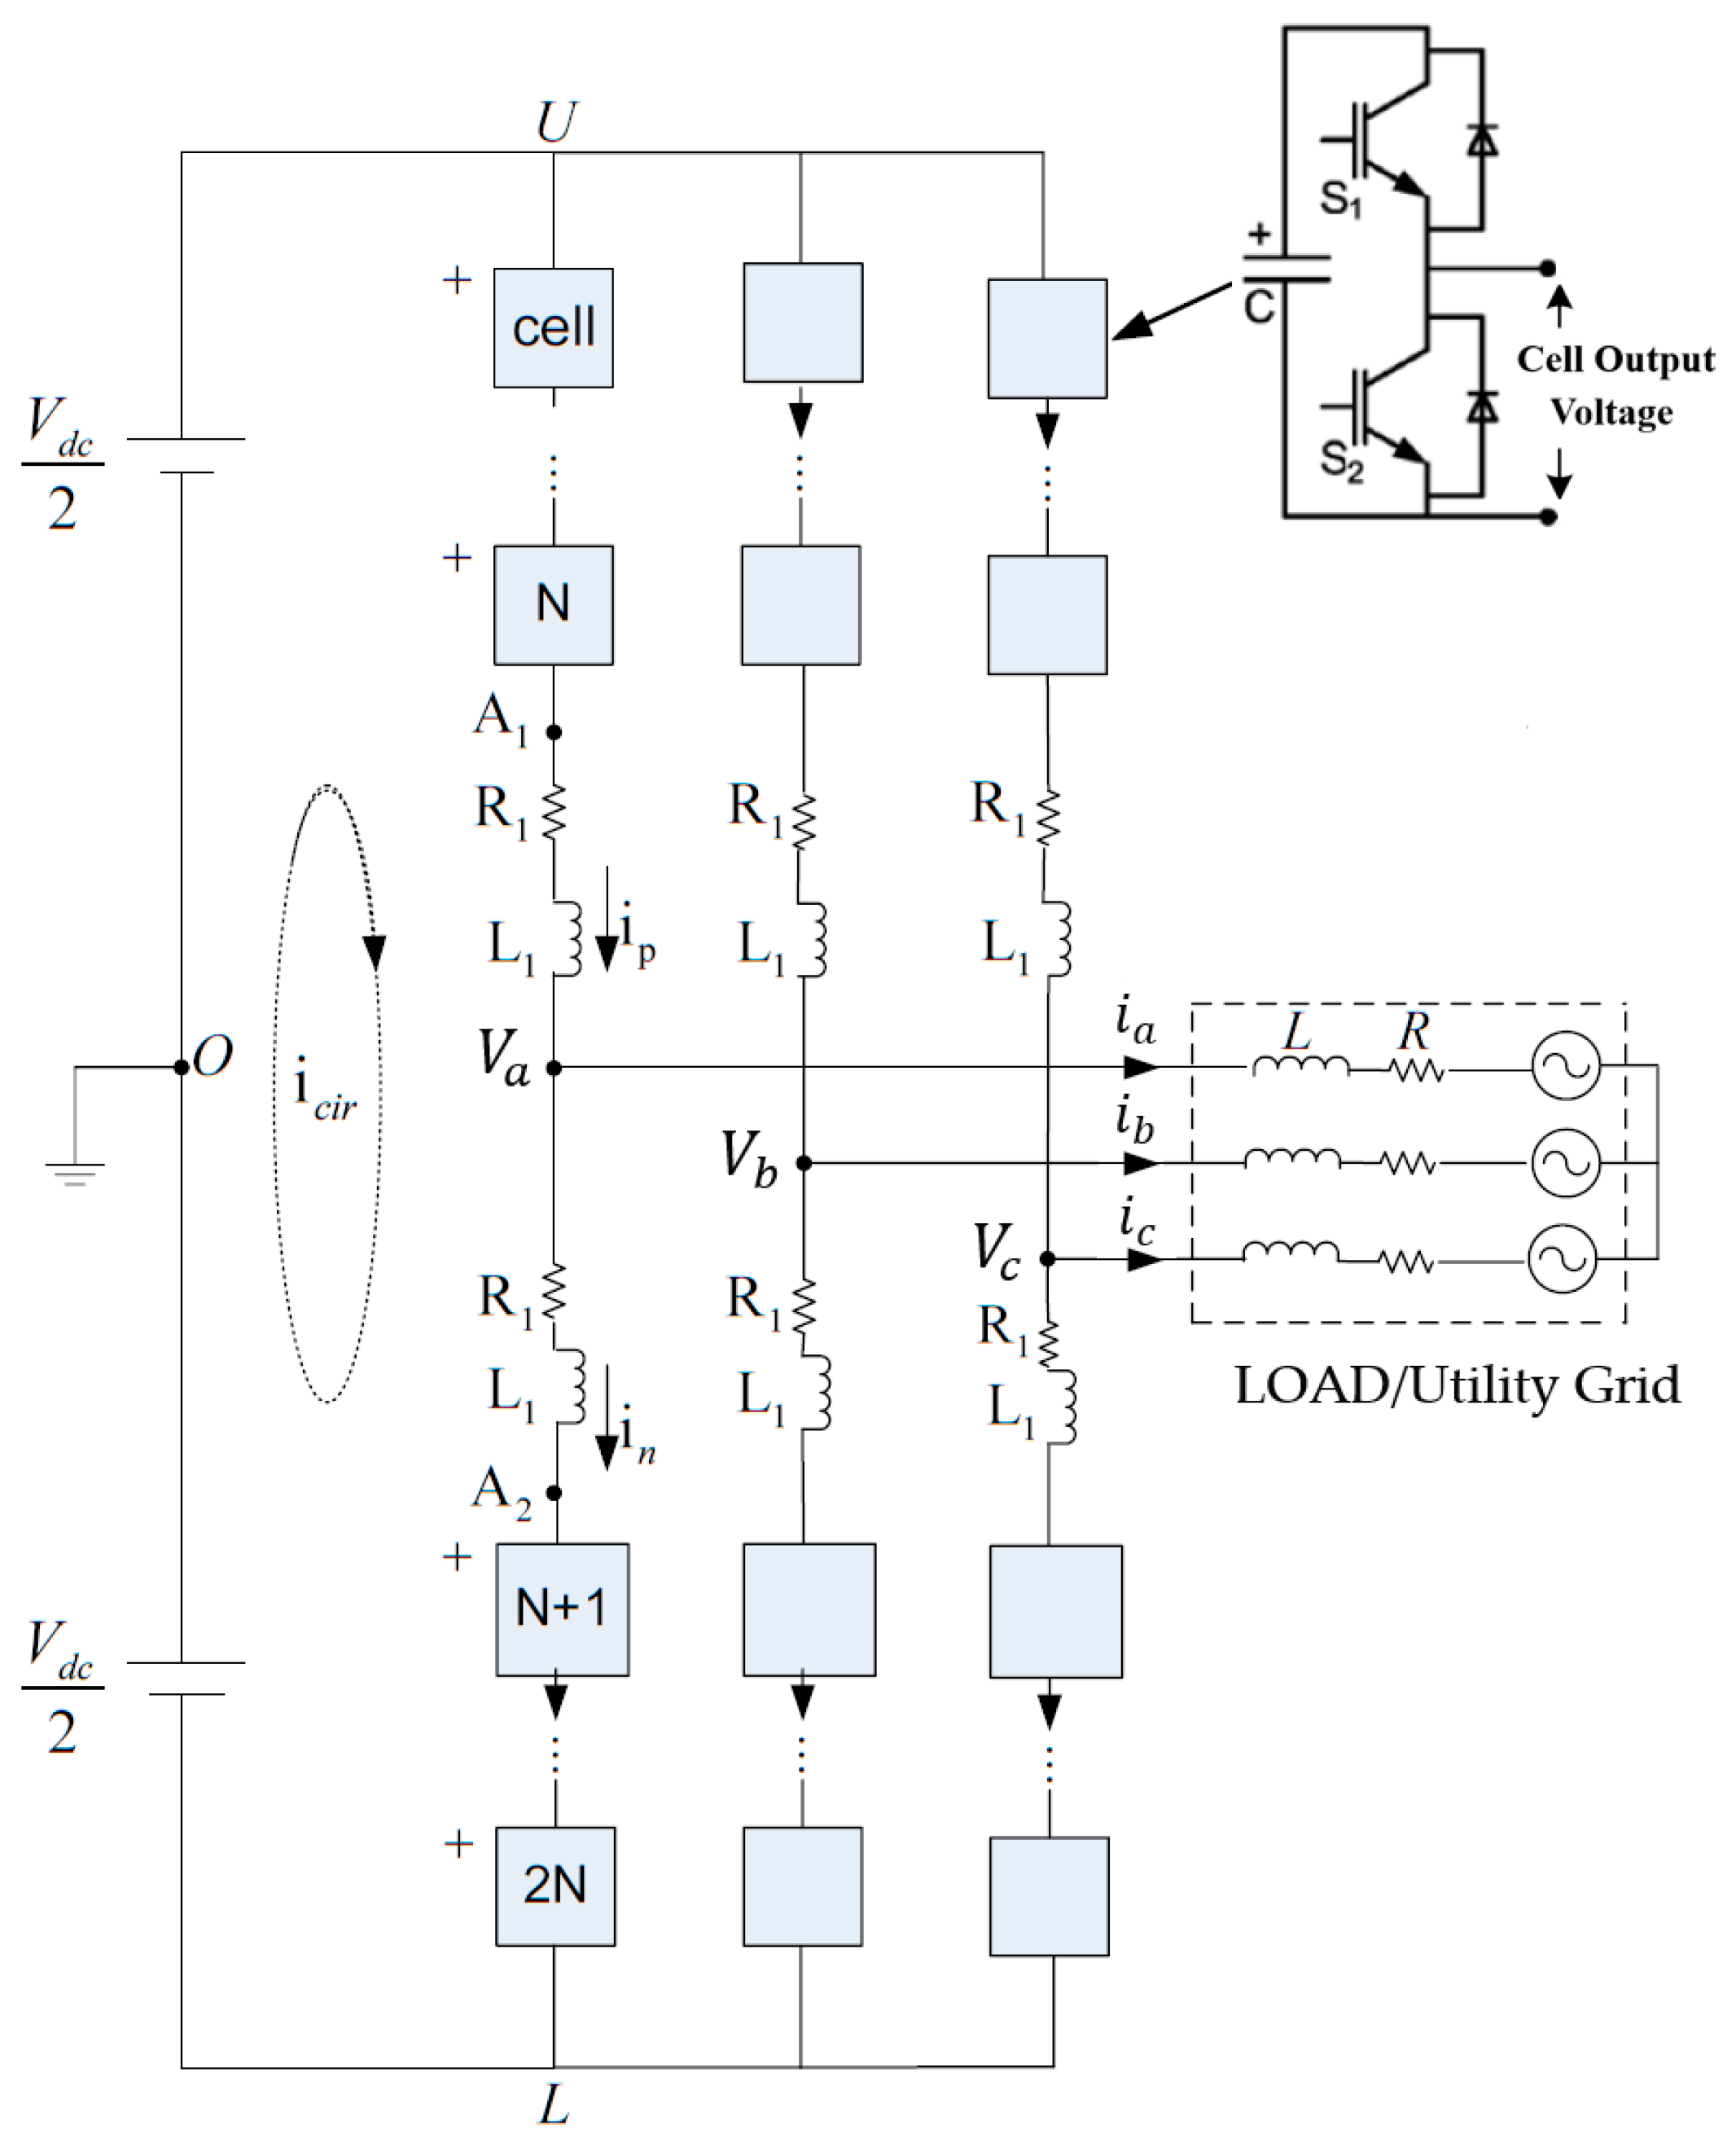
Figure 4 presents the power stage circuit diagram of the MMC topology in an inverter in DC–AC mode. Each phase was composed of two arms, an upper arm and a lower arm, where each arm had a number of N cells.
and
are the upper arm current and lower arm current in each phase, respectively.
are the three-phase voltages, and
are the three-phase load currents on the AC side of the MMC.
L1 and
R1 are the arm inductors and series (internal) resistors, while
is the circulating current, which flowed only through the upper and lower arms of the three phases and did not appear on the MMC output side. Each cell included two metal-oxide-semiconductor field-effect transistors (MOSFET). These MOSFETs allowed current to pass from the source (S) terminal to the drain (D) when voltage was applied to the gate (g). They allowed our relatively low voltage pulse width modulation signals to turn the switches on and off. As it can be seen from
Figure 4, when the capacitors charged and discharged, the sum of all cell output voltages created an AC waveform at the load side between the two legs. Therefore, the cell capacitor charged with the applied input DC voltage, Vdc, and at each time instant, half the cells were connected, and half the cells were bypassed. This was essential due to the sum of all connected cells output voltages in each phase must be Vdc. To produce the desired output DC or AC voltage at the MMC terminals, the distributed controller generated PWM pulses for the cell switches, such as MOSFETs; henceforth, two complementary switching pulses were sent to each cell to prevent two switches from turning on and off simultaneously, making sure the principal operation of this converter was satisfied.
This research aimed to investigate the deployment of the proposed PTO system for both non-grid and grid-connected applications, for instance, interconnection to the existing utility electricity infrastructure or ocean water desalination plant paving the way to sustainable desalination to be cost-effective and self-sustained. The topology and control interfaces of the entire system needed to be evaluated, and the design for the considered WEC system is presented in
Figure 3. For the sake of simplicity, a simplified hydrodynamic model of the point absorber described in [
29] was developed via MATLAB/Simulink for the modeling analysis and simulation testing.
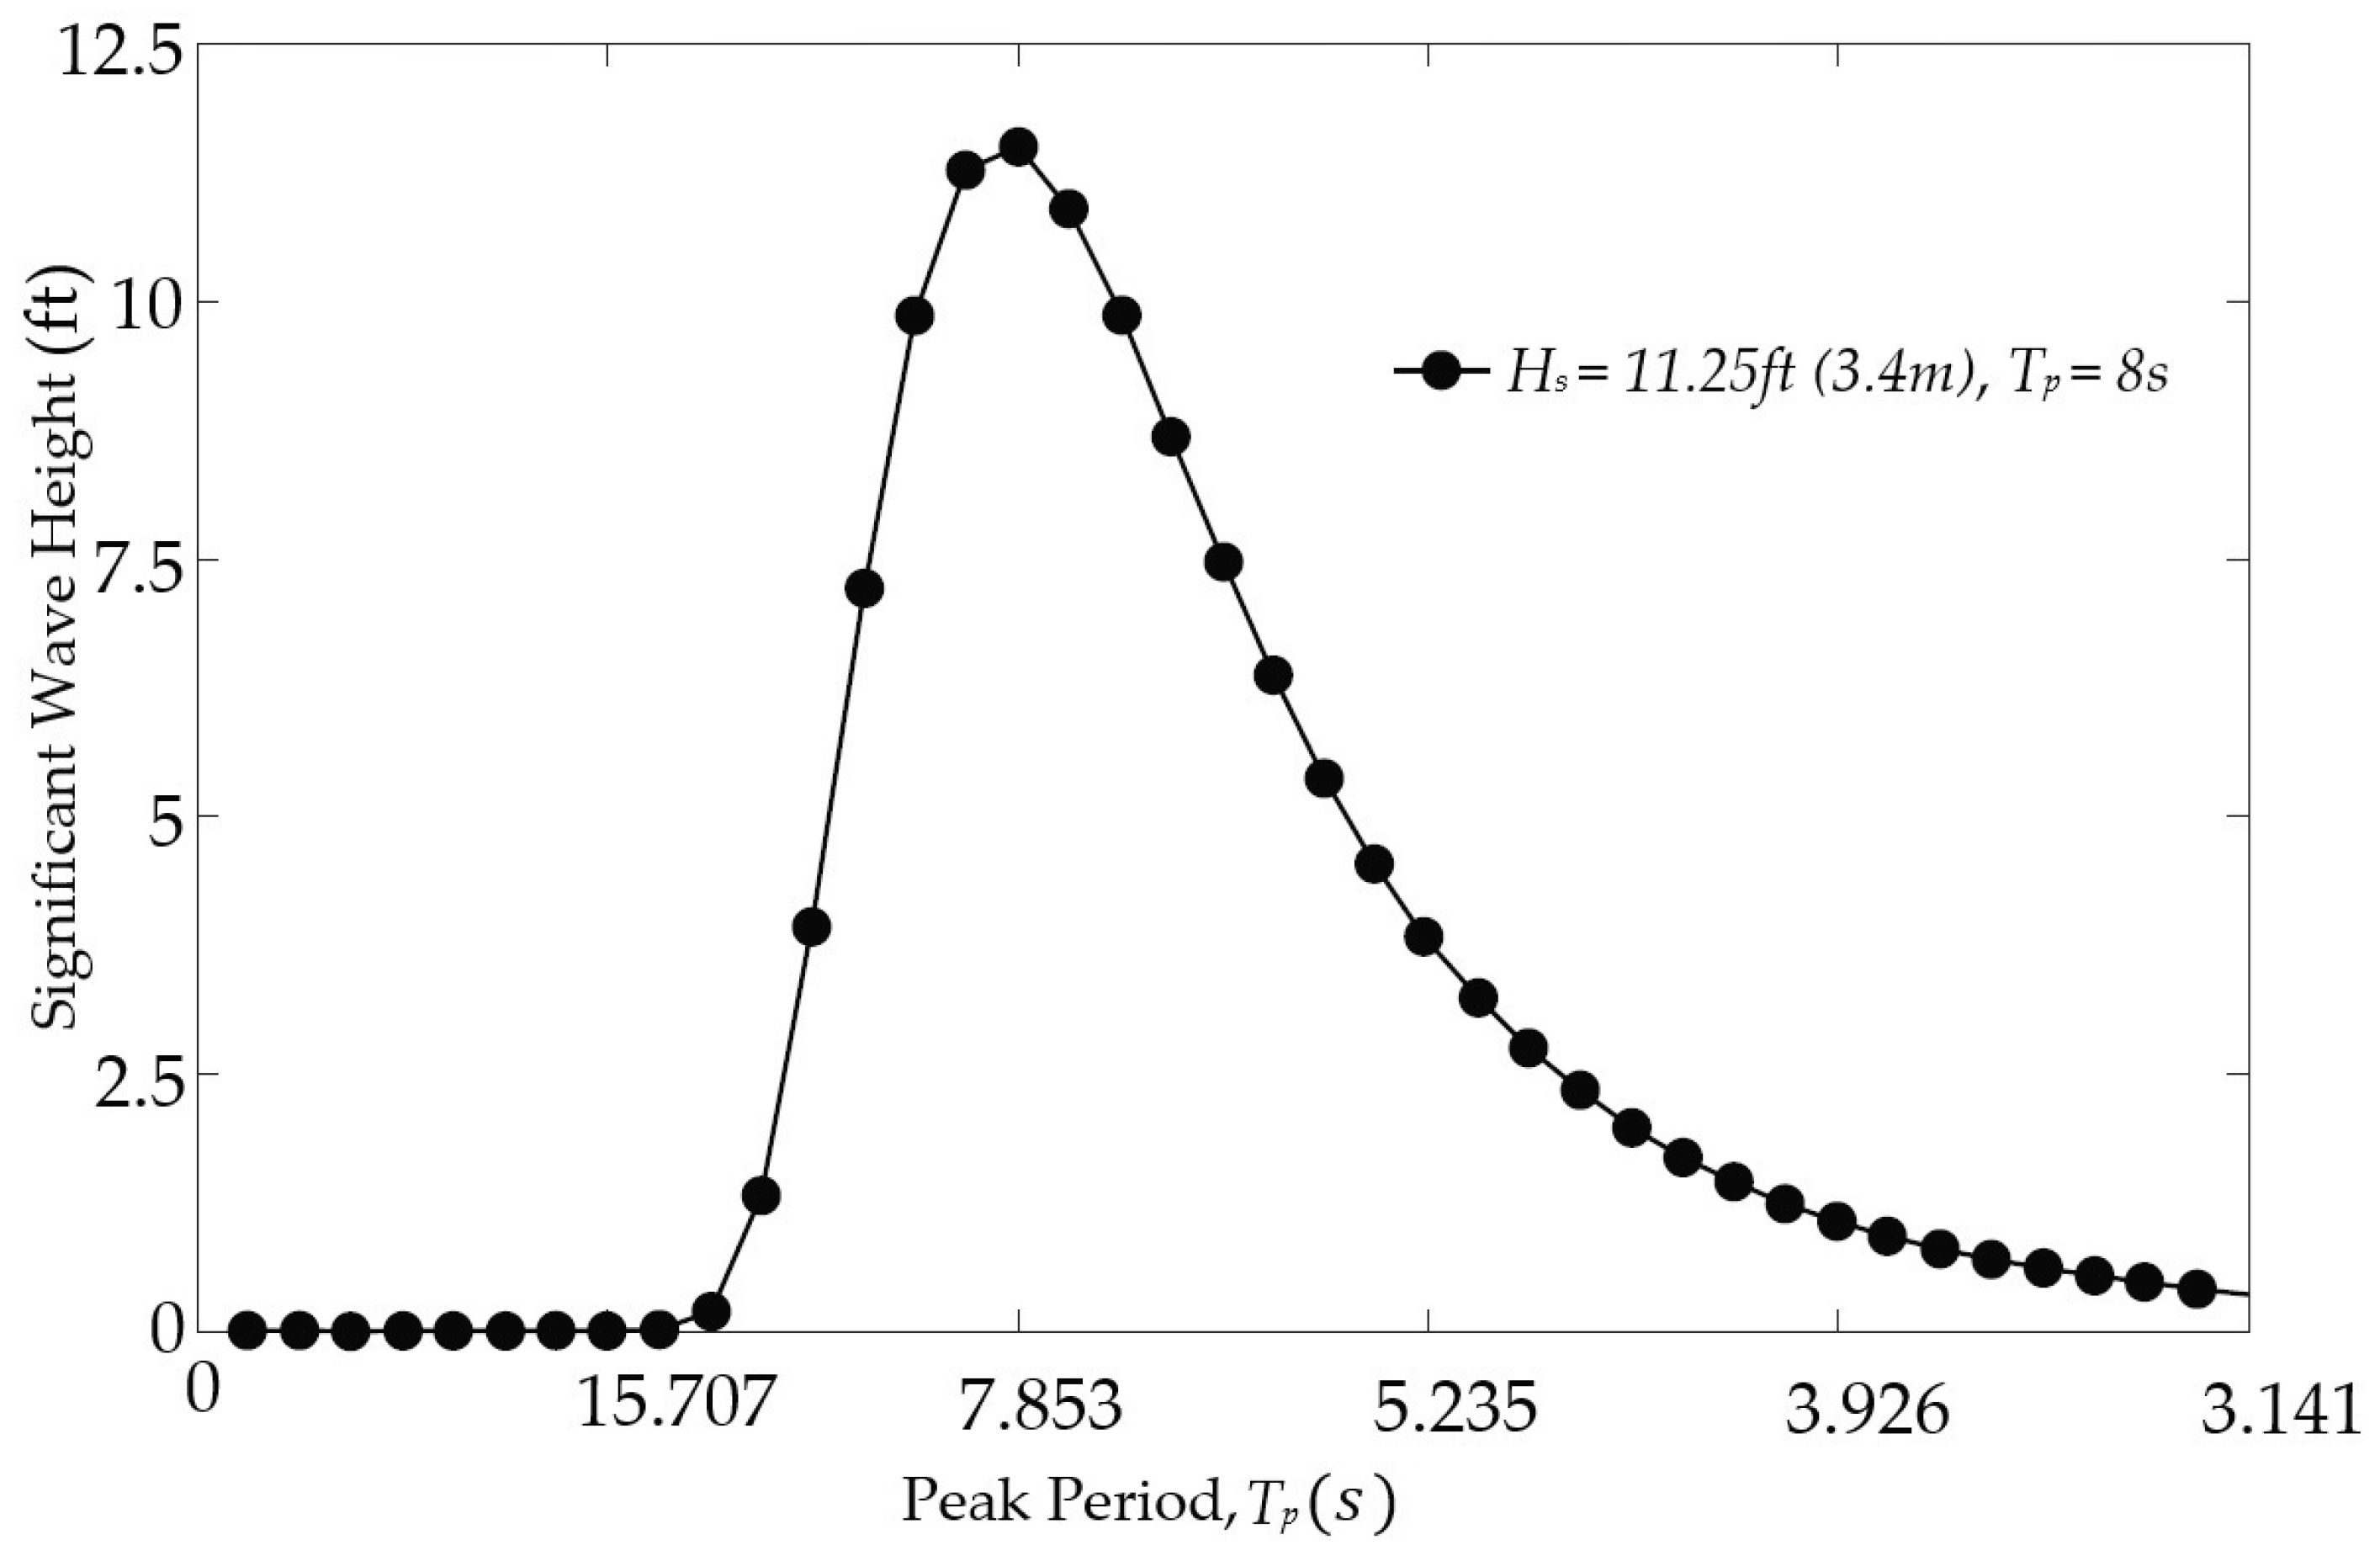
Many studies and technical reports have focused on the long-crested wave spectrum. This is a barrier in real-world applications. The actual marine environment has shown that the profile of ocean waves moves in different directions and patterns, and therefore, short-crested waves should be included in the design process [
30,
31]. The stochastic ocean state was considered to be a Bretschneider spectrum [
30] in this study for the waves model, which is denoted by (1), which comprises two key variables, the significant wave height, H
s, and the peak wave angular frequency,
ωp = 2
π/
Tp:
where
Tp is the peak period of the wave spectrum.
The PTO mechanism was responsible for transferring the harvested mechanical energy to an electrical form. The captured energy in the turbine was harnessed by a permanent magnet generator coupled to the shaft of turbine to produce the intended power at the rated speed for the application of interest. The salient feature of this scheme was that there was no gearbox, hydraulic, or pneumatic stage inside the PTO system compared with the previously proposed solutions as described earlier. By employing fully controlled power electronics converters, complete decoupling of the generator from the utility grid or load was achieved through a DC-link capacitor bank. This feature guaranteed that the same efficiency in the power extraction from the waves could be obtained.
The industry outlook of WEC technologies predicts WEC farms or arrays when the technology readiness levels allow the commercialization of large-scale exploitation. The proposed WEC unit can be connected in series to establish a wave power farm that can be located close to shore, in shallow water areas, or farther offshore featuring common infrastructures; for example, power distribution switchgears, cables, and mooring systems can lead to significant cost reductions for the CAPEX, operation, and maintenance expenditure.
The preliminary analysis was conducted to learn about power saving or energy efficiency improvement by deploying the proposed WEC to generate electricity for the Carlsbad desalination plant, located in Southern California, USA, which is the largest desalination plant in the western hemisphere [
32]. This plant’s capacity is 50 million gallons per day and, assuming power generation of only 2 kWh/m
3 from renewable energy resources such as the proposed WEC system, will lead to electricity cost savings of USD 18 million annually, as well as avoiding nearly 75,000 metric tons per year of CO
2 emissions. The energy savings were calculated based on an estimated USD 5 cost of production per 1000 gallons of clean drinking water and manufacturing, transportation, and deployment costs of our WEC system close to USD 5 million. In addition to cost savings of electricity consumption, the plant was less dependent on the utility power grid that could be congested during summer or heatwave season in the Southern California region.
3. Experimental Prototype Development of the Proposed PTO
A laboratory prototype of a single-phase 1 kW, 60 Hz MMC was designed and built to validate the basic operation of the proposed PTO including the control functionalities. The MMC was composed of six cells, three cells per each arm based on a half-bridge configuration. The generator power rating of the used PMSG was 1.2 kW.
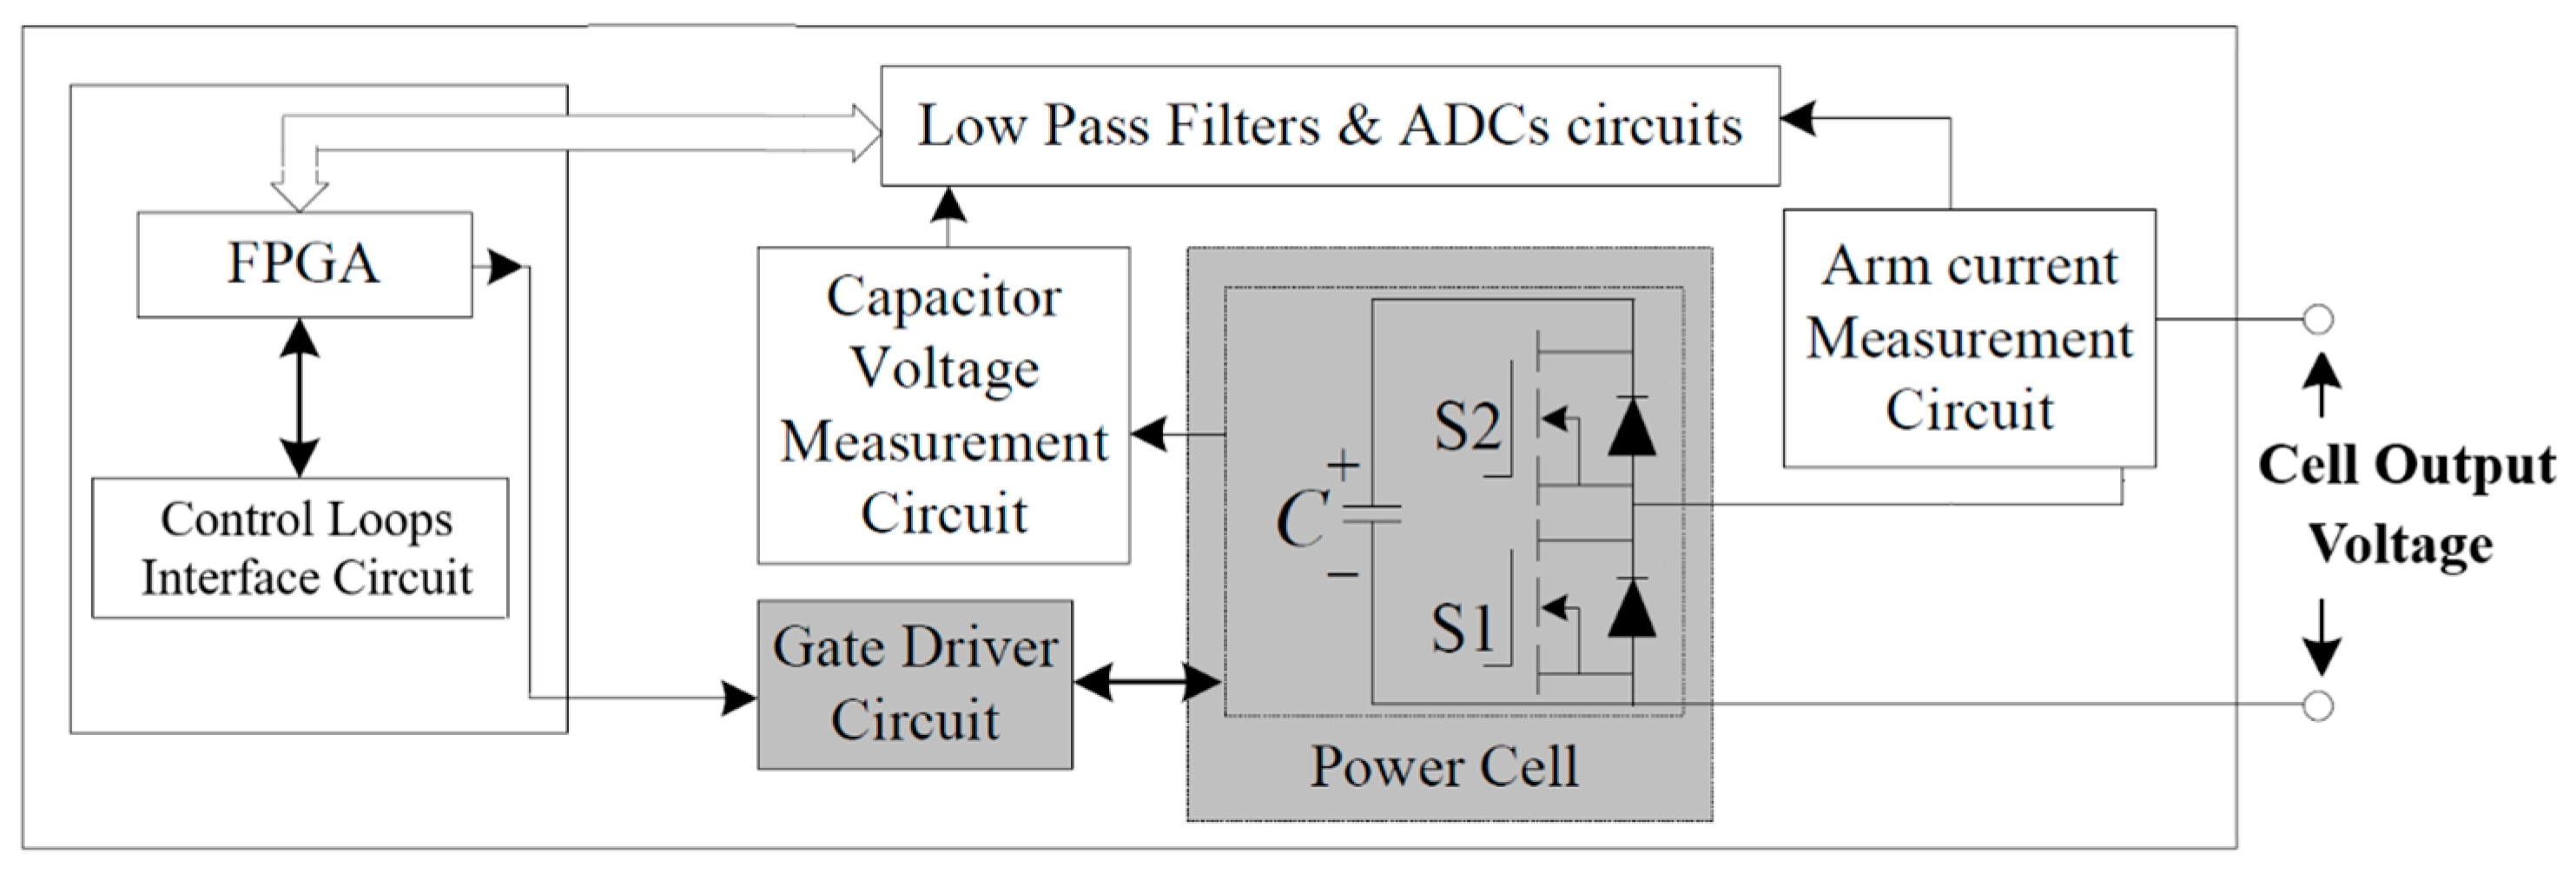
The detailed block diagram of a single cell of the MMC is displayed in
Figure 5, showing both control circuit and its power circuit interfacing with the FPGA controller board and sensing circuit.
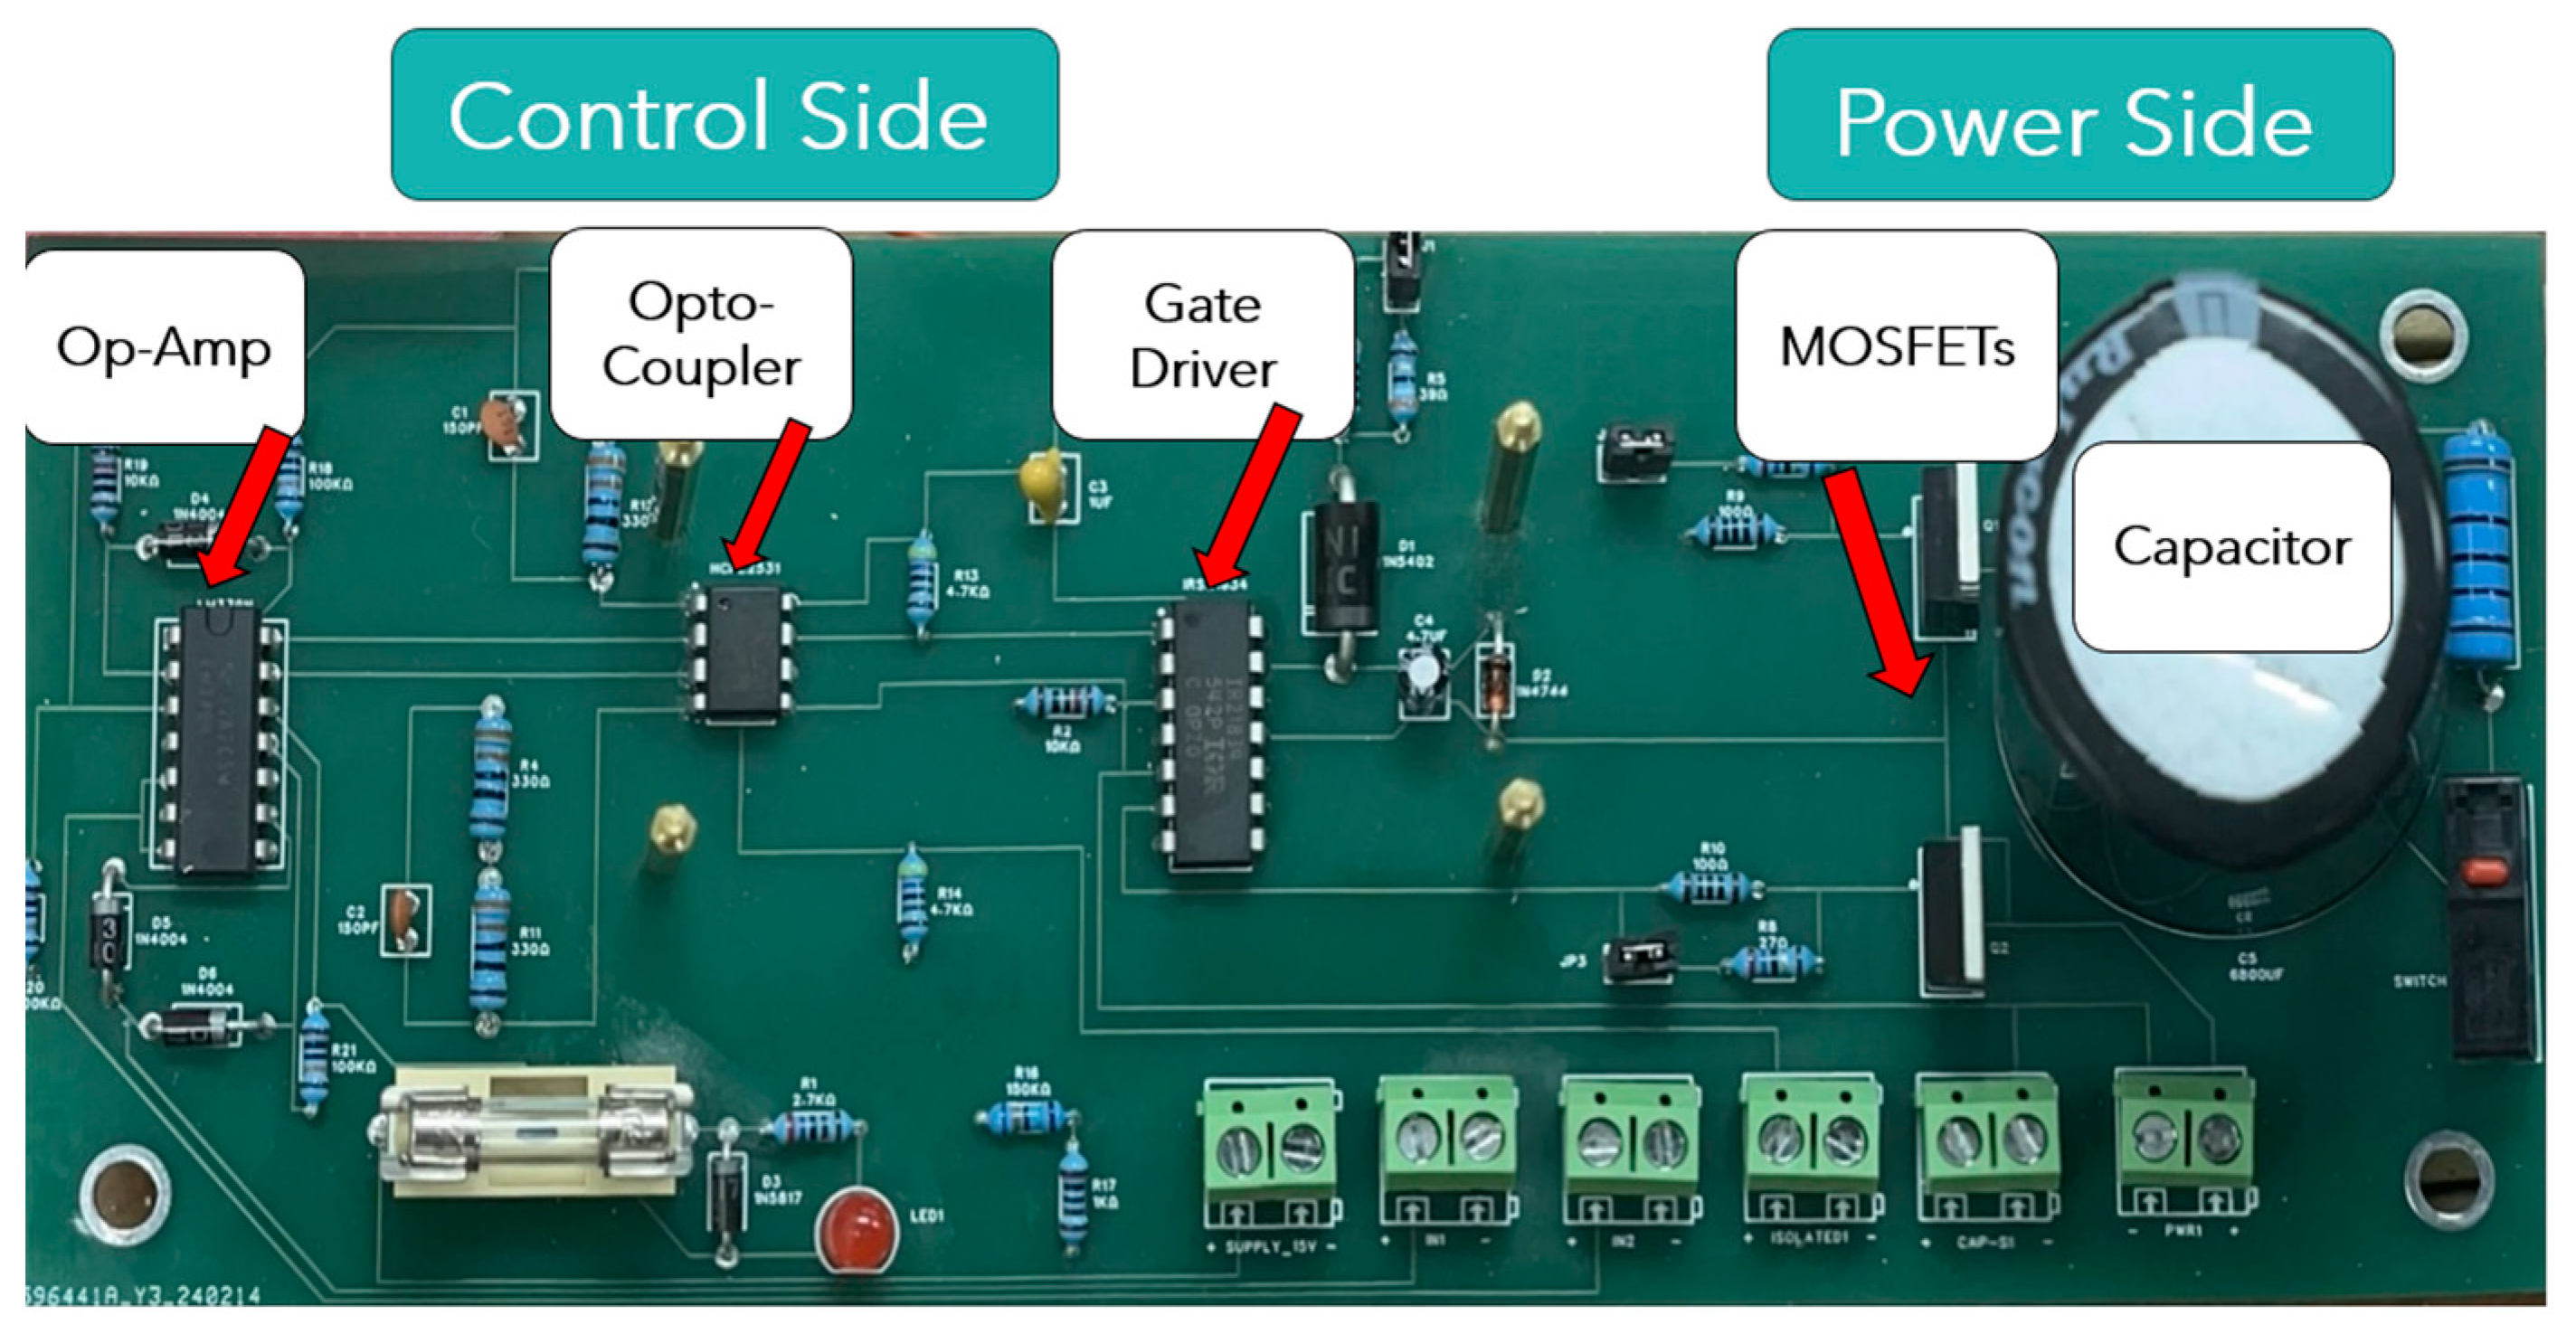
Figure 6 shows a designed and fabricated single cell on a printed circuit board (PCB) with all required components. For the power semiconductor switches, the MOSFETs, IRF520N, from Infineon Technologies rated at 100 V, 33 A, were utilized, which were suitable for our application along with the LM339 Op-Amp, HCPL2531 Opto-Coupler, and IR21834 Gate Driver for the control circuit of the cell as highlighted in
Figure 4.
The bulk of the control strategy implemented on the field-programmable gate array (FPGA) board was divided into two key functions: the capacitor voltage balancing algorithm and the generation of 6 PWM signals, which included cascaded control loops depending on the control objectives of the design.
A carrier-based level-shifted pulse-width modulation (LS-PWM) was used to control back-to-back converters due to its advantages, in particular, superior harmonics performance compared with the prevalent PWM techniques [
33]. The carrier frequency of 2 kHz was used via closed-loop control to send gating pulses to the MOSFETs. To control and monitor the PTO, the PWM signals from the control scheme, mainly the capacitor voltage balancing algorithm, were implemented on the used FPGA board, the Spartan-7 XC7S100. This board also had a variety of interfaces that allowed the deployment of various control loops such as PMSG speed and torque controls, DC-link voltage, and the output AC voltage and frequency controller.
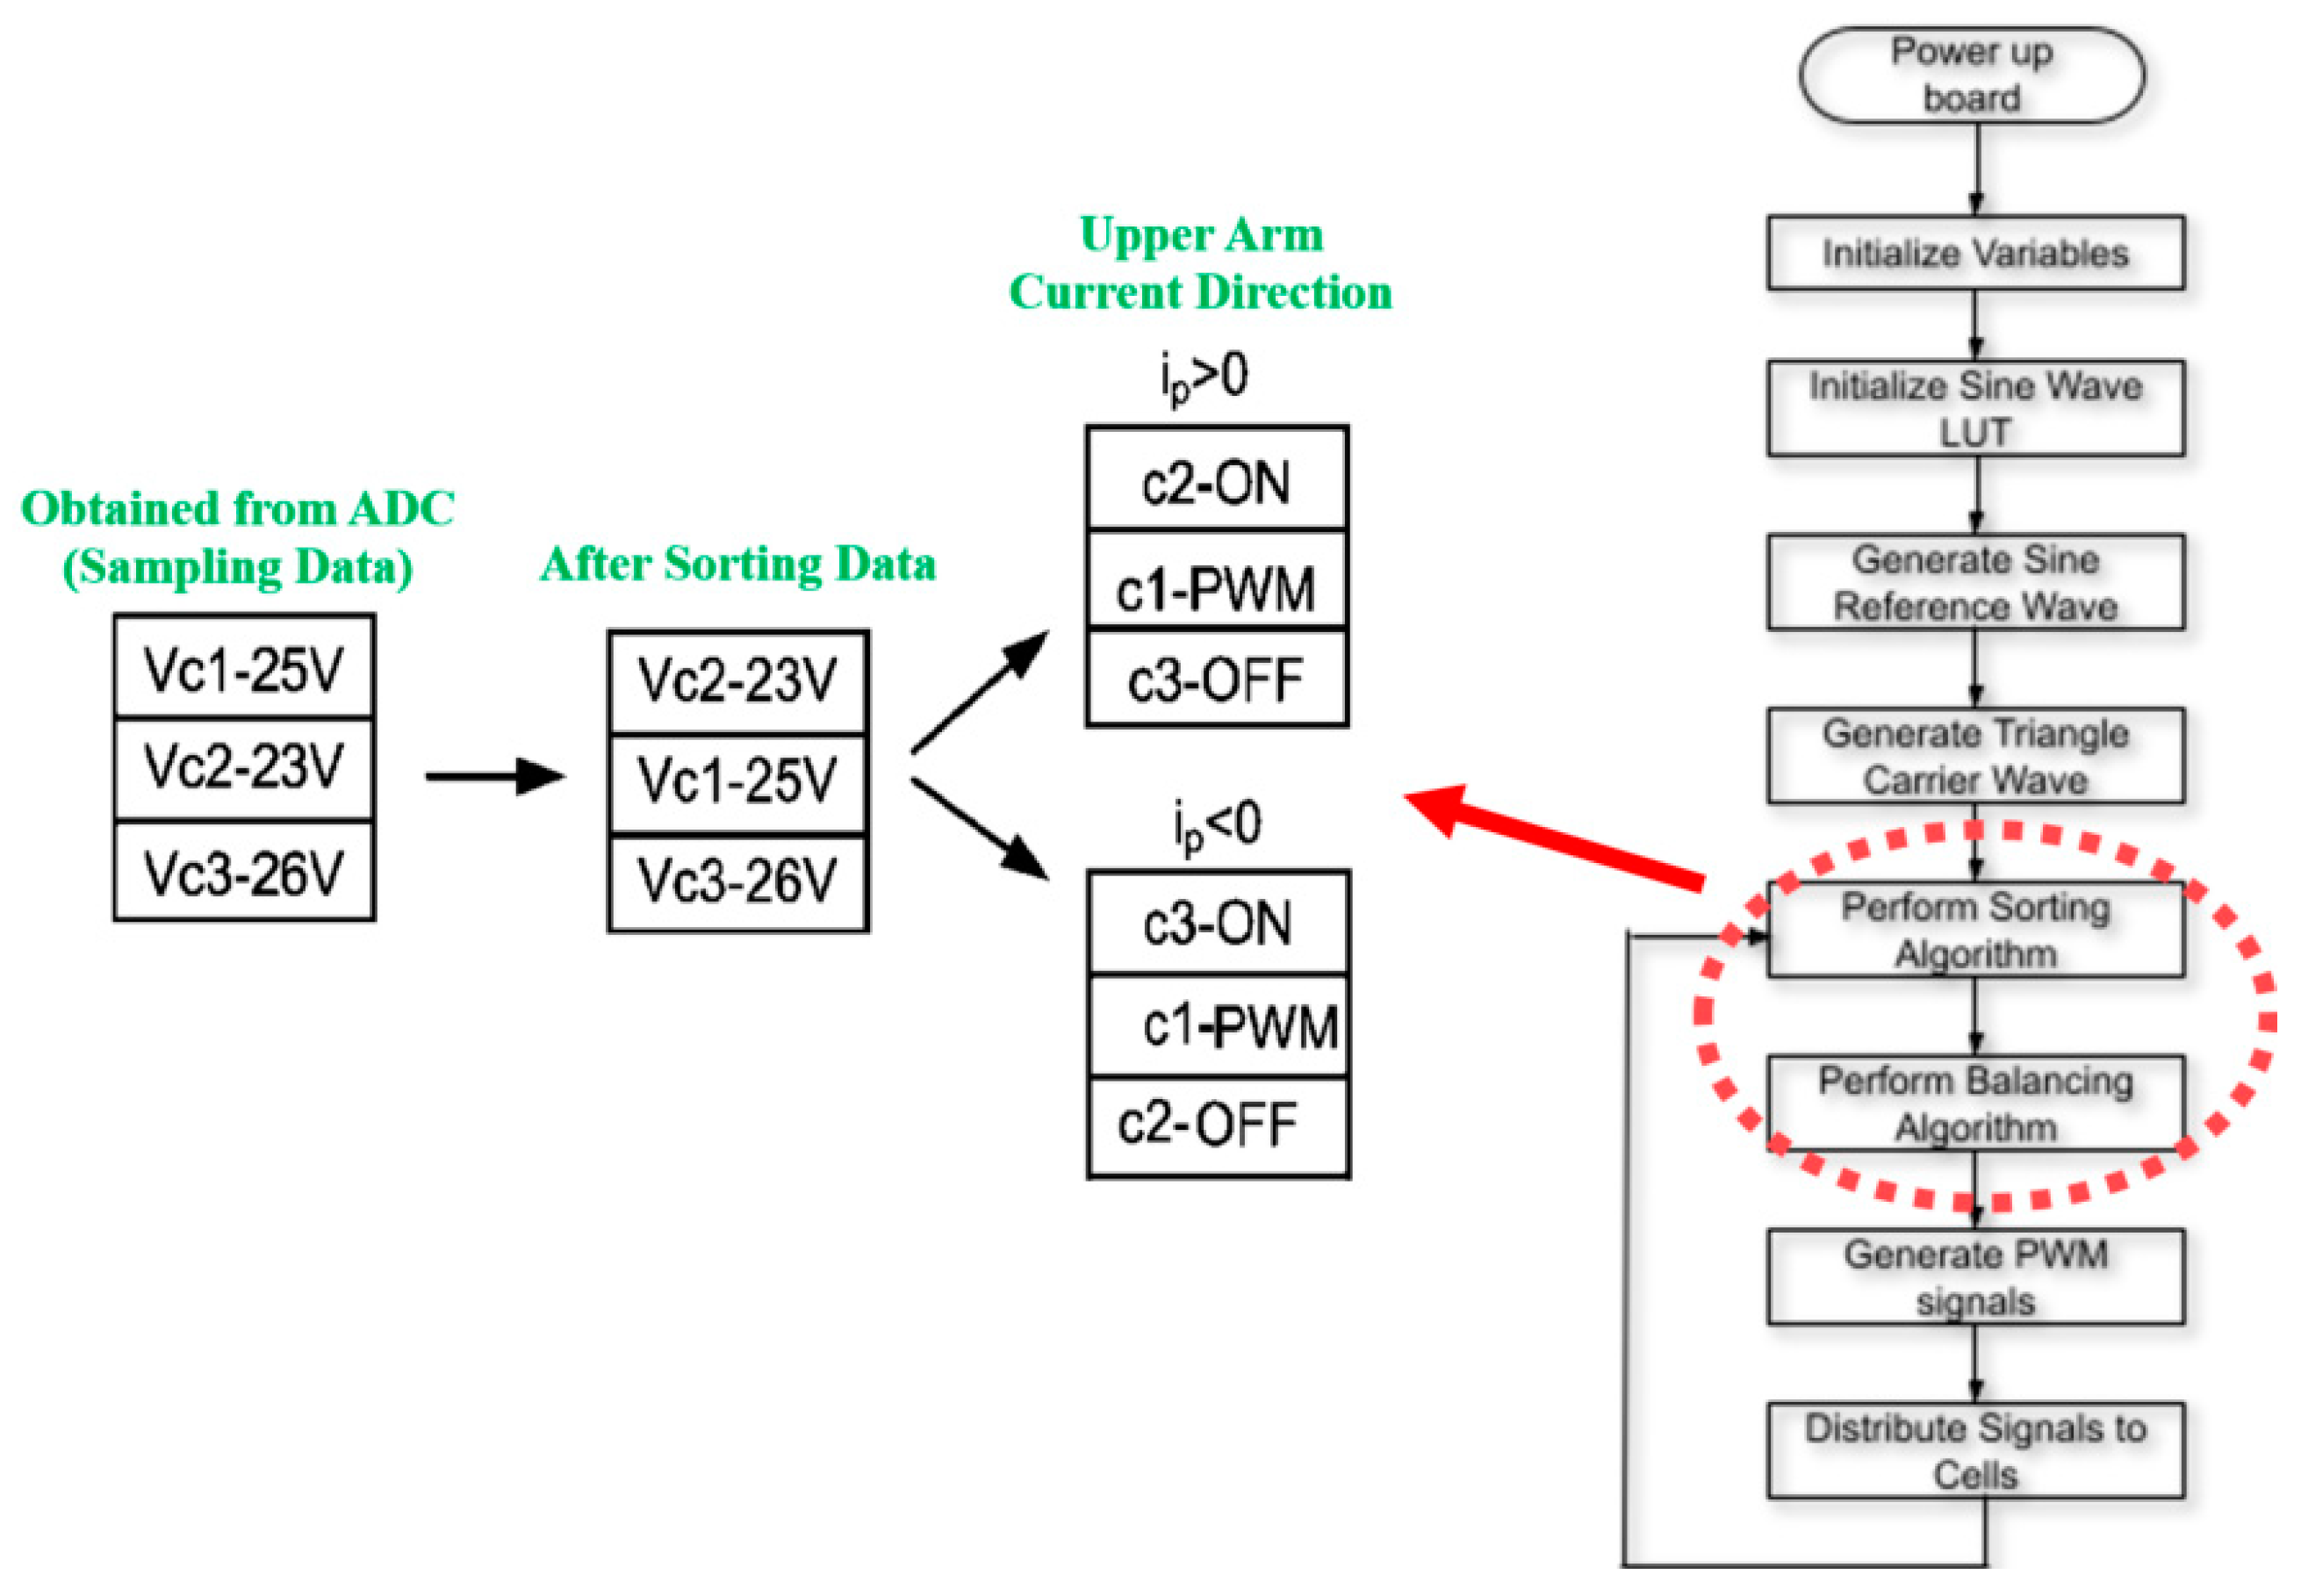
To ensure the proper operation of the MMC converter, the capacitor voltage balancing algorithm was essential to keep the output voltage of each cell around the reference value, which was a division of the DC-bus voltage and the number of cells per arm. The capacitor voltage balancing and sorting algorithm proposed in [
34] was adopted and implemented in this work. The overall flowchart of the PWM strategy and balancing algorithm is shown in
Figure 7. As can be seen from the example presented, a positive magnitude of the upper arm current
ip would charge the cells further, while a negative magnitude would discharge them. At the current sampling, it was found that the voltage magnitudes of the upper cells were in the following order: cells 2, 1, and 3, where cell 3 had the highest measured capacitor voltage. From the LS-PWM strategy, a modulating waveform was generated in which cell 3 was bypassed. Cell 2 was charging (by turning of switch S2). Cell 1 was in PWM mode where the triangle carrier signal was compared with the modulating waveform. Switch
S1 in cell 1 was turned on once the modulating waveform was greater than the triangle; otherwise, it was turned off. The cells working condition was reversed as far as a negative magnitude of the upper arm current
ip was concerned, as illustrated in
Figure 7.
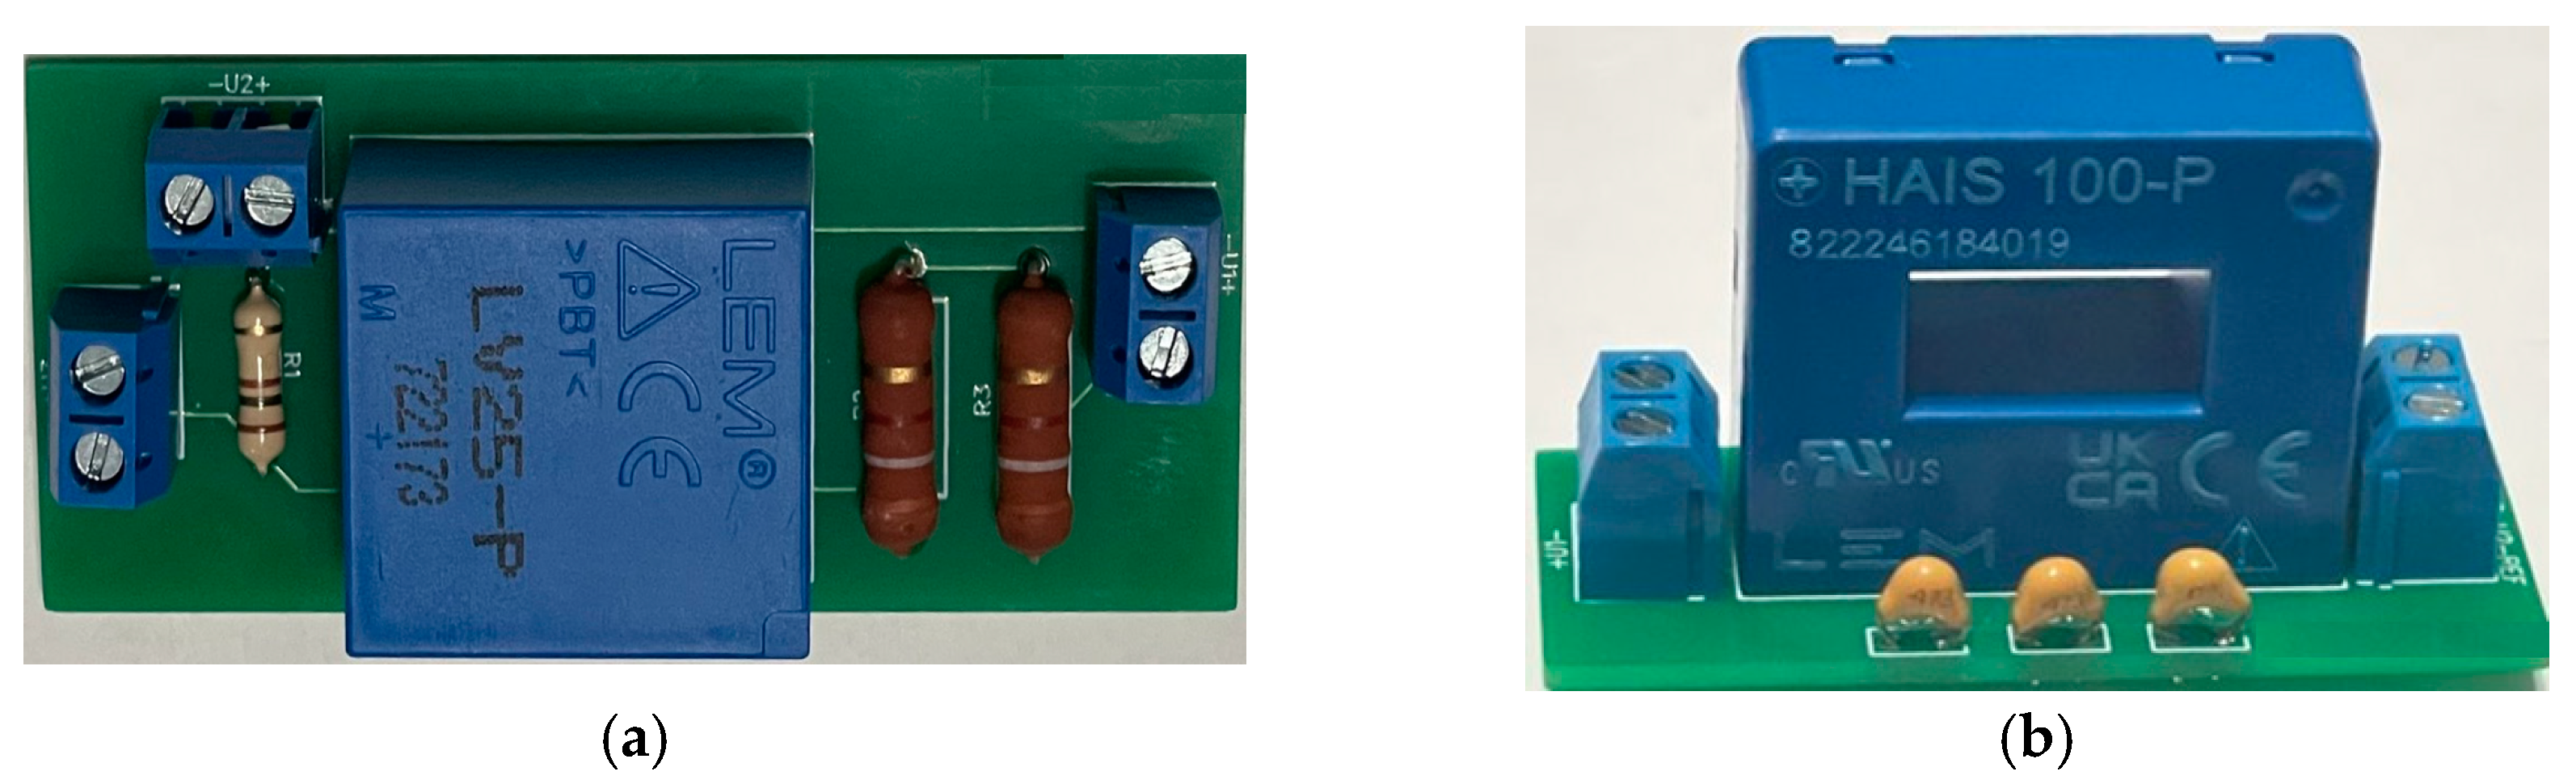
The voltage and current sensors fabricated on PCB boards are shown in
Figure 8. The voltage sensor LV25-P and the current sensor HAIS 100-P were used in this design.
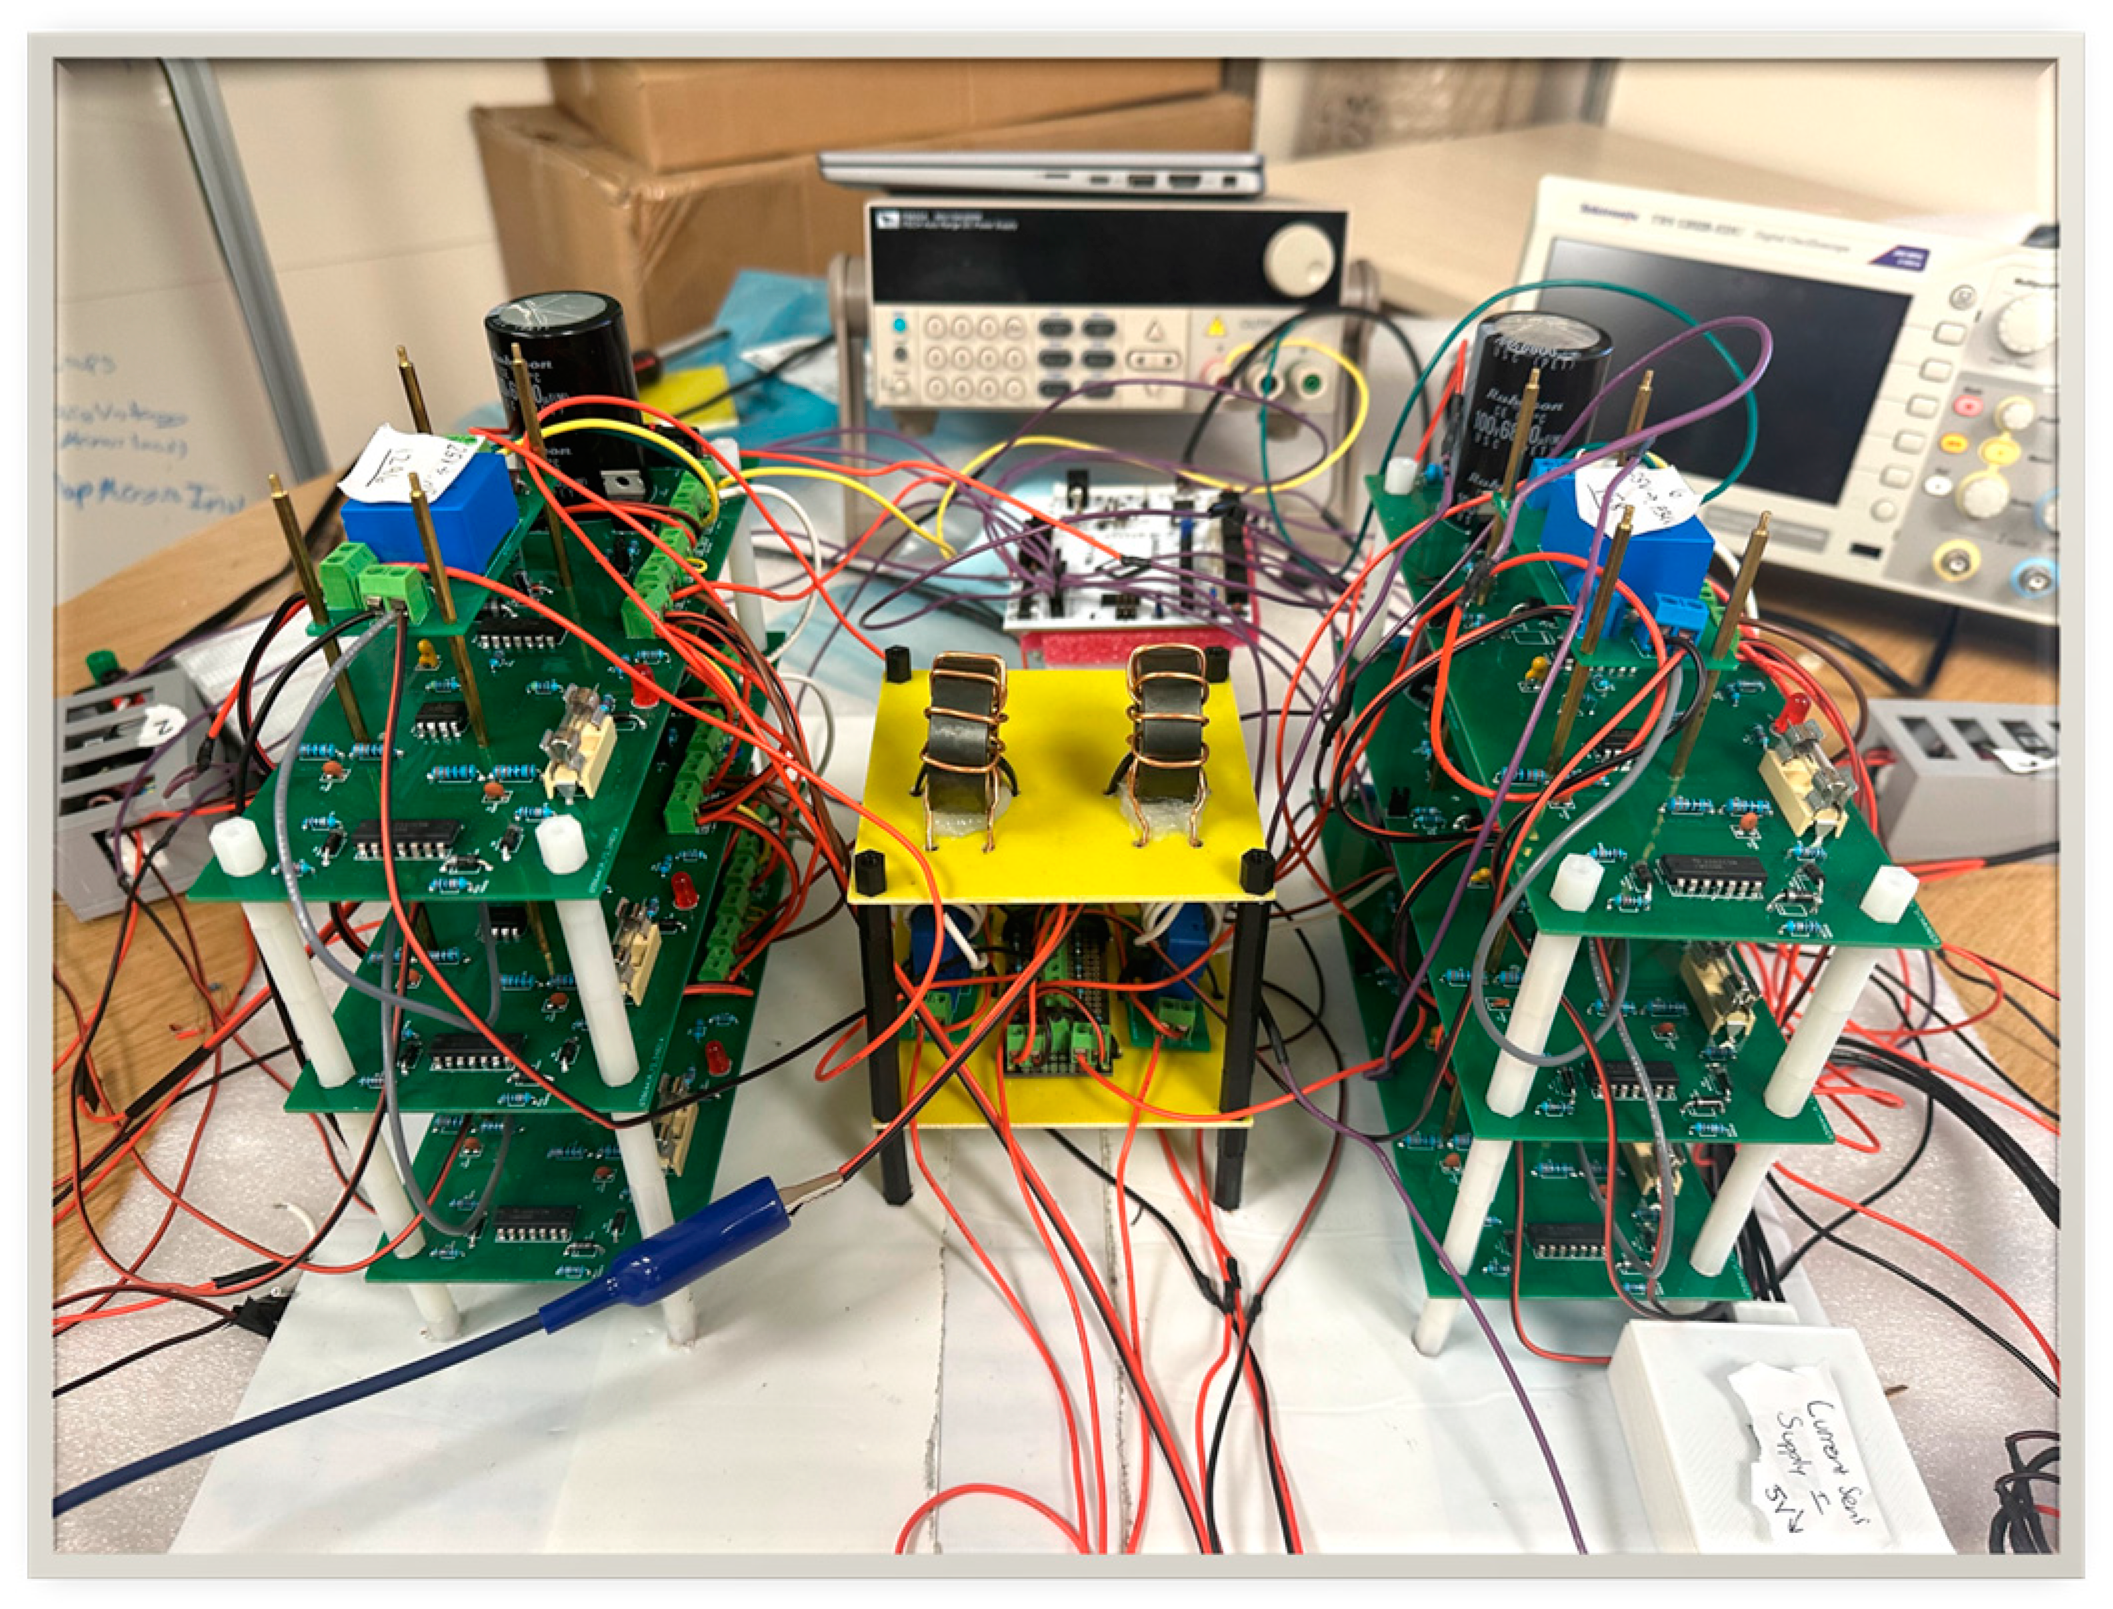
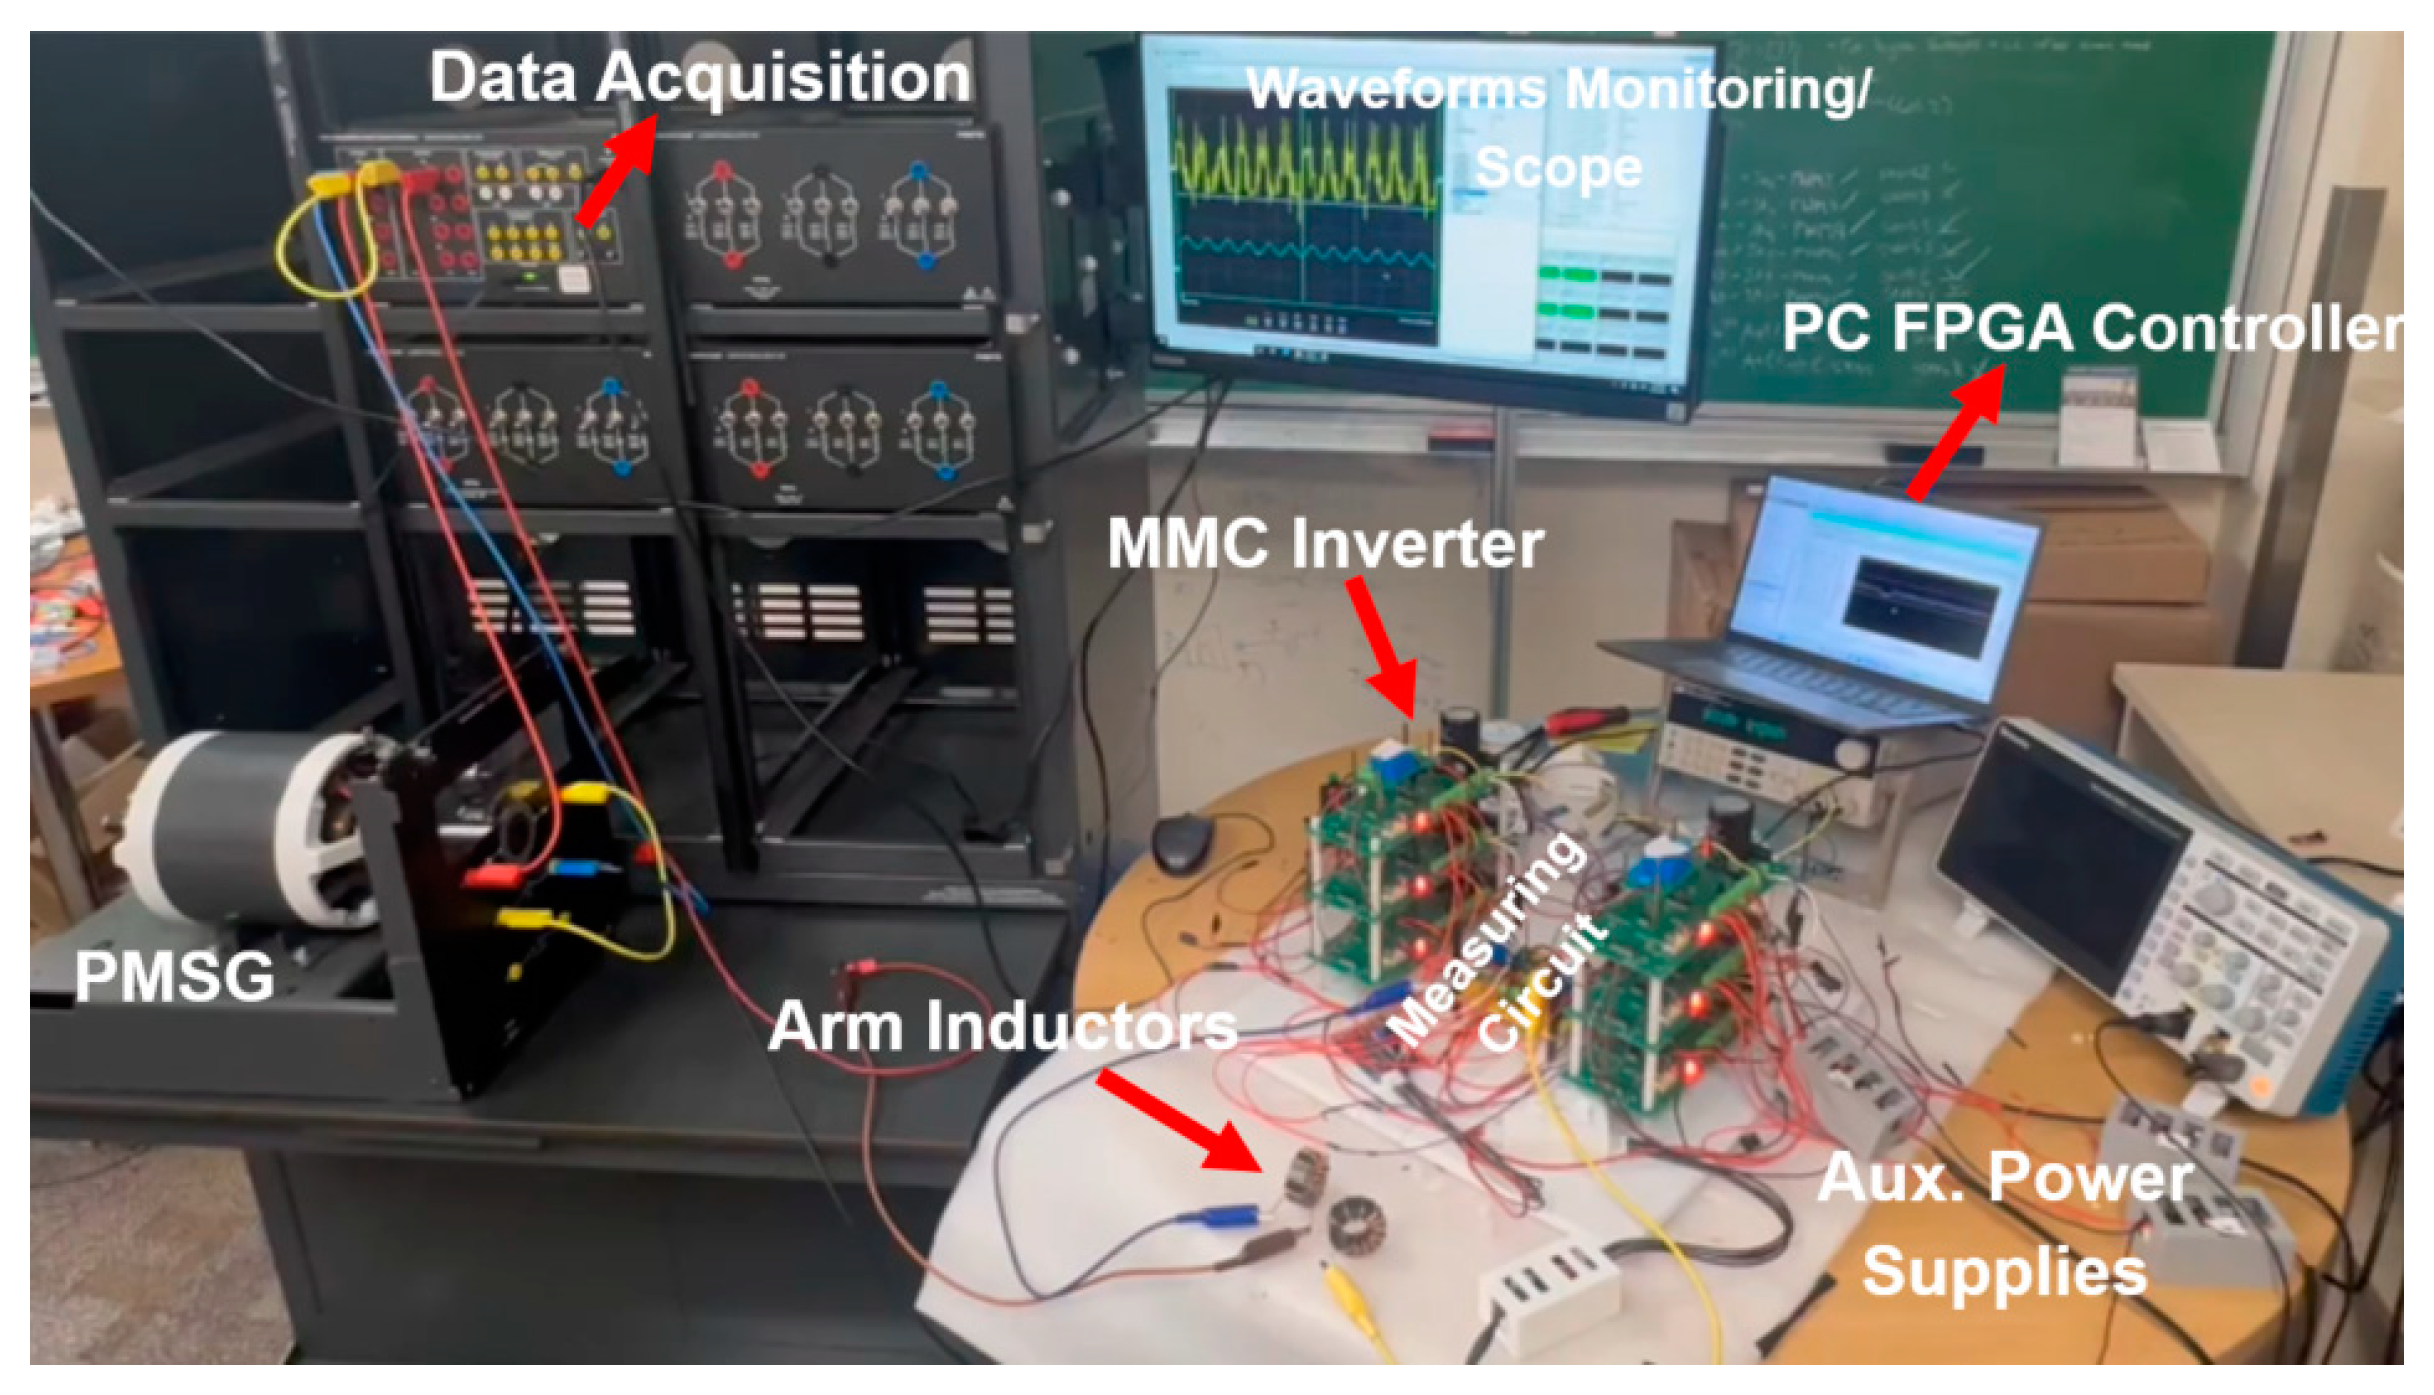
A down-scale lab prototype of the MMC shown in
Figure 9 and the designed experimental testbench in
Figure 10 were built to verify the operation and performance of the studied PTO system and its controls.
A comprehensive analysis and testing using both the MATLAB-Simulink simulation and experiments were conducted, and the results are discussed in the
Section 4.
5. Conclusions
In this paper, the all-electric modular power take-off (PTO) topology with its control schemes was explored for the point-absorber wave energy harvester, which extracted energy from ocean wave movements in all directions. The effects of the hydrodynamics of point-absorber from wave conditions, the flexibility feature of the PTO configuration, and wave profiles were effectively included in the design process to increase the efficiency and reliability of the studied WEC.
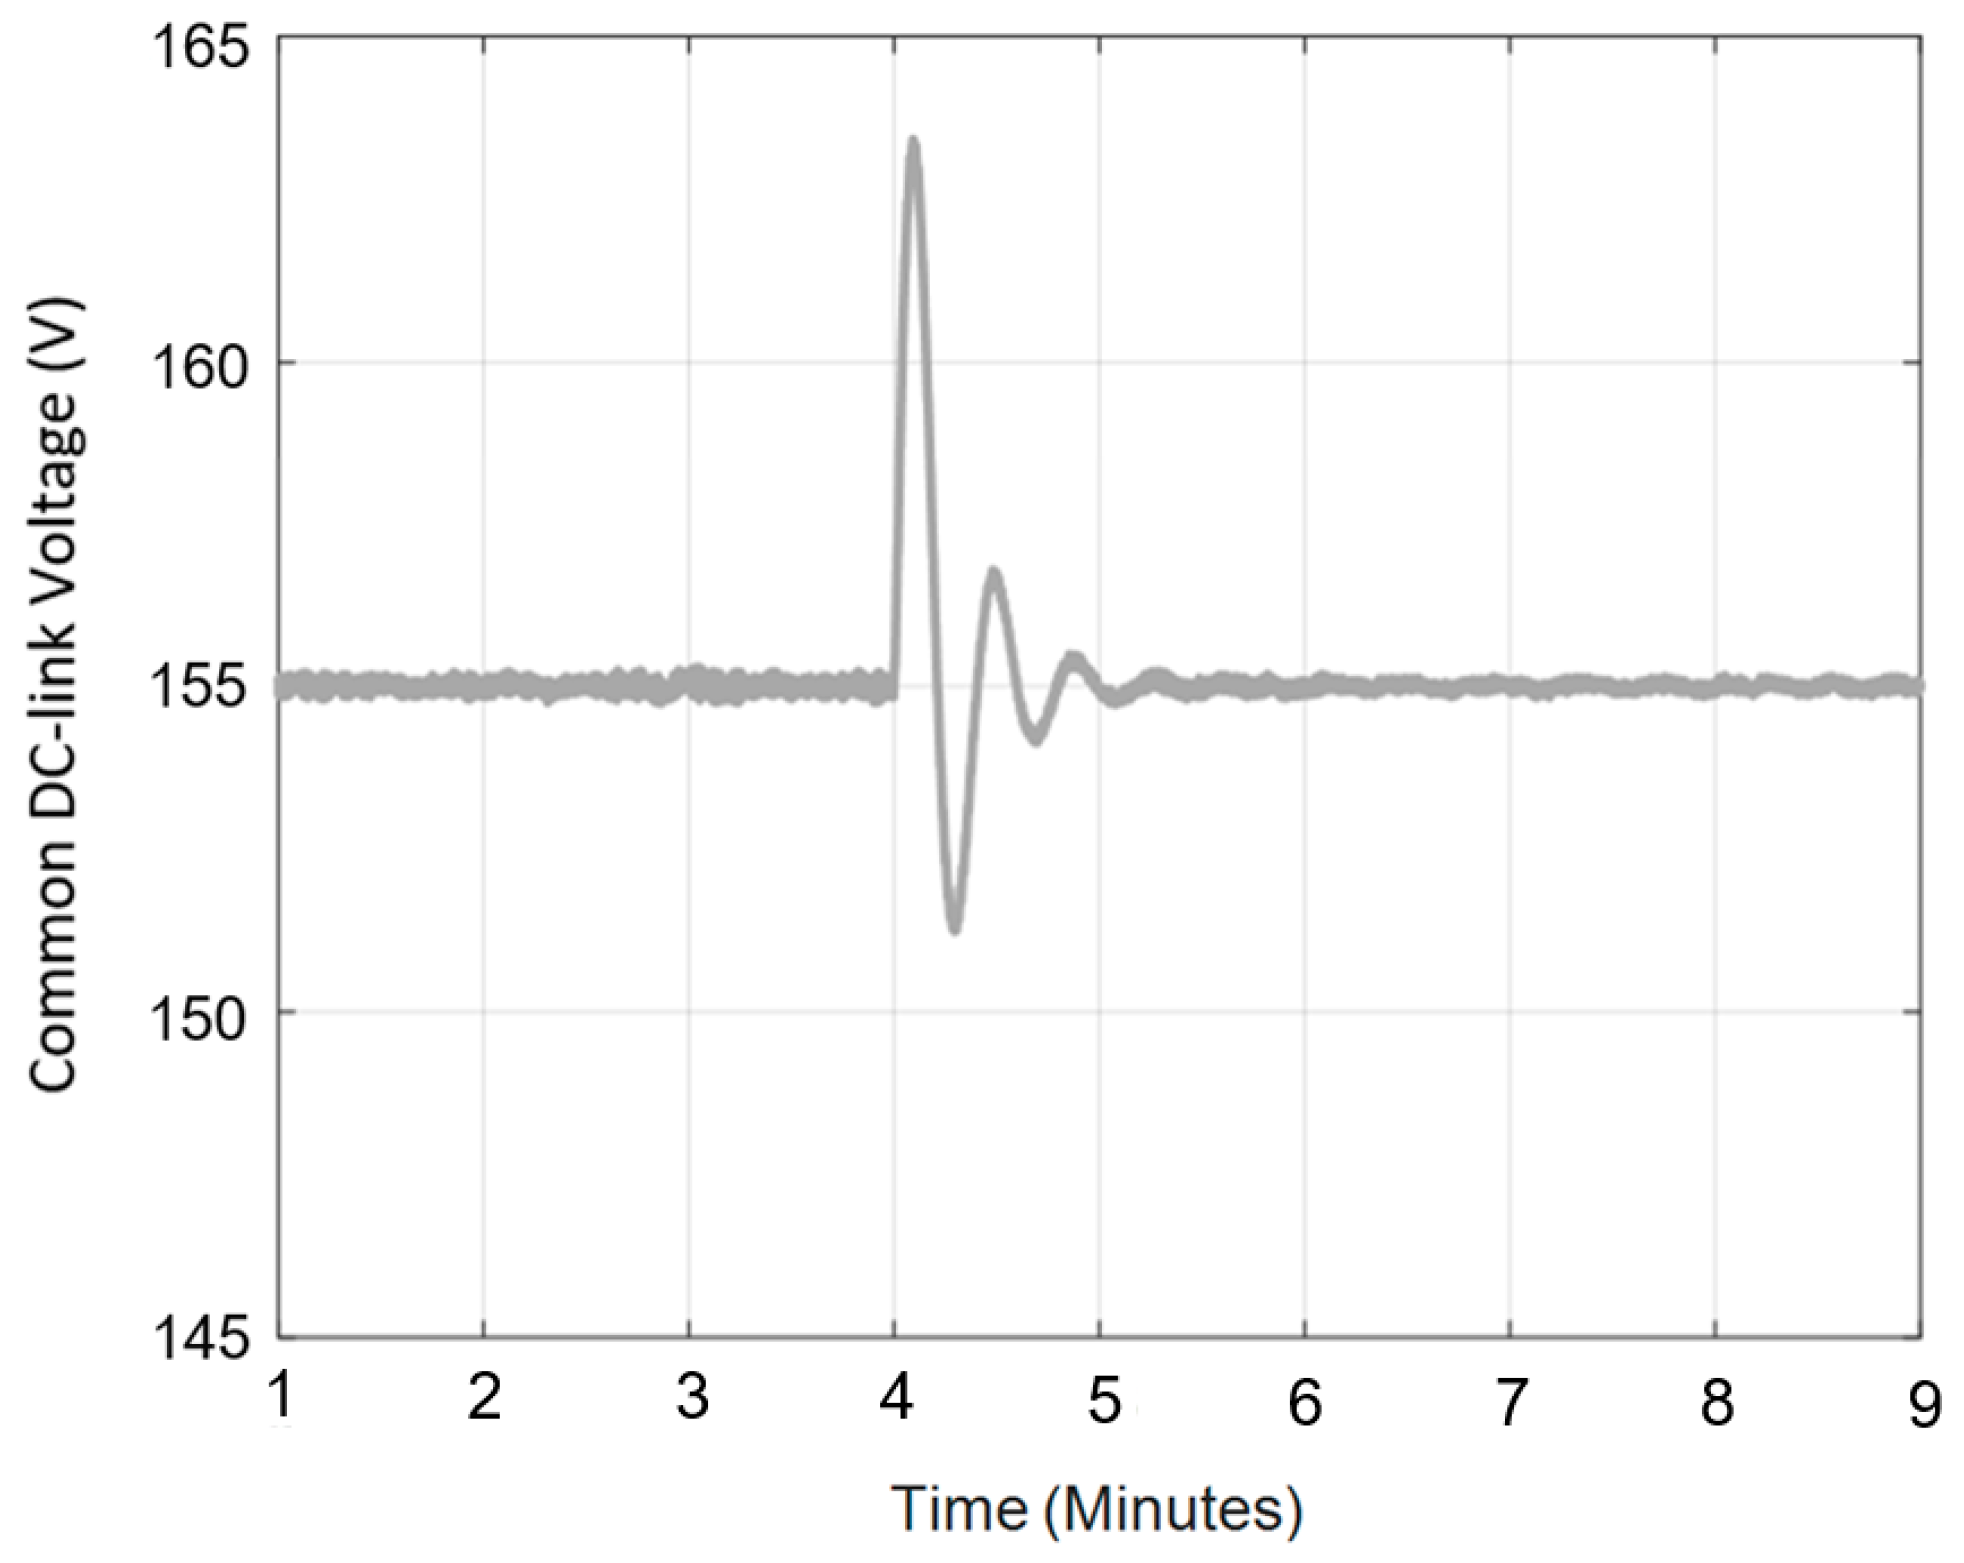
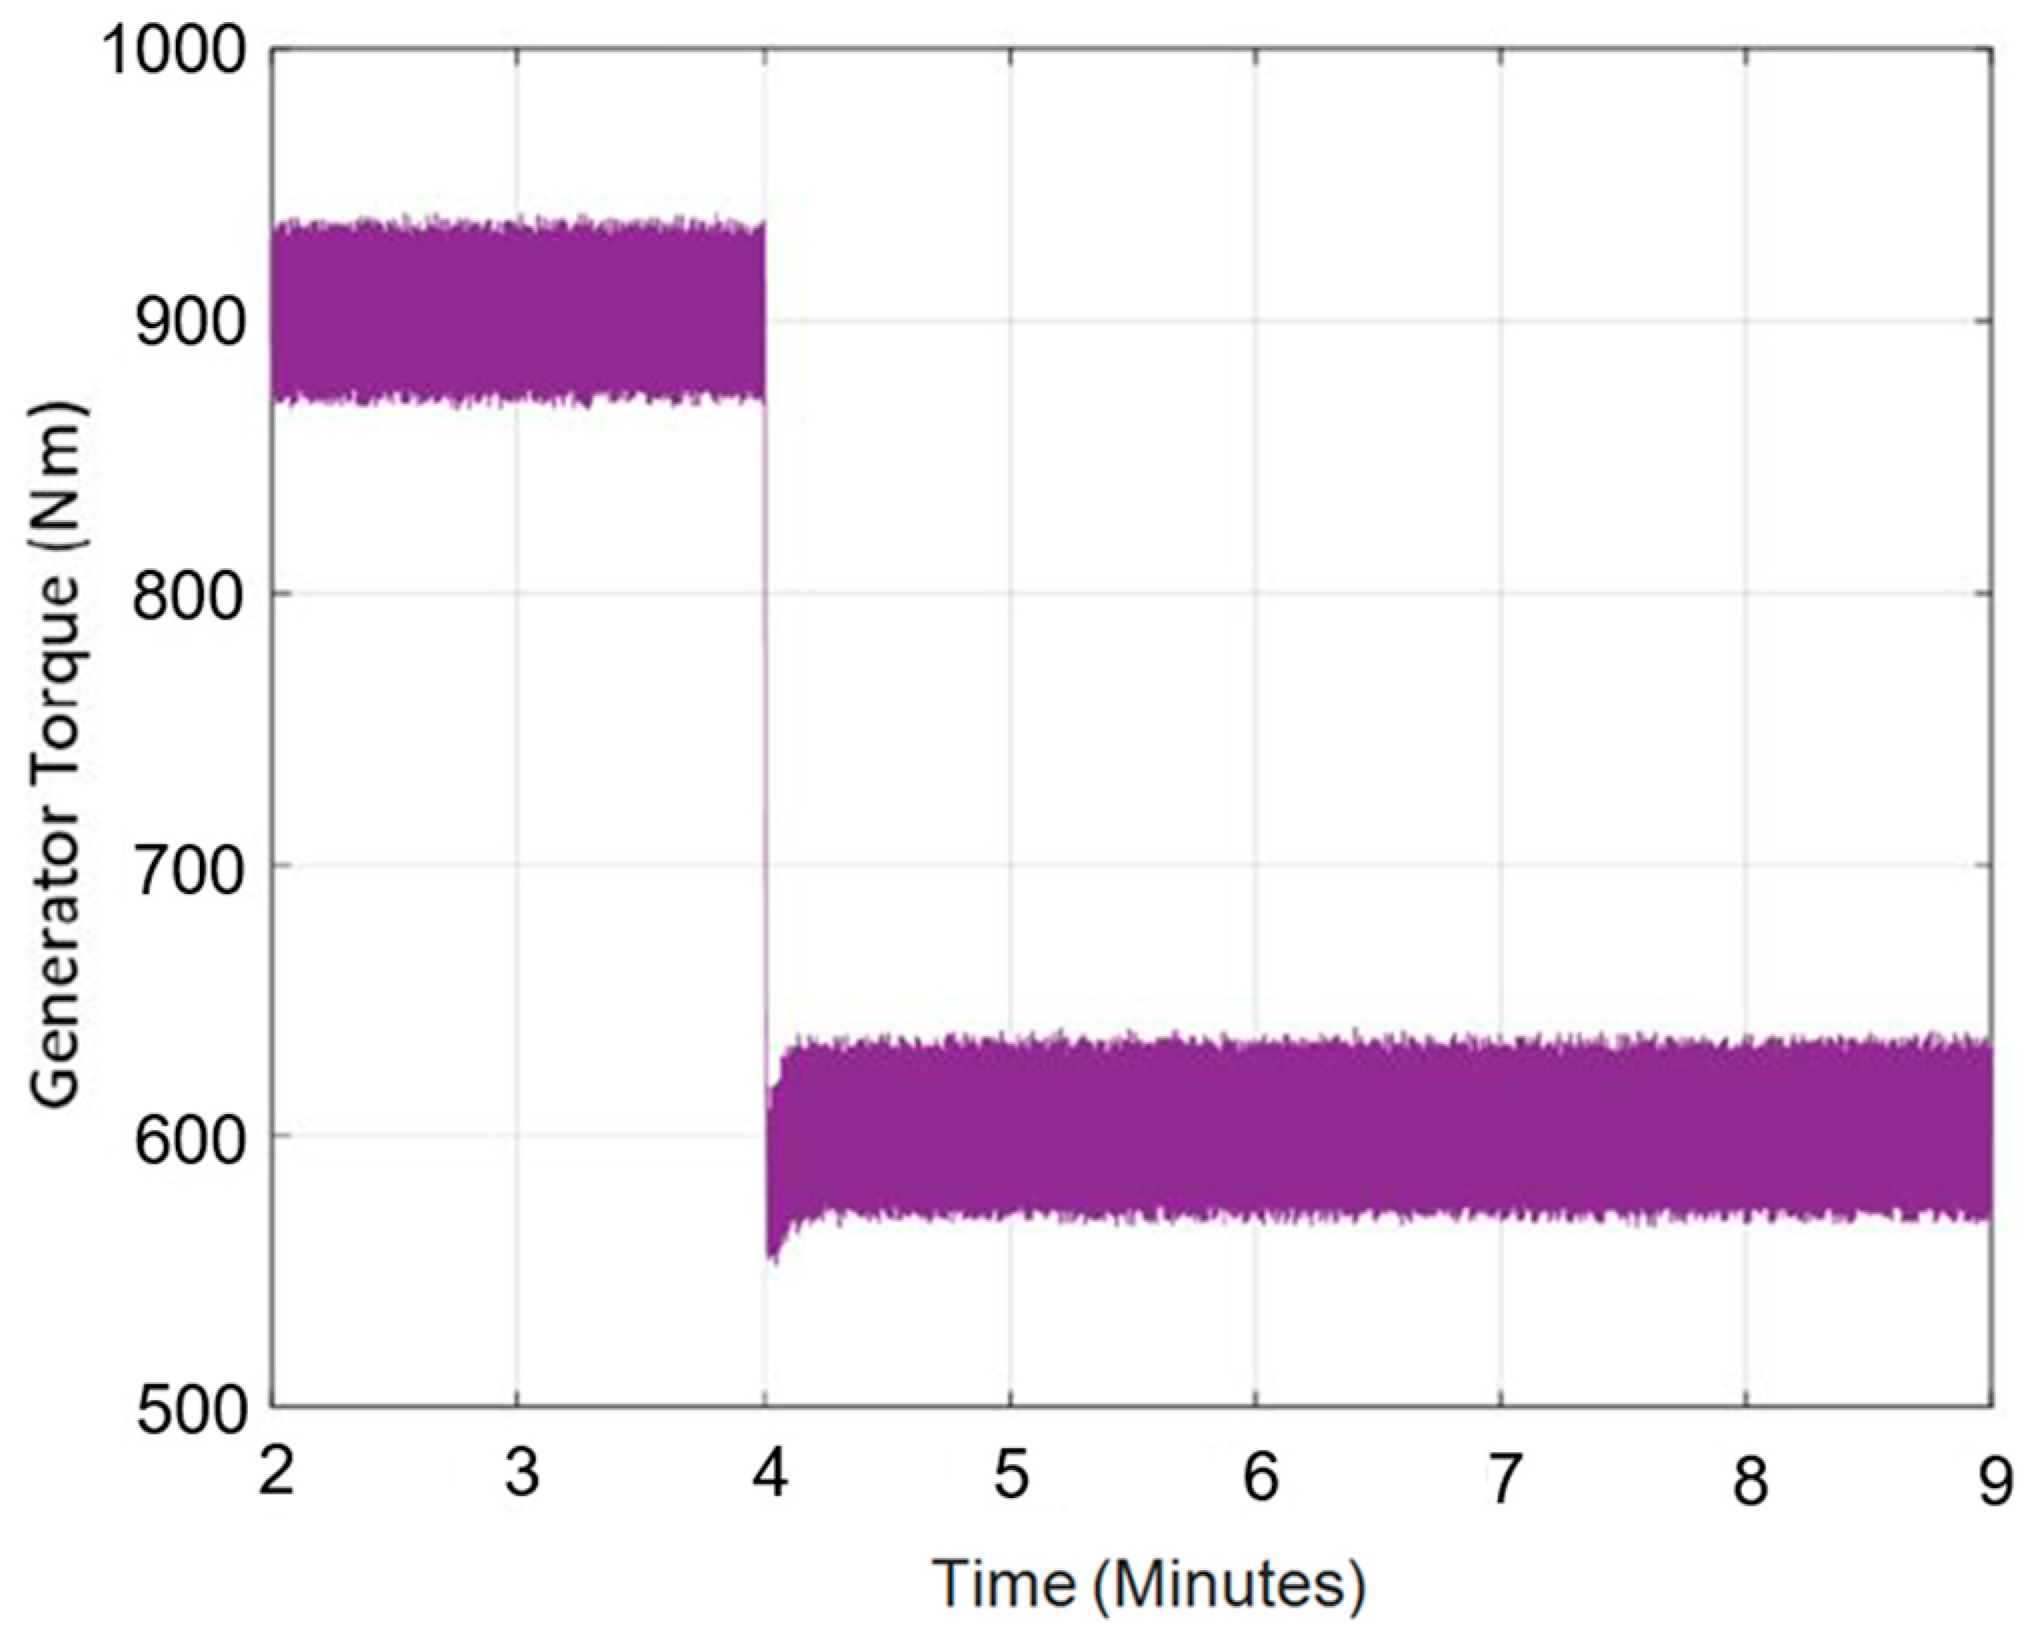
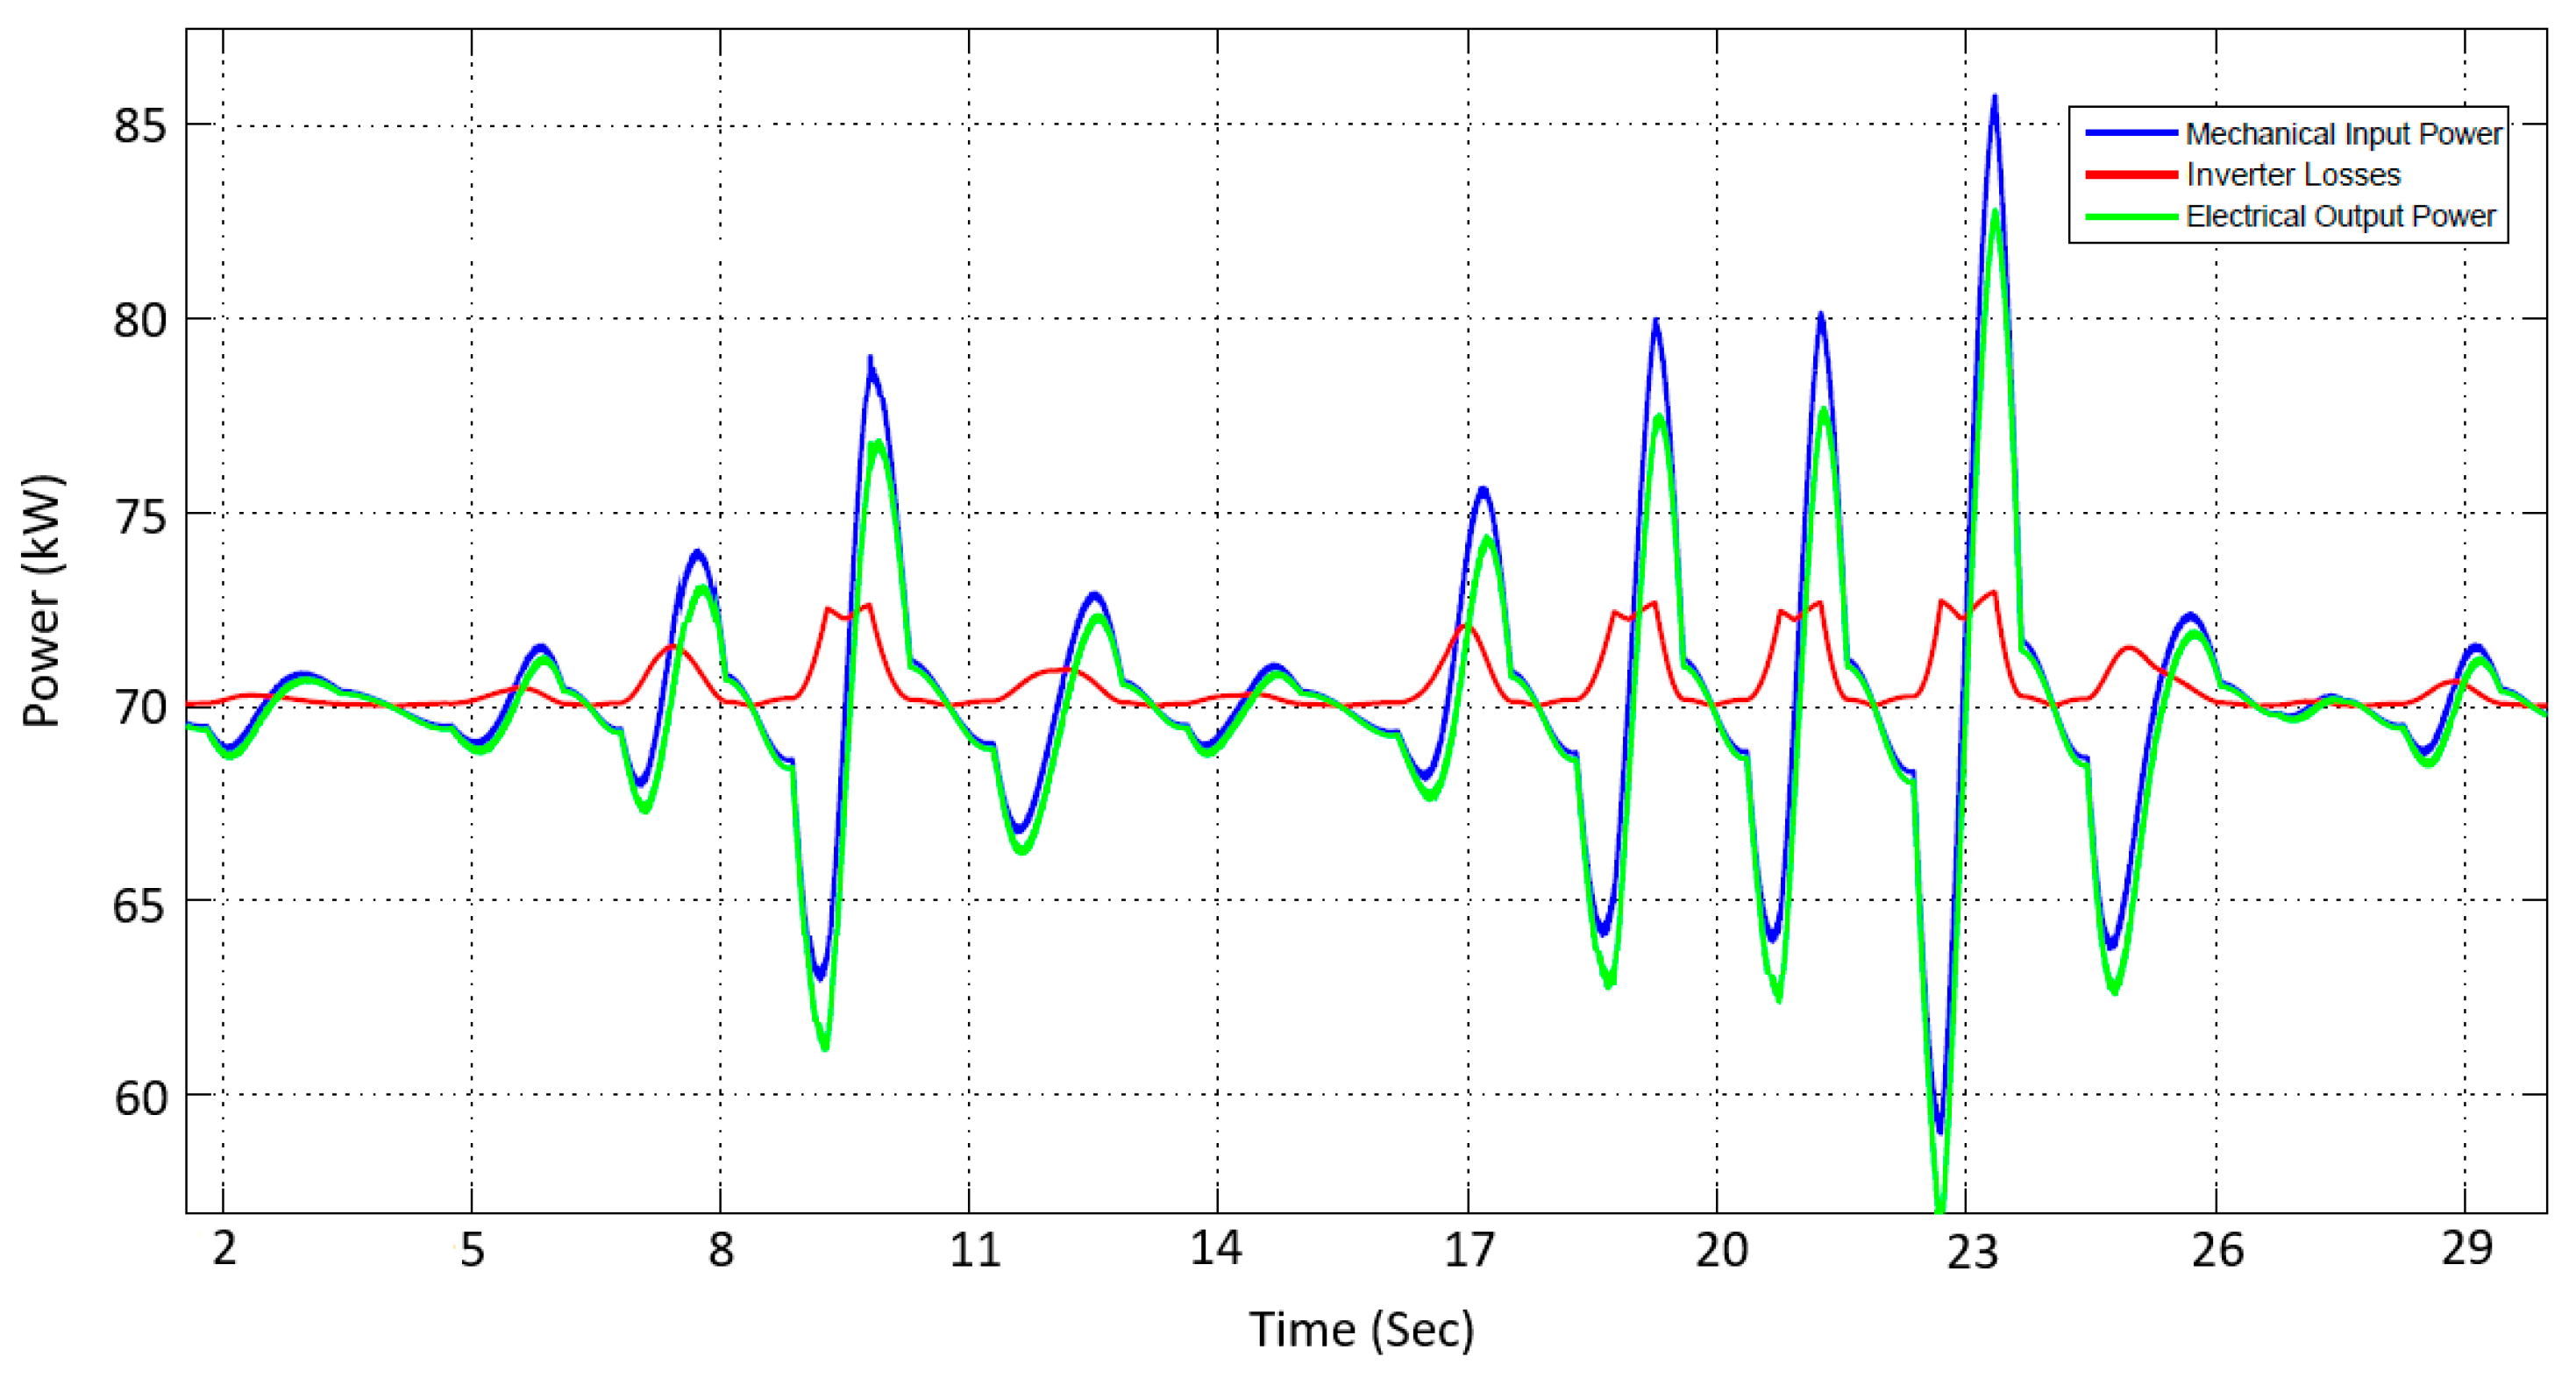
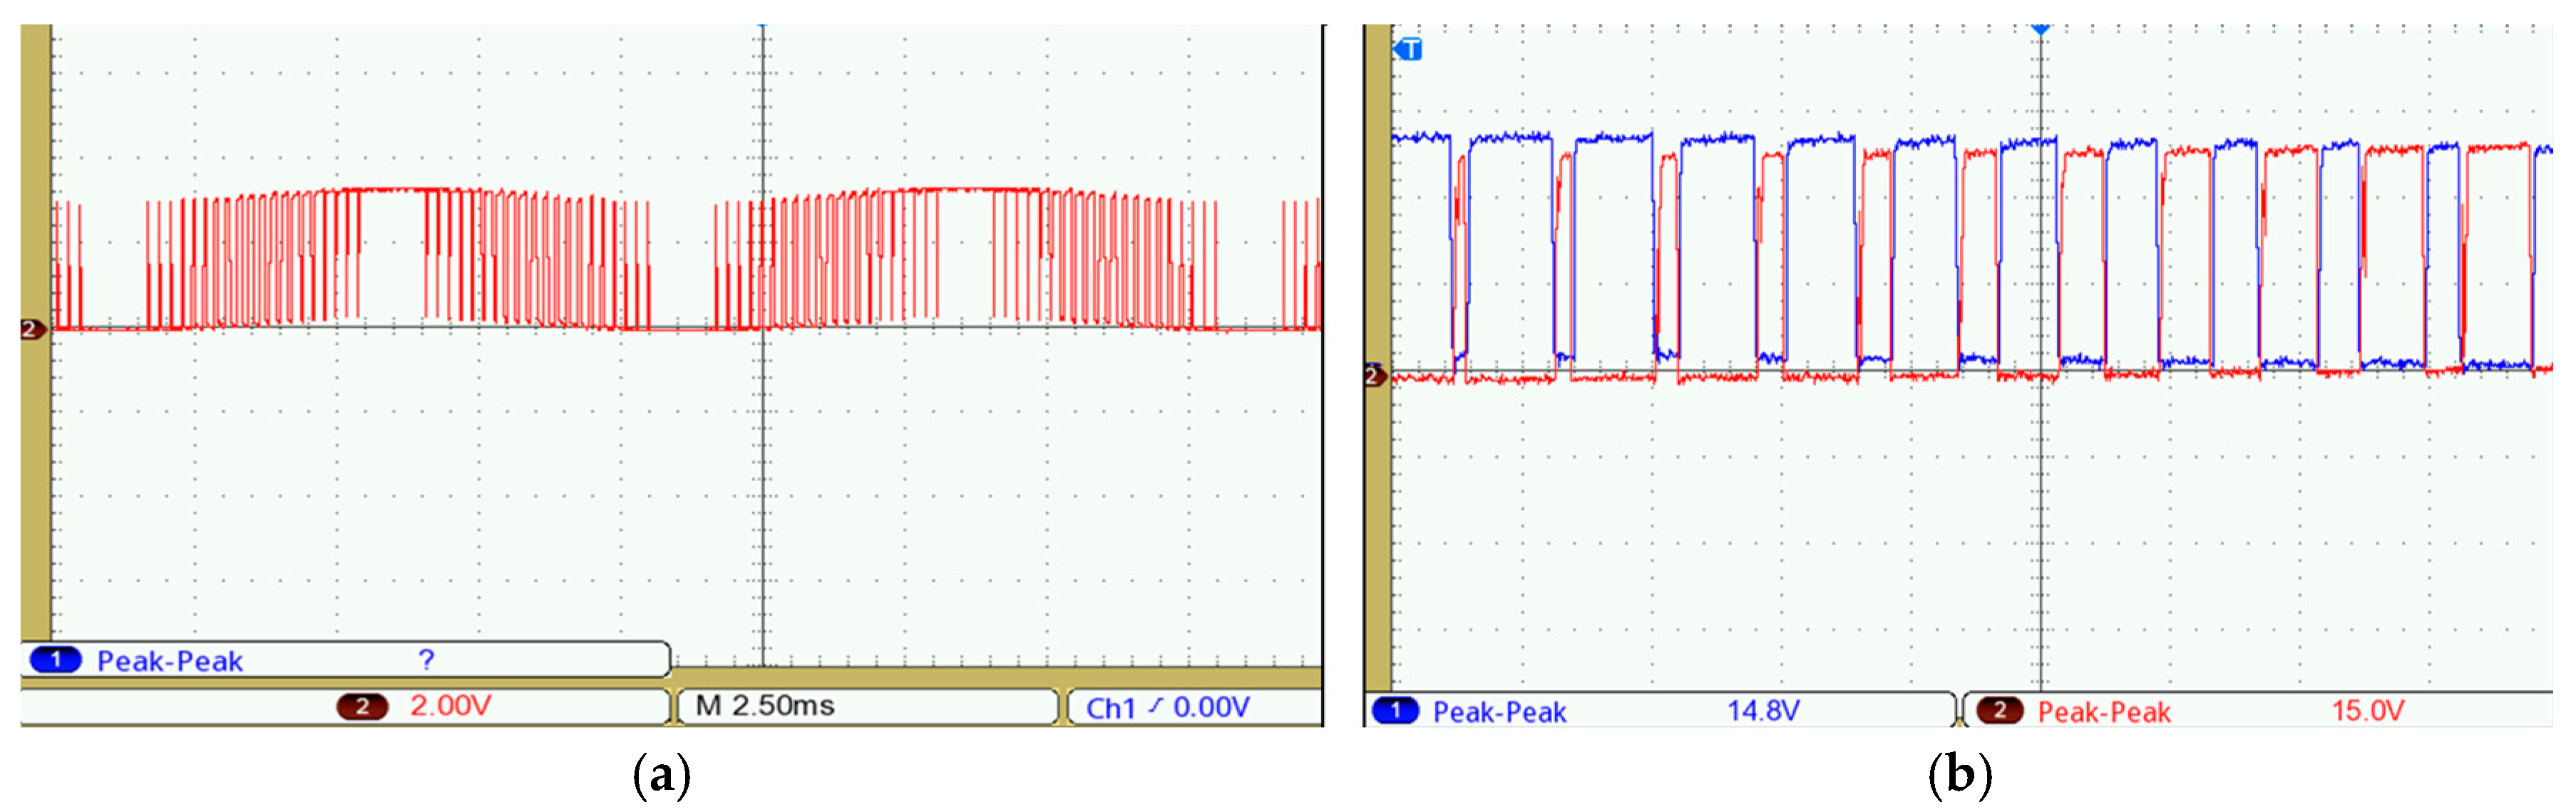
The irregular-wave profile was used for the hydrodynamic model in the simulation analysis that offered a prompt evaluation of the design from a system-level perspective. The preliminary simulation results obtained by the developed MATLAB-Simulink model were discussed. The findings from the steady-state and dynamic response of the proposed PTO were validated by a series of experiments conducted using the built experimental testbench. The obtained results verified the disturbance rejection control functionality with respect to fast transients caused by ocean wave dynamics imposing sudden changes in the generator torque reference for the designed PTO-based MMC converter. The precise system control performance for DC-link voltage regulation during fast dynamics was also obtained. From both the simulation and the experimental lab testing, a fast operation against reference tracking for seamless operation of the WEC system was confirmed without compromising any key operational requirements. Compared with the current state-of-the-art solutions, the proposed PTO system and its control algorithm demonstrated superior performance with reduced losses, higher power extraction, and improved economic benefits by the wave energy converter.
The direct integration of battery energy storage and solar PV modules to the MMC topology without using dc–dc converters is being pursued to achieve high efficiency for practical marine microgrids with increased energy yield. This aspect of the design will be investigated in our future publication together with the optimal energy dispatching scheme among distributed energy sources. By adopting the proposed PTO system, an acceptable size of the entire system is achieved to bring a levelized cost of energy (LCOE) comparable with other renewable energy technologies.
The proposed PTO system improved the current state-of-the-art barriers by introducing a technology that was modular and scalable so that the designed wave energy converter could be assembled in a plug-and-play manner and deployed rapidly. Modularity offered fault-tolerant operation advantages, while manufacturing costs could be minimized, and the operation and maintenance costs could also be substantially decreased by enabling quick replacement or repair of failed components.
Future research topics will investigate economic incentives of the design on the connected PTO circuit and control under various operating conditions and integration of other marine renewable resources. For the mechanical subsystem of the proposed WEC, the hydraulic–pneumatic rod friction considerations are important factors to be included for the WEC efficiency and loss analyses. The experiments on shallow water testing pave the way to further refine the design parameters and component dimensions that will be the direction of our future work.


