Article

Numerical Study on Optimization of Combustion Cycle Parameters and Exhaust Gas Emissions in Marine Dual-Fuel Engines by Adjusting Ammonia Injection Phases

by
Martynas Drazdauskas
* and
Sergejus Lebedevas
Faculty of Marine Technology and Natural Sciences, Klaipeda University, 91225 Klaipeda, Lithuania
*
Author to whom correspondence should be addressed.
J. Mar. Sci. Eng. 2024, 12(8), 1340; https://doi.org/10.3390/jmse12081340 (registering DOI)
Submission received: 17 June 2024 / Revised: 5 August 2024 / Accepted: 6 August 2024 / Published: 7 August 2024

Abstract

:
Decarbonizing maritime transport hinges on transitioning oil-fueled ships (98.4% of the fleet) to renewable and low-carbon fuel types. This shift is crucial for meeting the greenhouse gas (GHG) reduction targets set by the IMO and the EU, with the aim of achieving climate neutrality by 2050. Ammonia, which does not contain carbon atoms that generate CO2, is considered one of the effective solutions for decarbonization in the medium and long term. However, the concurrent increase in nitrogen oxide (NOx) emissions during the ammonia combustion cycle, subject to strict regulation by the MARPOL 73/78 convention, necessitates implementing solutions to reduce them through optimizing the combustion cycle. This publication presents a numerical study on the optimization of diesel and ammonia injection phases in a ship’s medium-speed engine, Wartsila 6L46. The study investigates the exhaust gas emissions and combustion cycle parameters through a high-pressure injection strategy. At an identified 7° CAD injection phase distance between diesel and ammonia, along with an optimal dual-fuel start of injection 10° CAD before TDC, a reduction of 47% in greenhouse gas emissions (GHG = CO2 + CH4 + N2O) was achieved compared to the diesel combustion cycle. This result aligns with the GHG reduction target set by both the IMO and the EU for 2030. Additionally, during the investigation of the thermodynamic combustion characteristics of the cycle, a comparative reduction in NOx of 4.6% was realized. This reduction is linked to the DeNOx process, where the decrease in NOx is offset by an increase in N2O. However, the optimized ammonia combustion cycle results in significant emissions of unburnt NH3, reaching 1.5 g/kWh. In summary, optimizing the combustion cycle of dual ammonia and diesel fuel is essential for achieving efficient and reliable engine performance. Balancing combustion efficiency with emission levels of greenhouse gases, unburned NH3, and NOx is crucial. For the Wartsila 6L46 marine diesel engine, the recommended injection phasing is A710/D717, with a 7° CAD between injection phases.

1. Introduction

Concerns about climate change have led to increased regulations and standards aimed at reducing greenhouse gas emissions from maritime transportation. The transportation sector, including shipping, is responsible for about 20% of the world’s total CO2 emissions, making it the second-largest contributor to global carbon pollution [1]. Therefore, international agreements such as the International Maritime Organization’s (IMO) MARPOL Annex VI set limits on vessel emissions and promote the use of cleaner fuels and technologies. The IMO revised its GHG reduction strategy in 2023, aiming to achieve a 70–80% reduction in GHG emissions by 2040 compared to 2008 levels, with the ultimate goal of achieving zero GHG emissions by 2050 [2]. The IMO initiative is coordinated with the EU’s long-term objectives for maritime transport, aiming to reduce GHG emissions by 90% by 2050 compared to 1990 levels, as outlined in directive SEC (2021) 562 [3]. Substantial reductions in CO2 emissions from the maritime transport sector are imperative for mitigating climate change. Logistic, hydrodynamic, and technological measures have the potential to reduce CO2 emissions from ships by 5–20%, while the utilization of renewable and low-carbon fuels could achieve reductions of up to 100%, according to DNV [4]. Despite these possibilities, recent data show that on average, 79% of newly built ships annually opt for traditional fuel, while 98.4% of ships in operation rely on petroleum fuel [4]. Furthermore, the average operational lifespan of ships in developed economies is 21.1 years, and in developing economies, it is 28.6 years [1]. Therefore, despite the construction of new ships, the transition to renewable and low-carbon fuels in maritime transport may progress slowly due to the long operational lifespan of ships. However, retrofitting the existing fleet of marine diesel engines to utilize renewable and low-carbon fuels is considered a solution that meets the regulations and achieves targets set by both the IMO and the EU. According to experts [4], in the short term, there will be a focus on prioritizing new-generation biofuels when evaluating the life cycle of GHG emissions, alongside an anticipated gradual transition from LNG to BIO-LNG and methanol. The utilization of methanol in maritime transport has begun to gain momentum. In February 2024, Maersk launched 1 of the 18 large vessels they had ordered, equipped to utilize methanol [5]. However, in the medium term, a key priority, given the substantial GHG reduction plans outlined by both the IMO and EU, involves advancing the development of ammonia [4]. When comparing ammonia with methanol, the physical properties of ammonia are similar, only the density of methanol is 30% higher. However, the change in CO2 is noticeable. Studies have shown that, taking a tank-to-wake approach, by using methanol instead of heavy fuel oil (HFO), CO2 emissions can be cut by 7% [6]. Ammonia does not generate CO2 emissions when burned since it lacks carbon atoms in its chemical composition. This characteristic makes it a promising option for reducing greenhouse gas emissions from ships. Another key factor in the widespread use of ammonia in the marine transport sector is the existing global terminal infrastructure for receiving and storing ammonia. Globally, there are approximately 210 existing ammonia terminals and 130 existing methanol terminals within the port storage infrastructure [4]. However, using ammonia in maritime transport poses several challenges. Ammonia’s combustion characteristics differ significantly from those of petroleum-based fuels and most renewable fuels. With a low fuel cetane number (5–7 units) and high auto-ignition temperature (650 °C), achieving ammonia ignition at an engine compression ratio of 35:1 or more is unrealistic given the geometrical parameters of marine engines [7]. Consequently, ensuring ammonia combustion in low- and medium-speed marine diesel engines, which typically have compression ratios of up to 17:1, necessitates the use of pilot fuel with favorable auto-ignition characteristics, such as diesel or biodiesel. With a laminar flame speed 6–12 times slower than that of diesel, ammonia’s laminar flame speed can lead to incomplete combustion of fuel–air mixtures, thereby reducing thermal efficiency and increasing emissions. Hence, during the combustion cycle, it is advisable to decrease the start of pilot fuel and ammonia combustion distance in crank angle degrees. Furthermore, the 28% lower density and 2.3 times lower calorific value of ammonia compared to diesel are related to the increase in ammonia fuel mass required to maintain the same power compared to running the engine on diesel.
Another concern is exhaust gas emissions. Due to the presence of nitrogen atoms in its chemical composition, ammonia combustion results in more intensive formation of NOx and N2O emissions compared to diesel [8]. Moreover, using ammonia in marine diesel engines presents substantial environmental and safety challenges, particularly regarding ammonia slip and its potential impacts on marine ecosystems. Ammonia slip, the unintentional release of unreacted ammonia into exhaust gases, contributes to air pollution by forming fine particulate matter and secondary aerosols, which pose significant health risks to humans [9,10]. In marine environments, ammonia can lead to eutrophication, where excess nutrients trigger harmful algal blooms that deplete oxygen and create hypoxic dead zones, severely impacting aquatic life [11,12]. The toxicity of ammonia to marine organisms can cause physiological stress, reduced growth rates, and increased mortality, with potential for bioaccumulation that disrupts food webs and overall ecosystem health [13]. Therefore, given the ongoing rise in requirements for environmentally sustainable transport (IMO MARPOL, EU Green Deal), before retrofitting the existing fleet of marine diesel engines to utilize ammonia, solutions like combustion cycle optimization and exhaust gas aftertreatment technologies are needed to reduce exhaust gas emissions.
Exhaust aftertreatment technologies are critical for the clean operation of ammonia in retrofitted diesel engines. Key methods include exhaust gas recirculation, which reduces NOx emissions by recirculating a portion of exhaust gases into the combustion chamber to lower combustion temperatures and inhibit NOx formation [14]. Wet scrubbers are effective in removing ammonia from exhaust gases due to ammonia’s basicity and water solubility, and they also capture particulates and reactive acid gases such as NO2, thereby mitigating environmental and health impacts [15]. Ammonia oxidation catalysts are used to oxidize unburned ammonia to nitrogen and water, reducing ammonia emissions [16]. Selective catalytic reduction systems, which utilize a catalyst and a reducing agent (typically ammonia or urea), convert NOx into nitrogen and water and are capable of oxidizing low concentrations of ammonia in the exhaust to N2 through NOx intermediates [17]. However, due to the complexity of exhaust gas aftertreatment systems and the scope of this article, an investigation into these systems is not included.
Recently, the DNV classification society has issued rules for ammonia ensuring the safe and compliant use of ammonia in marine transport engines [18]. Ammonia presents unique safety challenges due to its toxicity, flammability, and corrosiveness. Robust safety measures must be implemented throughout the supply chain, from production and transportation to onboard storage and handling. The rules come with several qualifiers specifying mandatory basic as well as optional levels of preparation, relating to structural aspects, engine and machinery, piping, and bunkering. DNV provides a practical path for owners to implement a zero-carbon fuel option for their vessels. However, an important aspect of the feasibility of using ammonia in diesel engines remains undefined—the efficient utilization of energy and a reduction in exhaust gas emissions, primarily focusing on NOx and N2O. Research in this direction is widely conducted within the scientific community [7,19,20,21,22,23,24,25,26,27]. Reviewed studies in the literature are divided into two categories of ammonia feed into the cylinder: low-pressure dual-fuel (LPDF) strategy, when gaseous ammonia is introduced through the intake manifold; and high-pressure dual-fuel (HPDF) strategy, when liquid ammonia is directly injected into the cylinder. Both fuel injection strategies differ mainly in combustion characteristics and maximum ammonia cyclic mass utilization. With the LPDF strategy, the share of ammonia in the dual-fuel balance is limited to 80–90% due to engine starting properties, predominantly attributed to the low laminar flame speed of ammonia [20,21,22]. On the contrary, with the HPDF strategy, the optimal proportion of ammonia in the dual-fuel balance is 95–97% [23,24]. However, due to the difference in ammonia heat release characteristics compared to diesel, direct diesel engine retrofitting to run on dual ammonia diesel fuel, especially for high ammonia ratios, is not an option as ammonia results in poor combustion characteristics. Therefore, an advanced start of diesel injection is necessary to achieve heat release characteristics similar to a diesel engine. Because of the early diesel injection, which determines ammonia ignition, typically 20–30° CAD earlier compared to D100, diesel has adequate time to be uniformly distributed in the combustion chamber. This results in a short and intense pre-mixed heat release characteristic which results in an increase in indicative thermal efficiency (ITE). For example, when a diesel engine (B/S = 137/165 mm, 910 rpm) was transferred to run on ammonia with a dual-fuel ratio of D10/A90 (diesel 10% and ammonia 90%) using the LPDF strategy at diesel SOI −15° CAD TDC (corresponds to D100) [25], ITE reached 36.3%, while advancing diesel SOI to −50° CAD TDC resulted in 48.4% ITE. A poor engine performance at SOI −15° CAD TDC was determined by incomplete combustion with a 22.8% unburned loss in energy balance. This also represents in high 35,000 ppm unburned NH3 at diesel SOI −15° CAD TDC, while at SOI −50° CAD TDC, unburned NH3 was reduced to 2000 ppm. It was also observed that N2O, one of the GHG components, had the same tendency to decrease from 110 ppm to 30 ppm. Thus, optimizing the diesel injection phase using LPDF demonstrates the potential for significantly reducing emissions while increasing efficiency. When using the HPDF strategy, both ammonia and diesel injection phases influence combustion cycle parameters and exhaust gas emissions. Zhang et al. [26] investigated two-stroke diesel engine (B/S = 150/175 mm, 375 rpm) performance by performing an experiment at a D50/A50 fuel ratio. It was determined that adjusting ammonia SOI from −16° to 0° CAD TDC while keeping diesel SOI constant at −8° CAD TDC resulted in the identification of pre-mixed and diffusion combustion. Diffusion combustion at ammonia SOI 0° CAD TDC resulted in a longer combustion duration by 5° CAD with a decrease in Pmax by 14% compared to pre-mixed combustion. However, differences in combustion characteristics did not influence ITE—it remained unchanged. As a result, the adjustment of injection phases demonstrates the potential to reduce Pmax, which is important as Pmax negatively impacts the mechanical loading of piston-rod group parts. Furthermore, Tie Li et al. [27] reported the optimization capabilities of pilot diesel and ammonia injection phases for a two-stroke marine diesel engine (B/S = 340/1600 mm, 157 rpm) running on a D3/A97 dual diesel ammonia fuel ratio. It was observed that not only the timing between the ammonia and diesel injection phases, but also their distance to TDC, has a great impact on exhaust gas emissions. When the diesel SOI was set to 0° CAD TDC and the ammonia start of injection SOI to 2° CAD TDC, NOx emissions decreased by 33% compared to when the diesel SOI was set to −8° CAD TDC and the ammonia SOI to −6° CAD TDC. However, under the same conditions, unburned NH3 increased from 0.01 mg/kWh to 0.30 mg/kWh, and GHG emissions increased by 2%. Regarding thermal efficiency, the optimization of injection phases had a negligible effect, with the alteration being under 1 percent for the tested engine. Despite the importance of injection phases in combustion cycle optimization when using the HPDF strategy, the sequence of diesel and ammonia injection together with the distance between diesel and ammonia injection phases is equally important. Depending on which fuel is injected first and if the distance is too long, combustion does not occur. Numerical studies of a diesel engine (B/S = 137/165 mm, 910 rpm) by Jisoo Shin and Sungwook Park et al. [25] showed that at 97% ammonia in the dual-fuel balance, at an earlier ammonia injection at −20° CAD TDC and later diesel at −15° CAD TDC combustion did not occur properly due to the slow flame propagation speed of ammonia and the decrease in cylinder temperature due to the effect of liquid ammonia evaporation. According to the authors of [25], the lowered in-cylinder temperature hindered the ignition of subsequently injected diesel. The same results were obtained with a distance between ammonia and diesel injection phases greater than that for 5° CAD. Therefore, earlier injection of ammonia than diesel with more than 5° CAD was not suitable using the HPDF strategy for the engine tested by the authors [25]. Nevertheless, if the distance between the diesel and ammonia injection phases is close enough for the two fuel sprays to interact, combustion will occur. Depending on the distance, variations in combustion efficiency will occur. Valentin Scharl et al. [24], using a rapid compression expansion machine at 800 rpm with a diesel injection pressure of 2000 bar and ammonia at 500 bar in a dual-fuel ratio D5/A95, determined that complete combustion occurs at specific injection phases. This happens when ammonia and diesel are injected simultaneously, or when diesel is injected first followed by ammonia injection up to a distance of 13° CAD. On the contrary, if ammonia is injected first up to a distance of 13° CAD, combustion efficiency deteriorates by up to 30%.
In summary, direct diesel engine transition to ammonia is limited due to ammonia’s unfavorable physical characteristics, specifically, high exhaust gas emissions. Therefore, direct retrofitting of diesel engines is not rational, and in many cases, combustion cycle parameters and exhaust gas emissions do not reach their potential—optimization of the combustion cycle is required. The optimization of the combustion cycle primarily involves adjusting fuel injection pressure, injection phase, and duration. For example, this approach was successfully implemented in MTU 396 series engines and later became widely used among the so-called “fourth generation” diesel engine models. Increased injection pressure was matched by adjusting the start of fuel injection to 4° CAD before TDC, and an increase in the compression ratio (CR) from 15 to 17.8. Consequently, a 20% reduction in heat release duration was achieved, which resulted in improved fuel efficiency and NOx reduction by 35% [28]. Furthermore, industry-leading companies such as Wärtsilä, MAN B&W, and Caterpillar have achieved LNG engines thermal efficiency comparable to diesel engines and reduced PM and NOx emissions by up to 90% compared to conventional diesel engines through combustion cycle optimization [29,30,31].
Considering the wide variety of diesel engines and models of ship power plants in operation, it is rational to base marine transport sector decarbonization with engine retrofitting based on numerical studies to reduce time and financial costs. When applying ammonia utilization in diesel engines, numerical studies based on multi-zone mathematical models demonstrate high accuracy [32,33,34]. In the context of engine retrofitting, the use of numerical multi-zone MM methods such as employing simulation software like AVL FIRE M R2022.2 to analyze optimal dual-fuel solutions for ammonia combustion cycles is justified. This is due to insufficient information regarding the formalization of combustion characteristics in single-zone methods like AVL BOOST, IMPULS, etc. [35]. The use of multi-zone MM allows the study of combustion cycle physical processes with sufficient accuracy for solving practical problems such as finding optimal combustion cycle parameters and exhaust gas emissions. For example, by employing multi-zone MM as described by Tie Li et al. [27], the authors achieved a 3% increase in thermal efficiency for a two-stroke marine diesel engine (B/S = 340/1600 mm, 157 rpm) running on dual diesel ammonia fuel. Additionally, they managed to reduce NOx by 24% and GHG emissions by 40% compared to the direct retrofitting case.
The majority of research in the scientific community has been conducted on engines with small cylinder bores while large-cylinder-bore marine engines operate under different conditions. Significant differences are determined by the technological principles of the mixture composition in the engine cylinder. Unlike automotive engines, where the relatively small cylinder diameter leads to fuel film formation along the cylinder walls, marine engines are designed to prevent direct contact between the fuel jet and the cylinder walls [36,37]. This difference in design and operation significantly alters the combustion characteristics of marine engines. Consequently, the novelty of this article lies in the organization of the combustion process. Retrofitting the existing fleet of marine diesel engines to utilize ammonia requires complex solutions aimed at increasing thermal efficiency and reducing exhaust gas emissions, given ammonia’s unfavorable combustion characteristics. Therefore, the presented research is a continuation of the authors’ previous research [38]. In the initial phase of the research, the objective was to assess the impact of intensified ammonia injection on combustion cycle parameters and exhaust gas emissions. This was achieved by employing multi-zone MM (AVL FIRE M) to increase the injection pressure of the Wartsila 6L46 diesel engine transferred to operate on dual ammonia–diesel fuel. The high-pressure dual-fuel (HPDF) injection strategy for the D5/A95 dual-fuel ratio (5% diesel and 95% ammonia by energy value) was investigated within the liquid ammonia injection pressure range of 500 to 2000 bar at the identified optimal injection phases (A −10° CAD and D −3° CAD TDC). Increasing the ammonia injection pressure from 500 bar (corresponding to diesel injection pressure) in the range of 800–2000 bar determined the single-phase heat release characteristic (HRC). Combustion duration decreased from 90° crank angle degrees (CAD) at D100 to 20–30° CAD, while indicative thermal efficiency (ITE) increased by ~4.6%. The optimal ammonia injection pressure was found to be 1000 bar, based on combustion cycle parameters (ITE, Pmax, and Tmax) and exhaust gas emissions (NOx, NH3, and GHG). GHG emissions in a CO2 equivalent were reduced by 24% when ammonia injection pressure was increased from 500 bar to 1000 bar. However, in previous research, injection phases were not investigated, which is another important parameter for combustion cycle optimization, aligning with the trends in diesel engine development and supported by research findings in the literature. With reference to the analysis of scientific research, the implemented strategy involves optimizing injection phases, which consists of two interrelated steps: adjusting the timing between the ammonia and diesel injection phases and their distance to TDC. According to the literature, both aspects significantly influence combustion cycle parameters and exhaust gas emissions.
The main objective of this article is to determine the limits of combustion cycle regulation parameters (NH3 and pilot fuel injection phases) to achieve an increase in thermal efficiency and a reduction in exhaust gas emissions for marine engines operating on dual ammonia–diesel fuel. The scientific novelty of this article is associated with the optimization of the combustion cycle of a marine diesel engine operating with diesel–ammonia fuel, aiming to comprehensively meet IMO requirements through the assessment of GHG components (CO2, CH4, N2O) as well as the most harmful NOx component. The hypothesis of this article is that optimizing fuel injection phases at high-pressure injection significantly reduces NOx emissions compared to the combustion cycle where ammonia gas is supplied together with air through the intake manifold, during which NOx emissions increase several times compared to diesel engines.

2. Materials and Methods

2.1. Research Object and Strategy

A marine medium-speed four-stroke Wartsila 6L46 (B/S = 460/580 mm, 500 rpm, 6 cylinders, 6300 kW) diesel engine was selected as the research object. Medium-speed (300–1000 rpm) four-stroke diesel engines are widespread in ship propulsion systems, especially in smaller cargo ships, as well as in larger specialized ships, such as cruise ships, ferries, and ro-ro cargo ships [39]. Detailed engine data are presented in the authors’ previous article [38].
Guidelines for the Wartsila 6L46 engine model creation to run on ammonia for numerical studies using AVL FIRE M simulation software are based on findings of conducted research in the literature. Due to lower concentrations of NOx and NH3 emissions during the combustion cycle, ammonia fuel injection is organized in the liquid phase. Due to the greater CO2 emission reduction effect, the selected dual-fuel ratio of diesel and ammonia is D5/A95 (5% diesel and 95% ammonia according to energy value). To ensure the shortest induction period (the time from injection start to the first noticeable increase in heat release rate, expressed in CAD) and the most effective combustion, the diesel and ammonia injectors’ nozzle holes are overlapped (0° angle). Simulations were performed with the same amount of heat input for D100 and D5/A95 cases. Inlet air pressure and temperature were unchanged for D100 and D5/A95. Initial simulation data are presented in Table 1.
In the studies, the optimization of the combustion cycle was based on trends in diesel engine development, specifically focusing on intensifying combustion to shorten the duration of combustion. For dual diesel ammonia fuel cases, regulation of ammonia and diesel injection phases was conducted. Variational calculations were conducted with NH3 injection starting from −25° to −5° CAD while maintaining a fixed start of injection for pilot fuel at −3° (717°) CAD before TDC. Additionally, the pilot fuel injection start angle was varied while keeping a constant 7° CAD distance between ammonia and pilot injections. Refer to Figure 1 and Table 1 for more details.

2.2. Mathematical Model and Verification

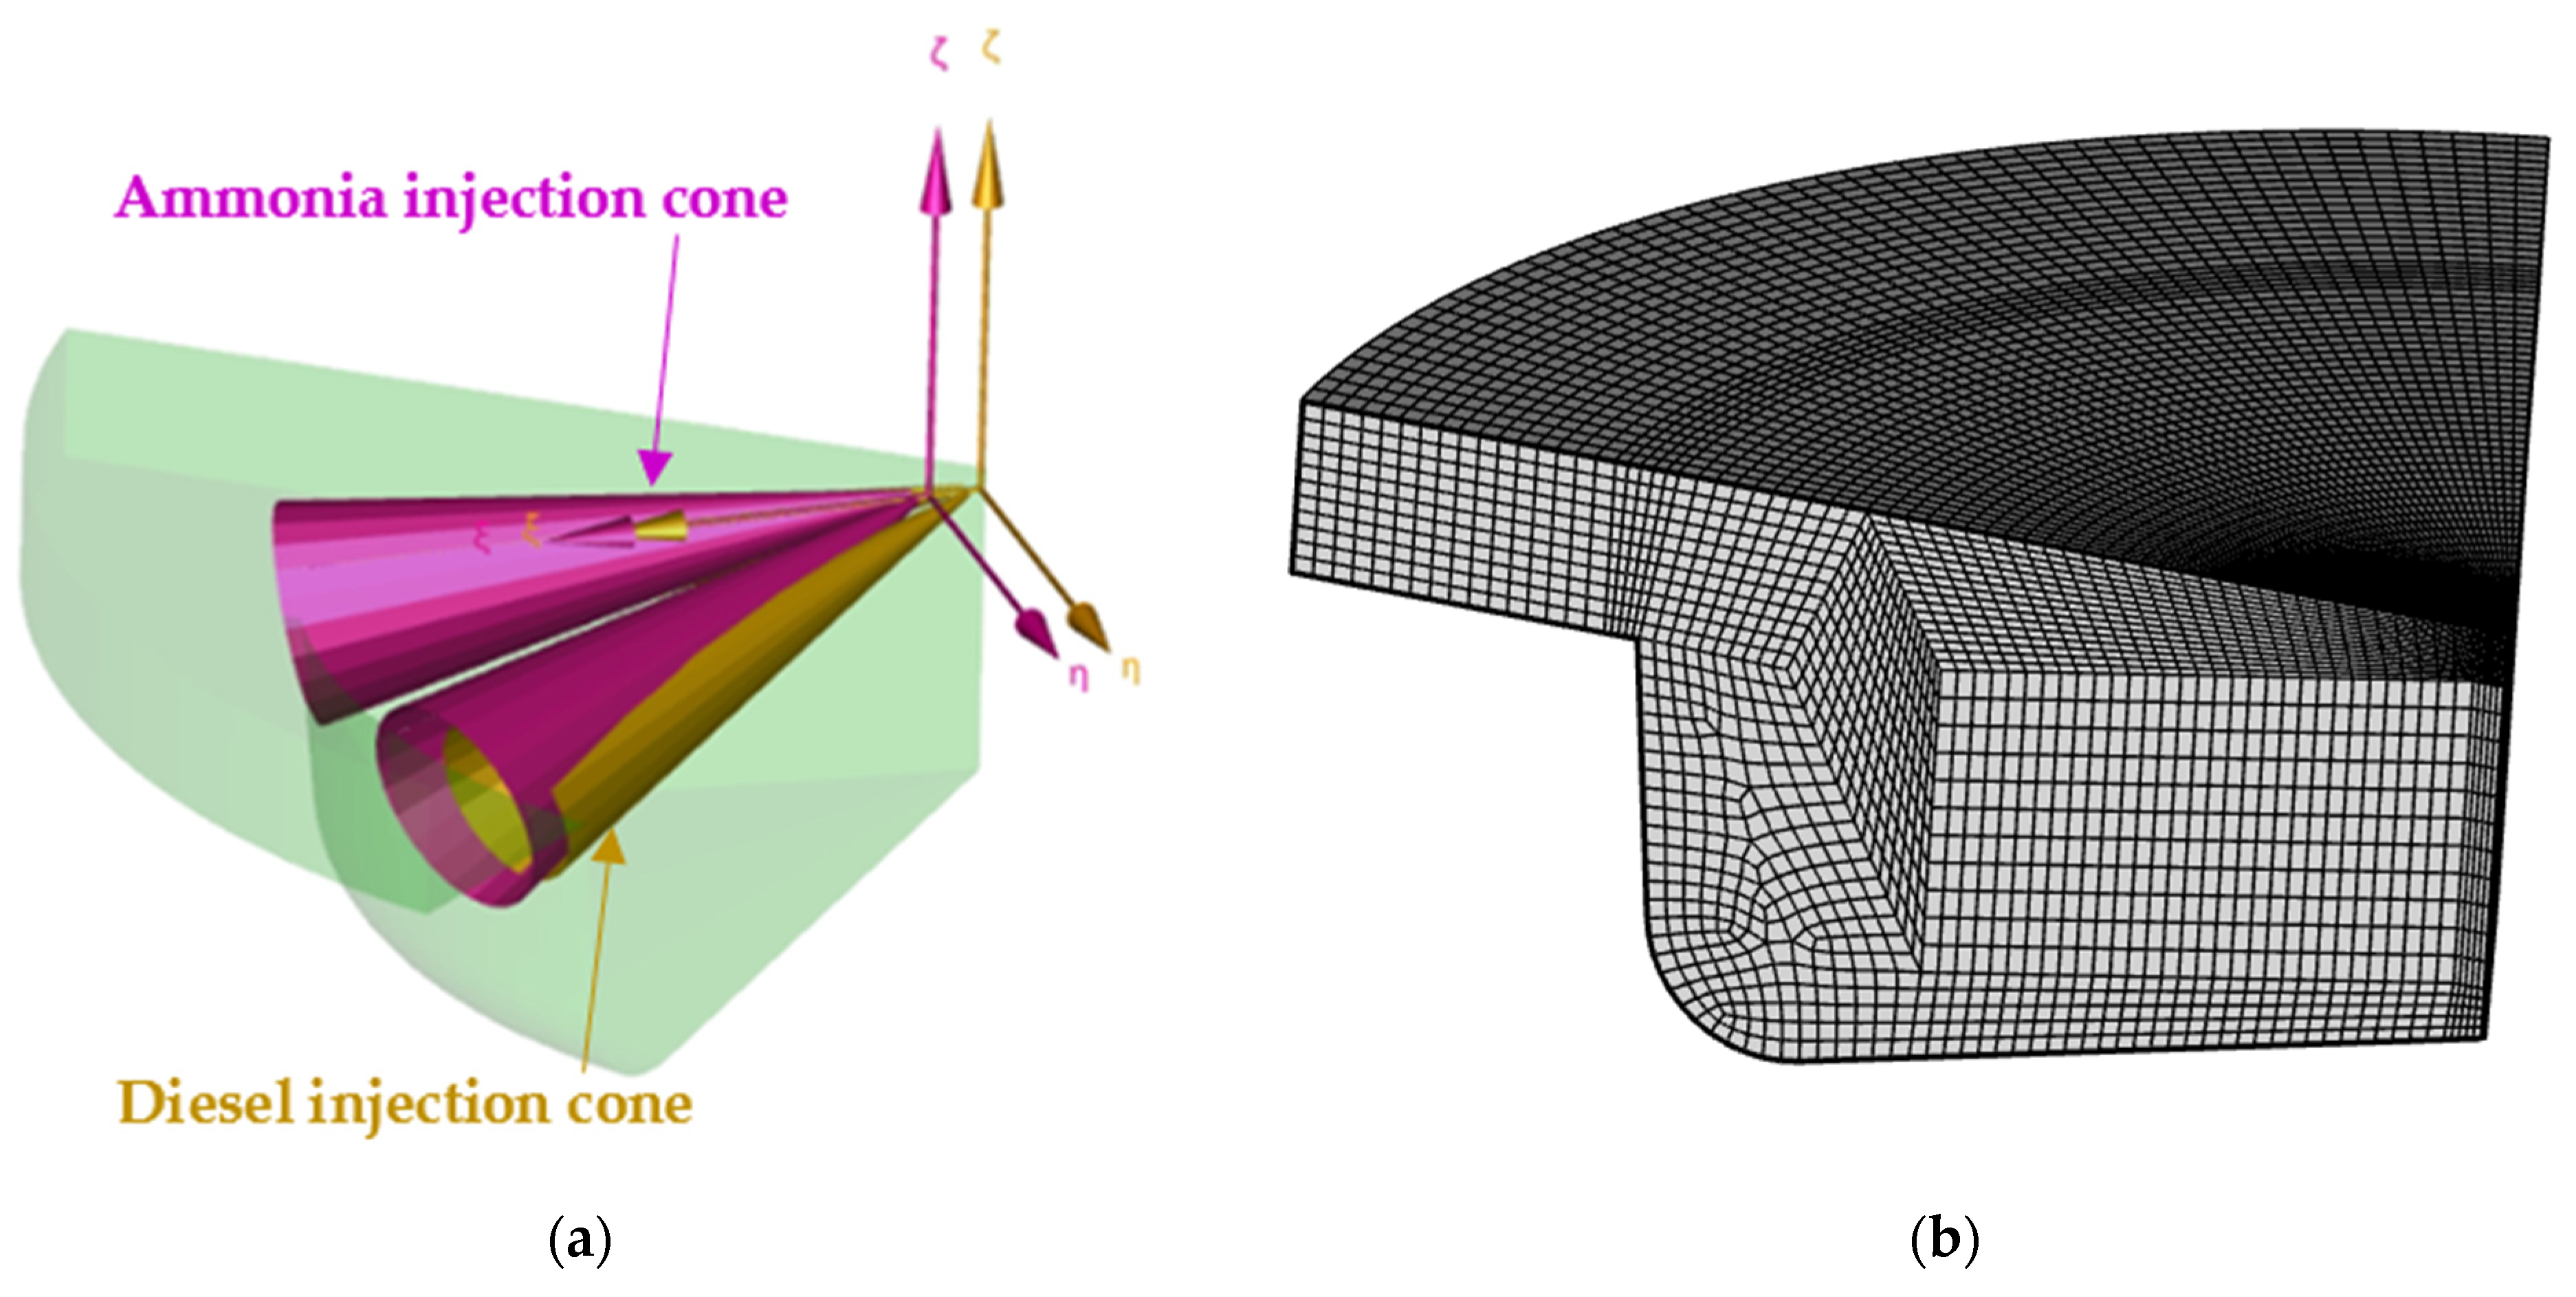
Numerical mathematical studies of combustion cycle characteristics were performed by transferring a ship’s propulsion main diesel engine Wartsila 6L46 to ammonia operation. The simulation was performed for 1/5 of the total combustion chamber (360°/5 = 72). The total fuel injection nozzle quantity for the full chamber is 10; therefore, for 1/5, the injection nozzle quantity was set to 2. An example of nozzle distribution is presented in Figure 2a. The simulation mesh is presented in Figure 2b. Detailed simulation mesh data are presented in the authors’ previous article [38].
Numerical studies were conducted using the multi-zone mathematical model developed by AVL company specifically designed to investigate the physical processes involved in the ammonia combustion cycle. The gas phase reaction model, combining combustion and emission models, is capable of solving diesel and ammonia combustion reactions. The general gas phase reaction model includes H, O, C, N, HE, and AR chemical elements and 54 numbers of species. The model is based on P. Glarborg’s methodology for modeling nitrogen chemistry in combustion [40]. The experimental verification of the model was conducted by AVL company. Since the combustion model is not yet commercially publicly available by AVL decision, the description of the general gas phase reaction model is not provided.
The spray module for calculating droplets in the simulation region uses the Lagrangian approach [41]. The droplets are tracked in a Lagrangian way through the computational grid used for solving the gas phase partial differential equations. Additional spray sub-models, such as the Schiller–Naumann injection drag model [42] and Abramzon–Sirignano evaporation model [43], were selected for this simulation.
AVL FIRE M simulation software focuses on detailed analysis of physicochemical processes taking place in the cylinder. However, it does not provide the combustion cycle (IMEP, BSFC, Pi, ITE) parameters. Therefore, these parameters are calculated from the array of AVL FIRE M simulation results according to formulas presented in the authors’ previous article [38].
All simulations were performed under an engine load of 75%, as statistically, within the designated time frame, the engine load mode operates for the longest duration, accounting for up to 50% of the time according to ISO 8178 [44]. A simulation indicator diagram when the engine was running on D100 was matched with the real operating engine indicator diagram for the combustion cycle from −120° (intake valve closing, corresponding to 600° in the software) to +128° (exhaust valve opening, corresponding to 848° in the software) crankshaft rotation angles when TDC was at 720°. The error of simulation indicated mean effective pressure compared to the real engine value reached 2.4%. Detailed simulation model verification is presented in the authors’ previous article [38]. A verified diesel engine combustion cycle simulation model was considered as the base engine operating mode for this research and was used for further comparison.
Ammonia combustion and emission model validation through an experiment was not feasible for the operation of the marine diesel engine. Therefore, the model validation relies on similar simulation results found in the literature [23,27]. A direct comparison of the combustion cycle parameters and exhaust gas emissions of this research to the literature would provide inaccurate results due to differences in engine types and combustion cycle organization. Thus, a comparison in the relative change in parameters compared to the diesel combustion cycle was selected. The model was validated according to previous authors’ simulation results (case Pinj 500 bar) [23]. In conclusion, the ammonia combustion and emission model provides similar relative changes in combustion cycle parameters and exhaust gas emissions compared to the literature. A detailed comparison of ammonia combustion and emission model validation parameters is provided in Table 2.

3. Results

3.1. The Influence of the Distance between Injection Phases on Combustion Cycle Characteristics

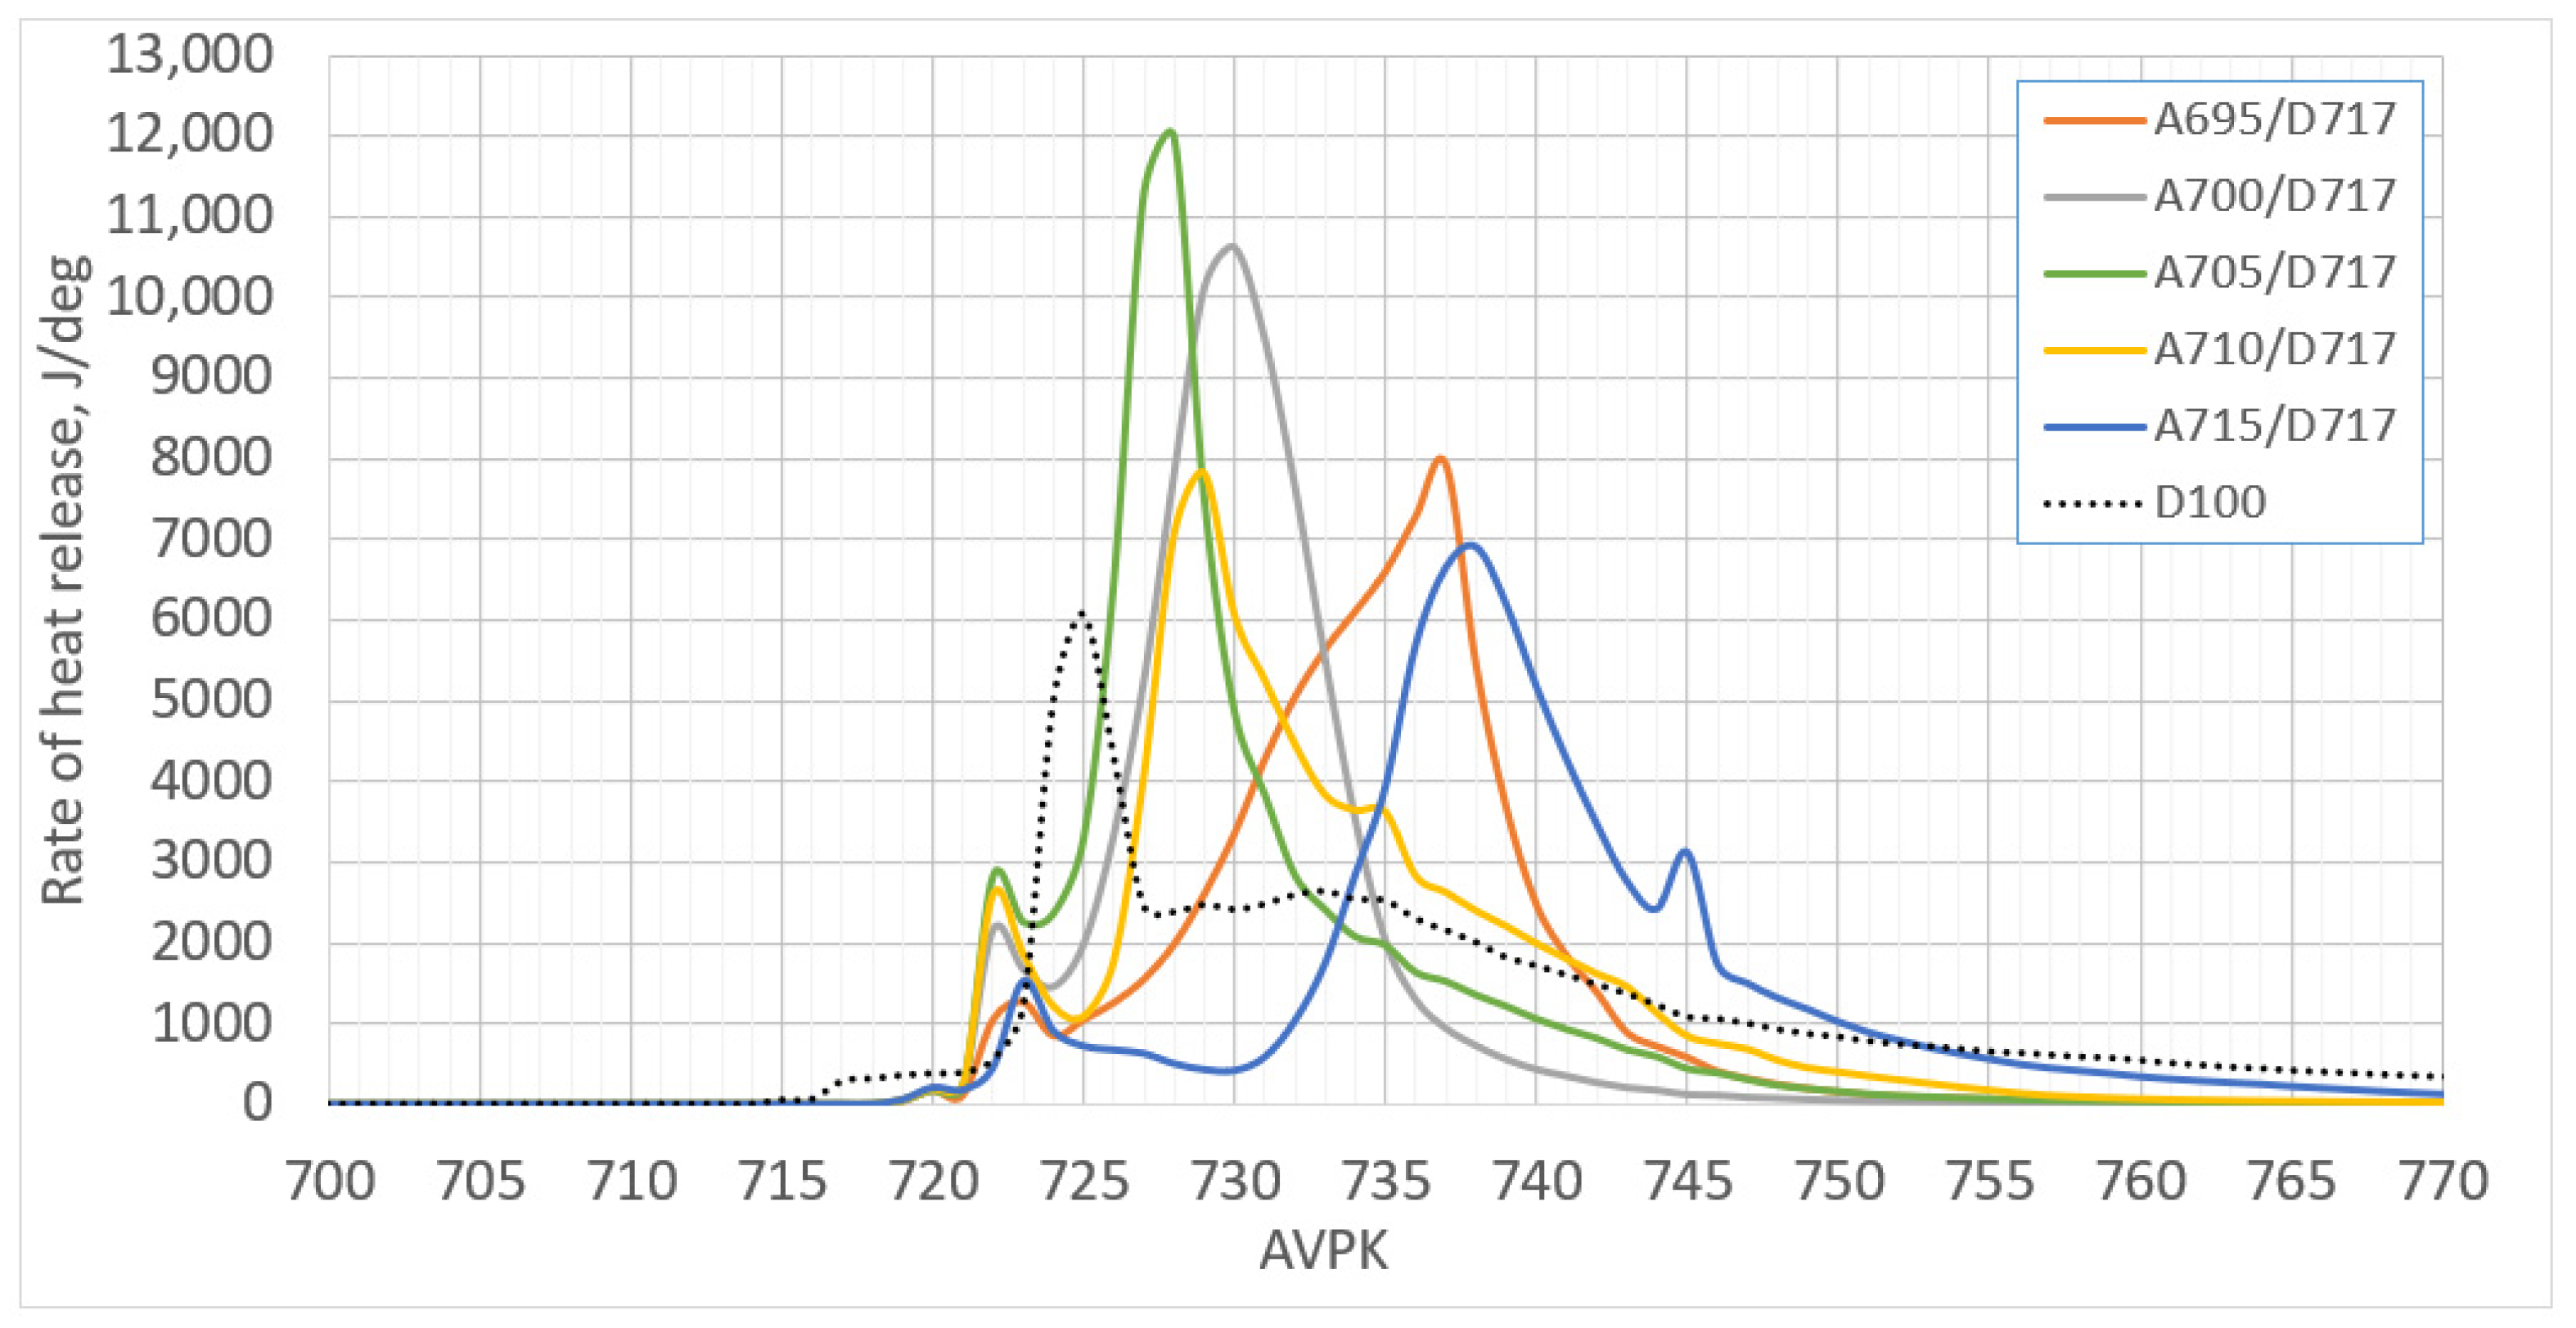
Ammonia combustion cycle optimization studies evaluate the influence of dual-fuel injection phases on combustion cycle parameters and exhaust gas emissions. According to literature analysis, changing the start angles of ammonia and diesel fuel injection significantly affects the engine’s combustion cycle parameters, as well as greenhouse gas (GHG) and harmful substance emissions [25,26,27]. Therefore, one method for optimizing the ammonia combustion cycle, which requires minimal engine modifications when retrofitting the diesel engine for ammonia operation, is the rational determination of the fuel injection phases. In this phase of research, the aim is to determine the optimal distance between the ammonia and diesel injection phases without exceeding the Pmax and Tmax parameters, which affect the reliability of engine components. The start of ammonia injection was varied from 695° to 715° CAD, while the start of diesel injection remained constant at 717° CAD. The distance between the pilot diesel injection, which initiates ammonia combustion, and the start of ammonia injection results in significant changes in the shape and duration of the heat release characteristic (see Figure 3). Injecting ammonia early in Case A695/D717 results in a comparatively slower heat release. The results show that the maximum heat release rate from the start of ammonia combustion is typically reached within 4–7° CAD, but in the A695/D717 case, it occurs at 13° CAD. This can be linked to stoichiometric conditions and the relatively low flame propagation speed of ammonia. Increasing the distance between the ammonia and diesel injection phases transforms the combustion from heterogeneous to homogeneous (see Figure 3).
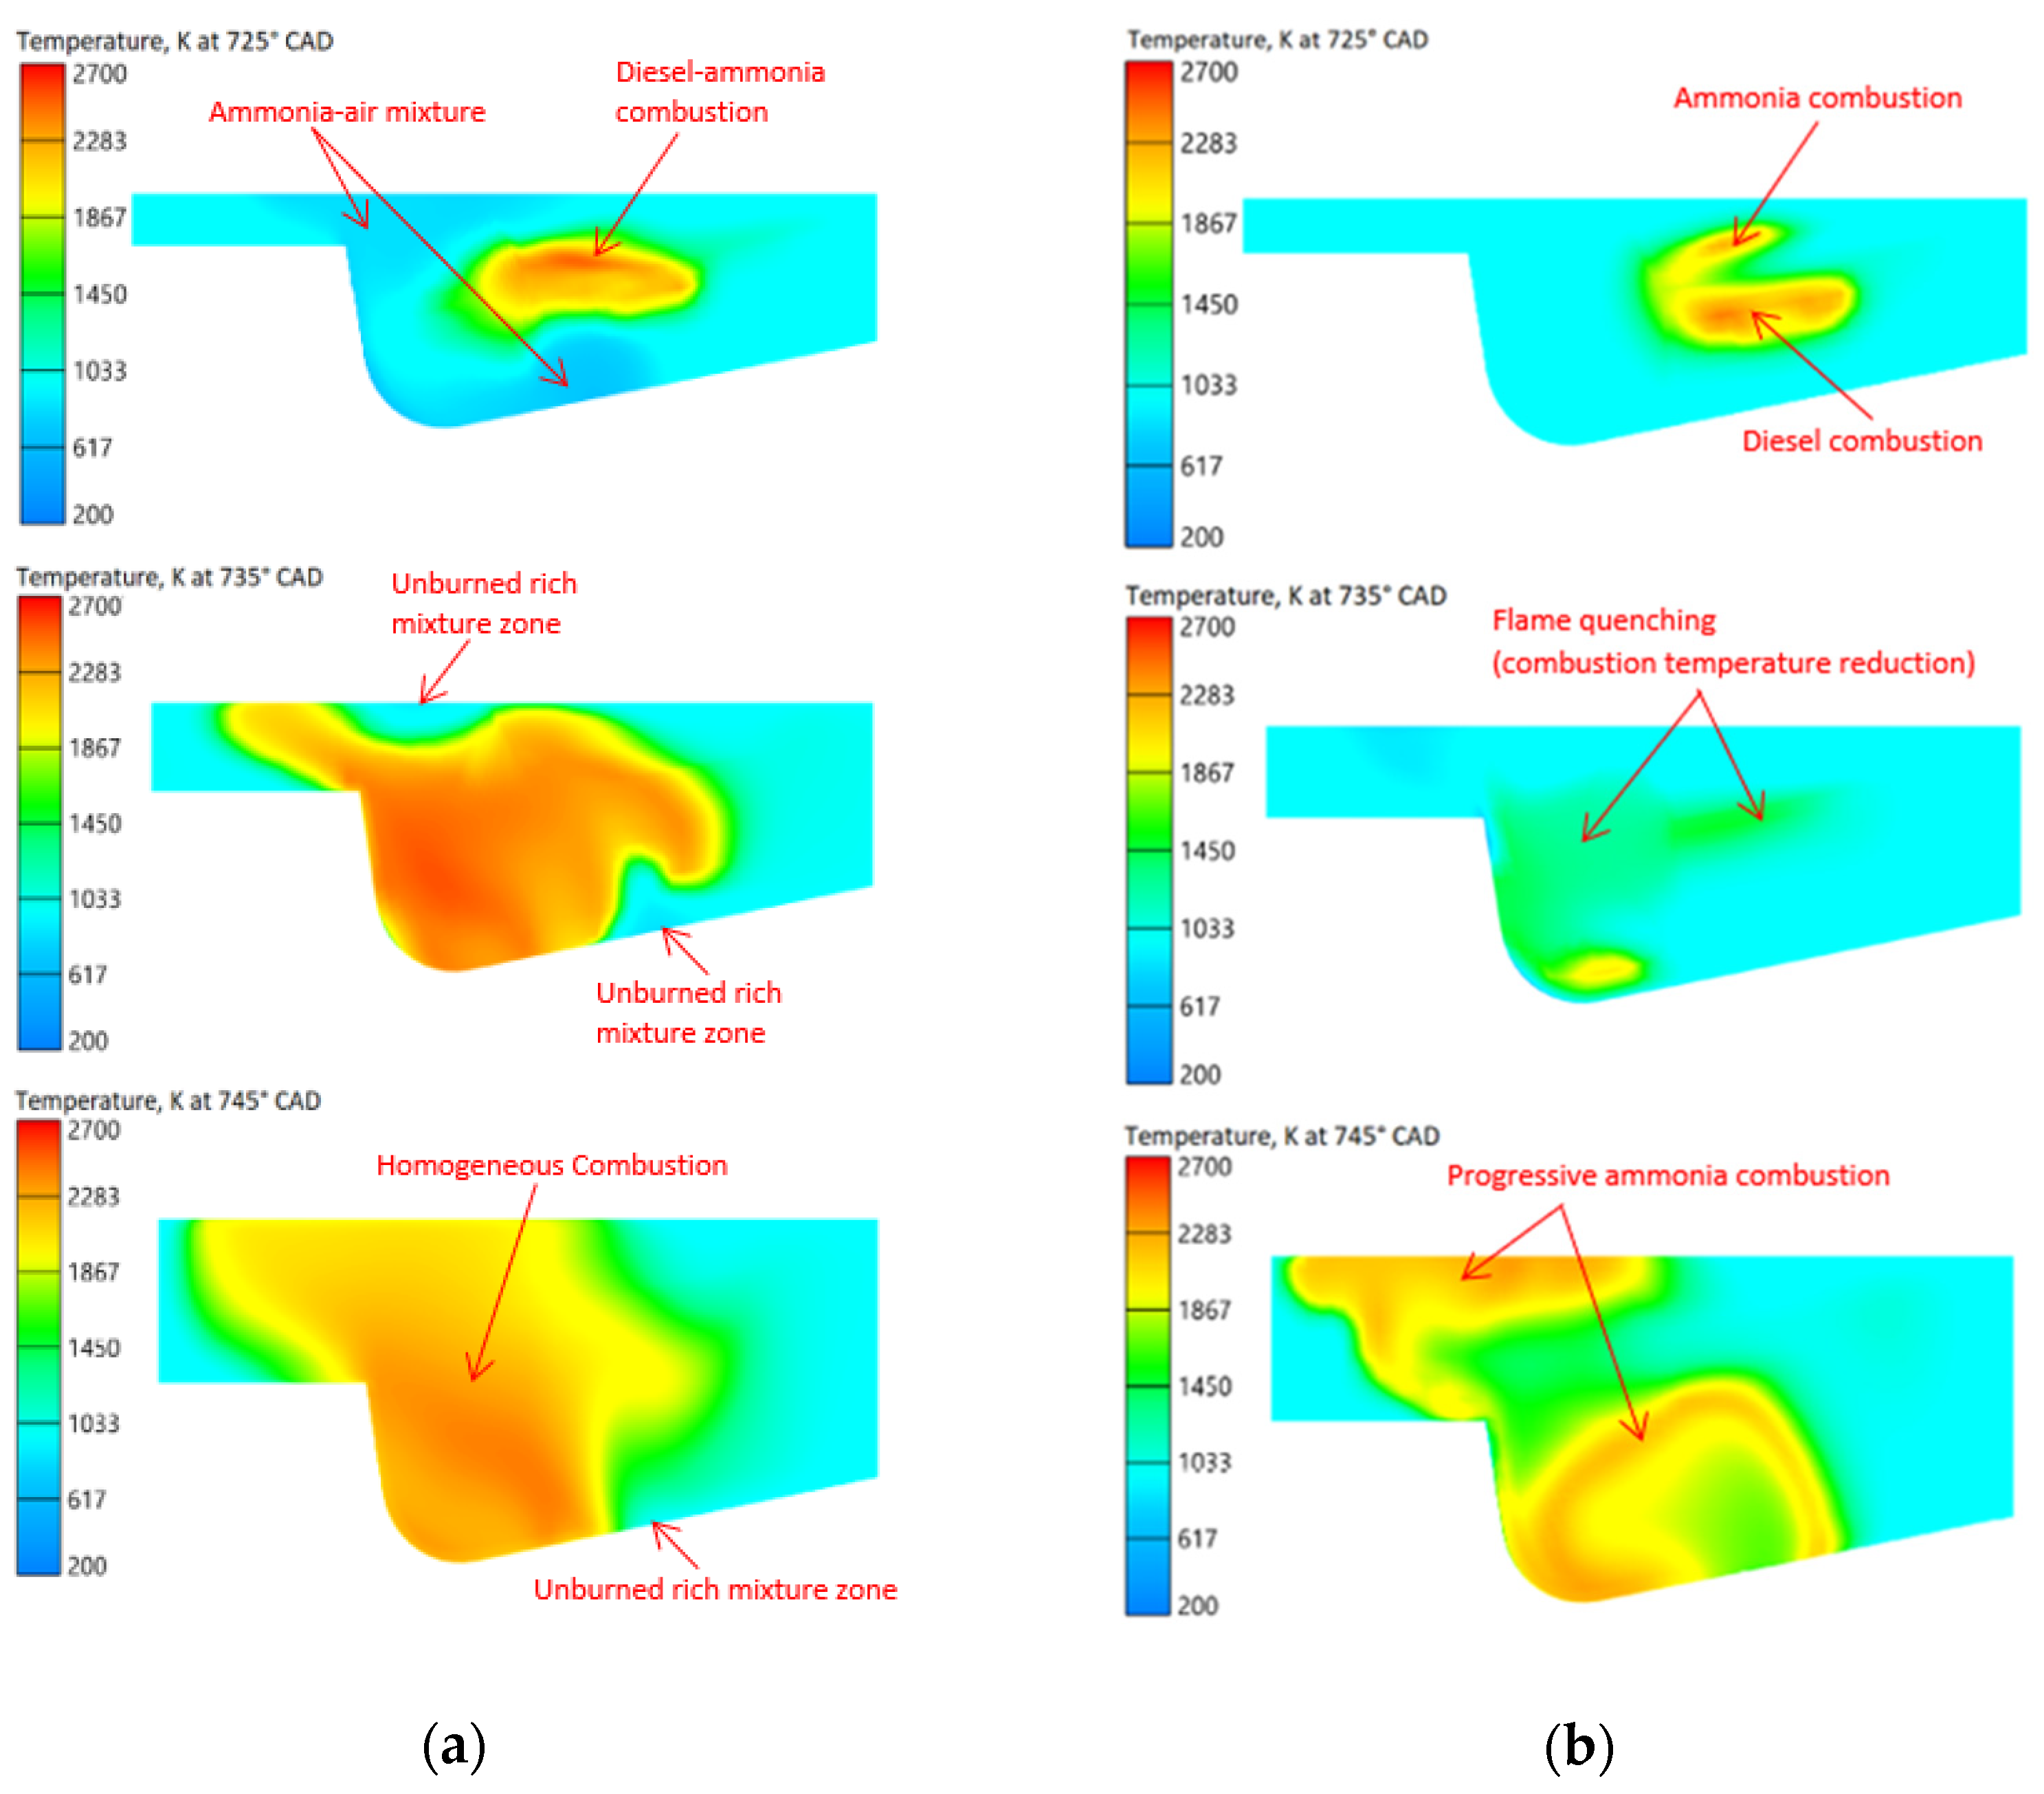
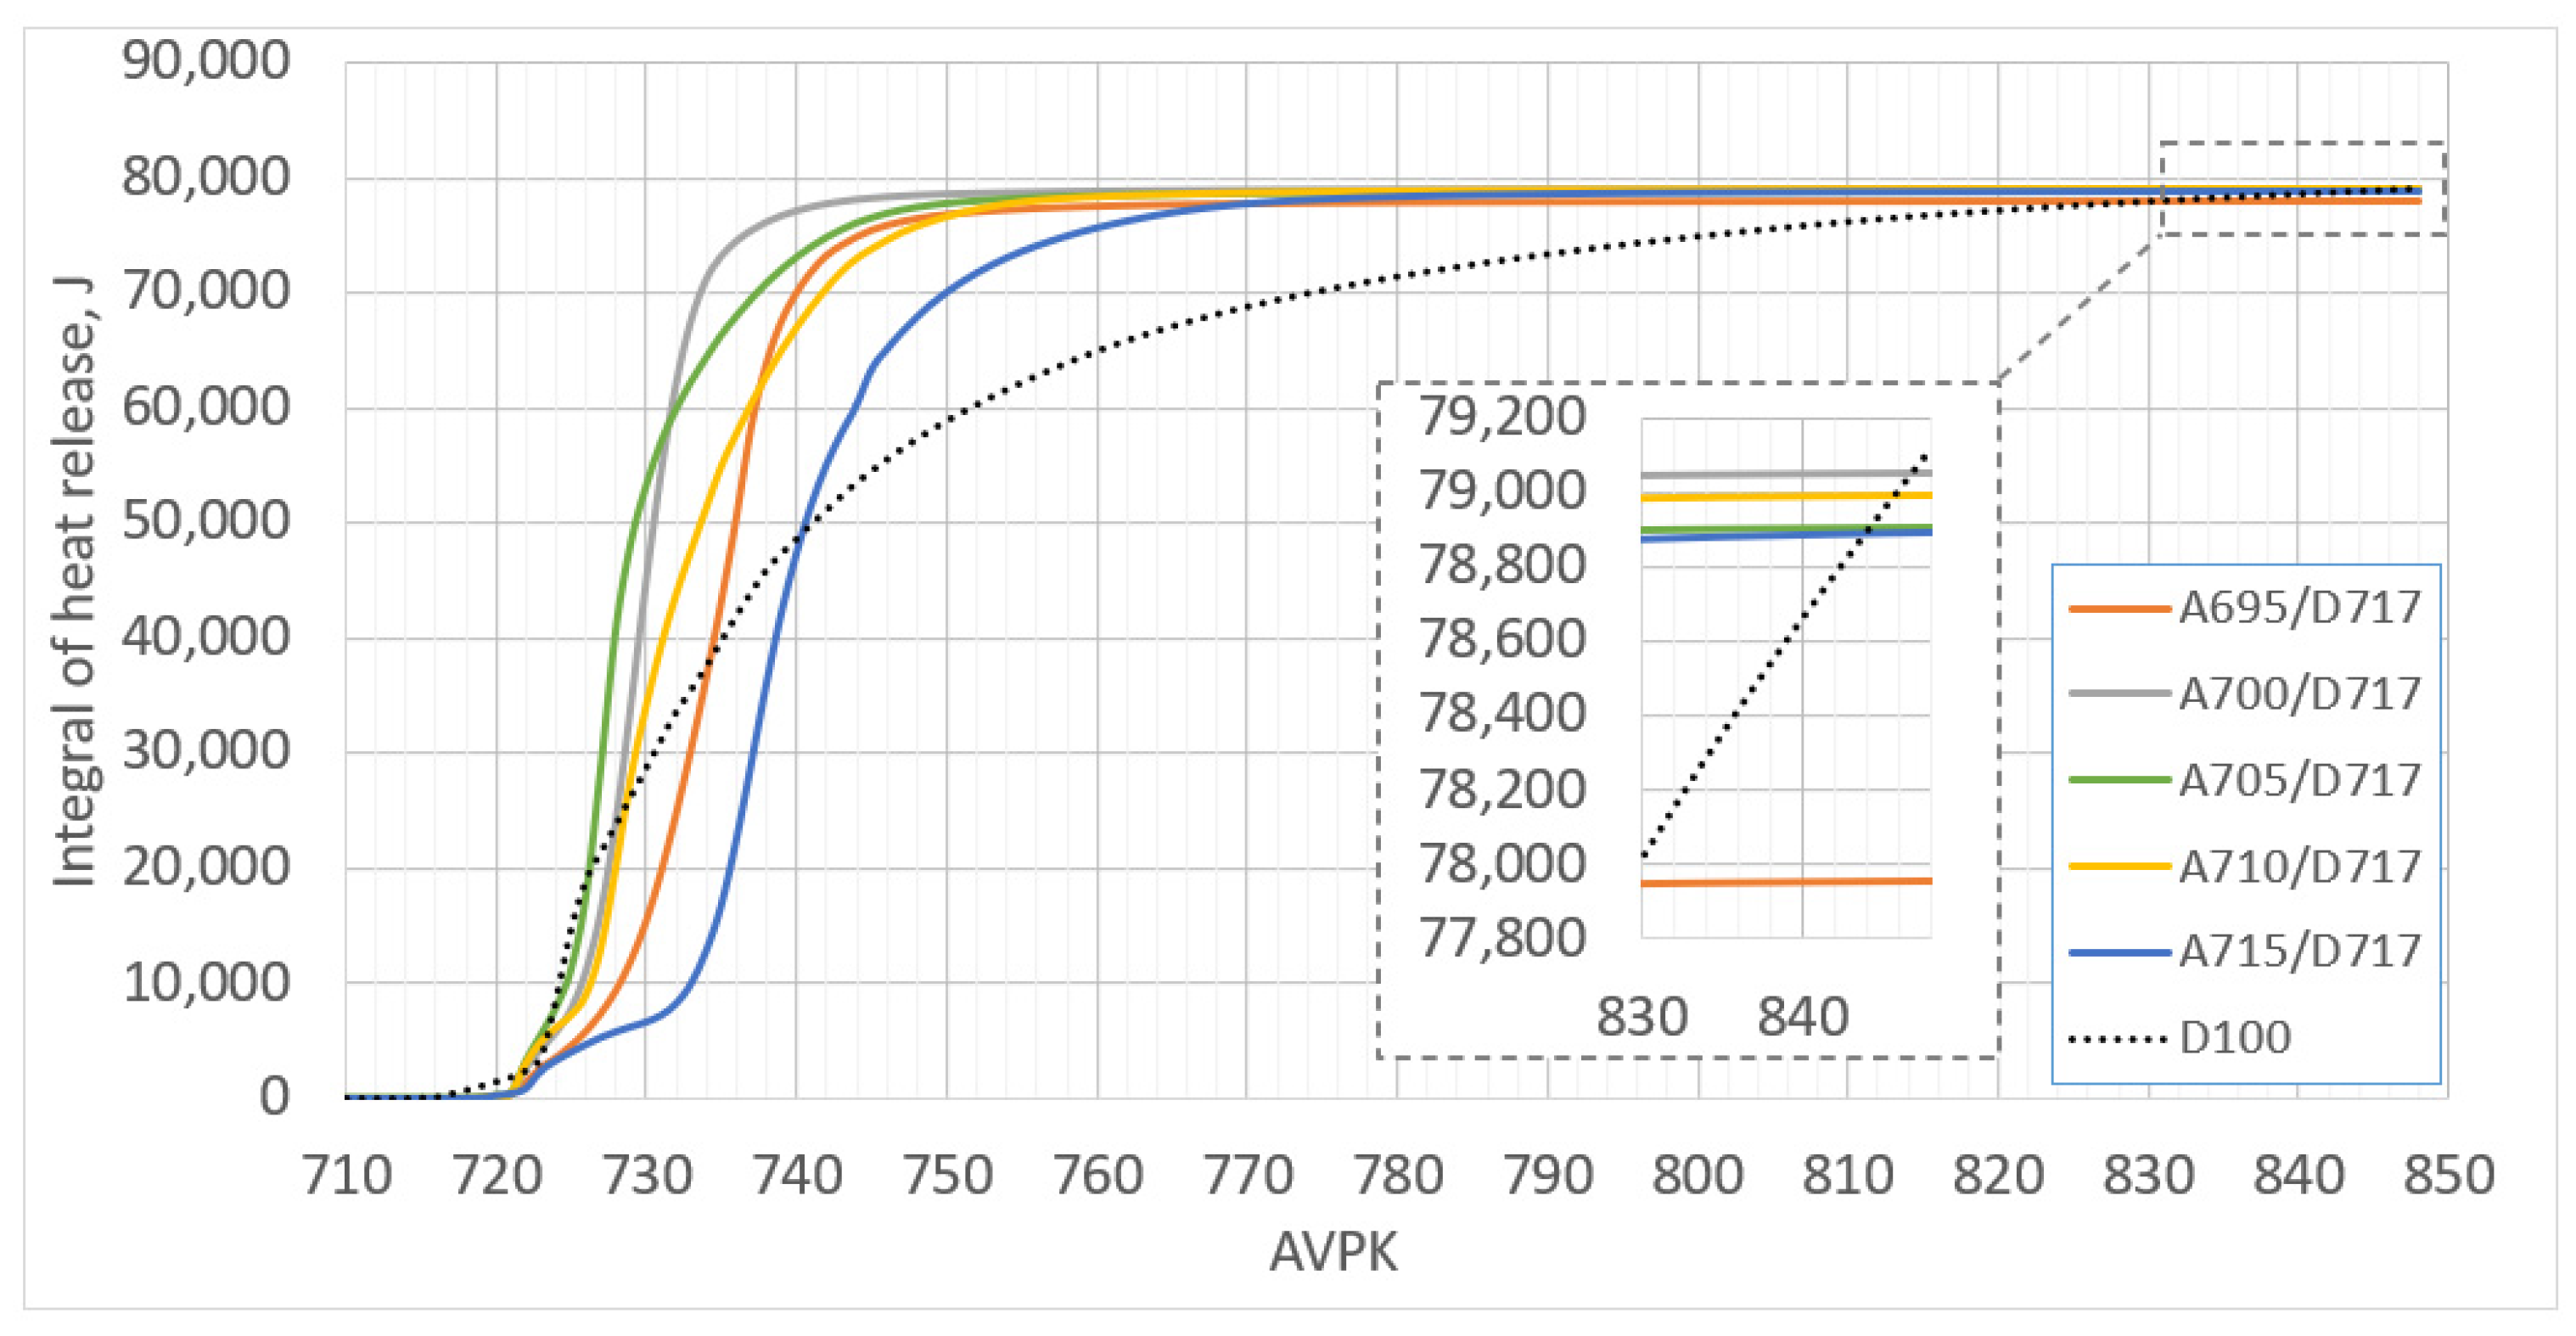
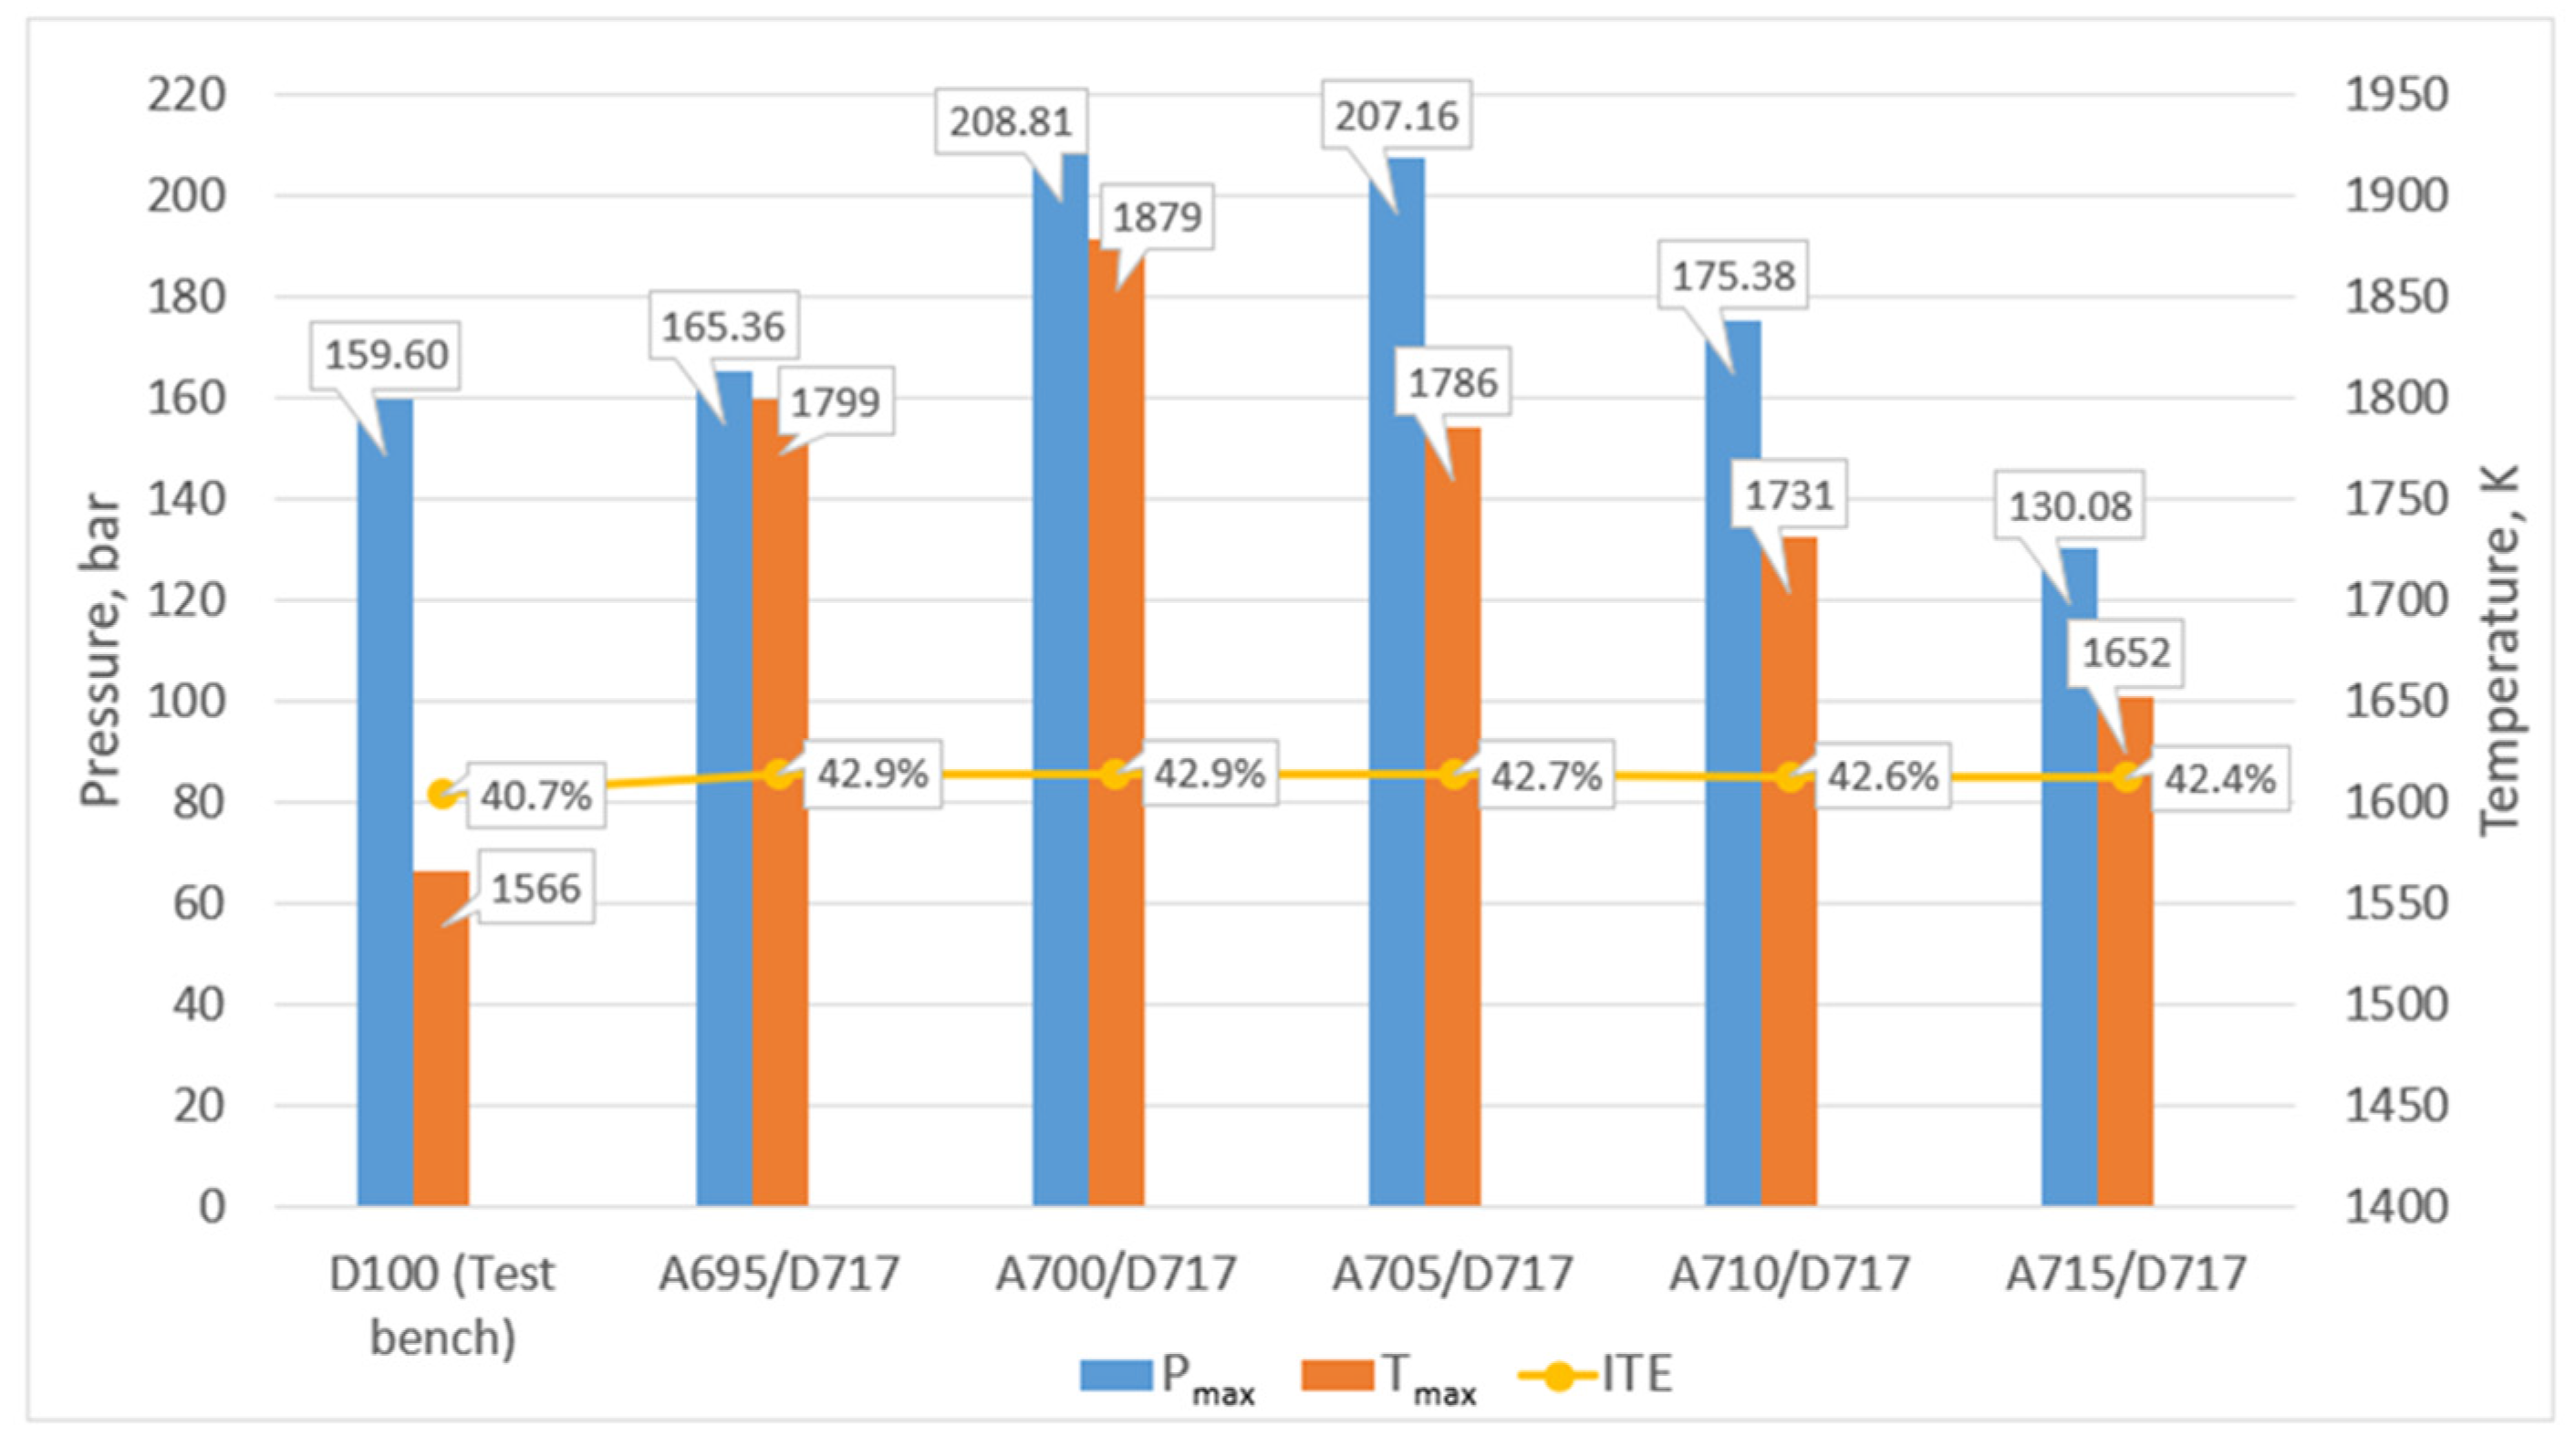
In an analysis of the results of the combustion chamber temperature field at early ammonia and late diesel injection phases A695/D717 (see Figure 4a), a decrease in temperature is observed within the combustion chamber volume, indicating the injection and distribution of ammonia. Subsequently, at around 725° CAD, combustion of the mixture initiated by ignition of the pilot fuel becomes evident. As the piston moves downward, the temperature field encompasses a large portion of the combustion chamber, indicating a relatively uniform temperature field and flame propagation within the combustion chamber. Consequently, early ammonia injection into the cylinder resulted in a relatively uniform distribution within the combustion chamber, similar to introducing ammonia in the gaseous phase through the intake manifold at low pressure. Thus, ammonia combustion became homogeneous. However, the integral heat release diagram revealed inefficient combustion (see Figure 5). At A695/D717, the lowest heat release was achieved compared to other injection phase combinations. Insufficient mixing of fuel and air before ignition due to direct injection leads to regions of rich and lean mixtures, potentially resulting in incomplete combustion zones within the combustion chamber. These characteristic zones are marked in the combustion chamber section at 735° CAD (see Figure 4a). Consequently, at angle A695/D717, Pmax increased by 3.6%, Tmax increased by 14.8% compared to the design limit of the studied engine, and the indicated thermal efficiency reached its peak value of 42.9% across the entire research range (see Figure 6).
On the other hand, when the start of ammonia injection is delayed and diesel is injected nearly simultaneously in Case A715/D717, heat release is delayed. According to the results (see Figure 3), ammonia combustion typically begins 3–4° CAD after the start of pilot diesel combustion. However, in this case, ammonia combustion started 10° CAD after the start of pilot fuel combustion. As a result, in Case A715/D717, the induction period of ammonia was extended by 7° CAD. The delay in heat release is influenced by flame quenching due to the high heat of ammonia vaporization (1370 kJ/kg), as revealed by temperature field analysis (see Figure 4b). At 725° CAD, the combustion zones of pilot and ammonia fuel are visible, but as the piston moves downward towards 735° CAD, the temperature in the direct ammonia injection zone significantly decreases, indicating flame quenching. Later, at 745° CAD, the temperature increases, and the temperature field intensively expands within the combustion chamber. Consequently, with the A715/D717 configuration, a sufficiently high ITE of 42.4% was achieved due to combustion organization after TDC, while Pmax and Tmax decreased by 19% and 5.5%, respectively, compared to D100 (see Figure 6).
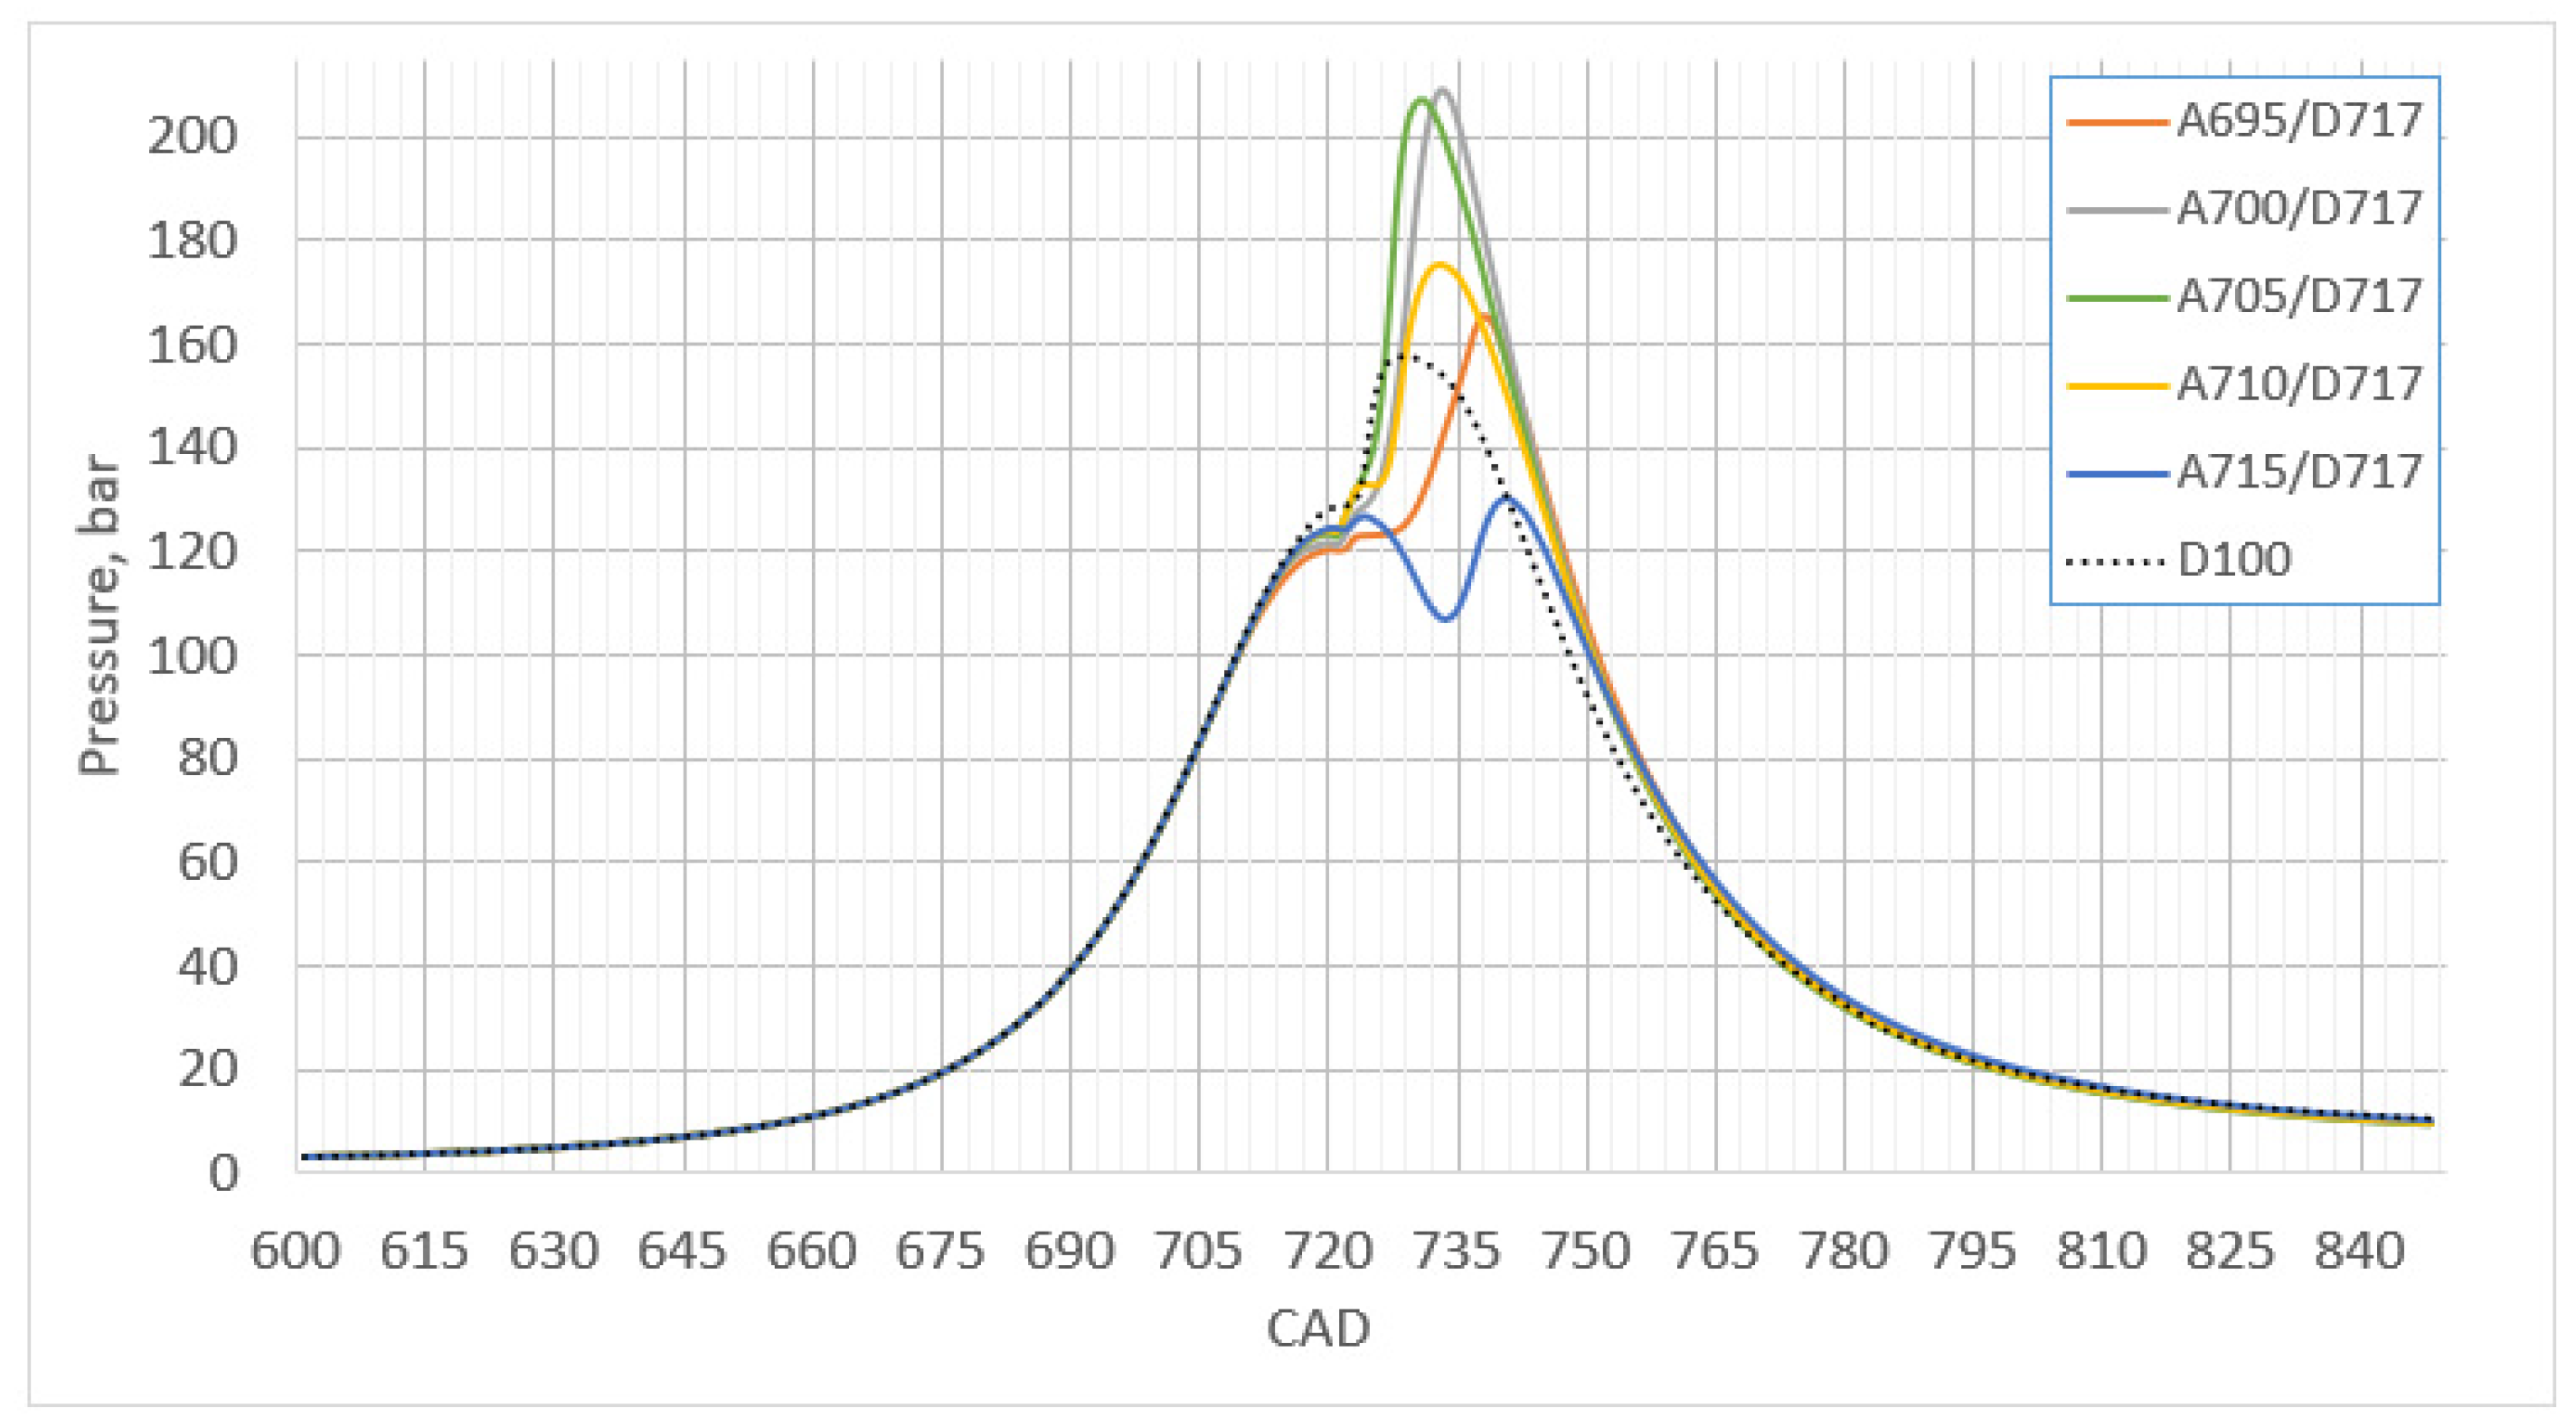
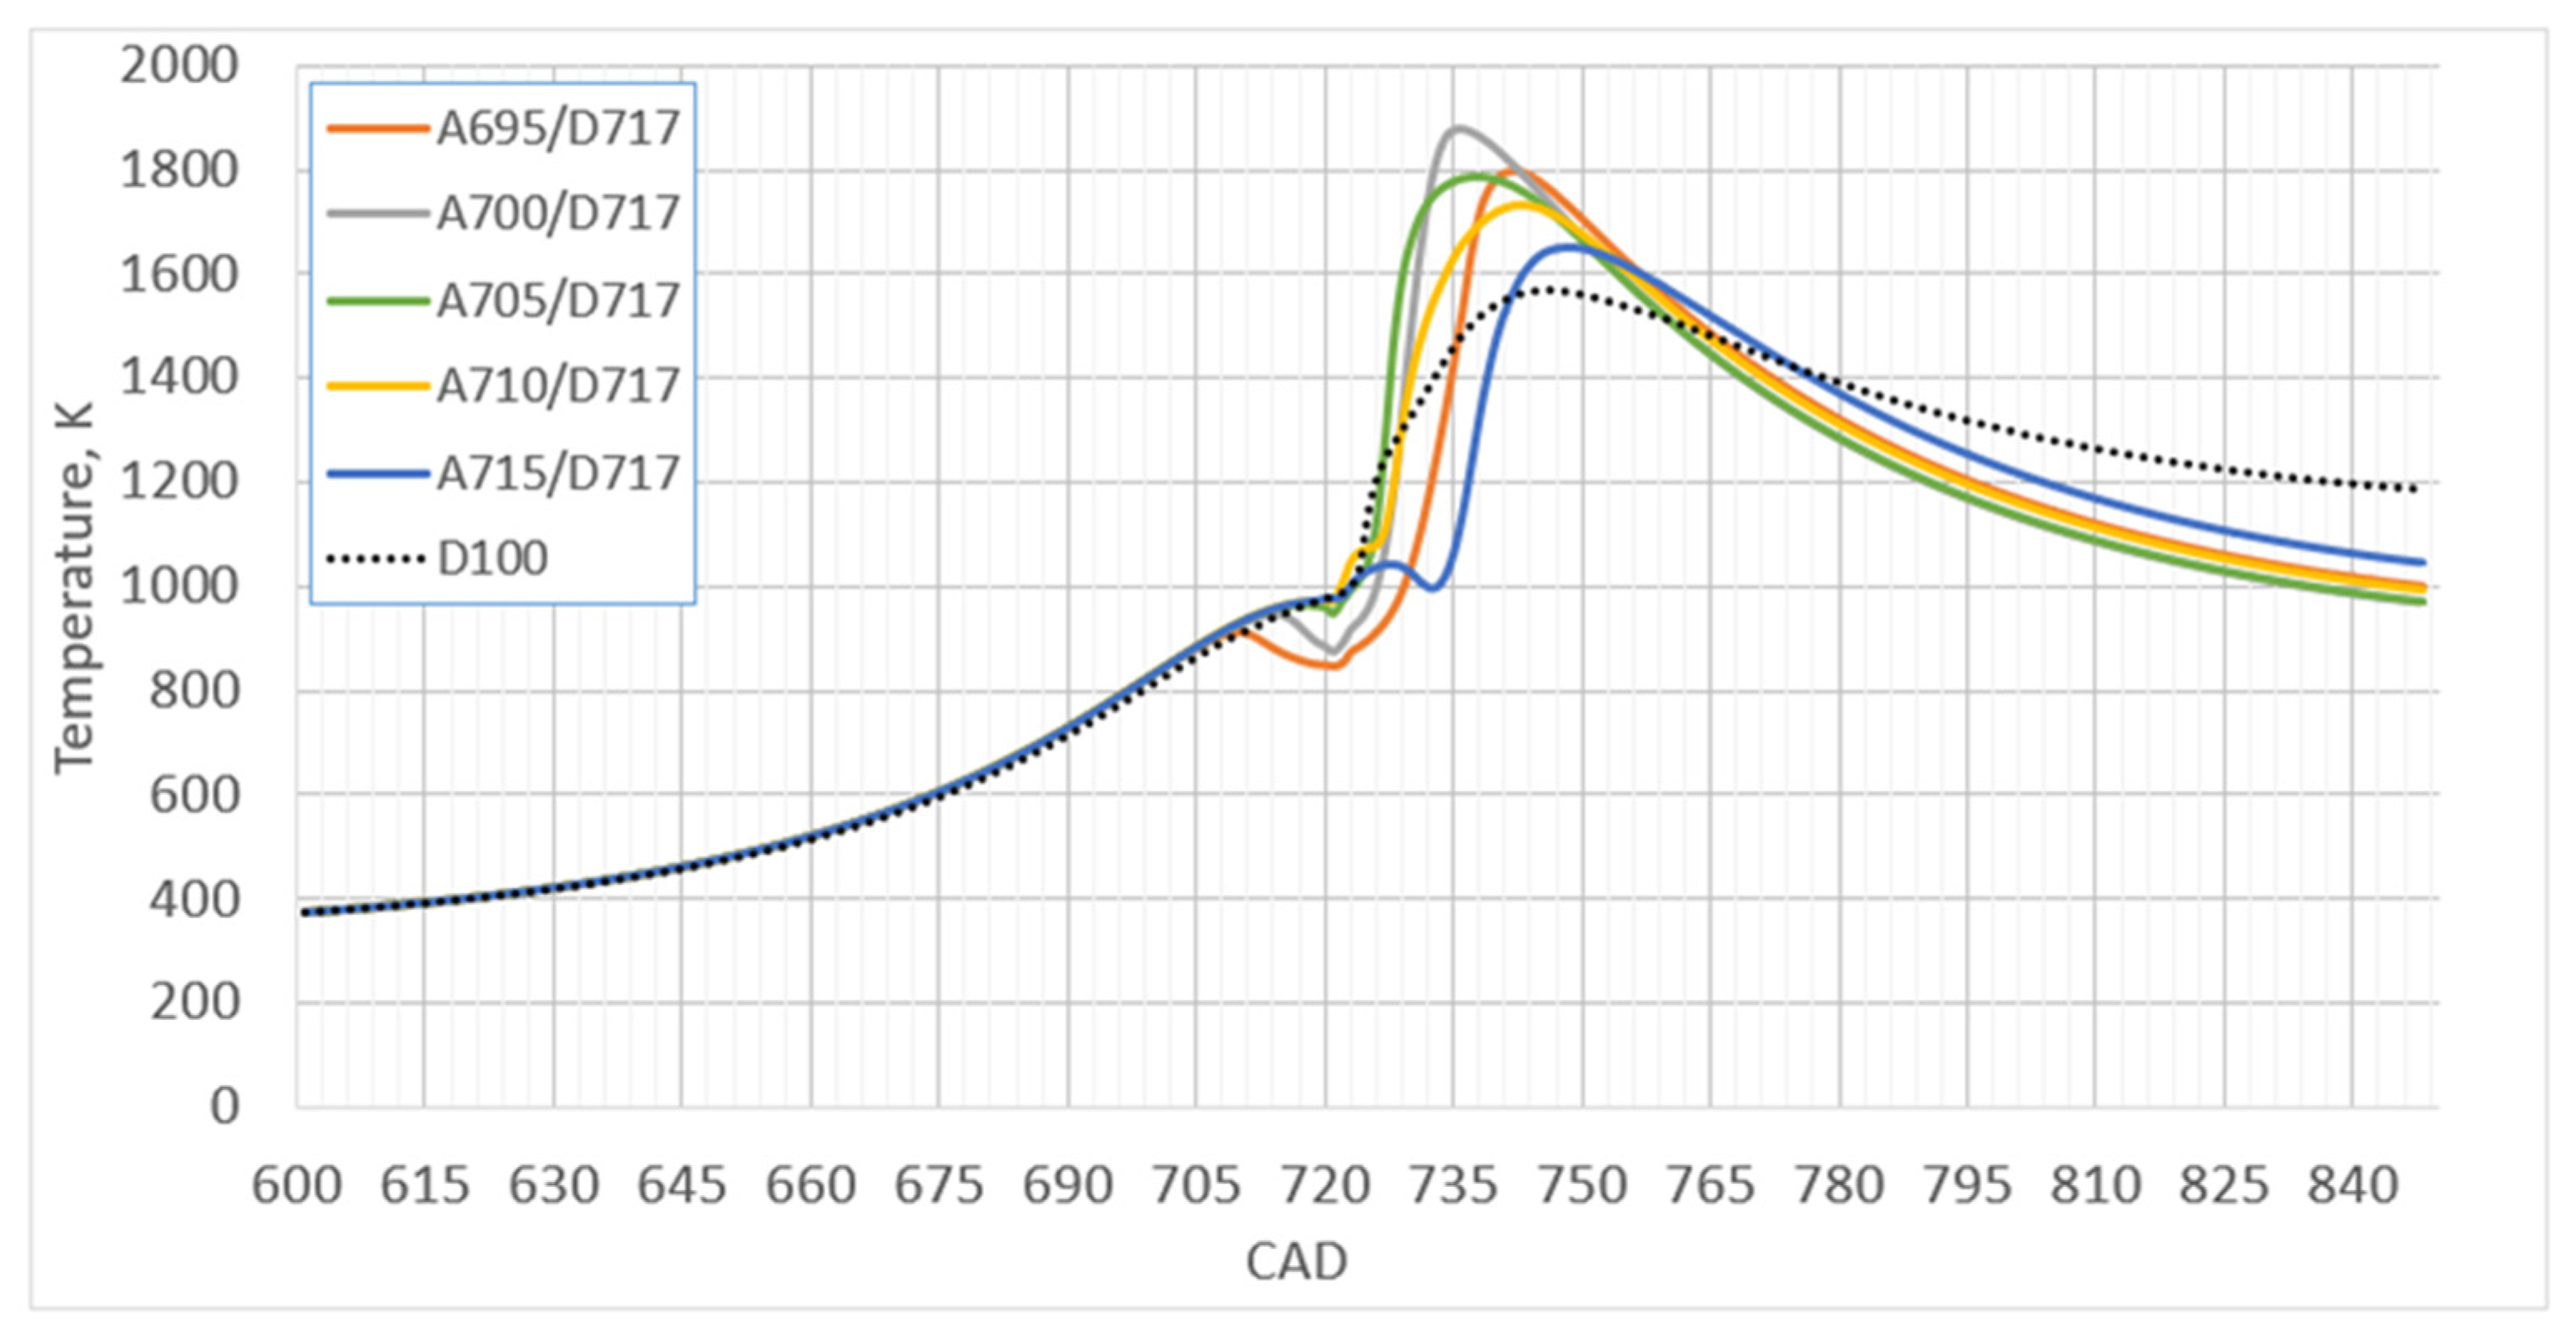
Analyzing the dependency of integral heat release characteristics on injection phases (see Figure 5), it has been observed that initiating ammonia injection 22° CAD before diesel injection (A695/D717) results in delayed heat release, shifting the curve towards the expansion stroke. Similarly, initiating ammonia injection 2° CAD before diesel injection (A715/D717) also shifts the heat release curve towards the expansion stroke. As a result, the position of the heat release characteristic in the cycle becomes irregular, leading to corresponding irregular changes in exhaust gas emissions and temperatures. On the other hand, the remaining heat release curves in Cases A700/D717, A705/D717, and A710/D717 describe a closer distance to TDC, indicating early and intense heat release. Progressive penetration of ammonia into the pilot fuel combustion zone results in continuous and intense ammonia combustion, leading to increased Pmax and Tmax (see Figure 7 and Figure 8). This is crucial as the increase in Pmax and Tmax negatively affects the mechanical and thermal stresses on engine components.
In summary, an optimal injection start angle exists between early and late ammonia injection phases. In a general assessment, short and intense combustion near TDC leads to high ITE due to efficient combustion and reduced heat losses to the cooling system, characterized by increased maximum cycle pressure and temperature. Consequently, adhering to Pmax and Tmax limitations within the D100 combustion cycle, the optimal injection phase combination in this scenario is A710/D717, maintaining a 7° CAD distance to the start of pilot fuel injection. As a result, ITE reaches 42.6%, Pmax increases by 9%, and Tmax increases by 10.5% compared to the D100 combustion cycle.

3.2. The Influence of the Distance between Injection Phases on Exhaust Gas Emissions

An analysis of the variation in start angles for ammonia injection, while maintaining the start of diesel injection fixed at 717° CAD, revealed that initiating ammonia injection early, results in nearly homogeneous combustion which significantly increases emissions of NOx, N2O, and NH3 (see Figure 9). These findings align qualitatively with other studies where ammonia introduction into the cylinder is organized in a gaseous phase along with intake air. Primarily due to increased Tmax, which promotes intense NOx formation, and inefficient combustion leading to high levels of unburned NH3 emissions, conditions are also conducive to intensified N2O formation. Consequently, advancing the ammonia injection timing, or in other words, increasing the distance between the start of ammonia and pilot fuel injections, proves impractical when applying a high-pressure injection strategy, as it negates the primary benefits of this method. On the other hand, injecting ammonia closer to TDC, almost simultaneously with pilot fuel injection in Case A715/D717, where flame extinction and a prolonged induction period are observed, also proves suboptimal due to relatively high N2O and unburned NH3 emissions. Bringing the ammonia injection closer to TDC results in reduced N2O emissions. However, in Case A715/D717, N2O levels begin to rise again. The increase in N2O is linked to a high mass fraction of unburned NH3 and a relatively longer active temperature window for N2O reaction in the combustion chamber. In contrast, injection phases closer to TDC in Case A715/D717 result in the lowest thermal NOx formation compared to other injection phases, due to the lower combustion chamber temperature. In summary, a large distance between ammonia and pilot fuel injection phases results in uniformly high NOx, NH3, and GHG emissions. Conversely, a narrower 2° CAD distance leads to higher GHG and NH3 emissions compared to a 7° CAD distance between injection phases. When evaluating the emissions balance, the optimal injection phase is determined to be A710/D717, with a 7° CAD distance between the start of ammonia and diesel injection.

3.3. The Influence of Injection Phase Distance from TDC on Combustion Cycle Characteristics

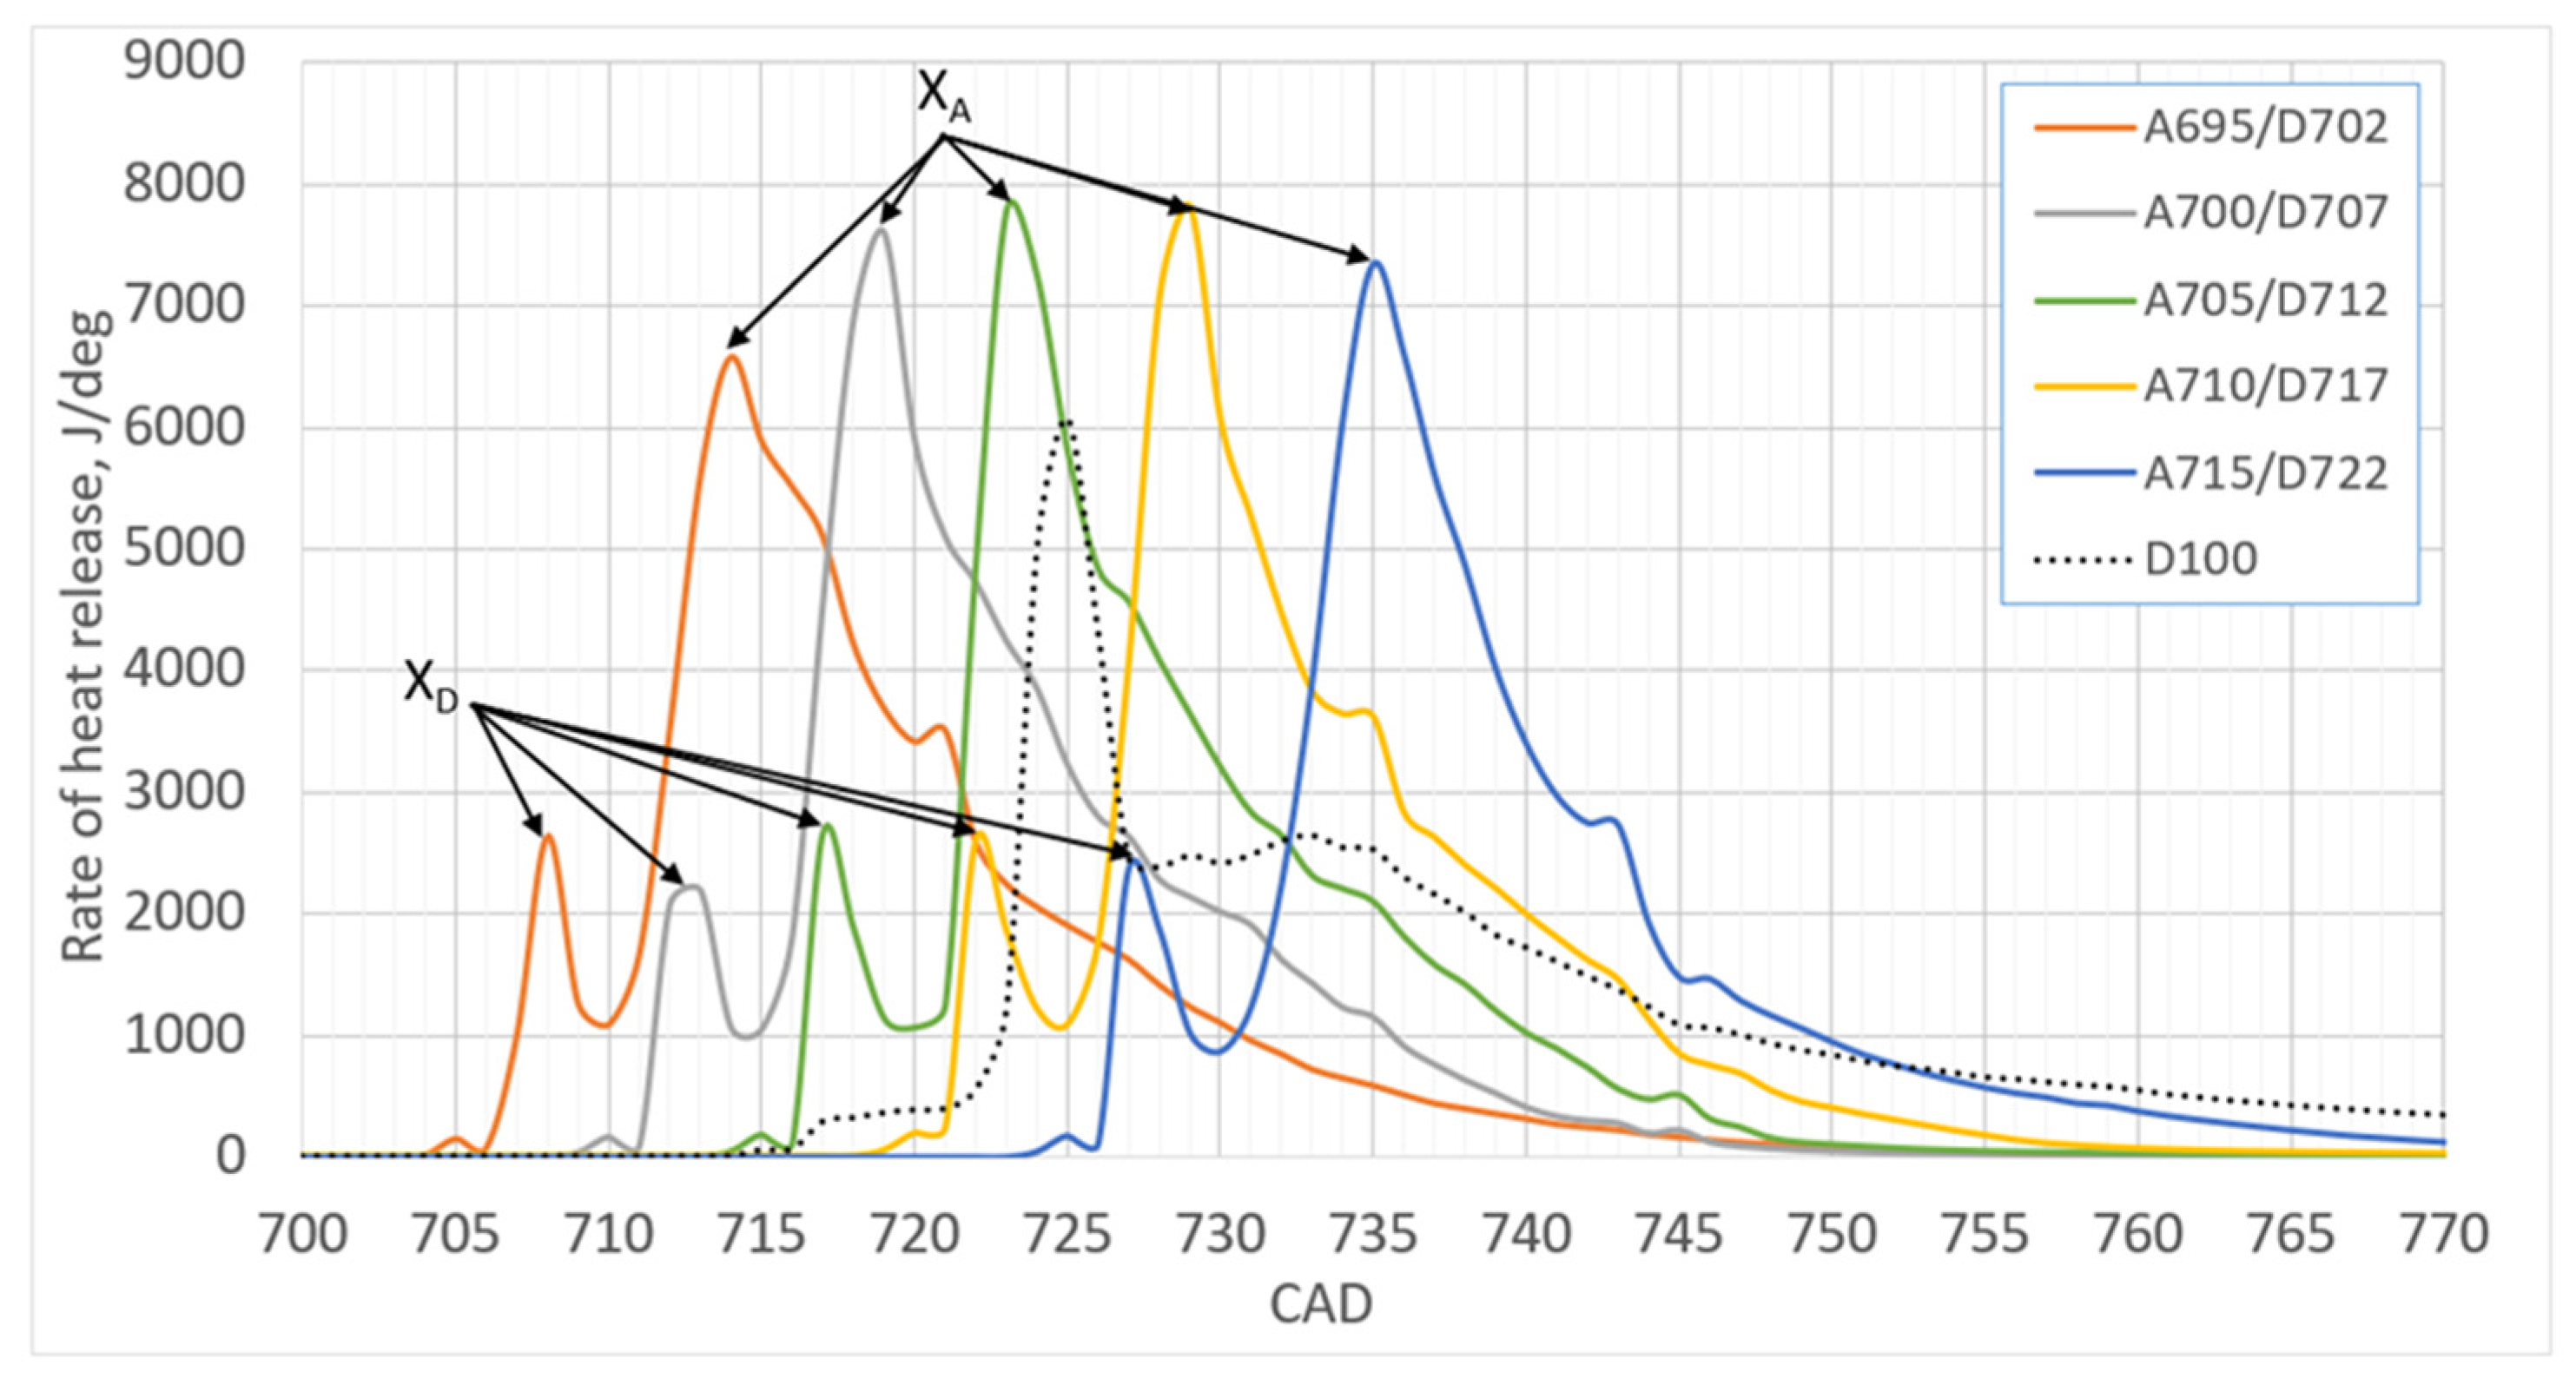
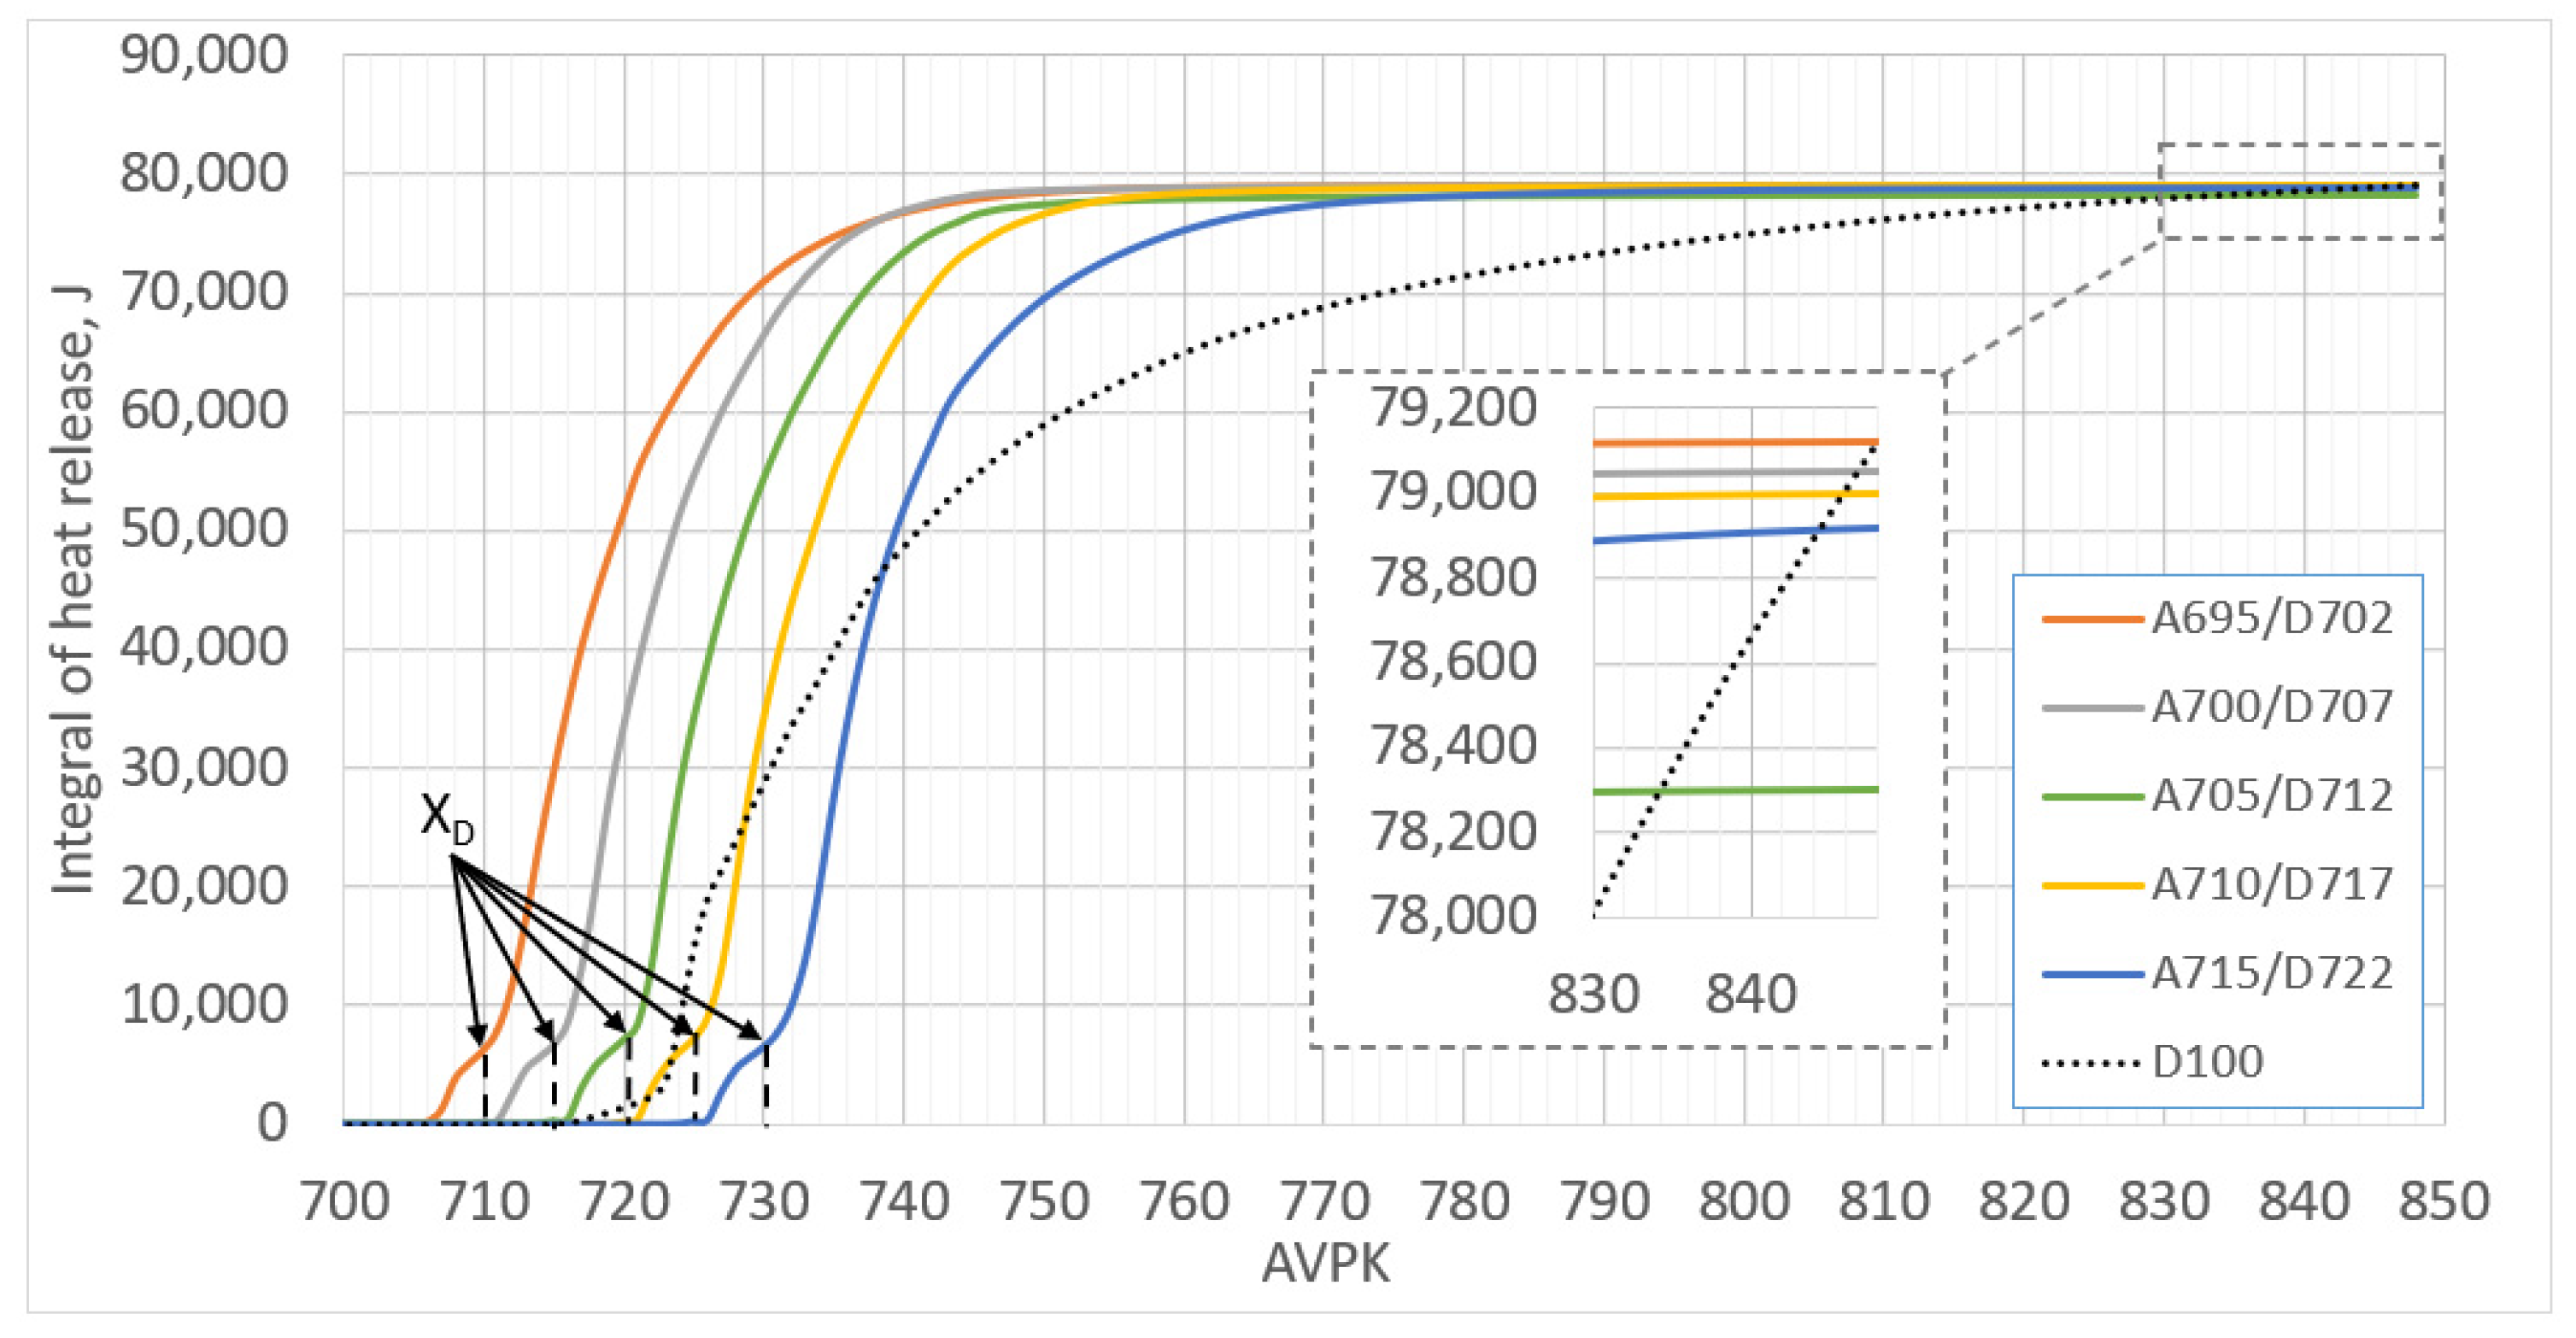
In this stage of the research, after determining the optimal distance between dual-fuel injection phases to better align Pmax and Tmax parameters with exhaust gas emission, the start of ammonia injection was varied from 695° to 715° CAD, while the start of diesel injection after ammonia injection was maintained at 7° CAD. An analysis of the heat release rate dependency on crank angle (see Figure 10) revealed uniform single-phase heat release characteristics typical of dual-fuel engines. In comparison to D100 (see Figure 10), a double-phase (kinetic and diffusive) heat release characteristic is evident. The initial slight increase in heat release (XD) at D5/A95 is associated with pilot diesel combustion, while the subsequent significant increase in heat release (XA) correlates with the combustion of main cyclic fuel—ammonia. However, the results indicate that optimizing dual-fuel injection start angles has minimal influence on both the shape and duration of the heat release. This phenomenon can be attributed to the auto-model ammonia combustion following pilot diesel fuel ignition. Both the heat release rate (see Figure 10) and the integral heat release (see Figure 11) show consistent patterns irrespective of the changes in the start angles of ammonia injection, which is considered advantageous in the numerical optimization of the ammonia combustion cycle. Further studies indicated that the consistent repetition of heat release curves was influenced by maintaining a 7° CAD distance between the start of pilot fuel injection and ammonia injection. As a result, the induction period (the time from injection start to the first noticeable increase in heat release rate, expressed in CAD) remains stable at 4° CAD for diesel and 15° CAD for ammonia. It can be concluded that XD has minimal influence on the heat release diagram and combustion cycle parameters, primarily influenced by the XA segment.
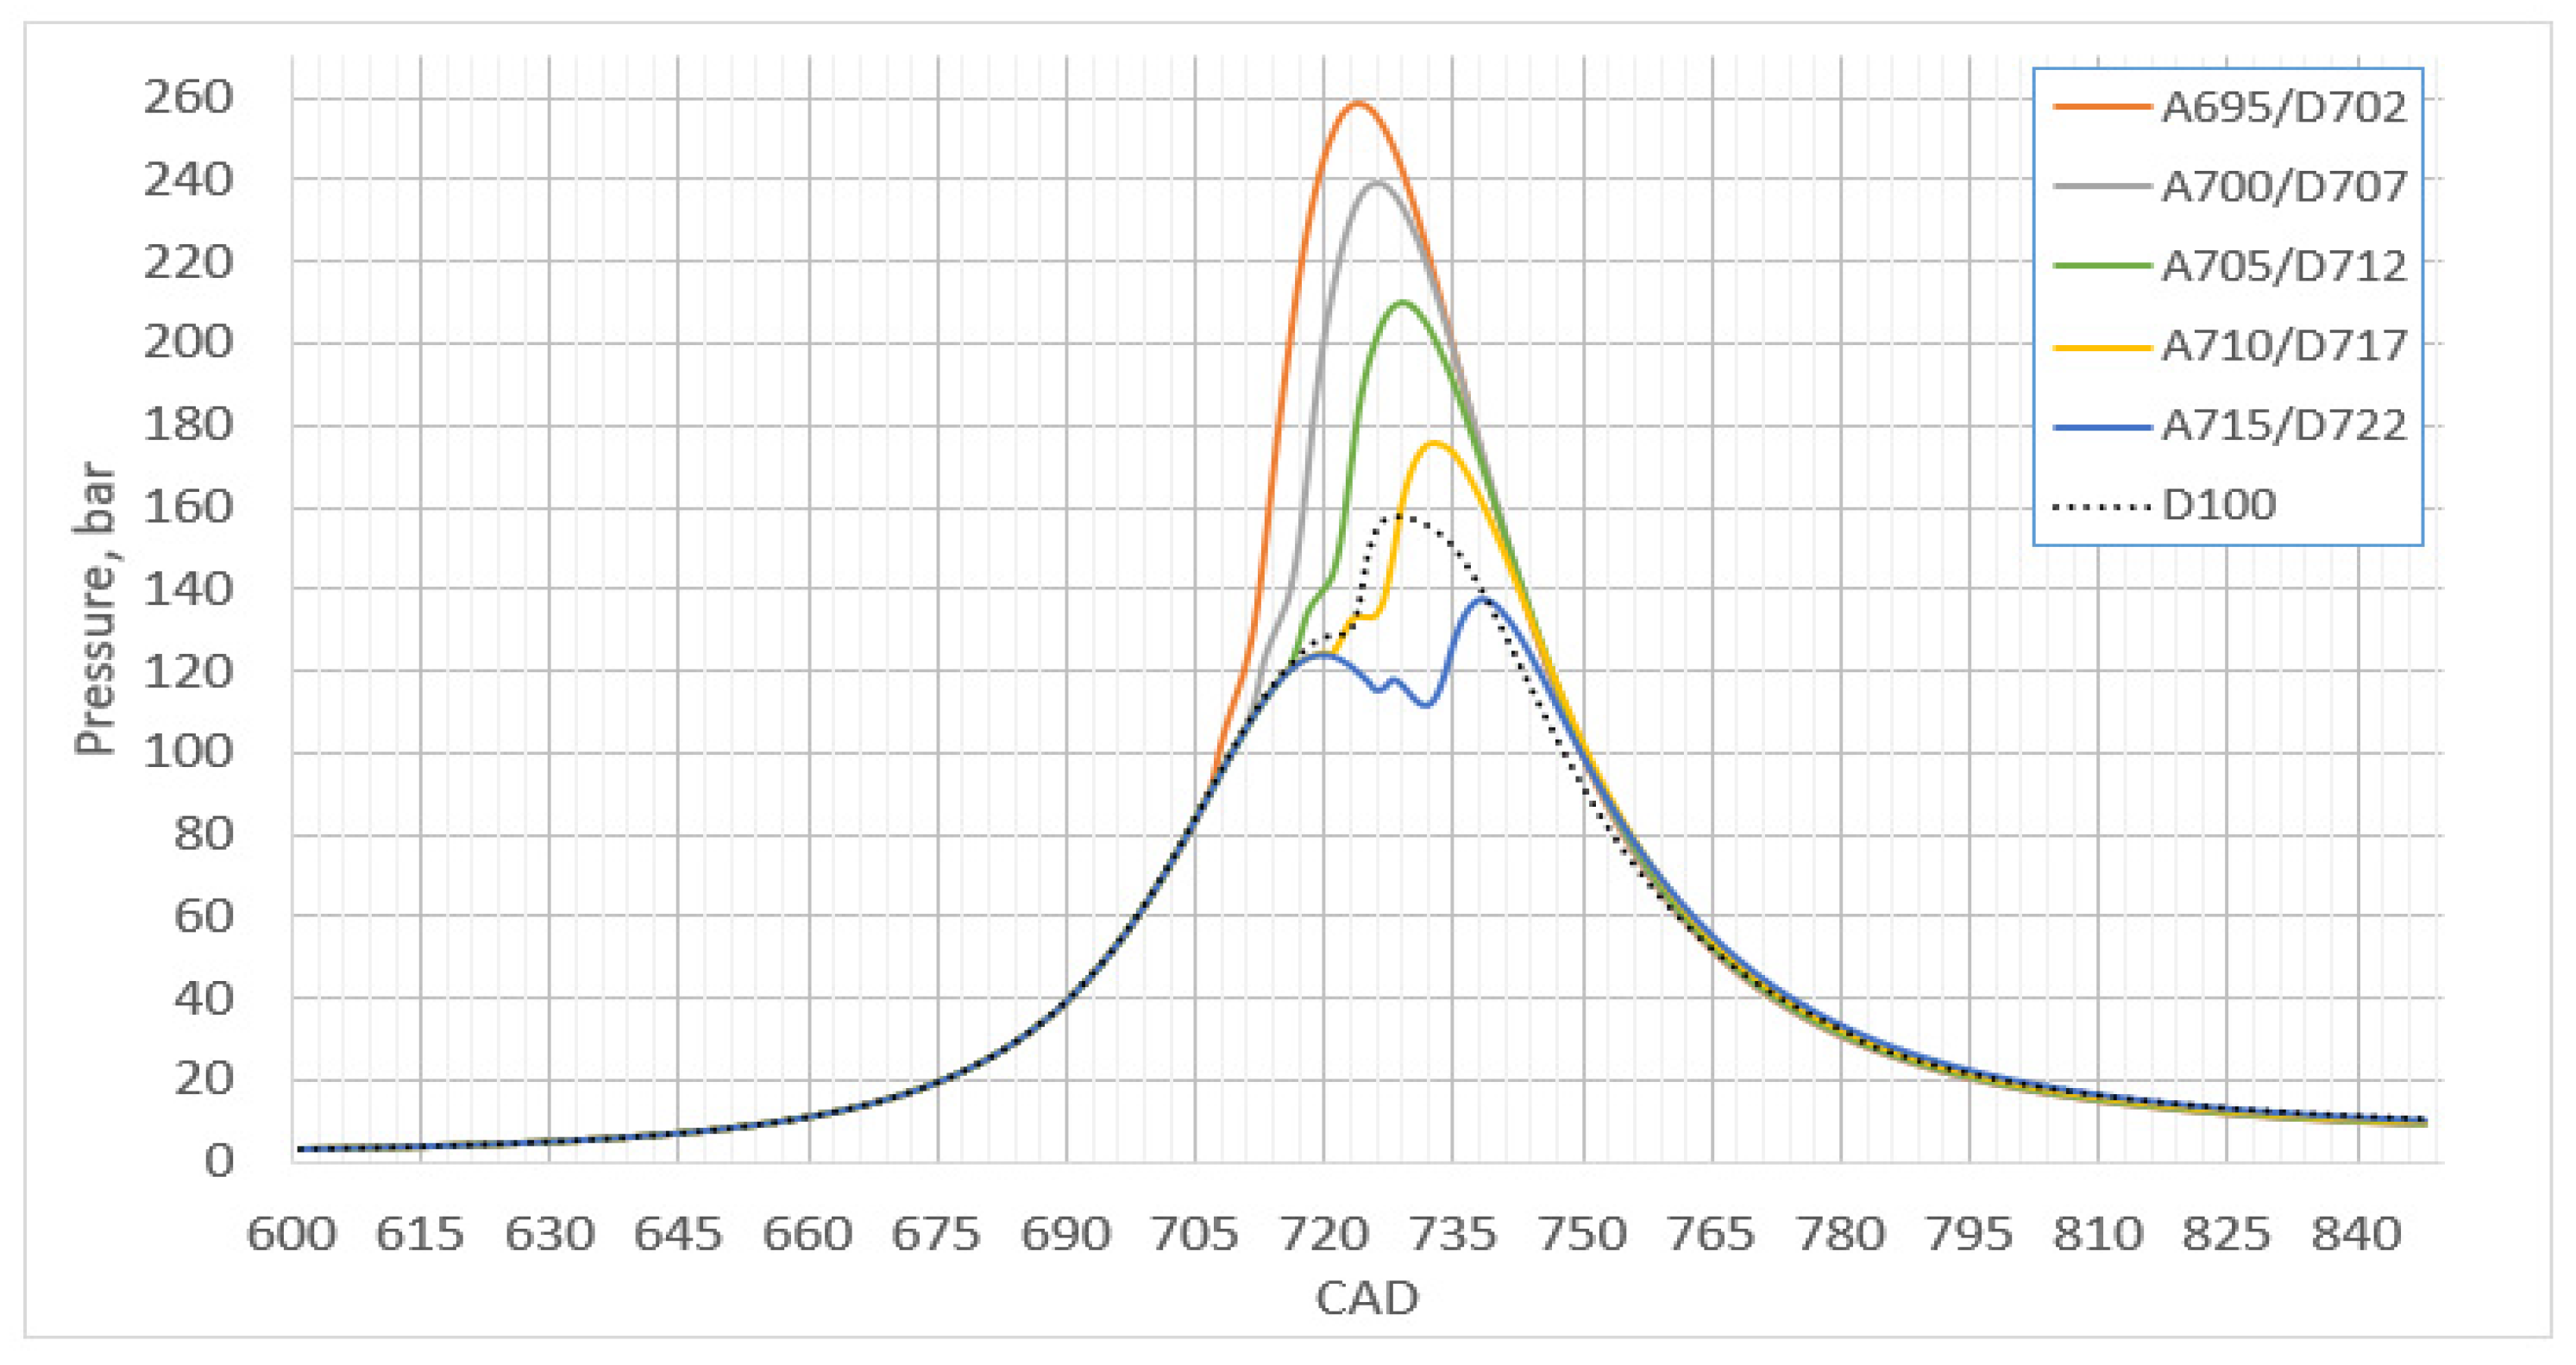
Auto-model combustion in the cylinder, together with the constant ammonia flame propagation speed, is also determined by uniform diesel injection following ammonia injection in all variants, as in diesel engines [45,46,47,48]. In diesel engine theory [36,37], Pmax is defined by the heat released during fuel combustion (QPmax) up to Pmax relative to crank angle degrees (φPmax). In this study, considering the relatively large range of diesel fuel injection variation (20° CAD), φPmax varies within the range from 724° to 738°. With negligible error, QPmax can be evaluated up to the average φPmax, i.e., 731° or 11° ATDC. The findings confirm a direct correlation between Pmax and QPmax, as in diesel engine theory. Therefore, it can be stated that optimizing fuel injection phases is related to Pmax and the balance of harmful emissions. The confirmed aspect provides favorable conditions for the dual-fuel operation of a diesel engine with ammonia combustion cycle optimization according to the diesel fuel injection phase. Maintaining the Pmax limitation according to the D100, it is adequate to precisely present the auto-model heat release diagram aligned with the D100 position relative to TDC, despite significant differences in the integral heat release curves between ammonia and diesel.
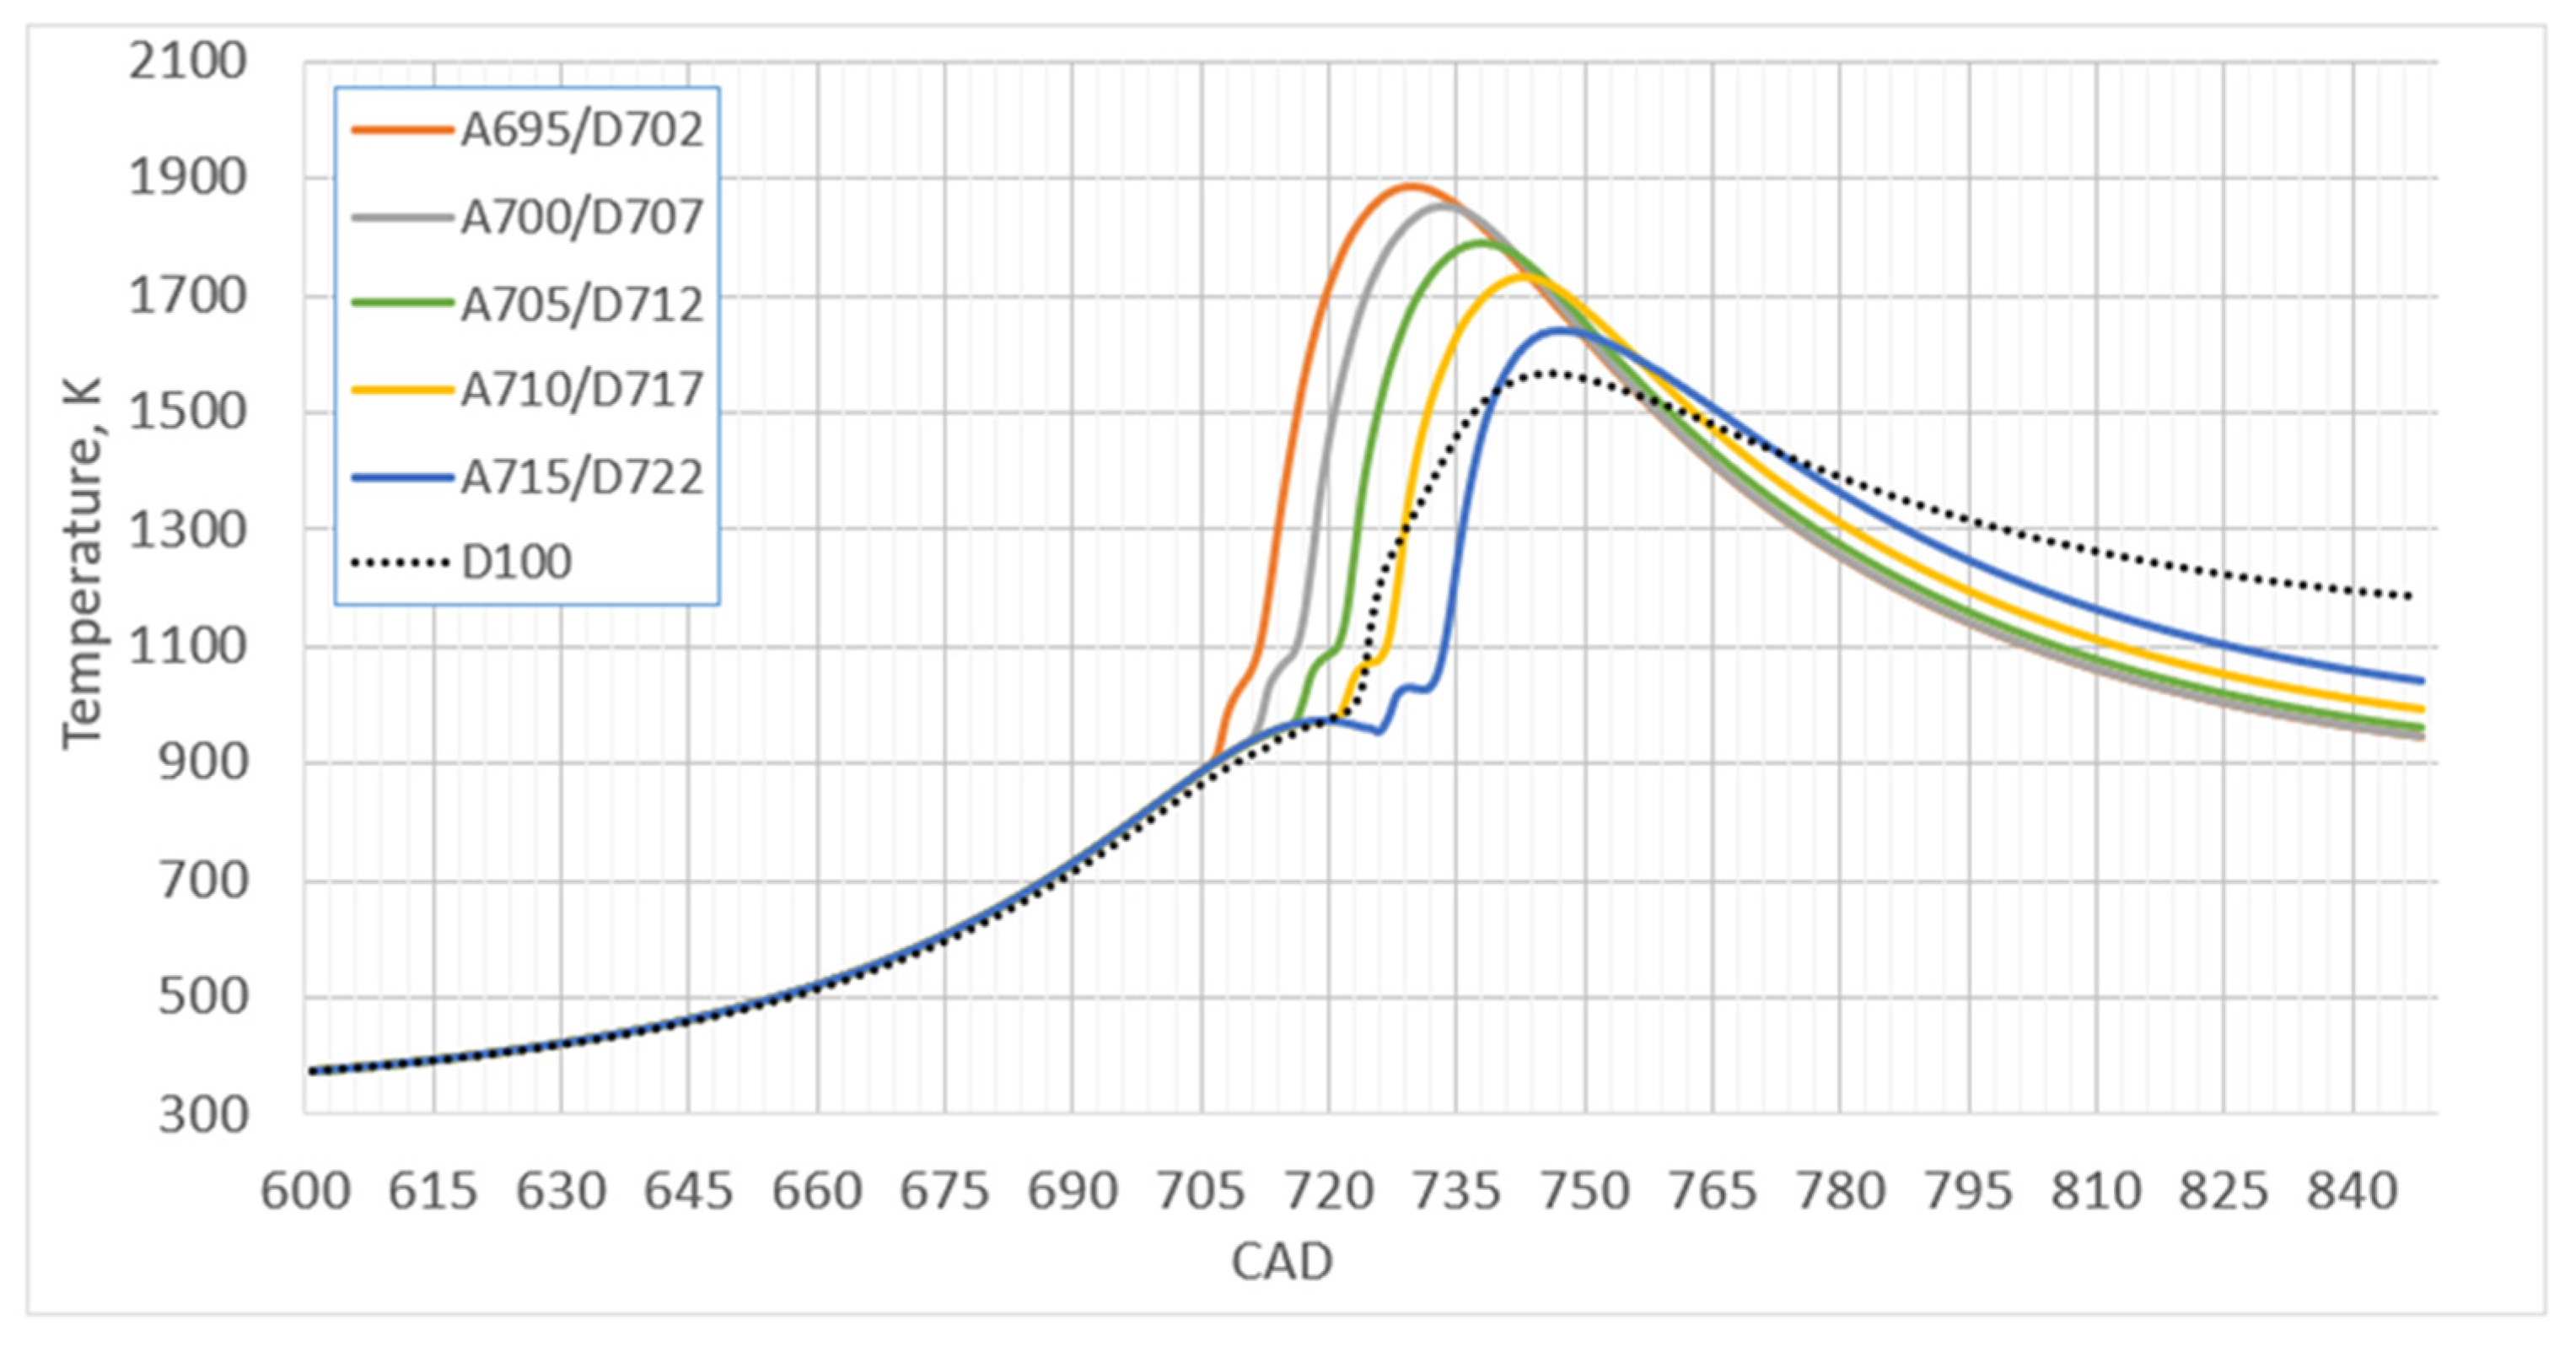
The position of heat release characteristics relative to TDC influences changes in structural combustion cycle parameters and the formation of exhaust gases. Early mixture injection enhances effective compression due to additional mixture compression before ignition. Therefore, starting pilot fuel combustion at −14° to TDC and subsequent ammonia combustion at −10° to TDC during the compression stroke significantly increases Pmax and Tmax. This results in a 62% increase in Pmax and a 20% increase in Tmax with early ammonia injection in the case of A695/D702 compared to the designed limits of the combustion cycle at D100 (Pmax—160 bar, Tmax—1566 K) (see Figure 12 and Figure 13). However, due to increased mechanical and heat losses through the cylinder walls to the cooling system, ITE reached a minimum of 41.7% (see Figure 14). Cases A700/D707 and A705/D712, where combustion initiation occurs before TDC, also lead to higher Pmax and Tmax, with ITE not reaching its maximum accordingly. Optimum conditions are achieved in Cases A710/D717 and A715/D722, 1° and 6° ATDC, respectively, among all investigated cases. At A710/D717, ITE reaches a maximum of 42.6%, with Pmax increasing by 9% and Tmax by 10.5%; at A715/D722, ITE reaches 42.2%, Pmax decreases by 14%, and Tmax increases by 4.5%. Thus, ensuring high ITE and acceptable changes in Pmax and Tmax, while considering the engine’s design limits, necessitates setting injection start angles to ensure ammonia combustion begins immediately after TDC. These conditions align with research-based strategies for optimizing the combustion cycle in diesel engine development.

3.4. The Influence of Injection Phase Distance from TDC on Exhaust Gas Emissions

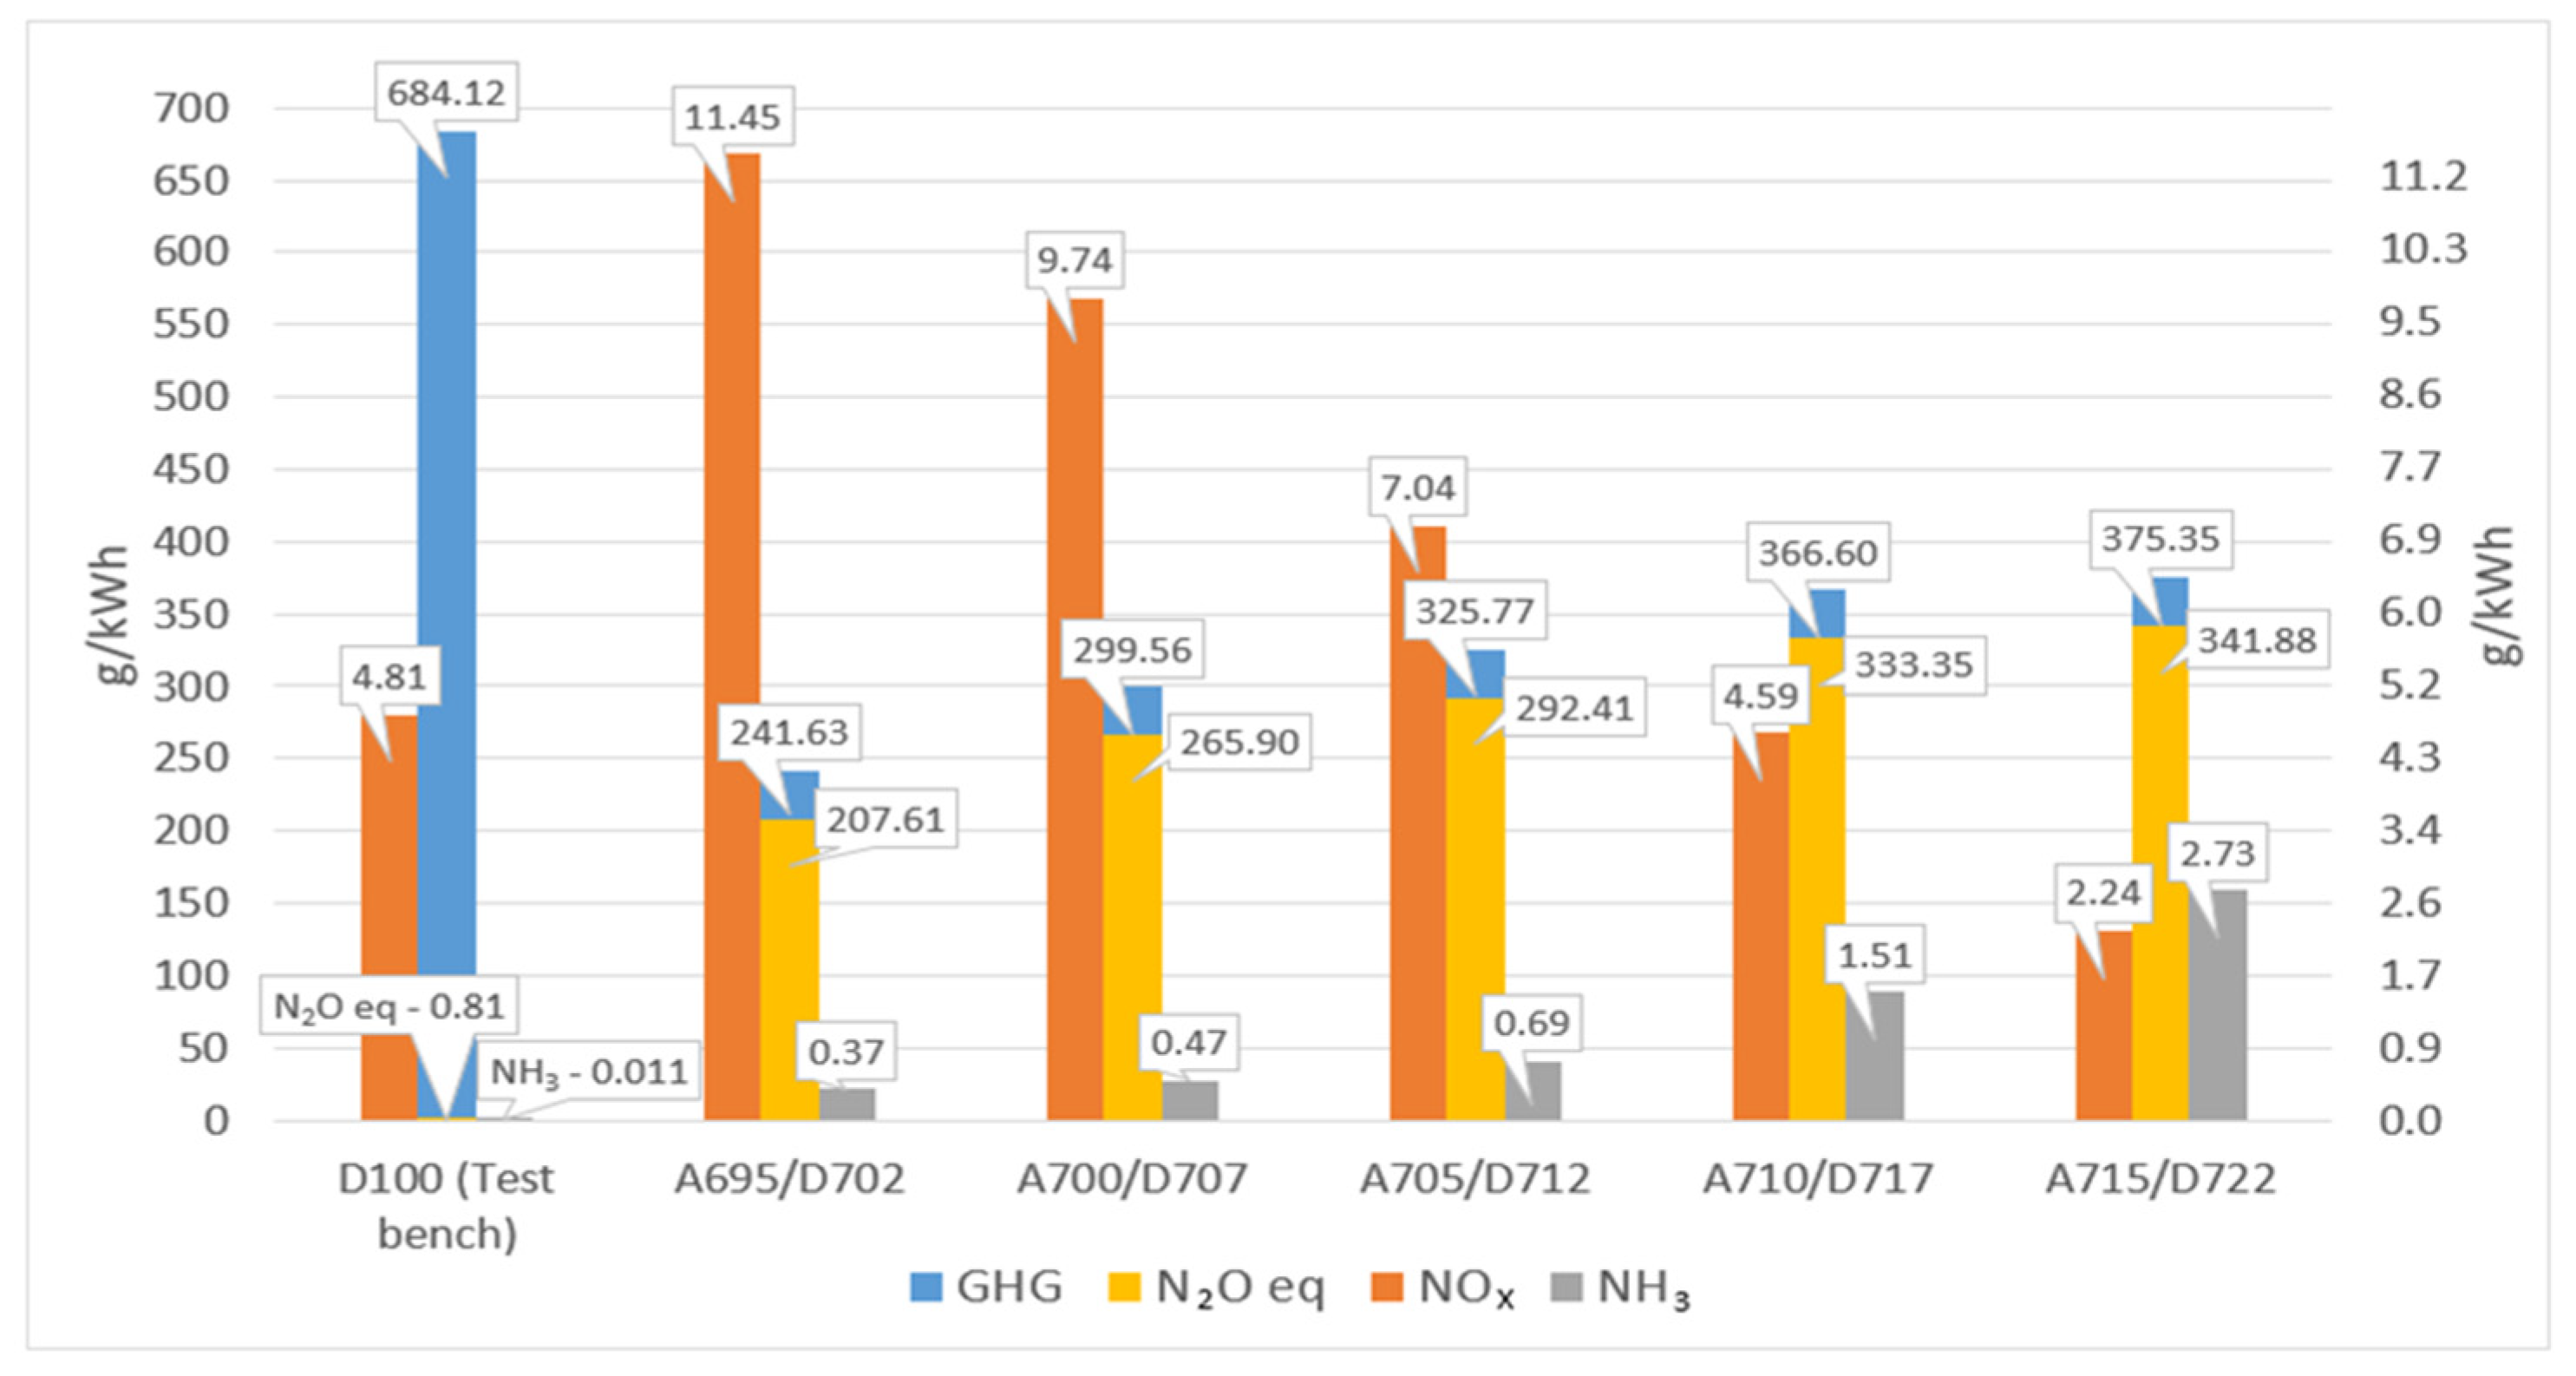
In an assessment of the influence of injection timing angles on CO2 equivalent specific emissions (see Figure 15), CO2, CH4, and N2O emissions are evaluated in terms of their potential climate impact. Unlike D100, the ammonia combustion cycle shows low and consistent CO2 and CH4 emissions (CO2—33 g/kWh, CH4—0.003 g/kWh), which depend on the mass of pilot diesel fuel. However, N2O emissions predominantly contribute to CO2 equivalent emissions. For instance, with the A695/D702 injection phase combination, N2O equivalents reach 208 g/kWh, whereas in the D100 variant, it is 0.8 g/kWh. Over a 100-year period, N2O’s global warming potential is approximately 273 times higher than CO2’s. Therefore, strategies for reducing N2O emissions are crucially tied to the use of ammonia in diesel engines. Scientific research indicates that N2O formation during ammonia combustion occurs at temperatures below 1400 K in the combustion chamber [21]. During combustion, NO and NO2 react with NH and NH2 radicals, forming N2O through chemical reactions 1 and 2:
NH + NO→N2O + H
NH2 + NO2→N2O + H
As a result, N2O directly depends on the combustion chamber temperature and the mass of ammonia fuel. Specifically, early mixture injection in Case A695/D702 achieves the highest Tmax, and the 1400 K temperature window for N2O formation is the shortest compared to other injection phases, resulting in the lowest N2O formation (see Figure 13). On the other hand, temperature increase facilitates intensive formation of NOx emissions. Compared to D100, NOx emissions increased by 138%. Conversely, organizing fuel injection closer to TDC reduces NOx emission practically linearly due to lower combustion chamber temperatures. The lowest NOx emissions were achieved at injection start angle A715/D722, where Tmax was also the lowest at 1638 K. NOx decreased by more than 2 times compared to D100 cycle NOx emissions. This phenomenon can be explained by the DeNOx process, where active NH2 radicals react with NO at 1000–1400 K combustion chamber temperatures to form N2 + OH [49].
On the other hand, advancing the injection start towards TDC increases unburned NH3 emissions due to the decrease in combustion chamber temperature, consequently creating conditions for N2O emissions, thereby increasing CO2 equivalent emissions. In the A715/D722 case, the highest level of unburned NH3 emissions was reached, increasing more than 7 times compared to A695/D702. This increase in unburned NH3 in the A715/D722 case is explained by prolonged ammonia combustion during the expansion stroke, supported by the highest thermodynamic temperature achieved at the end of the combustion cycle (see Figure 13). Combustion extends into the expansion stroke, occurring later compared to other injection phases. As a result, ammonia combustion was allocated a shorter period in the cycle, leading to higher unburned NH3 emissions. The level of unburned NH3 emissions also impacts combustion losses. In the graph showing the integral of heat release (see Figure 11), in the A715/D722 case where the highest unburned NH3 emission level is observed, combustion cycle losses increased to approximately 1% due to the combustion process extending into the expansion stroke. Meanwhile, in the A695/D702 case, the highest heat release indicates the most efficient combustion and the lowest NH3 emissions.
In summary, it can be stated that the start-of-injection phases of ammonia and diesel have a significant impact on exhaust gas emissions. However, there is no single optimal injection phase that achieves a reduction in all exhaust gas emissions. As a result, injection phases should be chosen considering the balance between exhaust gas emissions. In this case, the optimal injection phases maintaining a 7° CAD distance to the start of diesel injection are considered to be A710/D717 and A715/D722.
When evaluating the prospects of ammonia in maritime transport according to the IMO and EU GHG reduction targets, it is stated that the 47% GHG reduction achieved in the studies conducted in this work meets the 2030 target set by the IMO to reduce GHG emissions by 20–30%. However, the EU’s 2030 target to reduce emissions by 55%, as well as the long-term goal to reduce emissions by 90% by 2050 or achieve climate neutrality according to the IMO, will not be achievable for the test engine under the combustion cycle optimization conditions implemented in this work. Summarizing the obtained results, it can be stated that retrofitting the test engine to operate on dual ammonia–diesel fuel at a D5/A95 ratio can achieve the short-term GHG reduction targets set for 2030 by the IMO. However, to meet further GHG reduction goals, it is advisable to continue research on reducing ammonia combustion cycle emissions.

3.5. Summary of Results

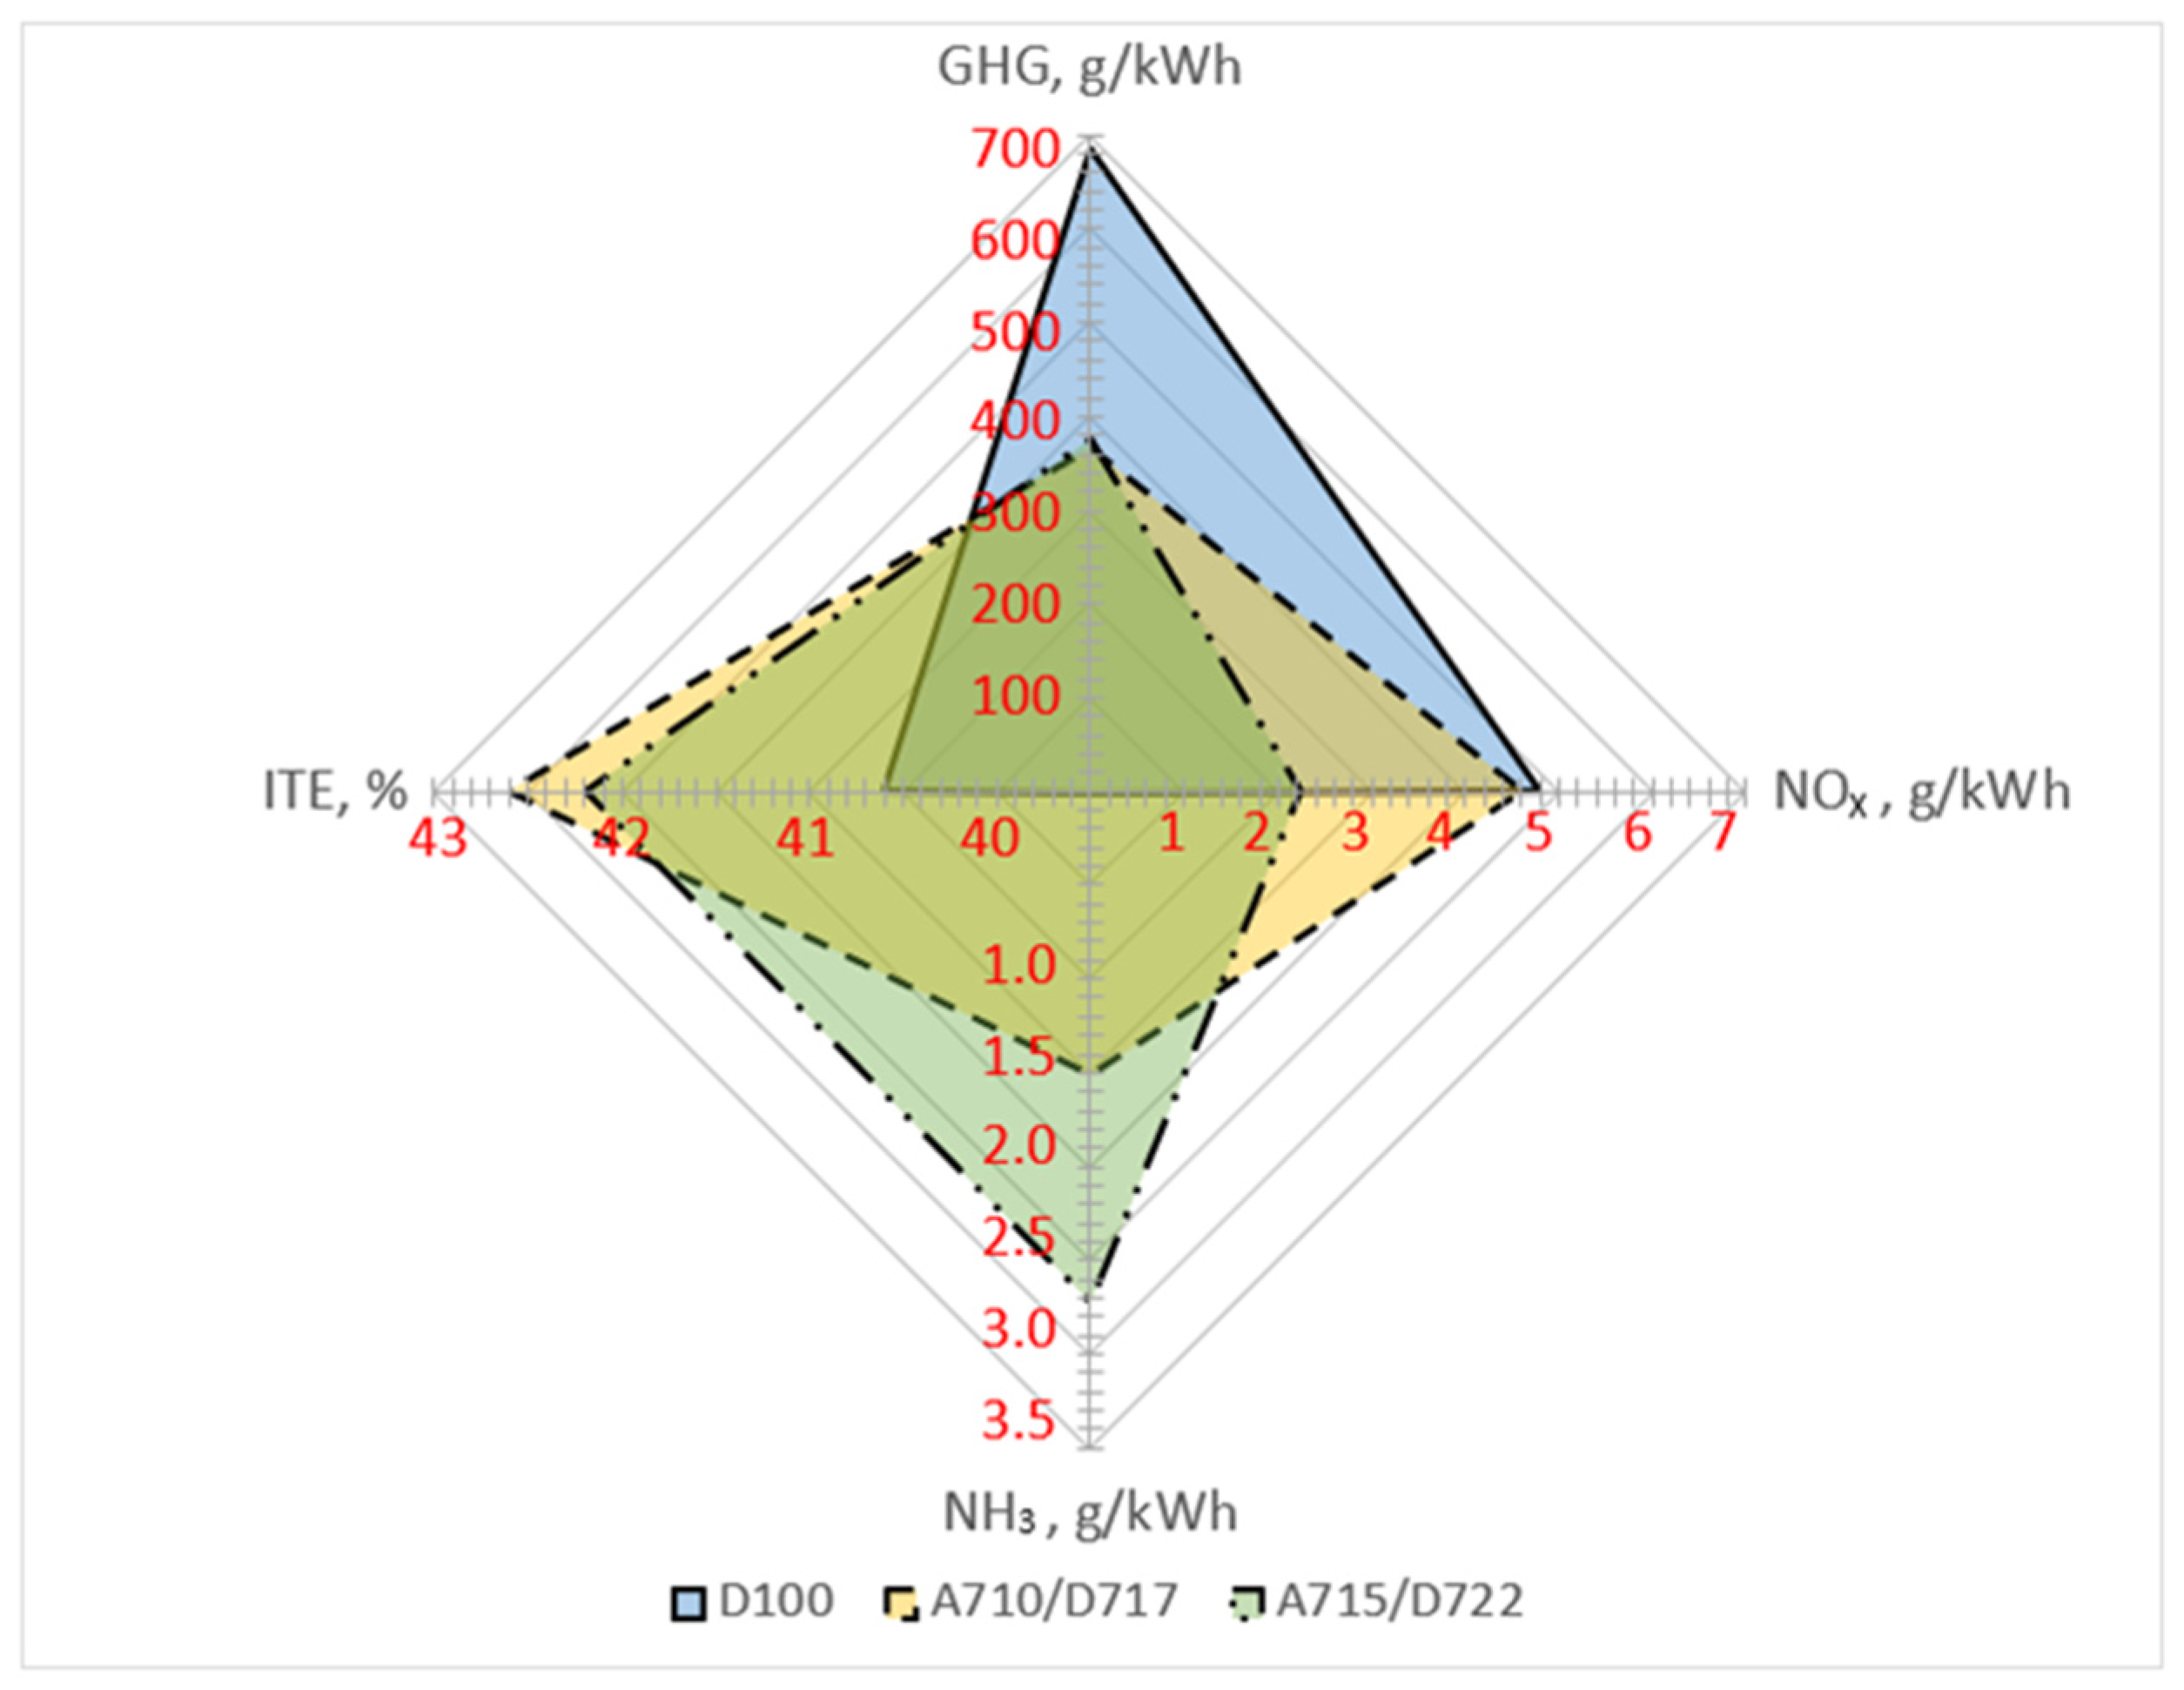
Summarizing the results of dual-fuel injection phase optimization, two injection phase combinations are distinguished compared to D100 based on the criteria of key harmful emissions and GHG emissions, as well as indicative thermal efficiency (see Figure 16). It is evident that achieving a comprehensive reduction in exhaust gas emissions along with increased ITE with a single solution is fundamentally impossible due to significant differences in the physical and chemical properties of diesel and ammonia. Therefore, an optimal balance between the studied combustion cycle parameters and exhaust gas emissions reduction was chosen. The injection phase combination A710/D717 achieves the highest ITE, with a 4.6% improvement compared to D100. Additionally, it achieves a 47% reduction in GHG emissions and a modest 4.6% reduction in NOx. However, the positive outcome of injection phase optimization is diminished by the emergence of harmful unburned NH3 emissions in the exhaust system, with an NH3 concentration reaching 1.50 g/kWh. NH3 emissions need to be carefully regulated due to the high toxicity of ammonia, which can lead to the formation of fine particulate matter and secondary aerosols. These emissions pose significant health risks to humans and disrupt overall ecosystem health. On the other hand, the injection phase combination A715/D722 can increase engine efficiency by up to 3.7% compared to D100 and also reduce GHG emissions to 45%. In contrast to the A710/D717 case, NOx is reduced by 53%, but at the expense of higher unburned NH3 emissions of 2.7 g/kWh. Given the interaction between changes in NOx and NH3 emissions, it is advisable to explore additional strategies for reducing these emissions further.

3.6. Effect of Engine Loads on Air Pollution Compliance

In 2023, the IMO updated its strategy to reduce GHG emissions: 20–30% by 2030, 70–80% by 2040, and zero emissions by 2050 [2]. The EU aims for a 55% reduction in maritime GHG emissions by 2030 and 90% by 2050 [3]. From January 2023, ships over 400 GT must comply with the Energy Efficiency Existing Ship Index (EEXI), and ships over 5000 GT must report energy efficiency data and take corrective actions if the Carbon Intensity Indicator (CII) is insufficient [2]. Current methods suggest a 5–20% emission reduction, but up to 100% with renewable and low-carbon fuels [4].
A comprehensive emission assessment was conducted for a test engine operating on diesel (D100) and ammonia (D5/A95), using IMO MARPOL Annex VI Regulation 13 methodology. This included NOx, CO2, and GHG emissions in line with IMO and EU targets. GHGs are evaluated based on CO2, CH4, and N2O, which impact the ozone layer.
The E2 cycle was chosen for the ship’s propulsion system with a variable pitch propeller, assessing emissions at 100%, 75%, and 50% engine loads. At 75% load with dual fuel (D5/A95), emissions were calculated using optimized combustion cycle results at 1000 bar injection pressure and phase combination A710/D717. The same parameters were used for 100% and 50% load conditions. Due to the lack of data at 25% load, the impact coefficient was adjusted, achieving a total impact coefficient sum of 1.0. Detailed results according to the E2 cycle are presented in Table 3.
The engine’s NOx emissions meet Regulation 13 limits for both diesel and dual ammonia–diesel fuel, as shown in Table 3. Retrofitting to ammonia, which reduces NOx emissions by 69% from Tier I limits and by 30% compared to D100, aligns with MARPOL VI Annex VI Regulation 13. When evaluating CO2 and GHG (CO2, CH4, N2O) emissions using the E2 cycle methodology, emissions were calculated for the engine operating on D100 and D5/A95 (see Table 3). An assessment was based on emissions from the D100 combustion cycle, calculating the emissions limit for 2030–2050 according to IMO and EU targets. The D100 limit was considered the maximum threshold when retrofitting the engine for dual ammonia–diesel fuel.
Applying the IMO’s EEXI measure to reduce CO2 emissions by 40% by 2030 sets the D100 limit at 348 g/kWh. With ammonia, CO2 emissions decrease to 37 g/kWh, meeting the target. No further CO2 reduction targets are set beyond this period. For the IMO’s GHG reduction target of 20–30% by 2030, the D100 limit is 580–508 g/kWh, while the D5/A95 cycle achieves 295 g/kWh, meeting the target. The engine conversion to dual fuel with ammonia aligns with the EU’s 55% GHG reduction target by 2030. However, for 2040 and beyond, a 70–80% reduction is required by the IMO. The engine’s GHG emissions exceed the 2040 target by 35–102%, not meeting the longer-term IMO and EU targets for 2050.
In a summary of the emission assessment results using the E2 cycle methodology of IMO MARPOL Annex VI Regulation 13, it can be stated that retrofitting the studied engine to operate on dual ammonia–diesel fuel (D5/A95) can achieve the 2030 CO2 and GHG reduction targets set by IMO and EU strategies. However, from 2040 onward, these engines may become unviable due to exceeding emissions norms. Therefore, additional combustion cycle optimization or exhaust gas aftertreatment measures should be considered.

4. Conclusions

Research validates the hypothesis that dual ammonia–diesel fuel injection significantly enhances engine thermal efficiency and reduces harmful components and GHG emissions when adapting medium-speed marine diesel engines to operate on ammonia. Implementing a single-phase combustion cycle with ammonia and diesel fuel injection at the end of the compression stroke, during the A710/D717 injection phases, increases indicated thermal efficiency by 4.6% compared to using diesel alone. This method also achieves a 47% reduction in GHG emissions and a 4.6% reduction in the most harmful regulated NOx emissions. This optimized approach meets the EU and IMO environmental regulations for reducing GHG emissions by 2030 and complying with NOx Tier standards. It is a crucial solution for retrofitting the existing fleet without the need for exhaust gas aftertreatment technologies.
Reducing GHG emissions (CO2, CH4, and N2O) in CO2 equivalent form through optimizing injection phases is linked to initiating the DeNOx process at combustion chamber temperatures below 1400 K. Concurrently, this reduction in thermal nitrogen oxides maintains permissible thermal and mechanical load factors (Tmax and Pmax) for engine components. However, optimizing the injection phases presents challenges due to an increase in harmful NH3 emissions, which pose significant health risks. At A715/D722, unburned NH3 emissions reach a maximum of 2.7 g/kWh due to poor combustion efficiency. However, using the A695/D702 injection phase combination can reduce these emissions to 0.4 g/kWh. Therefore, future research will focus on improving NH3 combustion efficiency and reducing its slip into the exhaust system. This will involve optimizing valve timing, increasing the compression ratio, adjusting charge air parameters, and making other related modifications, all in alignment with NOx Tier III regulatory requirements.
In summary, when optimizing the dual ammonia and diesel fuel combustion cycle, one should aim for a short, single-phase combustion without exceeding permissible Pmax and Tmax limits, ensuring engine reliability. Additionally, when selecting the injection phases for ammonia and diesel, it is crucial to balance GHG, unburned NH3, and NOx emissions to maintain an optimal mix of these exhaust gases. Therefore, the optimal ammonia and diesel injection phases for a medium-speed, four-stroke, Wartsila 6L46 marine diesel engine are A710/D717, with a 7° CAD distance between injection phases.

Author Contributions

Conceptualization, S.L.; Methodology, M.D.; Software, M.D.; Validation, M.D.; Formal Analysis, M.D.; Data Curation, S.L.; Writing—Original Draft, M.D.; Writing—Review and Editing, S.L.; Supervision, S.L. All authors have read and agreed to the published version of the manuscript.

Funding

The project was financed by the Research Council of Lithuania and the Ministry of Education, Science and Sport Lithuania (Contract No. S-A-UEI-23-9).

Institutional Review Board Statement

Not applicable.

Informed Consent Statement

Not applicable.

Data Availability Statement

Data are contained within the article.

Acknowledgments

The authors thank AVL company for their long-term cooperation with Klaipeda University for providing AVL FIRE simulation software used in the PhD study program in maritime transport decarbonization research. Exceptional thanks to AVL FIRE personnel for sharing limited accessibility to the ammonia gas reaction mechanism, consultation, and professional advice.

Conflicts of Interest

The authors declare no conflicts of interest.

Abbreviations

B/Scylinder bore, stroke;
BSFCbrake specific fuel consumption;
CADcrank angle degrees;
CH4methane;
CO2carbon dioxide;
D100100% diesel fuel;
D5/A95mixture of 5% diesel and 95% ammonia fuel;
EUEuropean Union;
GHGgreenhouse gases;
HPDFhigh-pressure dual-fuel strategy;
HRCheat release characteristic;
IMEPindicated mean indicative pressure;
IMOInternational Maritime Organization;
ITEindicative thermal efficiency;
LNGliquified natural gas;
LPDFlow-pressure dual-fuel strategy;
MMmathematical model;
N2Odinitrogen oxide;
NH3ammonia;
NOxnitrous oxides;
PMparticulate matter;
TDCtop dead center;
Symbols
Piindicated power (kW);
Pinjammonia injection pressure (bar);
Pkcylinder pressure reading (bar);
Pmaxmaximum cycle pressure (bar);
Tmaxmaximum cycle temperature (K).

References

  1. United Nations Conference on Trade and Development. Review of Maritime Transport 2023. UNCTAD 2023. Available online: https://unctad.org/publication/review-maritime-transport-2023 (accessed on 17 May 2024).
  2. International Maritime Organization. Annex 15, Resolution MEPC.377(80). 2023 Strategy on Reduction of GHG Emissions from Ships. Available online: https://wwwcdn.imo.org/localresources/en/OurWork/Environment/Documents/annex/MEPC%2080/Annex%2015.pdf (accessed on 17 May 2024).
  3. SEC (2021) 562 Final. Regulation of the European Parliament and of the Council on the Use of Renewable and Low-Carbon Fuels in Maritime Transport and Amending Directive 2009/16/EC. Available online: https://eur-lex.europa.eu/legal-content/EN/ALL/?uri=COM:2021:562:FIN (accessed on 18 May 2024).
  4. DNV Report. Maritime Forecast to 2050. Available online: https://www.dnv.com/maritime/publications/maritime-forecast-2023/index.html (accessed on 18 May 2024).
  5. Maersk. Maersk to Deploy First Large Methanol-Enabled Vessel on Asia—Europe Trade Lane. 7 December 2023. Available online: https://www.maersk.com/news/articles/2023/12/07/maersk-to-deploy-first-large-methanol-enabled-vessel-on-asia-europe-trade-lane (accessed on 21 May 2024).
  6. Wartsila. Methanol as Marine Fuel—Is It the Solution You Are Looking For? 20 February 2023. Available online: https://www.wartsila.com/insights/article/methanol-fuel-for-thought-in-our-deep-dive-q-a (accessed on 20 May 2024).
  7. Reiter, A.J.; Kong, S.C. Combustion and emissions characteristics of compression-ignition engine using dual ammonia-diesel fuel. Fuel 2011, 90, 87–97. [Google Scholar] [CrossRef]
  8. French, J.M.B.; Northrop, W.J.; Ricketts, D.S. Ammonia as a transportation fuel: Challenges and opportunities. Proc. Inst. Mech. Eng. Part D J. Automob. Eng. 2006, 220, 785–800. [Google Scholar]
  9. Huang, Y.; Zhou, Y.; Xu, M.; Liu, X.; Zhang, Y.; Wang, J.; Li, Y.; Chen, H.; Guo, Q.; Zhang, Y.; et al. Formation and environmental impact of secondary aerosols from ammonia slip in diesel engine exhaust. Environ. Sci. Technol. 2020, 54, 2345–2353. [Google Scholar]
  10. Zhang, Y.; Li, J.; Huang, Y.; Chen, H.; Xu, M.; Zhang, Y.; Liu, X.; Zhou, Y.; Wang, J.; Guo, Q.; et al. Health effects of fine particulate matter and secondary aerosols formed from ammonia slip. Atmos. Environ. 2022, 265, 118736. [Google Scholar]
  11. Glibert, P.M.; Burkholder, J.M.; Anderson, D.M.; Coyne, K.J.; Dennison, W.C.; Glasgow, H.B.; Golisz, S.; Heil, C.A.; Hoagland, P.; Hutchins, D.A.; et al. Eutrophication and harmful algal blooms: A review of the past, present, and future. Harmful Algae 2015, 4, 12–33. [Google Scholar]
  12. Bricker, S.B.; Long, S.; Ward, S.; Weisman, W.; Tanguay, S.; McGinty, M.; McClain, M.; Batiuk, R.A.; Smith, D.E.; Johnson, K.M.; et al. Effects of nutrient enrichment on the water quality and eutrophication of coastal systems. Mar. Pollut. Bull. 2008, 56, 1844–1860. [Google Scholar]
  13. Jørgensen, B.B.; Kuhl, M.; Tiano, L.; Herndl, G.J.; Meyer-Reil, L.A.; Berg, P.; Canfield, D.E.; Des Marais, D.J.; Fennel, K.; Gundersen, J.K.; et al. The role of ammonia in marine ecosystems. Mar. Ecol. Prog. Ser. 2013, 475, 93–110. [Google Scholar]
  14. Smith, R.; Kim, J.; Lewis, D. Application of exhaust gas recirculation in CI engines. J. Mech. Eng. 2020, 42, 112–125. [Google Scholar]
  15. Johnson, A.; Lee, H. Effectiveness of wet scrubbers in reducing ammonia emissions. Environ. Eng. Sci. 2019, 36, 673–684. [Google Scholar]
  16. Wang, L.; Zhao, Y.; Zhang, Q. Ammonia oxidation catalysts for emission control. Catal. Rev. 2021, 63, 785–800. [Google Scholar]
  17. Brown, T.; Green, R.; Wilson, J. Selective catalytic reduction for NOx control in diesel engines. J. Emiss. Control. 2018, 12, 145–158. [Google Scholar]
  18. DNV Report 2024. New DNV Fuel Ready and Gas Fuelled Ammonia Class Notations Provide Maximum Flexibility to Tackle Shipping’s Carbon Curve. Available online: https://www.dnv.com/news/new-dnv-fuel-ready-and-gas-fuelled-ammonia-class-notations-provide-maximum-flexibility-to-tackle-shipping-s-carbon-curve-203646 (accessed on 24 May 2024).
  19. Ryu, K.; Zacharakis-Jutz, G.E.; Kong, S.C. Performance characteristics of compression-ignition engine using high concentration of ammonia mixed with dimethyl ether. Appl. Energy 2014, 113, 488–499. [Google Scholar] [CrossRef]
  20. Dimitriou, P.; Javaid, R. A review of ammonia as a compression ignition engine fuel. Int. J. Hydrogen Energy 2020, 45, 7098–7118. [Google Scholar] [CrossRef]
  21. Nadimi, E.; Przybyła, G.; Lewandowski, M.T.; Adamczyk, W. Effects of ammonia on combustion, emissions, and performance of the ammonia/diesel dual-fuel compression ignition engine. J. Energy Inst. 2023, 107, 101158. [Google Scholar] [CrossRef]
  22. Yousefi, A.; Guo, H.; Dev, S.; Liko, B.; Lafrance, S. Effects of ammonia energy fraction and diesel injection timing on combustion and emissions of an ammonia/diesel dual-fuel engine. Fuel 2022, 314, 122723. [Google Scholar] [CrossRef]
  23. Li, T.; Zhou, X.; Wang, N.; Wang, X.; Chen, R.; Li, S. A comparison between low and high-pressure injection dual-fuel modes of diesel-pilot-ignition ammonia combustion engines. J. Energy Inst. 2022, 102, 362–373. [Google Scholar] [CrossRef]
  24. Scharl, V.; Sattelmayer, T. Ignition and combustion characteristics of diesel piloted ammonia injections. Fuel Commun. 2022, 11, 100068. [Google Scholar] [CrossRef]
  25. Shin, J.; Park, S. Numerical analysis and optimization of combustion and emissions in an ammonia-diesel dual-fuel engine using an ammonia direct injection strategy. Energy 2024, 289, 130014. [Google Scholar] [CrossRef]
  26. Zhang, Z.; Long, W.; Dong, P.; Tian, H.; Tian, J.; Li, B.; Wang, Y. Performance characteristics of a two-stroke low speed engine applying ammonia/diesel dual direct injection strategy. Fuel 2023, 332, 126086. [Google Scholar] [CrossRef]
  27. Li, T.; Zhou, X.; Wang, N.; Wang, X.; Chen, R.; Li, S. Pilot diesel-ignited ammonia dual fuel low-speed marine engines: A comparative analysis of ammonia premixed and high-pressure spray combustion modes with CFD simulation. Renew. Sustain. Energy Rev. 2023, 173, 113108. [Google Scholar]
  28. Kruggel, O. Progress in the combustion technology of high performance diesel engines toward reduction of exhaust emissions without reduction of operation economy. In Proceedings of the Baden–Wurttemberg Technology Conference, Westborough, MA, USA, 12–14 June 1989; p. 14. [Google Scholar]
  29. Kakaee, A.H.; Rahnama, P.; Paykani, A. Influence of fuel composition on combustion and emissions characteristics of natural gas/diesel RCCI engine. J. Nat. Gas Sci. Eng. 2015, 25, 58–65. [Google Scholar] [CrossRef]
  30. Yang, B.; Xi, C.; Wei, X.; Zeng, K.; Lai, M.C. Parametric investigation of natural gas port injection and diesel pilot injection on the combustion and emissions of a turbocharged common rail dual-fuel engine at low load. Appl. Energy 2015, 143, 130–137. [Google Scholar] [CrossRef]
  31. Gatts, T.; Liu, S.; Liew, C.; Ralston, B.; Bell, C.; Li, H. An experimental investigation of incomplete combustion of gaseous fuels of a heavy-duty diesel engine supplemented with hydrogen and natural gas. Int. J. Hydrogen Energy 2012, 37, 7848–7859. [Google Scholar] [CrossRef]
  32. Wang, C.; Yang, Y.; Yang, J. Numerical simulation of ammonia combustion in a marine diesel engine using a multi-zone combustion model. Proc. Inst. Mech. Eng. Part M J. Eng. Marit. Environ. 2021, 235, 282–293. [Google Scholar]
  33. Togashi, M.; Nishimura, S.; Ishikawa, K.; Yamada, Y. Multi-zone modeling of ammonia combustion in a marine diesel engine. J. Mar. Sci. Technol. 2021, 26, 275–287. [Google Scholar]
  34. Sato, K.; Suzuki, Y.; Takagi, Y.; Hasegawa, H. Development of a multi-zone combustion model for ammonia combustion in diesel engines. Energy 2020, 208, 118387. [Google Scholar]
  35. AVL BOOST Simulation Software. Available online: https://www.avl.com/en/simulation-solutions (accessed on 2 June 2024).
  36. Mollenhauer, K.; Tschöke, H. Handbook of Diesel Engines; Springer: Berlin/Heidelberg, Germany, 2010; 636p. [Google Scholar]
  37. Heywood, J.B. Internal Combustion Engine Fundamentals; McGraw-Hill Education: New York, NY, USA, 1988; 930p. [Google Scholar]
  38. Drazdauskas, M.; Lebedevas, S. Optimization of combustion cycle energy efficiency and exhaust gas emissions of marine dual-fuel engine by intensifying ammonia injection. J. Mar. Sci. Eng. 2024, 12, 309. [Google Scholar] [CrossRef]
  39. Woodyard, D. Medium speed engines—Introduction. In Marine Diesel Engines; Elsevier: Amsterdam, The Netherlands, 2004; pp. 498–516. [Google Scholar]
  40. Glarborg, P.; Miller, J.A.; Ruscic, B.; Klippenstein, S.J. Modeling nitrogen chemistry in combustion. Prog. Energy Combust. Sci. 2018, 67, 31–68. [Google Scholar] [CrossRef]
  41. Dukowicz, J.K. A Particle-fluid numerical model for liquid sprays. J. Comput. Phys. 1980, 35, 229–253. [Google Scholar] [CrossRef]
  42. Schiller, L.; Naumann, A. A Drag Coefficient Correlation. VDI Ztg. 1933, 77, 318–320. [Google Scholar]
  43. Abramzon, B.; Sirignano, W.A. Droplet vaporization model for spray combustion calculations. In Proceedings of the AIAA 26th Aerospace Sciences Meeting, Reno, NV, USA, 11–14 January 1988. [Google Scholar]
  44. ISO 8178-1:2017; Internal Combustion Engines—Exhaust Emission Measurement—Part 1: Test Cycle for Diesel Engines. Available online: https://www.iso.org/standard/64710.html (accessed on 10 June 2024).
  45. Schulte, H.; Duernholz, M.; Wuebbeke, K. The Contribution of the fuel injection system to meeting future demands on truck diesel engines. SAE Trans. 1990, 99, 157–162. [Google Scholar]
  46. MTU, Deutsche Aerospace. Series 396 Engines; VTS 05076 (520 E); MTU, Deutsche Aerospace: Munich, Germany, 1990; 22p. [Google Scholar]
  47. Shundoh, S.; Kakegawa, T.; Tsujimura, K.; Kobayashi, S. The effect of injection parameters and swirl on diesel combustion with high pressure fuel injection. SAE Trans. 1991, 100, 793–805. [Google Scholar]
  48. Stas, M.; Wajand, J.; Bestimmung, D.V. Parameters for the two-phase combustion process in direct injection diesel engines. MTZ Mot. 1988, 49, 289–293. [Google Scholar]
  49. Lyon, R.K. The chemistry of the thermal DeNOx process: A review of the thechnology’s possible application to control of NOx from diesel engines. In Proceedings of the 7th Diesel Engine Emissions Reduction (DEER) Workshop 2001, Portsmouth, VA, USA, 5–9 August 2001. [Google Scholar]
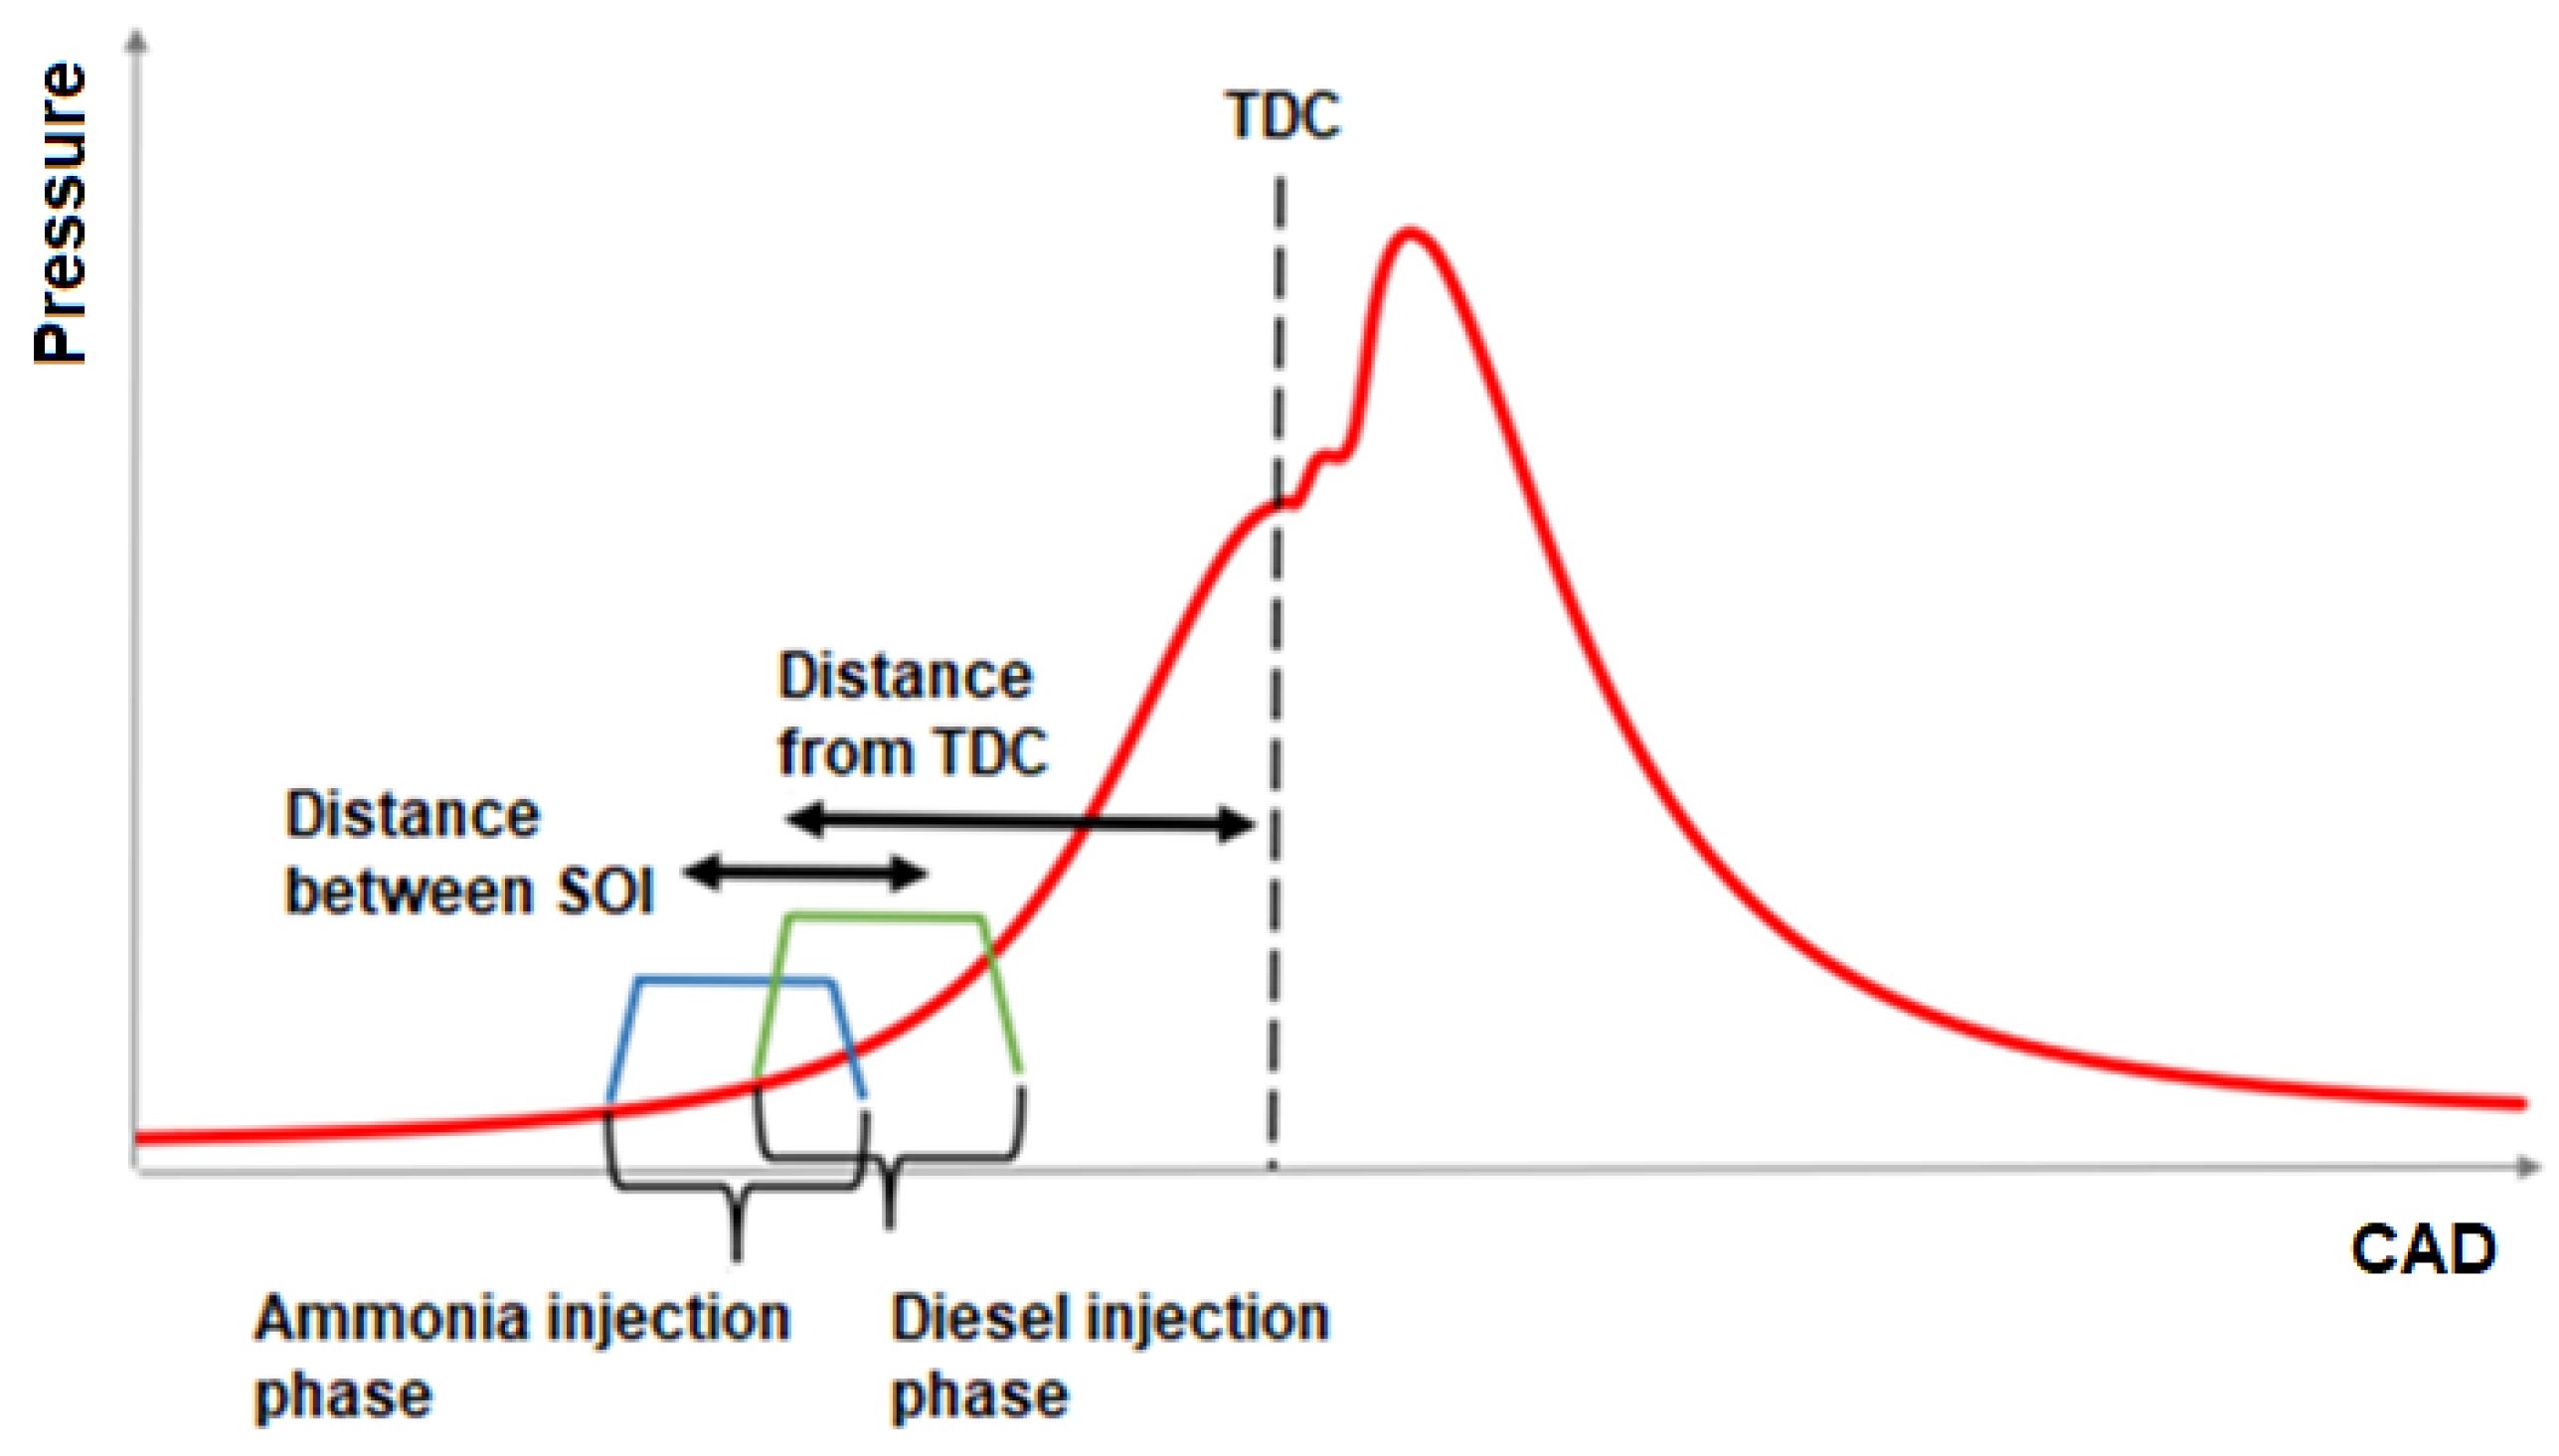
Figure 1. Optimization scheme for dual-fuel injection phases.
Jmse 12 01340 g001
Figure 2. (a) Injector nozzle hole arrangement (0° angle) inside combustion chamber sector; (b) 1/5 (72°) combustion chamber sector mesh.
Jmse 12 01340 g002
Figure 3. Diagram of heat release rate at different angles of ammonia injection initiation, with the start of diesel injection held constant at 717° CAD.
Jmse 12 01340 g003
Figure 4. (a) Combustion chamber temperature fields in Case A695/D717 at 725°, 735°, 745° CAD; (b) Combustion chamber temperature fields in Case A715/D717 at 725°, 735°, 745° CAD.
Jmse 12 01340 g004
Figure 5. Diagram of integral of heat release at different angles of ammonia injection initiation, with the start of diesel injection held constant at 717° CAD.
Jmse 12 01340 g005
Figure 6. Comparison of Pmax, Tmax, and ITE at different angles of ammonia injection initiation, with the start of diesel injection held constant at 717° CAD.
Jmse 12 01340 g006
Figure 7. Combustion cycle indicator diagram at different angles of ammonia injection initiation, with the start of diesel injection held constant at 717° CAD.
Jmse 12 01340 g007
Figure 8. Combustion cycle temperature diagram at different angles of ammonia injection initiation, with the start of diesel injection held constant at 717° CAD.
Jmse 12 01340 g008
Figure 9. Comparison of exhaust gas emissions at different angles of ammonia injection initiation, with the start of diesel injection held constant at 717° CAD.
Jmse 12 01340 g009
Figure 10. Diagram of heat release rate at different angles of ammonia injection initiation, with the start of diesel injection maintained at 7° CAD after ammonia injection.
Jmse 12 01340 g010
Figure 11. Diagram of integral of heat release at different angles of ammonia injection initiation, with the start of diesel injection maintained at 7° CAD after ammonia injection.
Jmse 12 01340 g011
Figure 12. Combustion cycle indicator diagram at different angles of ammonia injection initiation, with the start of diesel injection maintained at 7° CAD after ammonia injection.
Jmse 12 01340 g012
Figure 13. Combustion cycle temperature diagram at different angles of ammonia injection initiation, with the start of diesel injection maintained at 7° CAD after ammonia injection.
Jmse 12 01340 g013
Figure 14. Comparison of Pmax, Tmax, and ITE at different angles of ammonia injection initiation, with the start of diesel injection maintained at 7° CAD after ammonia injection.
Jmse 12 01340 g014
Figure 15. Comparison of exhaust gas emissions at different angles of ammonia injection initiation, with the start of diesel injection maintained at 7° CAD after ammonia injection.
Jmse 12 01340 g015
Figure 16. Comparison of optimized combustion cycle results with D100.
Jmse 12 01340 g016
Table 1. Initial data used for simulation.
ParameterDiesel (D100)Ammonia + Diesel (D5/A95)
Case D100 start of injection, CAD710°-
Case A695/D702 start of injection, CAD-695° NH3; 702° Pilot
Case A700/D707 start of injection, CAD-700° NH3; 707° Pilot
Case A705/D712 start of injection, CAD-705° NH3; 712° Pilot
Case A710/D717 start of injection, CAD-710° NH3; 717° Pilot
Case A715/D722 start of injection, CAD-715° NH3; 722° Pilot
Case A695/D717 start of injection, CAD-695° NH3; 717° Pilot
Case A700/D717 start of injection, CAD-700° NH3; 717° Pilot
Case A705/D717 start of injection, CAD-705° NH3; 717° Pilot
Case A715/D717 start of injection, CAD-715° NH3; 717° Pilot
Diesel injection duration, CAD26°
Ammonia injection duration, CAD-26°
Injected mass (Diesel), g1.870.1037
Injected mass (Ammonia), g-4.016
Injection pressure (Diesel), bar500500
Injection pressure (Ammonia), bar-1000
Diesel calorific value, MJ/kg42.5
Ammonia calorific value, MJ/kg18.8
Table 2. Comparison of dual ammonia–diesel fuel combustion cycle research results with results from the literature review [23,27].
Case 1Case 2
ParameterPinj 500 barLi, T. et al. [23]Pinj 1000 barLi, T. et al. [27]
Engine type4-stroke4-stroke4-stroke2-stroke
Bore, mm46095460340
Stroke, mm5801025801600
Engine speed, RPM5001000500157
Dual-fuel ratioD5/A95D3/A97D5/A95D3/A97
Diesel injector nozzle hole number108104
Ammonia injector nozzle hole number108104
Diesel and ammonia injector nozzle hole angle
Diesel injection pressure, bar500600500200
Ammonia injection pressure, bar50060010001000
Start of diesel injection, CAD−3° TDC−8° TDC−3° TDC−4° TDC
Start of ammonia injection, CAD−10° TDC−5° TDC−10° TDC−2° TDC
Ammonia ignition delay after diesel ignition, CAD
* Pmax, %>17>8<9<10
* Tmax, %>2>7<100
* T at 60° CAD ATDC, %>5>7>7>20
* ITE, %<2.20<4.6>1.1
* CO2, %>94>96>94>96
* NOx, %>72>50>5>46
N2O, g/kWhfrom 0.003 to 1.67from 0 to 25 ppmfrom 0.003 to 1.22from 0.0007 to 0.0016
Unburned NH3, g/kWhfrom 0.011 to 8.94from 0 to 130 ppmfrom 0.011 to 1.51N/A
* Relative change in parameters compared to diesel (D100) combustion cycle results. Symbol ‘<’ refers to increase, and ‘>’ refers to decrease.
Table 3. Emissions assessment according to E2 cycle: NOx, CO2, and GHG according to IMO MARPOL VI and EU 2030–2050 targets.
ParameterEngine Parameters under the E2 Cycle, IMO MARPOL VI Annex VI
Engine load, %1007550
Impact coefficient0.20.50.3
Emissions with D100 fuel, including impact coefficientSum of E2 cycle emissions, g/kWh
NOx, g/kWh1.092.402.175.7
CO2, g/kWh106.37281.98191.64580.0
GHG, g/kWh110.10342.06273.40725.6
Emissions with D5/A95 fuel, including impact coefficient
NOx, g/kWh1.282.350.324.0
CO2, g/kWh6.7217.0412.8136.6
GHG, g/kWh46.71187.9560.26294.9
Emissions regulation targets
NOx limit per IMO Reg. 13, g/kWhTier I—13.0Tier II—10.5Tier III—2.6
Year 2030Year 2040Year 2050
IMO EEXI (CO2)40%--
IMO GHG20–30%70–80%100%
EU GHG55%-90%
Calculated limit for D100 fuel, used as the basis for the D5/A95 limit, g/kWh
IMO EEXI (CO2)348.0--
IMO GHG580.4–507.9217.7–145.10
EU GHG326.5-72.6
Actual result for D5/A95 fuel, g/kWh
IMO EEXI (CO2)36.6
IMO GHG294.9
EU GHG294.9
Disclaimer/Publisher’s Note: The statements, opinions and data contained in all publications are solely those of the individual author(s) and contributor(s) and not of MDPI and/or the editor(s). MDPI and/or the editor(s) disclaim responsibility for any injury to people or property resulting from any ideas, methods, instructions or products referred to in the content.