Abstract
To reduce the resistance of high-speed displacement ships with Froude numbers (Fr) between 0.4 and 0.5, this paper proposes the installation of hydrofoils at the bow and stern of the ship. Firstly, starting from the bow wave, this paper proposes the installation of a flat plate appendage at the free surface of the ship’s bow to suppress the height of the bow wave and thus reduce the hull resistance. Taking the DTMB 5415 ship model as the research object, CFD calculation results show that installing a flat plate appendage at the free surface of the ship’s bow can effectively suppress the height of the bow wave, and the total resistance reduction ratio can reach 6.49% when Fr = 0.45. Then, the flat plate appendage was improved to a hydrofoil appendage, further reducing the hull resistance. As a result, the total resistance reduction rate can reach 9.15% at Fr = 0.45. Following this, hydrofoil appendages were installed simultaneously at the bow and stern. The drag reduction effect and mechanism were studied, and the results show that the hydrofoils at the bow and stern have a good drag reduction effect. Suppressing the bow and stern waves and improving the flow field are the main reasons for the drag reduction. Finally, the drag reduction effect of the hydrofoil appendages was verified through experiments, demonstrating its excellent drag reduction effect when Fr = 0.4–0.5 and a maximum total resistance reduction ratio of 14.552%.
1. Introduction
As the global economy continues to develop and people’s pace of life accelerates, the demand for fast and convenient maritime transportation is increasing. At the same time, fields such as military operations and maritime rescue also impose higher requirements on high-speed vessels. Research on the hydrodynamic performance of high-speed vessels is attracting more attention from researchers [1,2,3]. How to efficiently reduce the resistance of high-speed vessels is one of the key issues of concern among researchers. Ship resistance can be categorized into three categories: friction, viscous pressure, and wave-making resistance. The latter two types are collectively referred to as residual resistance. The ratio of each resistance component to the total resistance changes with the speed of the ship. For low-speed ships, frictional resistance is the main component of the total resistance, and typical methods for reducing it include the gas layer [4], microbubble [5], and hydrophobic coating [6].
Wave-making resistance increases sharply as the ship’s speed increases. For high-speed displacement ships, wave-making resistance is the main resistance component, accounting for more than 50% of the total resistance. Methods reducing the wave-making resistance include the bulbous bow [7,8], ship form optimization [9,10,11], and other methods.
The principle of reducing the wave-making resistance of the bulbous bow is that the wave-making of the bulbous bow and the bow shear wave of the hull form favorable interference when sailing, so that the wave-making resistance is reduced. The application of bulbous bow technology can achieve a good effect in reducing wave-making resistance in low-speed or medium-speed ships with a Froude number of less than 0.35, but it is difficult to reduce resistance in high-speed ships with a Froude number of more than 0.4.
The shape of the hull, especially the shape of the head and stern, affects the wave-making resistance, which can be reduced by optimizing the shape of the hull. Optimizing the shape of the ship has certain limitations: Ship shape optimization is generally optimized for a certain speed; hull shape optimization is effective only for a certain speed; and it is difficult to reduce the drag at other speeds. The optimization of ship shape is limited by the ship’s buoyancy, stability, carrying capacity, and other parameters, so the optimization effect is limited.
An alternative solution to reduce ship drag involves installing appendages on the hull. Stern flaps can reduce the wave-making resistance by improving the wakefield and reducing the wave-making at the stern. Maki et al. [12] investigated the drag reduction mechanism of stern flaps through towing tank model tests and CFD analysis. The results indicated that changes in attitude are not the primary cause of drag reduction by stern flaps. The stern flap influences a change in the wave pattern generated at the transom part, and this can result in a decrease in wave-making resistance, which is the main reason for the total resistance reduction. Moreover, Song et al. [13] used the 5415 ship model to simulate the stern flap drag reduction effect and concluded that when Fr was 0.28–0.41, the average drag reduction rate could reach 5.79%. At cruising speed (Fr = 0.28) and maximum speed (Fr = 0.41), the drag reduction rate reaches 3.84% and 5.84%, respectively. At the same time, the drag reduction mechanism analysis considered that the effect of stern flaps was mainly due to wave suppression, and improving the near and far wake flow fields reduced the wave-making resistance of ships, which is the main reason for the reduction in ship drag. Additionally, appendages used to reduce hull resistance also include interceptors [14,15], stern wedges [16,17], and hull vanes [18,19]. These appendages are installed at the stern, aiming to improve the flow field at the stern and reduce the wave at the stern without considering the influence on the drag due to the wave at the bow. However, the bow will also produce a large wave when the ship is sailing, significantly impacting the hull resistance. If the bow wave can be effectively reduced, it will positively impact ship drag reduction. Therefore, Wang et al. [20] proposed a new wave suppression and drag reduction plate mounted on the ship’s bow. For a ship model with a waterline length of 4.24 m, the total resistance was reduced by 6.67% and the residual resistance by 15.7% at the target speed (Fr = 0.44). Liu et al. [21] designed a curved bow appendage based on the bow waveform when Fr = 0.45. The test results show that this kind of appendage can restrain the bow wave height and reduce the hull resistance, with the maximum drag reduction rate exceeding 8%.
To summarize, bulbous bows are not effective in reducing resistance for high-speed displacement ships with Fr between 0.4 and 0.5. Hull form optimization is only effective in reducing resistance at a certain speed. Appendages used to reduce hull resistance are mainly installed at the stern without taking into account the effect of bow waves on resistance. To efficiently reduce the resistance of high-speed displacement ships with Fr between 0.4 and 0.5, a scheme of hydrofoil appendage installed at the waterplane of the bow is proposed in this paper. The drag reduction effect of the proposed scheme is studied through numerical simulation, with the corresponding results demonstrating its appealing drag reduction effect. Furthermore, the hydrofoil appendage is installed at the stern to form a combined hydrofoil appendage, and the drag reduction effect of the combined hydrofoil appendage is studied through numerical simulation and model tests. The research results indicate that the combined hydrofoil appendage strategy provides a good drag-reduction effect. Compared with existing appendages (such as the interceptor, stern wedge, and hull vane), the appendage scheme proposed in this paper takes into account the effect of bow waves on resistance. By installing the appendage on the free surface near the ship’s bow, the bow wave is effectively suppressed. The research presented here offers a new approach to drag reduction for high-speed vessels.
2. Numerical Simulation Method of a High-Speed Ship Model
This paper focuses on the drag reduction problem for high-speed displacement vessels with Fr in the range of 0.4 to 0.5. The scaled model employed throughout this research is the DTMB 5415, illustrated in Figure 1. The scale ratio of the model is 1:24.824, and its main parameters are reported in Table 1.
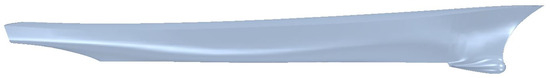
Figure 1.
Geometry of the ship model.

Table 1.
Main parameters of the ship model.
With the development of computer technology and CFD software, CFD has become mainstream in ship hydrodynamics research, posing an efficient and reliable fluid dynamics tool with high computational accuracy [22,23]. Thus, this paper uses the CFD as a virtual towing tank method to study the resistance performance of the DTMB 5415 ship model. CFD has revolutionized the design and analysis of marine vessels by serving as a powerful virtual towing tank [24,25,26]. Traditionally, physical models were tested in water tanks to evaluate hydrodynamic performance, such as resistance, propulsion, and maneuverability. However, CFD simulations offer several advantages over physical testing. The drag reduction appendage is designed based on the CFD method.
2.1. Governing Equations, Turbulence Model, and Free Surface Treatment
The resistance and flow field of ship model 5415 are calculated by solving the RANS equation, which has been successfully applied to predict ship resistance, providing results that agree well with the test data [27]. The RANS equation is mathematically expressed as follows:
where is the fluid density, t is time, and (i, j = 1, 2, 3) are the time-averaged velocity components, p is the time-averaged pressure, is the dynamic viscosity coefficient, is the Reynolds stress term, and is the source term.
Given that the Reynolds stress term of the turbulent pulsation value is introduced into the RANS equation, the stress expression should be established to close the equation. That is, the turbulence model equation should be introduced. This paper adopts the Shear Stress Transport (SST) turbulence model [28]. Furthermore, this study adopts the Eulerian multiphase flow model, which considers that the free surface is the interface of water and air and employs the volume of fluid (VOF) [29] to capture the free surface.
2.2. Computational Domain, Boundary Conditions, and Mesh Generation
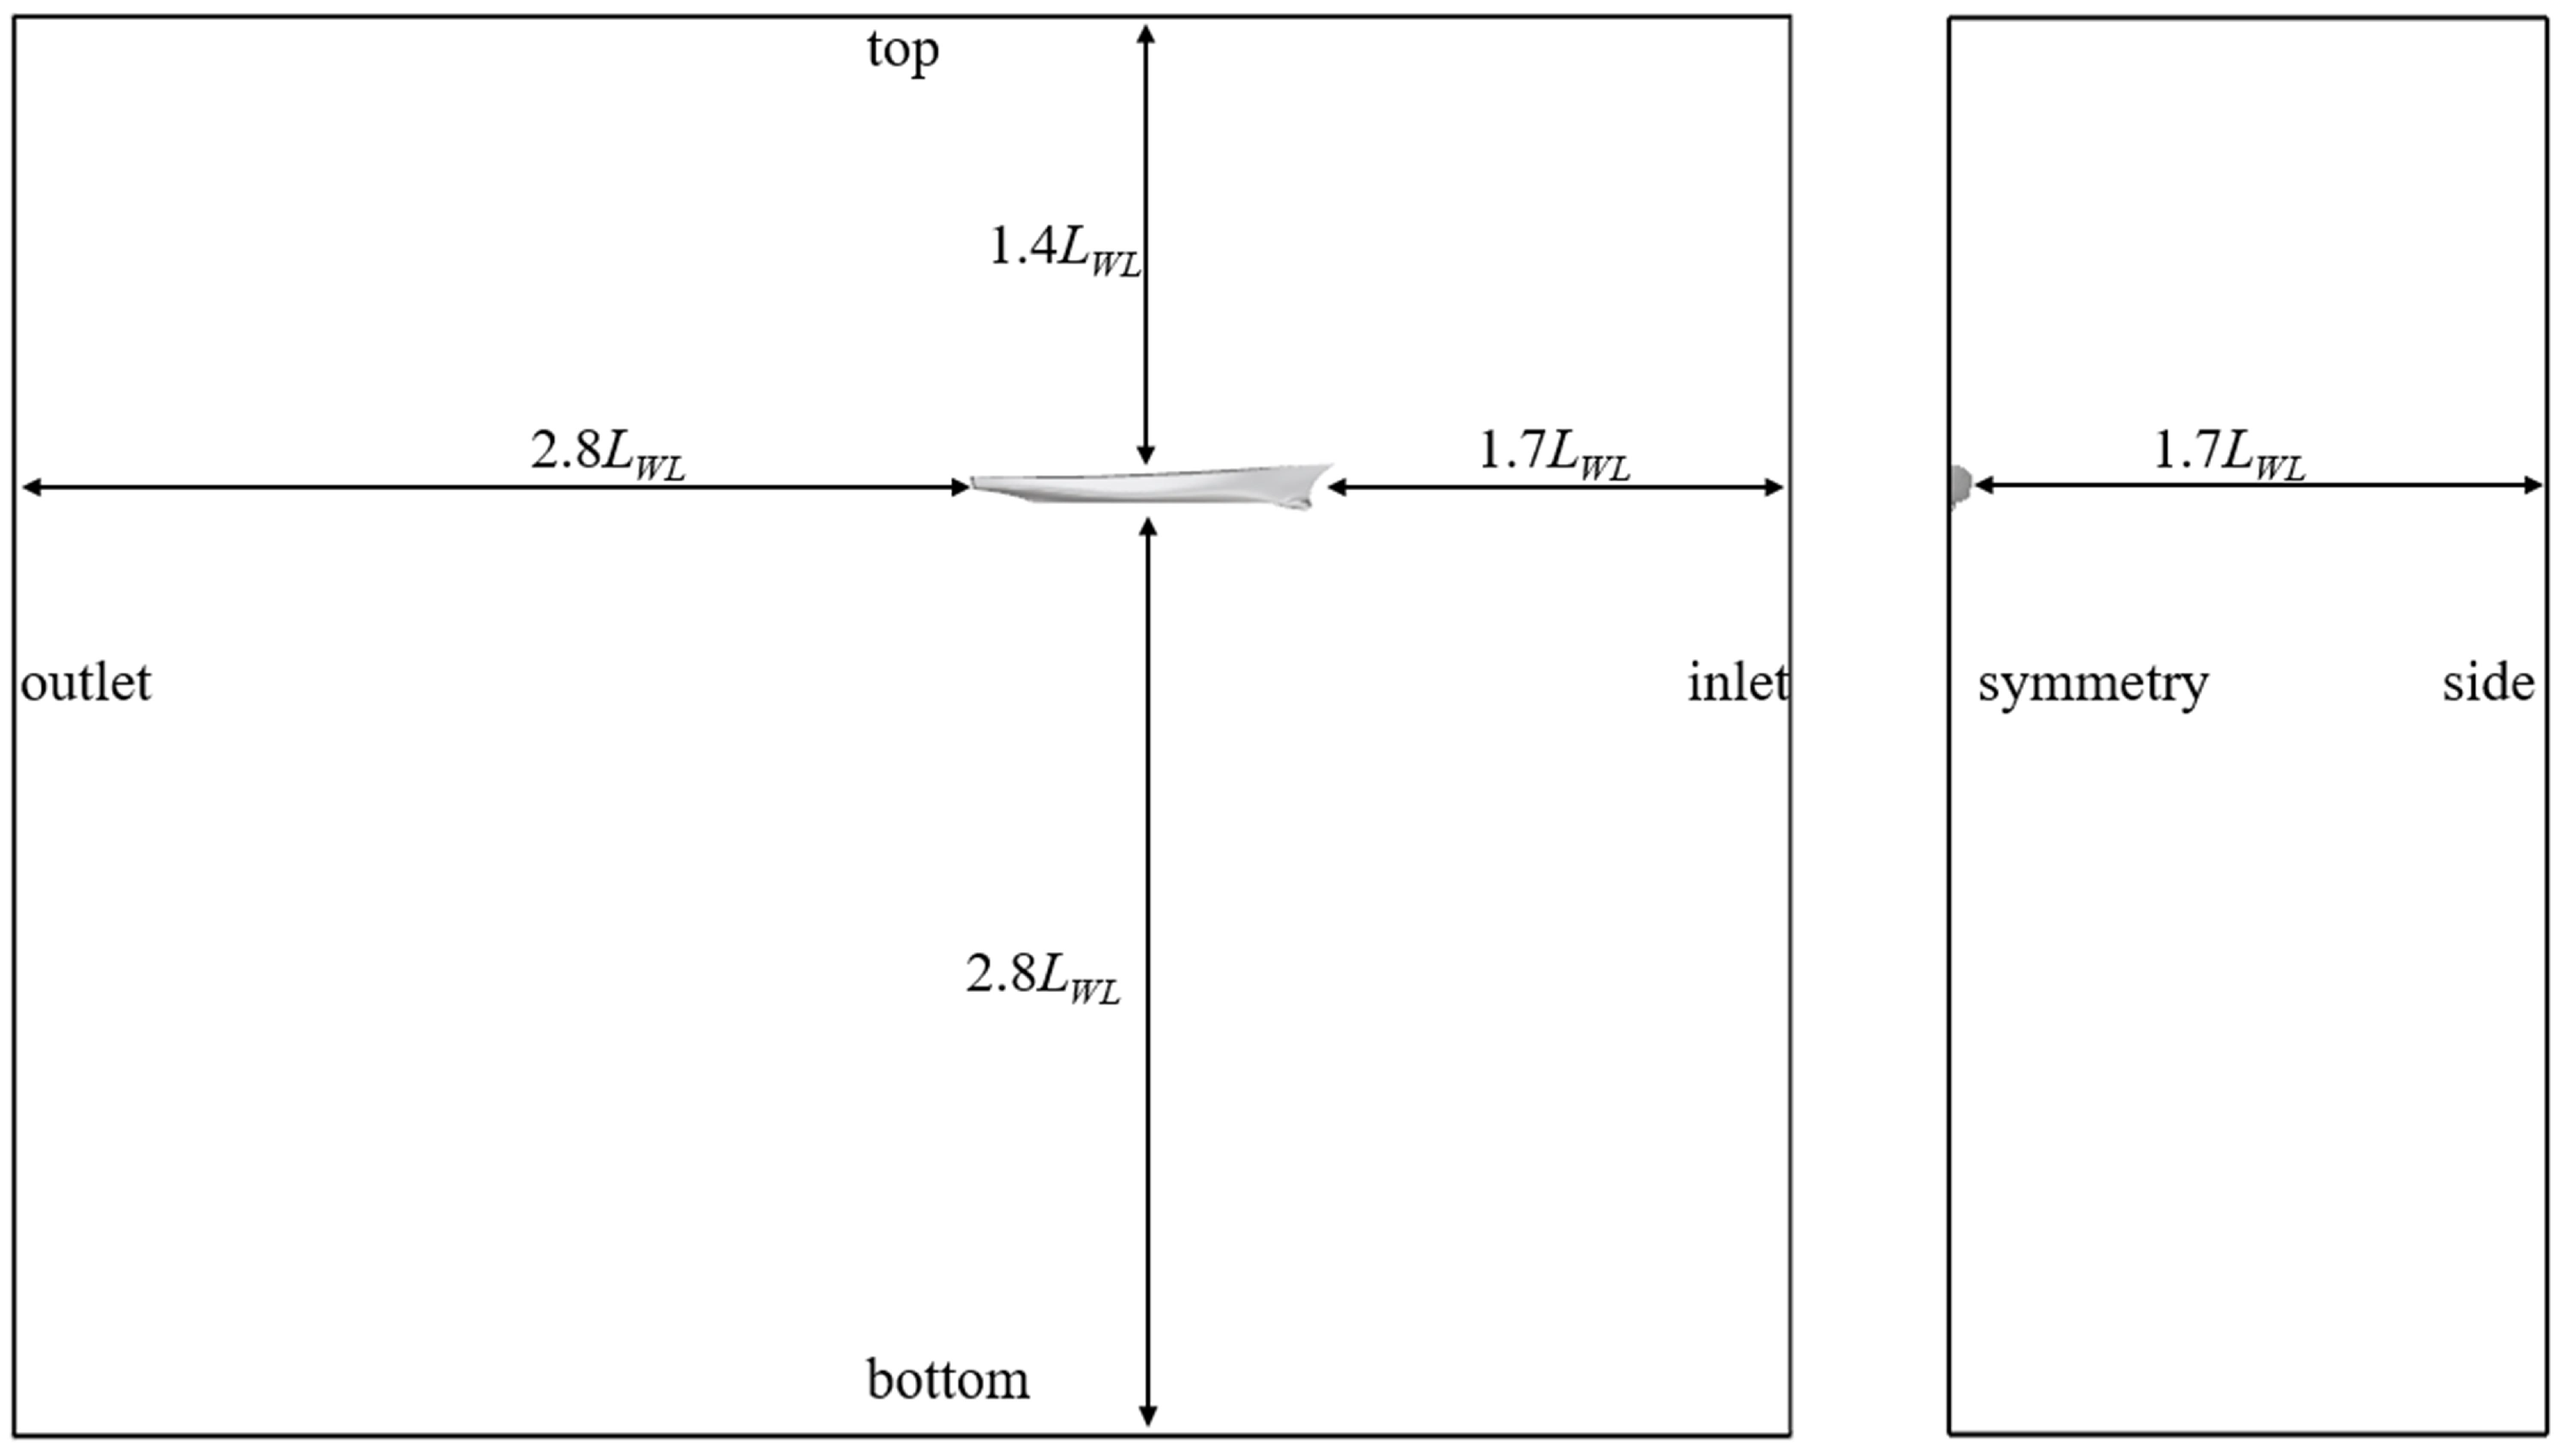
The computational domain is set to a cuboid of 5.5 × 1.7 × 4.2 that serves as a virtual towing tank. Due to the symmetry of the ship model and the flow field, the symmetry plane is used, and the calculations consider only half of the ship. Figure 2 depicts the size of the computational domain and the boundary conditions setup. The boundary conditions of the computational domain are set as follows: the inlet, top, and bottom are set as the velocity inlet, the outlet is the pressure outlet, the side is the non-slip wall, the longitudinal section of the hull is the symmetrical plane, and the hull surface is the non-slip wall.
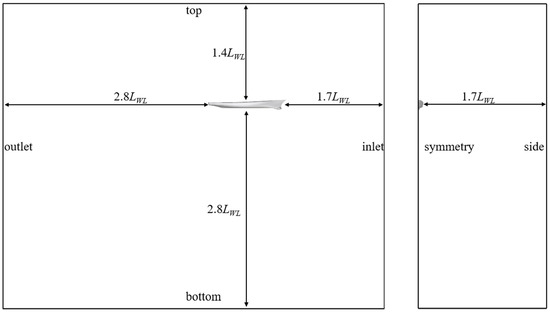
Figure 2.
Computational domain and boundary conditions.
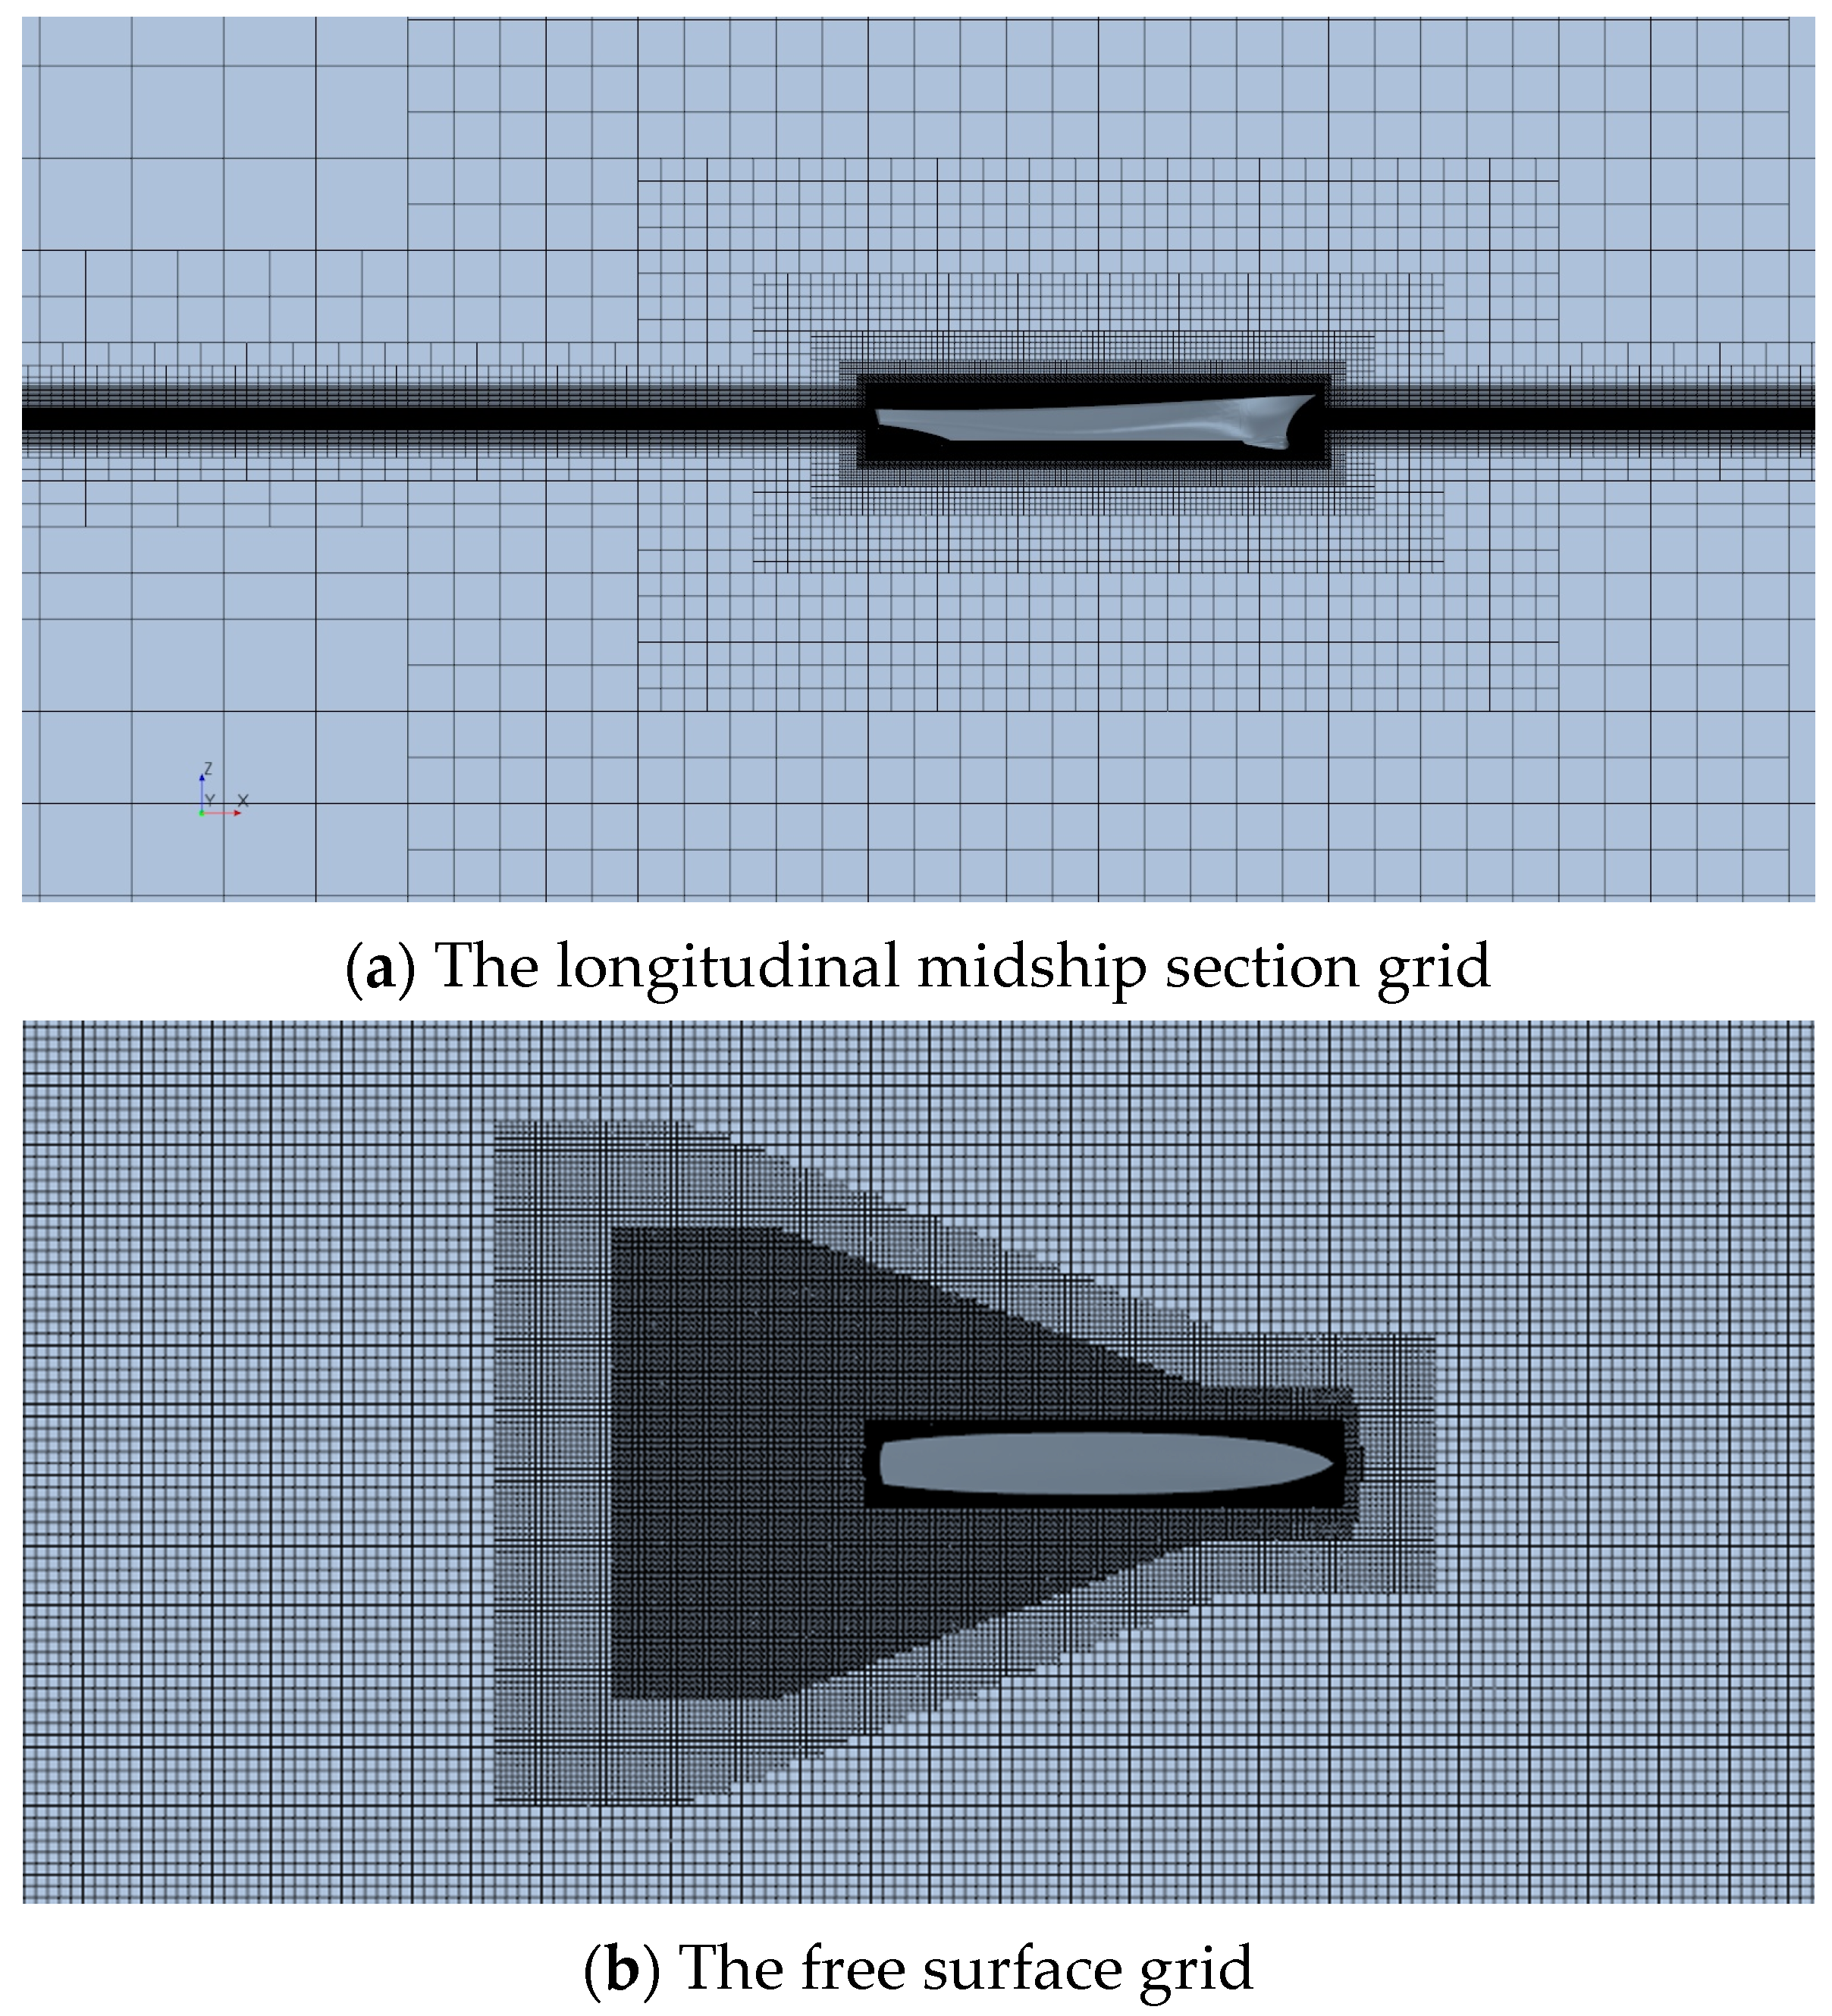
In order to ensure the accuracy of the numerical calculation results while considering the calculation cost, it is necessary to mesh the computational domain grid with a reasonable density distribution. This paper uses the commercial software package Star-CCM+ to generate the mesh, employing volume refinement near the free surface and surface refinement on the hull and appendages. Figure 3 depicts the mesh of the entire computational domain.
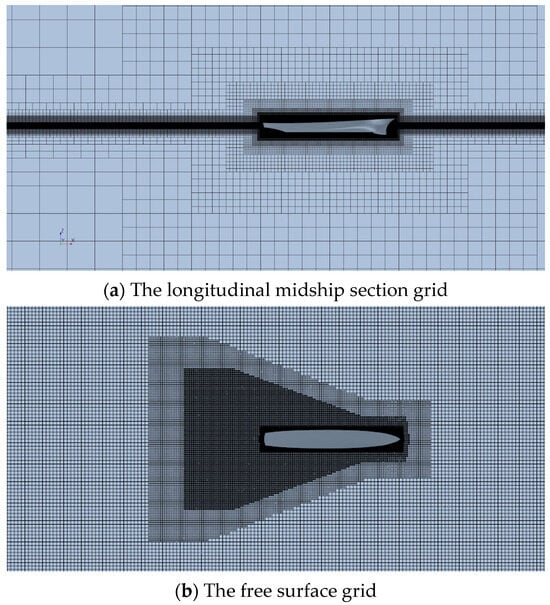
Figure 3.
Overview of computational domain grid.
2.3. Uncertainty Analysis of Grid Size
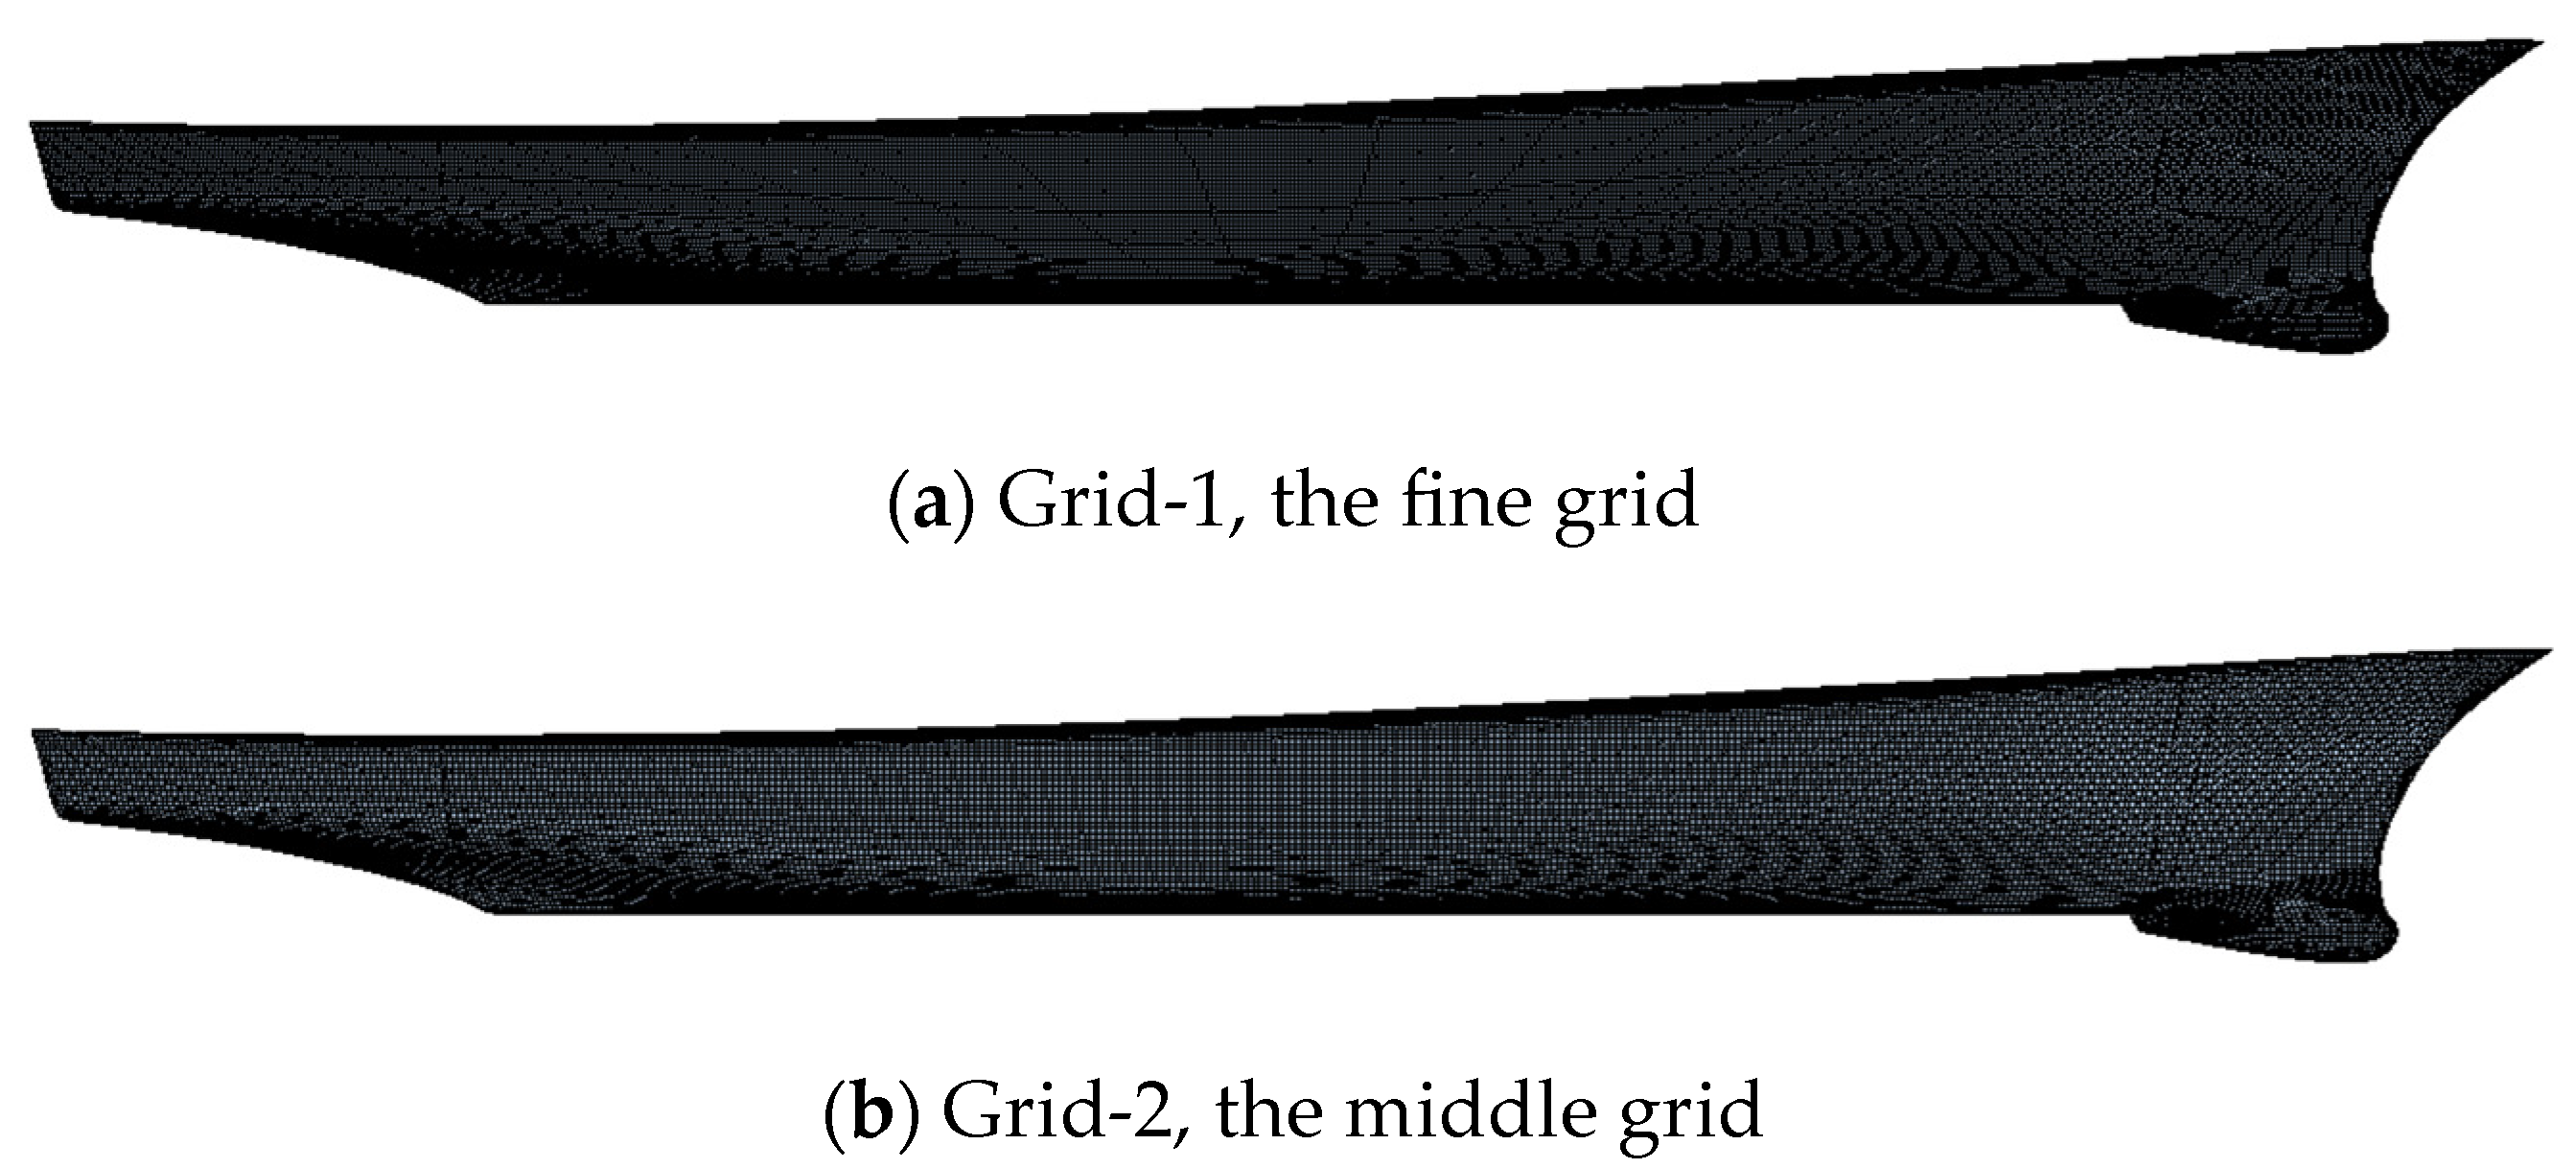
According to the procedures recommended by the 22nd ITTC [30], three sets of grids are generated by adjusting the grid base size with a grid refinement ratio of , as shown in Figure 4. Then, the resistance of the DTMB 5415 ship model at Fr = 0.45 (3.371 m/s) was calculated, and the time step was set to 0.01 s. The Y+ values of the ship surface below the free surface of the three grid sets were all between 30 and 150. Table 2 lists the number of grids and calculation results of the three grid schemes, where is the total resistance.
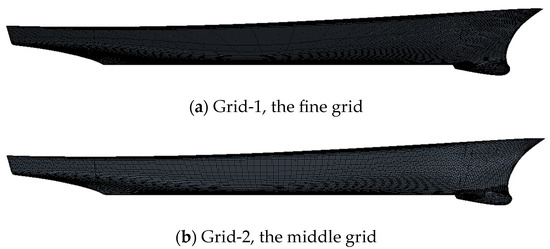
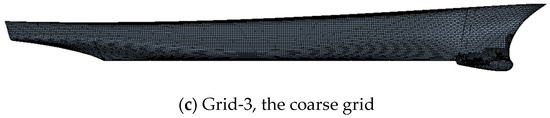
Figure 4.
Three sets of hull grids for uncertainty analysis.
Table 2.
Computed results for the three sets of grids when Fr = 0.45.
The following grid uncertainty analysis is conducted based on the calculation results presented in Table 2. Specifically, the difference between the resistance calculation results of two adjacent sets of grids is expressed as:
where , , and represent the computational results corresponding to fine, medium, and coarse grids. The grid convergence rate is expressed as:
The order of accuracy is estimated as follows:
The grid uncertainty is calculated by the following formula:
where , .
Table 3 reports the calculation results of grid uncertainty, revealing that the grid convergence rate is 0 < RG < 1, and the grid uncertainty is 0.284%D (D is the test value), indicating that the grid used has good monotone convergence. Considering the calculation accuracy and cost, the Grid-2 scheme is selected for calculation in the following studies.
Table 3.
Grid uncertainty results.
2.4. Time Step
In order to analyze the influence of the time step on the resistance calculation results, Grid-2 was used for the resistance calculation with different time steps, and the calculation results are shown in Table 4.
Table 4.
Effects of time step.
As can be seen from Table 4, within a certain range, the time step has little influence on the calculation results of resistance, and the difference between the calculation results of time step 0.04 s and 0.001 s is only 1.49%. In order to reduce the calculation time cost, the time step is set to 0.04 s in the following parts.
3. Numerical Calculation of Hydrofoil Appendages
3.1. Design of Bow Appendage
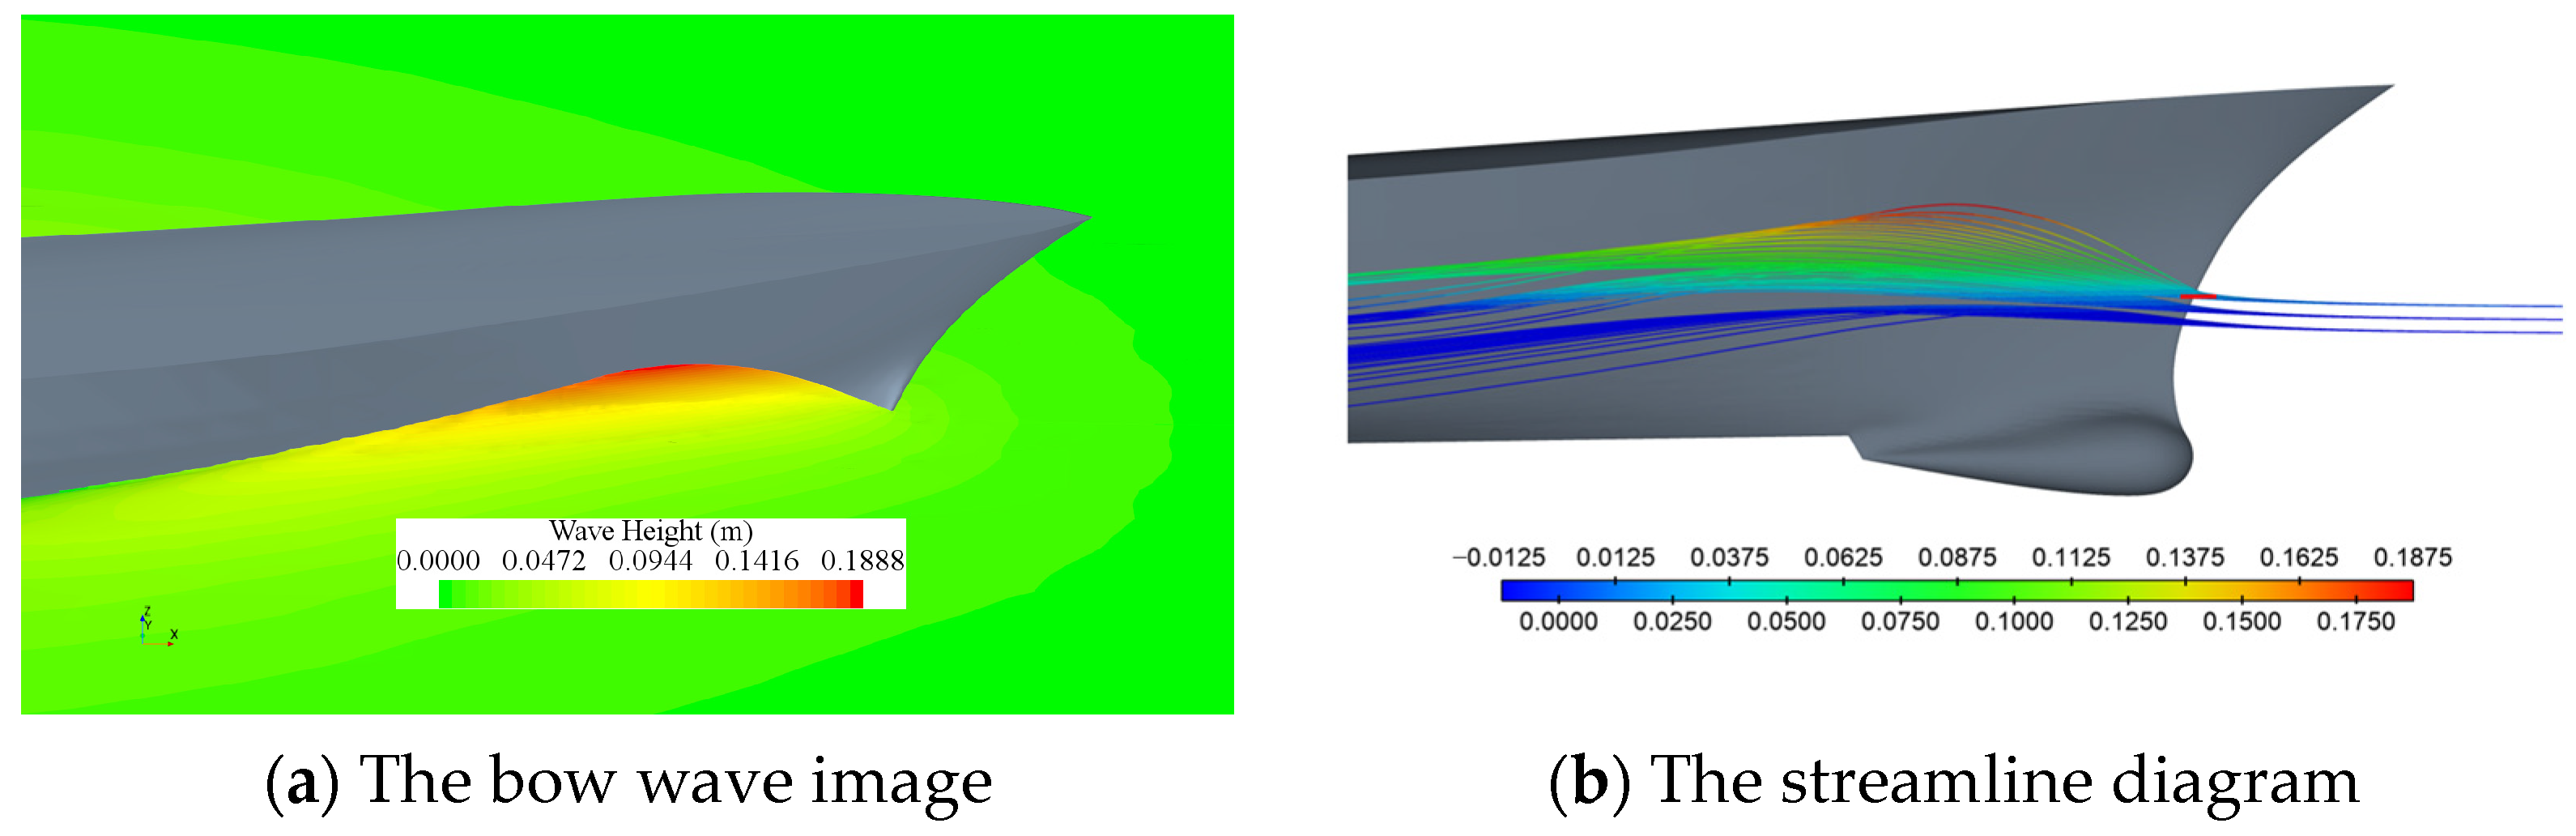
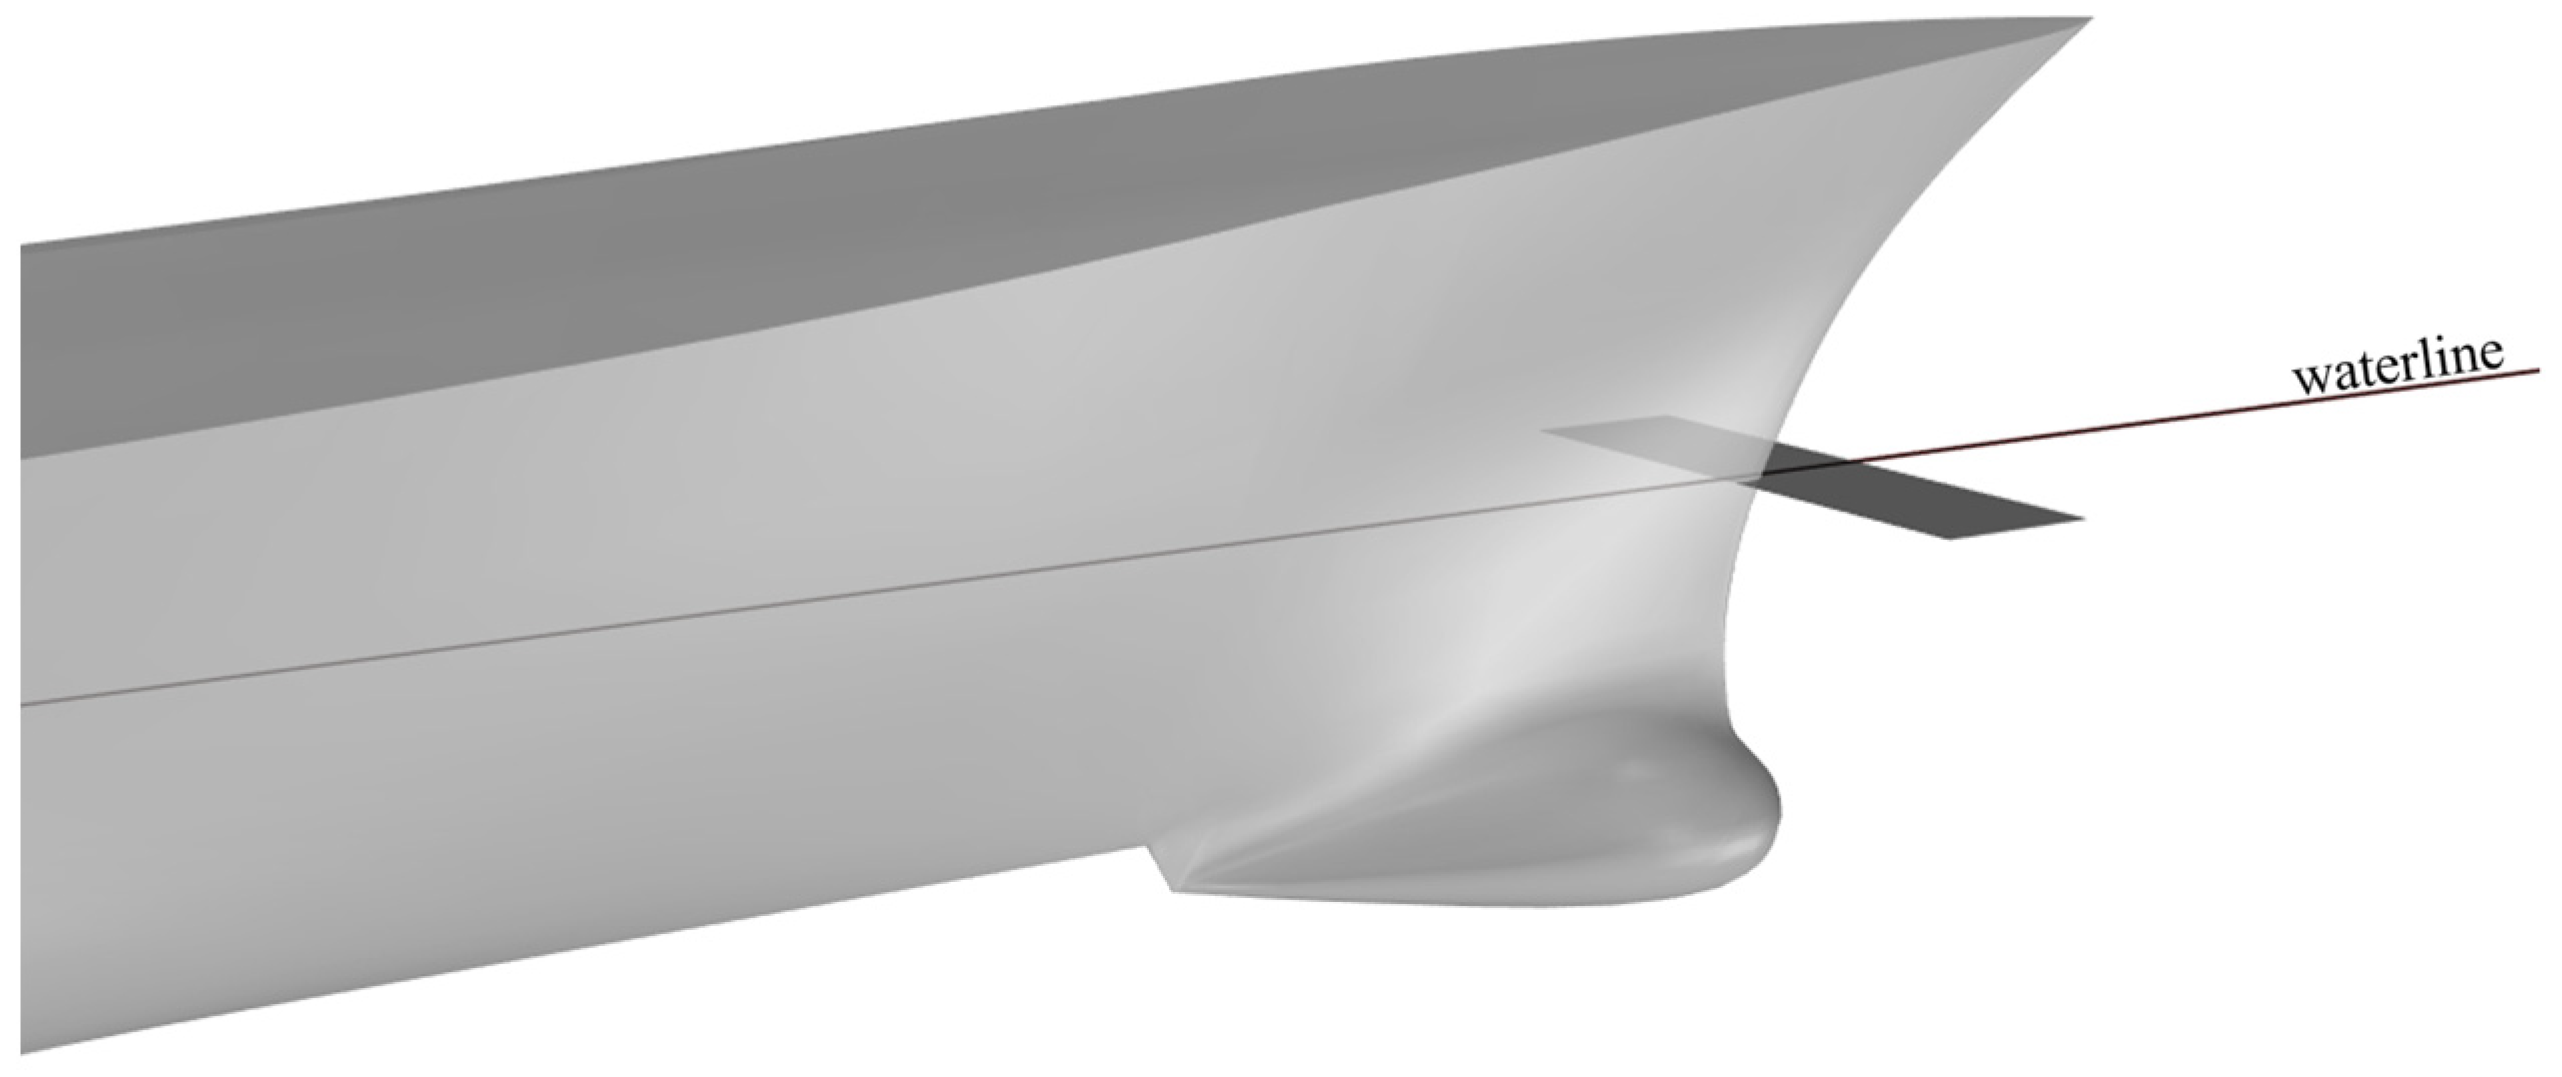
Figure 5a illustrates the bow wave image of the DTMB 5415 ship model at a speed of 3.371 m/s (Fr = 0.45), where it can be seen that a high wave is generated at the bow due to the excitation of the ship’s hull. Figure 5b is the streamline diagram near the free surface at the bow, from which it can be seen that the bow wave is mainly produced by the surface water at the free surface, and the bow wave starts to climb upwards at the stem post. In this paper, we hypothesize that by installing a small appendage at the free surface of the stem to block the upward climbing of the bow wave, the height of the bow wave will be reduced. Using the simplest shape, a flat plate as an appendage, set the length of the plate to 0.56 m, the width to 0.16 m, and the thickness to 0.001 m. The rear end of the plate is 0.04 m from the bow post, and its installation effect is shown in Figure 6. The selection of the plate size is based on the goal of covering the width of the wave as much as possible in the direction of the ship’s beam.

Figure 5.
Schematic diagram of the bow wave and streamline when Fr = 0.45.
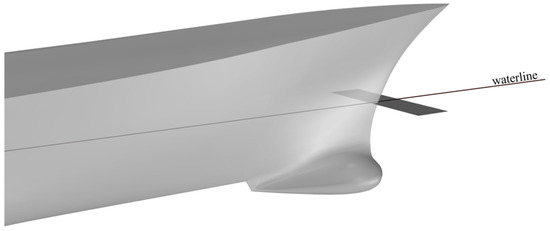
Figure 6.
Installation diagram of the bow flat plate appendage.
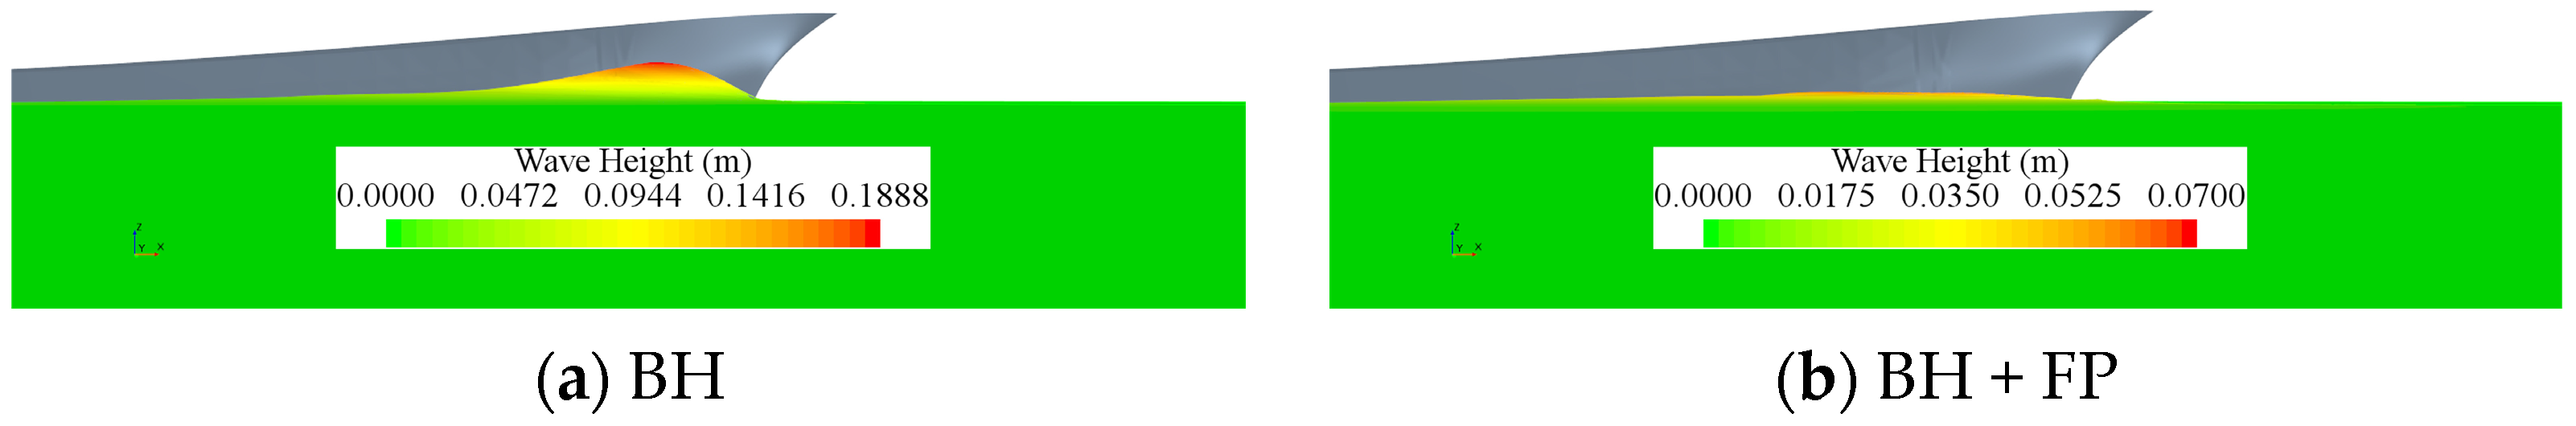
The numerical calculation method, previously verified, was used to calculate the model’s resistance and the bow wave after the installation of the flat plate appendage. In the calculations, the speed was set to 3.371 m/s, corresponding to Fr = 0.45. Figure 7 shows the comparison of the bow waves before and after the installation of the flat plate. In the figure, BH represents the bare hull, and FP denotes the flat plate appendage. It can be seen that there is a significant reduction in the bow wave after the installation of the flat plate appendage, leading to the inference that the ship’s resistance will be notably reduced.
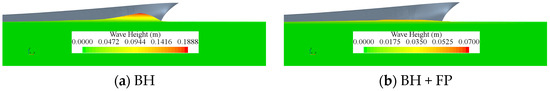
Figure 7.
Bow wave comparison before and after installing flat plate appendage when Fr = 0.45.
Table 5 shows the comparison of the total resistance, frictional resistance, and residual resistance of the hull with and without the flat plate appendage when Fr = 0.45. In the table, stands for the rate of total resistance change.
Table 5.
Resistance comparison of the hull with and without the plate appendage when Fr = 0.45.
From Table 5, it can be seen that after installing the flat plate appendage at the free surface of the bow post, the hull resistance is reduced. The total resistance decreases by 6.49%, the frictional resistance remains virtually unchanged, and the residual resistance is reduced by 10.44%.
The calculation results in Table 5 and the wave pattern comparison in Figure 7 confirm the aforementioned hypothesis: by installing a small appendage at the free surface of the bow post to obstruct the upward climbing of the bow wave, the height of the bow wave can be reduced, which in turn reduces the hull resistance.
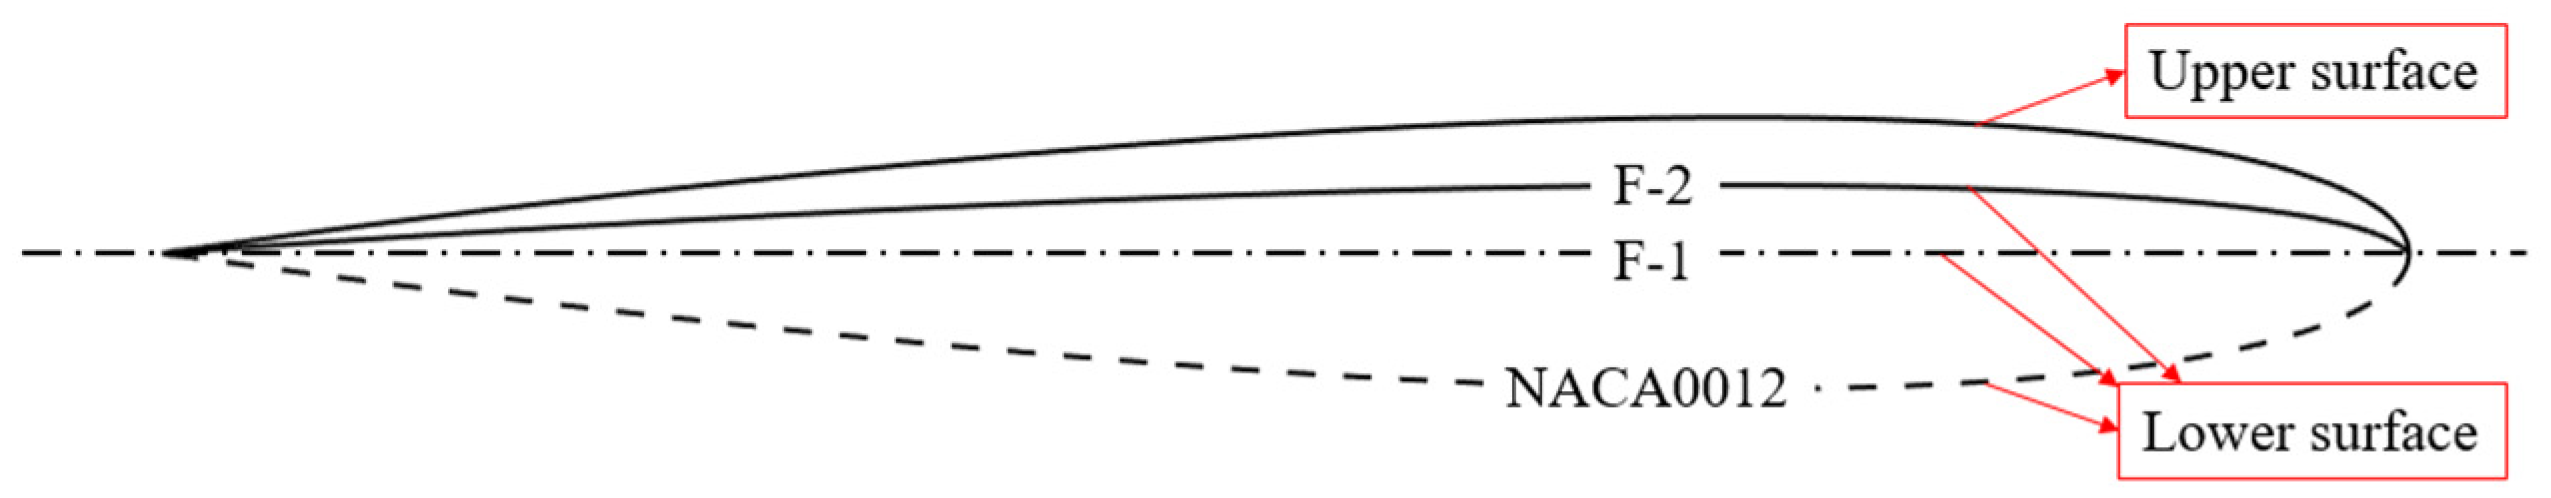
Then this paper improves the plate appendage into a flat-bottomed airfoil shape, maintaining the same length and width dimensions of the appendage, i.e., the chord length of the airfoil is 0.16 m and the span is 0.56 m, and keeping the installation position of the appendage unchanged. The NACA0012 airfoil is selected, and its lower half is removed, denoted as F-1, as shown in Figure 8.
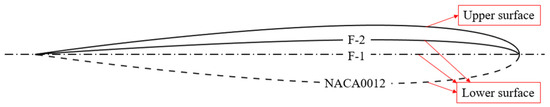
Figure 8.
Section shape of hydrofoil appendage.
Table 6 shows the comparison of the total resistance, frictional resistance, and residual resistance of the hull with and without the F-1 appendage when Fr = 0.45.
Table 6.
Resistance comparison of the hull with and without the F-1 appendage when Fr = 0.45.
From Table 6, it can be observed that after installing the F-1 appendage at the free surface of the bow post, the hull resistance can be further reduced. The total resistance decreases by 8.62%, the frictional resistance remains essentially unchanged, and the residual resistance is reduced by 13.87%.
Further modification involves changing the bottom profile of the flat-bottomed hydrofoil F-1 to a concave shape, which is designated as F-2, as shown in Figure 8.
Table 7 shows the comparison of the total resistance, frictional resistance, and residual resistance of the hull with and without the F-2 appendage at a speed of 3.371 m/s.
Table 7.
Resistance comparison of the hull with and without the F-2 appendage when Fr = 0.45.
From Table 7, it can be seen that after installing the F-2 appendage at the free surface near the ship’s bow, the hull resistance is further reduced. Specifically, the total resistance decreased by 9.15%, with almost no change in frictional resistance, while the residual resistance decreased by 14.33%.
Figure 9 shows the comparison of the bow wave before and after installing flat plate appendages, F-1 appendages, and F-2 appendages on the hull at Fr = 0.45. It can be seen from the figure that all three appendages can significantly reduce the bow wave height, with little difference in their effectiveness.
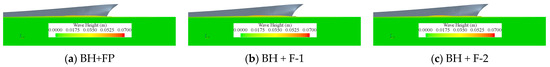
Figure 9.
Bow wave comparison before and after installing the three appendages when Fr = 0.45.
Table 8 lists the horizontal and vertical forces exerted on the three aforementioned appendages, where horizontal force is positive in the same direction as the forward direction of the ship and positive vertical force is defined as upward. From Table 8, it can be observed that the force experienced by the flat plate appendage in the horizontal direction is negative, whereas the forces experienced by the F-1 and F-2 appendages in the same direction are positive. This is one of the reasons why hydrofoil appendages can further reduce resistance compared to flat-plate appendages. Additionally, it is evident that all three appendages are subjected to upward vertical forces. Among them, the vertical forces acting on the three appendages gradually increase. The upward vertical force can alter the attitude of the hull, thereby affecting the hull’s resistance.
Table 8.
The horizontal and vertical forces of the three appendages.
Table 9 compares the changes in the ship’s trim and heave values before and after the installation of the previously mentioned three types of appendages.
Table 9.
The trim and sinkage comparison before and after installing the three appendages when Fr = 0.45.
From Table 9, it can be observed that installing the three appendages at the free surface level of the stem slightly increases the hull’s trim but improves the heave of the hull. The difference in trim values for the hull after installing the three appendages is not significant. However, the heave value corresponding to F-2 is notably less than that of the flat plate and F-1, which is the primary reason for F-2 having the best drag reduction effect. The following text focuses on the F-2 appendage as a drag-reducing device for investigation.
3.2. Analysis of Installation Position of Bow Appendage
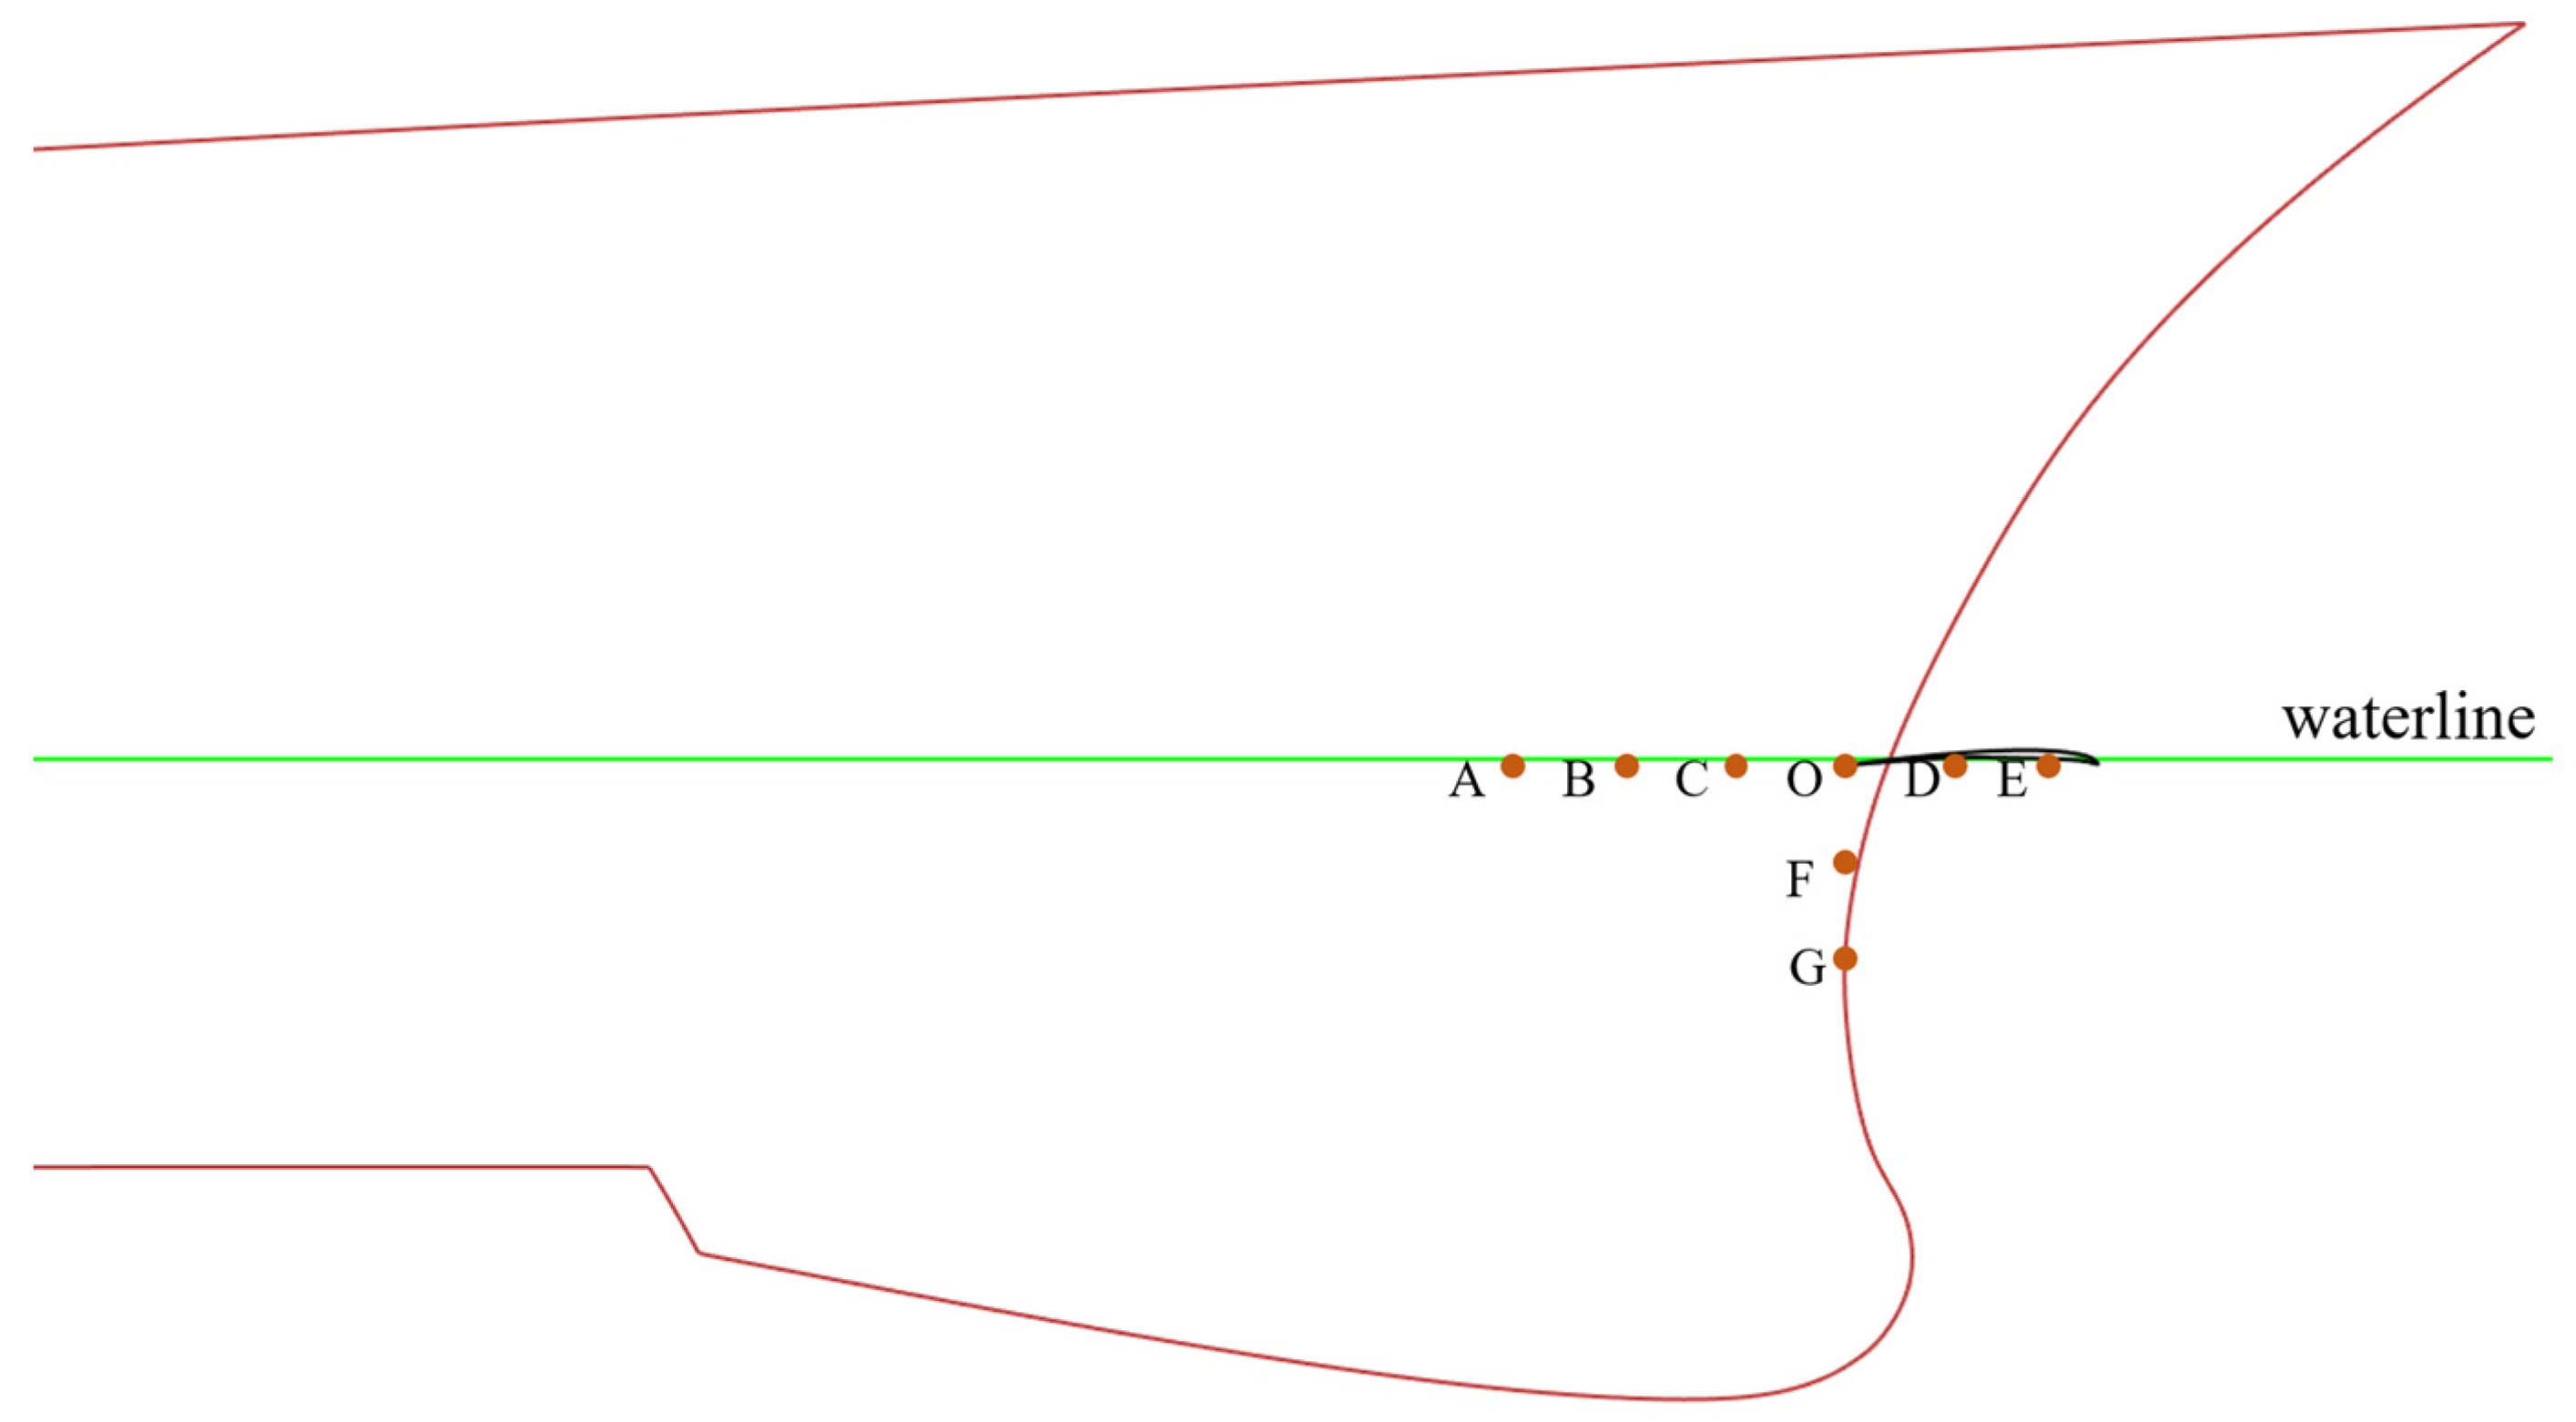
The drag reduction effect of the bow hydrofoil appendage F-2 is influenced by its installation position. A study was conducted on the influence of the F-2 appendage installation position on the drag reduction effect at 3.371 m/s. The position of the appendage is represented by the midpoint of the trailing edge of the appendage. Different installation positions of the F-2 appendage are shown in Figure 10, where the distance between adjacent positions is 0.05 m, and O represents the installation position of the F-2 appendage mentioned in the previous section.
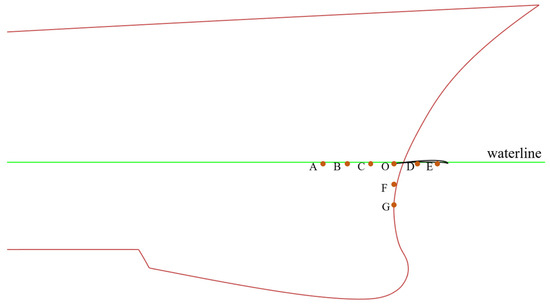
Figure 10.
Different installation positions of the F-2 appendage.
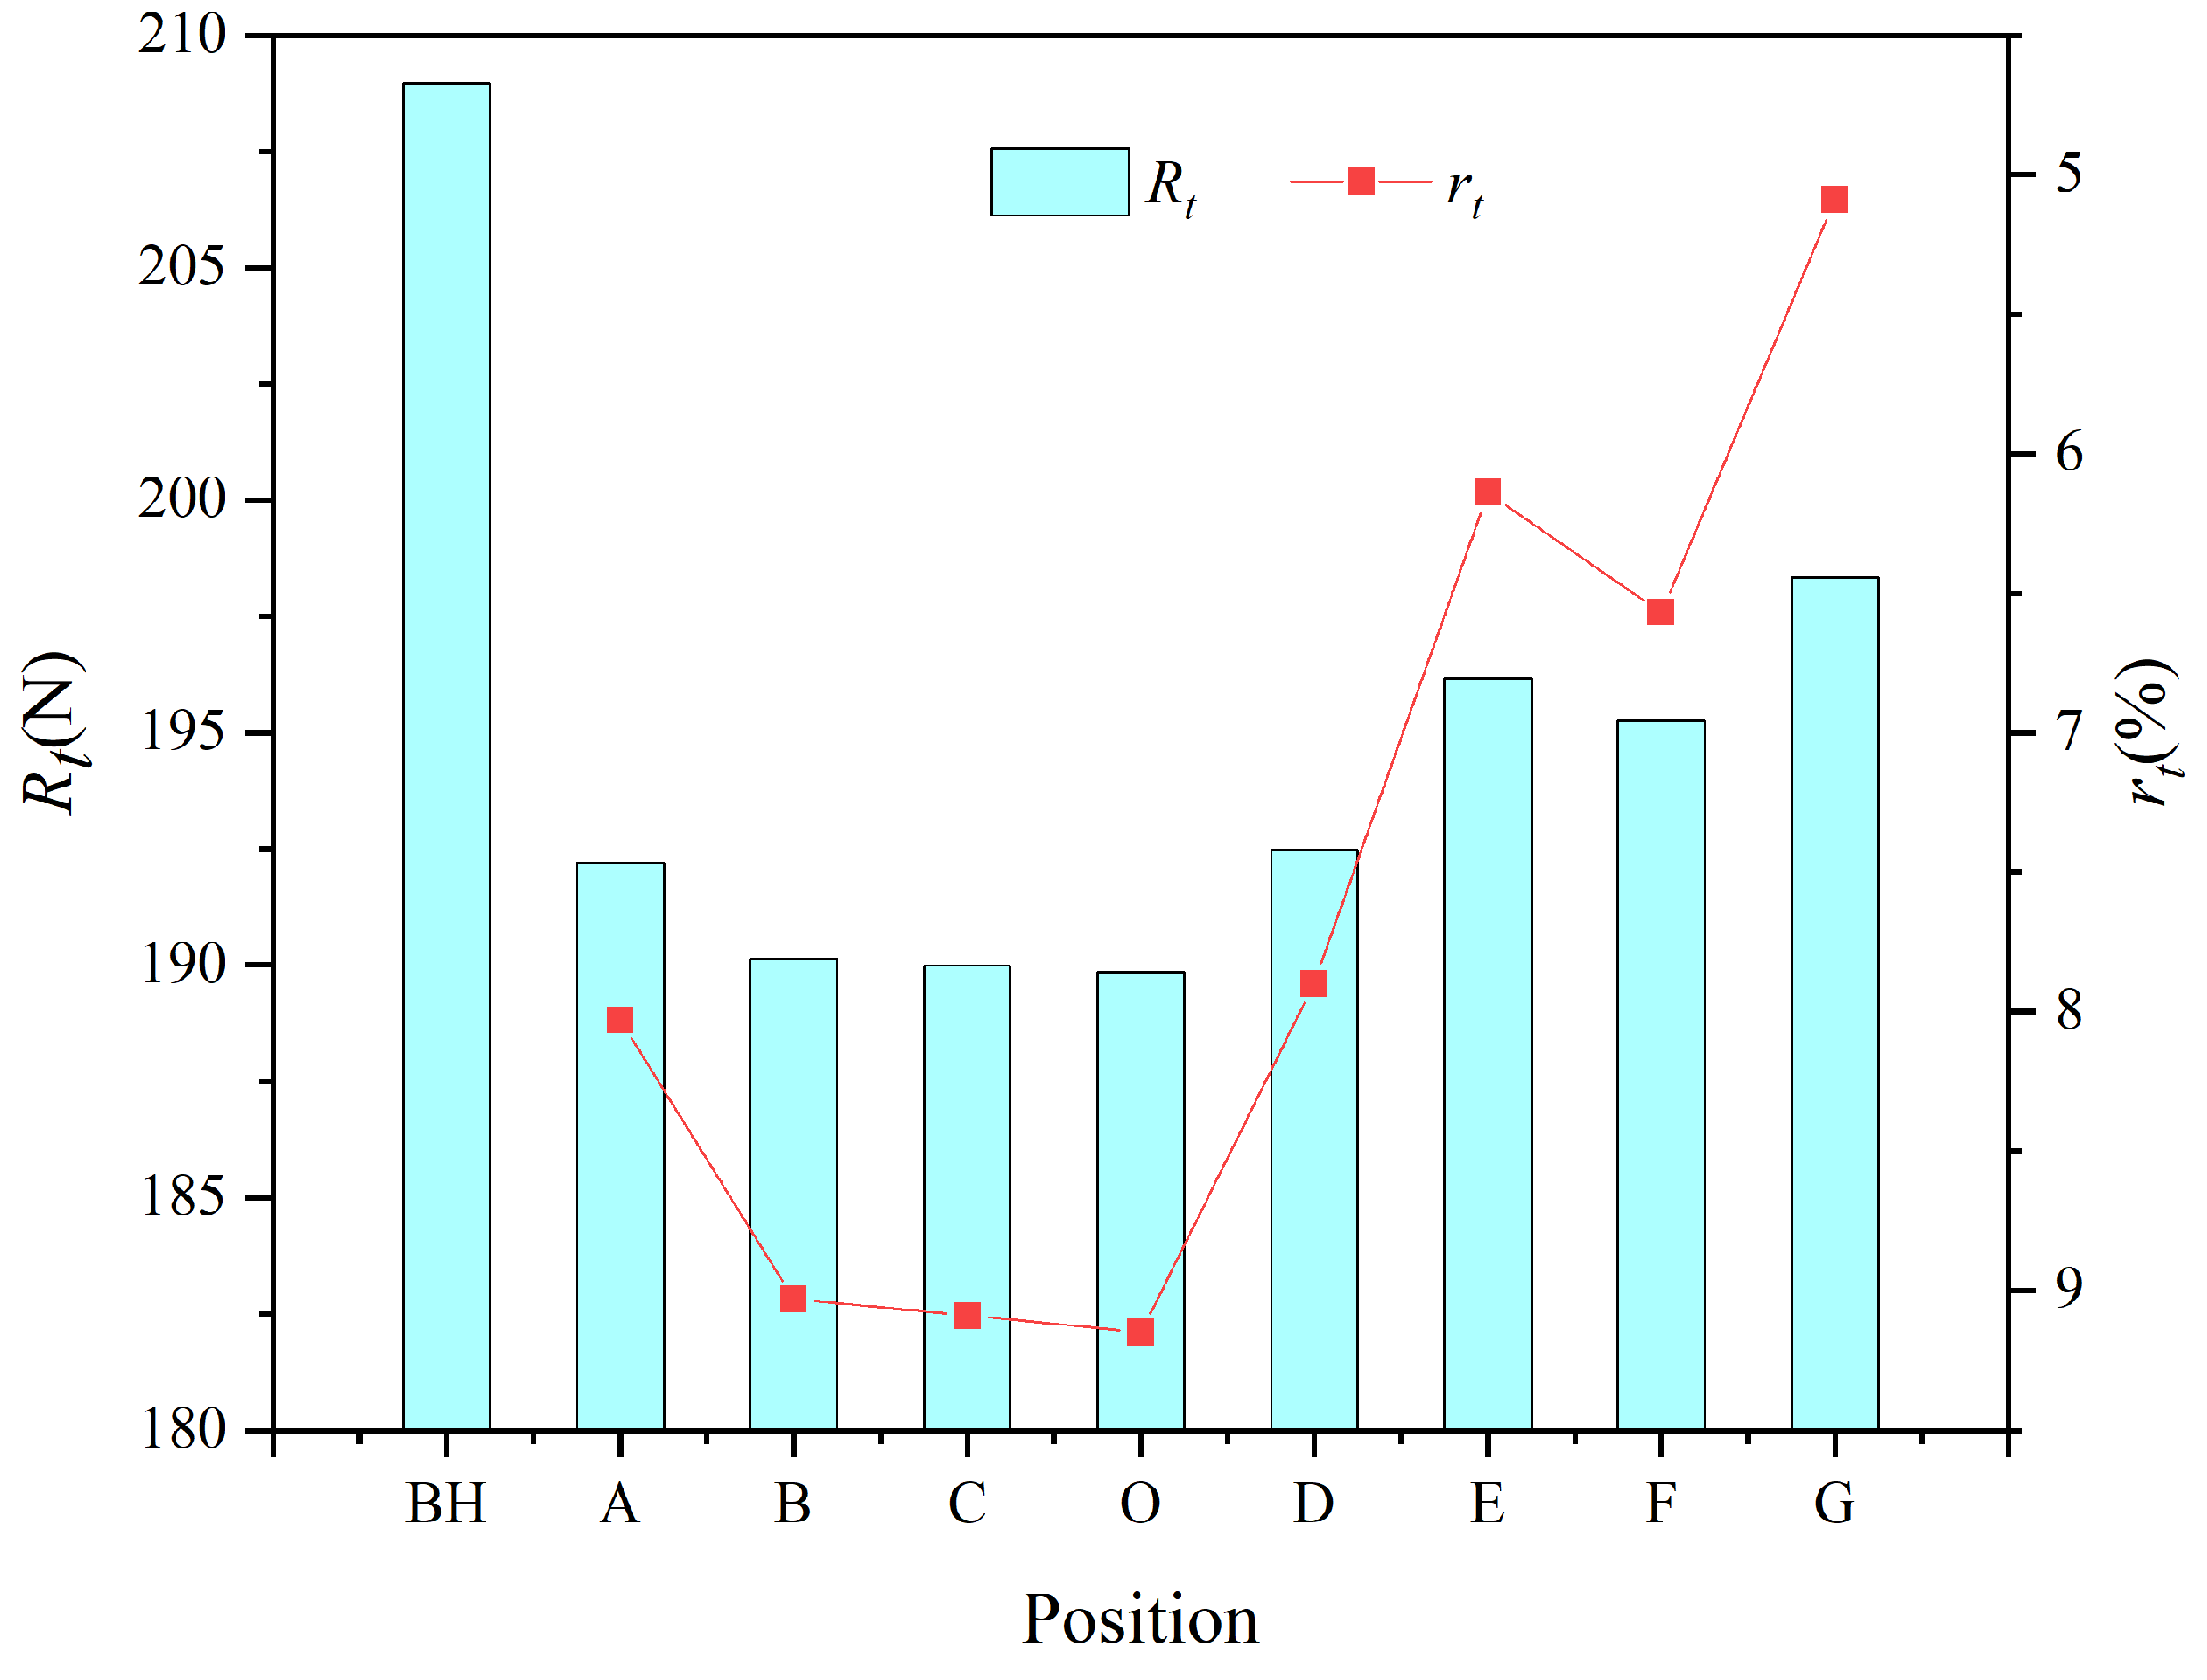
Figure 11 shows the ship’s total resistance and the rate of resistance change when the F-2 appendage is installed at different positions. From the figure, it can be seen that changes in the horizontal position of the appendage have a minor effect on the drag reduction, while changes in the vertical position have a more significant impact. The drag reduction becomes less effective as the appendage moves downward. This indicates that installing the hydrofoil appendage near the free surface results in better drag reduction. In the following text, the position of the bow hydrofoil appendage will remain at point O.

Figure 11.
Resistance calculation results corresponding to different installation positions at Fr = 0.45.
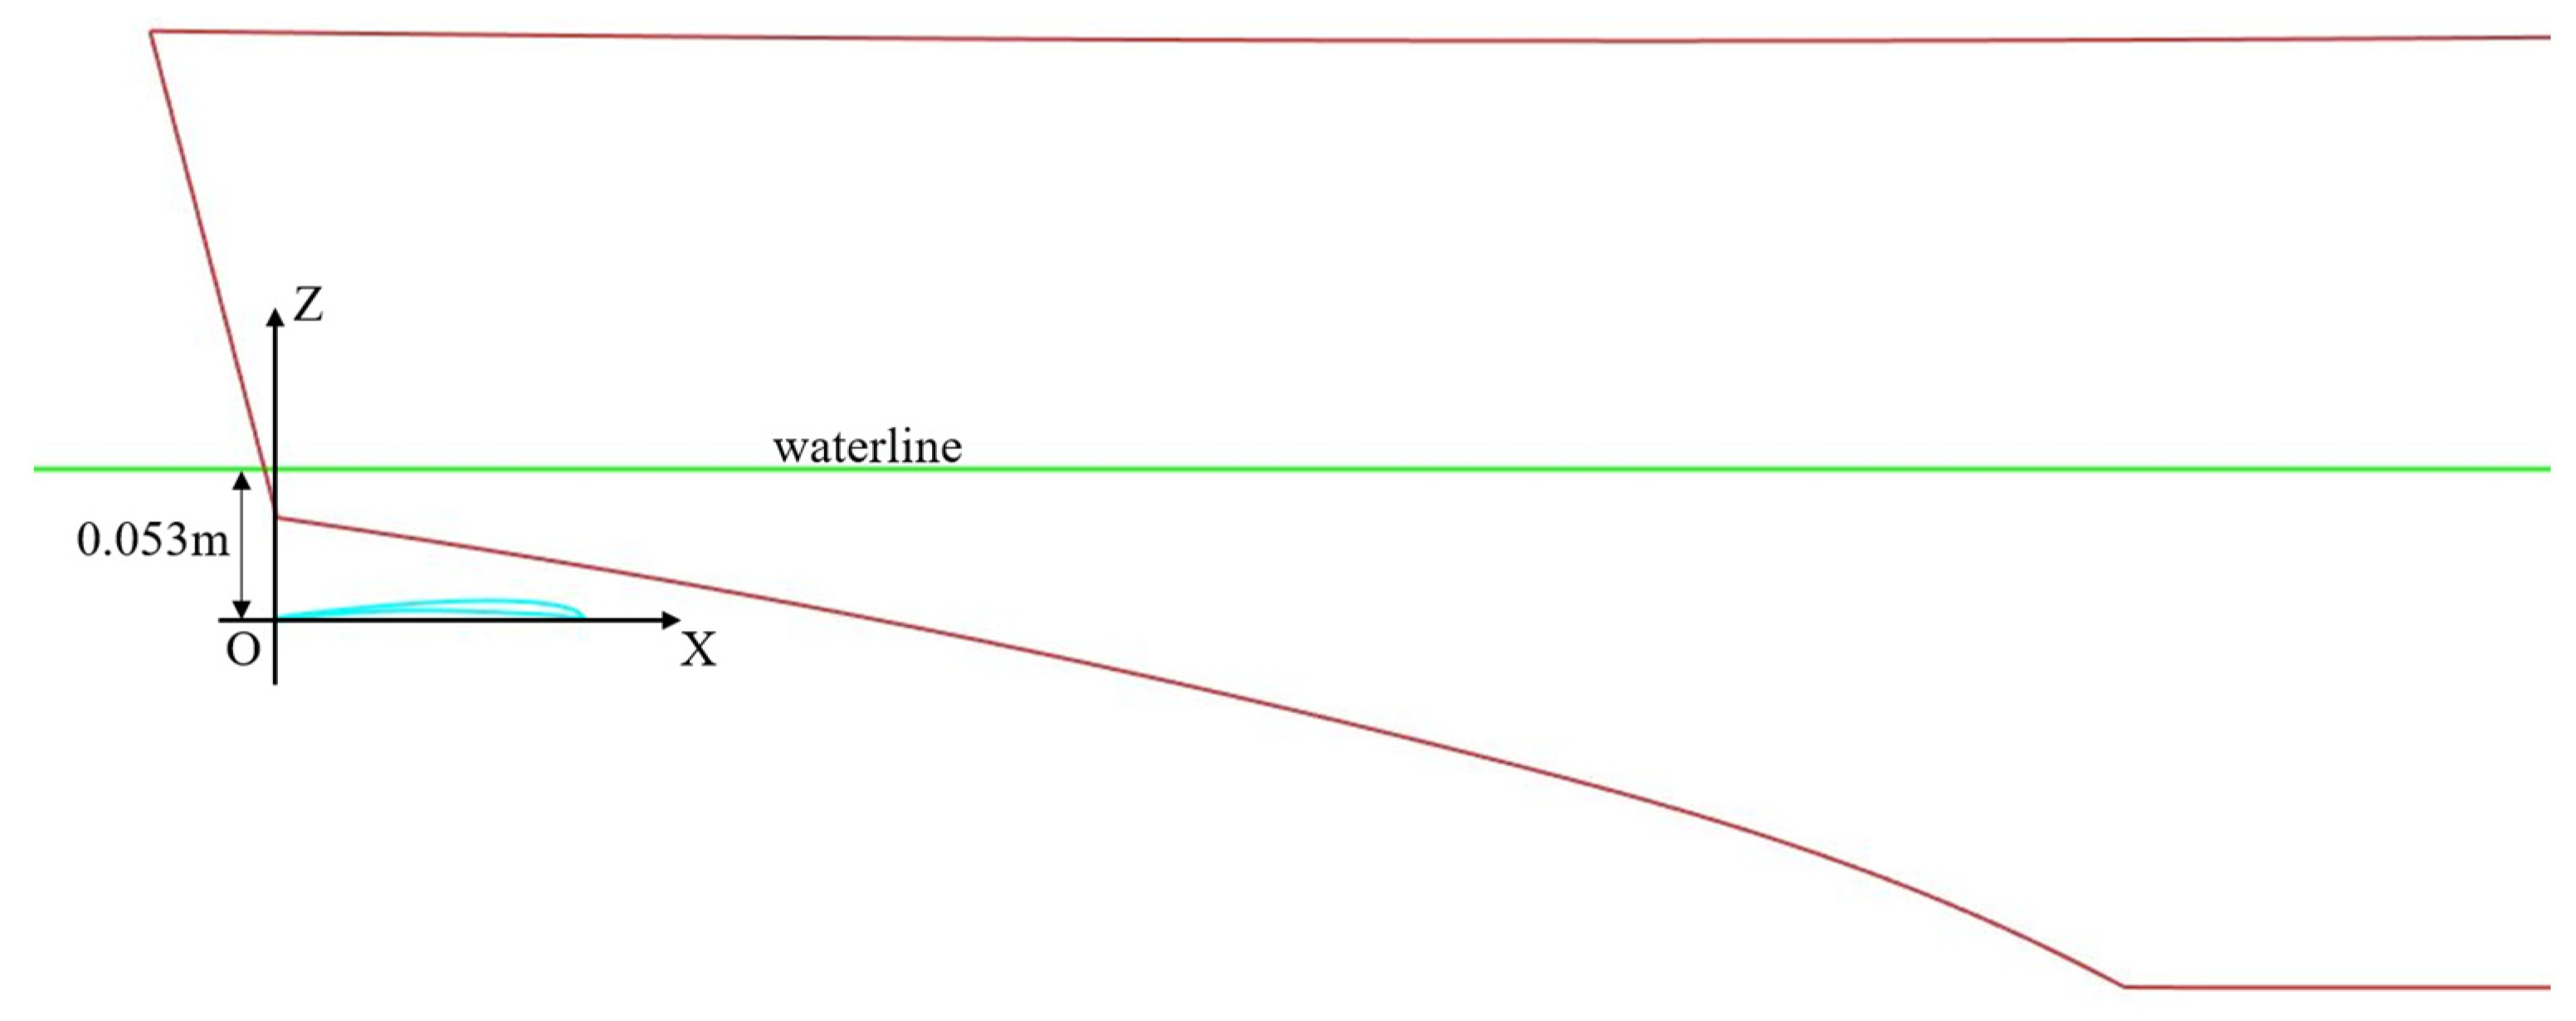
3.3. Analysis of Installation Position of Stern Appendage
Installing hydrofoil appendages at the stern of a vessel can effectively reduce the hull resistance [18,19]. To further reduce hull resistance, the F-2 appendage, which is initially installed at the bow, is also fitted at the stern of the ship, forming a combined hydrofoil appendage configuration marked as CoF-1. Then, the installation position of the stern hydrofoil appendage is studied at Fr = 0.45. For the convenience of expression, the coordinate system O-XZ (as shown in Figure 12) representing the position of the stern hydrofoil appendage is defined, where the O point is situated directly below the stern plate, 0.053 m away from the waterline.
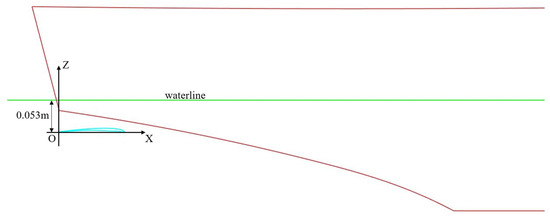
Figure 12.
The coordinate system for representing the installation position of the stern hydrofoil appendage.
Figure 13 shows the influence of the installation position of the stern hydrofoil appendage on the drag reduction effect. It can be seen from Figure 13a that when Z = 0, the varies greatly with the X value, indicating that the change in the longitudinal position of the stern hydrofoil appendage in the hull at this time has a significant impact on the drag reduction effect. The increases gradually as the stern hydrofoil appendage moves backward. When X = −0.35 m, the drag reduction rate reaches the maximum of 19.26%. When the stern hydrofoil appendage continues to move to the rear of the ship, the begins to decrease. At the same time, it can be seen that the change amplitude of tends to be flat between X = −0.25 m and −0.35 m. Figure 13b shows that the vertical position change in the stern hydrofoil appendage also has a certain influence on its drag reduction effect. At different X values, the has the same trend with the Z value, increasing first and then decreasing with the increase of Z, and reaching the maximum value at Z = 0.025 m. When X = 0, the Z value has a greater influence on the drag reduction effect, and when X = −0.1 and −0.25, the influence of the Z value on the drag reduction effect becomes gradually weaker.
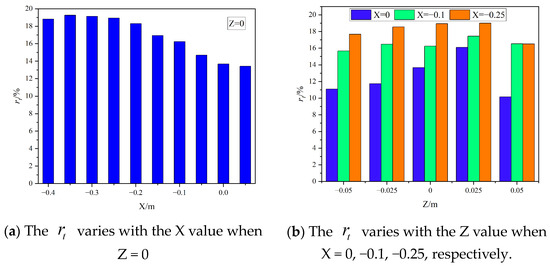
Figure 13.
The influence of the installation position of the stern hydrofoil appendage on the drag reduction effect at Fr = 0.45.
Considering the drag reduction effect and the convenience of installing the hydrofoil appendage, the installation position of the stern hydrofoil appendage is set to the position corresponding to X = −0.25 m and Z = 0 m.
It is worth noting that in this paper, the proposal of the appendages and the study of their installation positions were conducted at a speed of 3.371 m/s. Since the draft of the model ship varies at different speeds, the optimal position for the appendages may not be the same at other speeds.
3.4. Analysis of Drag Reduction Principle of Combined Hydrofoil Appendage
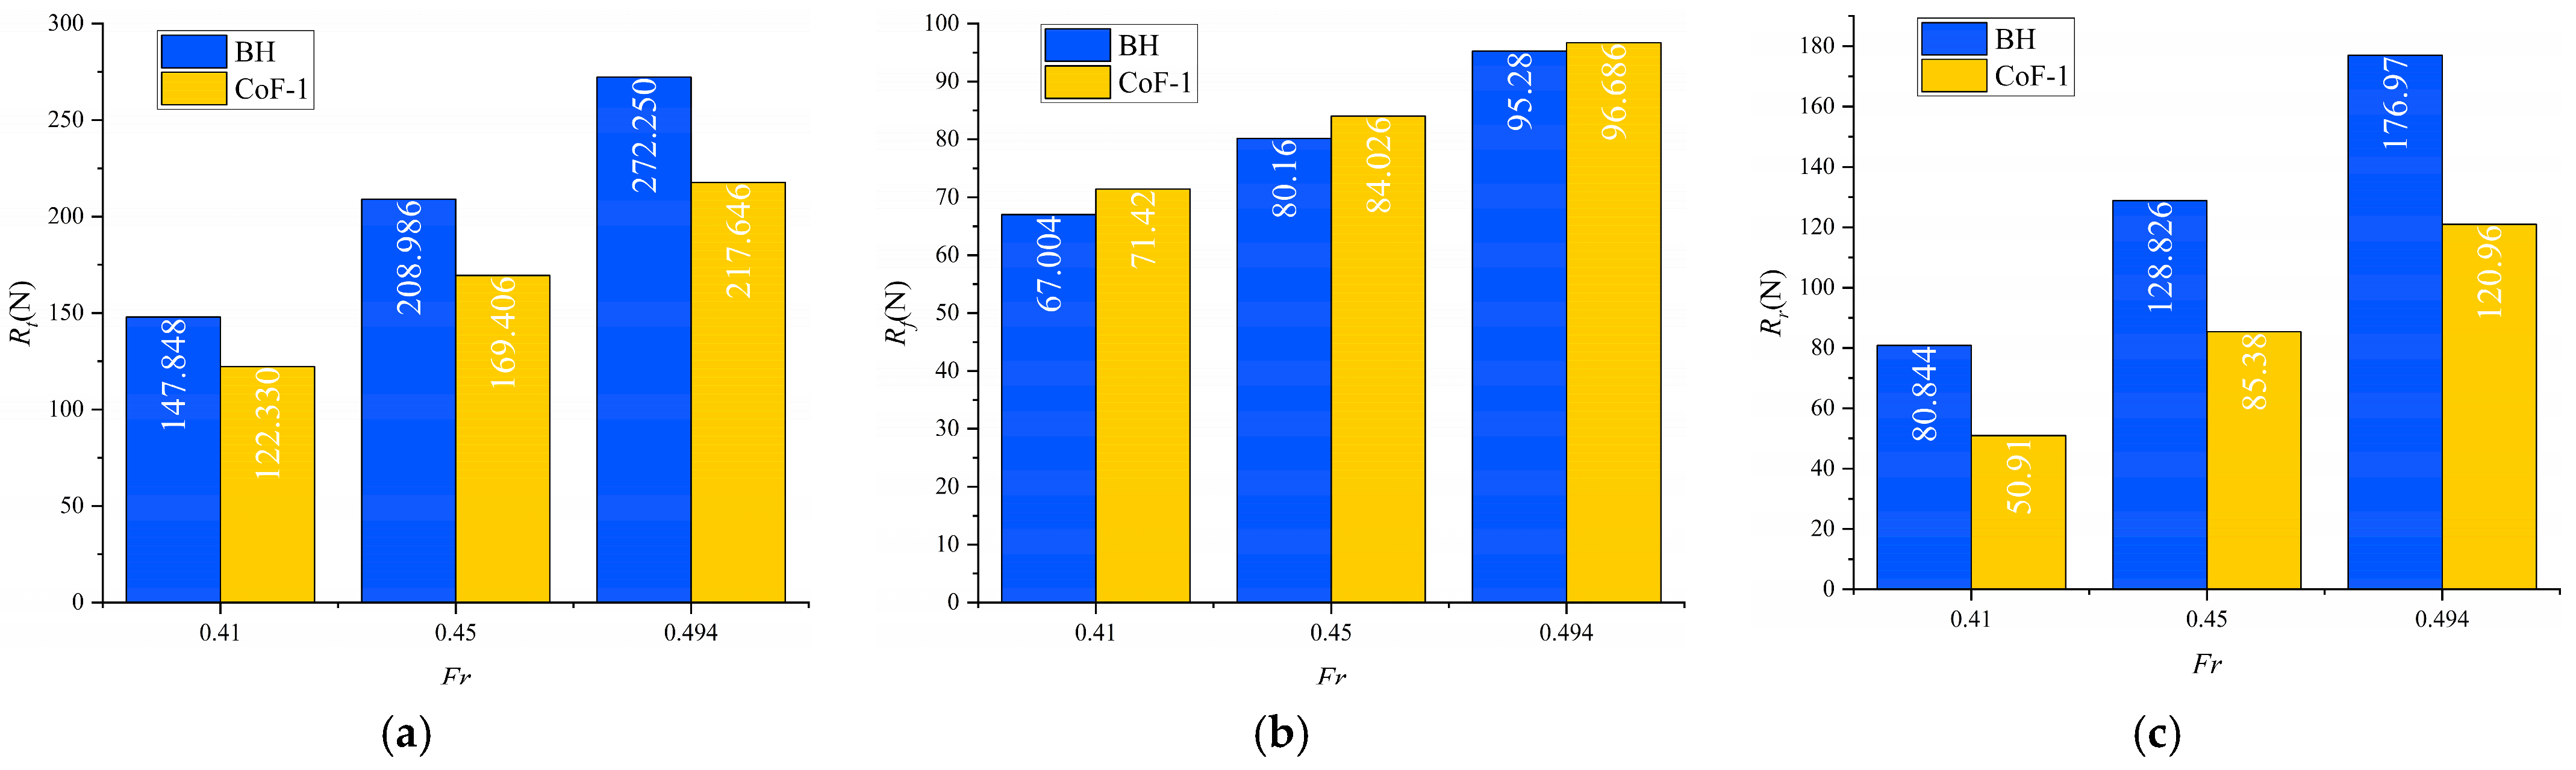
Figure 14 illustrates the changes in total, frictional, and residual resistance after installing CoF-1 on the hull under three high speeds. , , represent the total, frictional, and residual resistance, respectively.
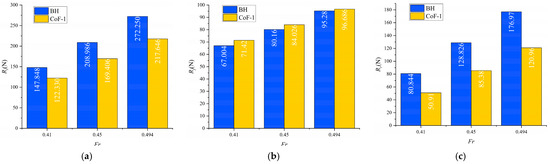
Figure 14.
Change in resistance before and after installing the combined hydrofoil appendage: (a) total resistance, (b) frictional resistance, and (c) residual resistance.
It can be seen from Figure 14 that the combined hydrofoil appendage has good drag reduction effects at three high speeds, and the drag reduction ratios increase as speed increases. The drag reduction ratios of CoF-1 at three speeds are 17.26%, 18.9%, and 20.1%, respectively.
Figure 14 reveals that after installing the combined hydrofoil appendage, the friction resistance of the hull increases, but the increase is small. The change ratio of the friction resistance is less than 5.5%, and the change ratio gradually decreases with speed. More notably, the residual resistance is significantly reduced after installing the combined hydrofoil appendage, and the reduction ratio of the residual resistance at different speeds exceeds 30%. Hence, the drag reduction effect of the combined hydrofoil appendage is reflected in the reduction in residual resistance.
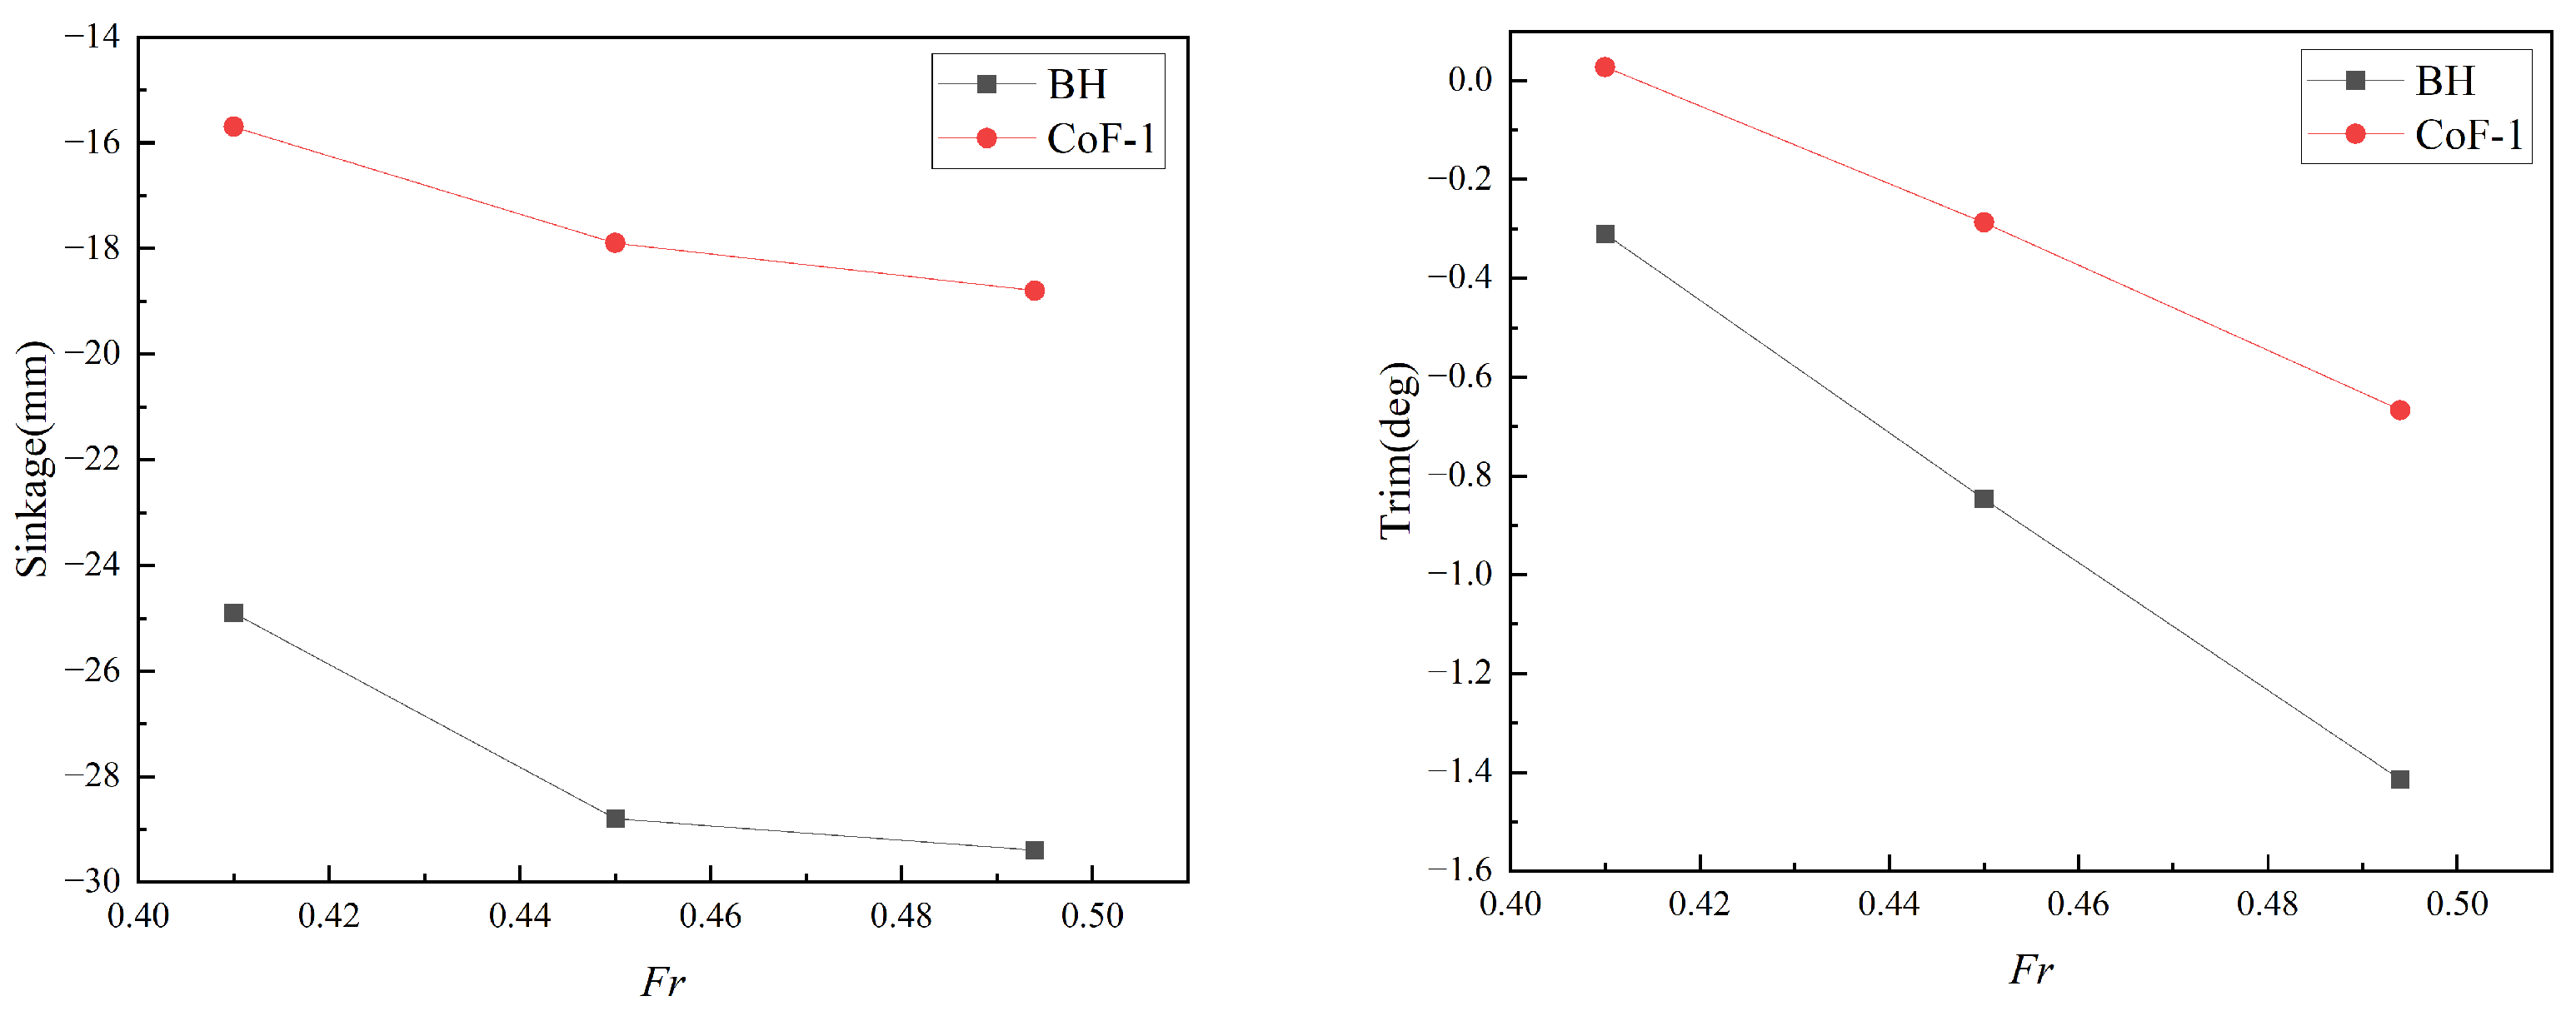
After installing the combined hydrofoil appendage, the attitude (sinkage and trim) of the ship changed. Figure 15 presents the hull’s sinkage and trim calculation results before and after installing the combined hydrofoil appendage. Figure 15 highlights that the sinkage and trim of the hull after installing the combined hydrofoil appendage are significantly improved compared with the bare hull.
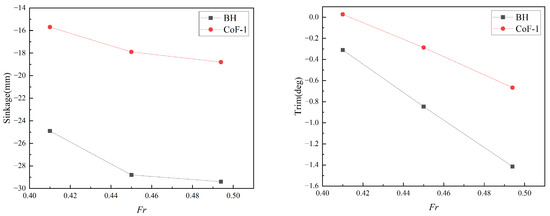
Figure 15.
Sinkage (left) and trim (right) changes in the hull with/without CoF-1.
To determine the contribution of the hull attitude’s change to the drag reduction, the attitude of the bare hull was adjusted to the attitude of the hull equipped with a combined hydrofoil appendage and fixed (marked as Fixed-1). At the fixed attitude, the bare hull resistance was calculated. The calculation results are presented in Figure 16.
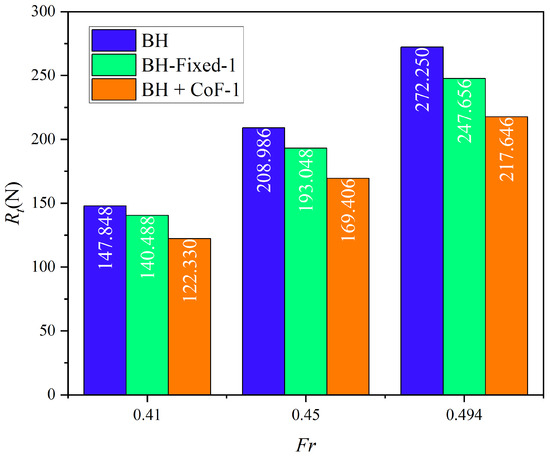
Figure 16.
Effect of attitude change on resistance.
Figure 16 reveals that, compared with the free state of the bare hull, the total resistance of the fixed hull decreases to a certain extent, indicating that the hull attitude changes due to installing the combined hydrofoil appendage have a certain influence on the hull resistance, and the influence increases with the increase in speed. Specifically, the attitude changes caused by CoF-1 reduced the total resistance by 4.98%, 7.63%, and 9.03%, respectively. Hence, the change in hull attitude caused by installing a combined hydrofoil appendage contributes significantly to the total drag reduction.
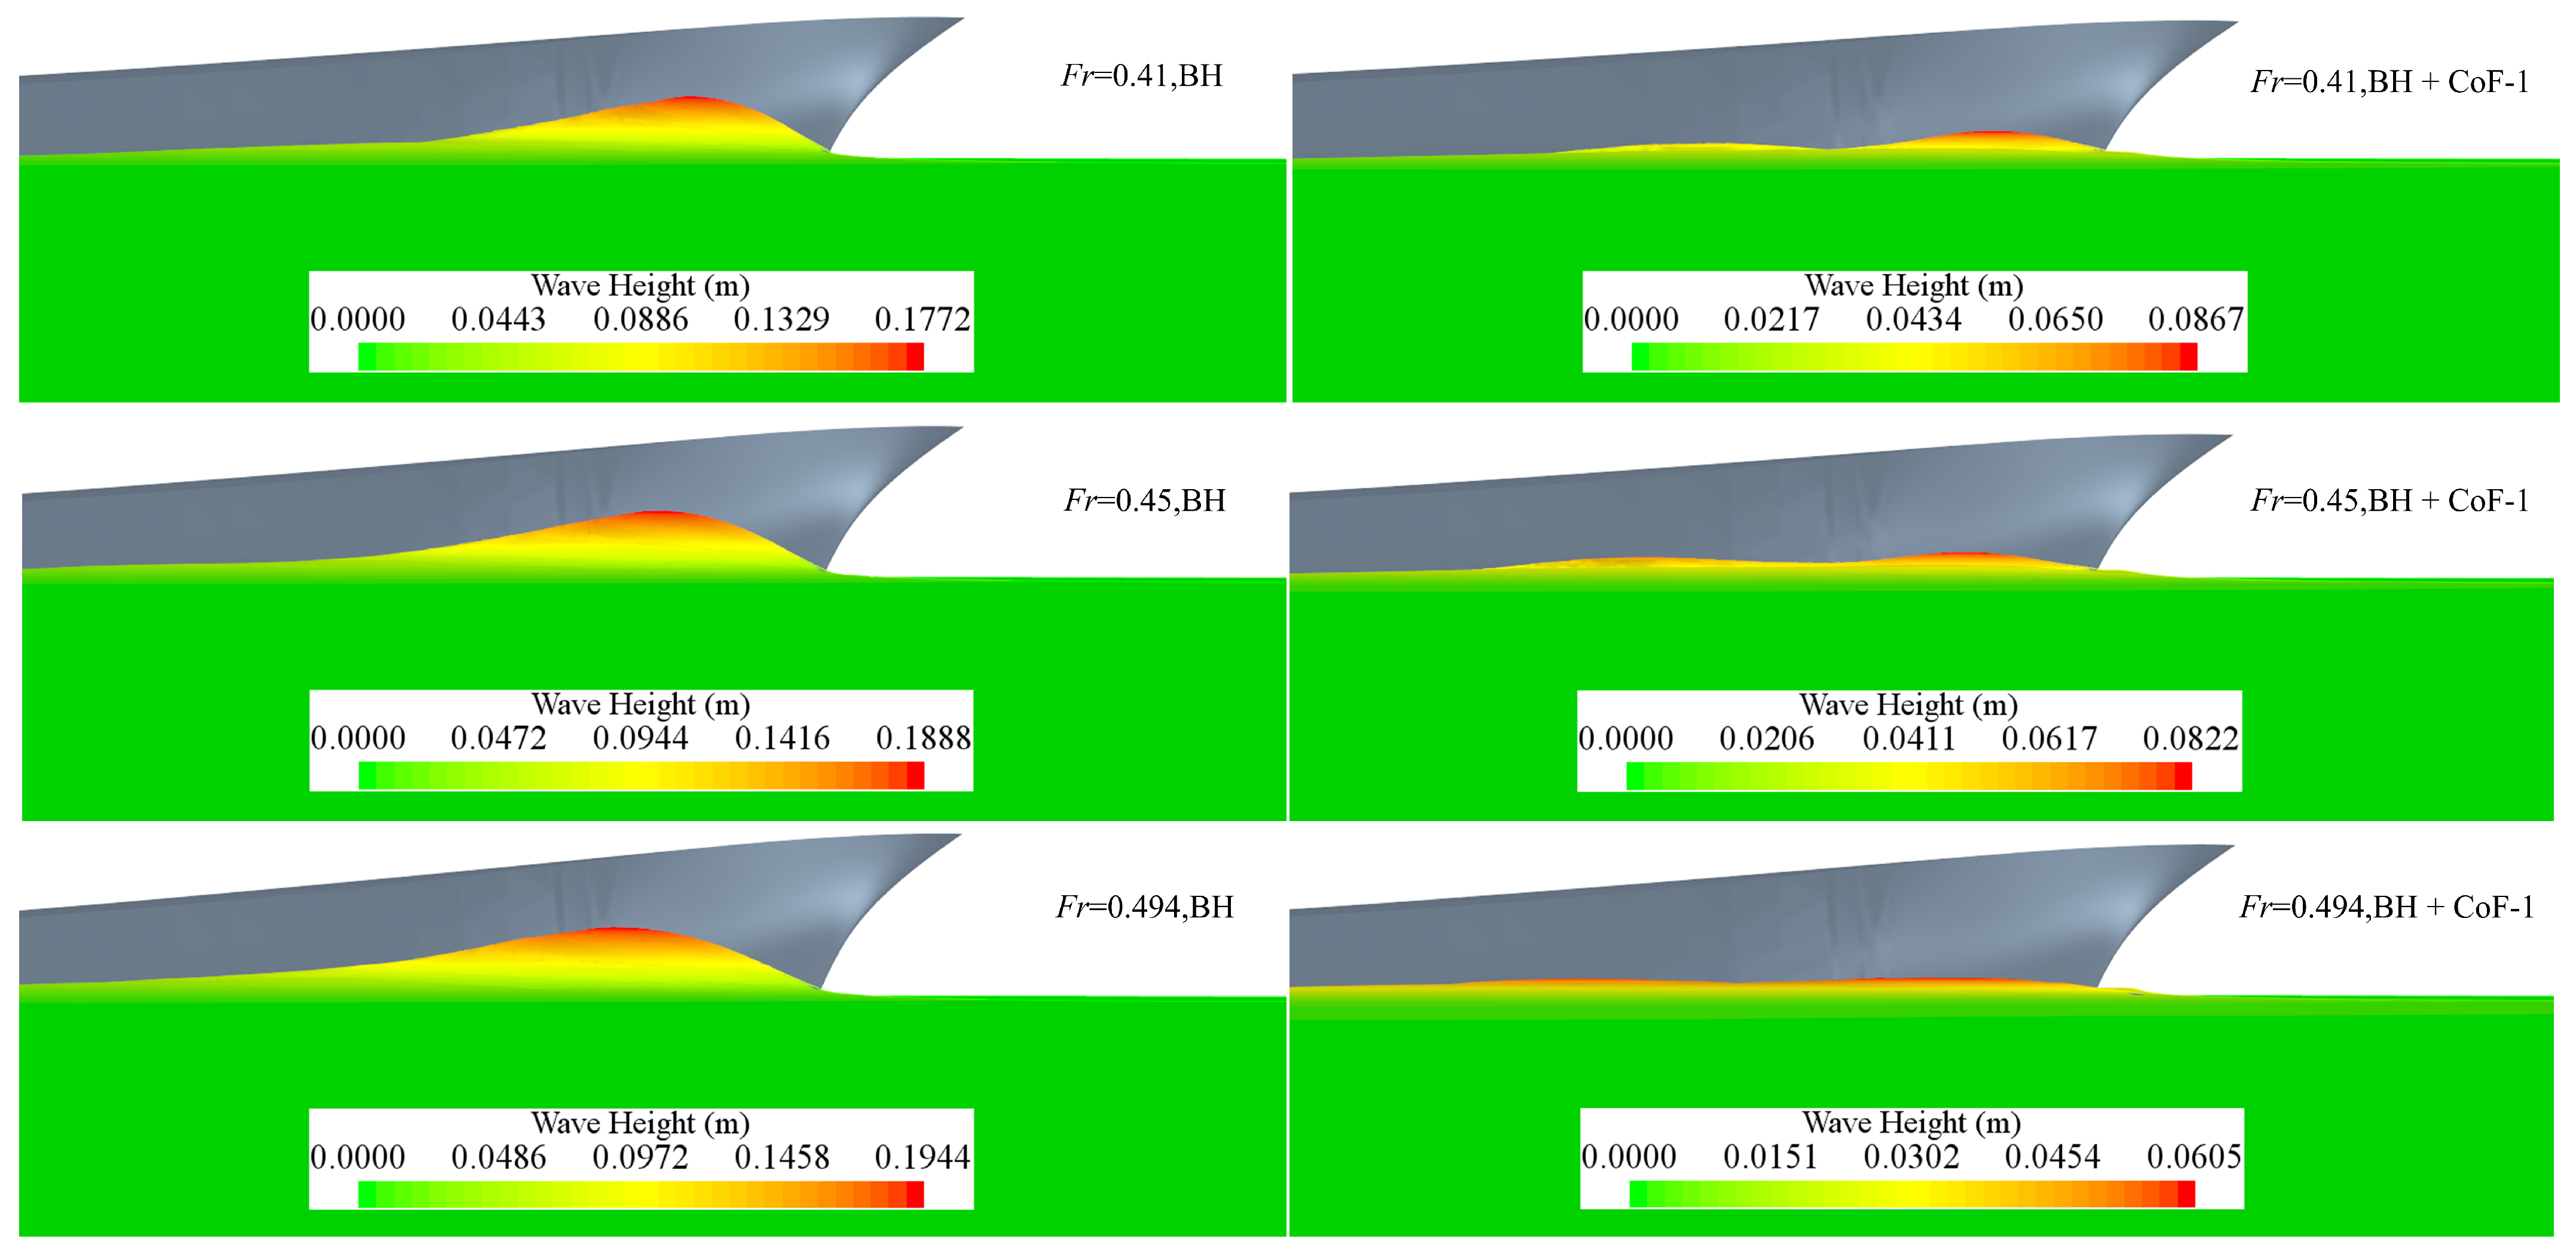
Figure 17 compares the bow wave height before and after installing the combined hydrofoil appendage on the ship model under three speeds. It can be seen from Figure 17 that after installing the combined hydrofoil appendage to the ship model, the bow wave height decreases significantly, indicating that the bow appendages of the combined hydrofoil appendage can effectively suppress the bow wave and reduce the bow wave height.
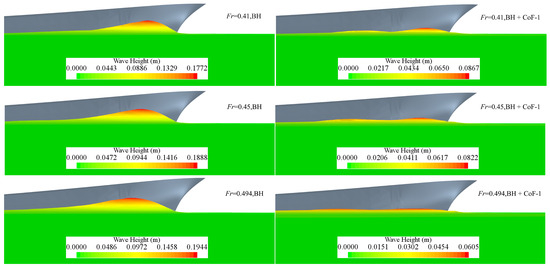
Figure 17.
Bow wave comparison in numerical calculation before and after installing CoF-1.
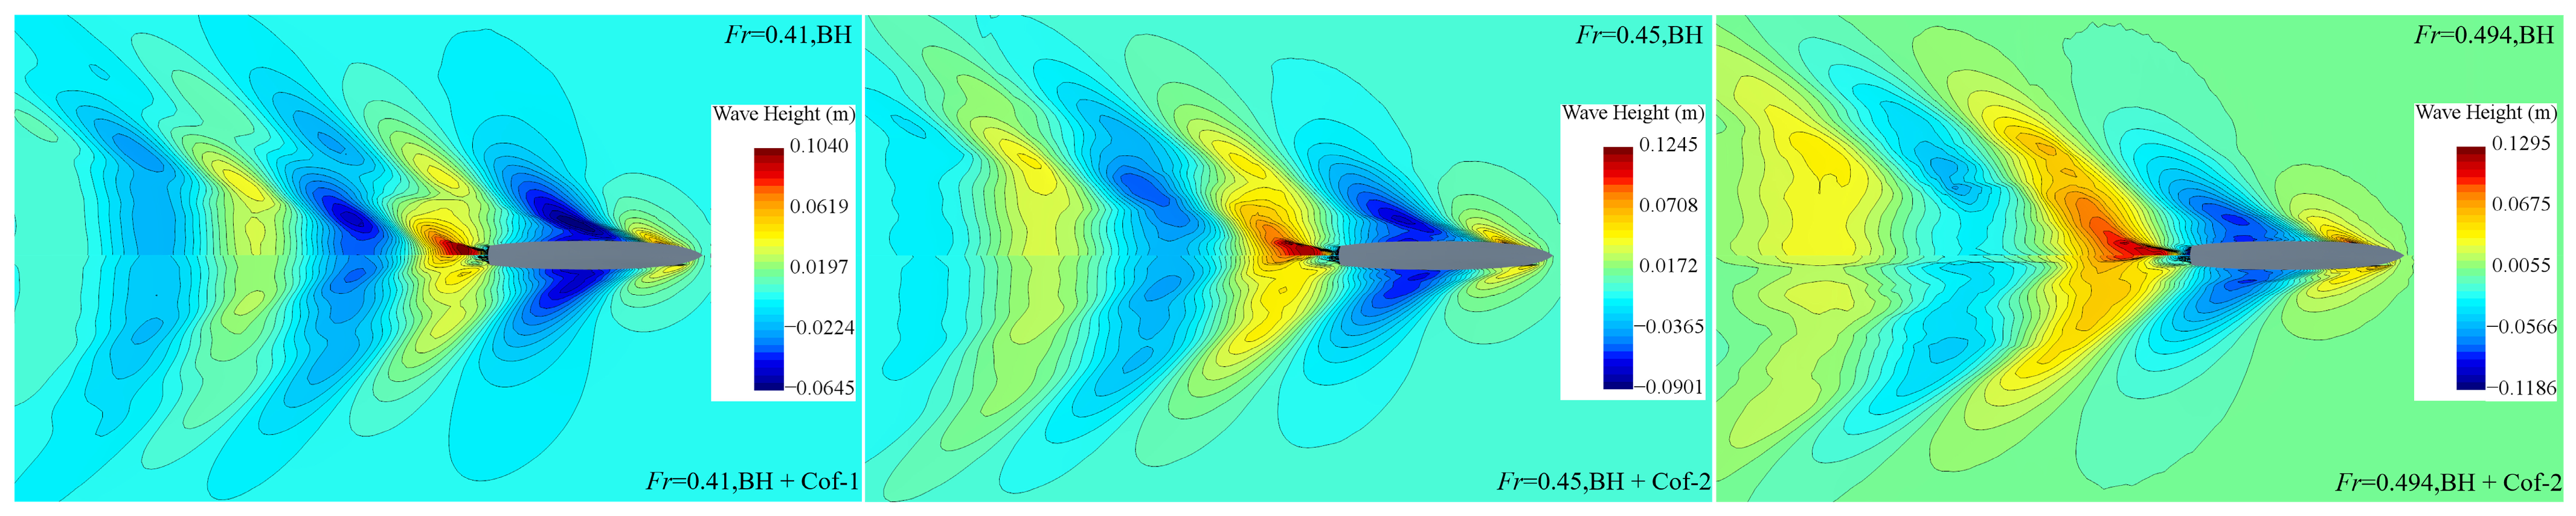
DTMB 5415 has a transom stern that gives rise to the wake field’s distinctive features: a rooster tail and a hull hollow. Figure 18 depicts the free surface waveform of the DTMB 5415 model with/without combined hydrofoil appendage at three high speeds.

Figure 18.
Effects of combined hydrofoil appendage on the free surface waveform.
Comparing the waveforms of the bare hull at the three speeds reveals that the stern formed an obvious rooster tail, and as the speed increases, the height of the rooster tail wave gradually increases. At the same time, there is a small hollow near the stern plate, and the hollow area increases as the speed increases. After installing the combined hydrofoil appendage, the wave height of the rooster tail decreases significantly, the crest of the rooster tail shifts significantly backward, and the hollow area near the stern beam increases significantly at all three speeds. Lowering the rooster tail reduces the energy needed to generate the wave, resulting in less wave-making resistance. The hollow area increases the virtual length of the hull, thus increasing the slenderness coefficient of the hull. A higher slenderness coefficient helps reduce the ship’s wave-making resistance.
Combining Figure 17 and Figure 18 infers that installing the combined hydrofoil appendage significantly reduces the wave height at the bow and stern and changes the waveform at the stern, which is the main reason the combined hydrofoil appendage can reduce residual resistance. To sum up, the drag reduction effect of the combined hydrofoil appendage is mainly achieved through two aspects: one is to change the attitude of the hull, and the other is to change the waveform and reduce the wave height.
4. Hydrofoil Appendage Model Test
In order to verify the accuracy of the numerical simulation method in this paper and the actual drag reduction effect of the hydrofoil appendage, we fabricated the DTMB 5415 ship model to conduct the resistance tests in a towing tank (length 510 m, width 6.5 m, depth 6.5 m, and water depth 5.0 m). The ship model was towed by the carriage in the tank at a speed range of 0.1 m/s–25 m/s, with an accuracy of less than 0.1%. The uncertainty analysis shows that when the Froude number is between 0.4 and 0.5, the test error due to towing speed and repeatability is less than 1%.
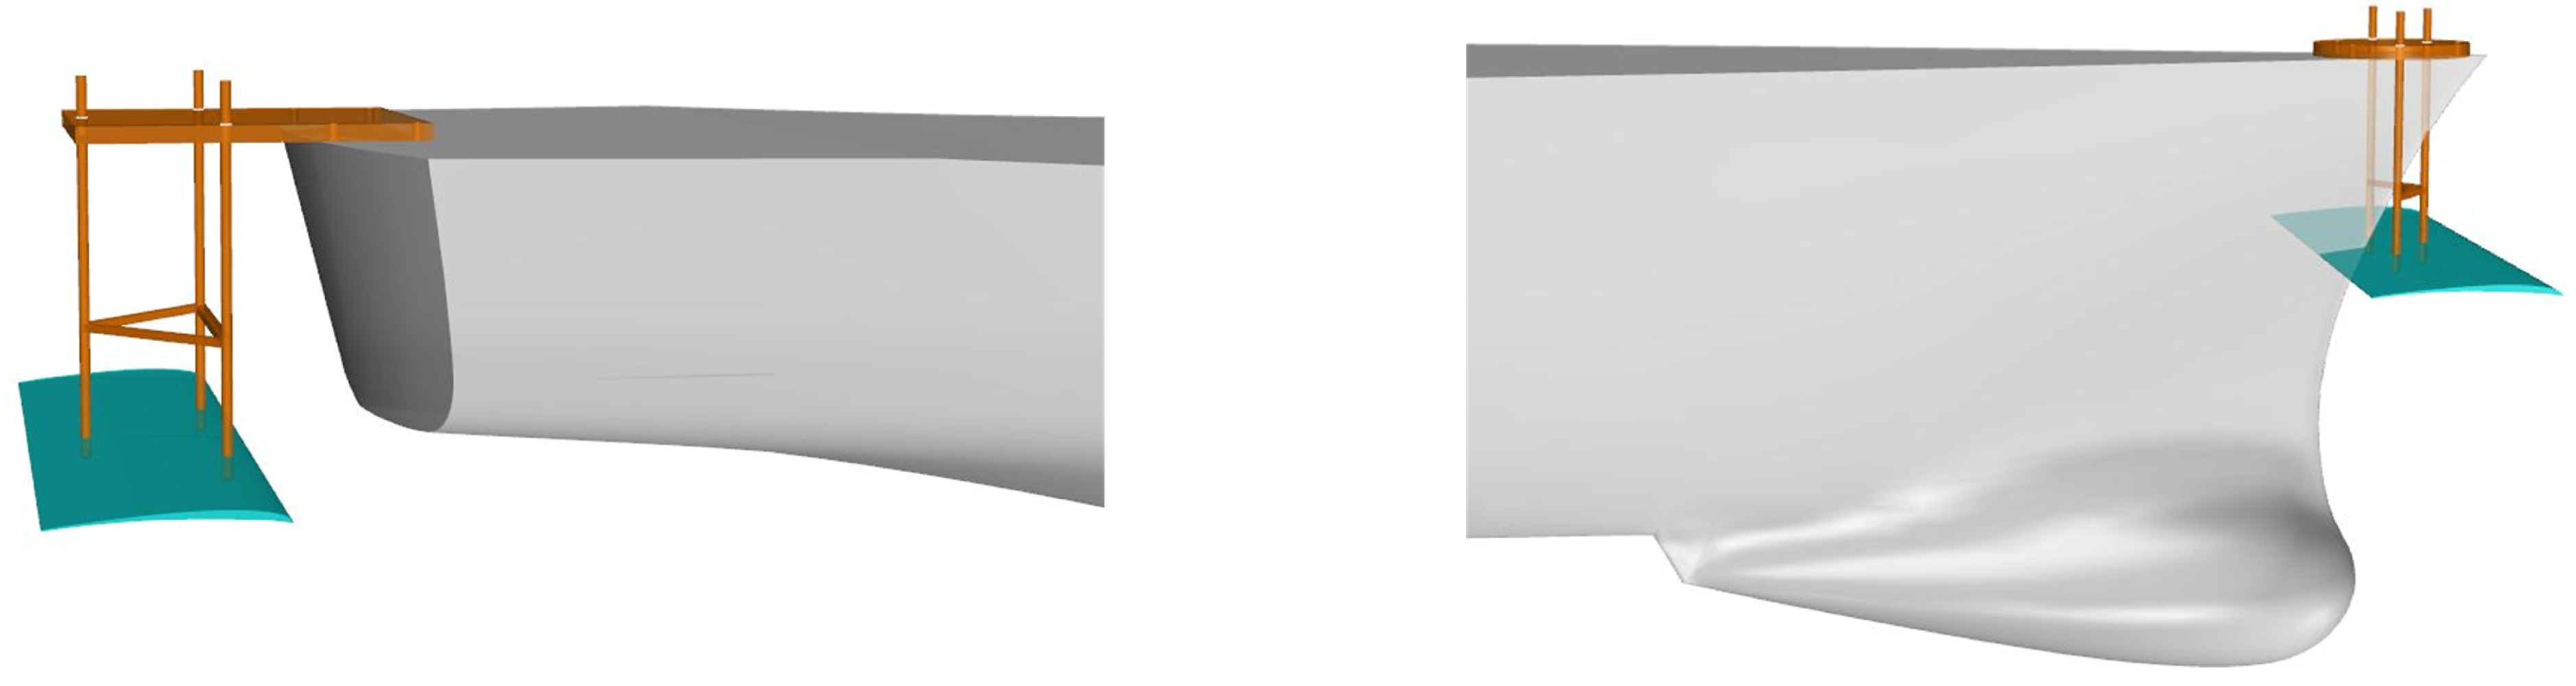
A support column installation scheme is designed to facilitate the installation, as illustrated in Figure 19. Obviously, the support column will perturb the bow and stern flow fields, imposing additional drag. Hence, a numerical simulation was conducted before the test to evaluate the effect of the column on the drag reduction in the combined hydrofoil appendage. Table 10 presents the corresponding results, highlighting that the support columns significantly impact the drag reduction effect of the combined hydrofoil appendage, reducing the drag reduction ratios at the three high speeds by 4.58%, 2.75%, and 2.73%, respectively.

Figure 19.
Design drawing of the support column installation scheme.
Table 10.
Influence of the column installation method.
After a preliminary understanding of the effects of the support columns, the hydrofoil appendages were installed on the hull with support columns, and resistance tests were conducted. In order to prevent water from pouring into the cabin during the test and affecting the results, a 25 cm high baffle was installed on the bow deck of the ship. Before the tests, the initial draft and trim of the hull installed with CoF-1 were consistent with the bare hull condition after adjusting the ballast. Resistance tests were performed at 5-speed points with Fr between 0.4 and 0.5.
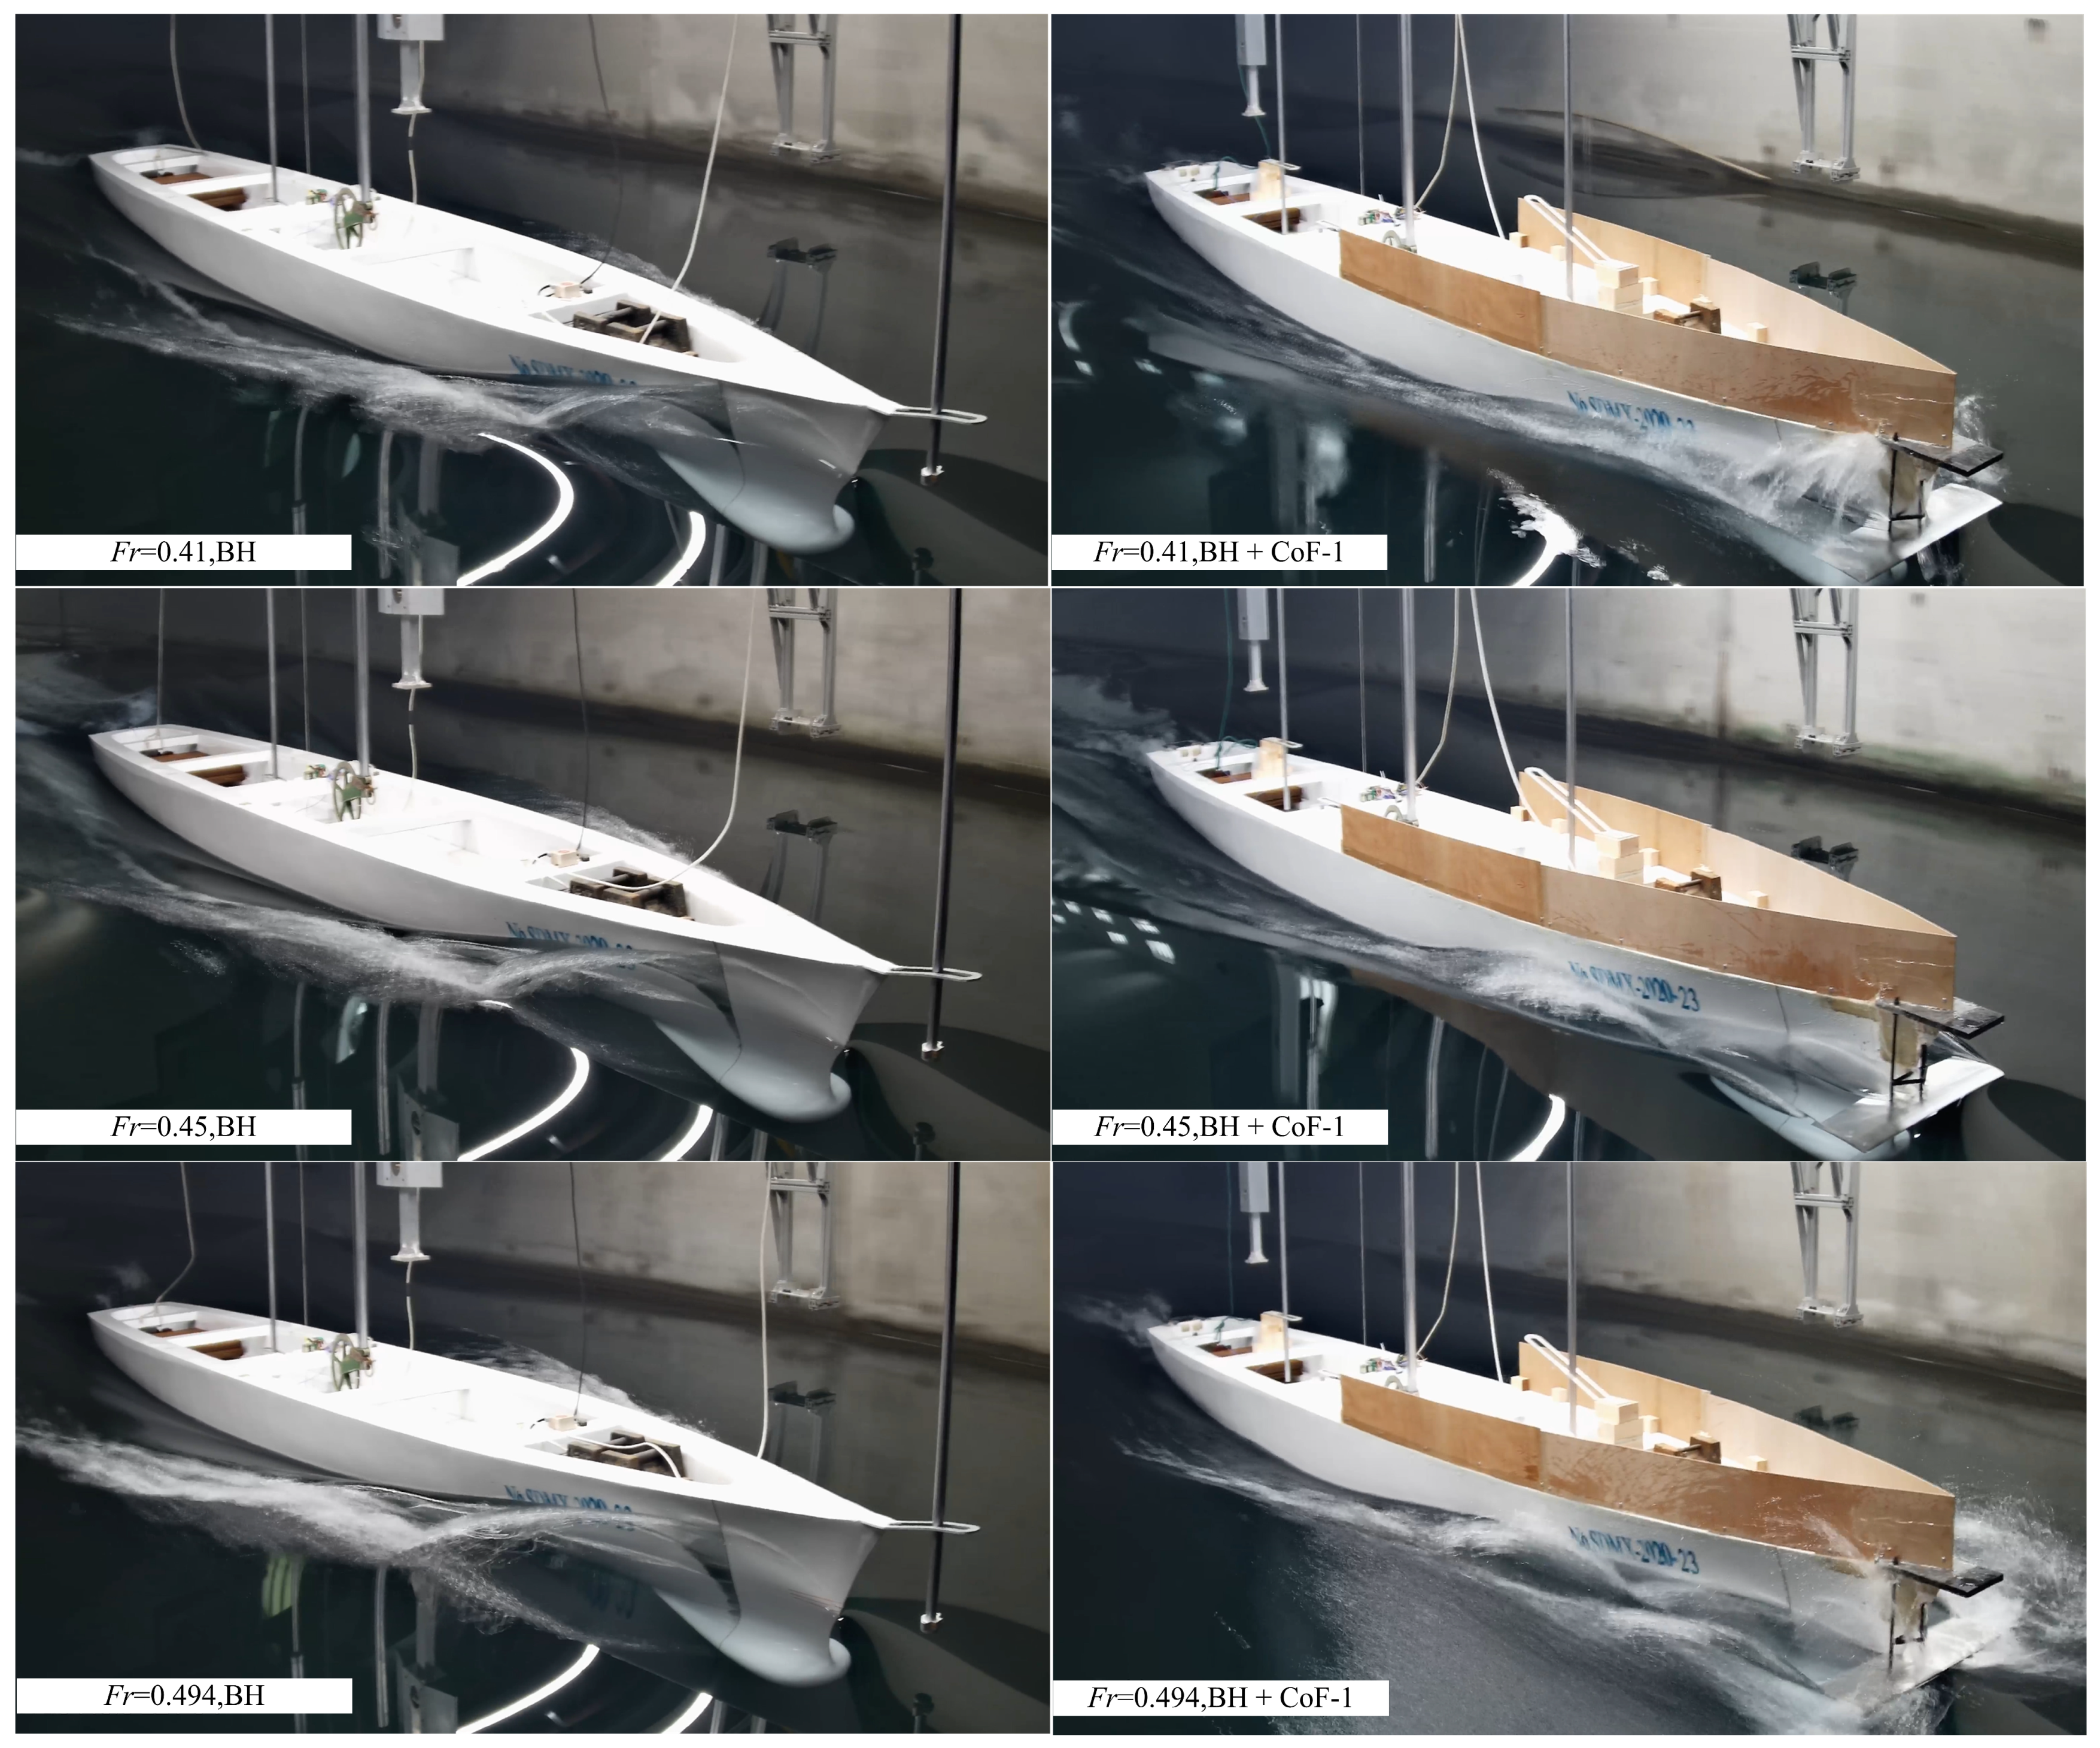
Figure 20 presents the comparison diagram of the bow wave under several typical navigation speeds. Figure 20 suggests that the wave height at the ship’s bow decreases to a certain extent after installing CoF-1, which indicates that the bow hydrofoil appendage can suppress the wave, conforming with the initial assumption of the hydrofoil appendage scheme. Additionally, Figure 20 reveals that after installing the combined hydrofoil appendage, there is a strong splashing phenomenon at the ship’s bow, mainly caused by two factors. First, the disturbance of the column to the water causes a splashing phenomenon, and since the column is closer to the hull, the splashing generated by the column directly hits the hull (especially obvious when Fr = 0.41), forming a broken wave and consuming more energy. Second, as speed increases, the trim at the stern of the hull increases, making the bow hydrofoil gradually emerge from the water surface, weakening the disturbance of the column on the hydrofoil to the water. A skimping process over the water surface is evident for the bow hydrofoil, developing a strong splashing phenomenon at both ends and the leading edge of the bow hydrofoil, which becomes more severe as the speed increases, especially when Fr = 0.494. The splashing phenomenon weakens the drag reduction effect of the combined hydrofoil appendage.
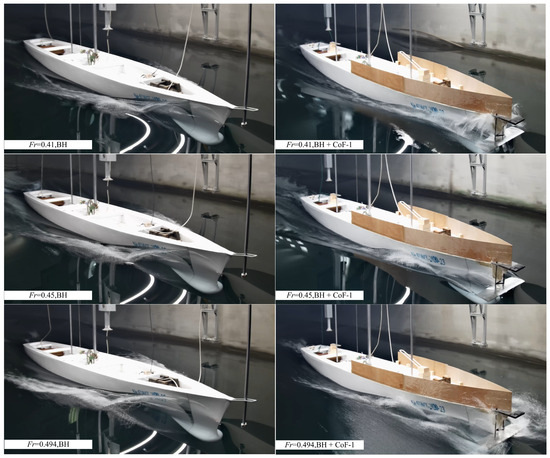
Figure 20.
Comparison of experimental bow waves before and after installing CoF-1.
Table 11 reports the resistance test results of the ship model with/without CoF-1, where the frictional resistance is calculated based on the total resistance data of the ship model using the ITTC-57 formula. According to Table 11, the total resistance reduction ratio can reach more than 10%, with the drag reduction ratio maximizing (14.552%) when Fr = 0.47. At Fr = 0.494, the drag reduction decreases significantly, mainly due to the severe splashing at the bow appendage at this speed, which is evident in Figure 20.
Table 11.
Resistance test results of ship model with/without CoF-1.
Table 11 reveals that after installing the CoF-1 appendage, the frictional resistance increases, but the increase is small. The change ratio of the friction resistance is approximately 3.3%. More notably, the residual resistance is significantly reduced after installing the CoF-1 appendage, and the reduction ratio of the residual resistance at different speeds exceeds 20%. Hence, the drag reduction effect of the combined hydrofoil appendage is reflected in the reduction in residual resistance.
Table 12 compares the CFD-calculated values of the hull resistance with the experimental values after the appendages have been installed. It can be found that the calculation results of bare hull resistance show good agreement with the experiment results, which proves the accuracy of the numerical simulation method in this paper. However, there is a certain difference between the numerical calculation results and the test results after installing CoF-1, which is mainly caused by two reasons. First, the installation method of the hydrofoil appendages is different. During the test, the support column installation method was adopted (Figure 19). However, the column caused additional interference to the flow field and increased the instability of the flow field. Second, the numerical calculation method itself has certain limitations. Indeed, the model test shows strong splashing phenomena near the bow hydrofoil and a mixed flow of water and gas around the hydrofoil. These phenomena have always been difficult problems in the field of numerical simulation research, requiring highly refined grids and appropriate HRIC coefficients for accurate capture. However, in this paper, a coarser grid has been used in order to enhance computational efficiency, which makes it difficult to accurately capture these phenomena. Although there are some differences in the numerical calculation and model test results, both results show that the combined hydrofoil appendage has a good drag reduction effect.
Table 12.
Comparison of the hull’s total resistance from model tests with that from CFD when installing CoF-1.
5. Conclusions and Future Work
The existing technologies for reducing wave resistance (such as bulbous bows and hull optimization techniques) are not effective in reducing the wave resistance of high-speed vessels with Froude numbers between 0.4 and 0.5. Existing appendage technologies designed to reduce a ship’s resistance do not take into account the impact of bow waves on resistance. This article innovatively considers the impact of bow waves on resistance and proposes a new drag reduction scheme, which involves installing hydrofoils at the free surface of the bow and at the stern simultaneously. This not only effectively suppresses the height of the bow waves but also achieves good drag reduction effects across the entire range of Froude numbers from 0.4 to 0.5. The conclusions of this study are summarized as follows:
(1) Installing a small flat plate appendage near the free surface at the ship’s bow can effectively suppress the bow wave and reduce hull resistance. The numerical simulation results show that the total resistance reduction ratio of the flat plate appendage can reach 6.49% at a high speed of Fr = 0.45.
(2) After modifying the flat plate appendage into a hydrofoil appendage, both the height of the bow wave and the hull resistance are further reduced. Numerical simulation results indicate that the total resistance reduction rate of the bow hydrofoil appendage can reach 9.15% at Fr = 0.45.
(3) The numerical simulation results show that the proposed combined hydrofoil appendage has a good drag reduction effect at high speed. The drag reduction mechanism of the combined hydrofoil appendage mainly includes two aspects: one is to correct the attitude of the hull; the other is to restrain the wave height of the hull bow and stern and change the waveform.
(4) The drag reduction effect of the combined hydrofoil appendage CoF-1 was verified through model tests. The test results revealed that CoF-1 has a good drag reduction effect when Fr is between 0.4 and 0.5 and the total resistance reduction ratio is above 10%, affording a maximum total resistance reduction ratio of 14.552%.
(5) Model tests show that the bow hydrofoil appendage will produce a serious splashing phenomenon, and the splashing phenomenon will weaken the drag reduction effect of the hydrofoil appendage, which is the main reason for the difference between the numerical simulation results and the model test results.
The extensive numerical simulation and experimental verifications show that the combined hydrofoil appendage has a good drag reduction effect for high-speed ships, but some problems must be studied in future work. First, the numerical simulation method cannot accurately simulate the splashing phenomenon generated by the hydrofoil appendage. The new numerical simulation scheme, including the appropriate mesh size and HRIC coefficient, will be studied to accurately capture the splashing phenomenon. Second, the splashing phenomenon produced by the hydrofoil appendages weakens the drag reduction effect. The shape of the hydrofoil appendage will be optimized to reduce the splashing phenomenon in the future. Finally, in the model test in this paper, the installation mode of the hydrofoil appendage produces additional interference to the flow field, affecting the hydrofoil appendage’s drag reduction effect. Hence, the installation mode of the hydrofoil appendage is also a problem that needs to be studied further. Additionally, considering the potential risks to appendages in high-sea states, designing them to be retractable could be a viable solution.
Author Contributions
Conceptualization, Q.C.; methodology, Q.C.; software, Q.C.; validation, Z.L.; formal analysis, Q.C.; investigation, W.L.; data curation, Z.L.; writing—original draft preparation, Q.C.; writing—review and editing, Q.C.; visualization, W.L.; supervision, G.Z.; project administration, Z.L.; funding acquisition, Z.L. All authors have read and agreed to the published version of the manuscript.
Funding
This research was funded by the Foundation Strengthening Program Fund Project, grant number 2019-JCJQ-JJ-045.
Institutional Review Board Statement
Not applicable.
Informed Consent Statement
Not applicable.
Data Availability Statement
The data presented in this study are available on request from the corresponding author. The data are not publicly available due to privacy.
Conflicts of Interest
The authors declare no conflicts of interest.
References
- Farkas, A.; Degiuli, N.; Martić, I. Numerical investigation into the interaction of resistance components for a series 60 catamaran. Ocean. Eng. 2017, 146, 151–169. [Google Scholar] [CrossRef]
- Avci, A.G.; Barlas, B. Investigation of the optimum longitudinal single transverse step location for a high-speed craft. Brodogradnja 2023, 74, 47–70. [Google Scholar] [CrossRef]
- Sahin, O.S.; Kahramanoglu, E.; Cakici, F.; Pesman, E. Control of dynamic trim for planing vessels with interceptors in terms of comfort and minimum drag. Brodogradnja 2023, 74, 1–17. [Google Scholar] [CrossRef]
- Wu, H.; Ou, Y.; Ye, Q. Experimental study of air layer drag reduction on a flat plate and bottom hull of a ship with cavity. Ocean. Eng. 2019, 183, 236–248. [Google Scholar]
- Tanaka, T.; Oishi, Y.; Park, H.J.; Tasaka, Y.; Murai, Y.; Kawakita, C. Frictional drag reduction caused by bubble injection in a turbulent boundary layer beneath a 36-m-long flat-bottom model ship. Ocean. Eng. 2022, 252, 111224. [Google Scholar] [CrossRef]
- Dong, H.; Cheng, M.; Zhang, Y.; Wei, H.; Shi, F. Extraordinary drag-reducing effect of a superhydrophobic coating on a macroscopic model ship at high speed. J. Mater. Chem. A 2013, 1, 5886–5891. [Google Scholar] [CrossRef]
- Díaz Ojeda, H.R.; Oyuela, S.; Sosa, R.; Otero, A.D.; Pérez Arribas, F. Fishing Vessel Bulbous Bow Hydrodynamics—A Numerical Reverse Design Approach. J. Mar. Sci. Eng. 2024, 12, 436. [Google Scholar] [CrossRef]
- Jie, L.; Bao-Ji, Z.; Ning, X. Research on Design Optimization of High-Speed Ship Bulbous Bow Based on Nelder-Mead Algorithm. J. Ship Prod. Des. 2022, 38, 28–38. [Google Scholar] [CrossRef]
- Zhang, B.-J.; Ma, K.; Ji, Z.-S. The optimization of the hull form with the minimum wave making resistance based on Rankine source method. J. Hydrodyn. 2009, 21, 277–284. [Google Scholar] [CrossRef]
- Zhang, S.; Tezdogan, T.; Zhang, B.; Lin, L. Research on the hull form optimization using the surrogate models. Eng. Appl. Comput. Fluid Mech. 2021, 15, 747–761. [Google Scholar] [CrossRef]
- Zhang, S.; Zhang, B.; Tezdogan, T.; Xu, L.; Lai, Y. Computational fluid dynamics-based hull form optimization using approximation method. Eng. Appl. Comput. Fluid Mech. 2018, 12, 74–88. [Google Scholar] [CrossRef]
- Maki, A.; Arai, J.; Tsutsumoto, T.; Suzuki, K.; Miyauchi, Y. Fundamental research on resistance reduction of surface combatants due to stern flaps. J. Mar. Sci. Technol. 2016, 21, 344–358. [Google Scholar] [CrossRef]
- Song, K.-W.; Guo, C.-Y.; Wang, C.; Sun, C.; Li, P.; Wang, W. Numerical analysis of the effects of stern flaps on ship resistance and propulsion performance. Ocean. Eng. 2019, 193, 106621. [Google Scholar] [CrossRef]
- Deng, R.; Chen, S.; Wu, T.; Luo, F.; Jiang, D.; Li, Y. Investigation on the influence induced by interceptor on the viscous flow field of deep-Vee vessel. Ocean. Eng. 2020, 196, 106735. [Google Scholar] [CrossRef]
- Song, K.-W.; Gong, J.; Ma, J.; Xu, Q.; Shi, Y.; Xu, F. Numerical study on the influence of interceptor and stern flap on ship resistance and motion response in regular waves. J. Mar. Sci. Eng. 2024, 12, 929. [Google Scholar] [CrossRef]
- Ashkezari, A.Z.; Moradi, M. Three-dimensional simulation and evaluation of the hydrodynamic effects of stern wedges on the performance and stability of high-speed planing monohull craft. Appl. Ocean. Res. 2021, 110, 102585. [Google Scholar] [CrossRef]
- Yousefifard, M.; Maboodi, A. Numerical and experimental study of the stern wedge effects on the hydrodynamics performance of a semi-displacement catamaran in calm water. J. Appl. Fluid Mech. 2020, 14, 401–415. [Google Scholar]
- Çelik, C.; Danışman, D.B.; Khan, S.; Kaklis, P. A reduced order data-driven method for resistance prediction and shape optimization of hull vane. Ocean. Eng. 2021, 235, 109406. [Google Scholar] [CrossRef]
- Soma, G.C.; Vijayakumar, R. Hydrodynamic performance of high-speed displacement vessel with hull vane. Ocean. Eng. 2023, 285, 115362. [Google Scholar] [CrossRef]
- Wang, W.; Liu, Z.; Zhang, J. Design and experiment study on wave suppression and drag reduction appendage for high-speed ship with deep V formation. Shipbuild. China 2017, 58, 38–45. [Google Scholar]
- Liu, Z.; Liu, W.; Chen, Q.; Luo, F.; Zhai, S. Resistance reduction technology research of high speed ships based on a new type of bow appendage. Ocean. Eng. 2020, 206, 107246. [Google Scholar] [CrossRef]
- Guo, B.; Deng, G.; Steen, S. Verification and validation of numerical calculation of ship resistance and flow field of a large tanker. Ships Offshore Struct. 2013, 8, 3–14. [Google Scholar] [CrossRef]
- Larsson, L.; Stern, F.; Visonneau, M. CFD in ship hydrodynamics—Results of the Gothenburg 2010 workshop. In MARINE 2011, IV International Conference on Computational Methods in Marine Engineering: Selected Papers; Springer: Dordrecht, The Netherlands, 2013; pp. 237–259. [Google Scholar]
- Ahn, S.H.; Kim, K.H.; Park, C. Development of a virtual towing tank for ship hydrodynamic performance prediction. J. Ship Res. 2016, 60, 151–162. [Google Scholar]
- Lee, J.W.; Park, S.Y. Numerical simulation of propeller performance using RANS and LES models in a virtual towing tank. Ocean. Eng. 2017, 131, 442–455. [Google Scholar]
- Zheku, V.V.; Villa, D.; Piaggio, B.; Gaggero, S.; Viviani, M. Assessment of Numerical Captive Model Tests for Underwater Vehicles: The DARPA SUB-OFF Test Case. J. Mar. Sci. Eng. 2023, 11, 2325. [Google Scholar] [CrossRef]
- Pena, B.; Huang, L. A review on the turbulence modelling strategy for ship hydrodynamic simulations. Ocean. Eng. 2021, 241, 110082. [Google Scholar] [CrossRef]
- Deng, R.; Huang, D.-B.; Zhou, G.-L.; Sun, H.-W. Investigation on some factors effecting ship resistance calculation with CFD code FLUENT. J. Ship Mech. 2013, 17, 616–624. [Google Scholar]
- Hirt, C.W.; Nichols, B.D. Volume of fluid (VOF) method for the dynamics of free boundaries. J. Comput. Phys. 1981, 39, 201–225. [Google Scholar] [CrossRef]
- Resistance Committee of 23rd ITTC. Uncertainty Analysis in CFD Verification and Validation, Methodology and Procedures. ITTC—Quality System Manual Recommended Procedures and Guidelines 7, 5-03-01-01. ITTC, 2003. Available online: https://ittc.info/media/1922/75-03-01-01.pdf (accessed on 7 July 2024).


Disclaimer/Publisher’s Note: The statements, opinions and data contained in all publications are solely those of the individual author(s) and contributor(s) and not of MDPI and/or the editor(s). MDPI and/or the editor(s) disclaim responsibility for any injury to people or property resulting from any ideas, methods, instructions or products referred to in the content. |
© 2024 by the authors. Licensee MDPI, Basel, Switzerland. This article is an open access article distributed under the terms and conditions of the Creative Commons Attribution (CC BY) license (https://creativecommons.org/licenses/by/4.0/).