
Analysis of Production Laws of Hydrate Reservoirs via Combined Heat Injection and Depressurization Based on Local Thermal Non-Equilibrium

Abstract
:1. Introduction
2. Model Building
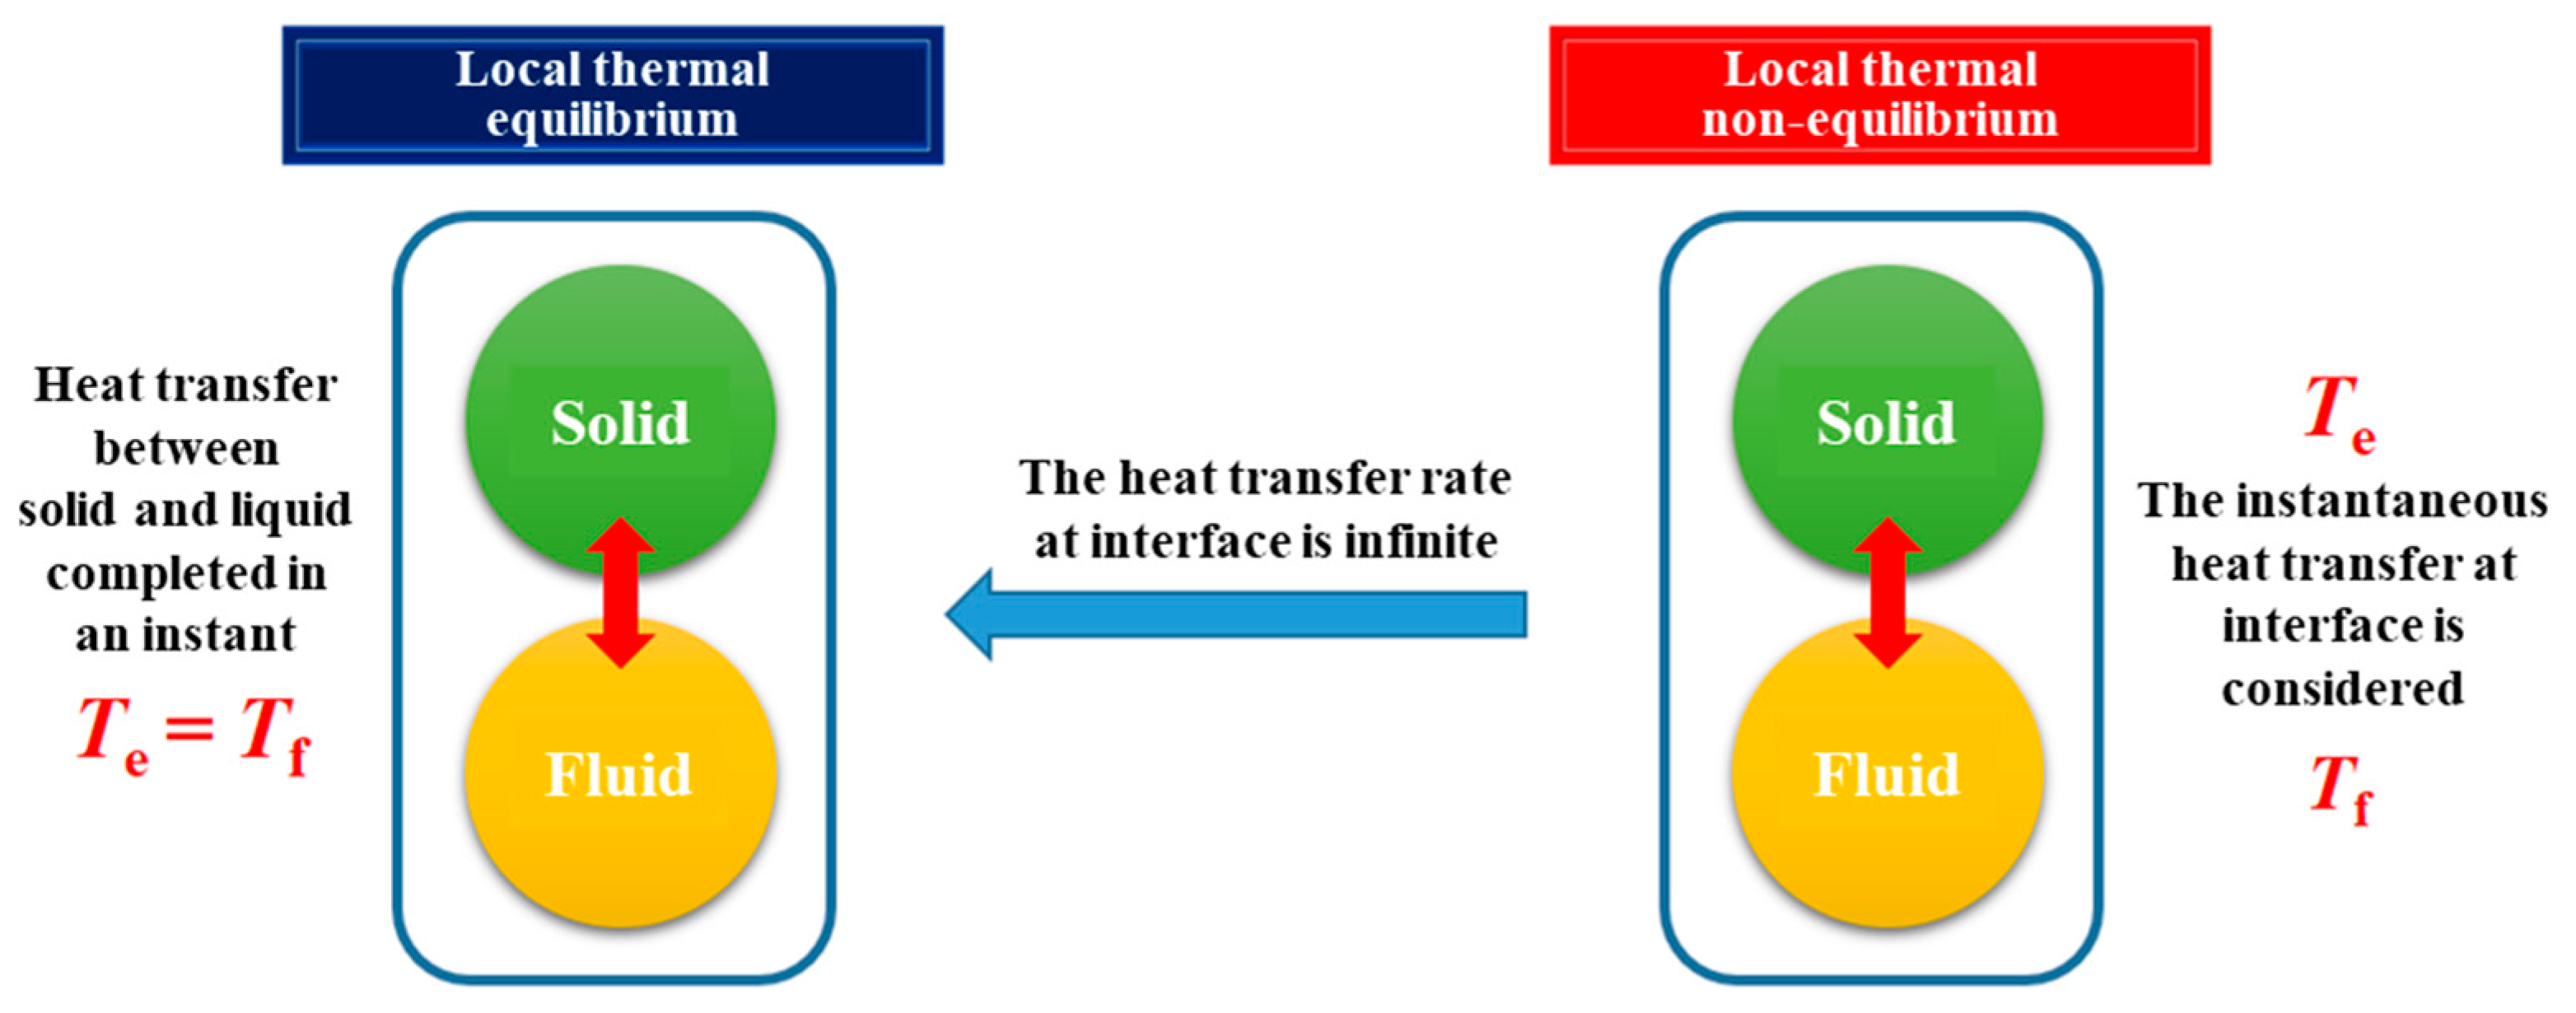
2.1. The Difference between a Fluid–Solid Local Thermal Non-Equilibrium (LTNE) Model and Fluid–Solid Thermal Equilibrium (LTE) Model
2.2. Building of the Unsteady Heat Transfer Model Considering Fluid–Solid Thermal Non-Equilibrium in the Porous Medium
2.2.1. Assumptions in the Model Building
2.2.2. Energy Equation of the Solid Phase
2.2.3. Energy Equation of the Fluid
2.2.4. Interfacial Convective Heat Transfer Equation
2.2.5. Auxiliary Equations
3. Numerical Solution
3.1. Simulation of a Hydrate Reservoir in the X2 Sea Area
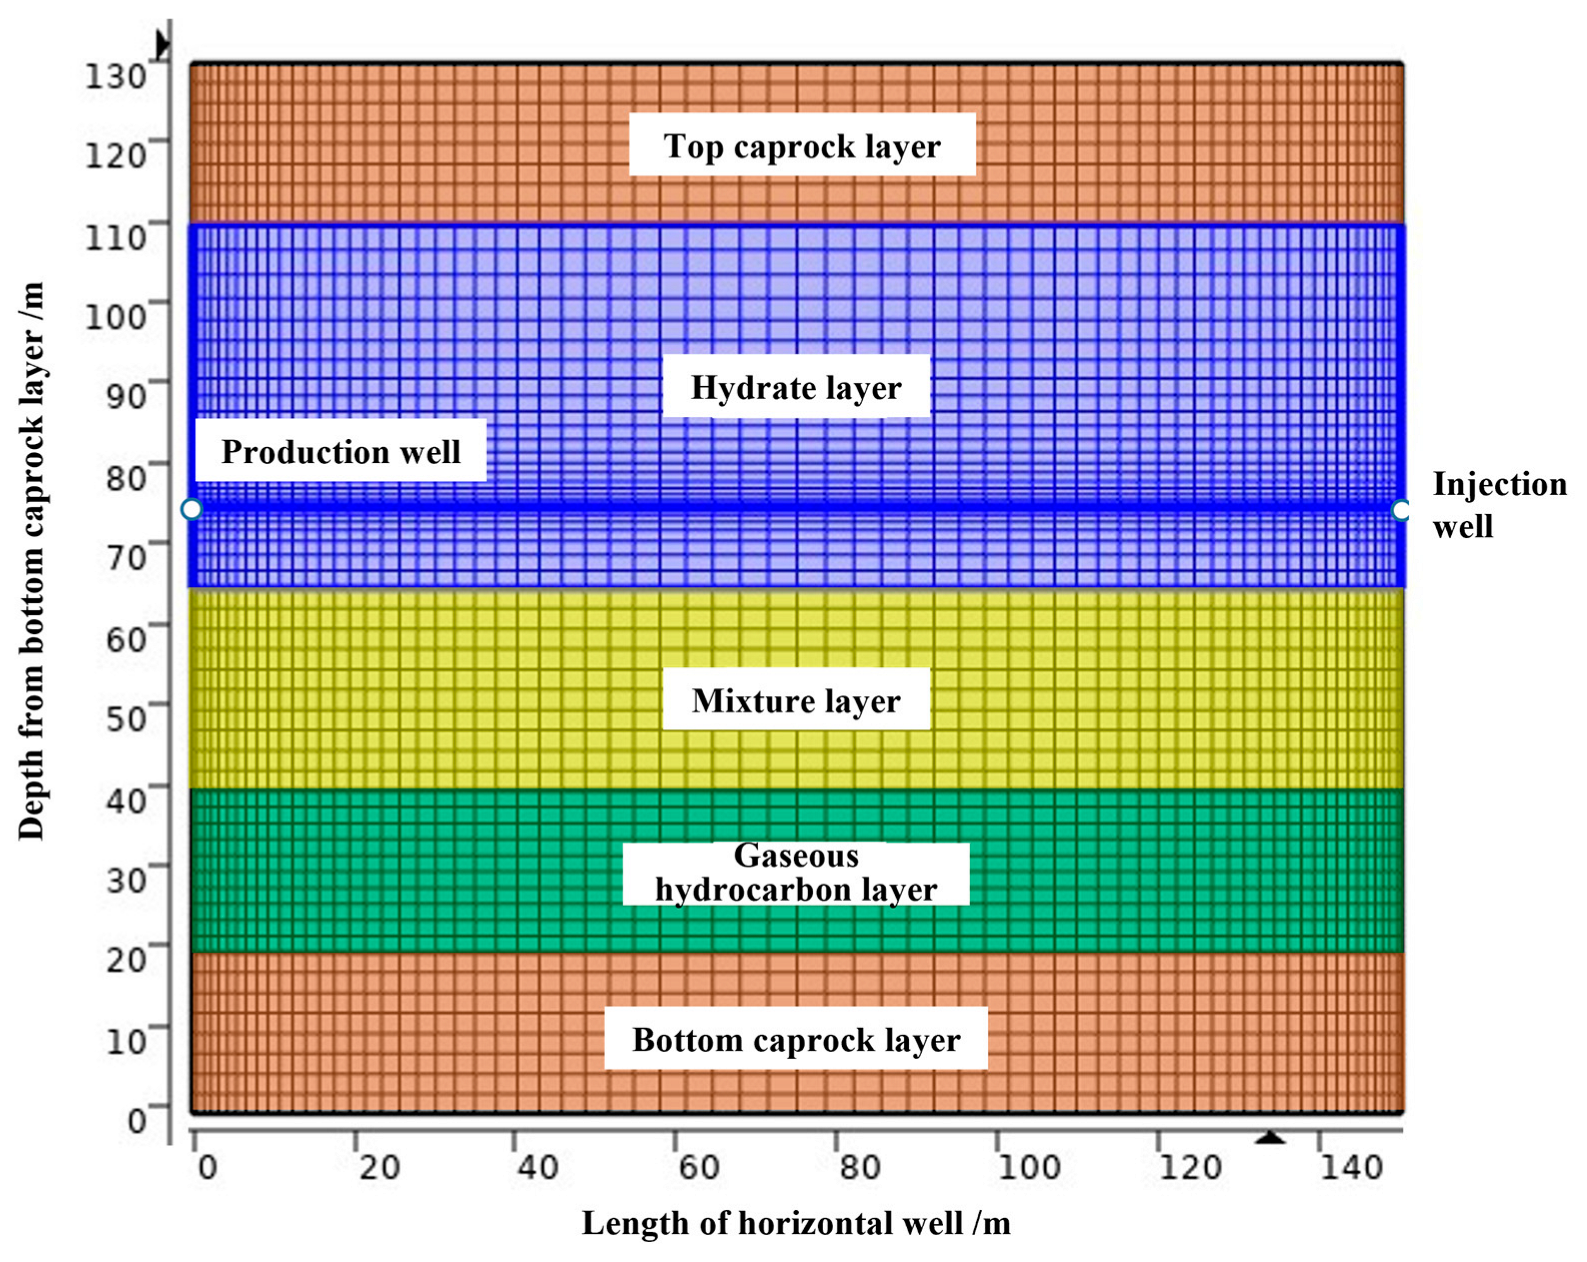
3.2. Numerical Model of the Hydrate Reservoir’s Development
4. Analysis of Production Laws
4.1. Production Patterns of Fluids during Hydrate Extraction
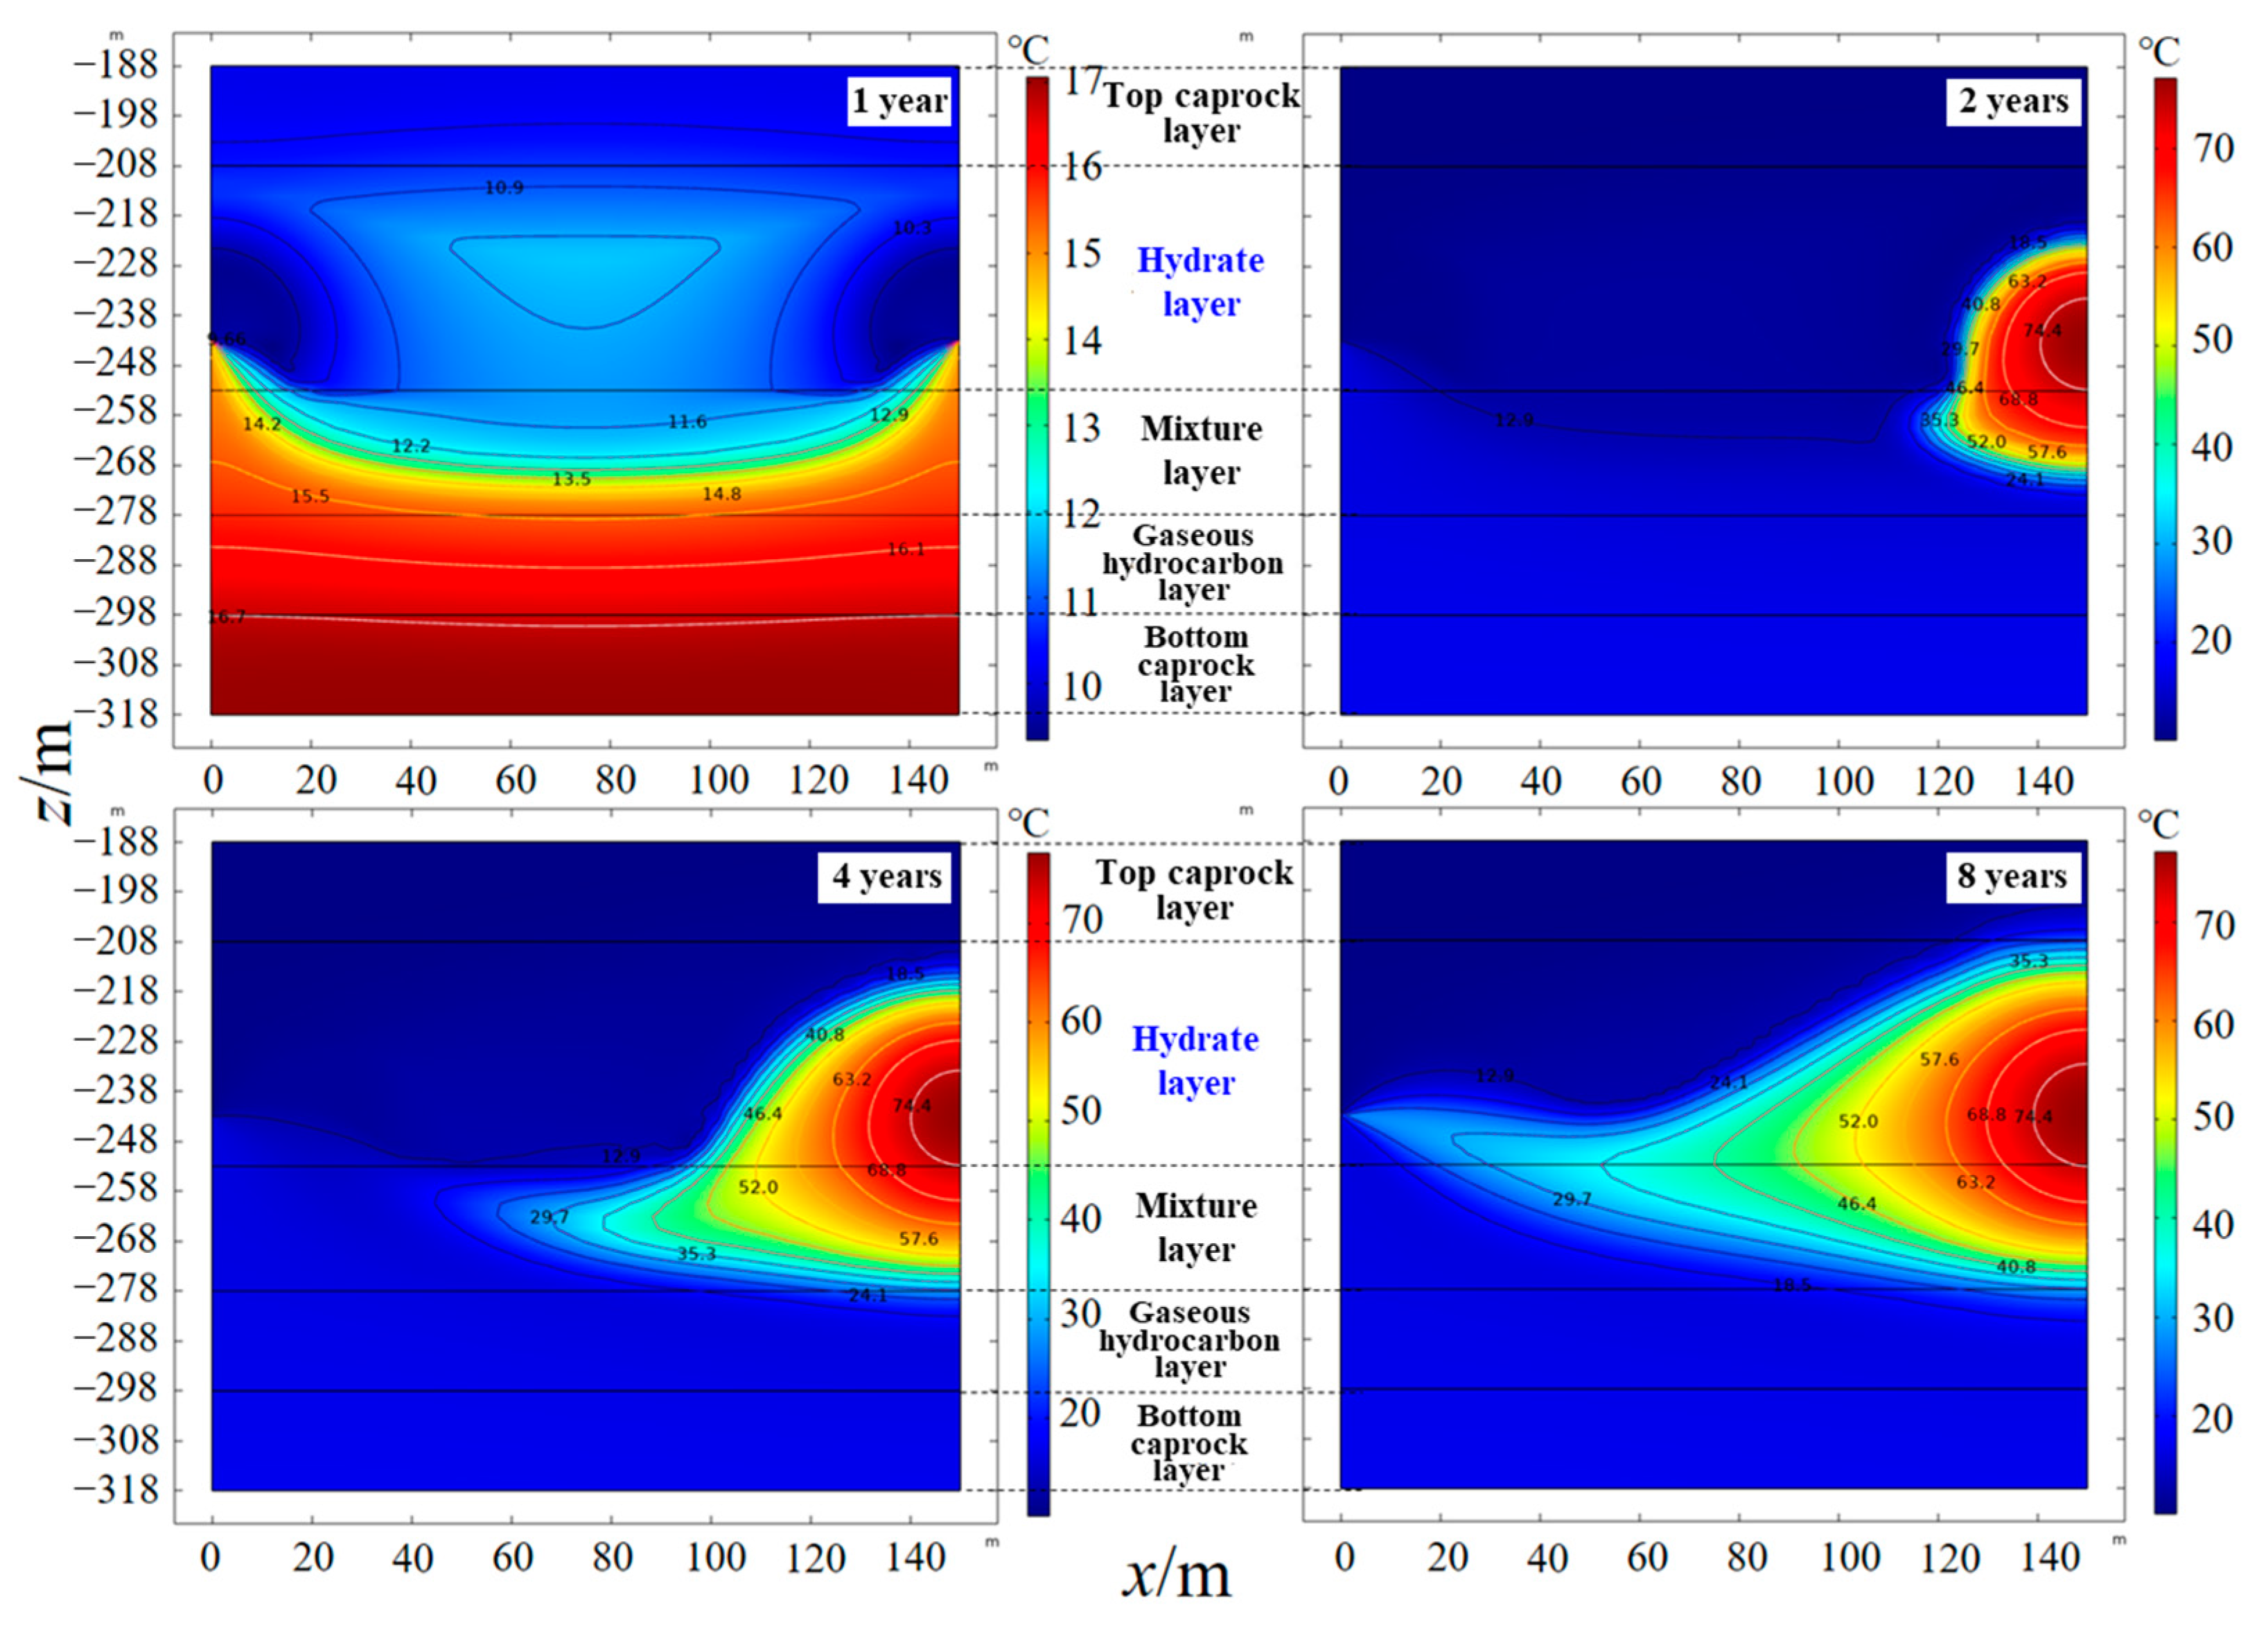
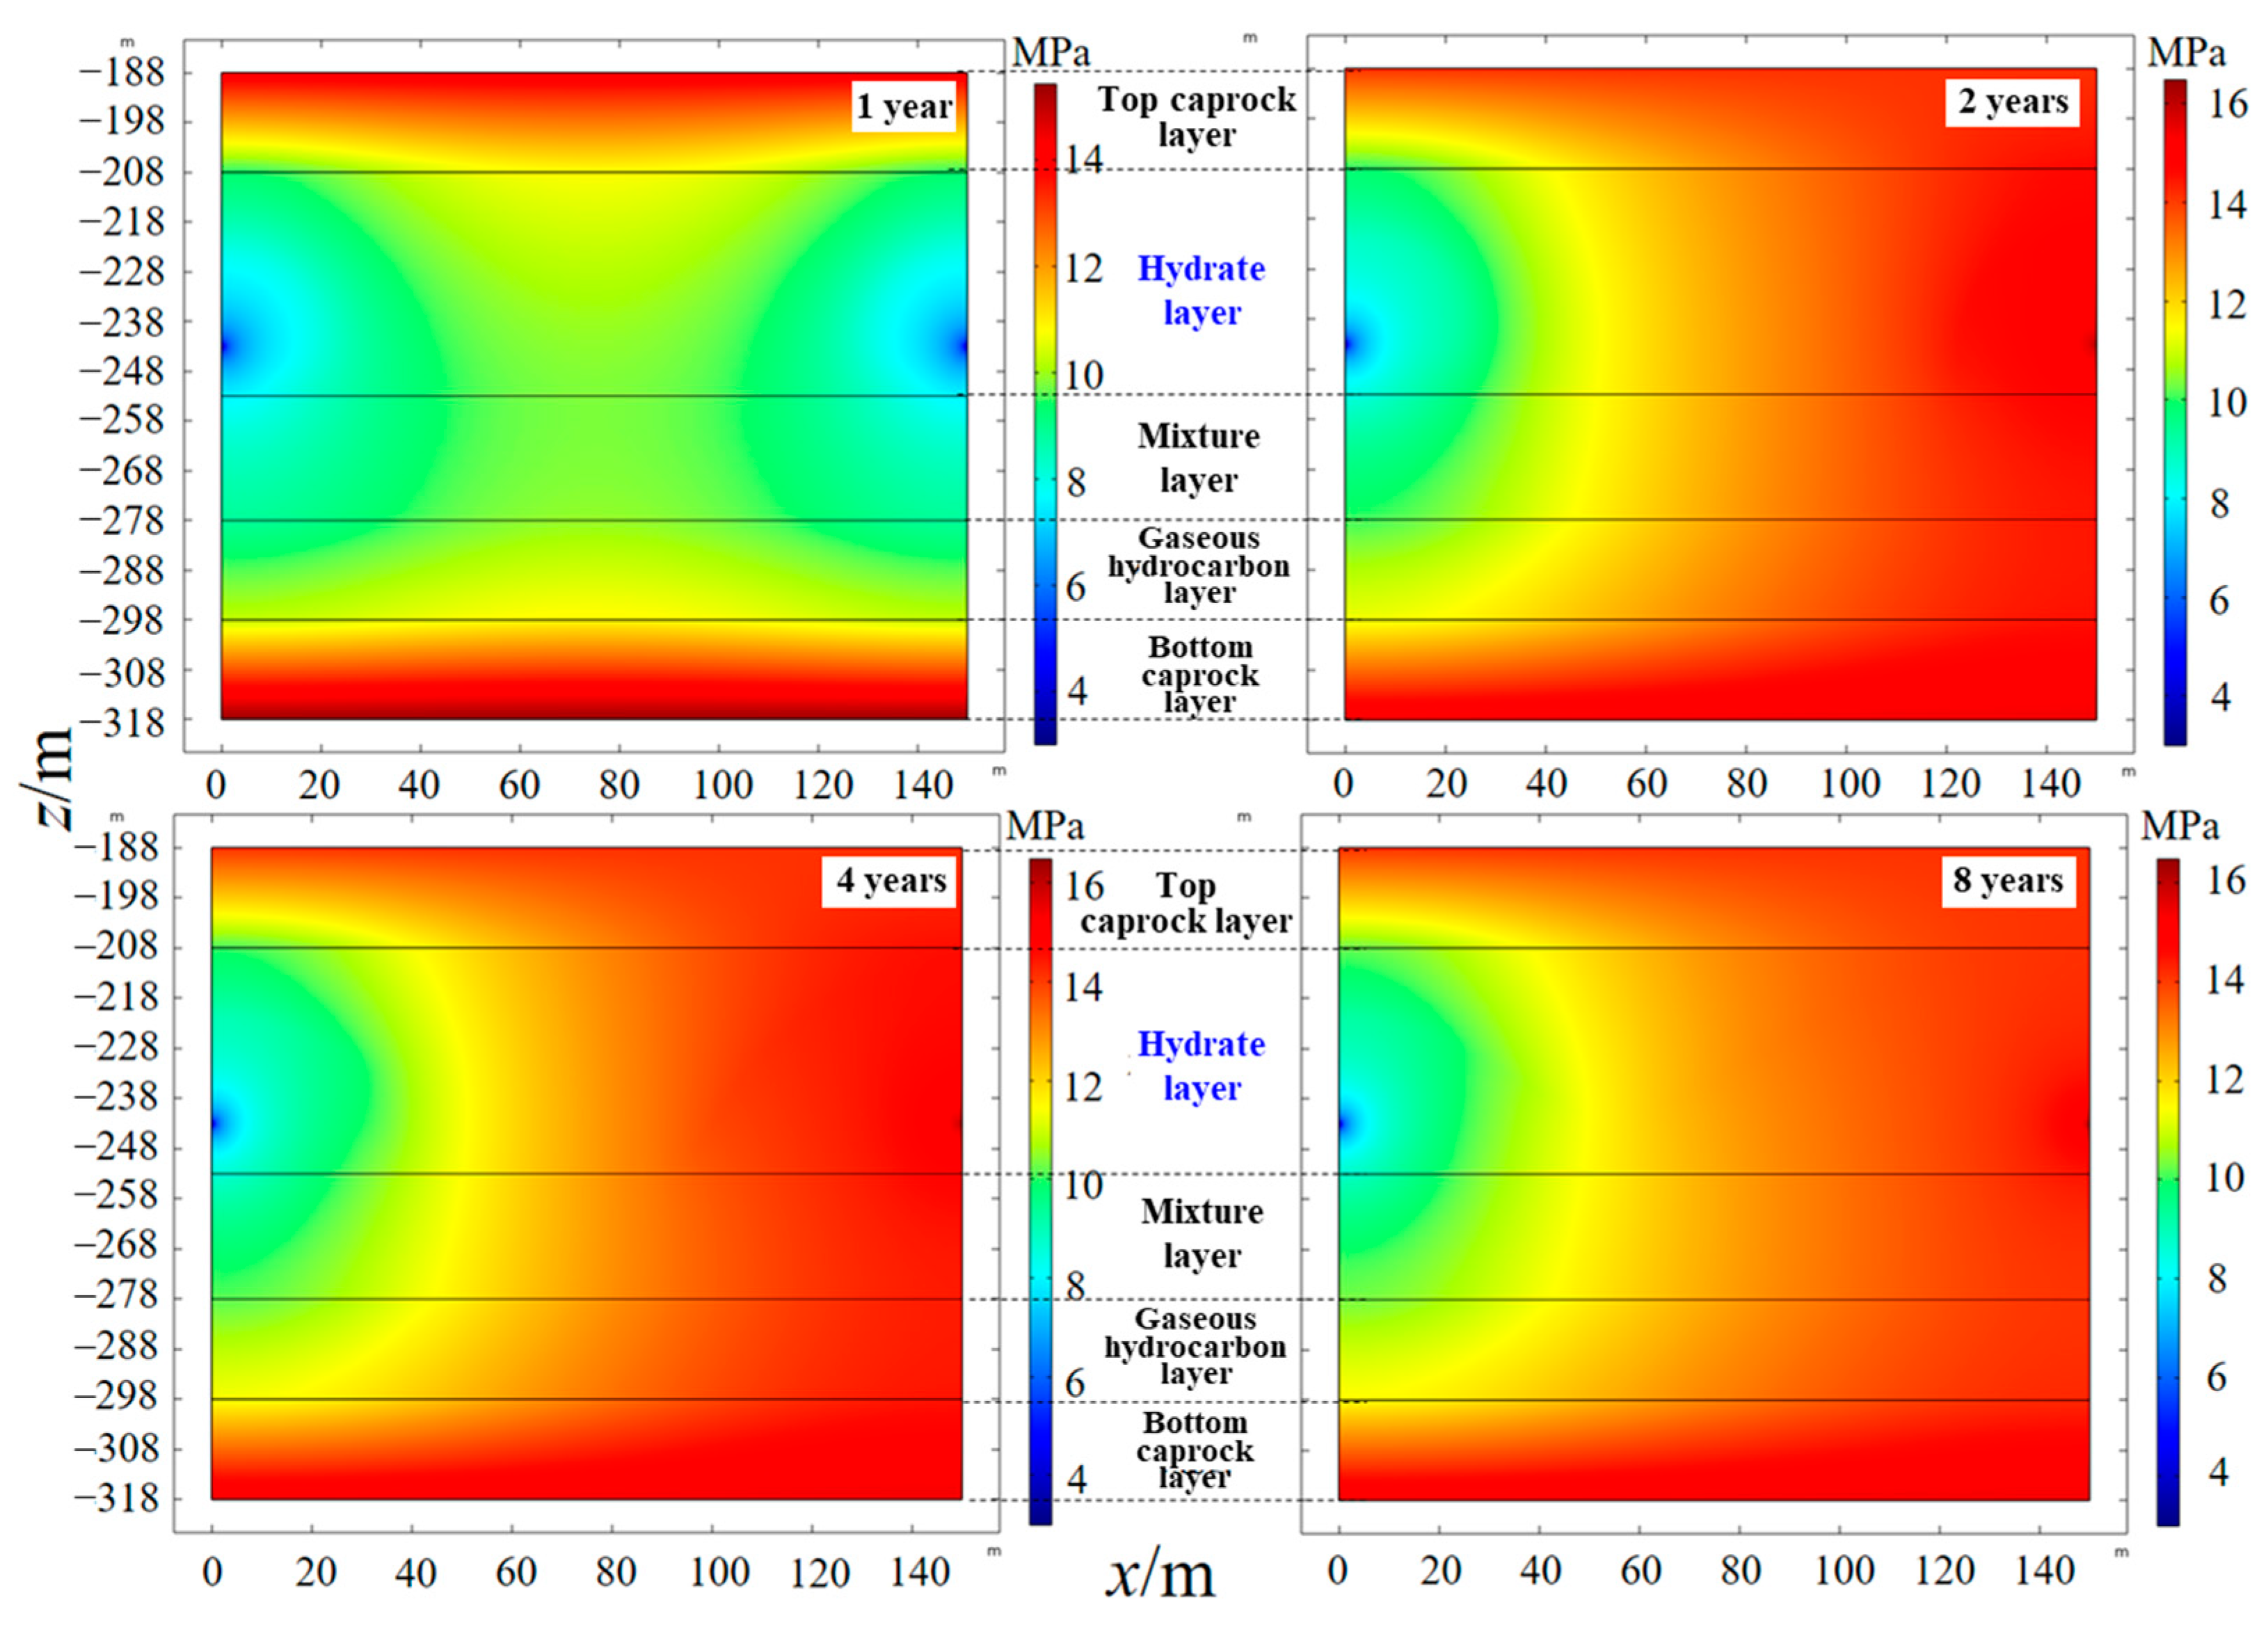
4.2. Temperature and Pressure Response Characteristics of the Hydrate Reservoir
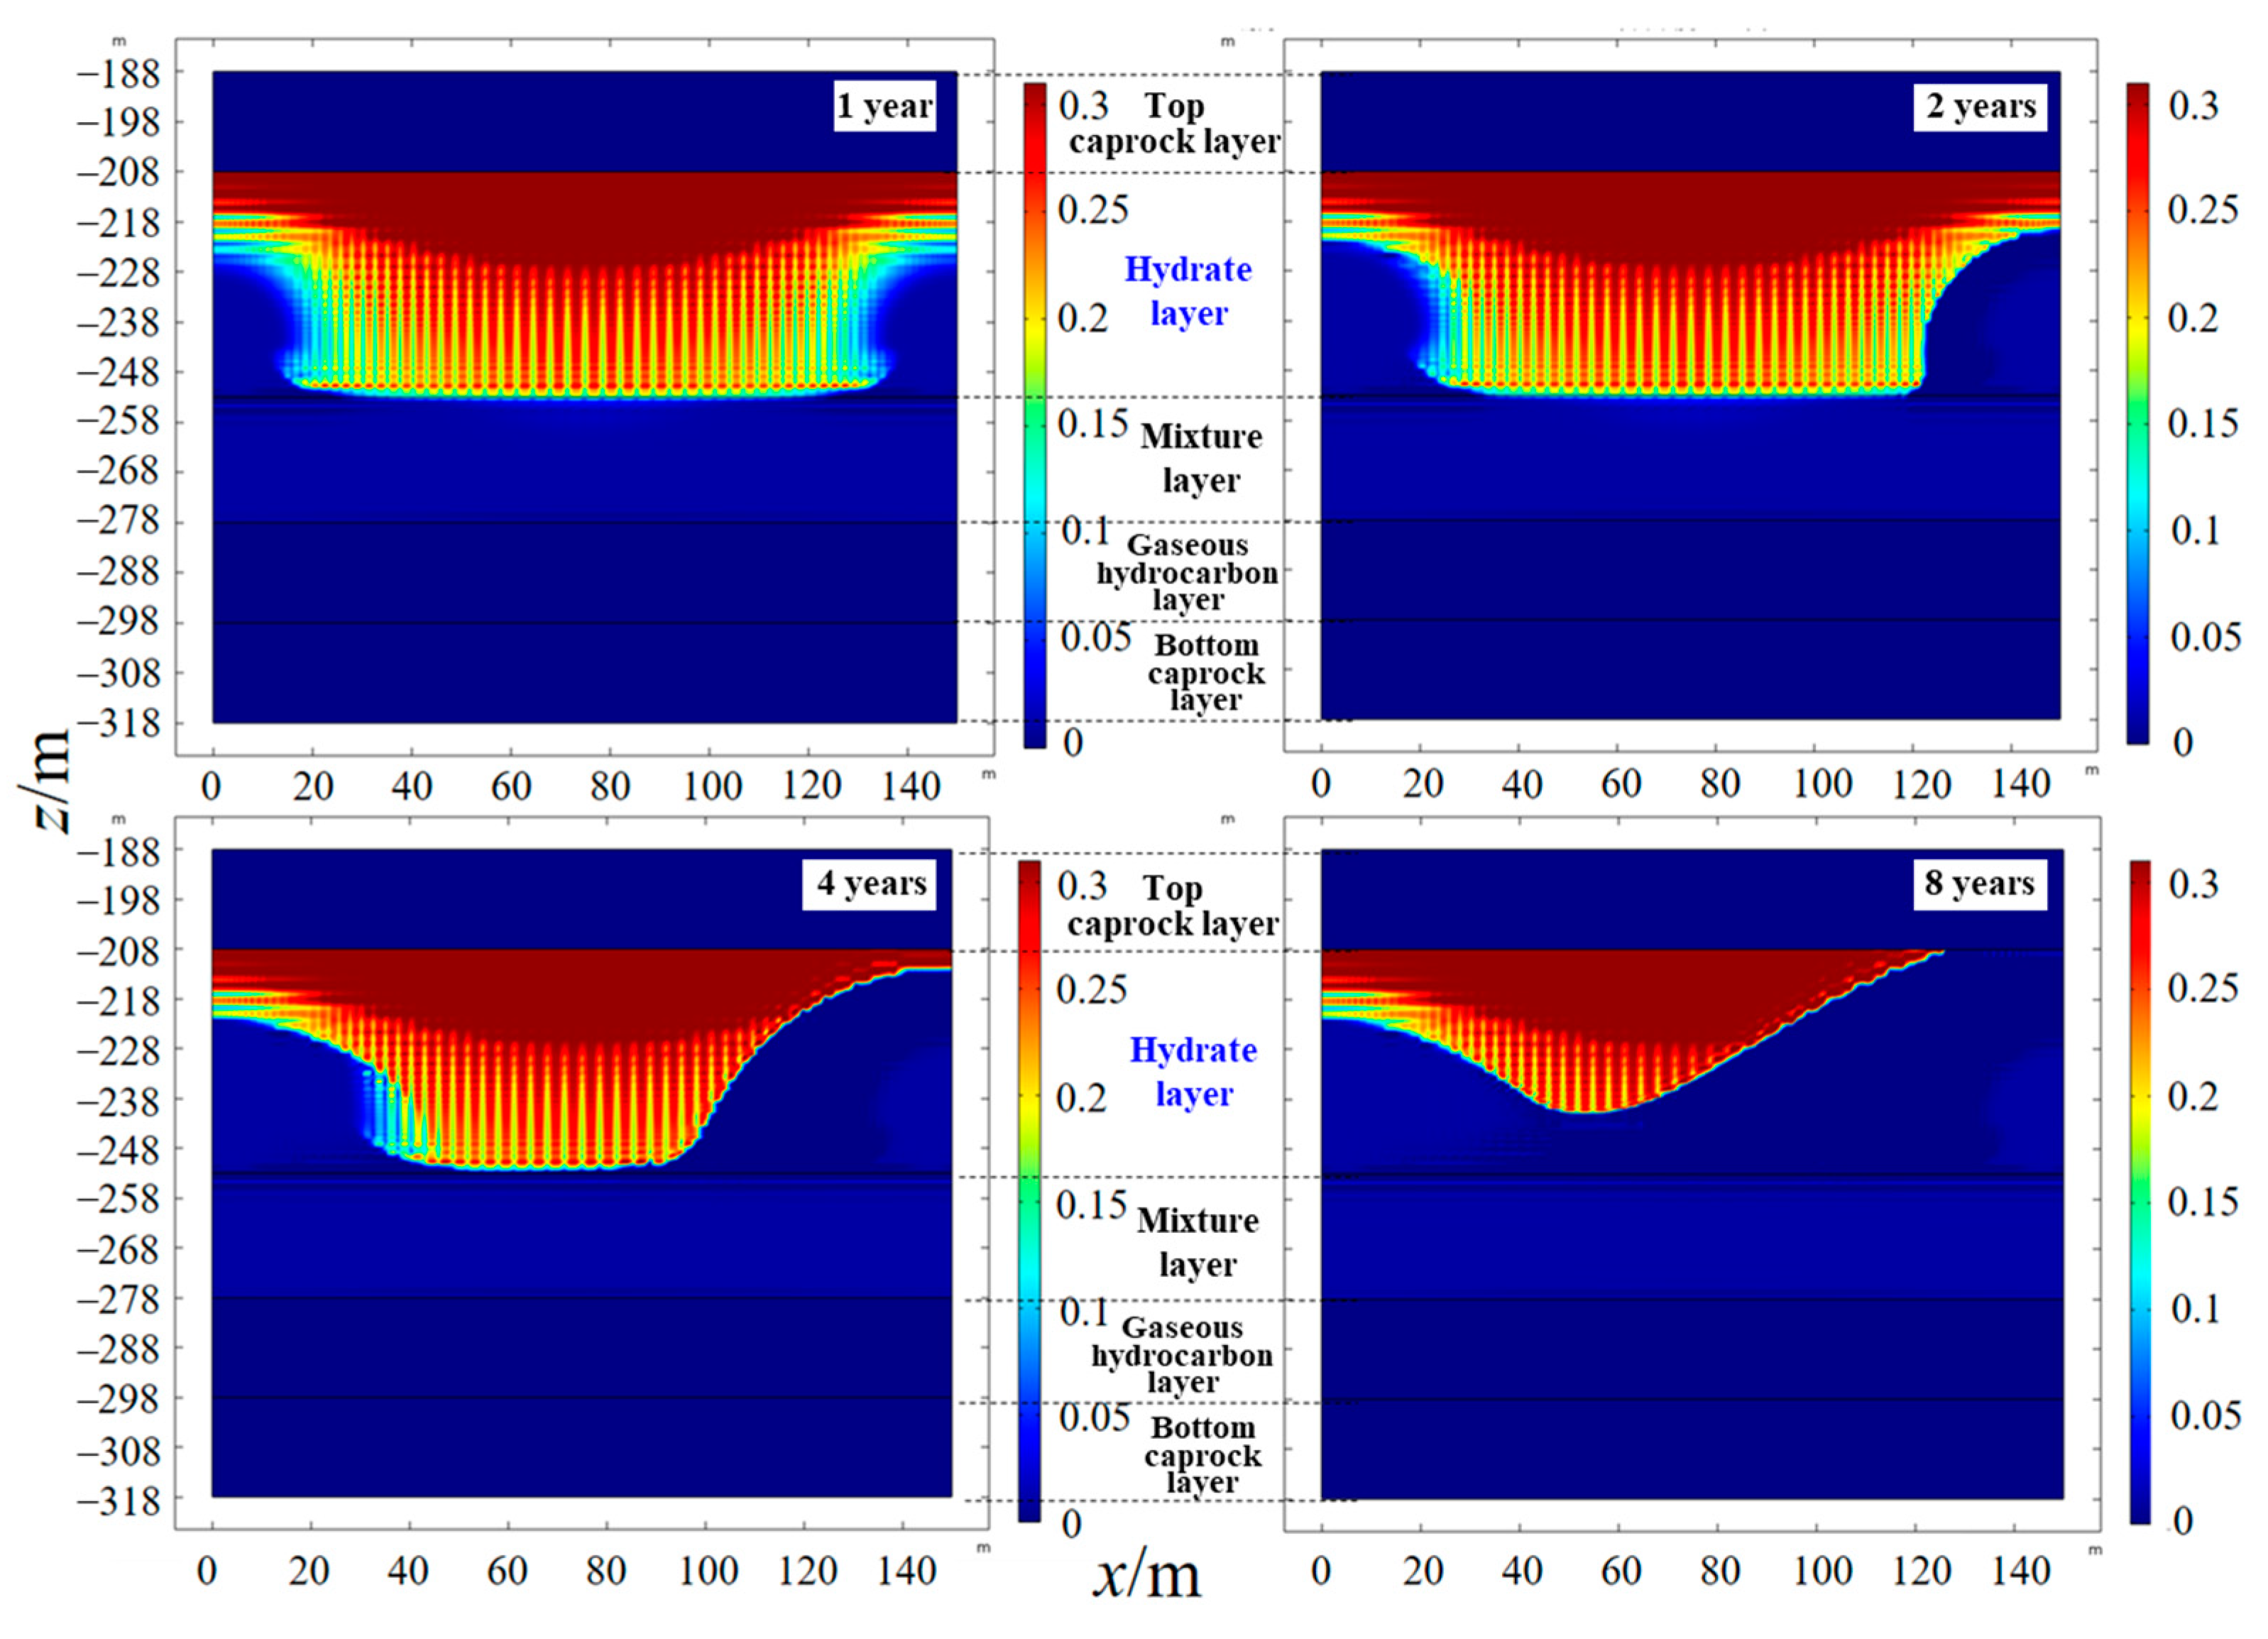
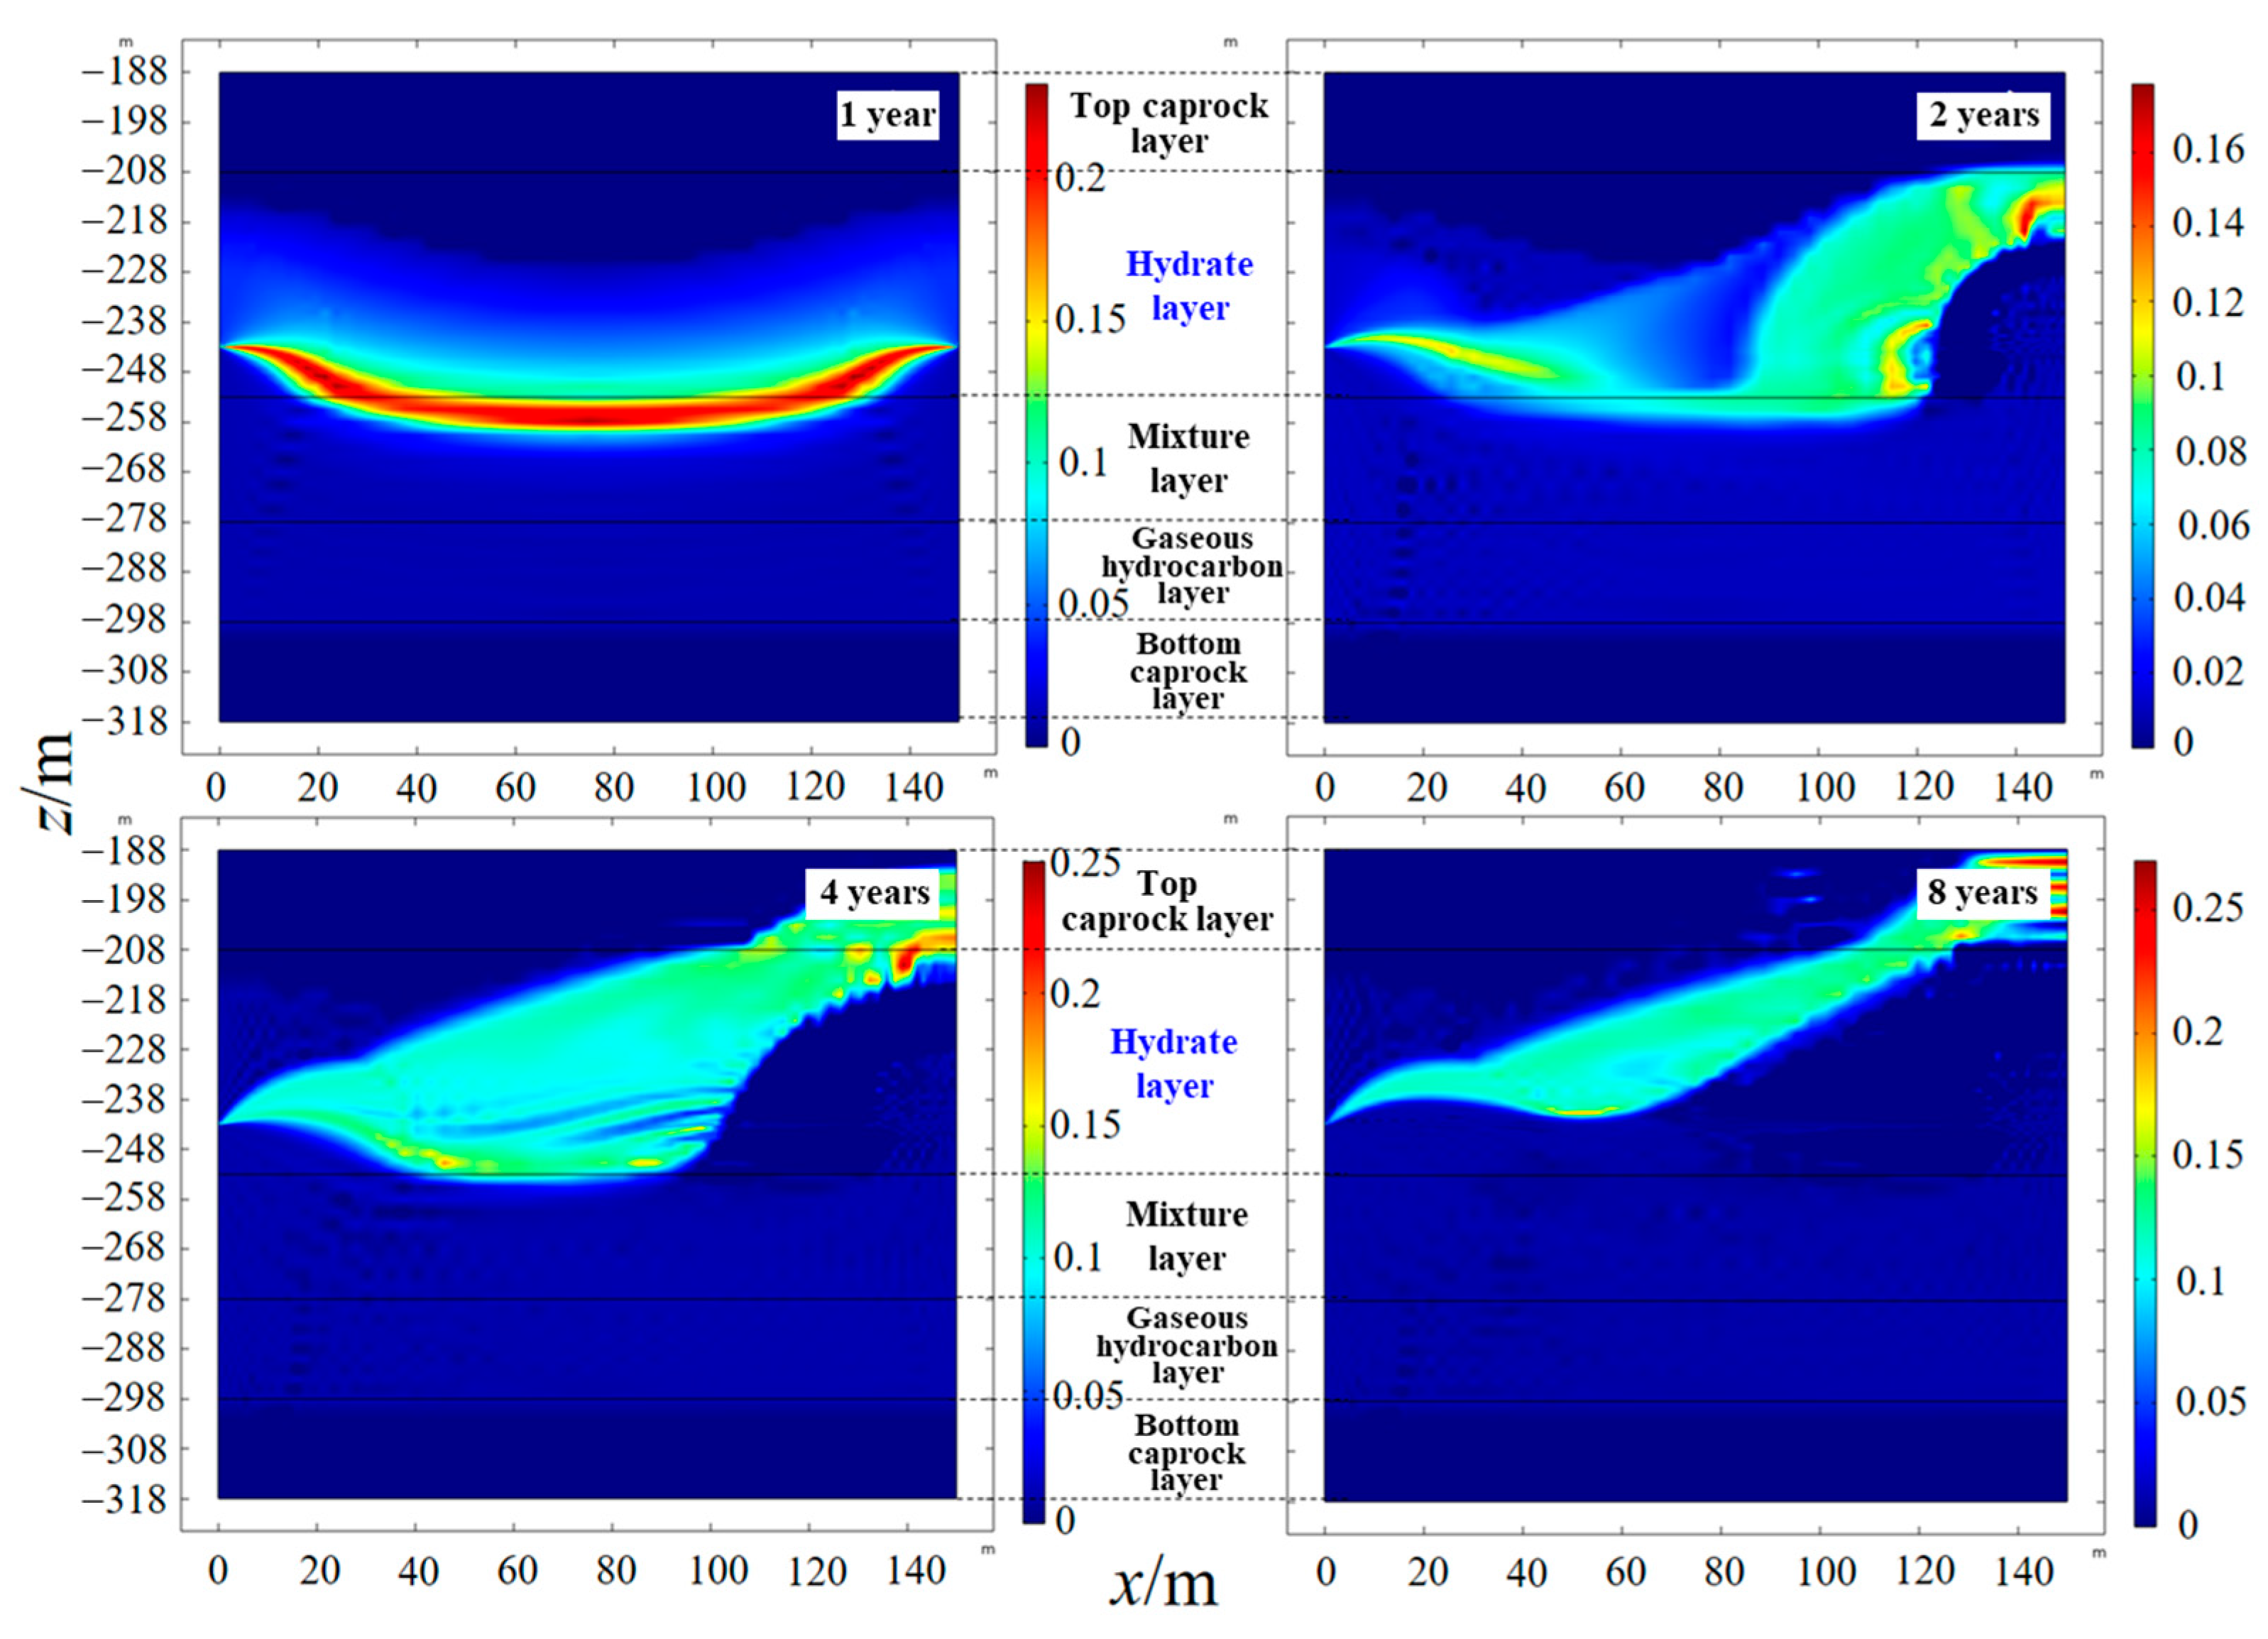
4.3. Spatial Distribution of Saturation
5. Conclusions
- (1)
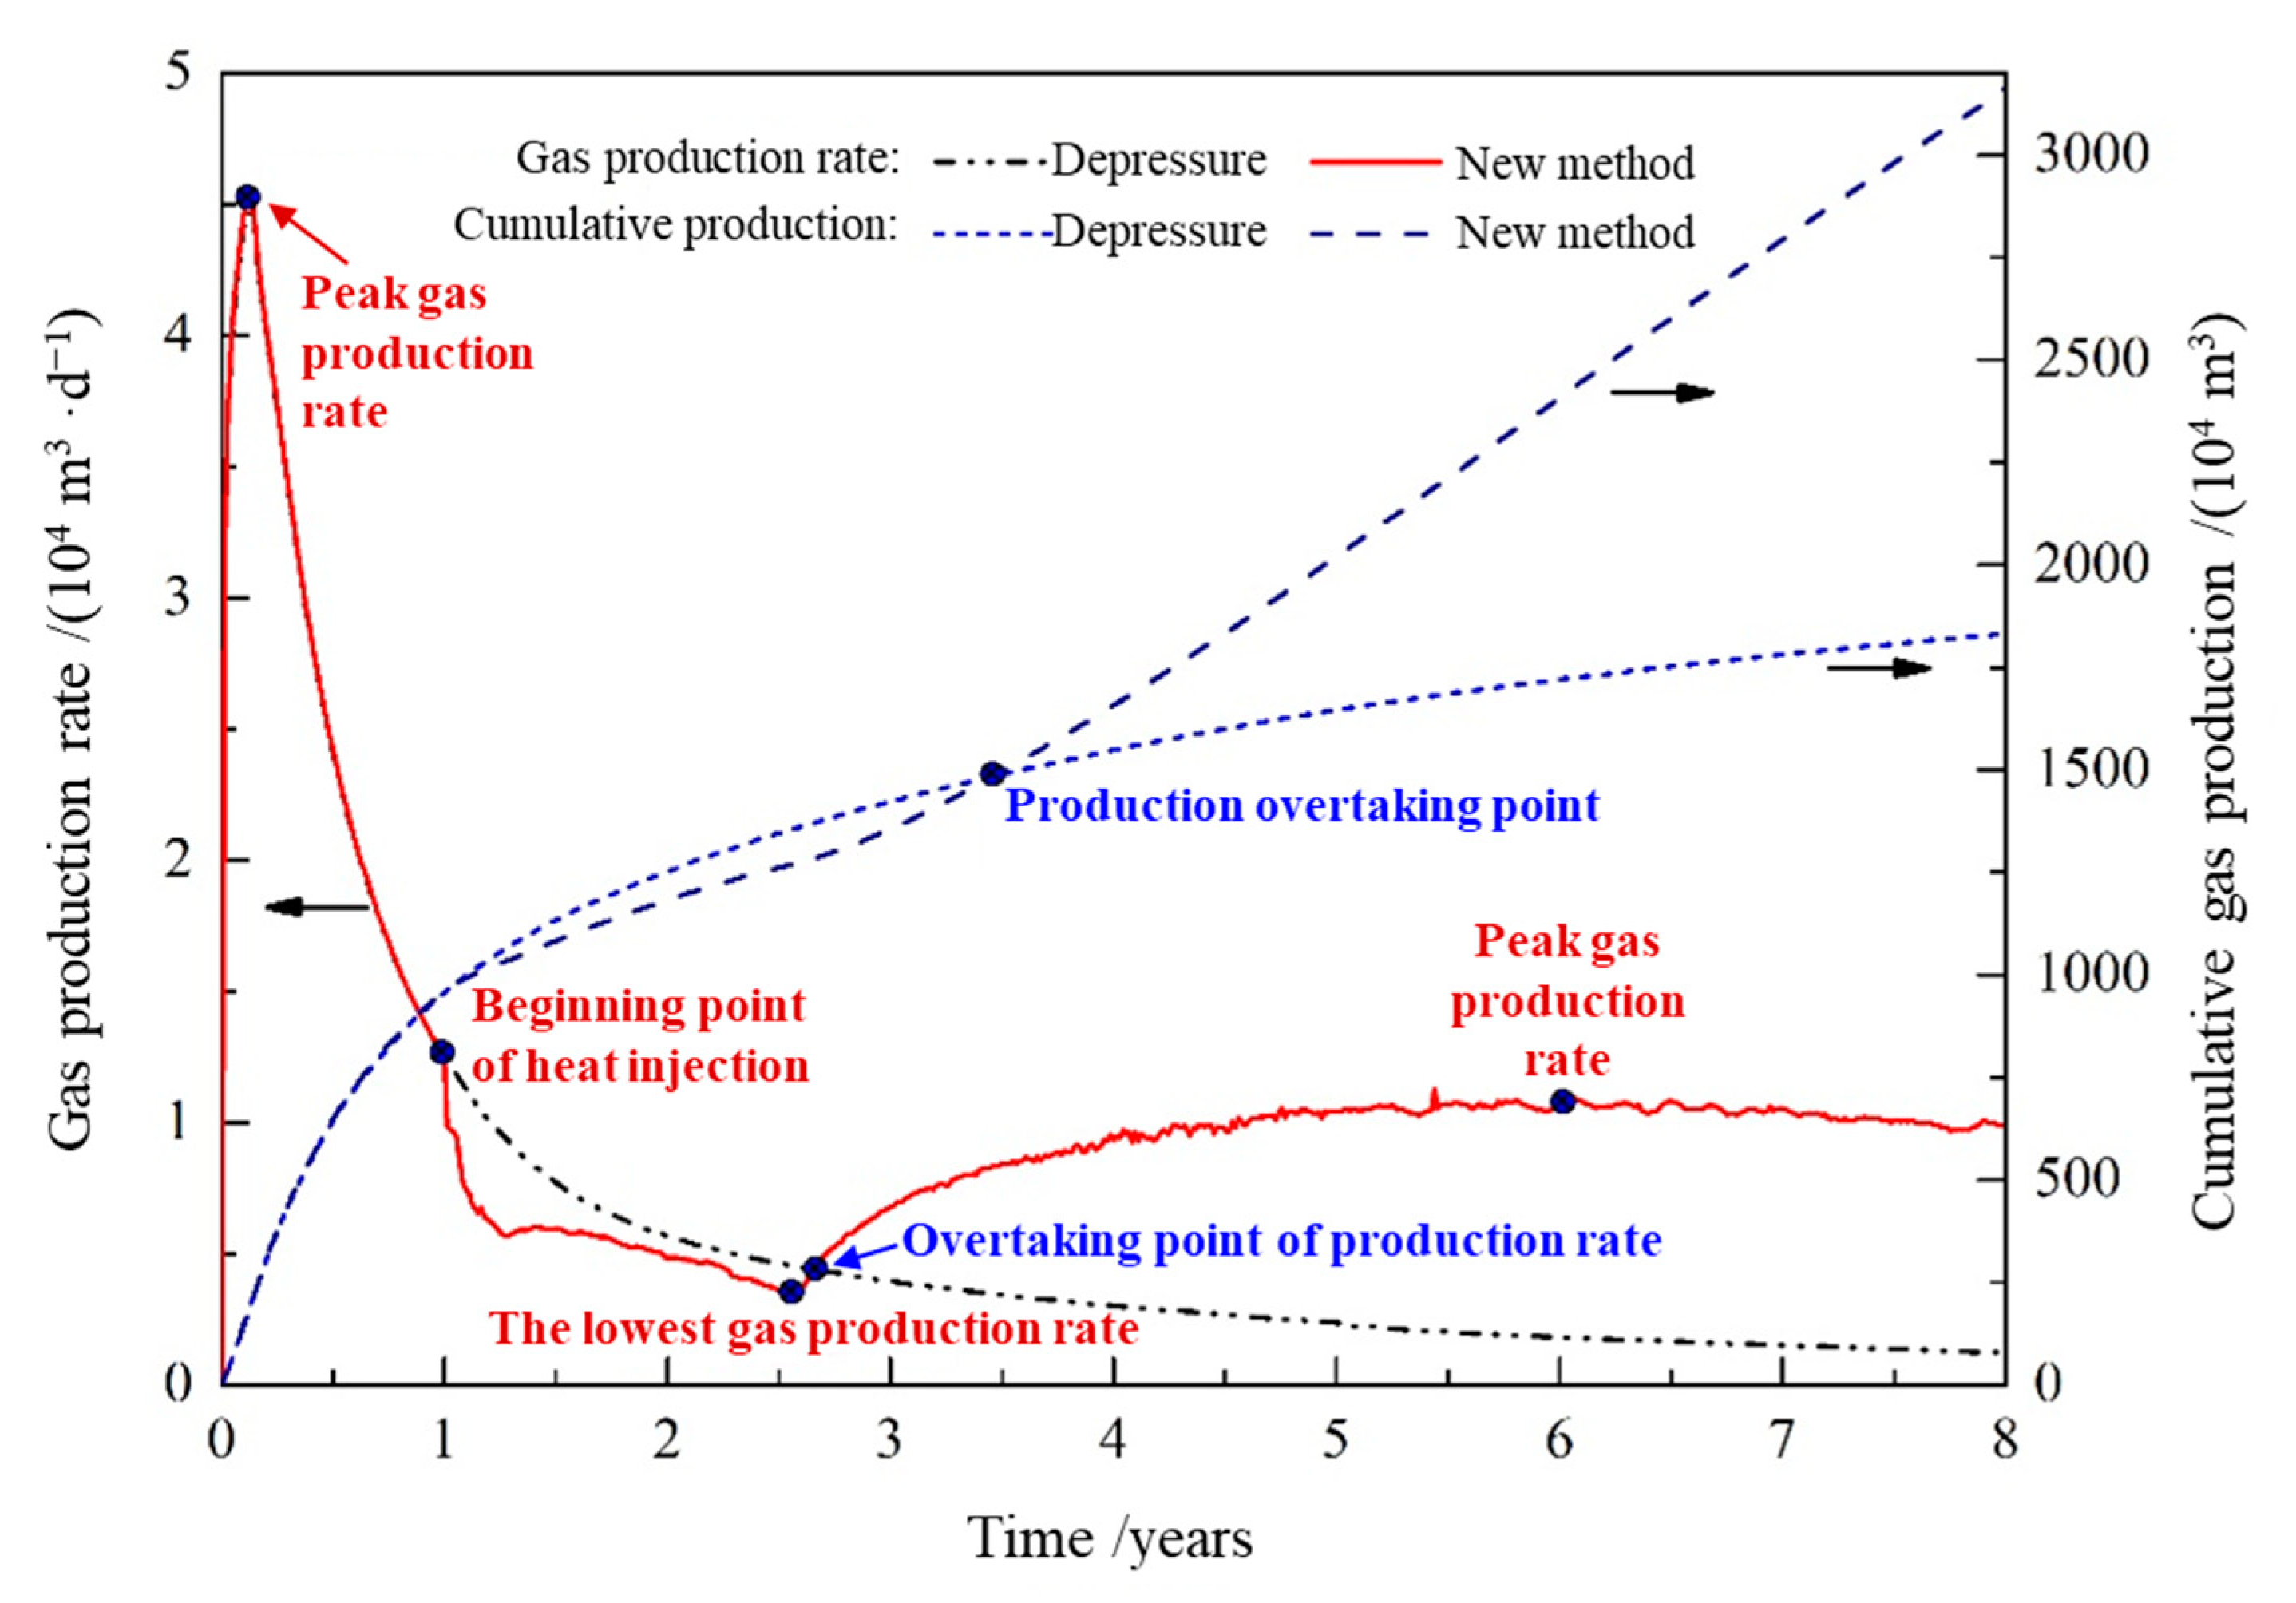
- The whole hydrate development process can be subdivided into five stages, with the turning points of the trends in the gas production rate as the dividing points: the initial stage of depressurization (0–50 days), the remaining depressurization period (from the 50th day to 1 year), the early stage of heat injection (from the end of the 1st year to 2.6 years), the middle stage of heat injection (2.6–6.1 years of production), and the later stage of heat injection (6.0–8.0 years).
- (2)
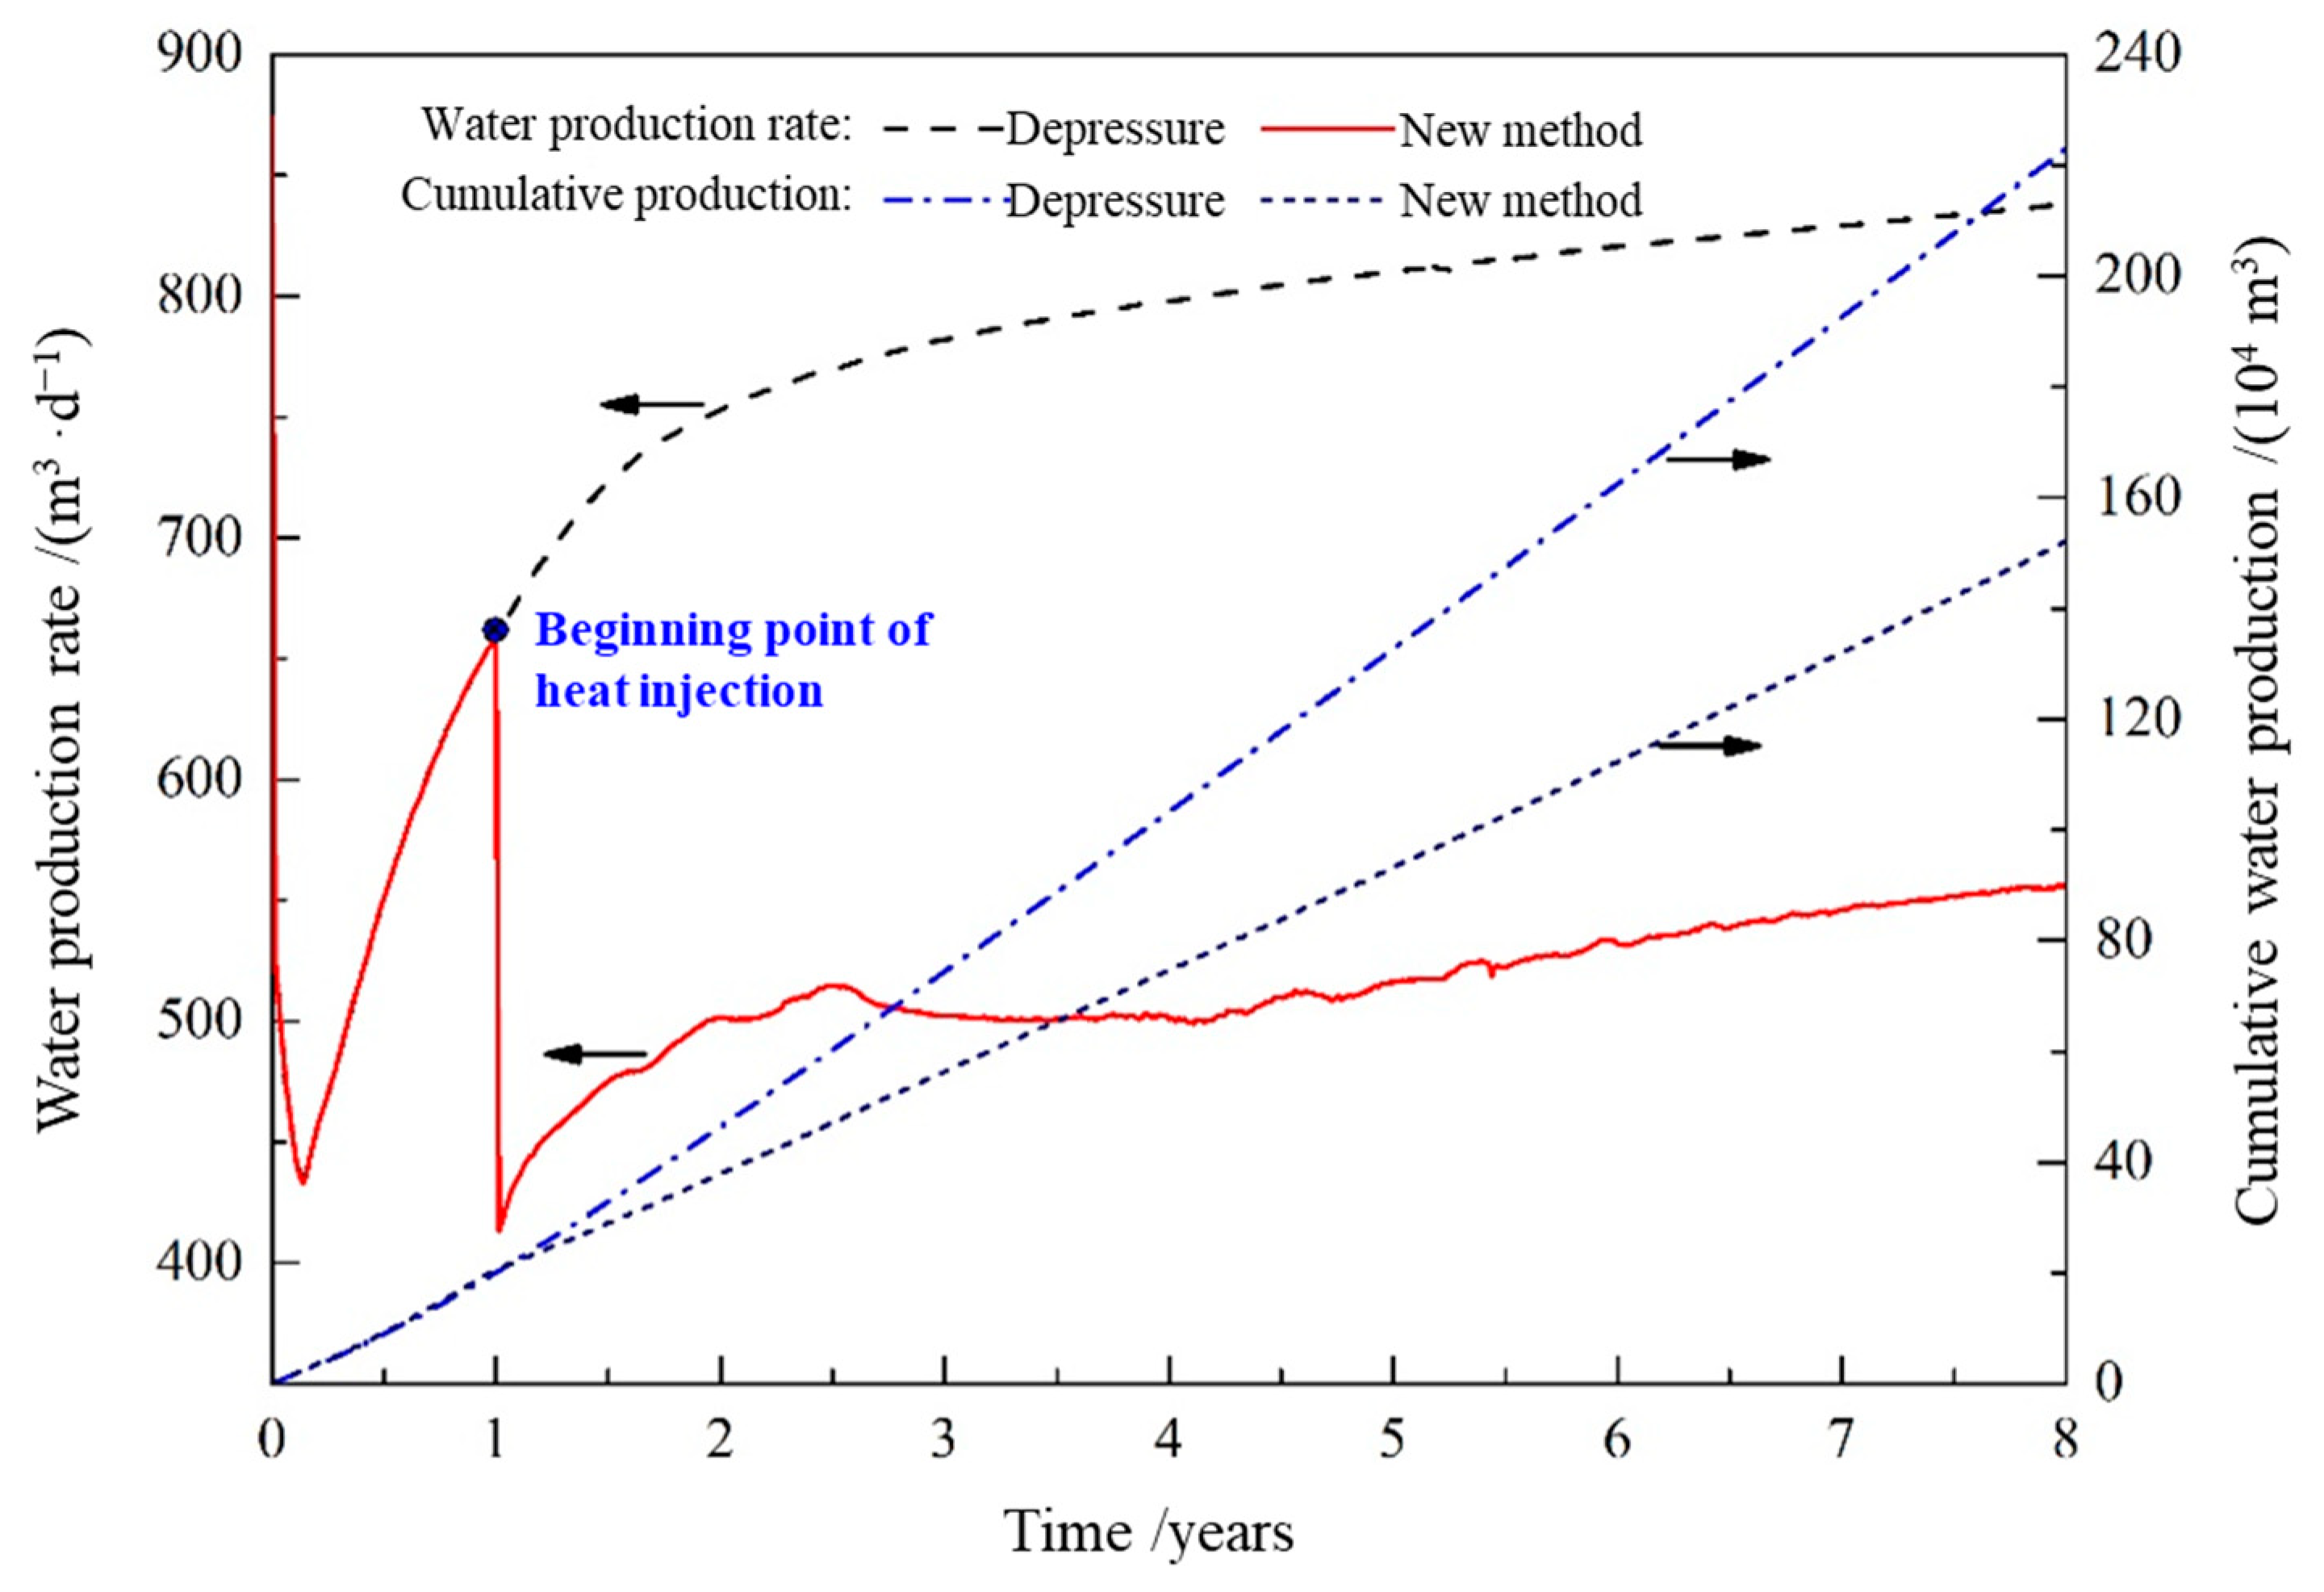
- In this 8-year production cycle, hydrate extraction by depressurization alone would have a cumulative gas production of 18.3166 million m3 and a cumulative water production of 2.2298 million m3, in comparison, the hydrate extraction conducted using a combined heat injection and depressurization would have a cumulative gas production of 31.609 million m3 and a cumulative water production of 1.5219 million m3, which are 72.57% higher and 31.75% lower than those of depressurization alone, respectively.
- (3)
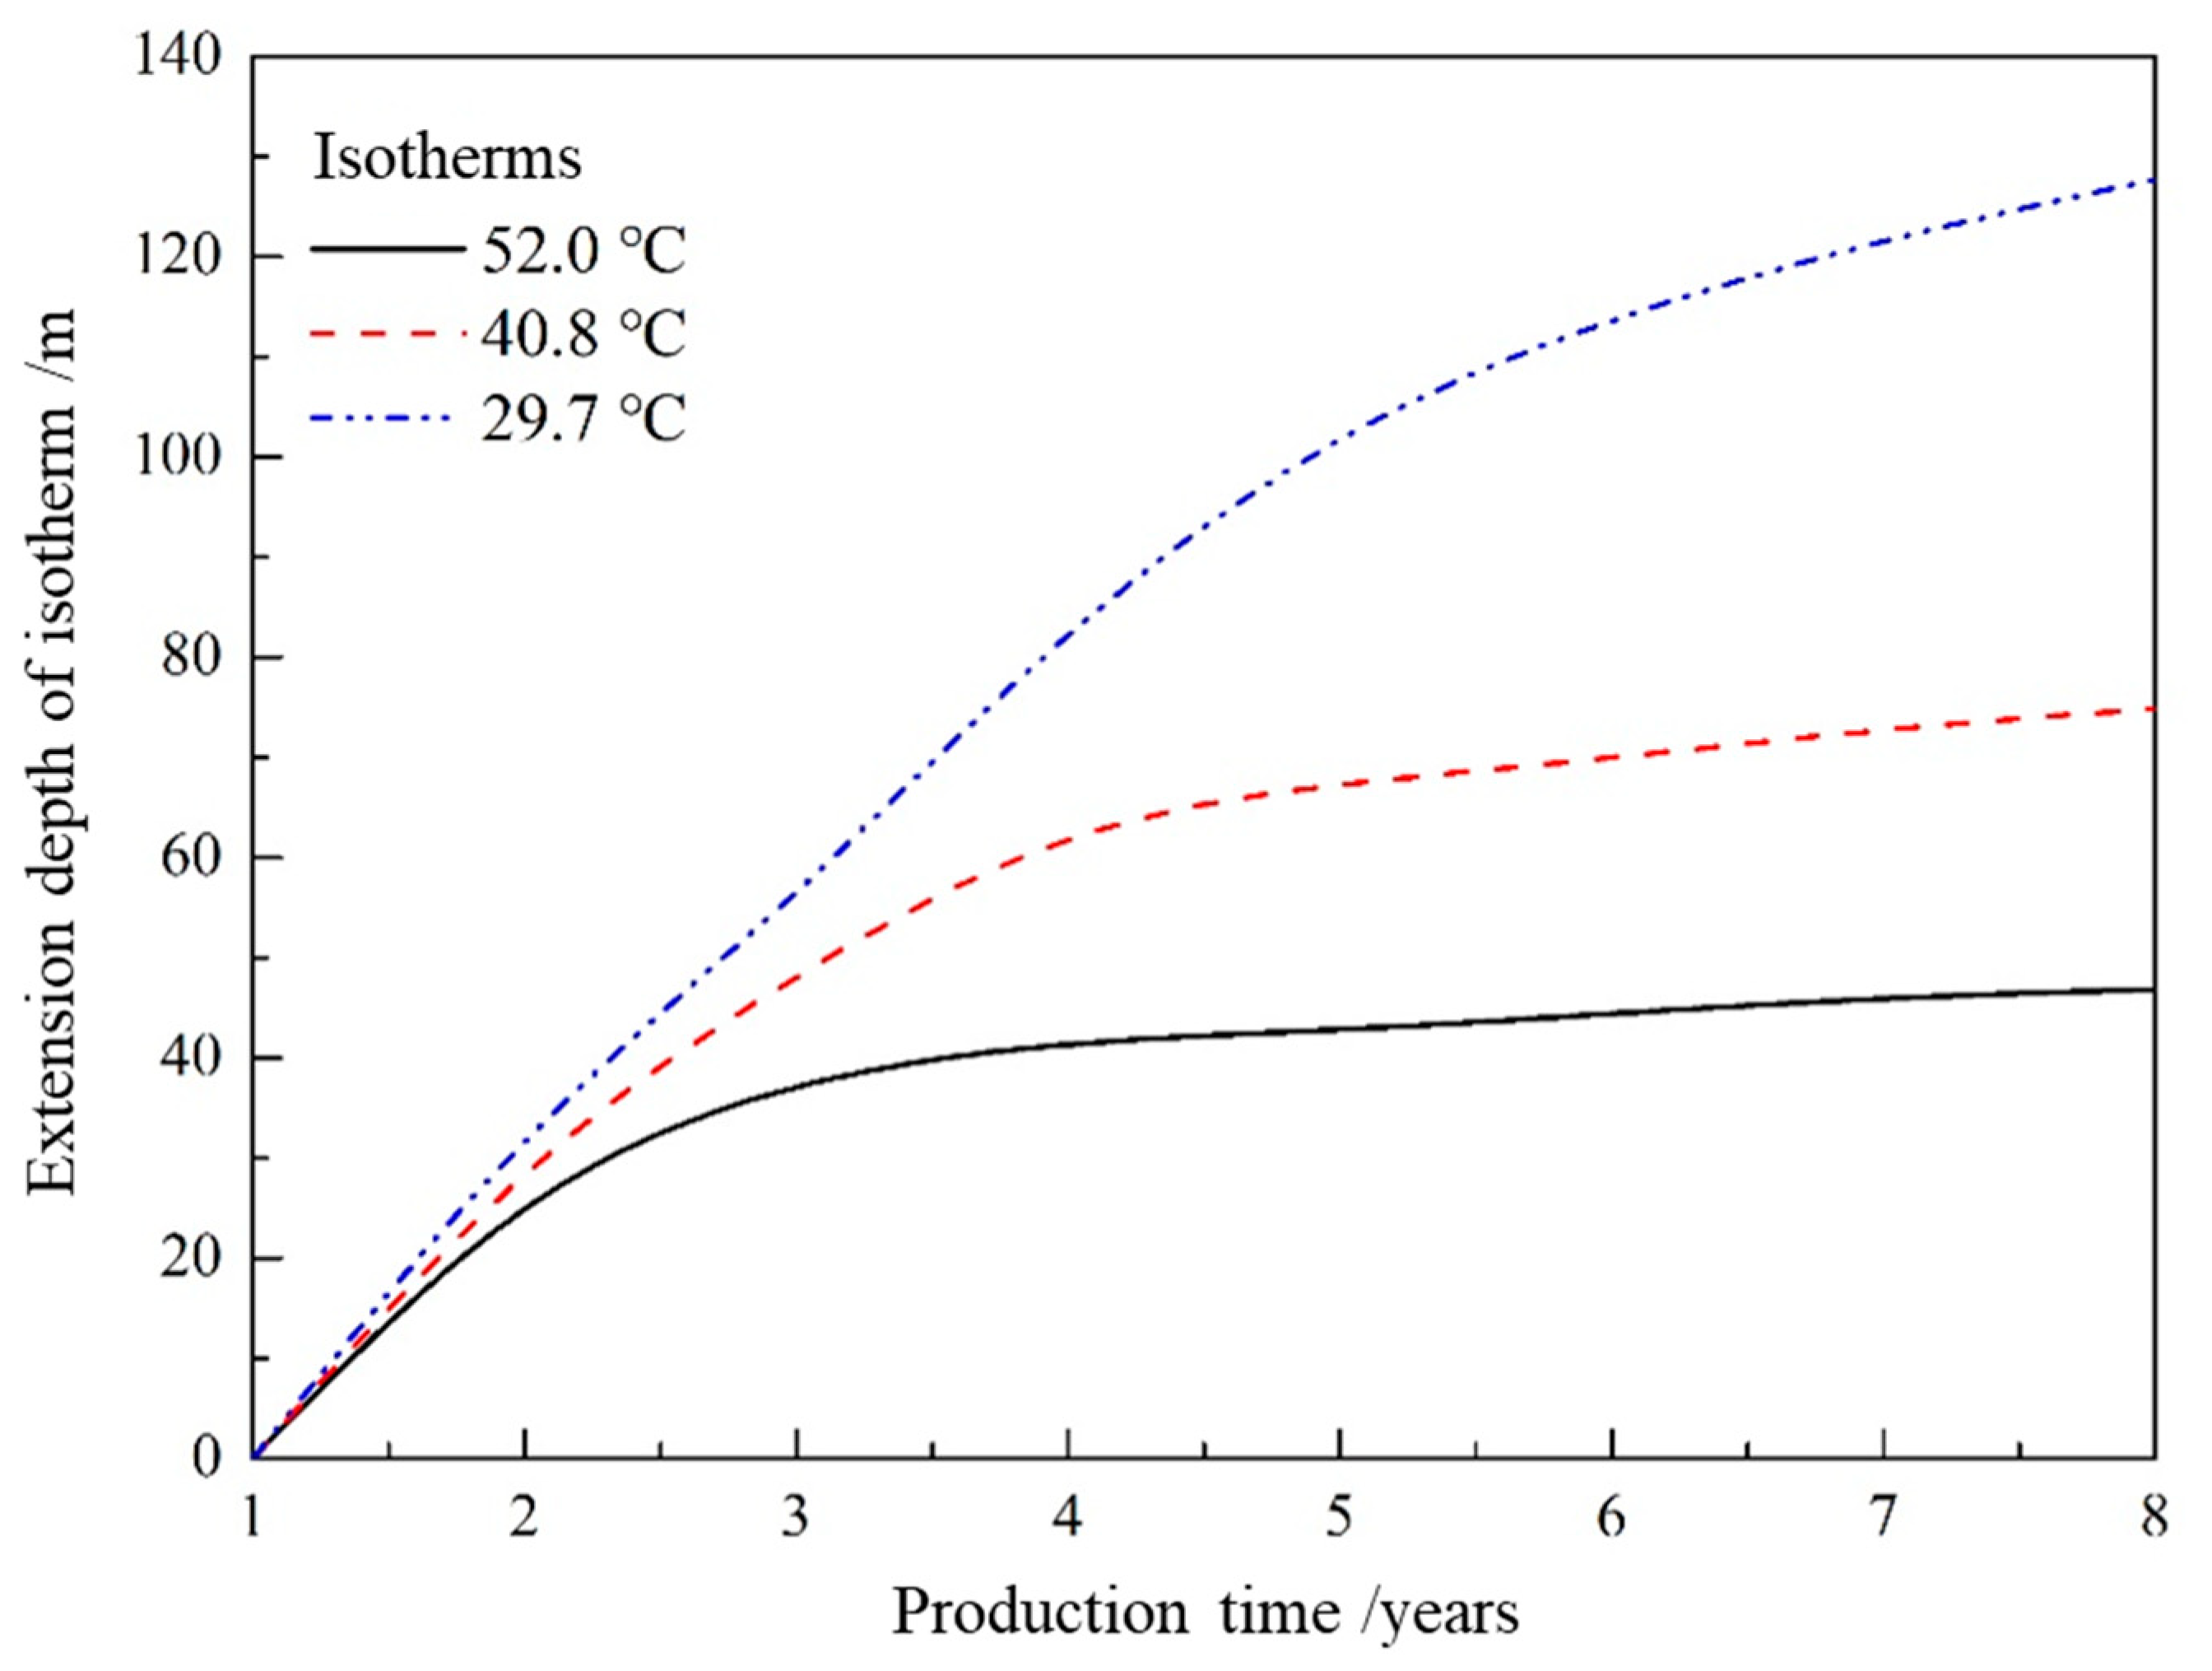
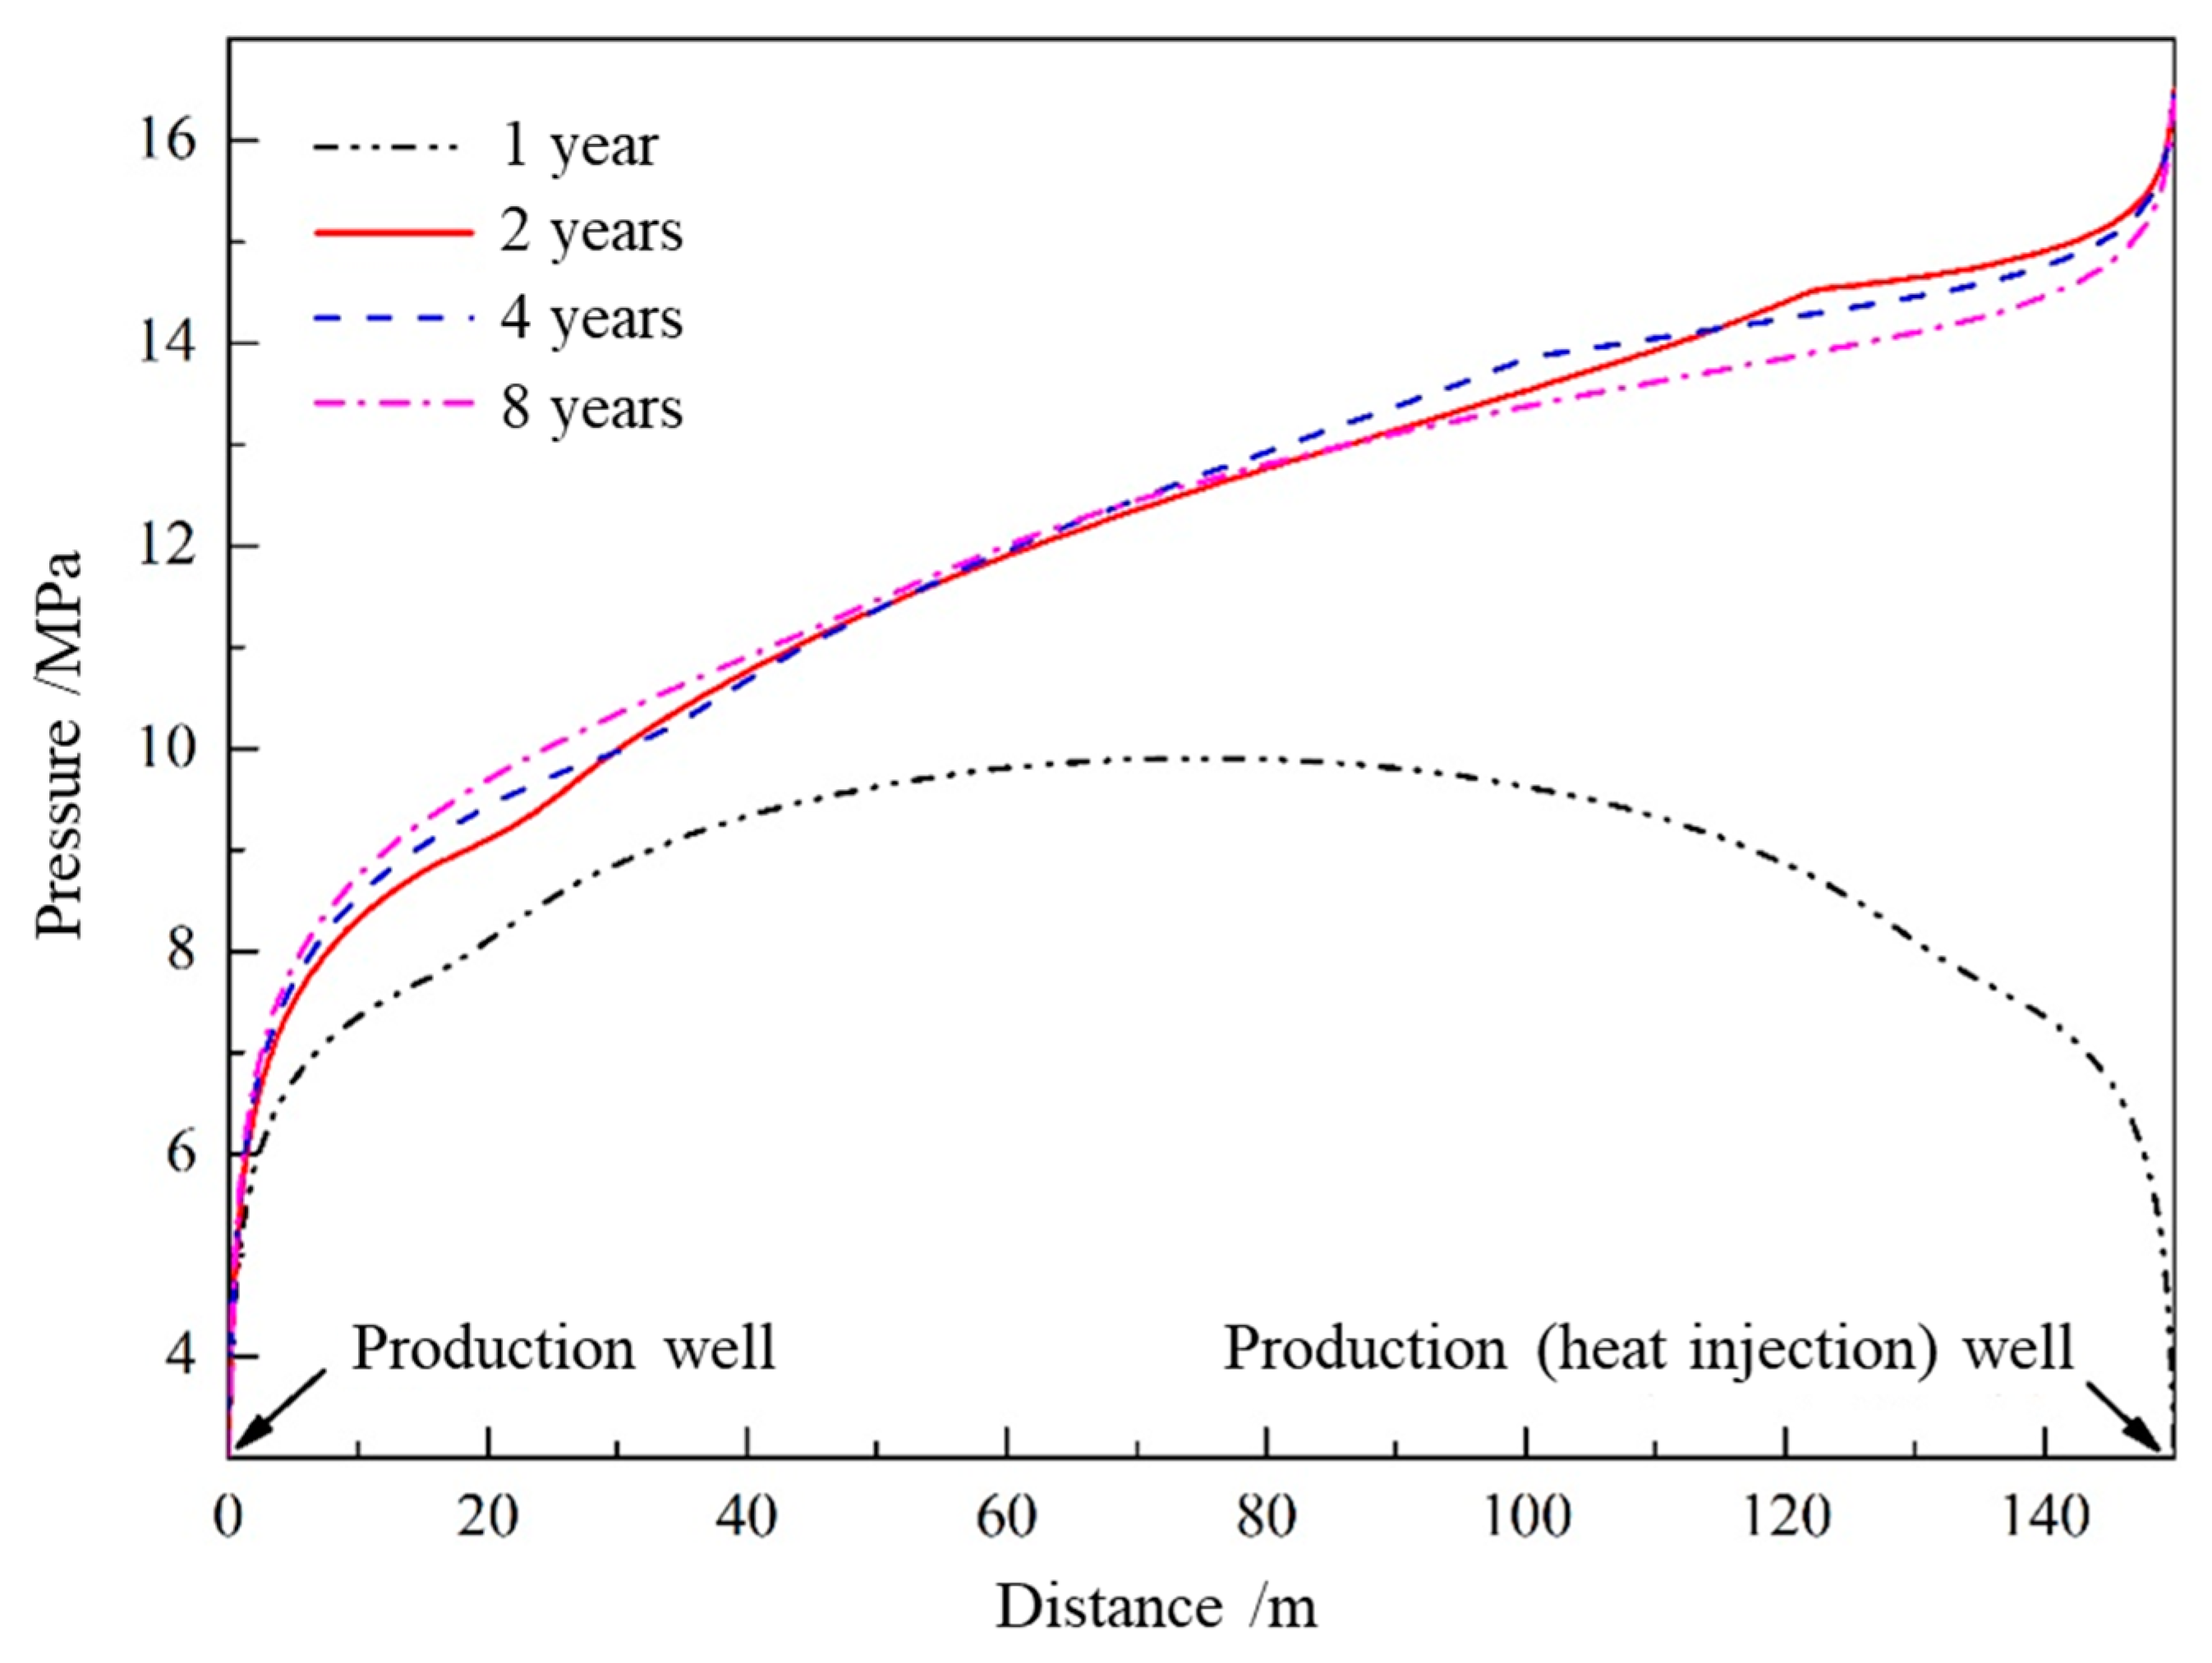
- As the hydrate reservoir, dominated by argillaceous siltstone, had extremely low permeability, the 8 MPa isobar only extended to 18. 91 m after one year of depressurization extraction, with the pressure drop range very limited. When water was injected, the pressure gradient between the injection well and production well rose significantly. At the early stage of water injection, the isotherms also expanded at an approximate linear rate of 24 m·a−1, before the isotherms of 52.0 °C, 40.8 °C and 29.7 °C the expanded forward slowly at a rate of 1.32 m·a−1, 2.44 m·a−1 and 6.19 m·a−1, respectively. The ultimate extension depth of the 52.0 °C isotherm was only about 48 m.
Author Contributions
Funding
Institutional Review Board Statement
Informed Consent Statement
Data Availability Statement
Conflicts of Interest
Appendix A
References
- Cheng, Z.H.; Nan, N.; Zhang, Y.R. The Spatio-Temporal Pattern, Development Predicament and Trend of China’s Petroleum Import Trade. Econ. Geogr. 2019, 39, 1–11. [Google Scholar]
- Xue, M.; Lu, M.X.; Zhang, X.F. Suggestions for green and low-carbon development of oil and gas Industry under the targets of carbon peak and carbon neutrality. Environ. Prot. 2021, 49, 30–32. [Google Scholar]
- Sloan, E.D. Fundamental principles and applications of natural gas hydrates. Nature 2003, 426, 353–359. [Google Scholar] [CrossRef]
- Makogon, Y.F. Natural gas hydrates—A promising source of energy. J. Nat. Gas Sci. Eng. 2010, 2, 49–59. [Google Scholar] [CrossRef]
- Yin, Z.; Chong, Z.R.; Tan, H.K.; Linga, P. Review of gas hydrate dissociation kinetic models for energy recovery. J. Nat. Gas Sci. Eng. 2016, 35, 1362–1387. [Google Scholar] [CrossRef]
- Chen, X.; Yang, J.; Gao, D.; Hong, Y.; Zou, Y.; Du, X. Unlocking the deepwater natural gas hydrate’s commercial potential with extended reach wells from shallow water: Review and an innovative method. Renew. Sustain. Energy Rev. 2020, 134, 110388. [Google Scholar] [CrossRef]
- Chong, Z.R.; Yang, S.H.B.; Babu, P.; Linga, P.; Li, X.-S. Review of natural gas hydrates as an energy resource: Prospects and challenges. Appl. Energy 2016, 162, 1633–1652. [Google Scholar] [CrossRef]
- Ruan, X.; Li, X. Investigation of the methane hydrate surface area during depressurization-induced dissociation in hy-drate-bearing porous media. Chin. J. Chem. Eng. 2021, 32, 324–334. [Google Scholar] [CrossRef]
- Wan, Q.-C.; Si, H.; Li, B.; Yin, Z.Y.; Gao, Q.; Liu, S.; Han, X.; Chen, L.-L. Energy recovery enhancement from gas hydrate based on the optimization of thermal stimulation modes and depressurization. Appl. Energy 2020, 278, 115612. [Google Scholar] [CrossRef]
- Stanwix, P.L.; Rathnayake, N.M.; De Obanos, F.P.; Johns, M.L.; Aman, Z.M.; May, E.F. Characterising thermally controlled CH4–CO2 hydrate exchange in unconsolidated sediments. Energy Environ. Sci. 2018, 11, 1828–1840. [Google Scholar] [CrossRef]
- Zhong, X.; Pan, D.; Zhu, Y.; Wang, Y.; Tu, G.; Nie, S.; Ma, Y.; Liu, K.; Chen, C. Commercial production potential evaluation of injection-production mode for CH-Bk hydrate reservoir and investigation of its stimulated potential by fracture network. Energy 2022, 239, 122113. [Google Scholar] [CrossRef]
- Ma, X.; Sun, Y.; Liu, B.; Guo, W.; Jia, R.; Li, B.; Li, S. Numerical study of depressurization and hot water injection for gas hydrate production in China’s first offshore test site. J. Nat. Gas Sci. Eng. 2020, 83, 103530. [Google Scholar] [CrossRef]
- Tomaru, H.; Fehn, U.; Lu, Z.; Matsumoto, R. Halogen systematics in the Mallik 5L-38 gas hydrate production research well, Northwest Territories, Canada: Implications for the origin of gas hydrates under terrestrial permafrost conditions. Appl. Geochem. 2007, 22, 656–675. [Google Scholar] [CrossRef]
- Hunter, R.B.; Collett, T.S.; Boswell, R.; Anderson, B.J.; Digert, S.A.; Pospisil, G.; Baker, R.; Weeks, M. Mount Elbert Gas Hydrate Stratigraphic Test Well, Alaska North Slope: Overview of scientific and technical program. Mar. Pet. Geol. 2011, 28, 295–310. [Google Scholar] [CrossRef]
- Yamamoto, K. Overview and introduction: Pressure core-sampling and analyses in the 2012–2013 MH21 offshore test of gas production from methane hydrates in the eastern Nankai Trough. Mar. Pet. Geol. 2015, 66, 296–309. [Google Scholar] [CrossRef]
- Konno, Y.; Fujii, T.; Sato, A.; Akamine, K.; Naiki, M.; Masuda, Y.; Yamamoto, K.; Nagao, J. Key Findings of the World’s First Offshore Methane Hydrate Production Test off the Coast of Japan: Toward Future Commercial Production. Energy Fuels 2017, 31, 2607–2616. [Google Scholar] [CrossRef]
- Ye, J.-L.; Survey, M.O.N.R.C.G.; Qin, X.-W.; Xie, W.-W.; Lu, H.-L.; Ma, B.-J.; Qiu, H.-J.; Liang, J.-Q.; Lu, J.-A.; Kuang, Z.-G.; et al. The second natural gas hydrate production test in the South China Sea. China Geol. 2020, 2, 197–209. [Google Scholar] [CrossRef]
- Qin, X.; Liang, Q.; Ye, J.; Yang, L.; Qiu, H.; Xie, W.; Liang, J.; Lu, J.; Lu, C.; Lu, H.; et al. The response of temperature and pressure of hydrate reservoirs in the first gas hydrate production test in South China Sea. Appl. Energy 2020, 278, 115649. [Google Scholar] [CrossRef]
- Zhou, S.; Zhao, J.; Li, Q.; Chen, W.; Zhou, J.; Wei, N.; Guo, P.; Sun, W. Optimal design of the engineering parameters for the first global trial production of marine natural gas hydrates through solid fluidization. Nat. Gas Ind. B 2018, 5, 118–131. [Google Scholar] [CrossRef]
- Li, J.-F.; Ye, J.-L.; Qin, X.-W.; Qiu, H.-J.; Wu, N.-Y.; Lu, H.-L.; Xie, W.-W.; Lu, J.-A.; Peng, F.; Xu, Z.-Q.; et al. The first offshore natural gas hydrate production test in South China Sea. China Geol. 2018, 1, 5–16. [Google Scholar] [CrossRef]
- Huang, J.-J.; Jiang, M.-J.; Wang, H.-N. Reliability analysis of wellbore stability for hydrate reservoirs in Shenhu area of the South China Sea. Rock Soil Mech. 2024, 45, 1505–1516. [Google Scholar] [CrossRef]
- Zhou, S.; Li, Q.; Zhu, J.; Pang, W.; He, Y. Challenges and considerations for the development of natural gas hydrates in South China Sea. Nat. Gas Ind. 2023, 43, 152–163. [Google Scholar]
- Wang, J.; Wei, H.; Chen, Y.; Guo, X.; Ge, K. Simulation Study on Hydrate Production Using Step-wise Depressurization En-hanced by Fracturing Method. J. Eng. Thermophys. 2024, 45, 1498–1505. [Google Scholar]
- Pan, M.; Zhang, Z.; Chen, Q.; Xu, L.; Du, S.; Liu, Y. Advances in research on CO2 replacement for natural gas hydrate exploitation. Oli Gas Geol. 2024, 45, 553–564. [Google Scholar]
- Wan, Q.-C.; Si, H.; Li, B.; Li, G. Heat transfer analysis of methane hydrate dissociation by depressurization and thermal stimulation. Int. J. Heat Mass Transf. 2018, 127, 206–217. [Google Scholar] [CrossRef]
- Yu, T.; Guan, G.; Abudula, A.; Wang, D. 3D visualization of fluid flow behaviors during methane hydrate extraction by hot water injection. Energy 2019, 188, 116110. [Google Scholar] [CrossRef]
- Kondori, J.; Zendehboudi, S.; Hossain, M.E. A review on simulation of methane production from gas hydrate reservoirs: Mo-lecular dynamics prospective. J. Pet. Sci. Eng. 2017, 159, 754–772. [Google Scholar] [CrossRef]
- Kondori, J.; Zendehboudi, S.; James, L. New insights into methane hydrate dissociation: Utilization of molecular dynamics strategy. Fuel 2019, 249, 264–276. [Google Scholar] [CrossRef]
- Yang, M.; Zhao, J.; Zheng, J.-N.; Song, Y. Hydrate reformation characteristics in natural gas hydrate dissociation process: A review. Appl. Energy 2019, 256, 113878. [Google Scholar] [CrossRef]
- Li, Y.; Hu, G.; Liu, C.; Wu, N.; Chen, Q.; Liu, L.; Li, C. Gravel sizing method for sand control packing in hydrate production test wells. Pet. Explor. Dev. 2017, 44, 1016–1021. [Google Scholar] [CrossRef]
- Liang, Y.-P.; Li, X.-S.; Li, B. Assessment of Gas Production Potential from Hydrate Reservoir in Qilian Mountain Permafrost Using Five-Spot Horizontal Well System. Energies 2015, 8, 10796–10817. [Google Scholar] [CrossRef]
- Li, B.; Li, X.-S.; Li, G.; Chen, Z.-Y. Evaluation of gas production from Qilian Mountain permafrost hydrate deposits in two-spot horizontal well system. Cold Reg. Sci. Technol. 2015, 109, 87–98. [Google Scholar] [CrossRef]
- Feng, J.-C.; Li, G.; Li, X.-S.; Li, B.; Chen, Z.-Y. Evolution of Hydrate Dissociation by Warm Brine Stimulation Combined Depressurization in the South China Sea. Energies 2013, 6, 5402–5425. [Google Scholar] [CrossRef]
- Moridis, G.J.; Reagan, M.T.; Queiruga, A.F.; Kim, S.J. System response to gas production from a heterogeneous hydrate accumu-lation at the UBGH2-6 site of the Ulleung basin in the Korean East Sea. J. Pet. Sci. Eng. 2019, 178, 655–665. [Google Scholar] [CrossRef]
- Zhao, E.; Hou, J.; Du, Q.; Liu, Y.; Ji, Y.; Bai, Y. Numerical modeling of gas production from methane hydrate deposits using low-frequency electrical heating assisted depressurization method. Fuel 2021, 290, 120075. [Google Scholar] [CrossRef]
- Yu, T.; Guan, G.; Wang, D.; Song, Y.; Abudula, A. Numerical evaluation on the effect of horizontal-well systems on the long-term gas hydrate production behavior at the second Shenhu test site. J. Nat. Gas Sci. Eng. 2021, 95, 104200. [Google Scholar] [CrossRef]
- Vishal, V.; Lall, D.; Sarna, S.; Sharma, A.; Ranjith, P. Sensitivity analysis of methane hydrate bearing Class 3 reservoirs during thermal injection. J. Pet. Sci. Eng. 2020, 195, 107575. [Google Scholar] [CrossRef]
- Pan, L.; Doughty, C.; Freifeld, B. How to sustain a CO2-thermosiphon in a partially saturated geothermal reservoir: Lessons learned from field experiment and numerical modeling. Geothermics 2018, 71, 274–293. [Google Scholar] [CrossRef]
- Kotresha, B.; Gnanasekaran, N. Determination of interfacial heat transfer coefficient for the flow assisted mixed convection through brass wire mesh. Int. J. Therm. Sci. 2019, 138, 98–108. [Google Scholar] [CrossRef]
- Li, W.; Klemeš, J.J.; Wang, Q.; Zeng, M. Numerical analysis on the improved thermo-chemical behaviour of hierarchical energy materials as a cascaded thermal accumulator. Energy 2021, 232, 120937. [Google Scholar] [CrossRef]
- Ouyang, X.-L.; Xu, R.-N.; Jiang, P.-X. Three-equation local thermal non-equilibrium model for transient heat transfer in porous media: The internal thermal conduction effect in the solid phase. Int. J. Heat Mass Transf. 2017, 115, 1113–1124. [Google Scholar] [CrossRef]
- Yin, Z.; Moridis, G.; Linga, P. On the importance of phase saturation heterogeneity in the analysis of laboratory studies of hydrate dissociation. Appl. Energy 2019, 255, 113861. [Google Scholar] [CrossRef]
- Wei, R.; Shi, K.; Guo, X.; Wang, T.; Lv, X.; Li, Q.; Zhang, Y.; Zhao, J.; Yang, L. Evolving thermal conductivity upon formation and decomposition of hydrate in natural marine sediments. Fuel 2021, 302, 121141. [Google Scholar] [CrossRef]
- Kuwahara, F.; Shirota, M.; Nakayama, A. A numerical study of interfacial convective heat transfer coefficient in two-energy equation model for convection in porous media. Int. J. Heat Mass Transf. 2001, 44, 1153–1159. [Google Scholar] [CrossRef]
- Ziabakhsh-Ganji, Z.; Kooi, H. Sensitivity of Joule–Thomson cooling to impure CO2 injection in depleted gas reservoirs. Appl. Energy 2014, 113, 434–451. [Google Scholar] [CrossRef]
- Kim, H.; Bishnoi, P.; Heidemann, R.; Rizvi, S. Kinetics of methane hydrate decomposition. Chem. Eng. Sci. 1987, 42, 1645–1653. [Google Scholar] [CrossRef]
- Hardwick, J.S.; Mathias, S.A. Masuda’s sandstone core hydrate dissociation experiment revisited. Chem. Eng. Sci. 2018, 175, 98–109. [Google Scholar] [CrossRef]
- Stone, H. Probability Model for Estimating Three-Phase Relative Permeability. J. Pet. Technol. 1970, 22, 214–218. [Google Scholar] [CrossRef]
- van Genuchten, M.T. A Closed-form Equation for Predicting the Hydraulic Conductivity of Unsaturated Soils. Soil Sci. Soc. Am. J. 1980, 44, 892–898. [Google Scholar] [CrossRef]
- Moridis, G.J. TOUGH+HYDRATE v1.2 User’s Manual A Code for the Simulation of System Behavior in Hydrate-Bearing Ge-ologic Media. Master’s Thesis, Lawrence Berkeley National Laboratory, Berkeley, CA, USA, 2014. [Google Scholar]
- Yu, T.; Guan, G.; Abudula, A. Production performance and numerical investigation of the 2017 offshore methane hydrate production test in the Nankai Trough of Japan. Appl. Energy 2019, 251, 113338. [Google Scholar] [CrossRef]
- Ye, J.-L.; Survey, C.G.S.G.M.G.; Qin, X.-W.; Qiu, H.-J.; Liang, Q.-Y.; Dong, Y.-F.; Wei, J.-G.; Lu, H.-L.; Lu, J.-A.; Shi, Y.-H.; et al. Preliminary results of environmental monitoring of the natural gas hydrate production test in the South China Sea. China Geol. 2018, 1, 202–209. [Google Scholar] [CrossRef]
- Ketzer, M.; Praeg, D.; Rodrigues, L.F.; Augustin, A.; Pivel, M.A.G.; Rahmati-Abkenar, M.; Miller, D.J.; Viana, A.R.; Cupertino, J.A. Gas hydrate dissociation linked to contemporary ocean warming in the southern hemisphere. Nat. Commun. 2020, 11, 3788. [Google Scholar] [CrossRef] [PubMed]

| Parameter | Value | Parameter | Value |
|---|---|---|---|
| Water depth | 1225 m | Sea surface temperature | 20 °C |
| Hydrate reservoir pressure | 15.45 MPa | Hydrate reservoir temperature | 17.10 °C |
| Permeability of the caprock layer and bottom layer | 1.5 × 10⁻³ μm2 | Permeability of the hydrate layer | 2.38 × 10⁻³ μm2 |
| Thickness of the caprock layer and bottom layer | 20 m | Thickness of the hydrate layer | 45 m |
| Porosity of the caprock layer and bottom layer | 0.31 | Hydrate layer porosity | 0.373 |
| Mixture layer permeability | 6.63 ×10⁻³ μm2 | Gas layer permeability | 6.8 × 10⁻³ μm2 |
| Mixture layer thickness | 25 m | Gas layer thickness | 20 m |
| Mixture layer porosity | 0.346 | Gas layer porosity | 0.347 |
Disclaimer/Publisher’s Note: The statements, opinions and data contained in all publications are solely those of the individual author(s) and contributor(s) and not of MDPI and/or the editor(s). MDPI and/or the editor(s) disclaim responsibility for any injury to people or property resulting from any ideas, methods, instructions or products referred to in the content. |
© 2024 by the authors. Licensee MDPI, Basel, Switzerland. This article is an open access article distributed under the terms and conditions of the Creative Commons Attribution (CC BY) license (https://creativecommons.org/licenses/by/4.0/).
Share and Cite
Shan, Z.; Zhou, B.; Kong, Q.; Wang, X.; Liao, Y.; Wang, Z.; Zhang, J. Analysis of Production Laws of Hydrate Reservoirs via Combined Heat Injection and Depressurization Based on Local Thermal Non-Equilibrium. J. Mar. Sci. Eng. 2024, 12, 1408. https://doi.org/10.3390/jmse12081408
Shan Z, Zhou B, Kong Q, Wang X, Liao Y, Wang Z, Zhang J. Analysis of Production Laws of Hydrate Reservoirs via Combined Heat Injection and Depressurization Based on Local Thermal Non-Equilibrium. Journal of Marine Science and Engineering. 2024; 12(8):1408. https://doi.org/10.3390/jmse12081408
Chicago/Turabian StyleShan, Zhengfeng, Boyu Zhou, Qingwen Kong, Xiansi Wang, Youqiang Liao, Zhiyuan Wang, and Jianbo Zhang. 2024. "Analysis of Production Laws of Hydrate Reservoirs via Combined Heat Injection and Depressurization Based on Local Thermal Non-Equilibrium" Journal of Marine Science and Engineering 12, no. 8: 1408. https://doi.org/10.3390/jmse12081408