Article

An Experimental Study of Pulp-Lift Characteristics Using a High-Viscous Fluid Simulating Deep Muddy Seawater

1
Institute of Technology, Penta-Ocean Construction Co., Ltd., Nasushiobara 329-2746, Japan
2
Graduate School of Engineering, Osaka Metropolitan University, Osaka 599-8531, Japan
*
Author to whom correspondence should be addressed.
J. Mar. Sci. Eng. 2024, 12(8), 1448; https://doi.org/10.3390/jmse12081448
Submission received: 19 July 2024 / Revised: 8 August 2024 / Accepted: 9 August 2024 / Published: 21 August 2024
(This article belongs to the Special Issue Deep-Sea Mining Technologies: Recent Developments and Challenges)

Abstract

:
Rare-earth mud and manganese nodules coexist on the seafloor around Minamitorishima Island. To investigate the feasibility of a pulp-lift system that can ensure economic efficiency by pumping manganese using rare-earth mud as the working fluid, we conducted pulp-lift experiments at a head of 5.0 m using a squeeze pump for mortar pumping. In the study, we used carboxymethylcellulose (CMC) as the working fluid, which is a pseudo-plastic fluid like deep muddy seawater. We investigated the effects of the viscosity of the working fluid and the pump pulsation characteristics on lifting. The results revealed that the drag force acting on the pumped ore increased as the fluid became more viscous and the pulsation period became higher, while the reverse flow rate increased due to the negative pulsation pressure. This suggests that there is an optimum value for the viscosity of the working fluid.

1. Introduction

Rare-earth mud and manganese nodules coexist on the seafloor around Minamitorishima Island, which is within Japan’s EEZ [1]. Although airlift, pump-lift and mechanical methods have been proposed for pumping up these seabed resources, all of them have problems in terms of economic efficiency and environmental impact. The pulp-lift method [2], which transports manganese nodules using a highly viscous working fluid mixed with rare-earth mud and seawater, is being considered [3]. From an economic perspective, the implementation of this method would be beneficial as it allows for the simultaneous pumping of both resources.
The authors in [4] conducted a basic study of the pulp-lift method using mud from offshore Hawaii as a working fluid. The results revealed that mud has a higher pumping potential than seawater. Similar results were also confirmed by Orita et al. [5]; thus, there is a possibility that ore can be pumped even at low flow velocities by increasing viscosity. However, many issues remain to be resolved to effectively use the pulp-lift method. In this study, we attempted to solve some of these issues.
First, rare-earth mud is reported to be a pseudo-plastic fluid [6], and the viscosity of the working fluid during pumping is considered to have a significant effect on the pumping efficiency. However, the B-type viscometer used by the authors in [4] could not directly calculate the shear rate [7]. Therefore, a concentric double-cylinder rotational viscometer was used in this study to directly calculate shear stress and shear rate. In addition, it is important to evaluate the viscosity of the working fluid more accurately. Shimizu et al. found that the modified Herschel–Bulkley model was a better fit than the power-law model [8], so the former model was used for fitting in this study.
Finally, while a mono pump creates a stable and low flow environment, the pumping efficiency is low [5]. Therefore, a squeeze pump for mortar pumping is desirable to create a high flow velocity environment from an economic point of view. However, the squeeze pump causes pulsations in the flow, so it is necessary to understand the effects of pulsations on the fluid and ore during pumping.
In summary, the purpose of this paper is to conduct pulp-lift experiments to improve the evaluation accuracy of the working fluid viscosity and understand the effects of viscosity and pump pulsation on the pumped ore.

2. Materials

2.1. Working Fluid

In this study, carboxymethylcellulose (CMC) was used as the working fluid [4,5]. If rare-earth mud were used as the working fluid, the conditions during pumping would not be visible. On the other hand, CMC is a transparent solution and exhibits pseudoplasticity similar to rare-earth mud. Therefore, CMC was used to visually understand the behavior of the working fluid and ore pumped in a pulsating environment.
To examine the effects of the viscosity of the working fluid, five different concentrations of working fluids were prepared using the mass concentration of CMC as a parameter: 0% (water), 0.5%, 0.75%, 1.0%, and 1.2%. Table 1 shows the density of each working fluid; as seen, there is no significant difference in density.

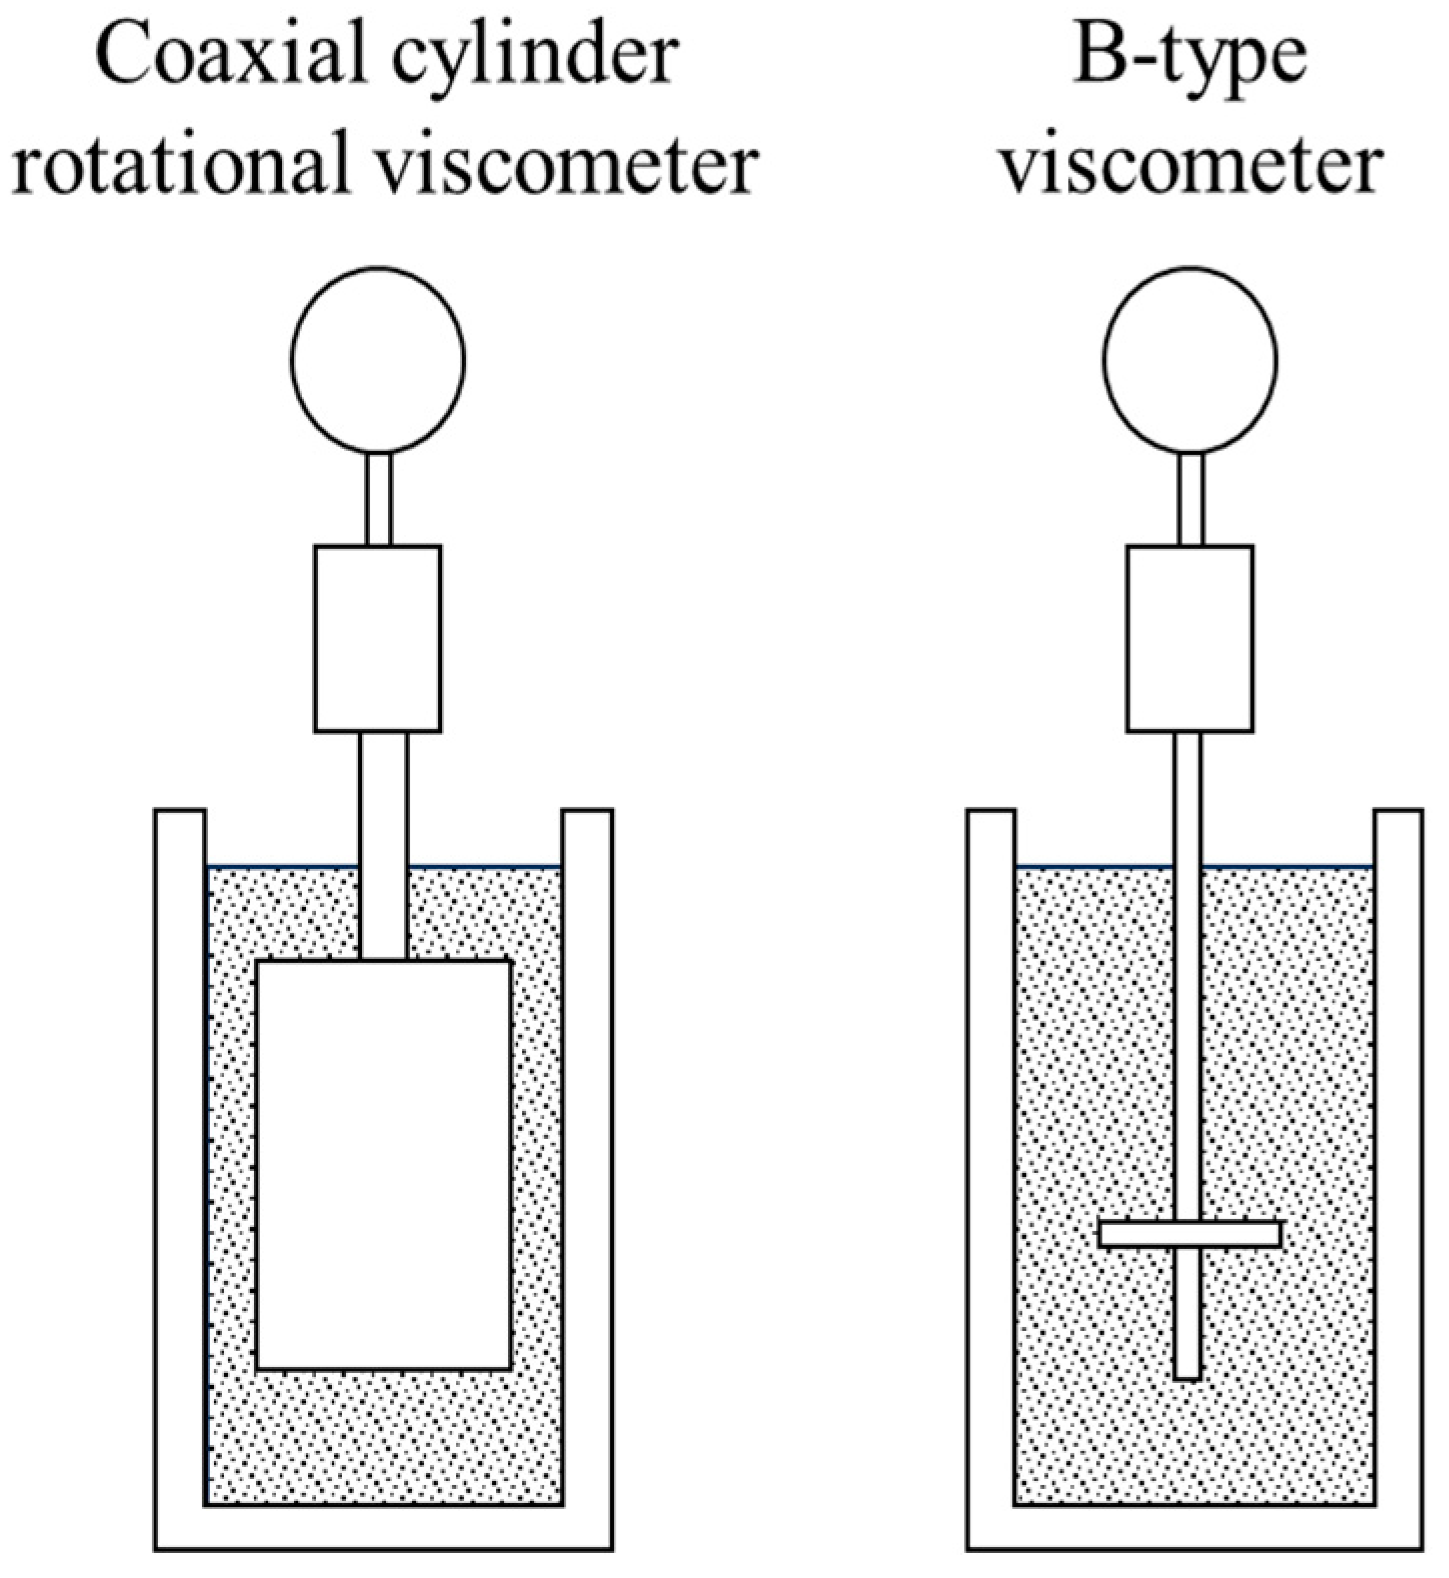
2.2. Viscosity Experiments
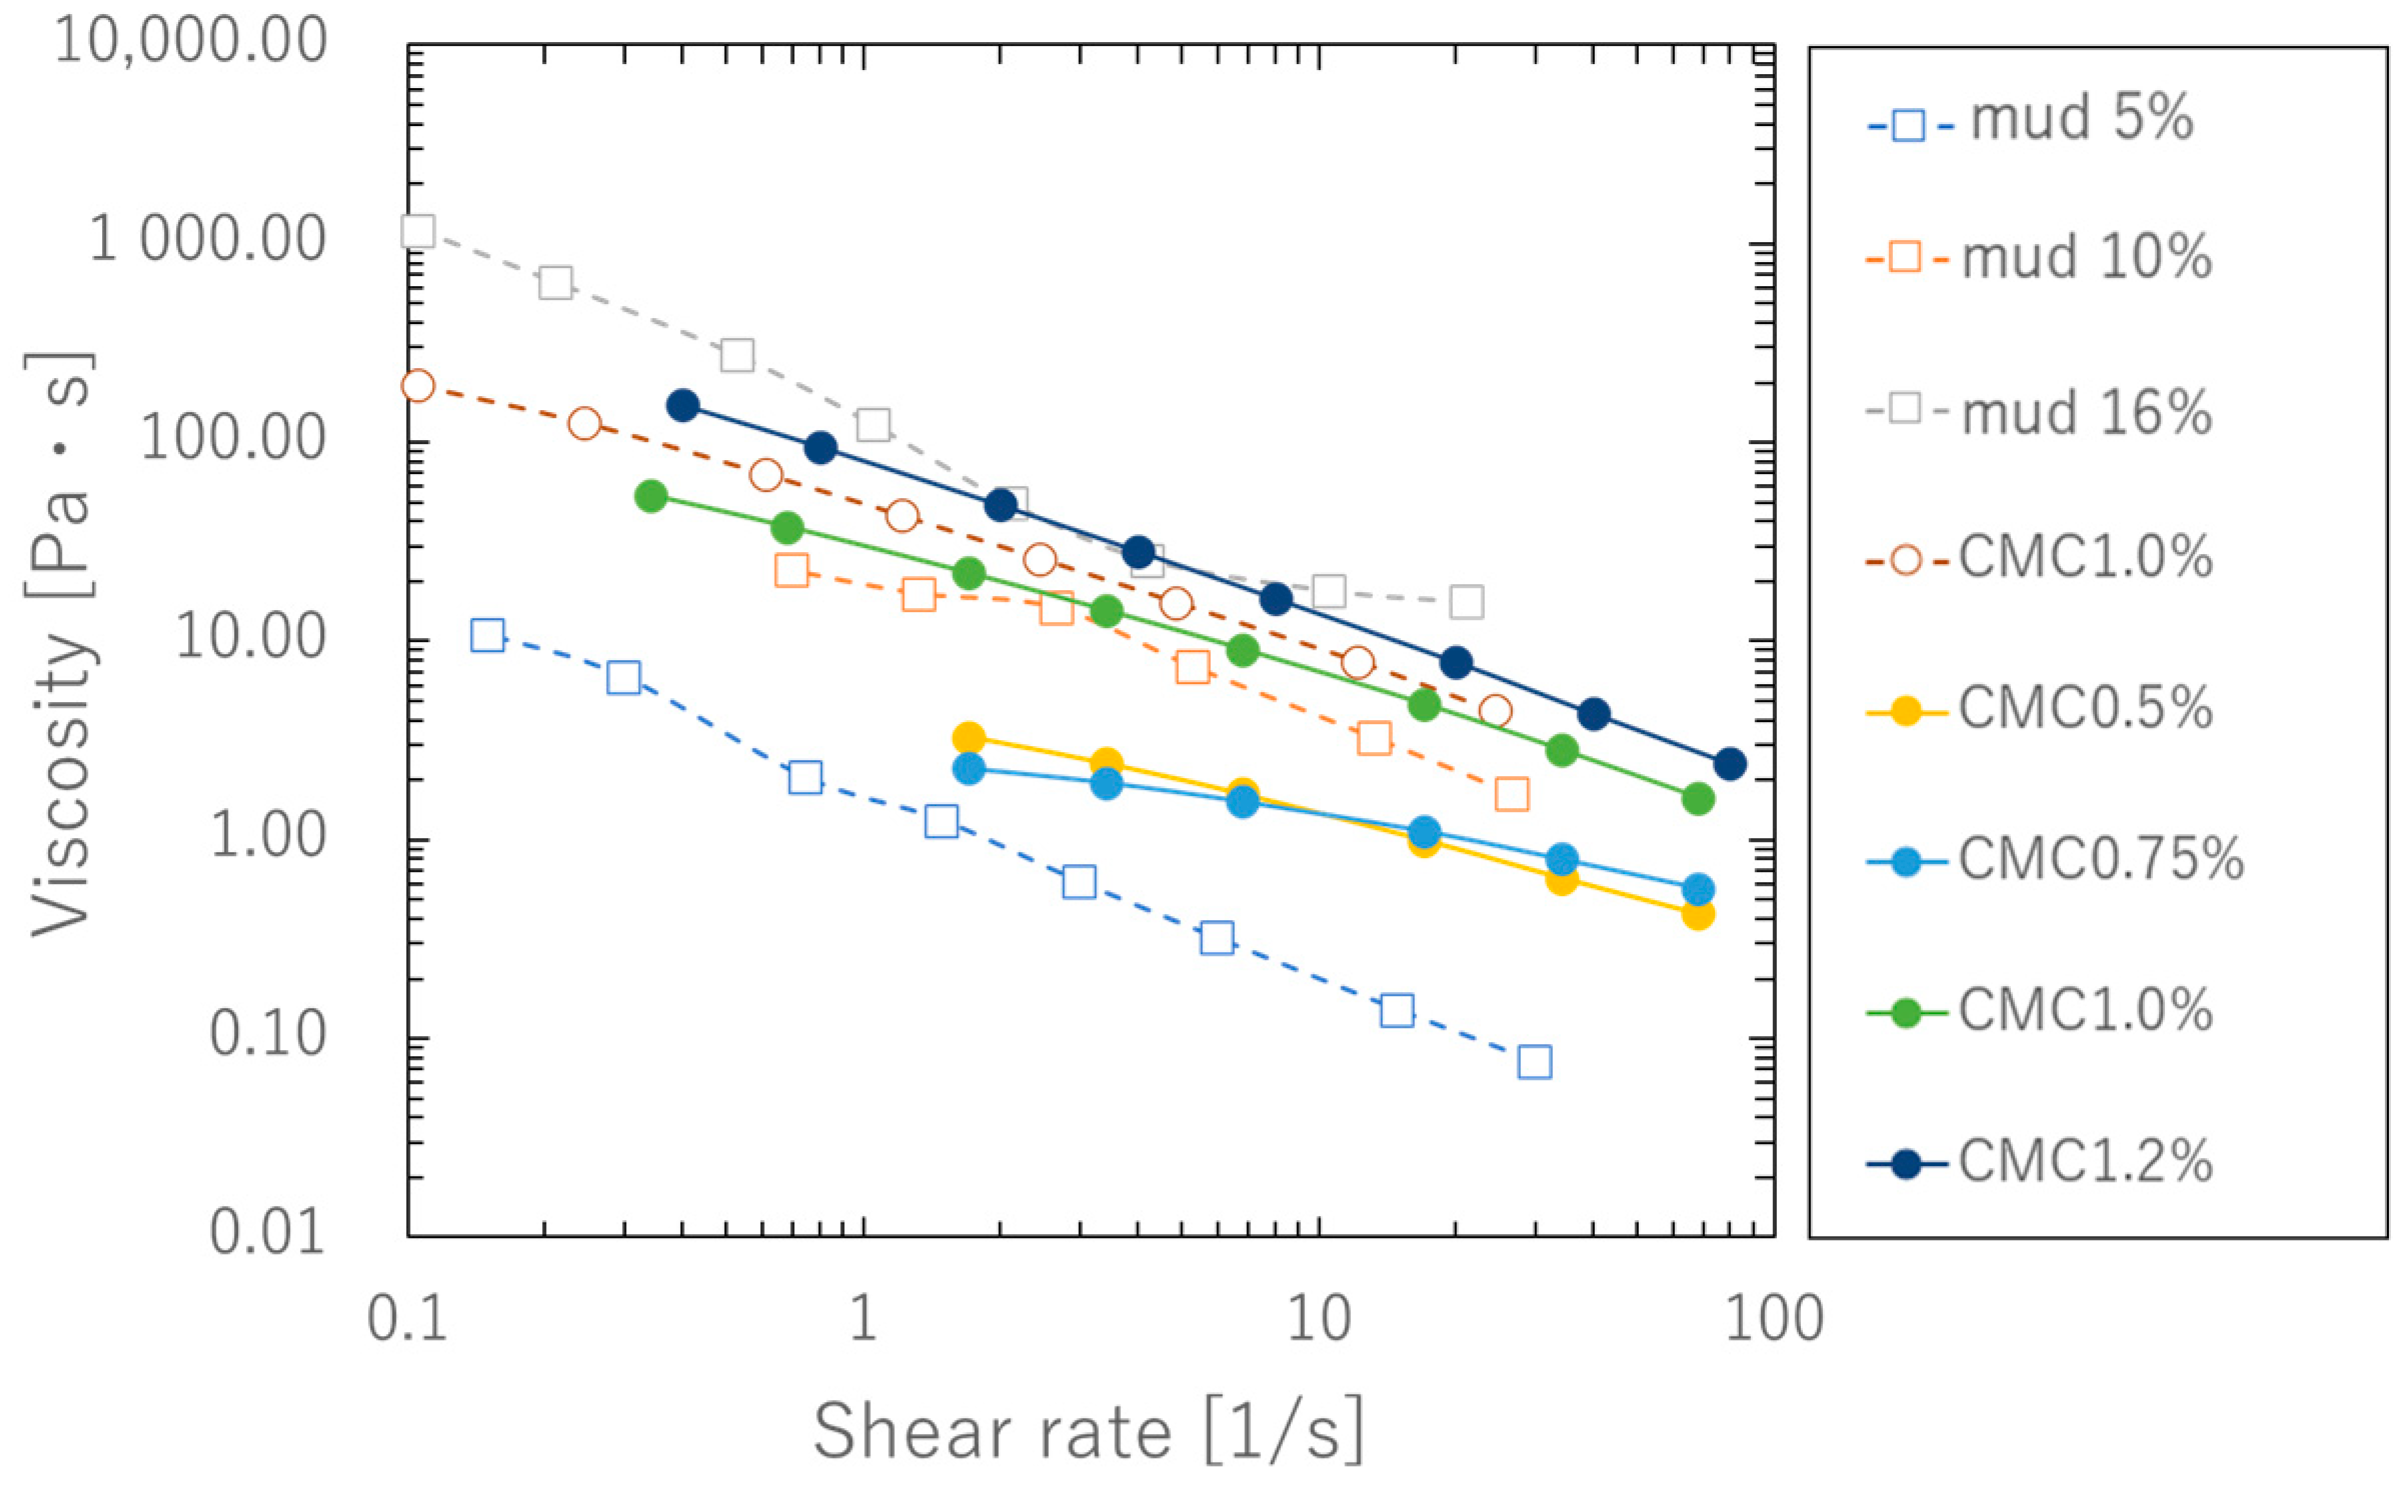
Viscosity tests were conducted on CMC to determine the difference in viscosity at each mass concentration. As mentioned, the shear rate could not be directly calculated with a B-type viscometer, so viscosity tests were conducted using a coaxial cylinder rotational viscometer (AMETEK Brookfield, MA, USA) that can directly calculate shear stress and shear rate. As shown in Figure 1, the viscometer has a small gap between the inner and outer cylinders, and the shear rate of the sample inside can be regarded as constant, so the viscosity can be obtained from a theoretical equation [7]. During the viscosity test, the material temperature was set at 20 °C, and the rotation speed of the viscometer was increased in sequence from 0.1 rpm to 200 rpm. The measured values were obtained after one minute of holding at each rotation speed.

2.3. Results

Figure 2 shows the line graph of shear rate and viscosity from the viscosity tests. Solid mark and line represent the data in this study, and open mark and dotted line represent past data [4]. The circle indicates CMC and the square indicates mud from offshore Hawaii. Comparing the results of the previous report with those of CMC 1.0% in this study, the present results show lower viscosity at the same shear rate. This is because B-Type viscometers generally underestimate the shear rate [9], and this tendency is also confirmed in this study. The viscosity characteristics of CMC 0.5% and 0.75% were almost the same. Since viscosity inversion was observed between fluids in the low-concentration range in the previous report [4], the accuracy of clay measurement in the low-viscosity range was difficult to determine regardless of the viscometer. Therefore, we decided not to re-measure the viscosity of the clay.
Comparing the viscosities of the mud and CMC, the viscosity of CMC 0.5% to 1.2% is within the range of 5% to 16% of the Hawaiian mud in mass concentration. Since the viscosity characteristics of the mud and CMC are similar, we decided to use CMC instead of mud in this study to verify the viscosity effect.

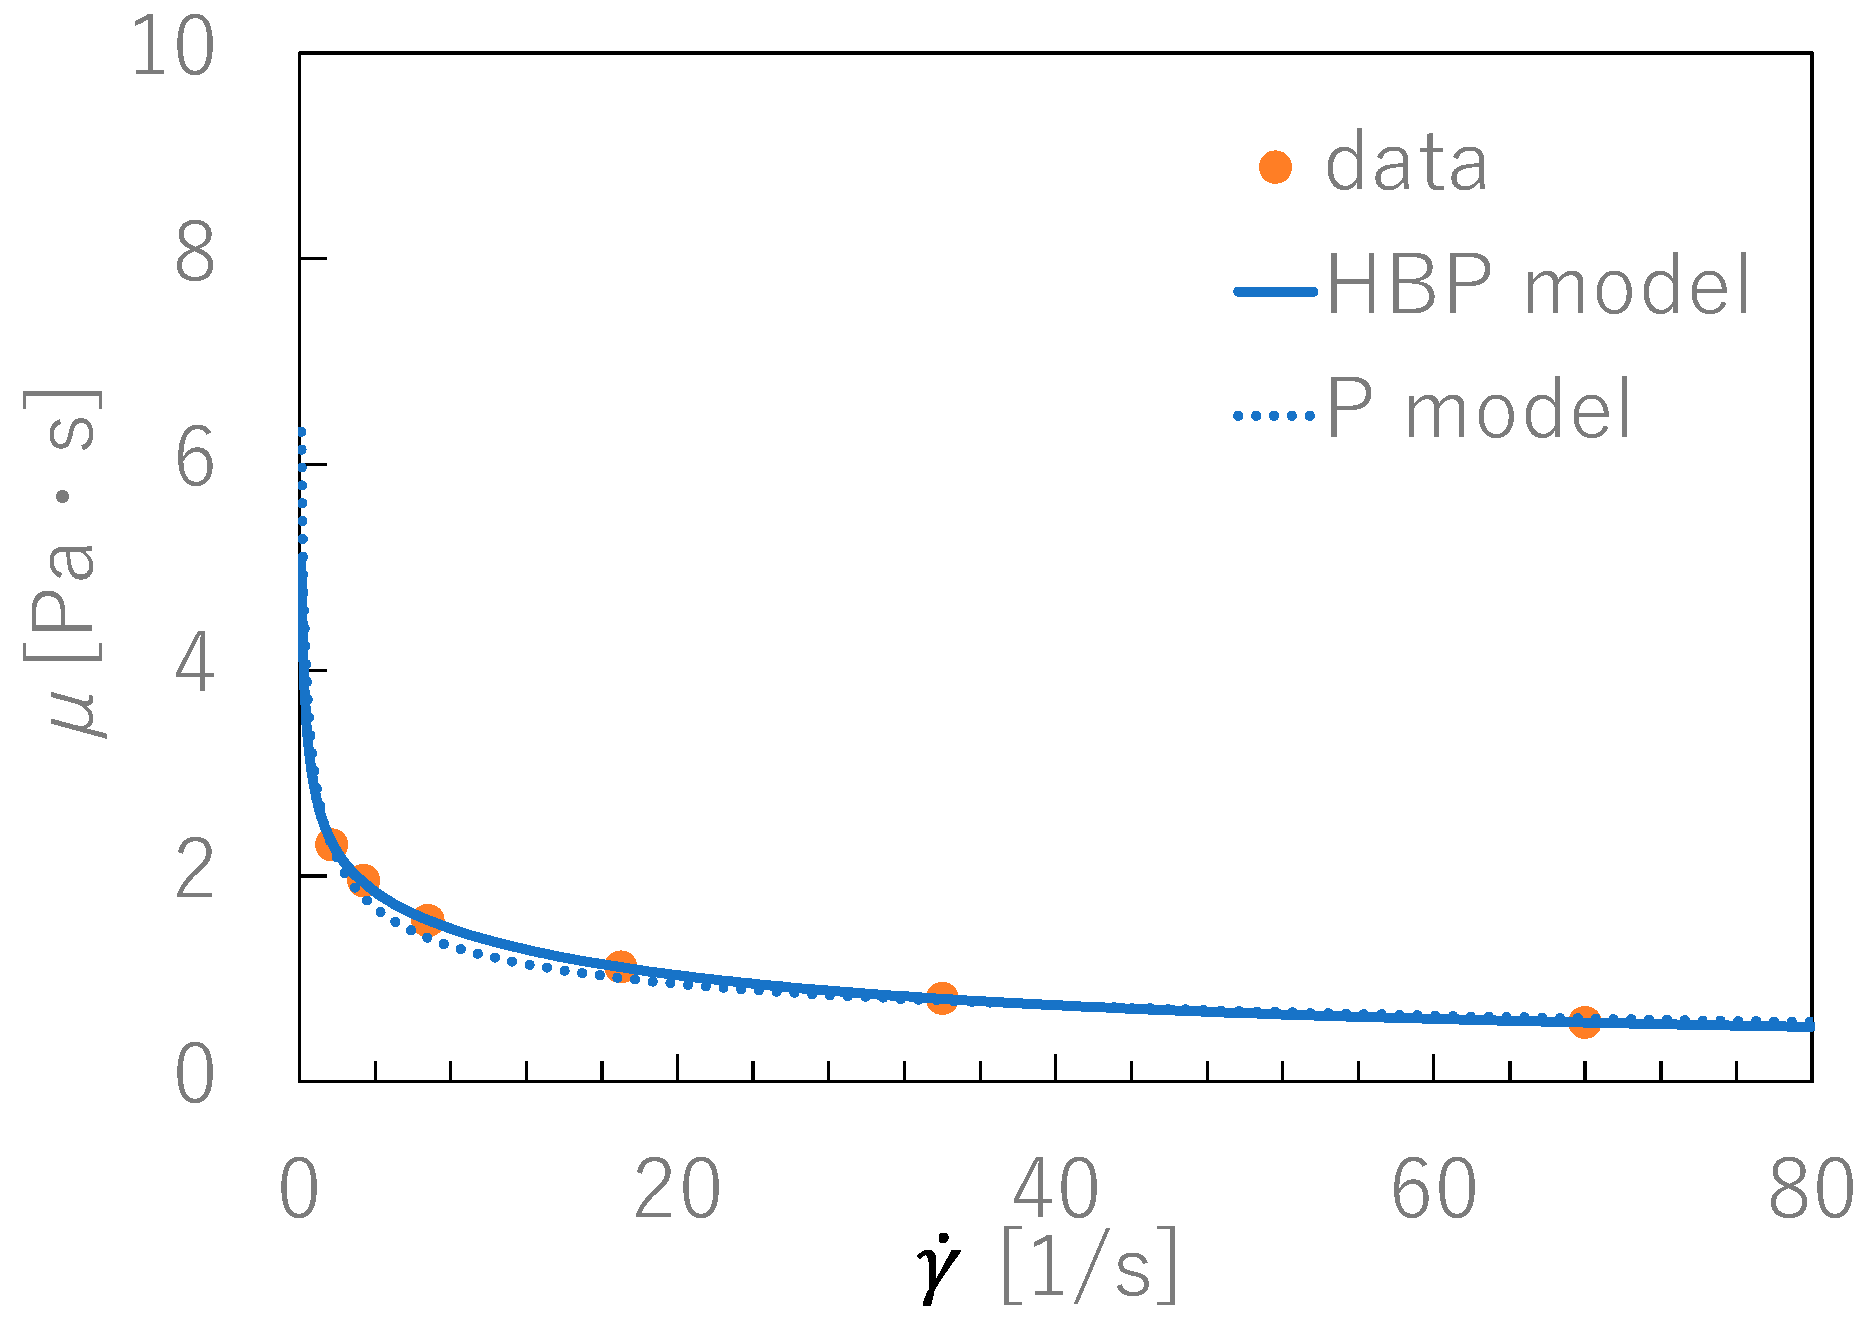
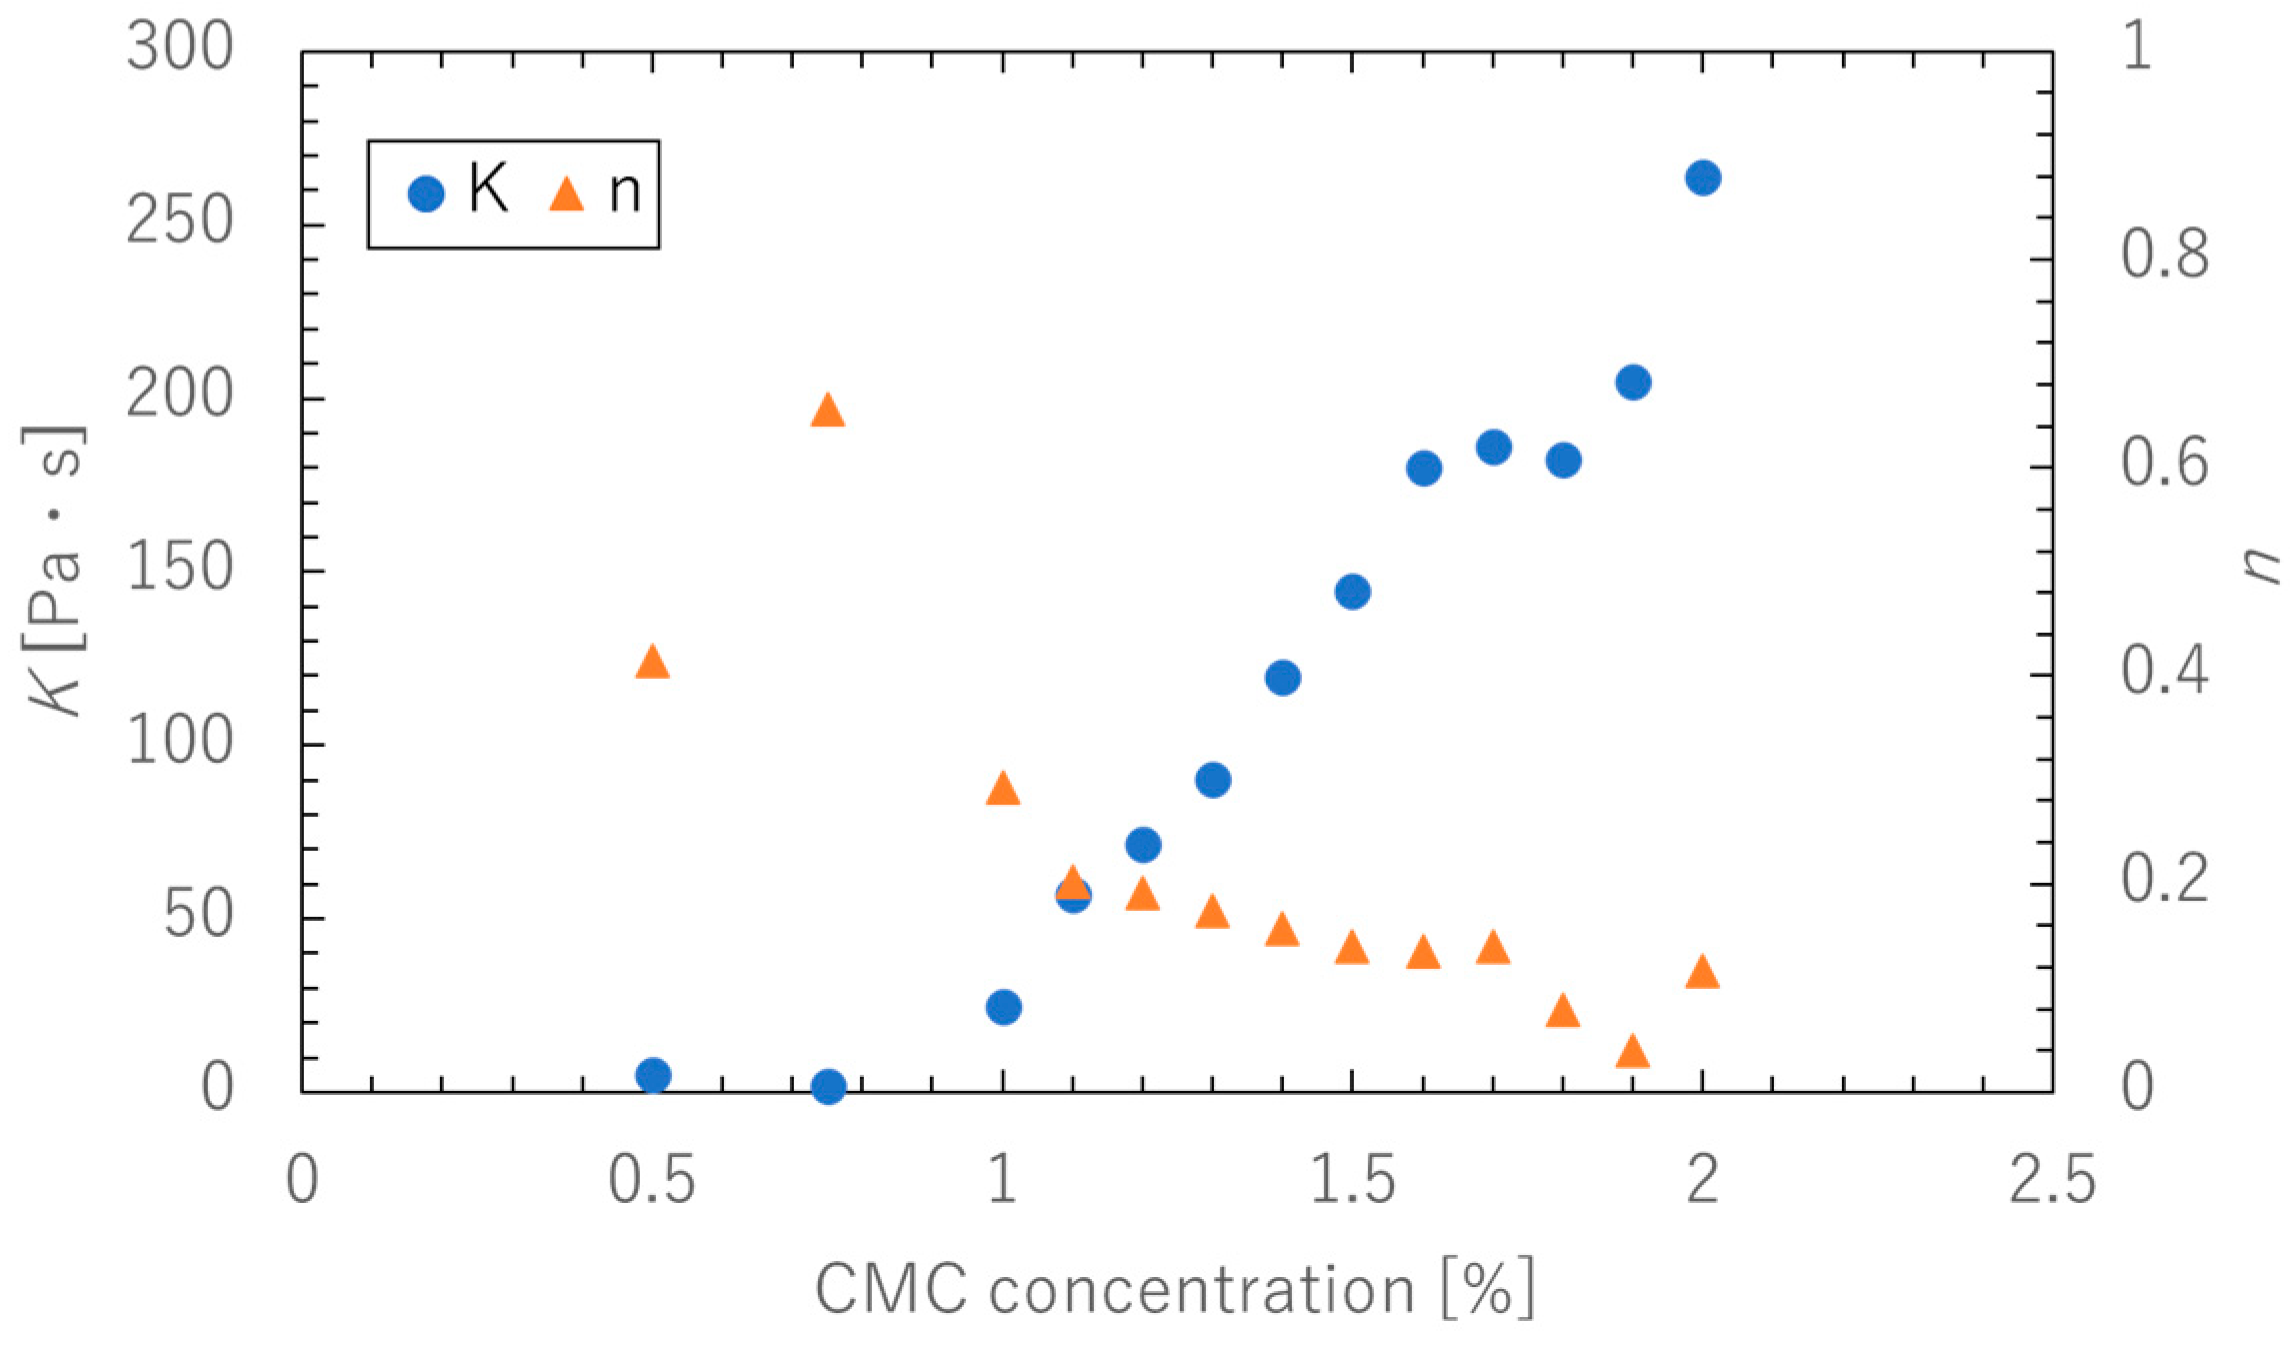
2.4. Estimation of the Viscosity Curve

Like rare-earth mud, CMC is also a pseudo-plastic fluid that exhibits a decrease in viscosity with an increase in shear rate. To evaluate the viscosity of the working fluid in this experiment, it is necessary to estimate the apparent viscosity at an any shear rate.
When estimating the viscosity of the original mud using the power-law model (hereinafter referred to as the P model) shown in Equation (1), there is a large deviation from the experimental data, especially in the low shear rate region [4]. Therefore, the modified Herschel–Bulkley model (hereinafter referred to as the HBP model), shown in Equation (2), was used in this study, which can reproduce the viscosity characteristics of a pseudo-plastic fluid like rare-earth mud with higher accuracy [8]. The equations are shown below.
μ = K γ ˙ n 1
μ = τ y γ ˙ 1 e m γ ˙ + K γ ˙ n 1
where μ is the viscosity [Pa·s], τ y is the yield stress, m is the coefficient of yield stress correction term, γ ˙ is the shear rate [1/s], K is the pseudo-plastic viscosity [Pa·s], and n is the viscosity index.
Figure 3 shows the plots of shear rate γ ˙ and viscosity μ of the HBP and P models at CMC 0.75%. The parameters were estimated using the method of Hatakeyama et al. [10]. In the estimation of CMC viscosity, the HBP model showed a better fit in the region of shear rate below 20.0 s−1, although not as pronounced as the results obtained with the original mud [8]. The HBP model showed a slightly better R2 value than the P model for all concentrations of CMC used in the experiments.
Figure 4 shows the plots of pseudo-plastic viscosity K and viscosity index n coefficients of the HBP model for each concentration of CMC. The figure also shows viscosities of CMC 1.1% to 2.0% for comparison. K does not change significantly up to CMC 0.75% but increases rapidly above 0.75%. On the other hand, n showed a tendency to decrease with increasing concentration. In other words, the increase in K becomes larger as the concentration increases above a certain level, indicating that a larger pressure is required for flow.

3. Pulp-Lift Experiments

3.1. Experimental Conditions

A simulated pumping pipe system was constructed using circular pipes to confirm whether or not the ore could be pumped and to check the flow velocity and pressure during pumping. CMC was used as the working fluid, and aluminum balls were used as ores. Figure 5 shows a schematic diagram of the experimental facility. Thick-walled vinyl chloride pipes with an inner diameter of 50 mm were used for the pipelines, with horizontal sections of about 5.0 m and vertical sections of about 5.0 m connected by elbows (R = 95 mm), for a total pipeline length is about 10 m. The top vertical end was open to atmospheric pressure. The working fluid was circulated by a hopper. Ore was introduced into the pipeline through an ore feed section installed in a branch pipe located in the horizontal pipeline near the pump.

3.1.1. Ore

Table 2 shows the specifications of ores used in the experiments. Aluminum balls (specific gravity: 2.8 kg/m3) was used because they had similar specific gravity to manganese nodules (wet specific gravity 2.0 kg/m3). Three types of aluminum balls with diameters of 10, 20, and 30 mm (hereafter A10, A20, and A30) were used. One ball of each size was fed into the pipe for each experimental condition to determine whether the ore could be lifted. It was assessed on the basis of whether the ore reached the 5.0 m vertical point or not.

3.1.2. Velocity Conditions

As in the previous report [4], a squeeze pump (ShinMaywa Industries, Ltd., MM200, Hyogo, Japan) was used. The flow velocity conditions were determined by a flowmeter (Keyence Corp., FD-Q50C, Osaka, Japan) so that each positive mean flow velocity was 0.5, 1.0, and 1.5 m/s at 1% CMC.

3.1.3. Observation Conditions

A total of six pressure gauges (KYOWA Electronic Instruments Co., Ltd., PGM-E, Tokyo, Japan) were installed to measure the pressure in the ducts during the experiment. Three were for horizontal pipes, and the others were for vertical pipes. When a squeeze pump was used, pulsation occurred in the flow, so it caused periodic flow reversals. Since the flow velocity at the reversal cannot be measured with a pipe flowmeter, an electromagnetic anemometer (JFE Advantech Co., Ltd., ACM2-RS, Hyogo, Japan) capable of measuring in both directions was installed at each location, one in the horizontal section and one in the vertical section. In addition, cameras were installed one at the pump, one in the horizontal piping section and two in the vertical piping section, to record the behavior of the fluid and ore during pumping. As shown in Table 3, experimental conditions were varied in terms of working fluid concentration and flow velocity in the pipe to confirm whether three types of ores could be pumped. Some experiments were also conducted to measure the flow velocity and pressure in the pipe without ore flowing through it.

3.2. Results

3.2.1. Pulp-Lift Results

Table 4 shows the pulp-lift results of each experiment. The circle indicates that the ore reached the 5.0 m vertical point. Similar to a previous report [4], it was revealed that the ore could be lifted with CMC even though it was impossible to lift with water. On the other hand, in CMC 1.2%, A20 and A30 could not be lifted at the flow velocity of 1.5 m/s even though all ores could be lifted in other experiments. This is due to the reverse effect of pulsation accompanying the increase in CMC concentration, which will be discussed later.

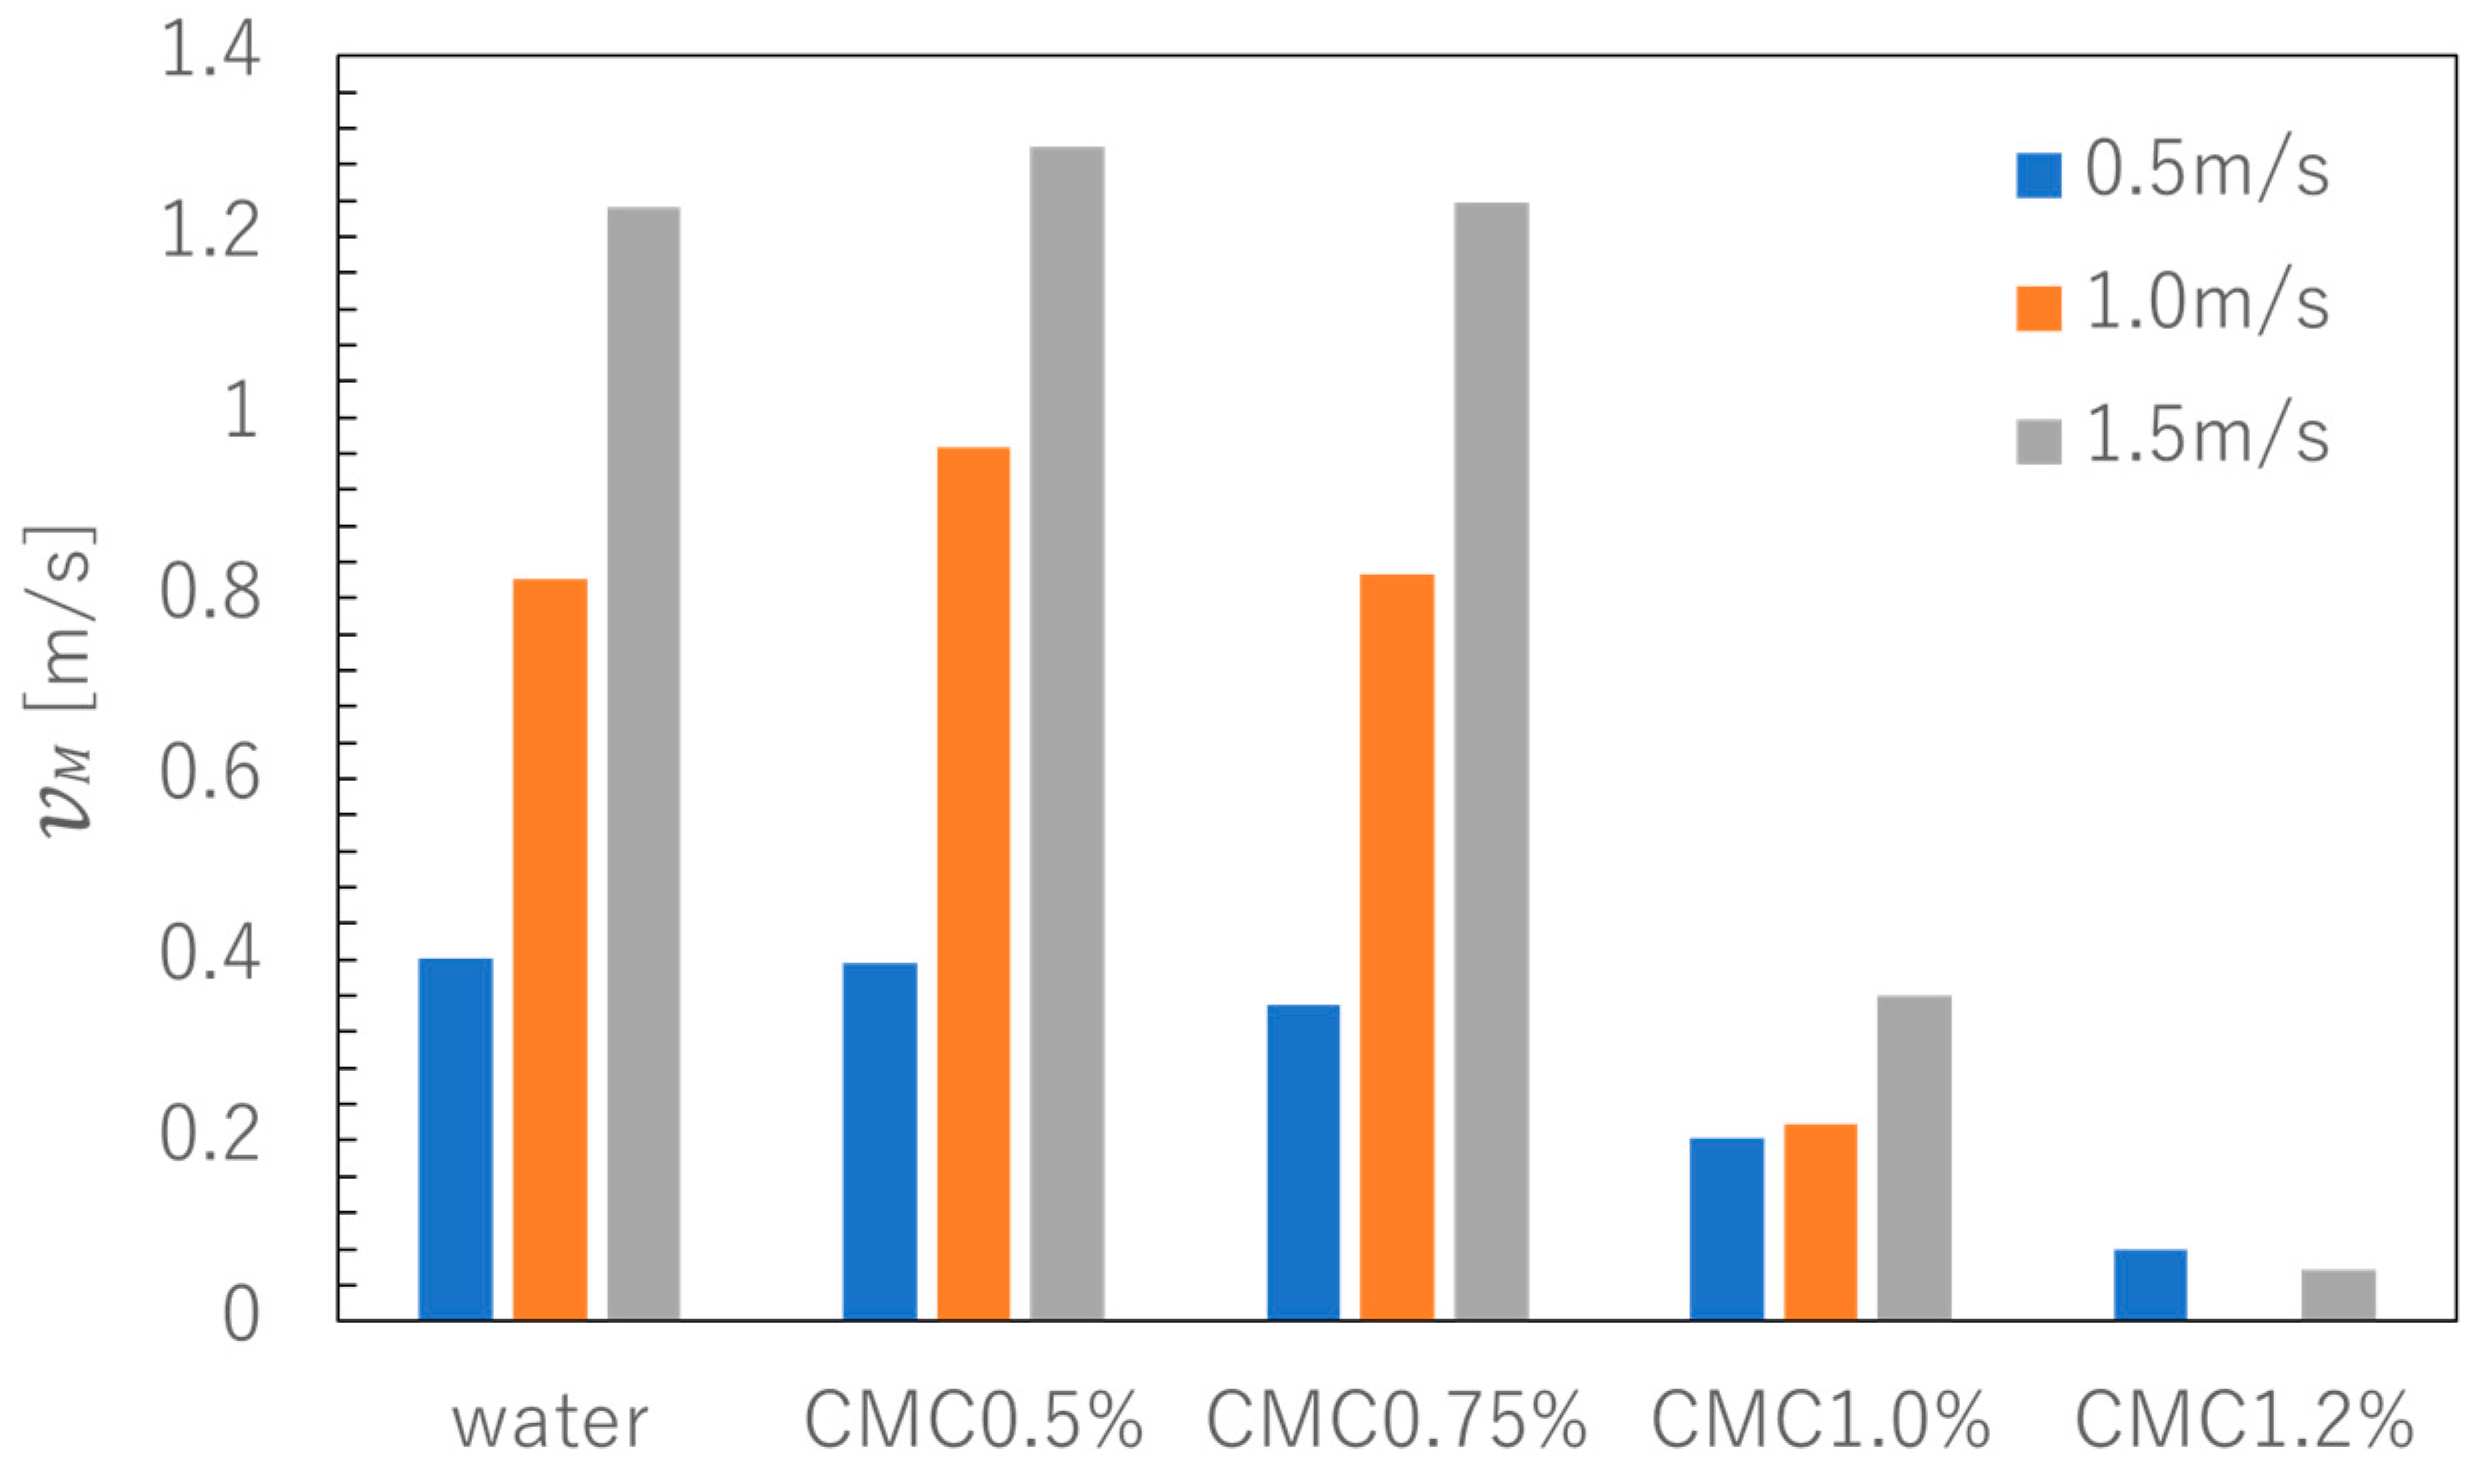
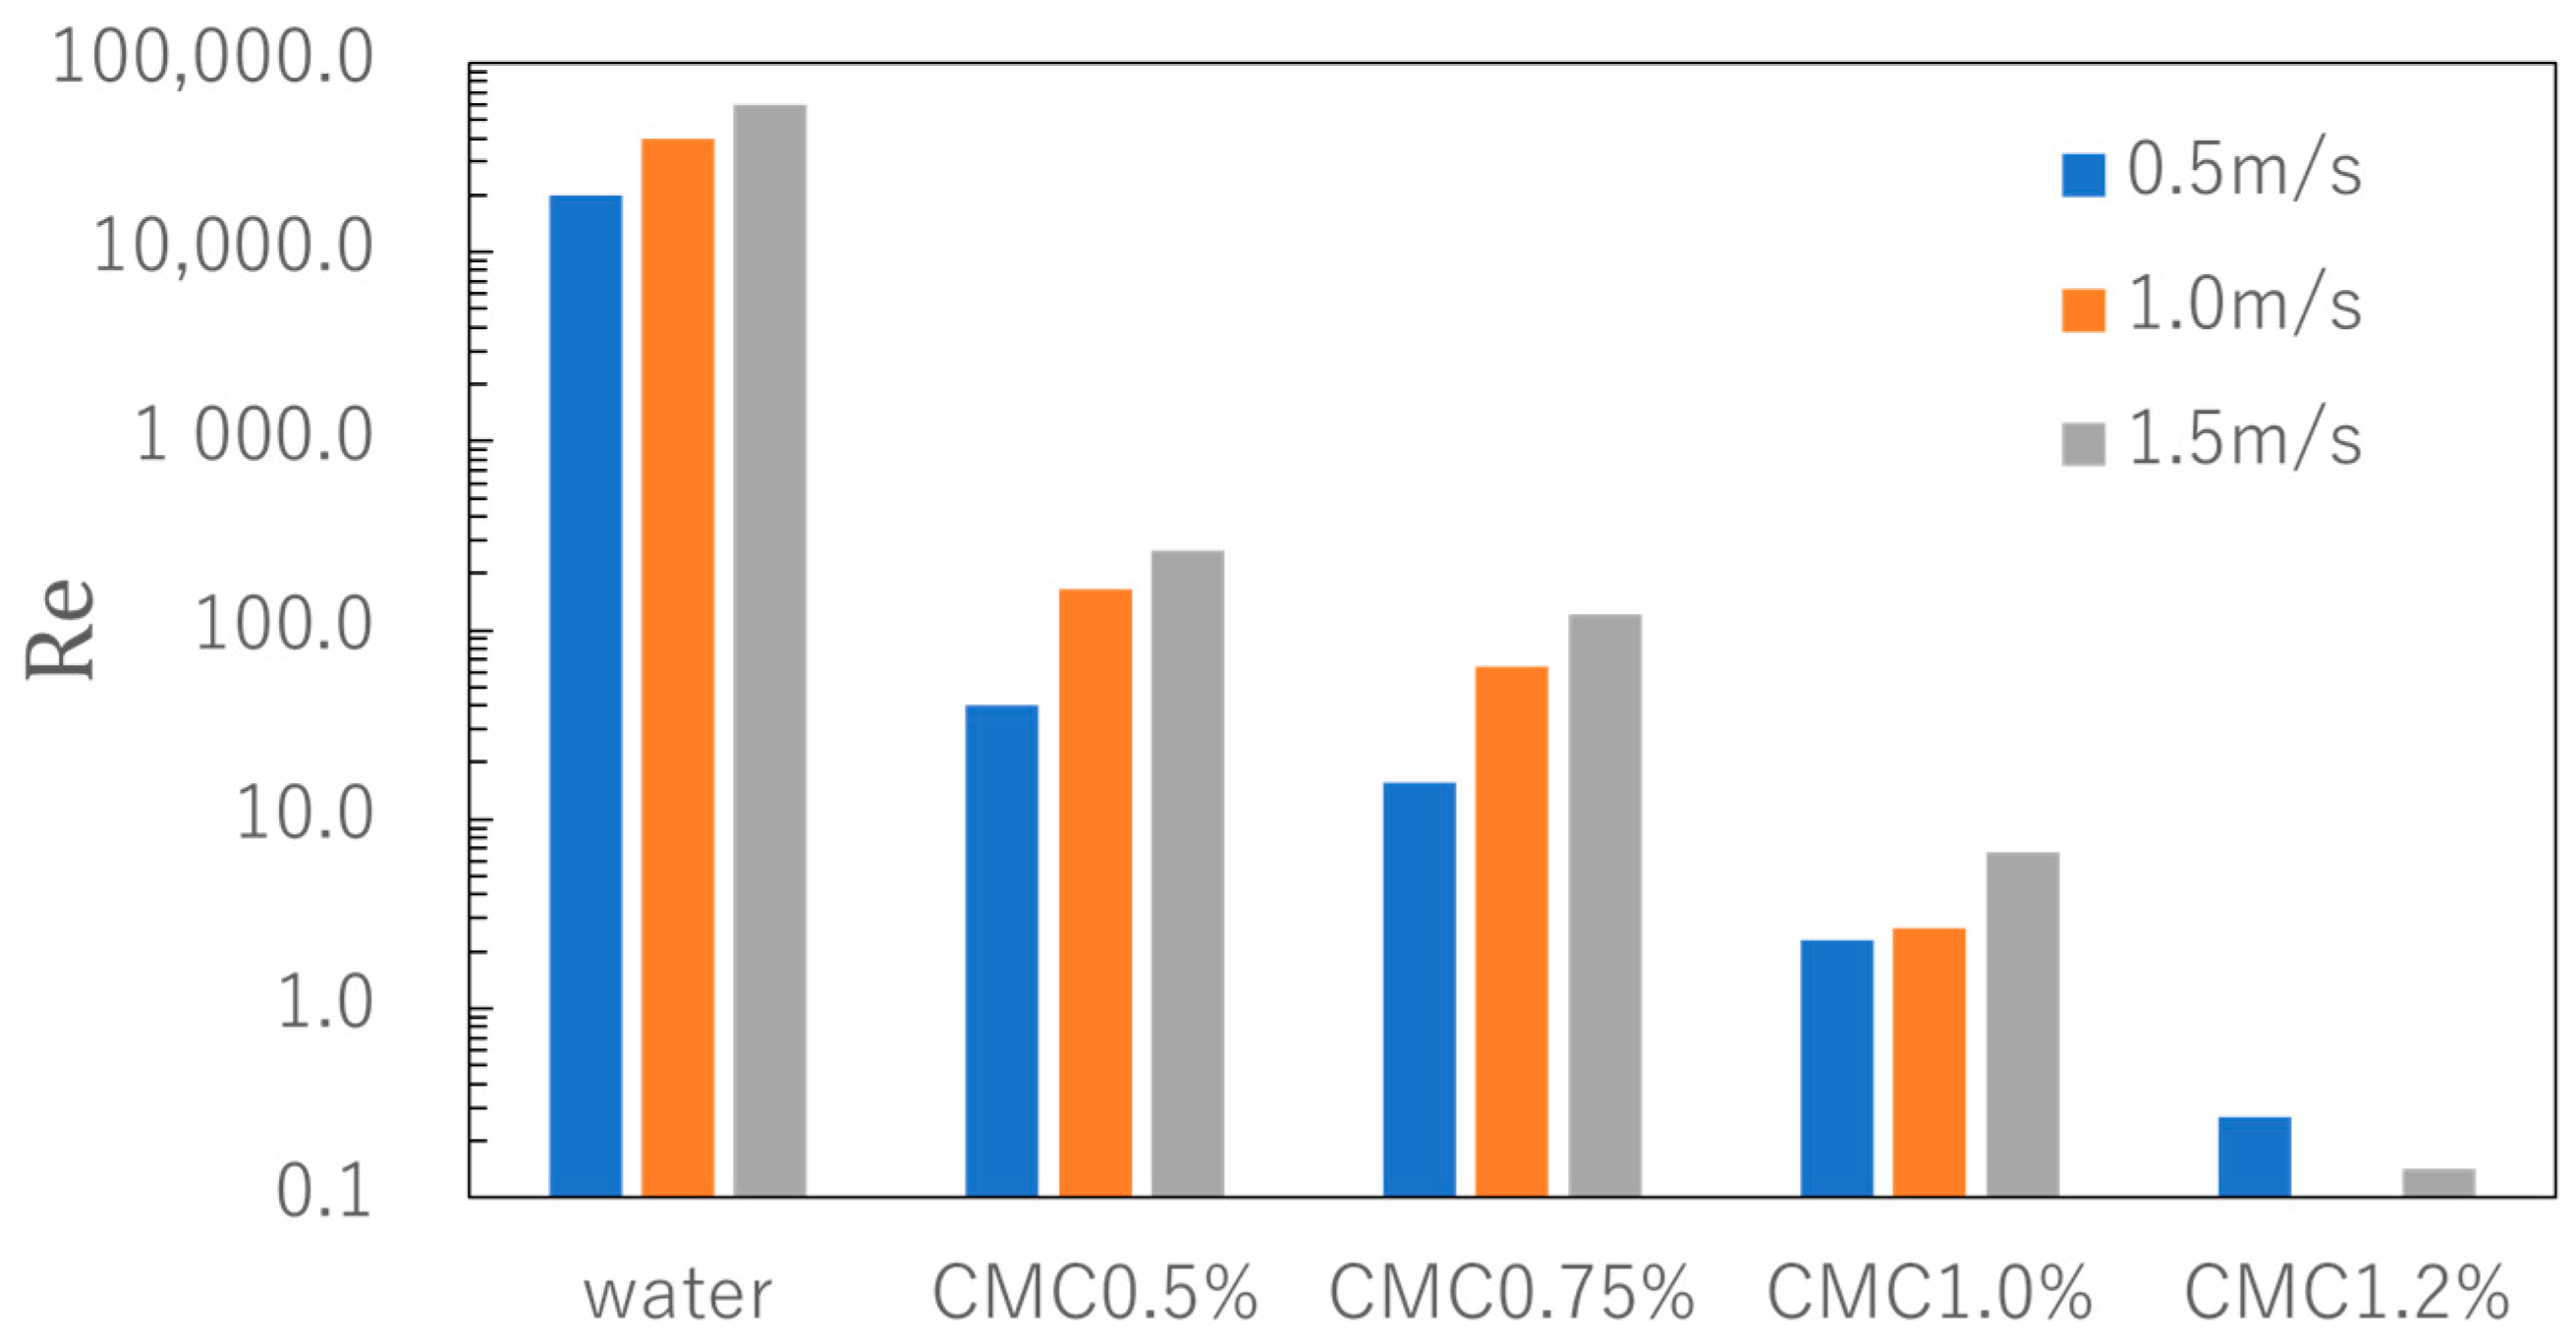
3.2.2. Reynolds Number
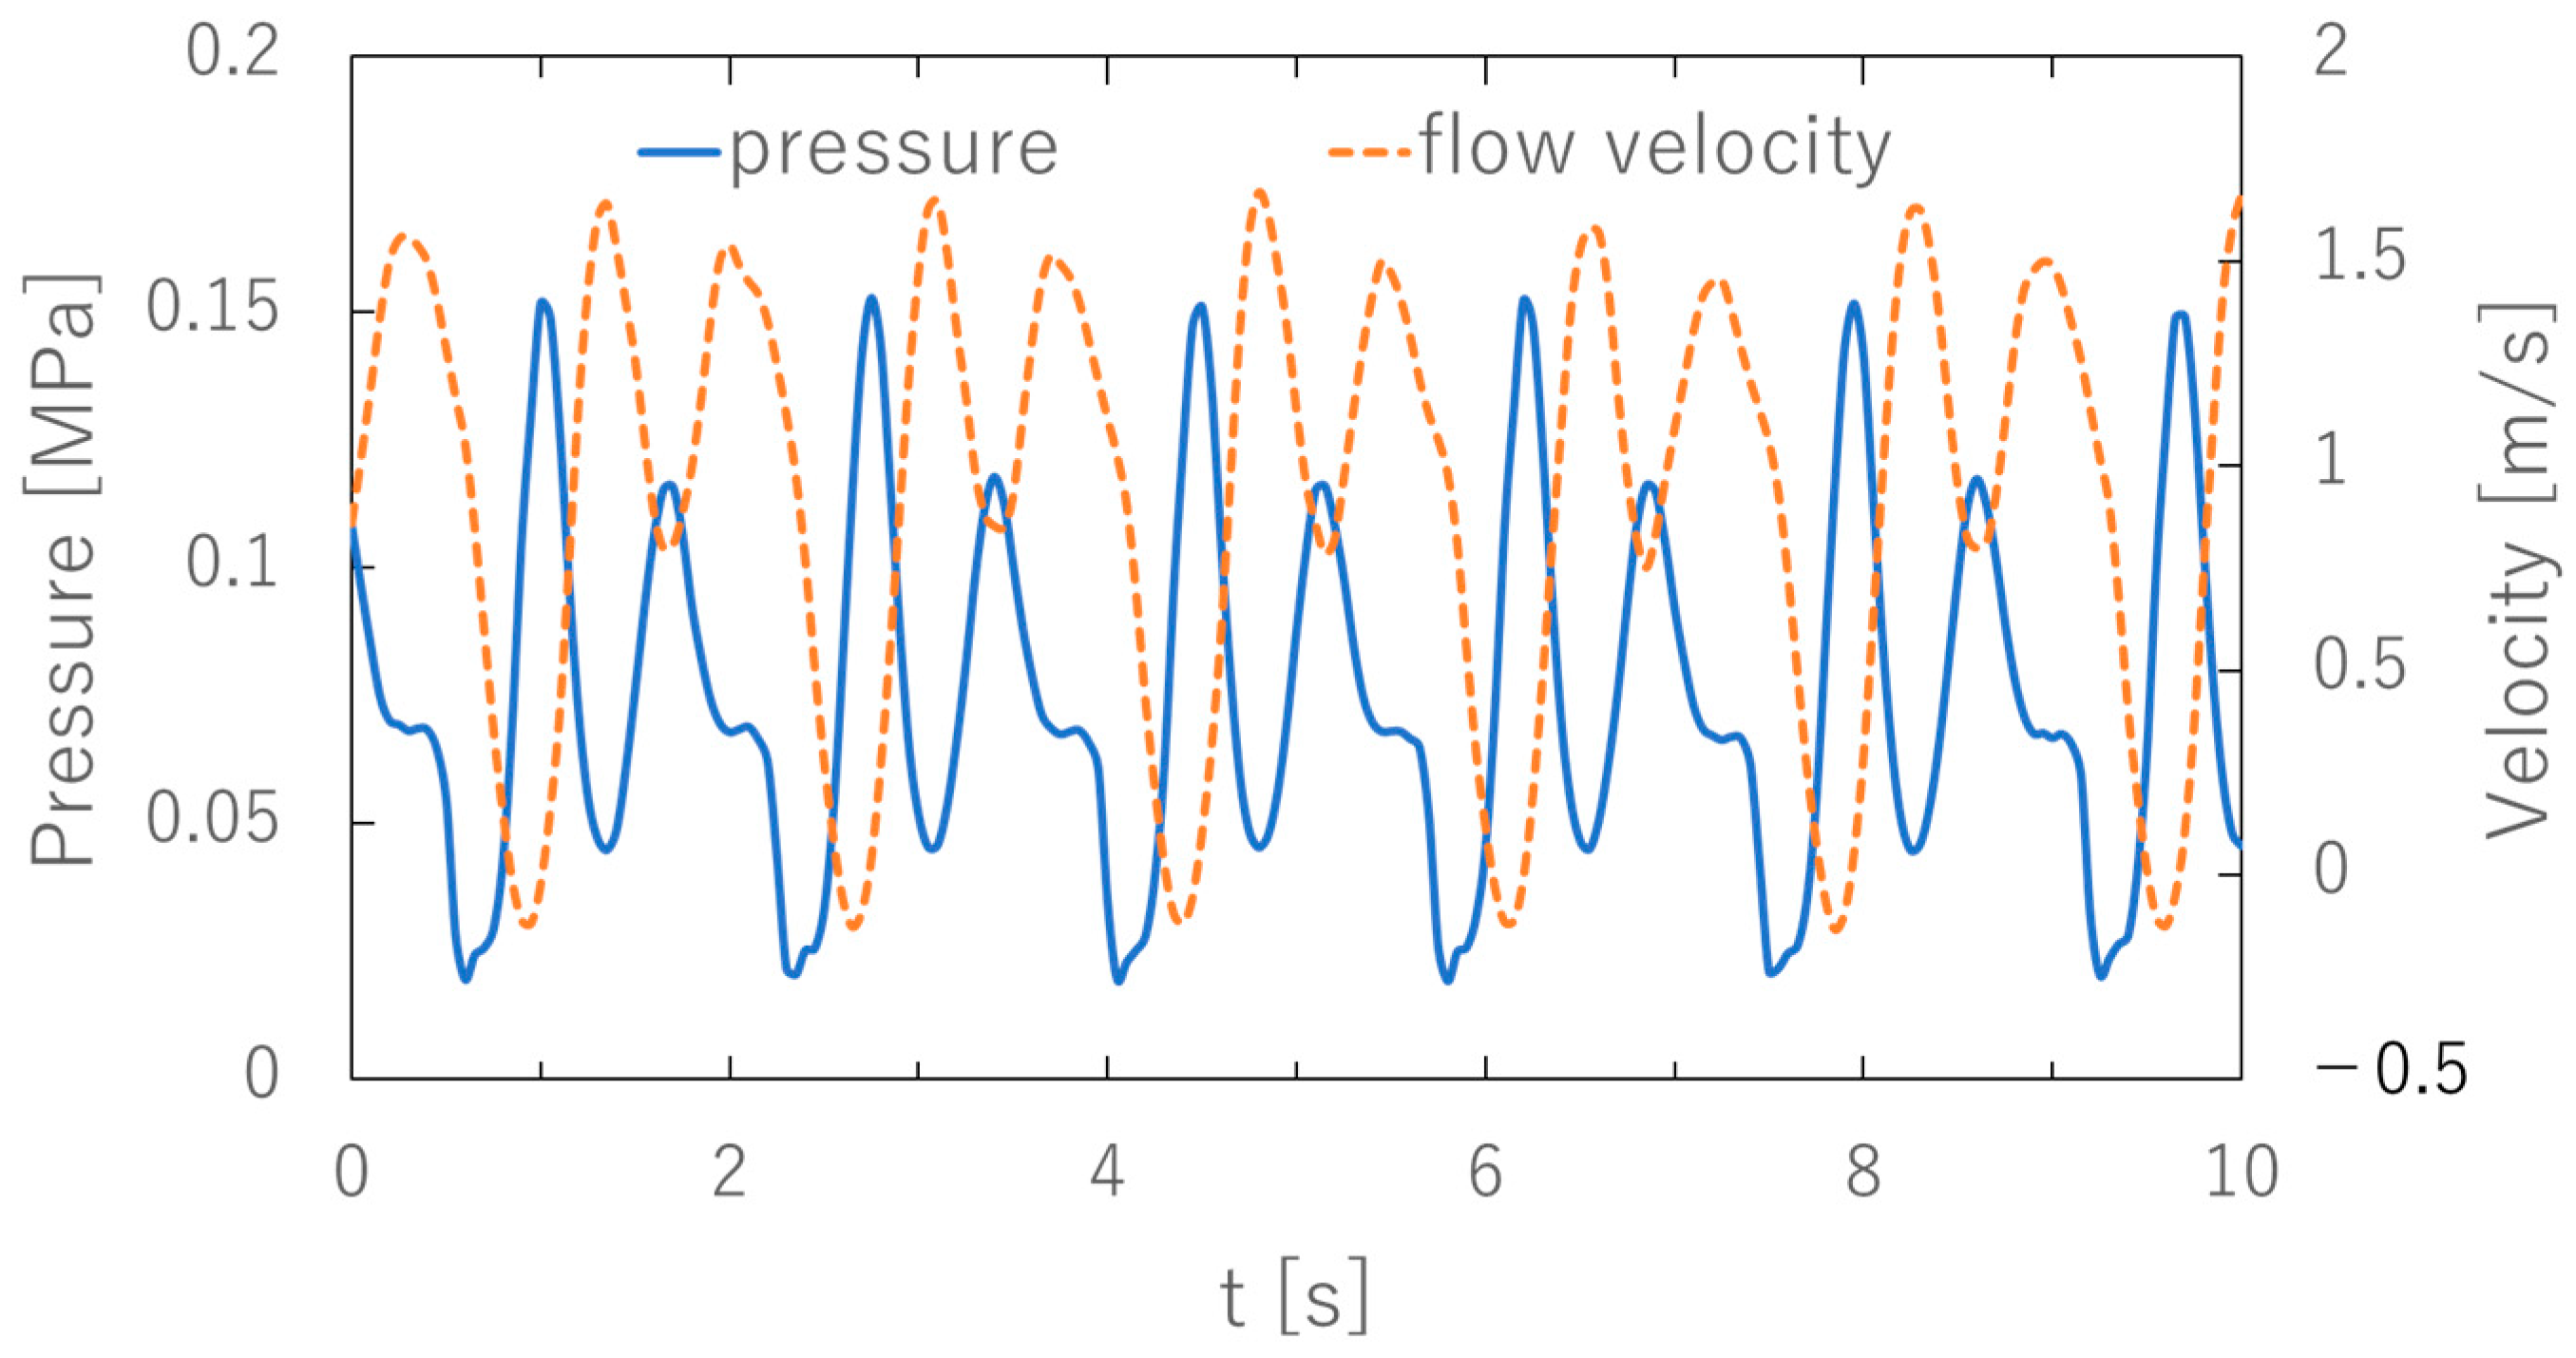
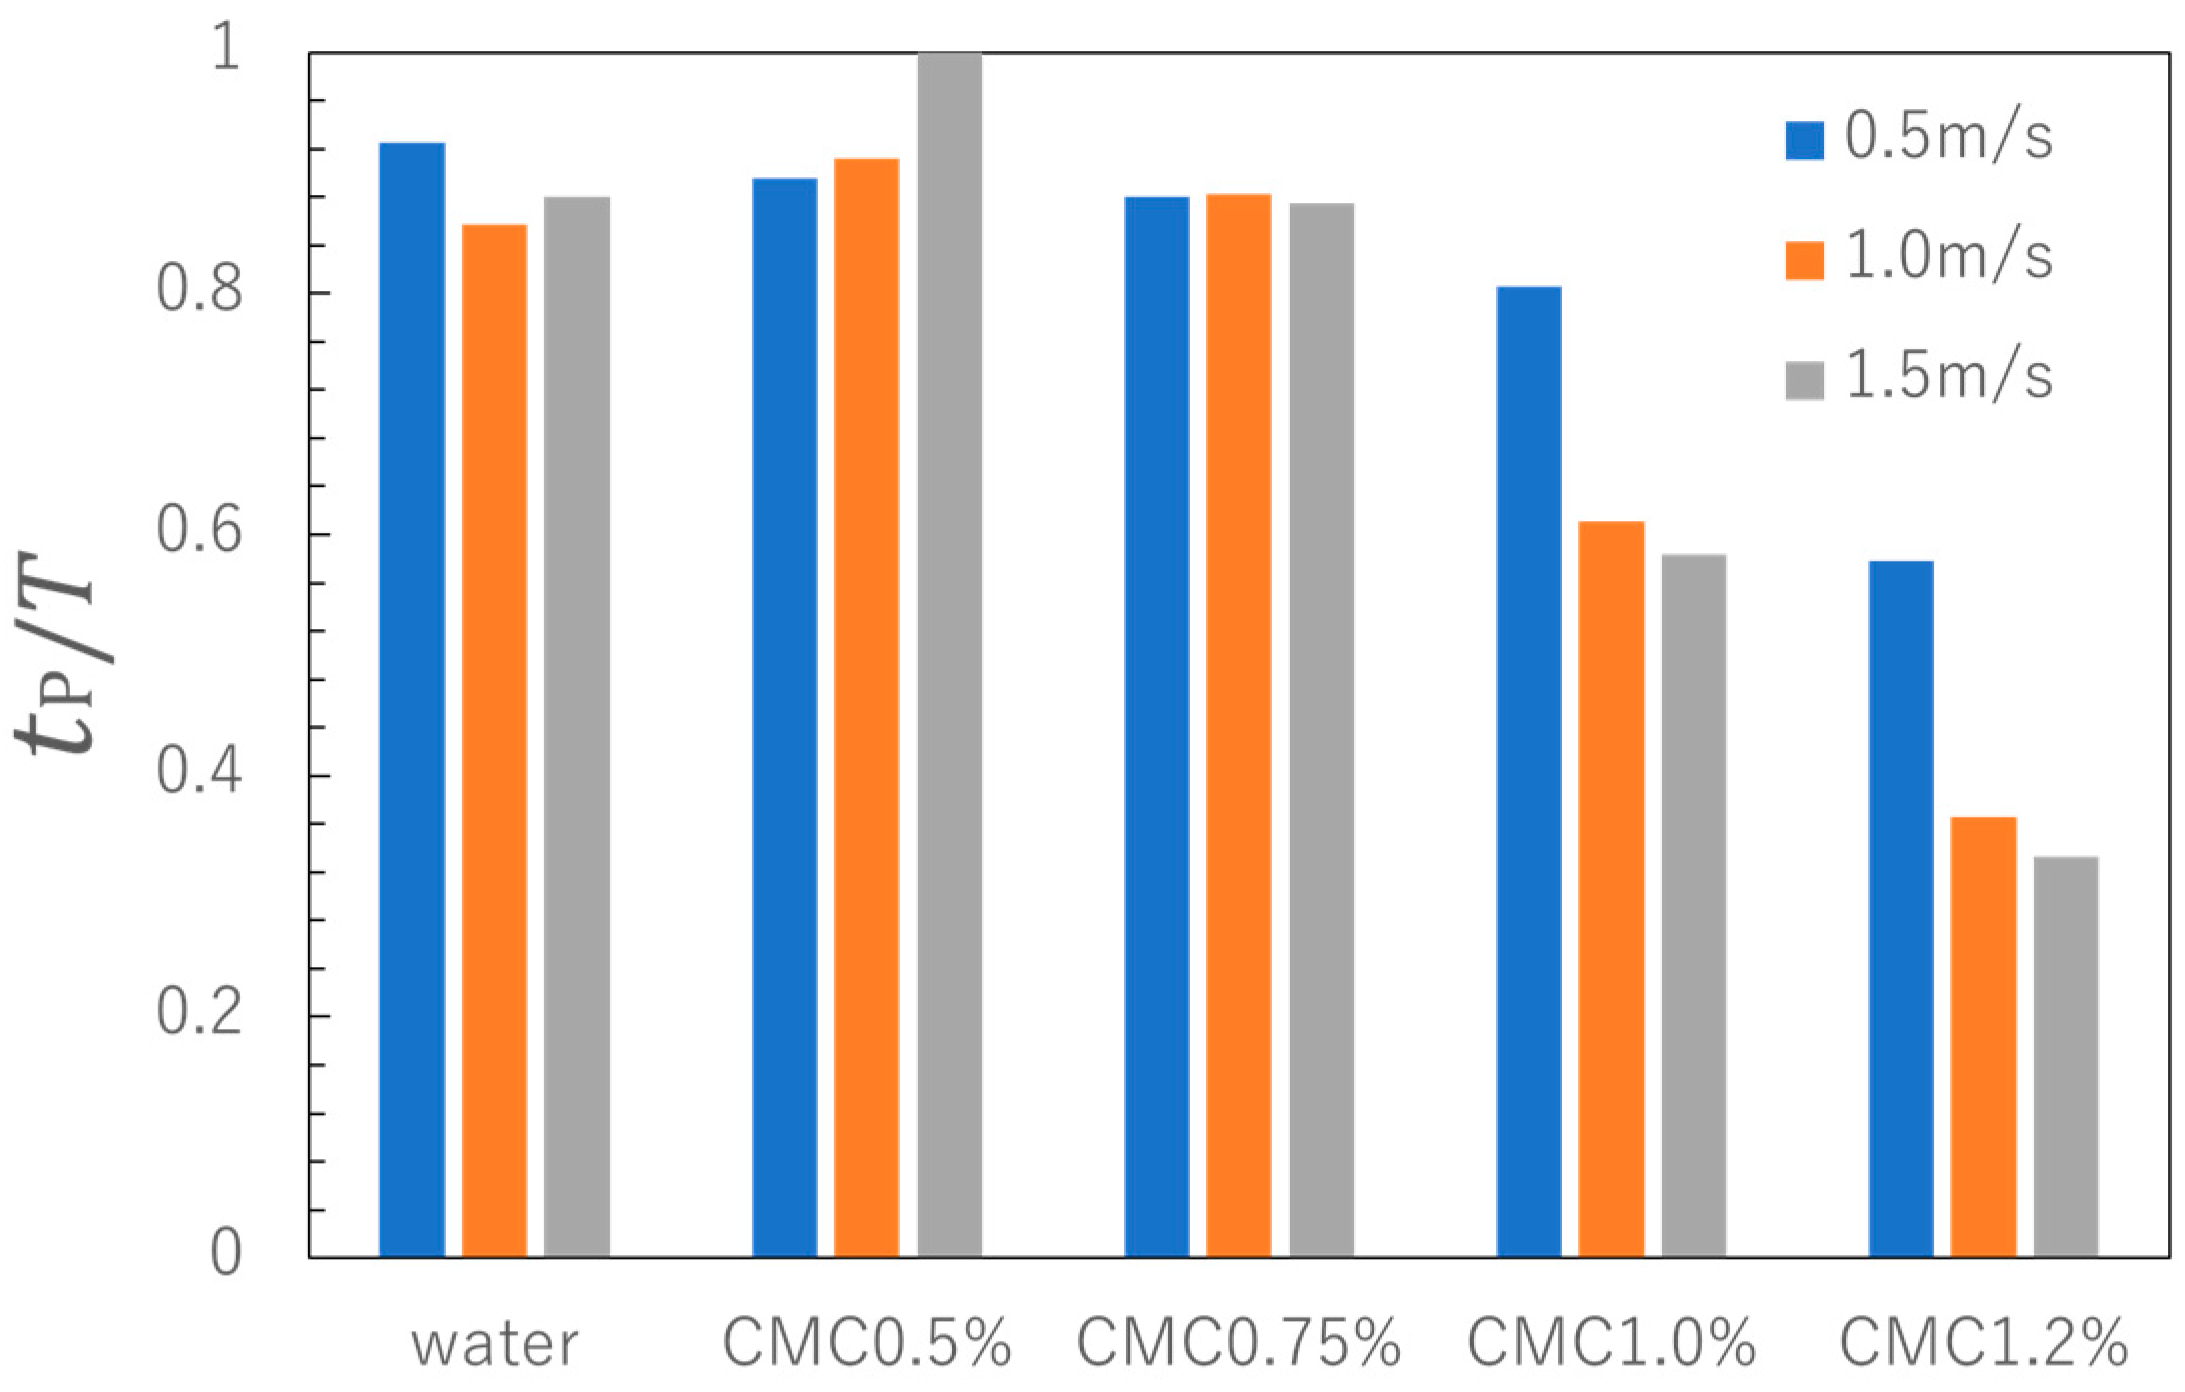
Figure 6 shows changes in flow velocity and pressure during an experiment. Both exhibit periodic pulsating flows, with the occurrence of a phase delay. Since CMC is a pseudo-plastic fluid, its apparent viscosity changes over time due to the flow velocity fluctuations, causing the Reynolds number R e to also change over time. Therefore, in this study, the Reynolds number is evaluated using v M , which is the average flow velocity per one pulsation’s period T , as the velocity scale in each experiment. Equation (3) shows R e of the HBP model.
R e = 8 1 n ρ x D n v M 2 n 1 + 3 n 1 + 2 n τ y 8 v M D n + K 4 n 1 + 3 n n
where D is the pipe diameter [mm] and v M is the average velocity per one period [m/s].
Figure 7 shows bar graphs of v M for each fluid. Here, the experiment with CMC 1.2% at 1.0 m/s is excluded because v M was negative. A significant decrease was observed in CMC 1.0% and 1.2%. This was due to an increase in the backflow as the viscosity of the working fluid increased.
Figure 8 shows R e , excluding the experiment with CMC 1.2% at 1.0 m/s velocity because v M was negative. R e for water were in the order of 104 or higher, thus turbulent range in all experiments, while those for CMC were in the order of 103 or lower, thus laminar range in all experiments. The large difference in kinematic viscosity between water and CMC is thought to have caused the difference in flow conditions.

3.2.3. Pulsation

To evaluate the amount of backflow due to pump pulsation, the ratio t P T was calculated for each experiment. Here, t P represents the time when a positive flow occurred during one pulsation’s period T . The results are shown in Figure 9.
Figure 9 shows that, except for the experiment with CMC 0.5% at 1.5 m/s, negative flow velocities occurred during one pulsation’s period, indicating the occurrence of backflow. In the experiments with CMC 1.0% and 1.2%, the reduction in the rate of positive flow velocities is noticeable as the flow velocity increases. On the other hand, for CMC 0.5%, the time fraction of positive flow velocity increases with increasing flow velocity, especially at 1.5 m/s, where positive flow velocity always occurs. In this case, the frictional resistance is considered to have decreased due to the submerged flow caused by the viscosity of the fluid.
Figure 10 shows the velocity amplitude ratio   v M A X v M , which is the ratio of the maximum turbulent component of the flow velocity to v M in each experiment. If it increases, it means that the pump pulsation also increases. Figure 10 shows that the velocity amplitude ratio tends to decrease with increasing flow velocity for water and CMC 0.5% and 0.75%. This indicates that in a low viscosity environment, the greater the flow velocity, the more stable the flow. On the other hand, CMC 1.0% and CMC 1.2% show a greater value of v M A X v M , and different trends. This indicates that velocity fluctuations due to pump pulsation became pronounced, because of high viscosity.
Therefore, the results show that flow turbulence is suppressed when the CMC concentration is around 0.5–0.75%, while the amplitude of turbulence increases when the CMC concentration is 1.0% or higher.

4. Discussion

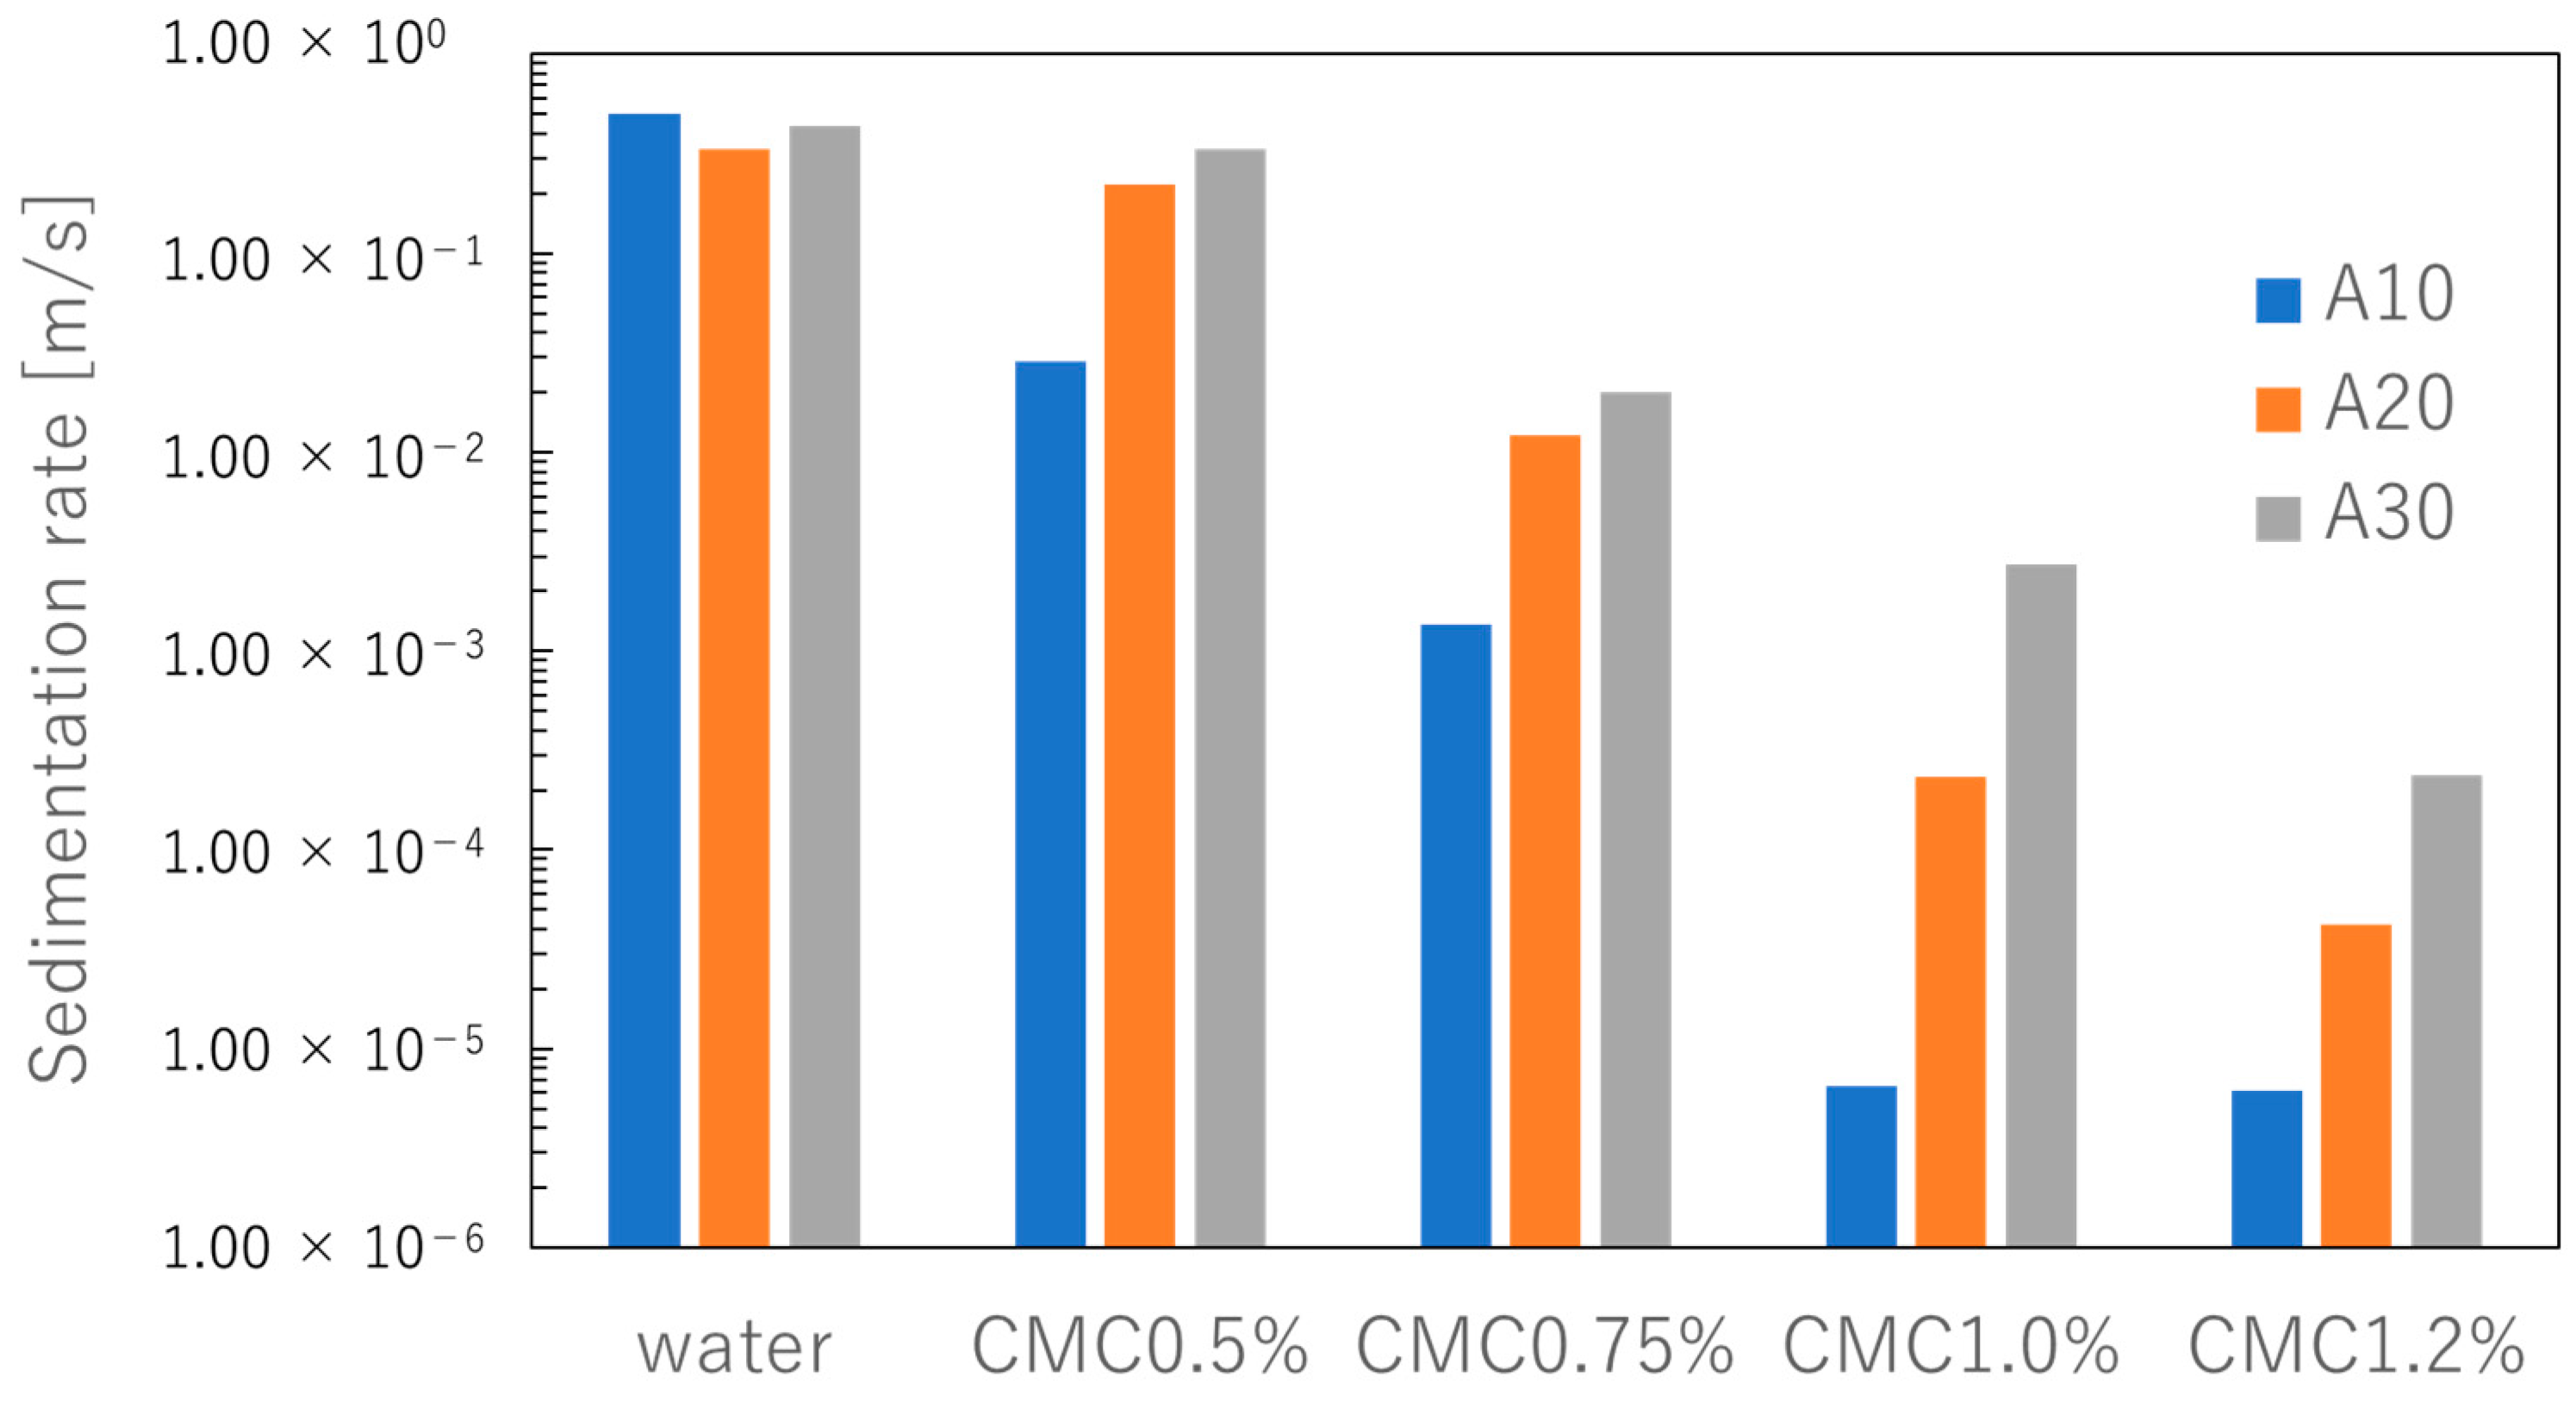
4.1. Results of Lifting Ore

The results of lifting ore using different working fluids are considered on the basis of the balance of gravity, buoyancy, and drag F on the ore being pumped [11]. As shown in Table 1, the difference in density between CMC and water is small, and the magnitude of gravity and buoyancy forces on ores of the same size are independent of the difference in working fluids. Therefore, the ability to lift the ore is greatly affected by changes in F, as shown below.
F = 1 2 ρ C D A v M 2
where ρ is the fluid density [kg/m3], C D is the drag coefficient, and A is the projected area of sphere [m2].
As shown in Figure 7, there is no significant difference in flow velocity between water and CMC, except for CMC 1.0% and 1.2%. Therefore, the value of C D determines whether the ore can be pumped.
Figure 11 shows the relationship between R e and C D . Except in the transition region between laminar and turbulent flows, C D basically decreases with increasing R e .
Figure 12 shows the results of drag for each experiment, using the value in Figure 8 for R e , v M for the velocity scale, and the value at A30 for the projected area A of the sphere. C D was calculated using the Clift and Grauvin equation. R e of water indicates turbulent flow, while CMC indicates laminar flow, resulting in differences in C D . As a result, it can be assumed that a greater F is generated by CMC than by water for the same pumping conditions.
Additional sedimentation experiments of ores were conducted using vessels with the same pipe diameters as those used in the pulp-lift experiments. Ores were gently introduced into the vessel containing each working fluid, and the sedimentation rate of each case was calculated. The results are shown in Figure 13.
Figure 13 shows that, in water, the sedimentation rate is higher for all ore sizes than in CMC. This results in the ore settling over a greater distance in water than in CMC when the flow return occurs due to pulsation, making it impossible to pump the ore in water at low velocities. On the other hand, in CMC, the sedimentation rate is lower than in water. This is significant in high concentrations, where the fluid and ore are considered to flow almost as a single unit.
The results indicate that if CMC is added to water, viscosity of the solution is increased, and the drag force on the ore is also increased. In addition, sedimentation rate is suppressed. Therefore, adding the CMC improves the ore lifting ability.

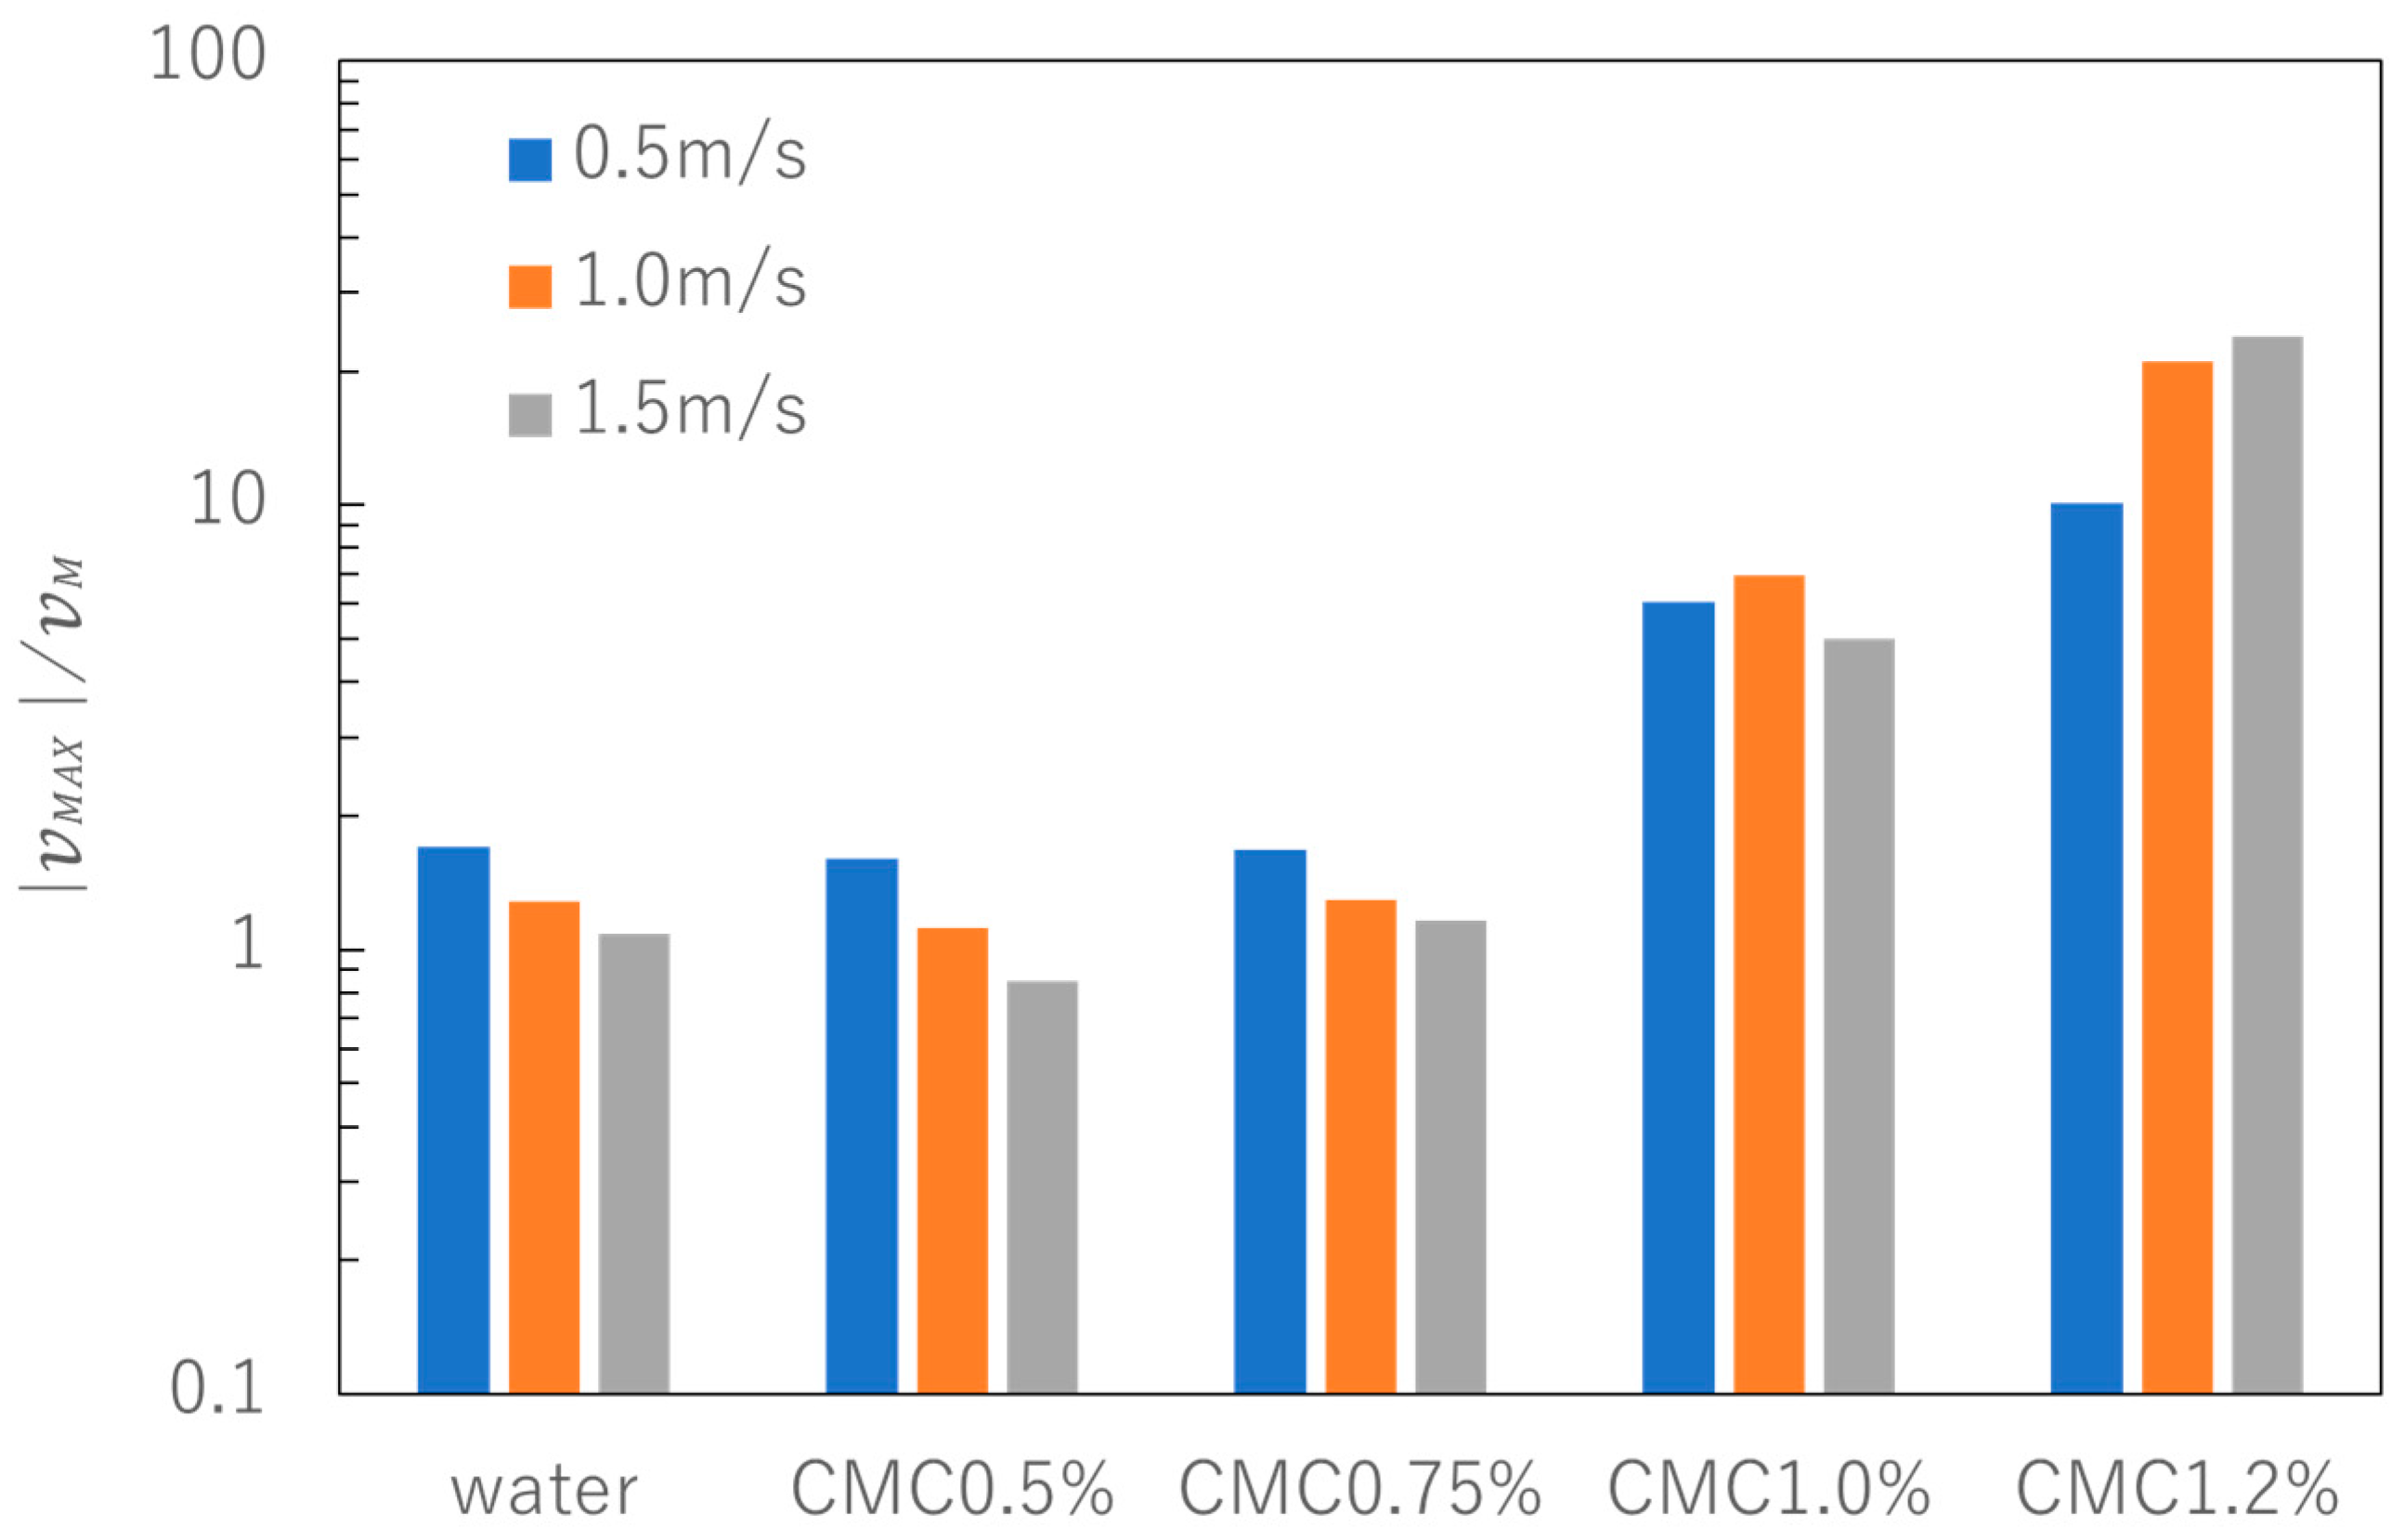
4.2. Effects of Pulsation Caused by Increased Viscosity

As mentioned earlier, the addition of CMC increased the drag force F acting on the ore in the fluid, while making it impossible to lift A20 and A30 in CMC 1.2% at 1.5 m/s flow velocity.
These results are influenced by the characteristics of the pseudo-plastic fluid shown in Figure 4. When CMC is added to water, the pseudo-plastic viscosity K increases and the viscosity index n decreases; the increase in K indicates an increase in frictional resistance, and the decrease in n indicates a reduction in viscosity for the same shear rate. The increase in K is larger, and the decrease in n is smaller around 1% of CMC concentration. Therefore, the results of this experiment suggest that the fluid flowed similarly to water at CMC 0.5% to 0.75% because of the reduction in viscosity during flow. This was because the increase in shear rate during pumping was also large, even though the K of the working fluid increased.
On the other hand, in CMC 1.0% or higher, the viscoelasticity of the fluid increases with the increase in concentration. And the working fluid in the entire pipe moves as one unit in response to pressure fluctuations of the pump. As a result, the backflow due to pump pulsation becomes more pronounced, especially under high flow velocity conditions, and the movement of ore in one cycle is considered to be canceled.
Therefore, when using a pump that produces pulsation, such as a mortar pump, an excessive increase in viscosity amplifies the backflow due to pulsation, which in turn is disadvantageous for lifting ores.

5. Conclusions

In this study, a pulp-lift experiment was conducted using CMC as the working fluid, which exhibit viscosity characteristics similar to those of rare-earth mud. And we investigated the effects of working fluid viscosity and pump pulsation on the pumping of manganese nodules and rare-earth mud. The main conclusions of this study are as follows.
(1)
The results of lifting ore using water and CMC as the working fluids showed that ores that could not be pumped by water could be pumped using CMC. This is because the increase in fluid viscosity suppressed turbulence in the pipe and increased the drag force. In addition, the sedimentation of the ore at the time of reversal was suppressed. Therefore, an appropriate increase in viscosity improves ore pumping efficiency.
(2)
On the other hand, an excessive increase in viscosity causes an increase in backward flow due to pump pulsation.
(3)
Therefore, there is an optimum viscosity for pulp-lift ore pumping, and a viscosity of about CMC 0.5% was optimum in this experiment.
The optimum concentration of working fluid for the pulp-lift system should be aligned with the capacity of the pumps used in actual sea areas. Once the optimum concentration is determined, producing the working fluid at that concentration in actual seas becomes an issue. Furthermore, since density was not considered in this experiment, it is necessary to use actual muddy seawater for further study.
The feasibility of the pulp-lift method depends on how much the economic value can be increased by simultaneously pumping manganese nodules and rare-earth mud. However, an excessive increase in the volume concentration of rare-earth mud could have negative effects, as observed in the case of CMC in this study. The feasibility of the pulp-lift method should be examined considering both economic efficiency and optimum pumping conditions.

Author Contributions

Conceptualization, T.Y. and N.N.; methodology, H.K.; software, S.O.; validation, K.O., H.K. and N.N.; formal analysis, S.O.; writing—original draft preparation, S.O.; writing—review and editing, Y.I.; visualization, S.O.; supervision, T.Y. All authors have read and agreed to the published version of the manuscript.

Funding

This research received no external funding.

Institutional Review Board Statement

Not applicable.

Informed Consent Statement

Not applicable.

Data Availability Statement

Data are available from the corresponding author upon request and subject to the Human Subjects protocol restrictions.

Acknowledgments

We thank Penta Techno Service Co., Ltd. for their assistance in conducting the experiments.

Conflicts of Interest

Author Sakai Onishi, Yurie Itagaki and Hiroyuki Katayama were employed by the company Penta-Ocean Construction Co., Ltd. The remaining authors declare that the research was conducted in the absence of any commercial or financial relationships that could be construed as a potential conflict of interest.

References

  1. Kato, Y.; Fujinaga, K.; Nakamura, K.; Takaya, Y.; Kitamura, K.; Ohta, J.; Toda, R.; Nakashima, T.; Iwamori, H. Deep-Sea Mud in the Pacific Ocean as a Potential Resource for Rare-Earth Elements. Nat. Geosci. 2011, 4, 535–539. [Google Scholar] [CrossRef]
  2. Bernard, J.; Bath, A.; Greger, B. Analysis and Comparison of Nodule Hydraulic Transport Systems. In Proceedings of the Offshore Technology Conference, Huston, TX, USA, 27–30 April 1987. [Google Scholar]
  3. Yamazaki, T.; Nakatani, N.; Arai, R.; Sekimoto, T.; Katayama, H. Combined Mining and Pulp-Lifting of Ferromanganese Nodules and Rare-Earth Element-Rich Mud around Minamitorishima Island in the Western North Pacific: A Prefeasibility Study. Minerals 2021, 11, 310. [Google Scholar] [CrossRef]
  4. Sugahara, H.; Shimomura, K.; Nakatani, N.; Yamazaki, T.; Katayama, H.; Kumagai, T. Fundamental Study of Pulp Lift Method for Mixed Lifting of Submarine Mineral Resources. Jpn. J. JSCE 2023, 79, 23–18091. [Google Scholar] [CrossRef]
  5. Orita, K.; Tani, K.; Suzuki, A.; Kosho, T. Study of Ore Lifting Efficiency Using Mixture of Bentonite Suspension and Sand for Deep Sea Mining. J. JSCE Ser. B3 2021, 77, I_523–I_528. [Google Scholar] [CrossRef] [PubMed]
  6. Nunoya, N.; Tsuchida, T.; Abe, T. Flow Characteristics of Marine Clays of High Water Content Condition. J. Jpn. Soc. Civ. Eng. Ser. B2 (Coast. Eng.) 2012, 68, I_551–I_555. [Google Scholar] [CrossRef]
  7. Japanese Standards Association (1991). JIS Z 8803: Methods for Viscosity Measurement of Liquid. 2011. Available online: https://kikakurui.com/z8/Z8803-2011-01.html (accessed on 19 July 2024).
  8. Shimizu, Y.; Hatakeyama, N.; Hanamura, E.; Watanabe, K.; Yokoyama, Y.; Masuyama, T. Flow Characteristics of Slurry with Rare-Earth Rich Mud under Deep Seabed around Minamitorishima. J. Min. Mater. Process. Inst. Jpn. 2019, 135, 52–62. [Google Scholar] [CrossRef]
  9. Asai, K.; Ichiyanagi, M.; Satone, H.; Mori, T.; Tsubaki, J.; Itoh, Y. The Influence of Non-Newtonian Property on the Apparent Viscosity Measured by Single Cylinder Rotational Viscometer (Type-B Viscometer). J. Soc. Powder Technol. Jpn. 2009, 46, 873–880. [Google Scholar] [CrossRef]
  10. Hatakeyama, N.; Shimizu, Y.; Masuyama, T. Spreadsheet Solutions for Rheological Properties and Viscoplastic Fluid Flow in Circular Pipes and in Parallel-Plates. J. Min. Mater. Process. Inst. Jpn. 2019, 135, 15–24. [Google Scholar] [CrossRef]
  11. Orita, K.; Tani, K.; Kosho, T.; Suzuki, A.; Tanaka, K. Study of Drag Force to Falling Spheres in Carrier Materials (Mixture of Viscous Fluid and Fine Particles) for Ore Lifting Technology and Interpretation of Rheological Constants. J. JSCE Ser. B3 2020, 76, I_881–I_886. [Google Scholar] [CrossRef] [PubMed]
Figure 1. Schematic illustration of the viscometers used in this study.
Jmse 12 01448 g001
Figure 2. Results of the viscosity experiments.
Jmse 12 01448 g002
Figure 3. Comparison of HBP model and P model (CMC 0.75%).
Jmse 12 01448 g003
Figure 4. Relation of K and n with CMC concentrations (HBP model).
Jmse 12 01448 g004
Figure 5. Schematic illustration of experimental equipment.
Jmse 12 01448 g005
Figure 6. An example of velocity and pressure (CMC 0.5%, 1.0 m/s).
Jmse 12 01448 g006
Figure 7. Average flow velocity in one pulsation’s period ( v M ) for each experiment.
Jmse 12 01448 g007
Figure 8. Reynolds number ( R e ) for each experiment.
Jmse 12 01448 g008
Figure 9. Positive flow velocity duration ratio in one period ( t P T ) for each experiment.
Jmse 12 01448 g009
Figure 10. Velocity amplitude ratio ( v M A X v M ) for each experiment.
Jmse 12 01448 g010
Figure 11. Relation between R e and C D .
Jmse 12 01448 g011
Figure 12. Drag ( F ) for each experiment with A30.
Jmse 12 01448 g012
Figure 13. Sedimentation rate.
Jmse 12 01448 g013
Table 1. Density of the working fluids used in this study.
Working FluidDensity [kg/m3]
Water999.9
CMC 0.5%1031
CMC 0.75%1007
CMC 1.0%1015
CMC 1.2%1090
Table 2. Specifications of ores.
OreDiameter [mm]Mass [g]Density [kg/m3]
Aluminum small (A10)101.472800
Aluminum medium (A20)2011.72800
Aluminum large (A30)3039.72810
Manganese Nodules307.072000
Table 3. Experimental conditions.
TitleContents
Working fluidWater, CMC 0.5%, CMC 0.75%, CMC 1.0%, CMC 1.2%
Velocity [m/s]0.5, 1.0, 1.5
OreA10, A20, A30
Height [m]5.0
Table 4. Results of lifting ores.
No.V [m/s]OreWorking Fluid
WaterCMC 0.5%CMC 1.0%CMC 1.2%
10.5A10-
2A20-
3A30-
41.0A10
5A20-
6A30-
71.5A10
8A20-
9A30-
Disclaimer/Publisher’s Note: The statements, opinions and data contained in all publications are solely those of the individual author(s) and contributor(s) and not of MDPI and/or the editor(s). MDPI and/or the editor(s) disclaim responsibility for any injury to people or property resulting from any ideas, methods, instructions or products referred to in the content.

