Article

Discrete Element Study on Mechanical Properties of MICP-Treated Sand under Triaxial Compression

1
College of Civil Engineering, Tongji University, Shanghai 200092, China
2
School of Medicine, Tongji University, Shanghai 200092, China
3
Guangxi Pinglu Canal Construction Co., Ltd., Nanning 535000, China
*
Authors to whom correspondence should be addressed.
J. Mar. Sci. Eng. 2024, 12(9), 1503; https://doi.org/10.3390/jmse12091503
Submission received: 18 July 2024 / Revised: 26 August 2024 / Accepted: 28 August 2024 / Published: 1 September 2024
(This article belongs to the Section Ocean Engineering)

Abstract

:
Microbial-induced calcium carbonate precipitation (MICP) has attracted much attention as a promising technology for soil improvement in the infrastructures of marine engineering. This paper introduces a novel numerical sample preparation technique for MICP-treated sand, with particular attention paid to the distribution patterns of calcium carbonate, including contact cementing, bridging, and grain coating. The effect of calcium carbonate content (CCC) on the deformation and failure mechanism is studied at macroscopic and granular scales. The findings show that a small amount of calcium carbonate can quickly increase the strength of sand. The strength improvement and deformation control of MICP technology are better than those of traditional compaction treatment. As the calcium carbonate content increases, the mechanical coordination number of the sand also increases, indicating a more stable microstructure of the sand phase. In the contact bonding mode, initial failure occurs as shear failure between sand and calcium carbonate. In the bridge mode, initial failure manifests as shear failure between calcium carbonate particles. In the coating mode, initial failure occurs as tensile failure between sand and calcium carbonate. Calcium carbonate contributes to a reduction in both sliding and rolling movements among sand particles.

1. Introduction

Microbial-induced calcium carbonate precipitation (MICP) technology is an innovative technique leveraging microbial mineralization processes to enhance properties of soil in marine engineering infrastructure [1,2,3]. This method uses naturally occurring bacteria that, in the presence of urea and calcium sources, produce urease. This enzyme hydrolyzes urea, leading to the generation of carbonate ions that subsequently combine with the available calcium ions. The result is the formation of calcium carbonate precipitation [4,5,6]. Such biologically induced mineralization significantly improves soil properties, increasing strength and stiffness and reducing permeability [7,8,9]. MICP technology stands out from traditional soil stabilization methods such as chemical grouting and mechanical compaction. Unlike these methods, MICP technology is environmentally benign, utilizing naturally occurring microbes and nontoxic reactants. This makes MICP technology a sustainable option that minimizes ecological disruption and avoids the introduction of harmful chemicals into the environment [10,11,12]. The application potential of MICP technology is vast and varied. For instance, in marine engineering applications, such as the laying of submarine pipelines or the construction of artificial islands, MICP-treated soil can significantly enhance the stability and safety of projects. Li et al. [13] applied MICP technology to the scour protection around monopiles for wind turbines. The results indicated that MICP treatment could significantly enhance the scour resistance of the seabed, reducing the scour depth and sediment transport rate. Wang et al. [14] conducted a series of solidification experiments using MICP in both natural seawater and freshwater environments. The curing effect in freshwater environments was superior to that in seawater, with the shear strength of biologically solidified samples in seawater reaching 1.4 MPa. Wang et al. [15] employed the gradient domestication method in their further research, enabling bacteria to gradually adapt to the seawater environment, effectively improving the curing effect of calcareous sand in seawater. Li et al. [16] experimentally investigated the shear behavior of the limestone sand–steel interface treated with MICP, discovering that microbial reinforcement had a notable effect on enhancing the cohesion of the calcareous sand and steel interfaces. Nevertheless, despite abundant practical applications and a solid scientific foundation, understanding the detailed micromechanical behavior of MICP technology to improve soil properties still remains a challenge.
MICP-treated sand is a complex multiphase granular medium, the essence of whose macroscopic mechanical behavior is rooted in the interactions between particles and changes in microstructure. While traditional experimental methods offer preliminary insights into the behavior of such materials, they frequently fall short in capturing intricate details at the microscopic level, such as the contact forces between particles and the bond cracking processes [17]. To address these limitations, discrete element numerical simulation serves as an invaluable tool. It not only simulates the macroscopic mechanical behavior of materials but also crucially elucidates the micromechanical mechanisms underlying these behaviors [18,19]. DEM can simulate the continuous nonlinear stress–strain relationships of microscopic media under different loading conditions and can visualize and analyze the dynamic process of crack formation and propagation and interaction on a microscopic scale [20].
In recent years, many scholars have used DEM to study the mechanical properties of MICP-treated sand. Feng et al. [21] explored fracture patterns of cemented bonds in numerical samples of MICP-treated sand and evaluated the relationship between dilatancy and stress–strain behavior. Khoubani et al. [22] proposed a new cementation model in which two particles are joined by a ring of several smaller calcium carbonate particles that can simulate the progressive failure of cementation contact between two particles. Four typical patterns of biotreated sand distribution have been identified using scanning electron microscopy (SEM): contact cementing, bridging, grain coating, and pore filling [3,23,24]. The key difference between contact bonding and bridging is the relative position between the sand grains. Contact bonding occurs when cement brings together two adjacent sand grains that have already been in contact or are close together, while bridging forms a carbonate bridge between two adjacent grains that are far apart.
Zhang et al. [25] have idealized these distribution patterns by the DEM numerical model and explored the influence of each distribution mode on the mechanical properties of MICP-treated sand. However, there is no single distribution pattern of MICP-treated sand but often a combination of multiple distribution patterns. Wu et al. [26] used the method of filling soil pores with calcium carbonate crystals and applying a random driving force to move the calcium carbonate crystals to simulate the biological cementation process, which can simulate the precipitation mode of coexisting calcium carbonate crystals, so as to better simulate the stable microstructure of MICP-treated sand. At present, although there have been many experimental studies on the mechanical properties of MICP-treated sand, there is a lack of research on the mechanical properties of MICP-treated sand with coexisting calcium carbonate precipitation under triaxial compression tests from both macro- and microperspectives using the three-dimensional discrete element method. It is particularly necessary to reveal the internal mechanisms underlying these macroscopic mechanical phenomena.
In this paper, a numerical sample preparation technique for MICP-treated sand with a coexisting calcium carbonate precipitation mode (including contact cementing, bridging, grain coating, and pore filling) was employed. A series of DEM numerical simulations on MICP-treated sand with varying calcium carbonate contents were carried out, and the results were compared with those of laboratory triaxial tests. The effects of various precipitation modes of calcium carbonate on the formation of microcracks were investigated. A particular focus was on how the content of calcium carbonate influences microstructure characteristics, such as the coordination number, the sliding contact fraction, and the rolling contact fraction. The microscopic deformation mechanism of MICP-treated sand with coexisting calcium carbonate precipitation modes was investigated at the particle scale.

2. DEM Model

2.1. Contact Model for DEM Simulations

In the discrete element method, the contact model is a physical criterion that describes the interaction between particles and determines the macroscopic and microscopic mechanical properties of the entire granular medium. According to the properties of adjacent units, MICP-treated sand samples are divided into three contact types: sand–sand, sand–calcium carbonate, and calcium carbonate–calcium carbonate. These three contact types require the selection of a suitable contact model to describe the interaction between the elements. In order to better simulate the influence of the shape characteristics of sand particles on a sample, a rolling resistance linear contact model was set up with sand–sand. In addition, calcium carbonate particles have a bonding effect on surrounding sand particles and calcium carbonate particles, so a linear parallel bond model was added between the sand and calcium carbonate, as well as between calcium carbonate particles, to achieve the bonding effect of the calcium carbonate.

2.2. Numerical Specimen Preparation of MICP-Treated Sand

The skeleton of MICP-treated sand is composed of two solid components: sand and calcium carbonate. In this study, spherical particle units were used to simulate these two materials. The location of deposition of calcium carbonate crystals directly shapes the morphology of MICP-treated sand, consequently affecting its mechanical behavior indirectly. Figure 1 presents a CT image of MICP-treated sand, where the black areas represent the pores, the blocky shapes represent the sand with the gray value, and the middle gray value represents calcium carbonate. Figure 1 clarifies that calcium carbonate crystals can be categorized into different types based upon their deposition locations, including contact cementing, bridging, grain coating, and pore filling.
The specific steps for creating a discrete element model of MICP-treated sand with coexisting calcium carbonate precipitation patterns are shown in Figure 2 and are as follows:
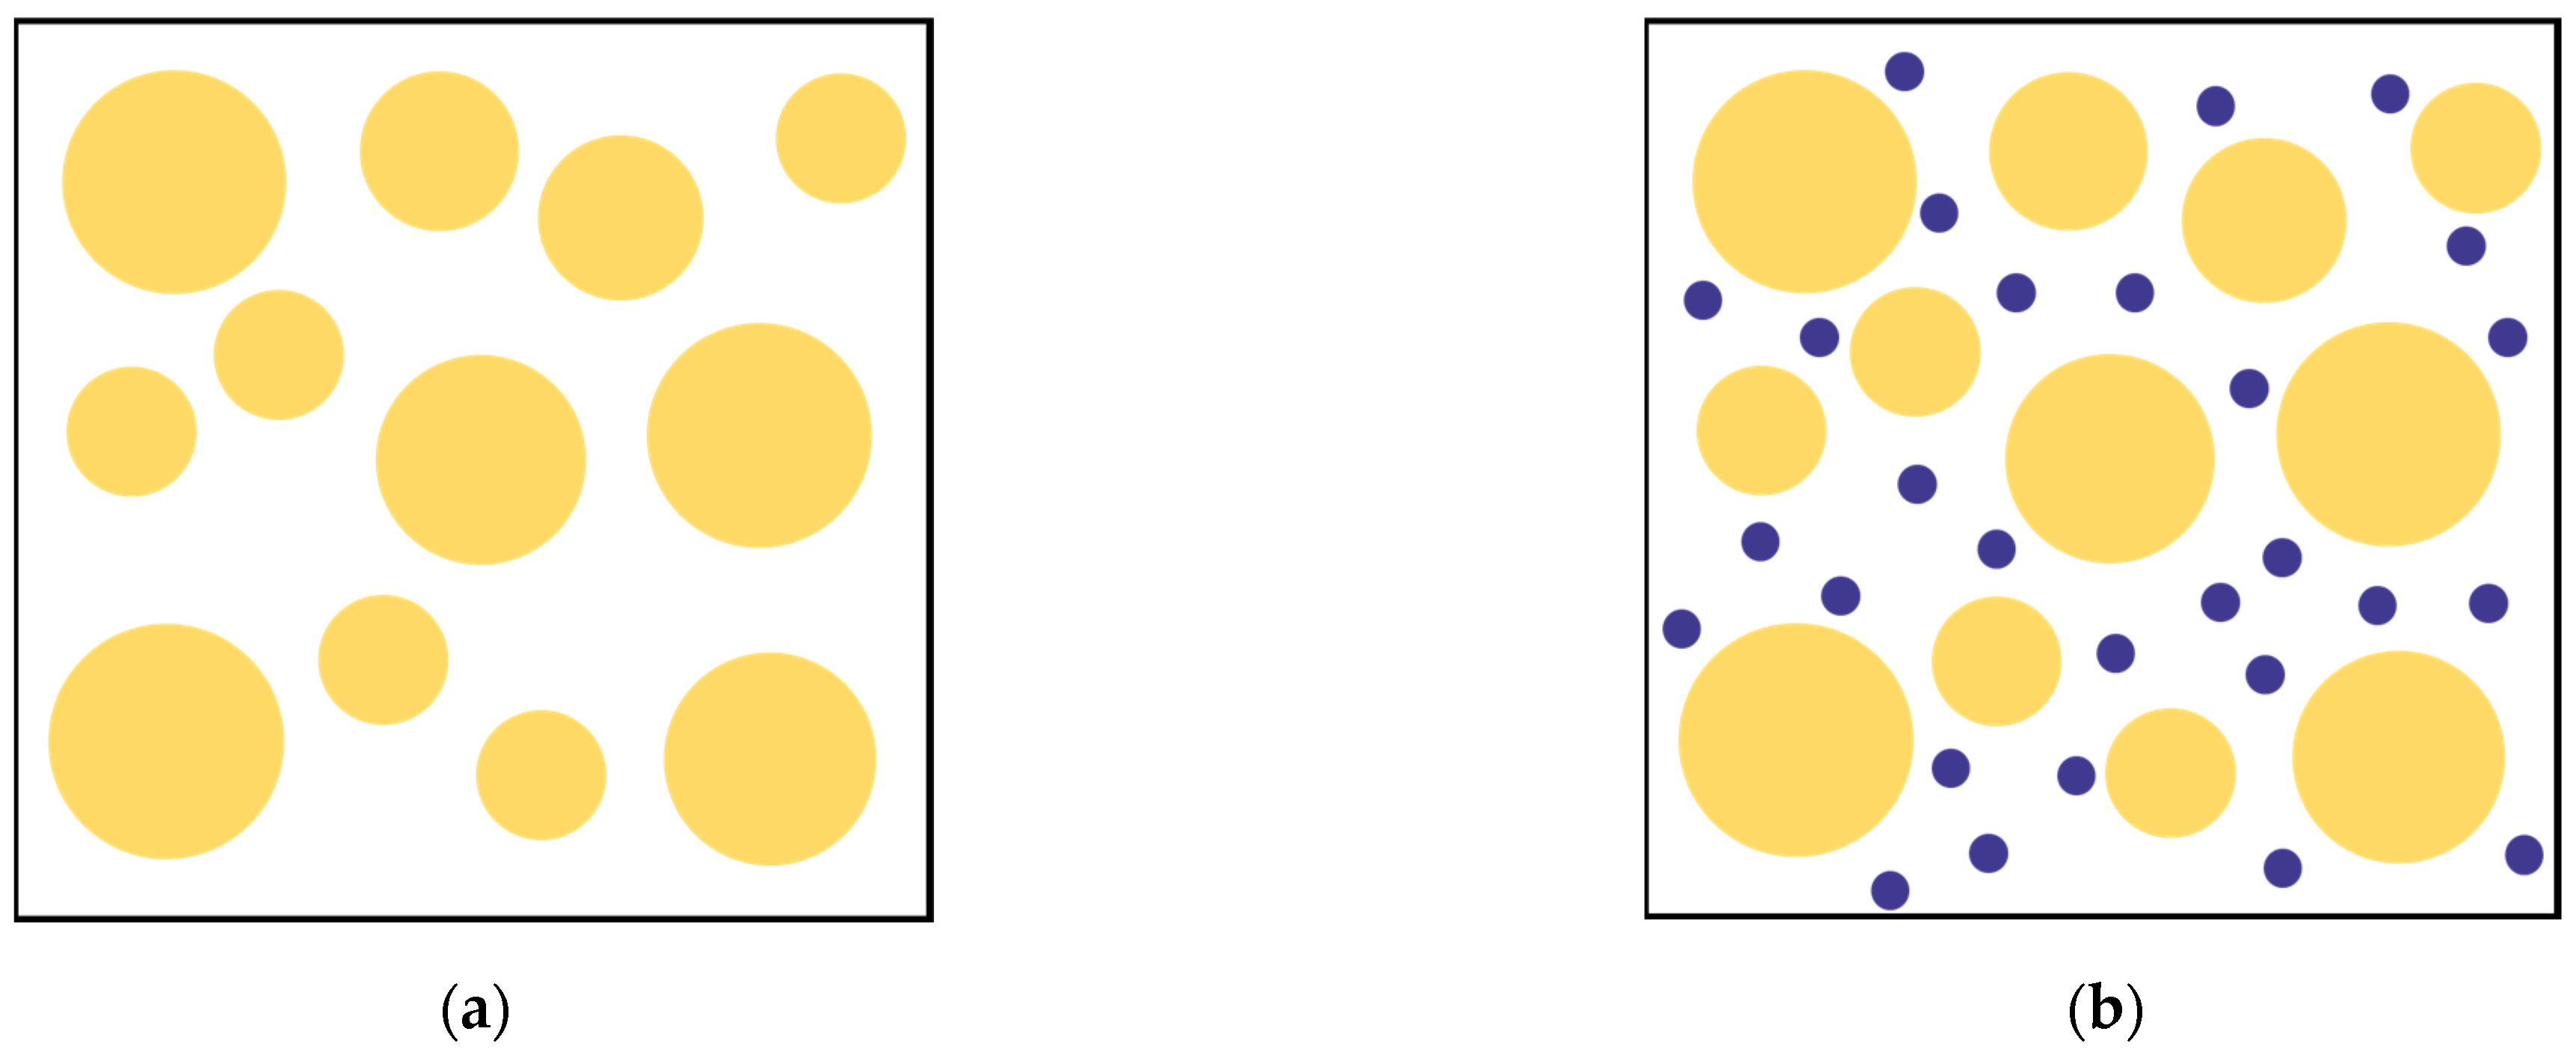
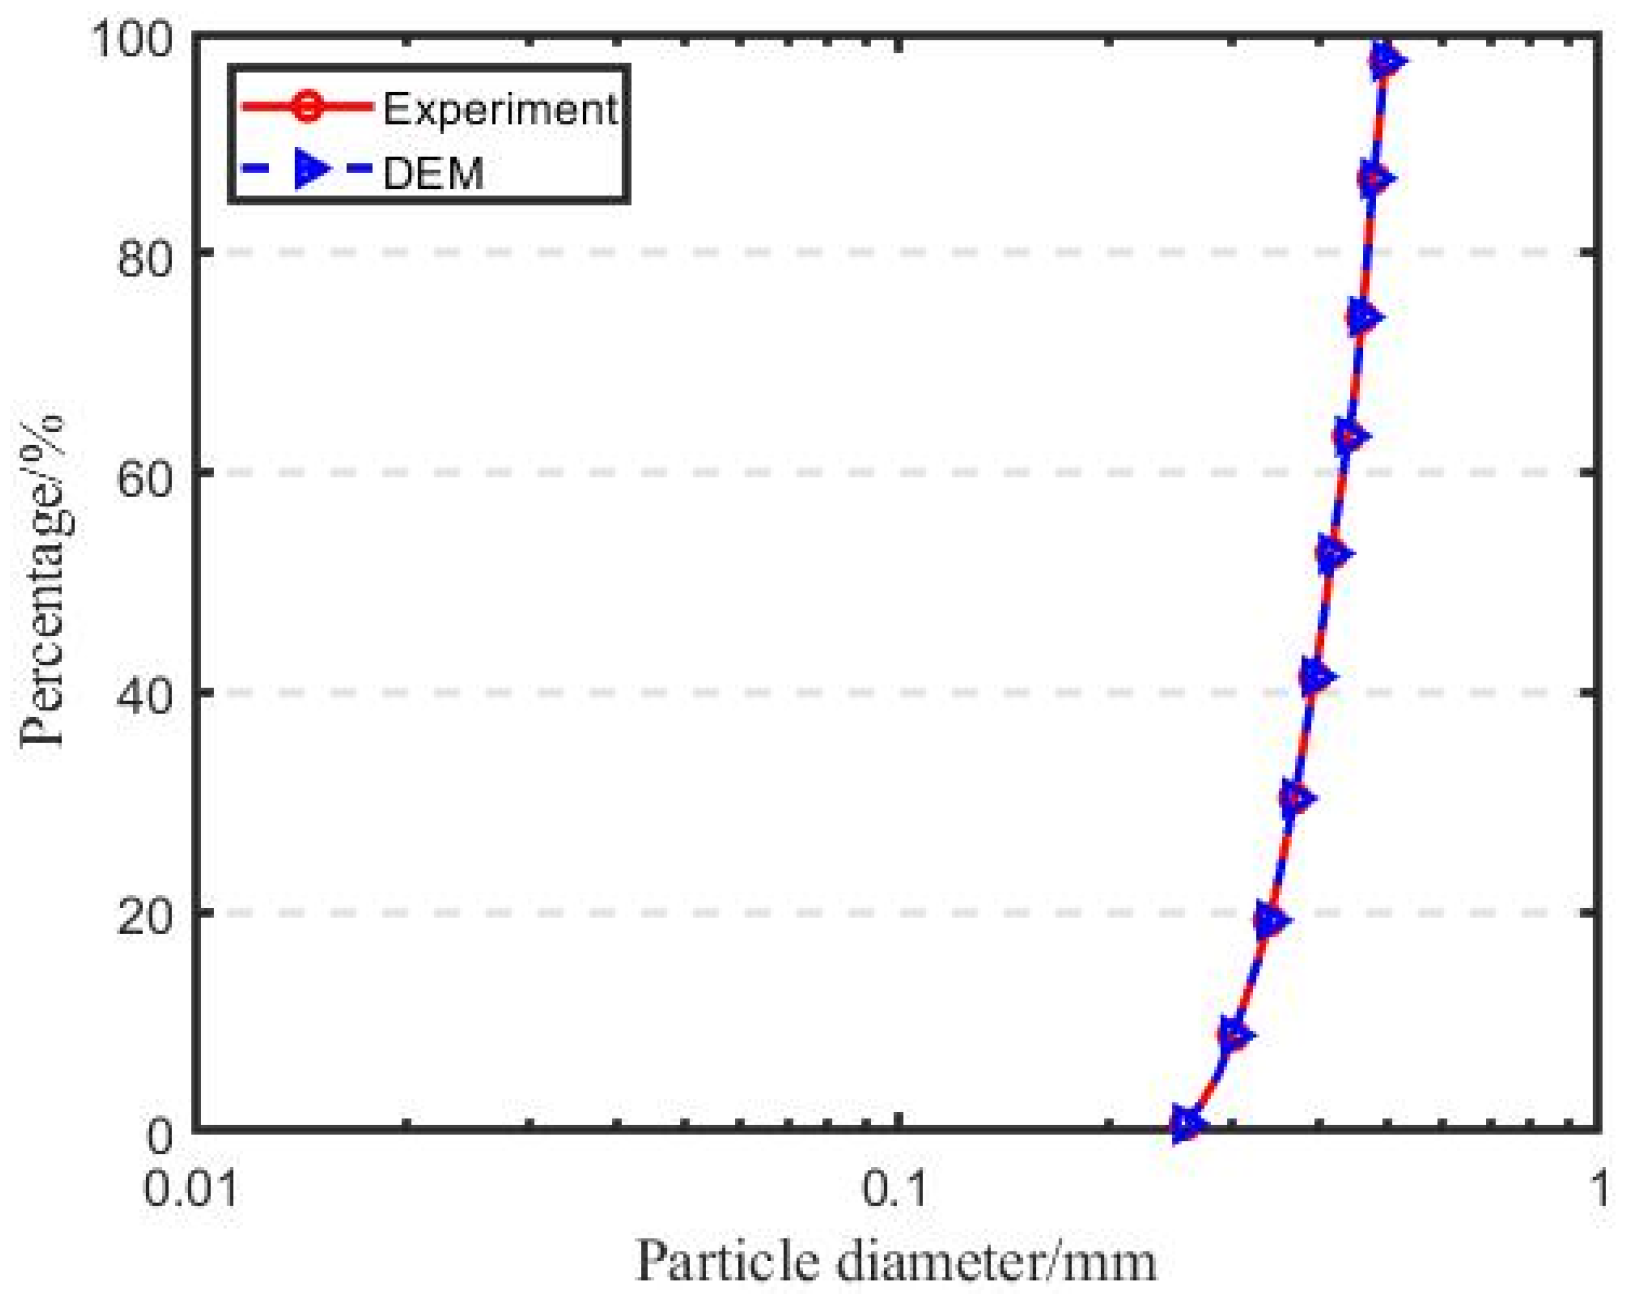
  • Sand sample preparation involves generating 7007 nonoverlapping particles, representing sand particles, with half diameter using gradation within the space enclosed by rigid walls, and then expanding to the desired size to simulate the sand’s particle size distribution curve, as shown in Figure 3. All contacts between the sand particles are assigned to the rolling resistance linear contact model. During this phase, the friction coefficient (μ) and the rolling resistance coefficient (μr) are both set to zero. Subsequently, the sand particles are subjected to compression until reaching an isotropic stress state of 10 kPa is reached. The porosity (e) is correlated with the values of μ and μr, and adjustments to these coefficients are made to attain the corresponding relative density [27].
  • Calcium carbonate particles are generated while the fixed wall remains stationary. The target diameter of the calcium carbonate particles is set at one-eighth of the median particle size of the sand. It should be noted that the number of calcium carbonate particles is determined by the calcium carbonate content measured in the laboratory pickling test, and the specific calculation formula is detailed as follows.
N = 3 M s a n d × C C C 4 π r 3 ρ c a c o 3 ,
where N is the quantity of calcium carbonate, Msand is the quality of sand, CCC is the content of calcium carbonate obtained by the pickling test (see reference [28] for specific test methods), r is the radius of the calcium carbonate particles, and ρ c a c o 3 is the density of calcium carbonate.
3.
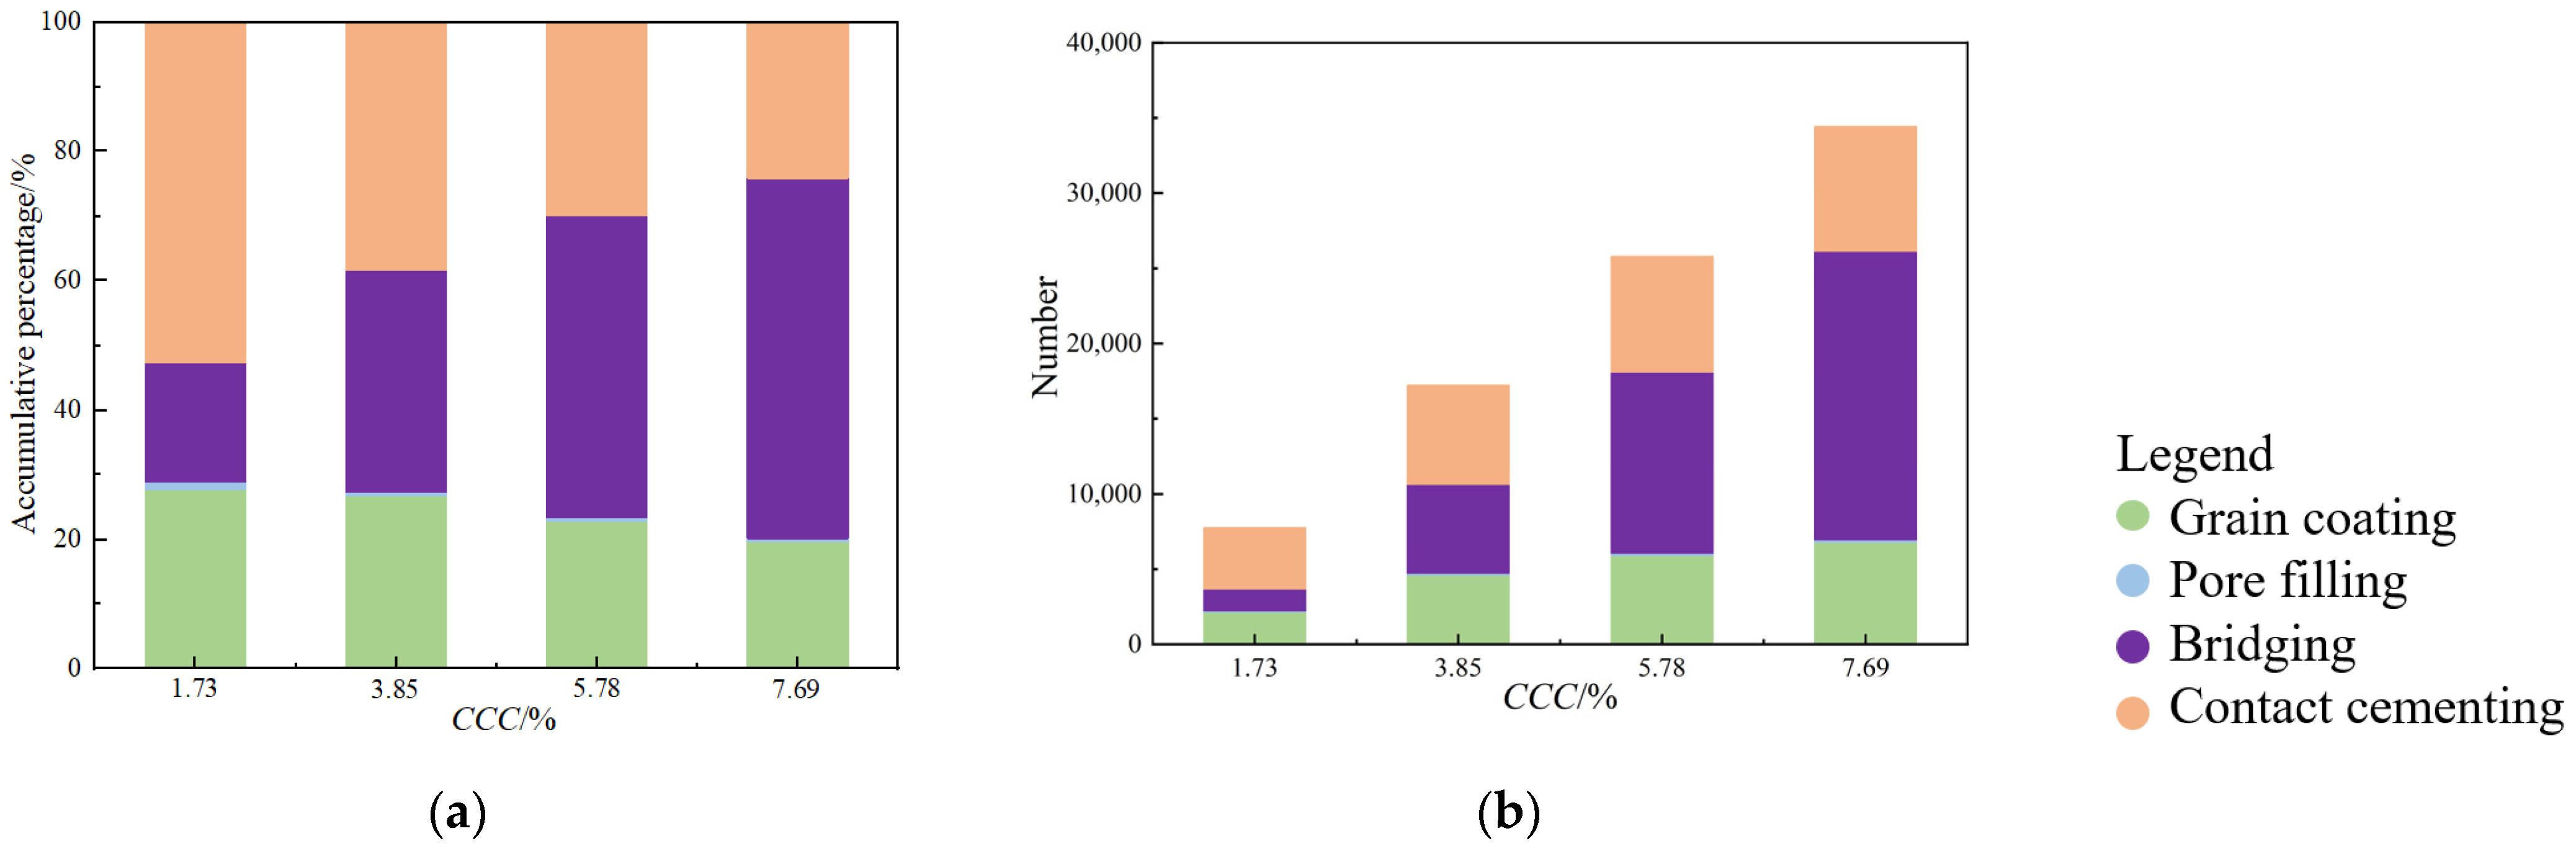
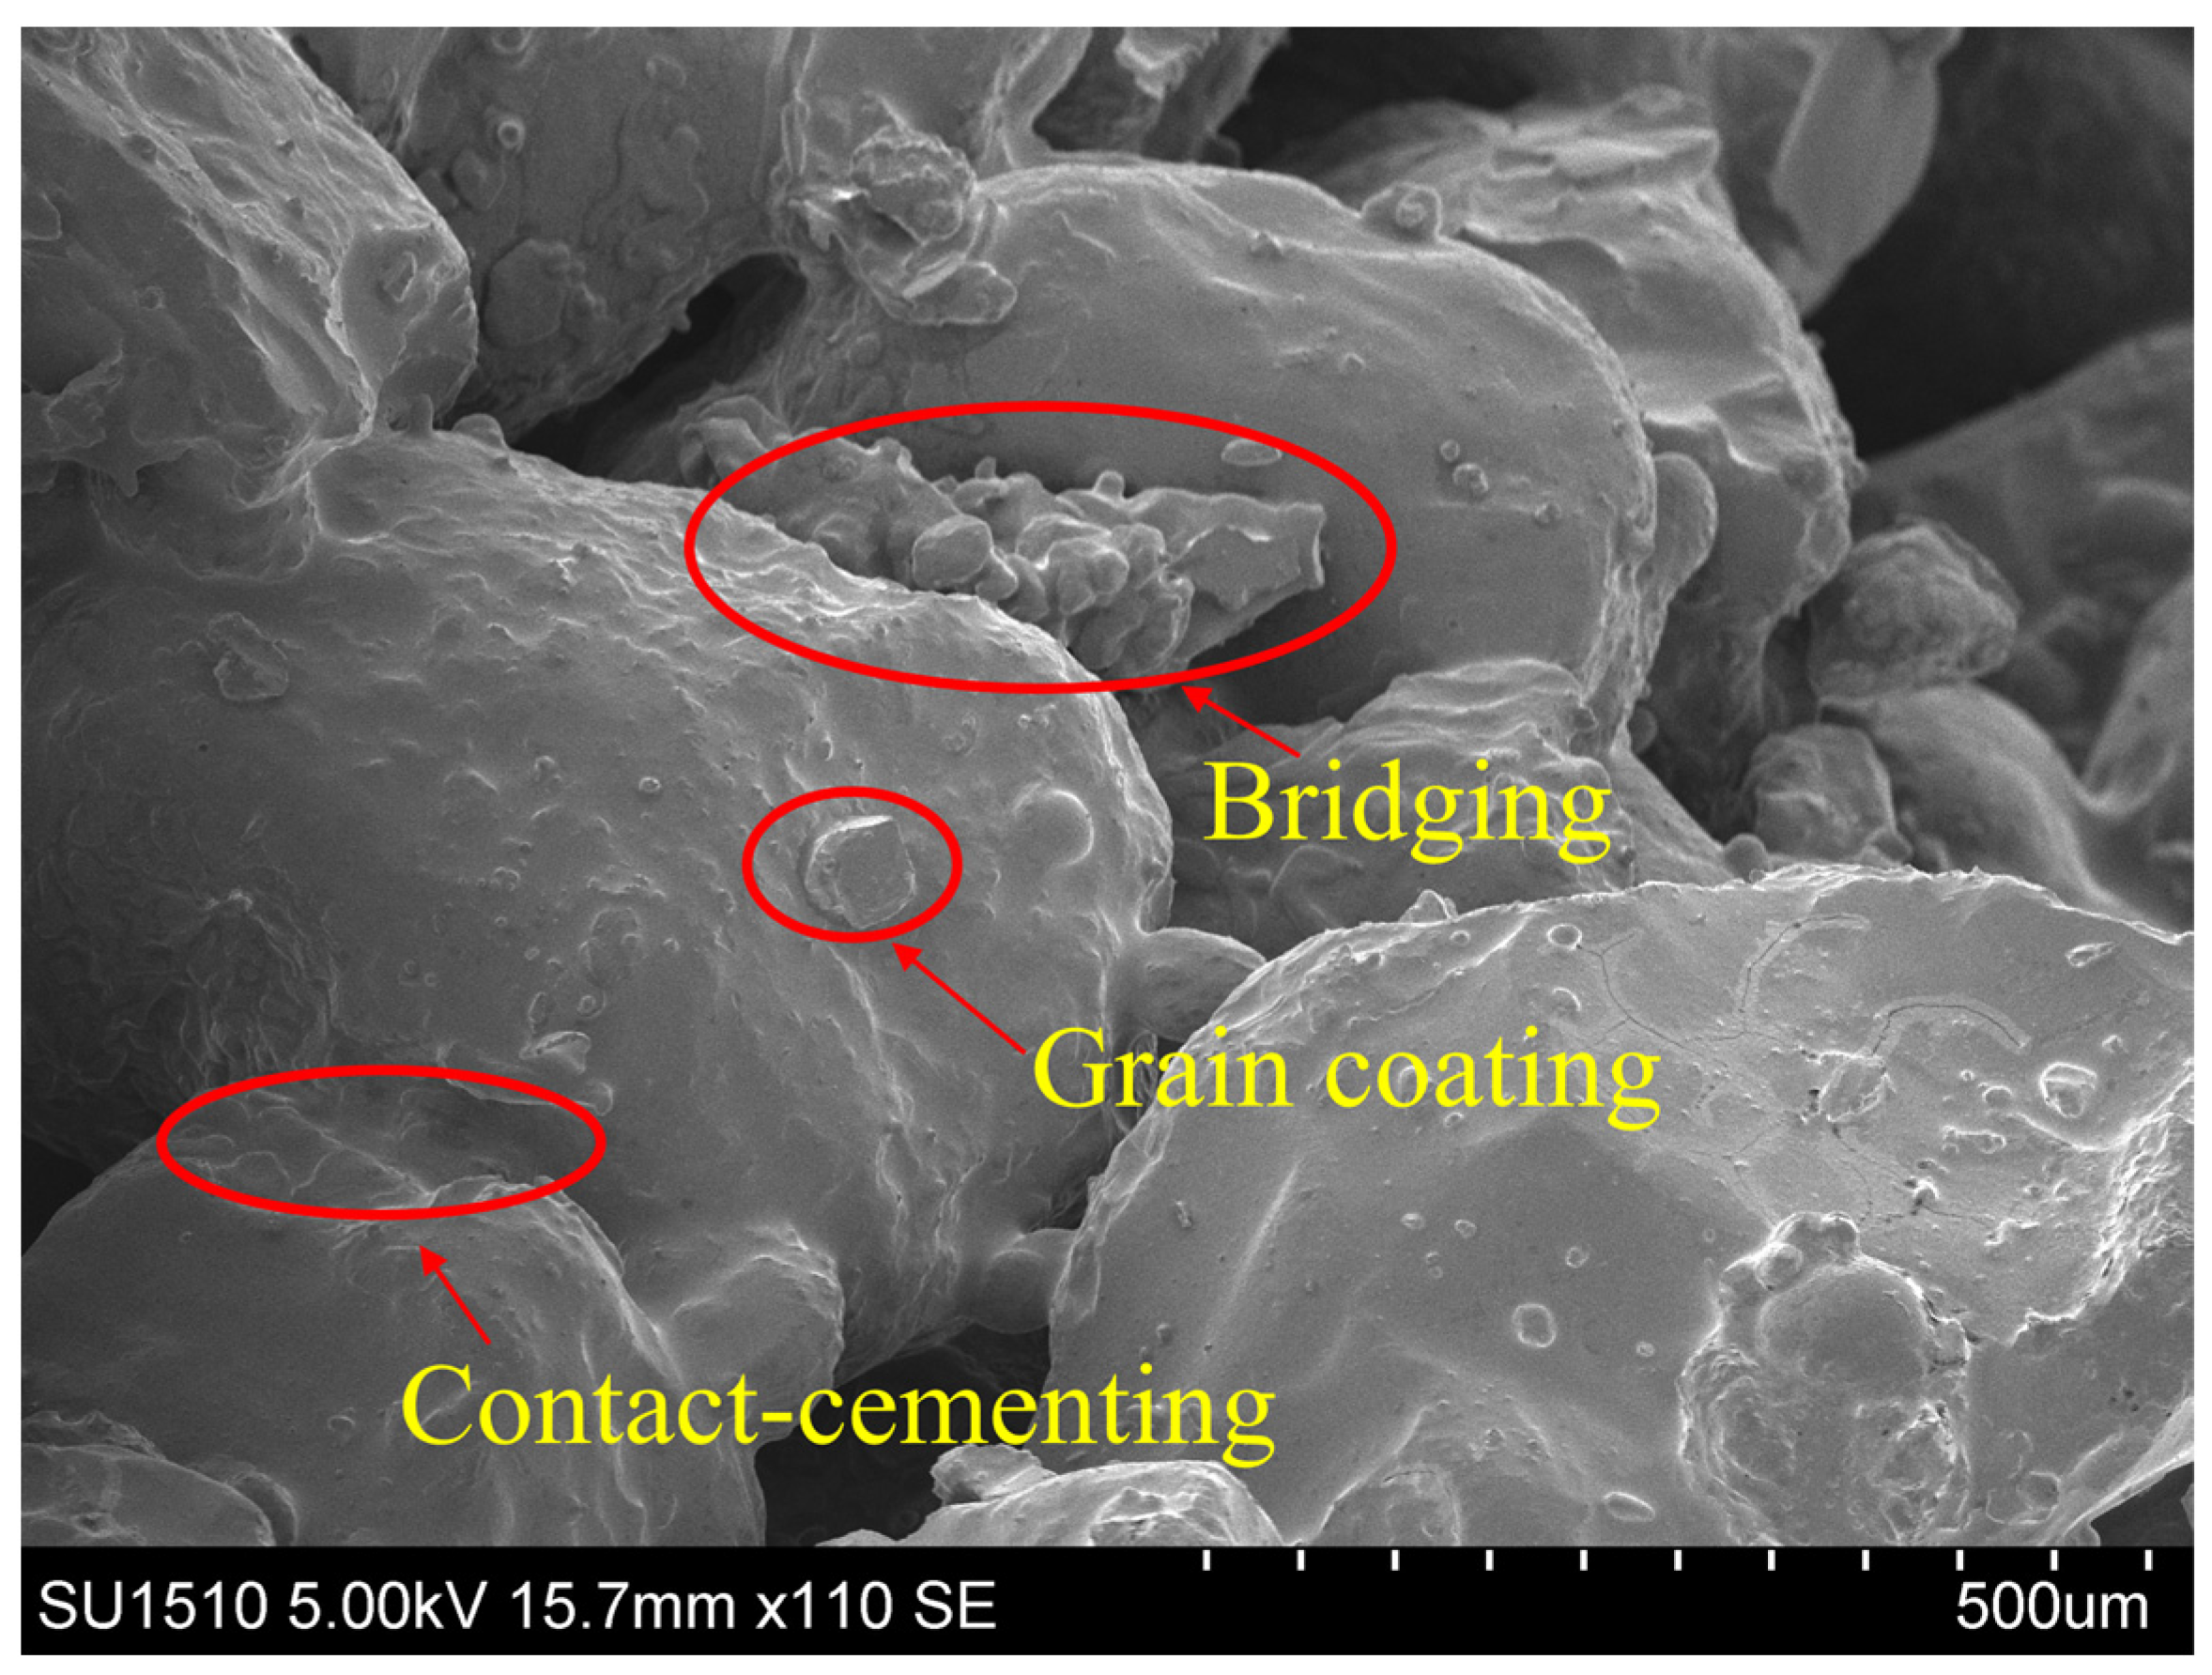
A driving force, denoted as F, is applied in a random direction to all calcium carbonate particles. The cohesion at particle contact and the normal and shear forces between the particles are utilized to counterbalance this driving force. Figure 2f reveals that, based on the relative positions of small and large particles, calcium carbonate can be categorized into four precipitation modes: contact cementing, bridging, grain coating, and pore filling. This demonstrates that the numerical sample preparation method for MICP-treated sand, as presented in this study, is capable of reflecting the microstructure of physical samples.

2.3. Triaxial Compression Test

DEM simulation follows the standard procedure of a triaxial compression test, which consists of two stages: consolidation and shear. During isotropic consolidation, a 100 kPa confining pressure is applied. Once the desired confining pressure is attained, the top of the sample is lowered at a constant strain rate of 0.5% while keeping the confining pressure constant, and the sample undergoes shear. The simulation details of MICP-treated sand are provided in Table 1.

2.4. Contact Model Parameter

For calibration, numerical simulations of sand samples with different relative densities and MICP-treated sand samples with different calcium carbonate contents were compared with the stress–strain–volume change responses measured in physical experiments, and the parameters were adjusted repeatedly to match the macroscopic responses. Table 2 presents the parameters used in the DEM simulations.

3. Results and Discussion
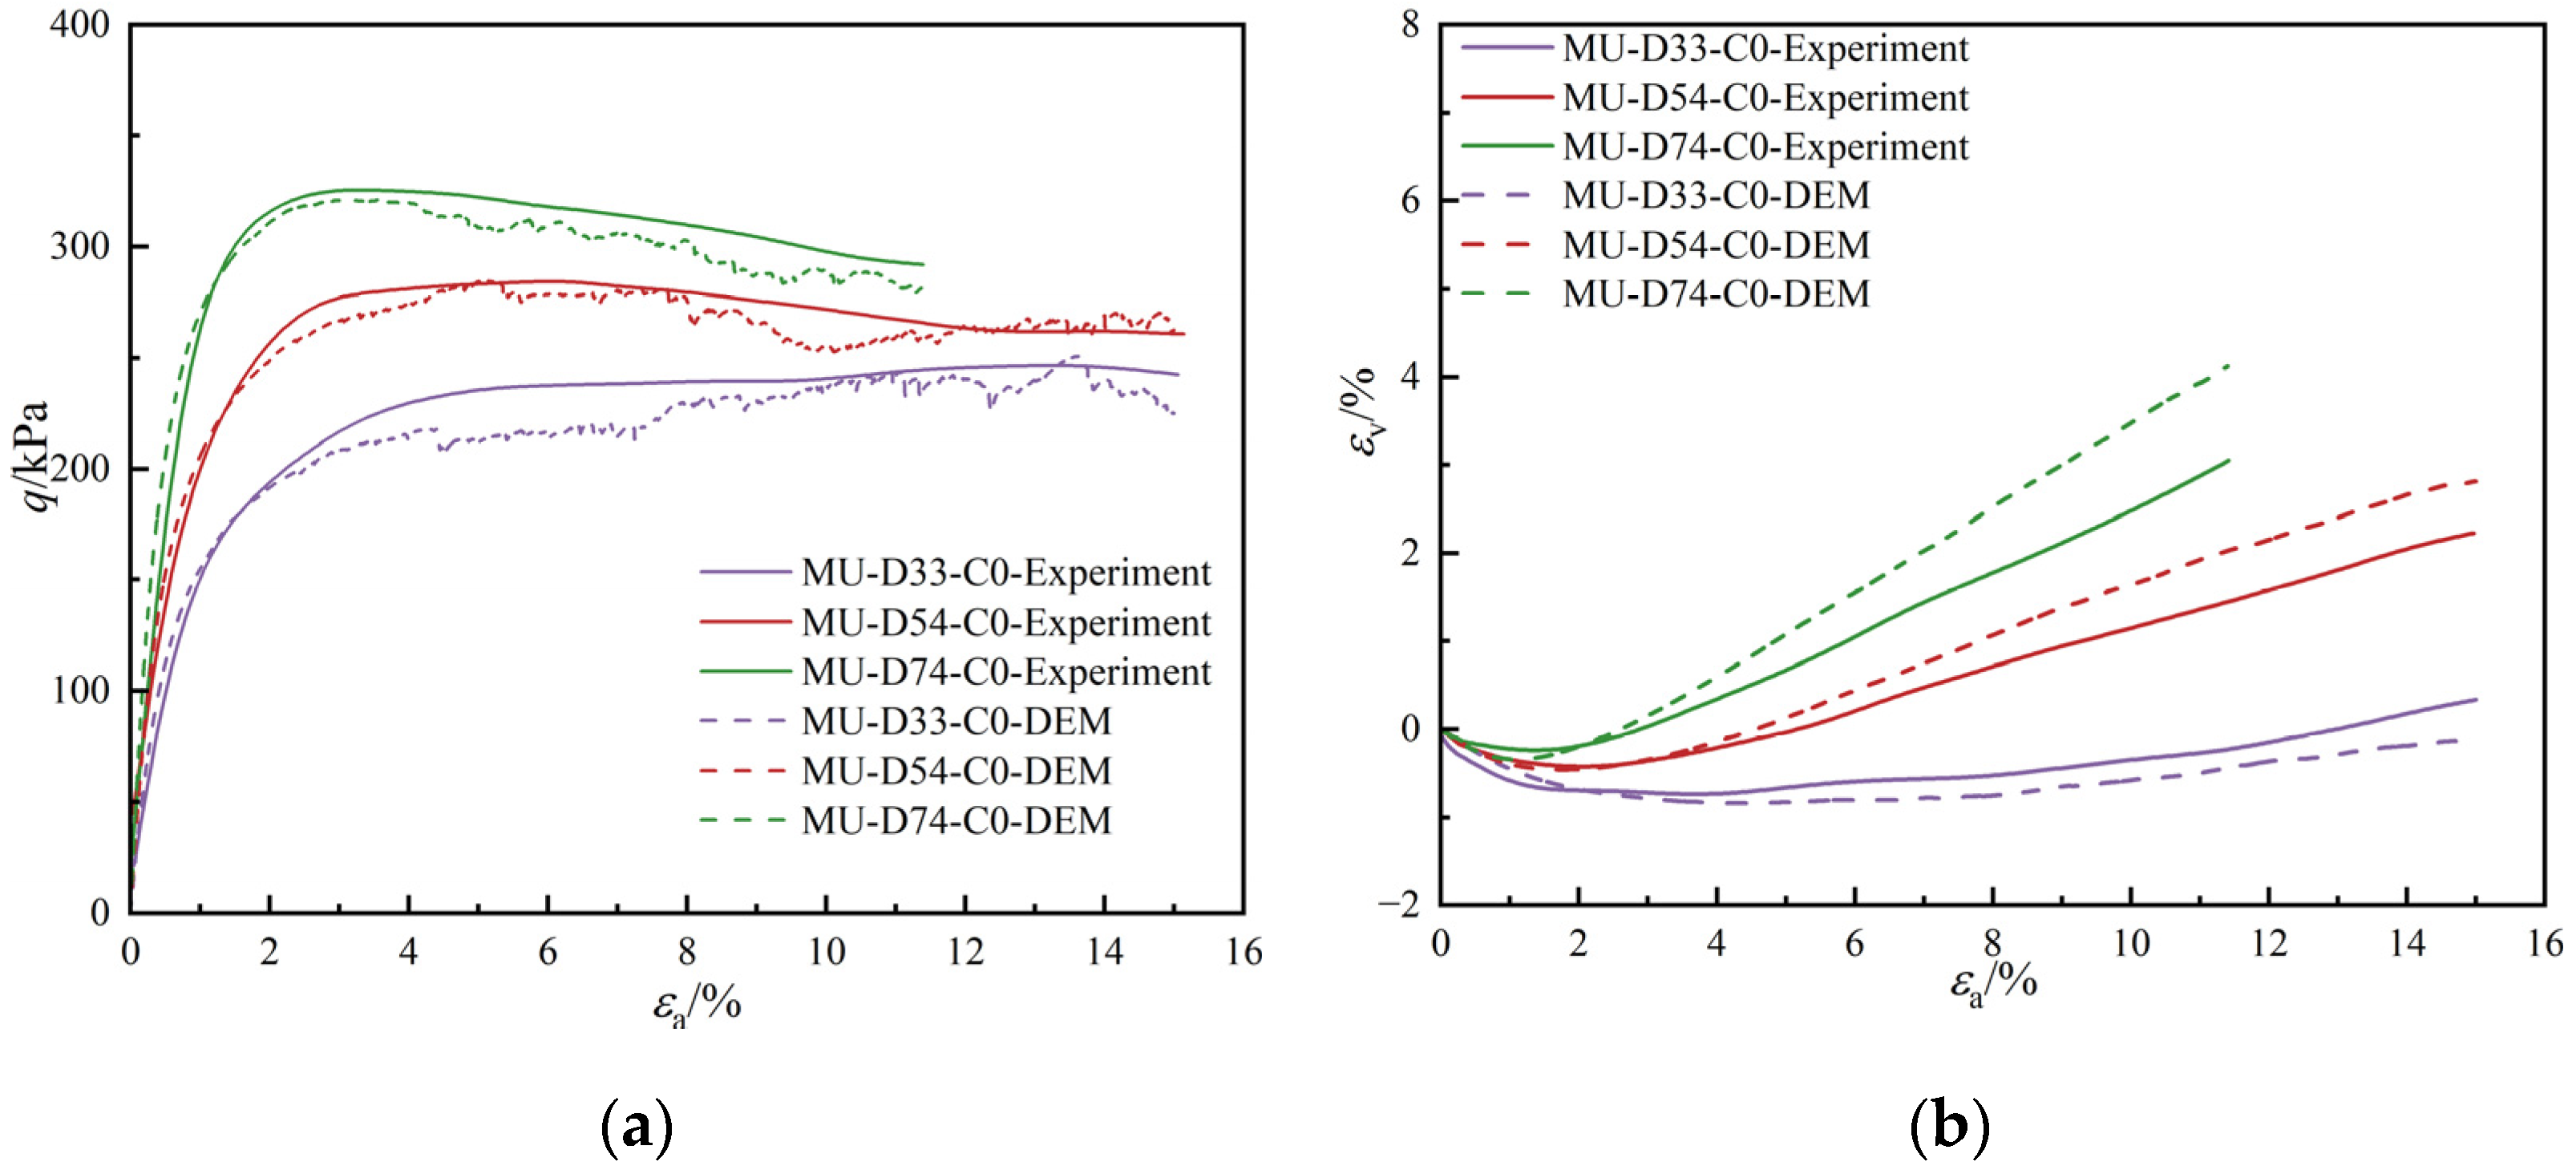
3.1. Macroresponse

To ensure the accuracy of the numerical model, representative experimental results were selected for calibration of the model. Figure 4 presents a detailed comparison between the numerical simulations and the test results pertaining to the stress–strain characteristics (Figure 4a) and volume deformation (Figure 4b). As the relative density increases, there is a progressive shift in the stress–strain curve from strain hardening to strain softening. This is accompanied by a transition in the volumetric strain curve from shear contraction to dilatancy. Furthermore, a denser initial soil state corresponds to a higher peak strength and a larger final volume strain. Figure 5 offers a comparative analysis of the stress–strain behaviors (Figure 5a) and volume deformation (Figure 5b) between the numerical simulations and the experimental results for MICP-treated sand samples with different calcium carbonate contents. An increase in the content of calcium carbonate contributes to an enhancement in the peak stress and residual stress of sand. Figure 4 and Figure 5 reveal that the numerical model offers a generally accurate simulation of the mechanical strength response. However, it is prone to overestimating the volume deformation and underestimating the residual strength. This could be attributed to the implementation of rigid boundary conditions in the numerical model, which often results in elevated estimations of volume deformation in DEM simulations.
It has been noted that when the relative density of untreated sand reaches 90%, the density requirements for most applications are met [24]. This is attributed to the fact that enhancing the relative density densifies sand structure, subsequently increasing soil strength. This notion is crucial in practical engineering applications where, using conventional compaction techniques, filled sand is often compacted to meet a predetermined density level. As shown in Figure 4 and Figure 5, the peak stress of MT-D33-C1.73, which measured 424.88 kPa, is marginally greater than the peak stress of MU-D90-C0, recorded at 390.25 kPa. This indicates that in real-world engineering applications, the effect of a small quantity of calcium carbonate surpasses the effect of enhancing relative density via compaction. It should be noted that the influence of relative density on the shear strength of soil is limited, and the maximum strength can only reach one to three times. However, the incorporation of MICP technology results in significant improvements in soil’s mechanical properties. The peak stress of MT-D33-C7.69, registered at 1110.95 kPa, is significantly higher, specifically 4.5 times greater than the peak stress of MU-D33-C0, which was measured at 244.91 kPa. Hence, by utilizing MICP in practical engineering, one can effectively enhance soil stability and effectively optimize its strength.
In the experiment, it was very difficult to prepare a very small amount of calcium carbonate for a triaxial shear test because it cannot form a complete whole that can be removed from the mold. In addition, studies have shown that when MICP technology is used to improve soil strength, especially in large-scale projects, the distribution of calcium carbonate in local areas is not uniform [4]. This may lead to low calcium carbonate contents in some areas, and it is difficult to obtain the mechanical properties of these areas. Numerical simulation provides the possibility that the mechanical properties can be obtained by DEM testing regardless of the calcium carbonate content. Figure 6 shows the stress–strain curves (Figure 6a) and volume change curves (Figure 6b) of untreated sand samples with different relative densities and MICP-treated sand samples with different calcium carbonate contents through DEM. The results show that adding 0.4% calcium carbonate content (MT-D33-C0.4) can achieve the same peak shear strength of MU-D54-C0 and that adding 0.78% calcium carbonate content (MT-D33-C0.78) can achieve the same peak shear strength of MU-D74-C0. It can be clearly observed from Figure 6b that in the volume–strain curve, the final volume strain of untreated sand increases with the increase in relative densities, and the final volume strain of MICP-treated sand increases with the increase in calcium carbonate content. Nevertheless, when the peak shear strength is kept almost identical, the final volume strain achieved through the MICP technology is less than that derived from the compaction method. For instance, the peak stresses of MT-D33-C0.4 and MU-D54-C0 are identical, as are the peak stresses of MT-D33-C1.51 and MU-D90-C0. The final volume strain of MT-D33-C0.4 stands at 1.59%, which is lower than MU-D54-C0’s volume strain of 2.82%. The final volume strain of MT-D33-C1.51 is 3.02% and that of MU-D90-C0 is 8.47%. All the above results indicate that the volume strain of MICP-treated sand is significantly smaller than that of improved relative densities. This implies that in practical engineering situations, the application of MICP technology can significantly enhance soil structure stability and diminish soil volume strain. This proves to be a more effective strategy than just increasing relative density for the sole purpose of enhancing strength.

3.2. Microresponse

DEM serves as a meticulous tool for microscopic observation and analysis, enabling detailed examination of intricate mechanisms, such as the mechanical coordination number, initiation, and propagation of microcracks. The insight into such microscopic mechanisms is crucial, as they directly influence the macroscopic mechanical properties of materials.

3.2.1. Microstructure Characteristics

MICP-treated sand samples with varying levels of calcium carbonate exhibit differences not only in the quantity of calcium carbonate particles but also in the ratios of precipitation modes. In Figure 7, the quantity and proportion of various precipitation modes are displayed for MICP-treated sand samples with different calcium carbonate contents. As the calcium carbonate content increases, the quantity of calcium carbonate particles correspondingly rises. The collective proportion of effective calcium carbonate crystals (bridging and contact cementing) also rises, conversely reducing the sum proportion of noneffective calcium carbonate crystals (grain coating and pore filling). It is worth noting that in this numerical model, the percentage of pore filling is small—less than 1%. The CT image in Figure 1 reveals that calcium carbonate particles within the pore filling do not have any contact with the sand; instead, they float within the pore space. This occurrence is relatively rare and the particles comprise a negligible proportion, thus having a minimal impact on the mechanical properties of the MICP-treated sand. Consequently, this section does not extensively explore the microresponse of pore filling.
Figure 8 is an SEM image of MT-D33-C7.69 showing calcium carbonate positioned between two neighboring sand grains, contributing to bridging and contact cementing, or on the grain surface, acting as a grain coating. The image reveals an inclination of calcium carbonate to reside between two adjacent sand grains instead of on the grain surface, which is consistent with the results of Figure 7a, further proving the accuracy of the MICP-treated sand numerical model. Prior research indicates that effective calcium carbonate crystals, cementing two neighboring sand grains, substantially influence the peak strength and rigidity of MICP-treated sand. In contrast, noneffective calcium carbonate crystals exhibit a minimal effect on peak strength, possibly contributing during the post-peak stage [3,8,26]. The fact that effective calcium carbonate crystals account for a higher proportion explains why even low amounts of calcium carbonate can significantly improve the mechanical properties of sand.

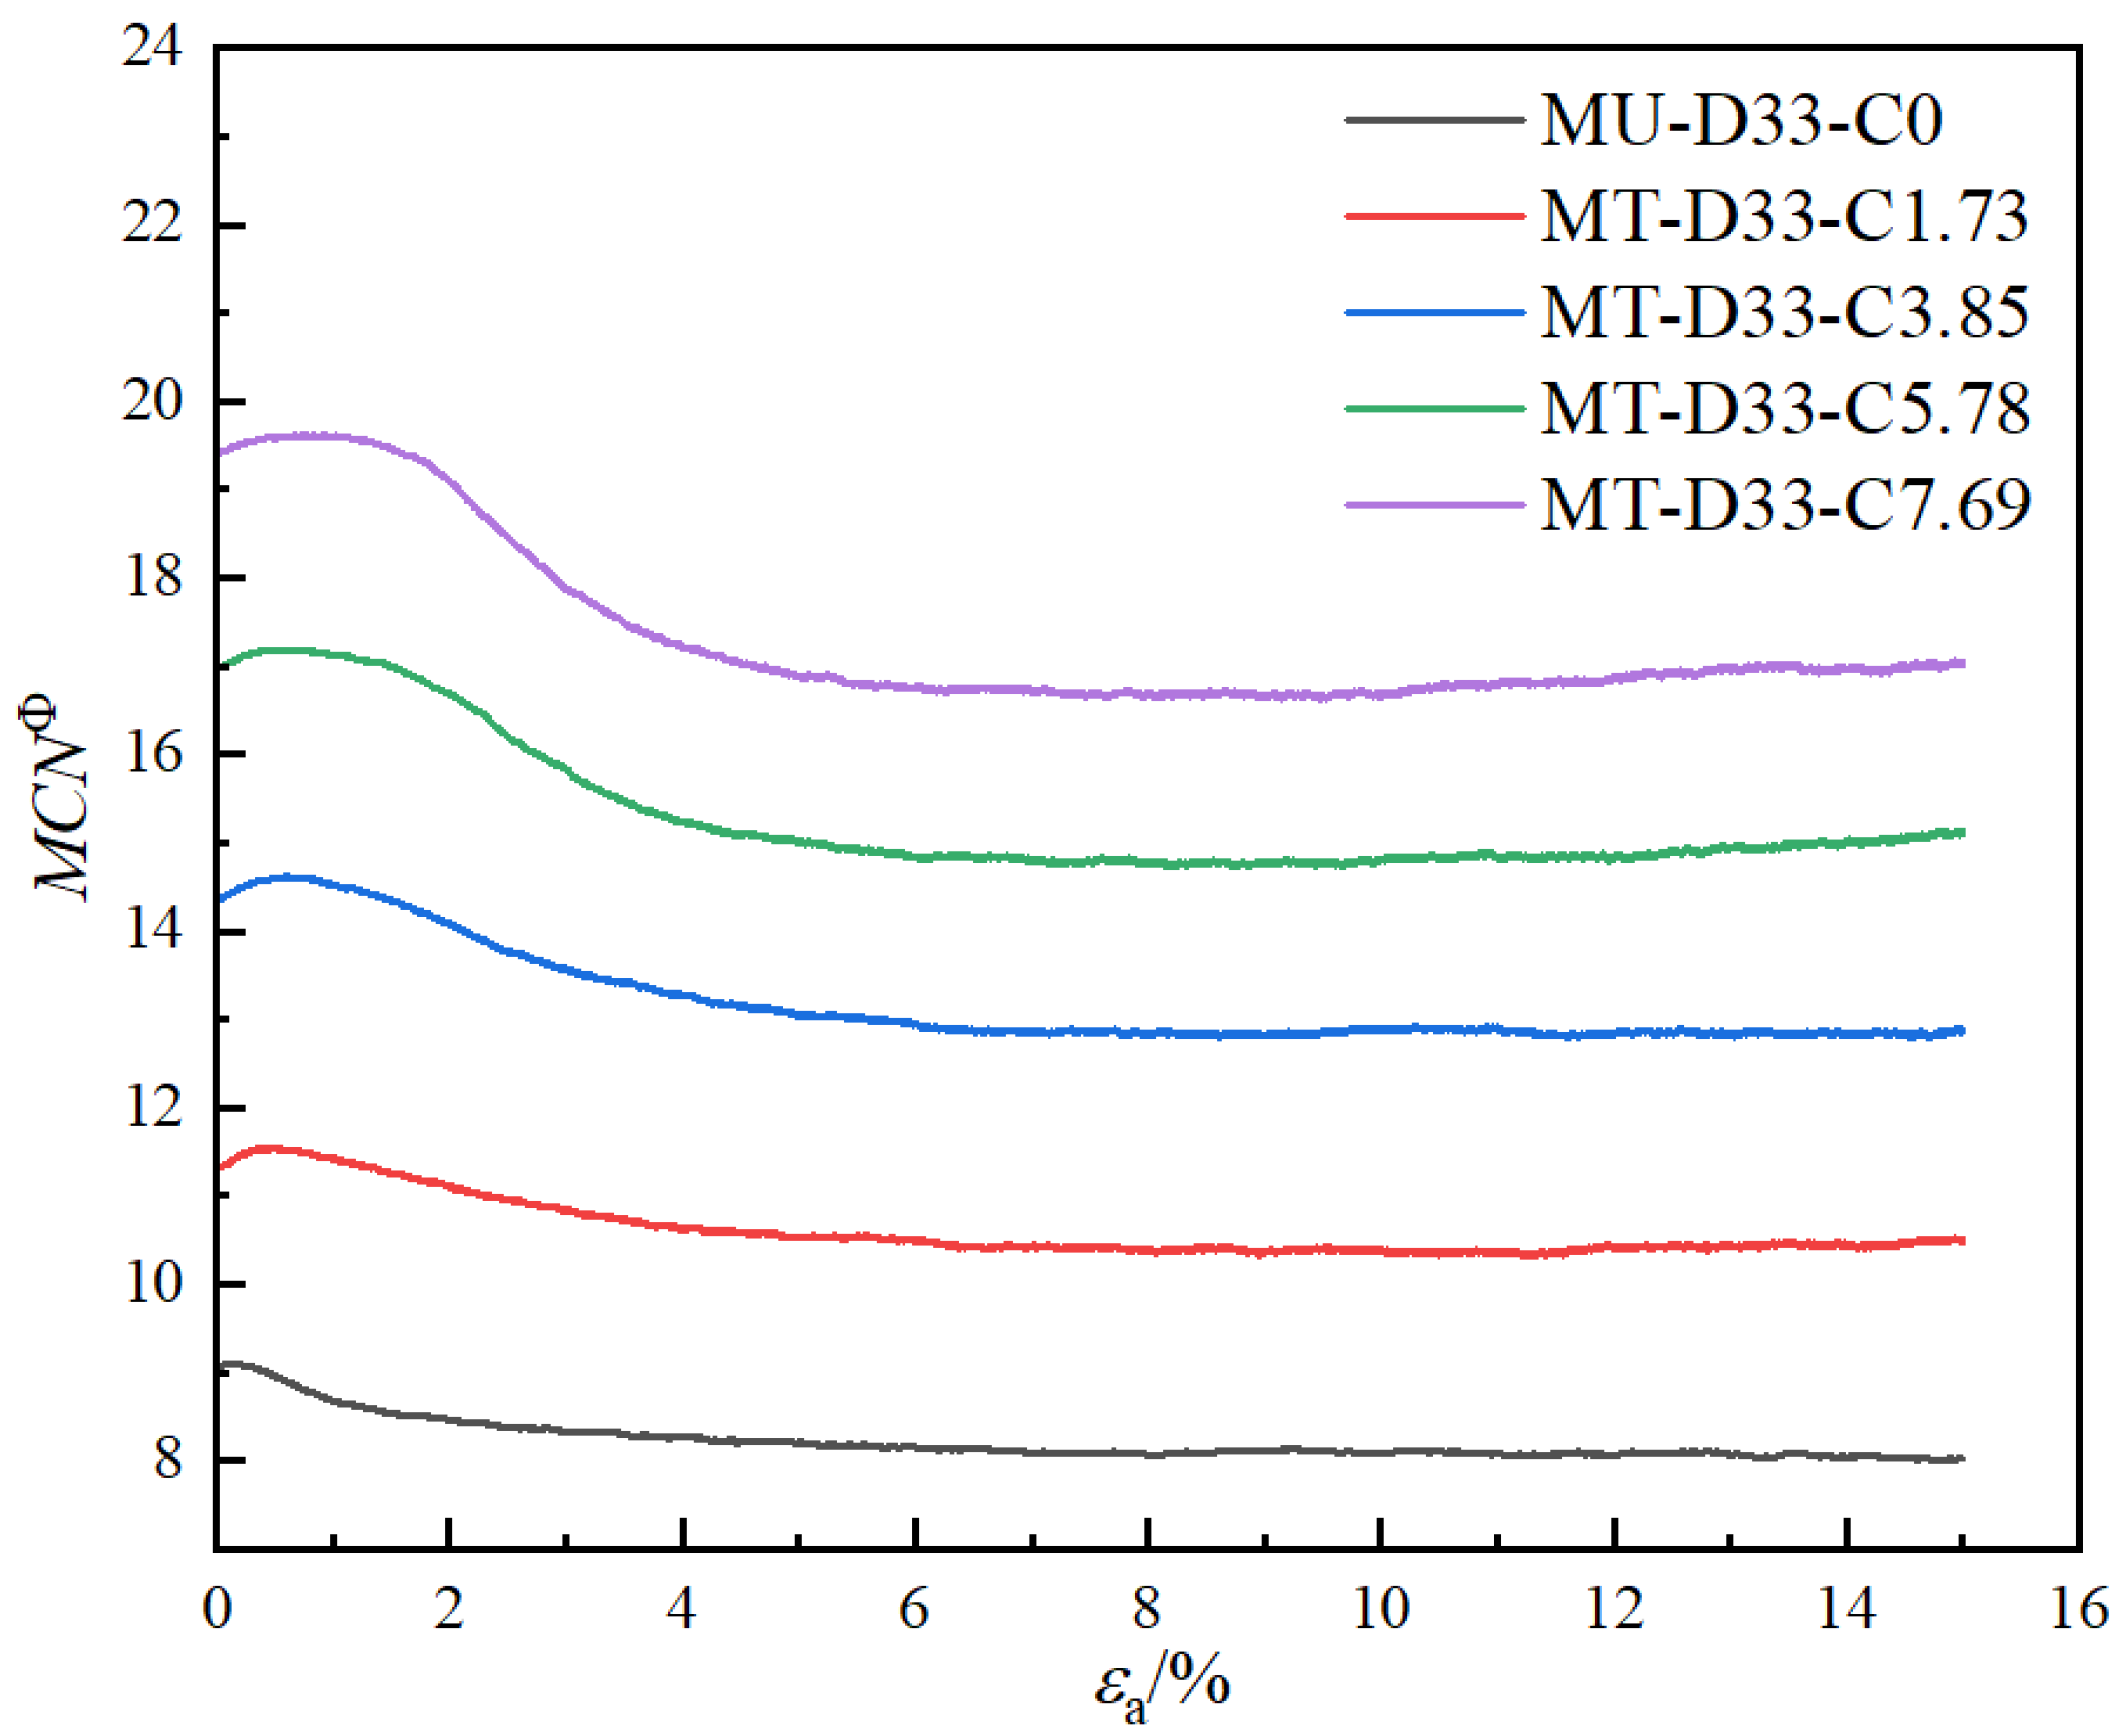
3.2.2. Coordination Numbers

The coordination number is a meaningful concept in understanding the structure and stability of materials at a granular level. Defined as the average number of contacts per particle, the coordination number reveals the compactness of a sample and provides insights into the structural stability in aggregations of particles. In the case of structured multiphase soils, considering the differences among different solid phases, it is useful to define the coordination number for each phase to gain a better understanding of its impact on the relative particle structure. This approach becomes even more relevant and critical in studies with varying conditions, such as those considering different precipitation patterns. In the mentioned research involving calcium carbonate, four precipitation patterns were explored. By considering the solid-phase structure characteristics in each precipitation pattern separately, a more detailed understanding of particle arrangement and contact conditions can be achieved among different phases. In practical, certain particles may not establish effective connections with other particles due to their contact number being less than or equal to 1. Typically, these particles are found in a suspended state, often dubbed ‘suspended particles’ or ‘rattlers’. Their contribution to the propagation of the overall force chain and to the mechanical properties of the system tends to be negligible. In DEM simulations, excluding these particles’ influences can lead to a more accurate depiction of the system’s mechanical behavior. The mechanical coordination number (MCN) proposed by Thornton [29] only considers particles with two or more contacts. The formula for calculating the mechanical coordination number of each phase is as follows:
M C N Φ = 2 i = 1 N Φ N c N p 1 Φ N Φ N p 1 Φ N p 0 Φ ,
where Φ refers to the sand phase or the filling, coating, or bridging phase; Nc represents the number of contacts that particle iii (in phase Φ) has; and NΦ denotes the total number of particles in phase Φ of the component. Specifically, NΦp0 is the number of particles in phase Φ with no contacts, and NΦp1 is the number of particles in phase Φ with only one contact.
Figure 9 shows the mechanical coordination numbers of MICP-treated sand samples with different calcium carbonate contents in coexisting calcium carbonate precipitation mode. Figure 9 reveals that the total mechanical coordination number values and development trends across samples with varying calcium carbonate contents exhibit minimal differences. While the development trend of the mechanical coordination number remains consistent across different precipitation modes of calcium carbonate, the specific numerical values vary. The mechanical coordination number of grain coating tends to diminish as the calcium carbonate content increases. This could be related to the tendency of the coating to exist as isolated particles, where the quantity of NΦp1 is high. As the content of calcium carbonate increases, the proportion of the coating existing as isolated particles reduces, which in turn results in a decrease in the mechanical coordination number. Additionally, as the calcium carbonate content increases, the mechanical coordination number, regarding bridge and contact bonding, demonstrates minimal change. Figure 10 displays the mechanical coordination numbers of soils with varying calcium carbonate contents. As depicted in Figure 10, the mechanical coordination number of sand particles increases with increased calcium carbonate content, signaling that each particle has increased contact with others. This typically signifies that the microstructure of the sandy soil phase is more stable.

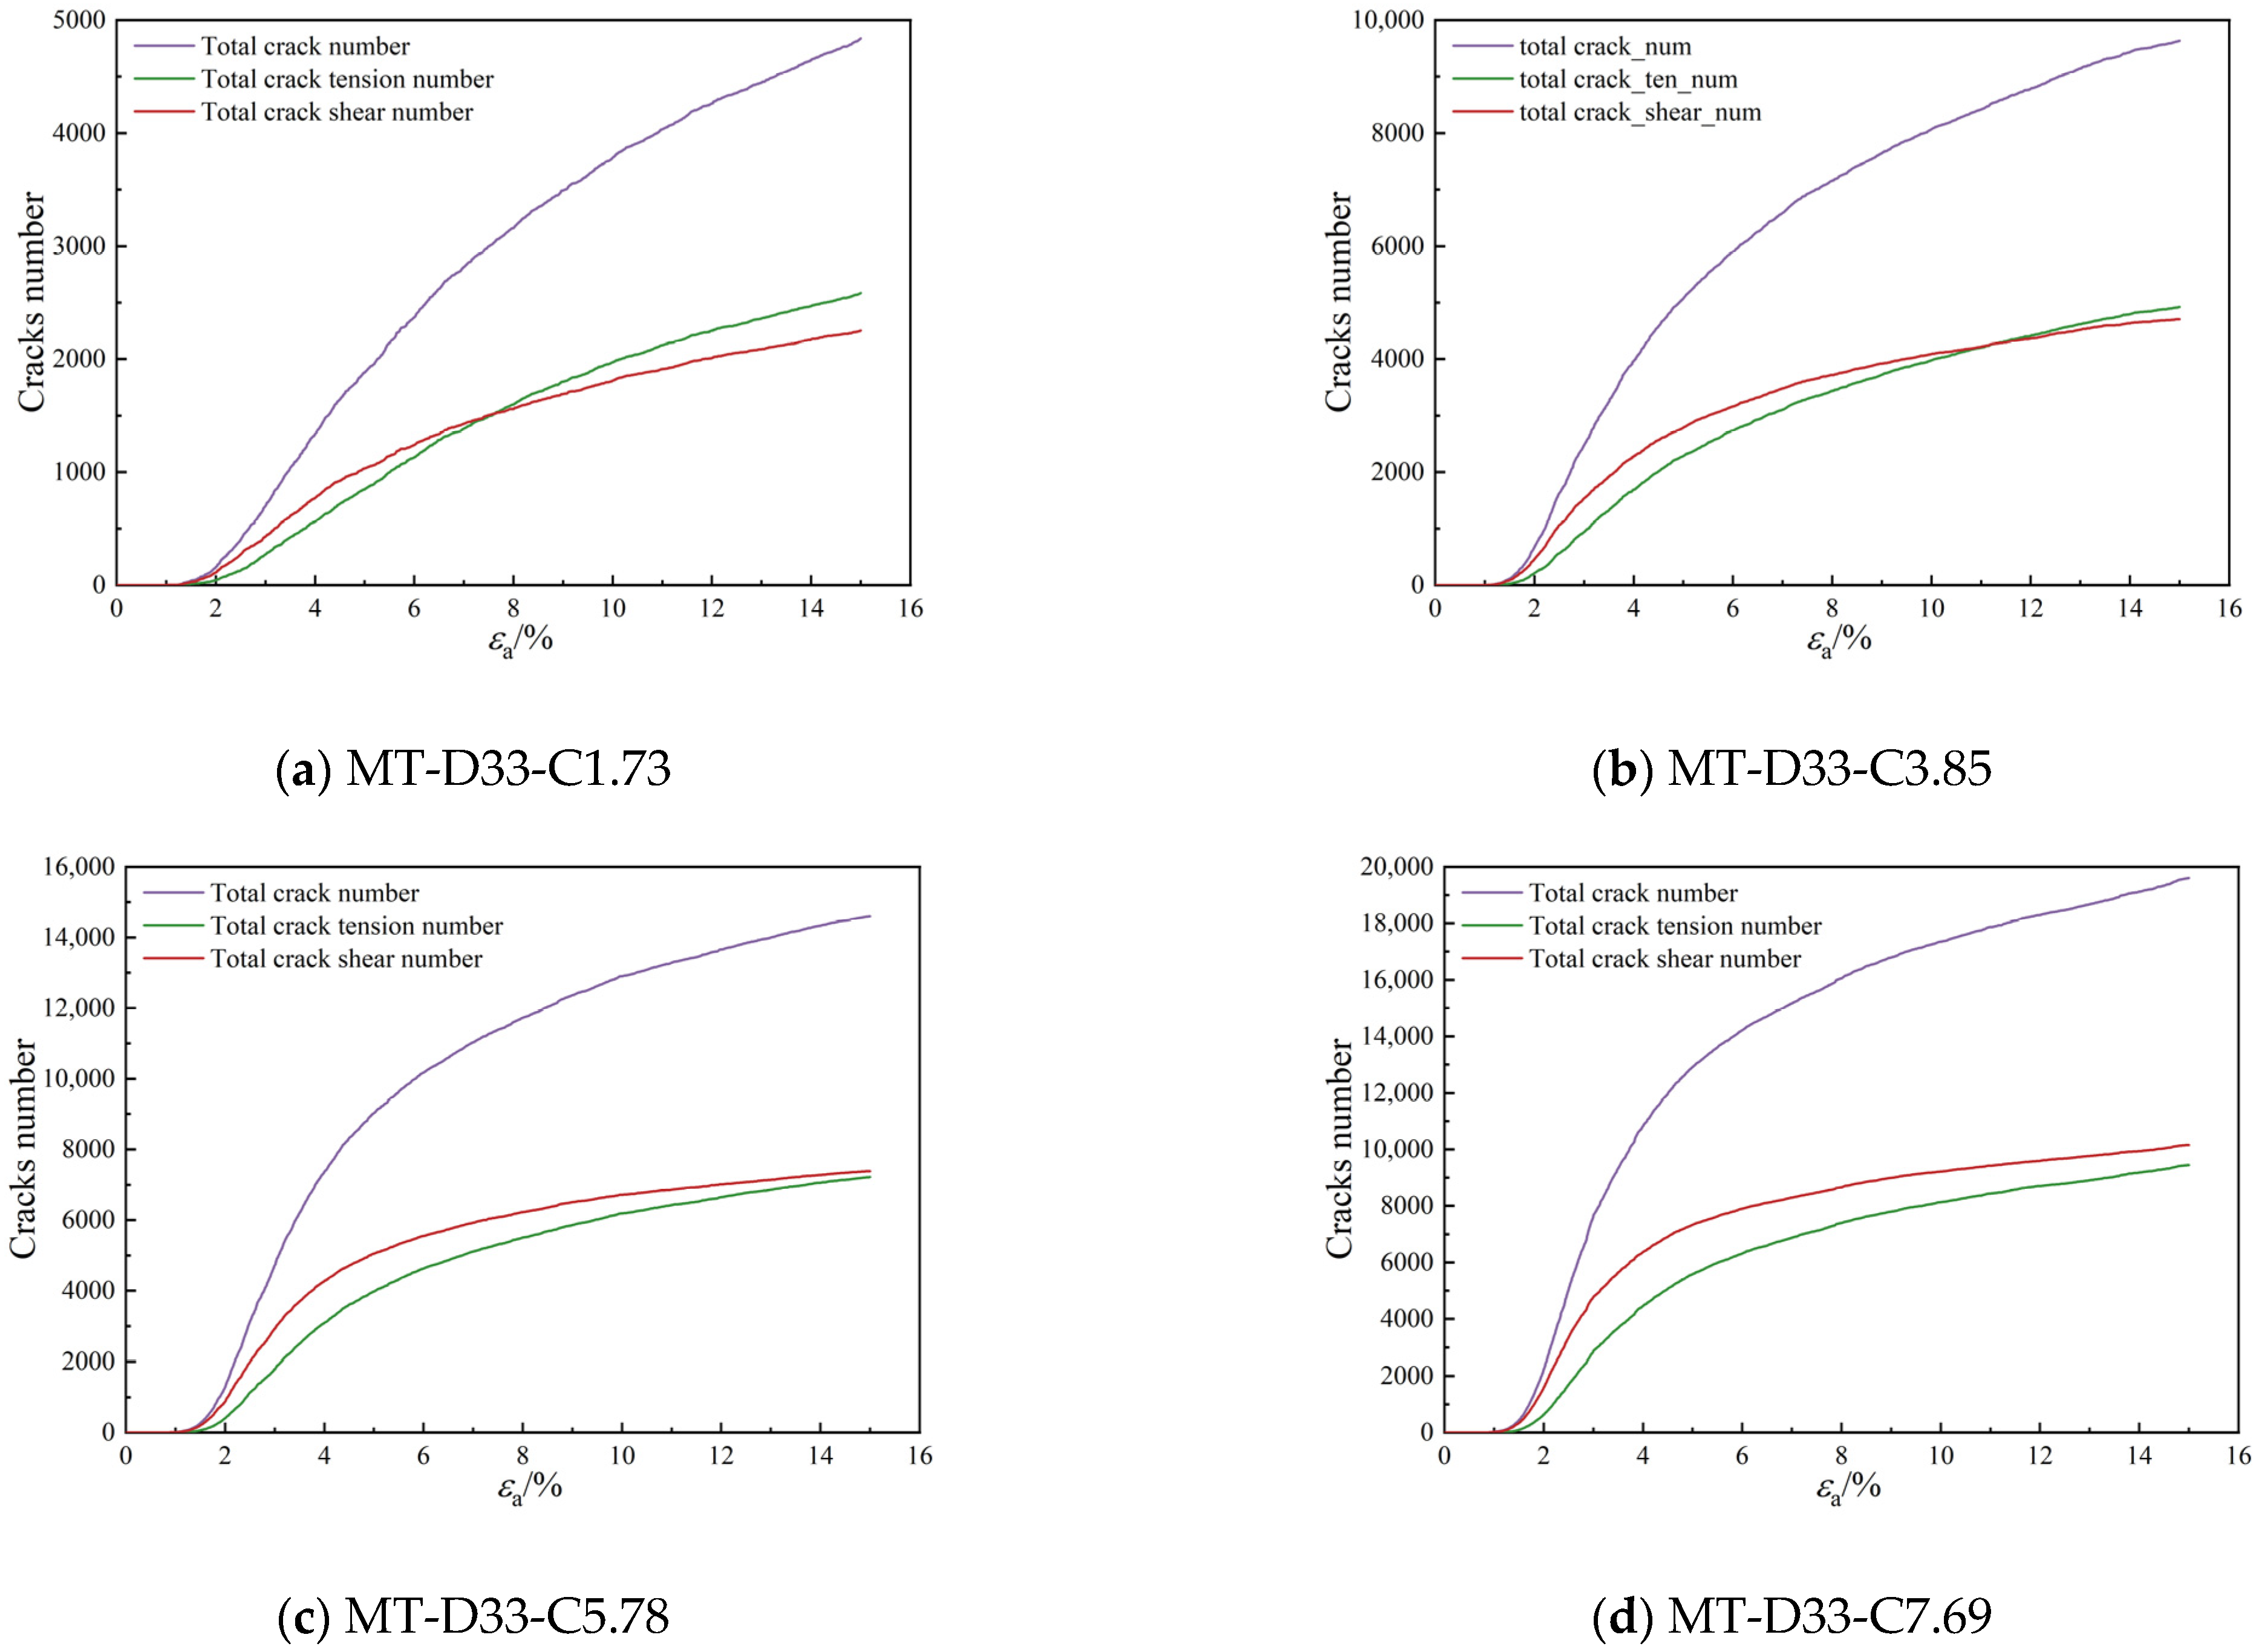
3.2.3. Bond Breakage Behavior

Studying the bond fracture of MICP-treated sand using the DEM is of substantial importance. The inclusion of calcium carbonate notably alters the geometric distribution of forces transmitted through the interactions of particles, which significantly effects the mechanical properties of the material. Under shear stress, the cementing bonds of calcium carbonate gradually deteriorate, thereby influencing the strength and stability of the material. Quantifying the bond breaking process in a laboratory setting poses challenges owing to the microscopic scales and the complexity of the interactions involved. Traditional experimental techniques often struggle to accurately document the intricate details of this fracture process. However, DEM emerges as a potent tool for understanding bond fracture, enabling detailed quantitative analysis that helps elucidate the mechanisms and patterns of bond failure. In this study, bond breaking was analyzed through both statistical and visual methods. Statistical analysis sheds light on the overall trends and distribution of bond fracture events, providing a comprehensive understanding of how bonds break under different conditions. Meanwhile, visualization techniques offer insights into the spatio-temporal evolution of bond failure, allowing for a closer observation of how fractures develop and propagate over time.
Figure 11 shows the crack development of MICP-treated sand samples with different calcium carbonate contents. The number of cracks, including both shear and tensile cracks, increases in line with the rise in calcium carbonate content. Initially, shear cracks appear in the MICP-treated sand, followed by the formation of tensile cracks. When the calcium carbonate content is relatively low, by the end of the loading phase, the number of tensile cracks surpasses that of the shear cracks. However, when there is a high level of calcium carbonate, the count of shear cracks consistently exceeds that of the tensile ones.
Figure 12 presents the progression of microcrack formation in contact cementing mode of MICP-treated sand at varying calcium carbonate contents. As can be observed in Figure 12, the contact cementing initially produces shear cracks, followed by tensile cracks. The fracture first occurs between the sand and calcium carbonate (c-s) and subsequently between the calcium carbonate particles themselves (c-c). Considering the interaction between calcium carbonate particles (c-c), when the calcium carbonate content is low (1.73%), the quantity of tensile cracks outstrips that of shear cracks. However, at a calcium carbonate content of 3.85%, the count of shear cracks is virtually equal to that of tensile cracks by the end of the loading phase. When the calcium carbonate content is high (5.78% and 7.69%), the prevalence of shear cracks continues to exceed that of tensile ones.
Figure 13 shows the crack development in bridging mode of MICP-treated sand samples with different calcium carbonate contents. From what can be discerned in Figure 13, the initial cracks develop at the junctions between calcium carbonate particles (c-c). This is followed by fractures occurring between calcium carbonate particles and sand grains (c-s). Between calcium carbonate particles or between calcium carbonate particles and sand particles (c-c, c-s), a pattern of shear failure preceding tensile failure is evident. When studying the fracturing phenomena occurring between calcium carbonate particles (c-c), it was observed that at low calcium carbonate contents, the quantities of tensile and shear cracks in the final load stage were almost equal. However, as the content of calcium carbonate elevates, the final loading state consistently presents a higher number of shear cracks compared to tensile ones. For the fracture between calcium carbonate particles and sand particles (c-s), the trend is consistent with the development trend of the total cracks.
Figure 14 illustrates the crack development in grain coatings of MICP-treated sand samples with varying levels of calcium carbonate contents. As depicted in Figure 14, microcracks primarily arise at the point of contact between the sand and calcium carbonate (c-s), with tensile cracks being the most common. There were fewer microcracks observed between the calcium carbonate particles themselves (c-c), and the observed shear cracks were notably larger than the tensile cracks. Overall, for the entire sample, the incidence of coating cracks was minimal.

3.2.4. Rolling and Sliding Contacts

In discrete element simulation, plastic sliding transpires when the tangential contact force between two particles surpasses the product of the friction coefficient and the normal contact force. Similarly, if the cumulative rotational torque is greater than the limit value, this leads to rotational failure among particles. It is widely acknowledged that sliding is the principal mechanism dictating macroscopic soil failure, with the strength of granular materials being associated with the friction coefficient between particles [30,31]. When the contact slides or rotates, the particles undergo rearrangement, giving rise to enduring plastic deformation.
DEM studies offer a means to exclusively analyze the interaction between sand particles. To evaluate the effect of calcium carbonate content on sliding contact fractions (fs), rolling contact fractions (fr), and contact that reaches the sliding and rolling limits (fsr), the fs, fr, and fsr values of samples with different calcium carbonate contents at the end of triaxial loading were analyzed and summarized. This analysis was performed under conditions where only the interaction forces between sand and sand were considered. Figure 15 illustrates the sliding and rolling contact fractions of samples with different calcium carbonate contents. fs and fr were both found to be higher than fsr; this finding aligns with Gu’s previous results obtained under consolidated drained conditions [27]. With the increase in calcium carbonate content, fs, fr, and fsr all decreased. The fs, fr, and fsr of MU-D33-C0 were 34.29%, 29.31%, and 17.21%, respectively. The fs, fr, and fsr of MT-D33-C1.73 were 22.21%, 15.28%, and 8.34%, respectively. The results show that a small amount of calcium carbonate can greatly reduce the sliding and rotation between sand and sand. In addition, the fs, fr, and fsr of MT-D33-C7.69 were 18.87%, 11.96%, and 6.89%, respectively. The results demonstrate that as the calcium carbonate content increases, the occurrences of both sliding and rotation between sand particles steadily decrease. This indicates that calcium carbonate contributes to a reduction in both sliding and rolling movements among sand particles.

4. Conclusions

In this paper, a numerical model of MICP-treated sand with coexisting calcium carbonate precipitation patterns is established, and a series of triaxial compression tests are carried out by DEM simulation. The effect of calcium carbonate content on the macro- and micromechanical characteristics of MICP-treated sand is analyzed. The main conclusions are as follows:
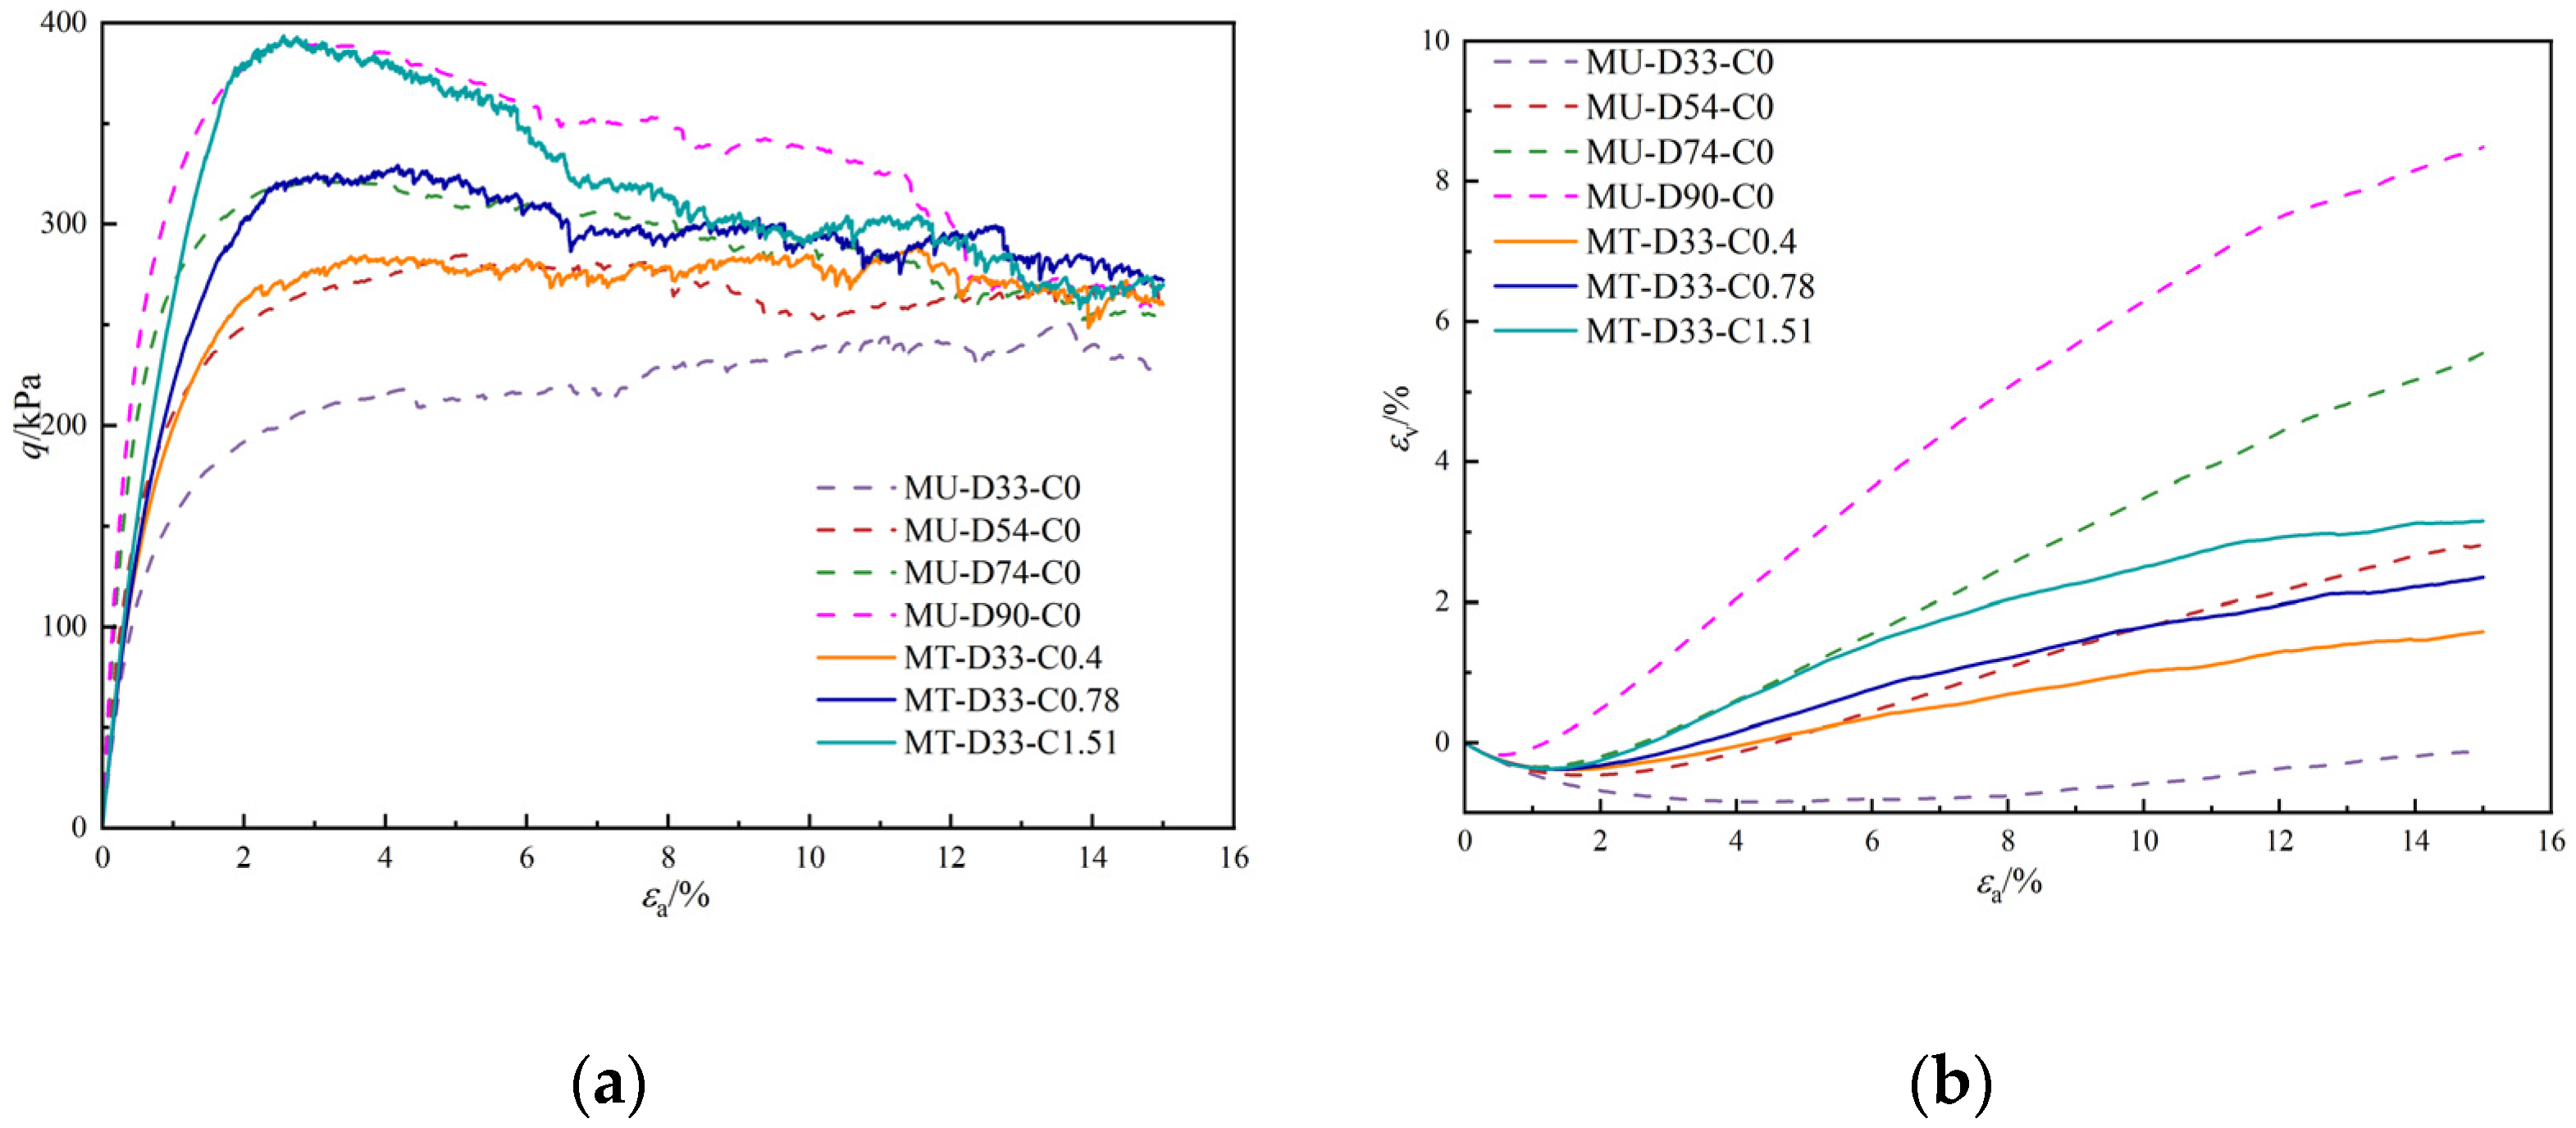
  • The peak strength of MICP-treated sand with a 7.69% calcium carbonate content is 4.5 times higher than that of untreated sand. This reveals that the calcium carbonate content can significantly enhance soil strength. In addition, the discrete element model provides a possibility to prepare MICP-treated sand with a very small calcium carbonate content. Loose sand with just a 1.51% calcium carbonate content demonstrates nearly the same peak strength as when the relative density is increased to 90%; the volume change of MICP-treated sand is smaller than that observed with increased relative density. The MICP technique emerges as a more efficient strategy than simply increasing relative density for enhancing strength.
  • The SEM images show that calcium carbonate tends to form between two sand particles rather than on the sand surface. This observation aligns with the proportion results of the calcium carbonate precipitation mode in the MICP-treated sand numerical model, further proving the accuracy of the MICP numerical model. The fact that there is a higher proportion of effective calcium carbonate crystals explains why even low amounts of calcium carbonate can significantly improve the mechanical properties of sand.
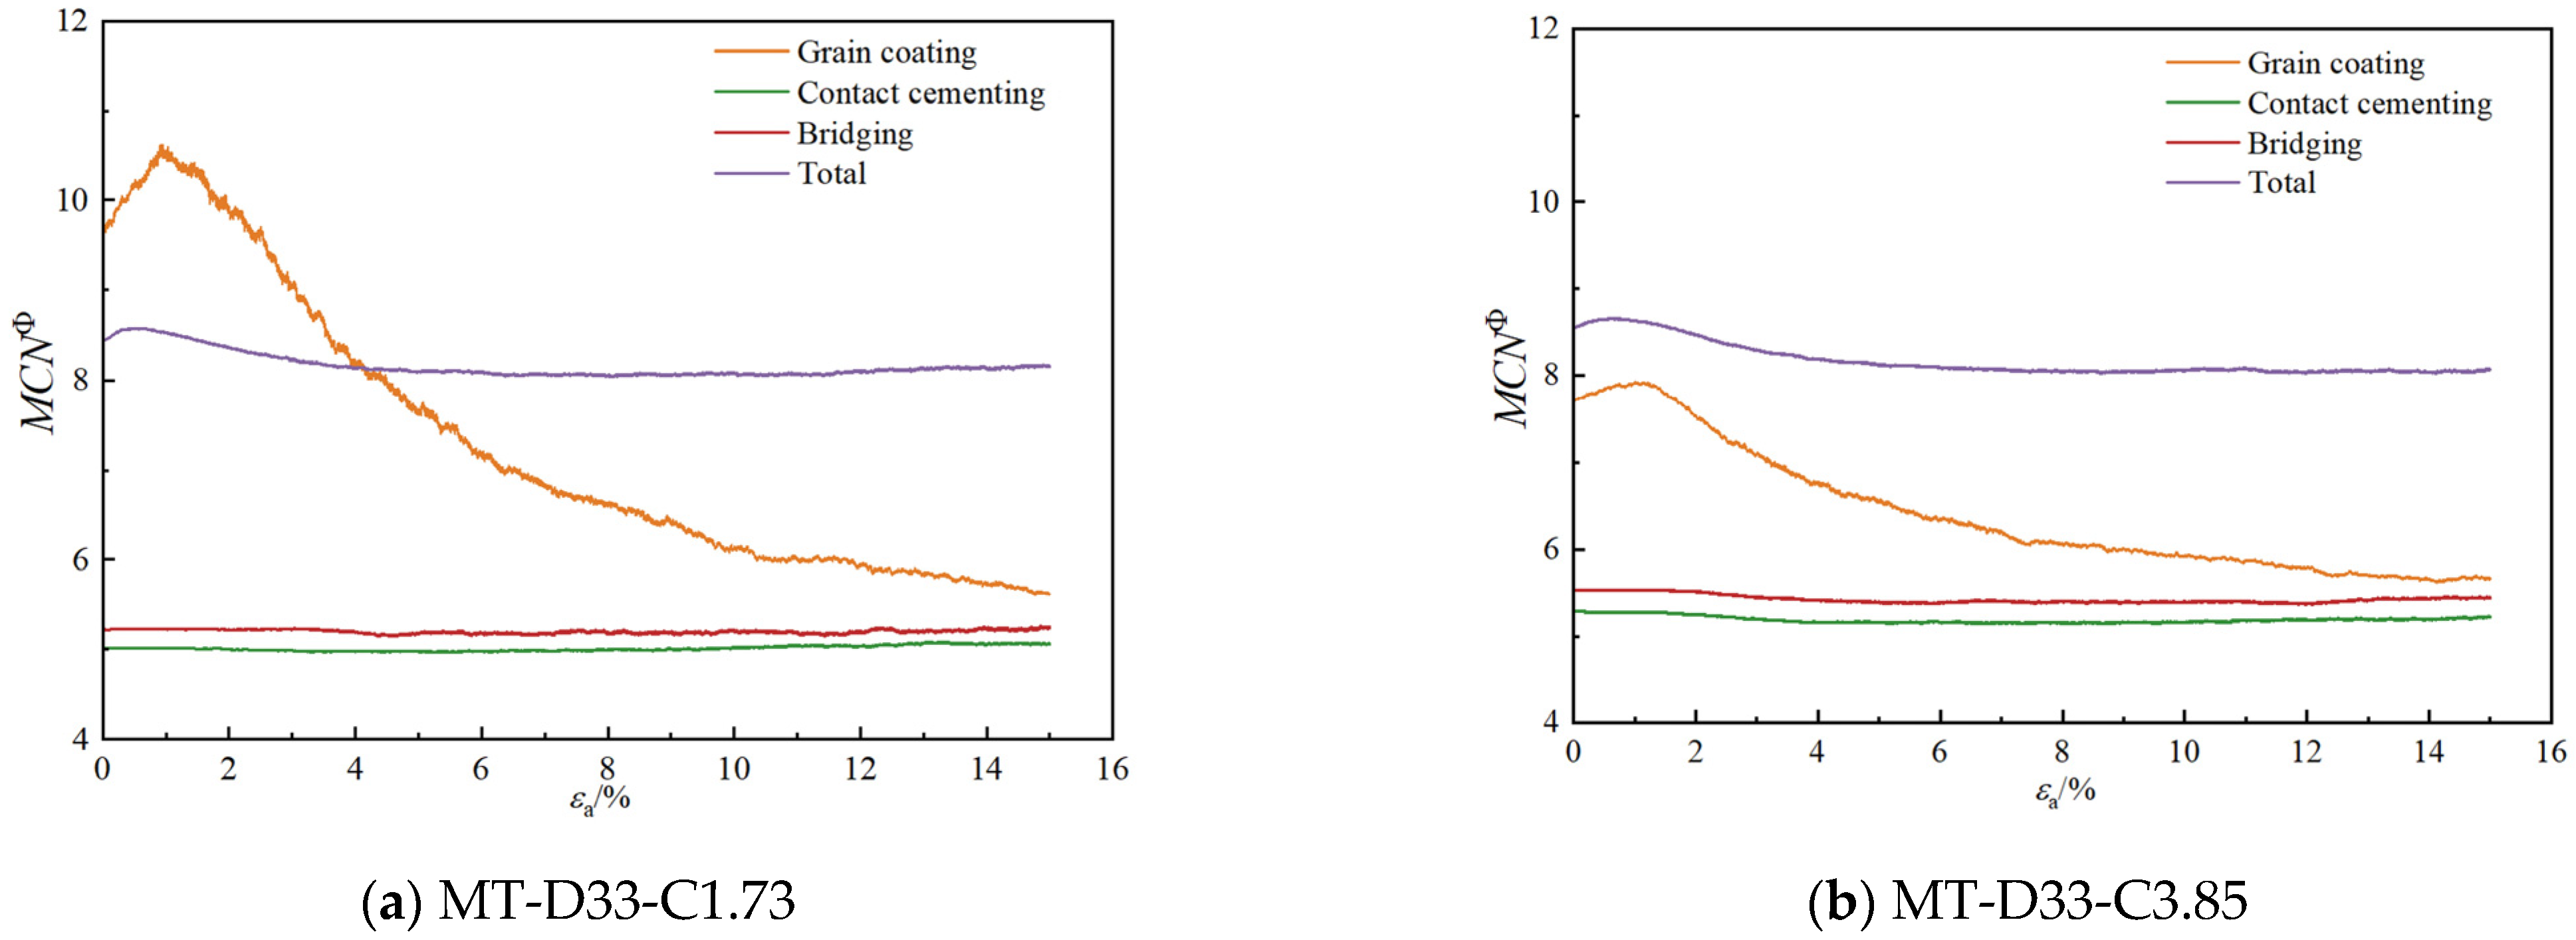
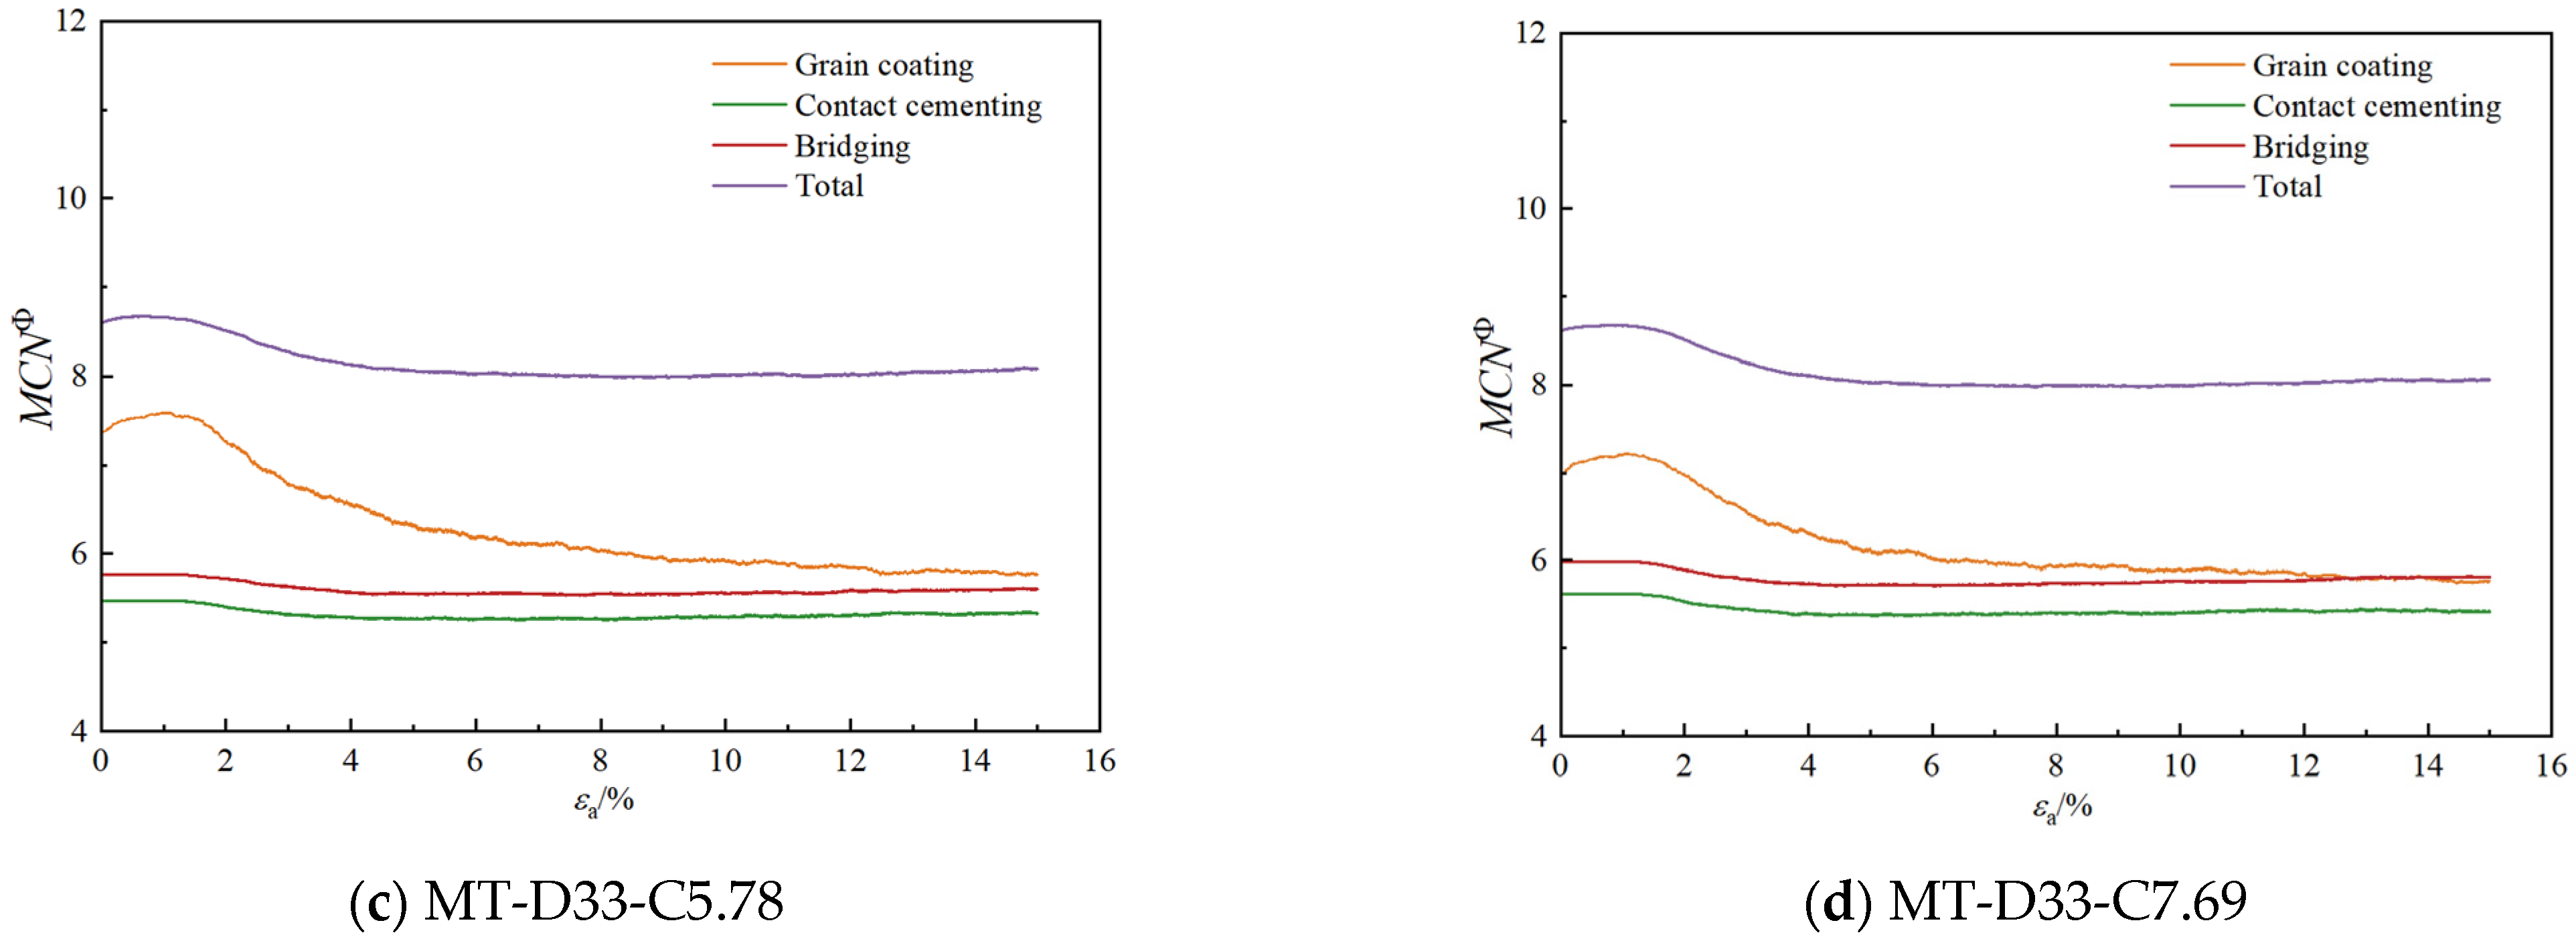
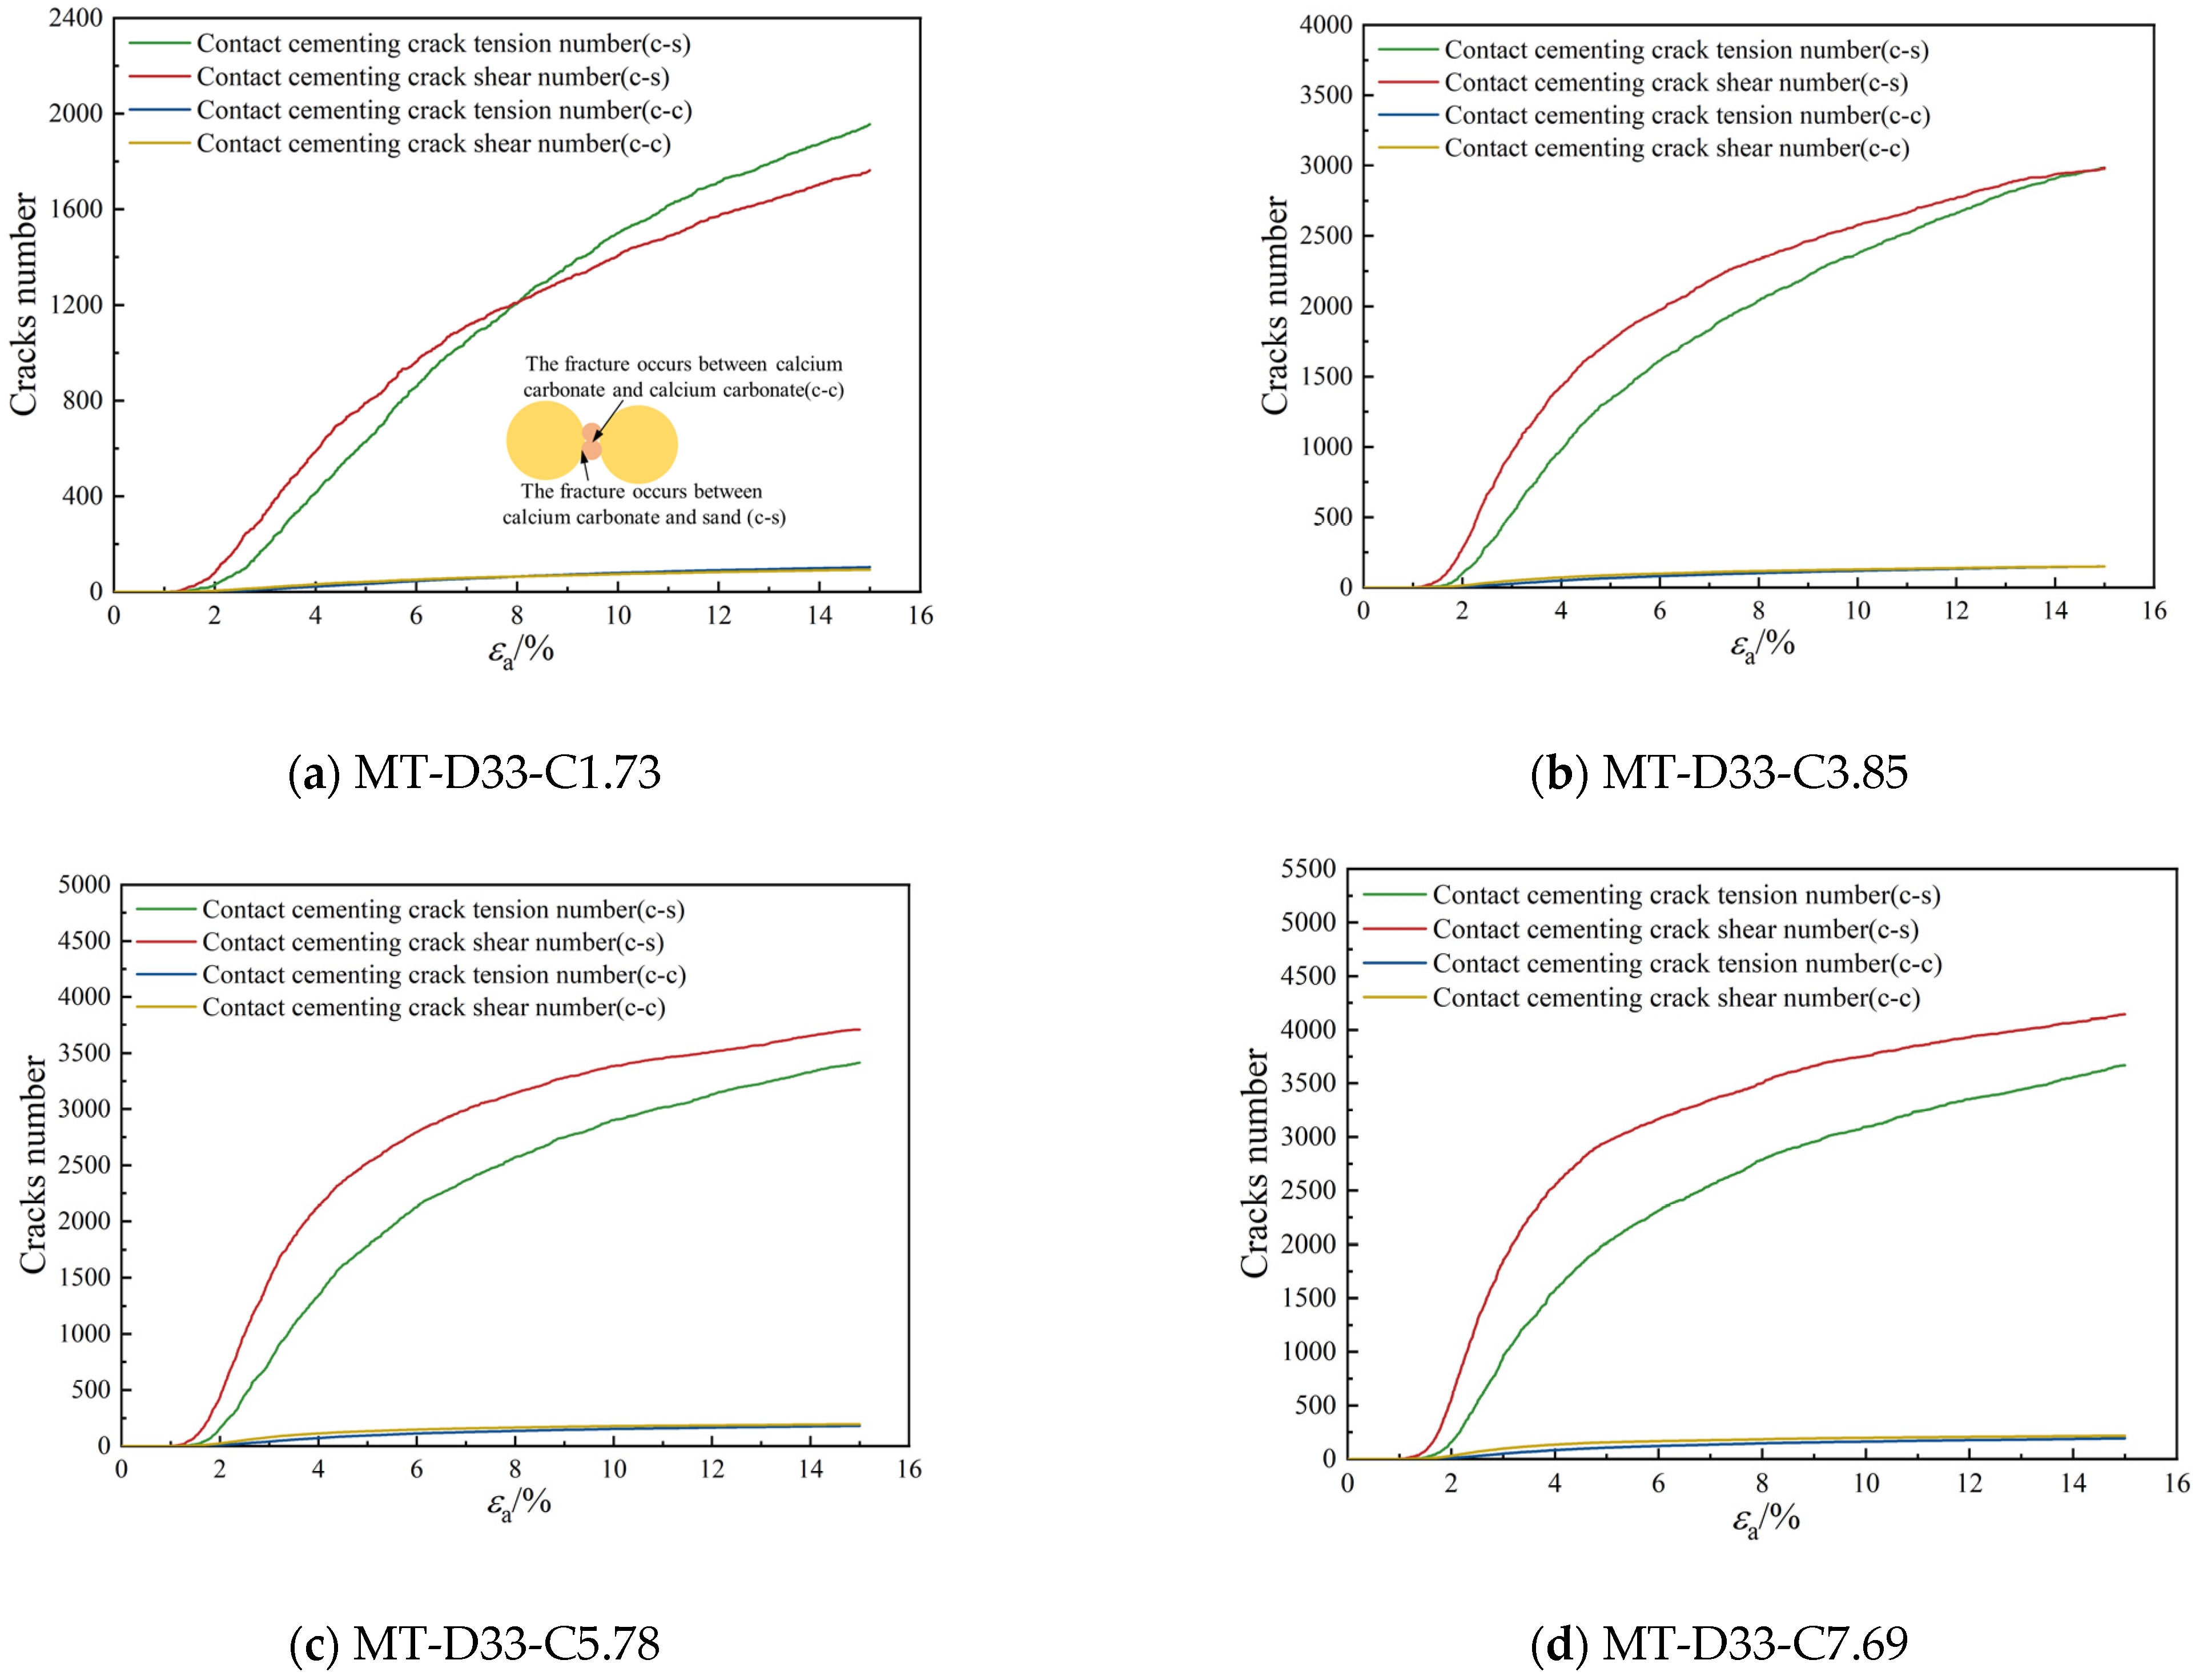
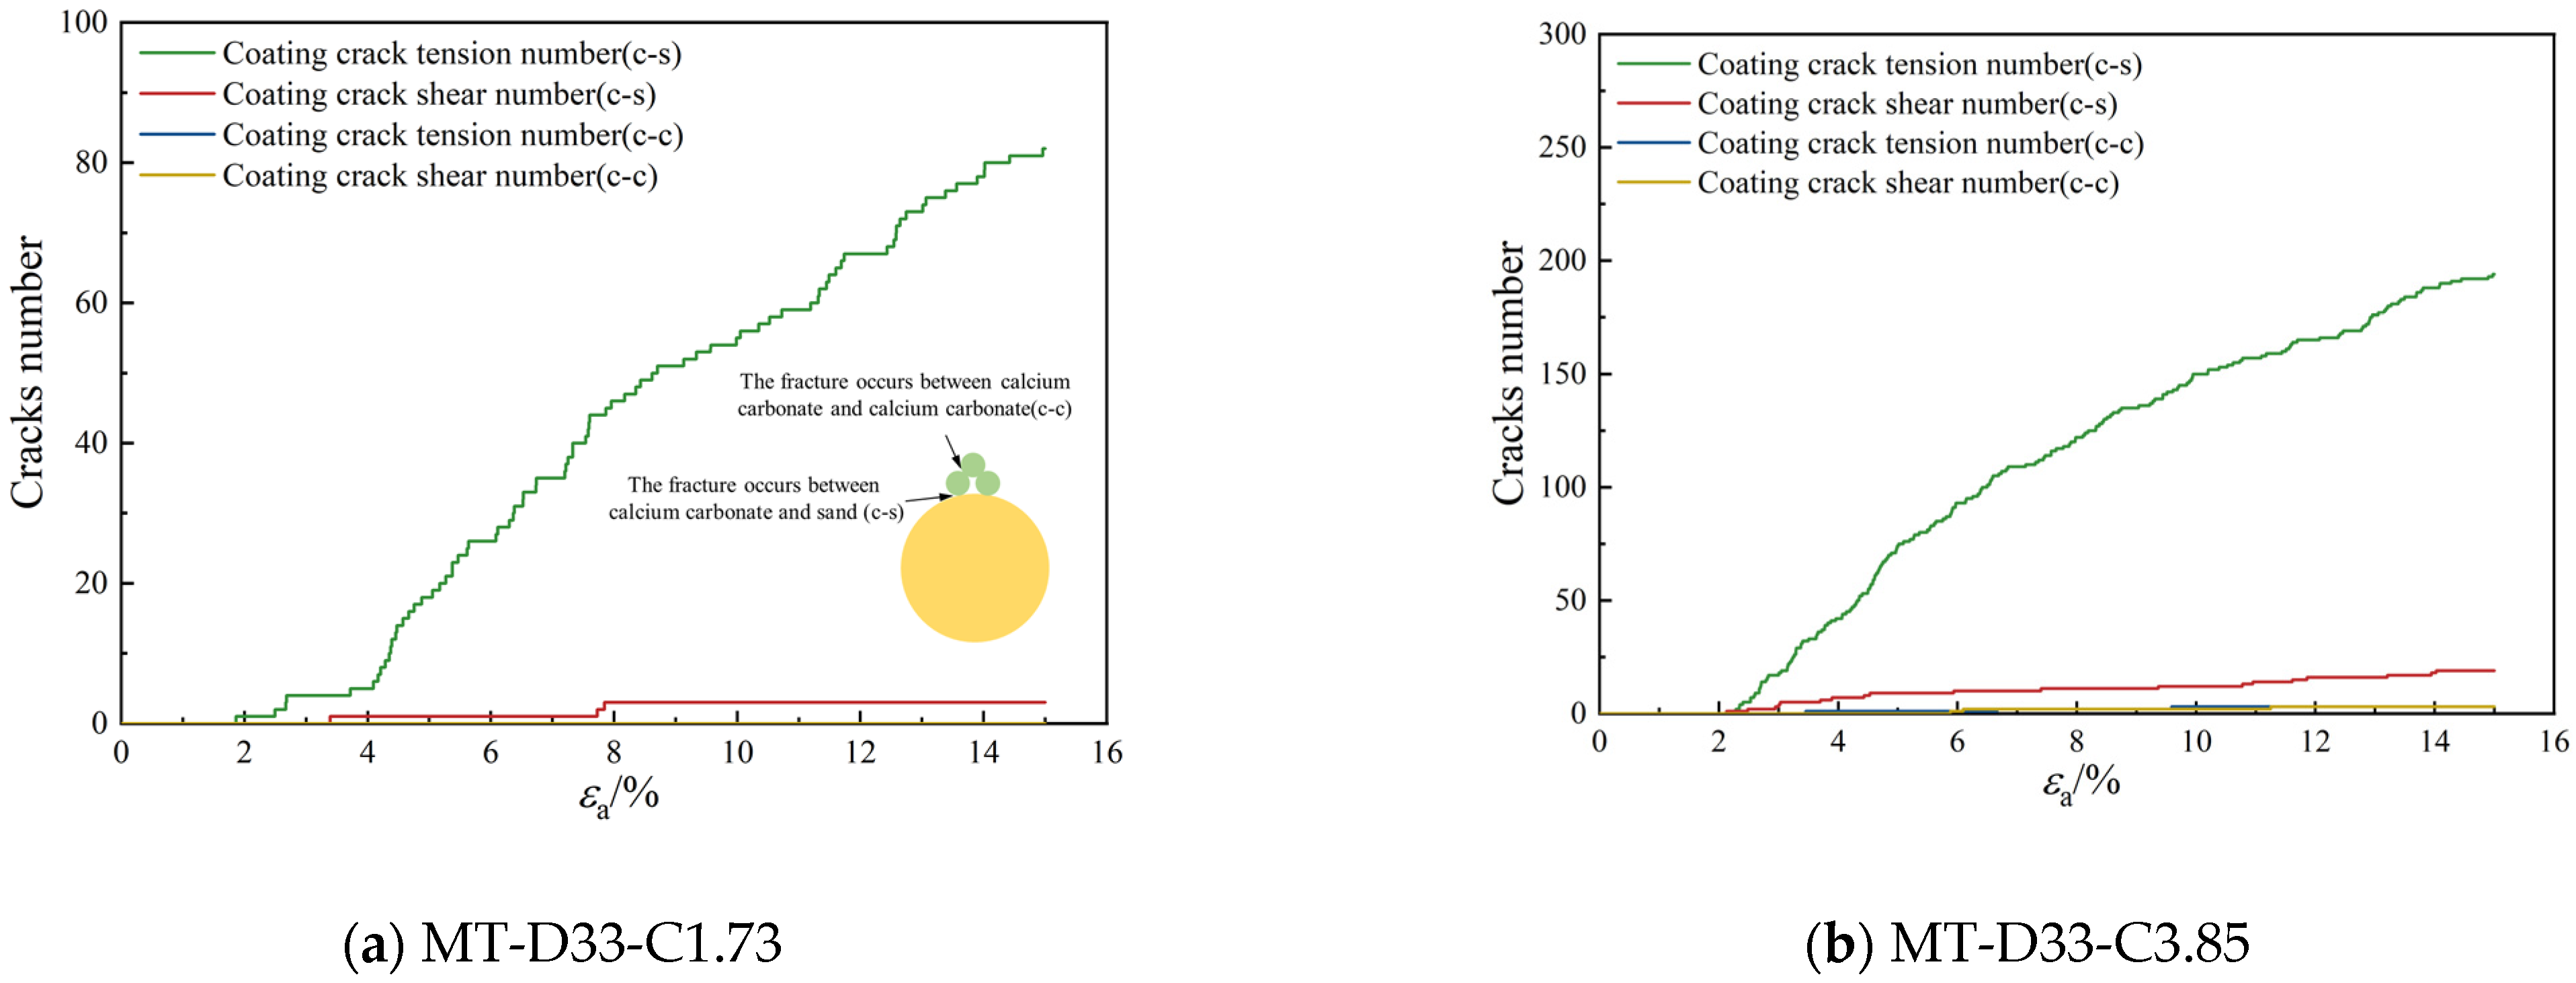
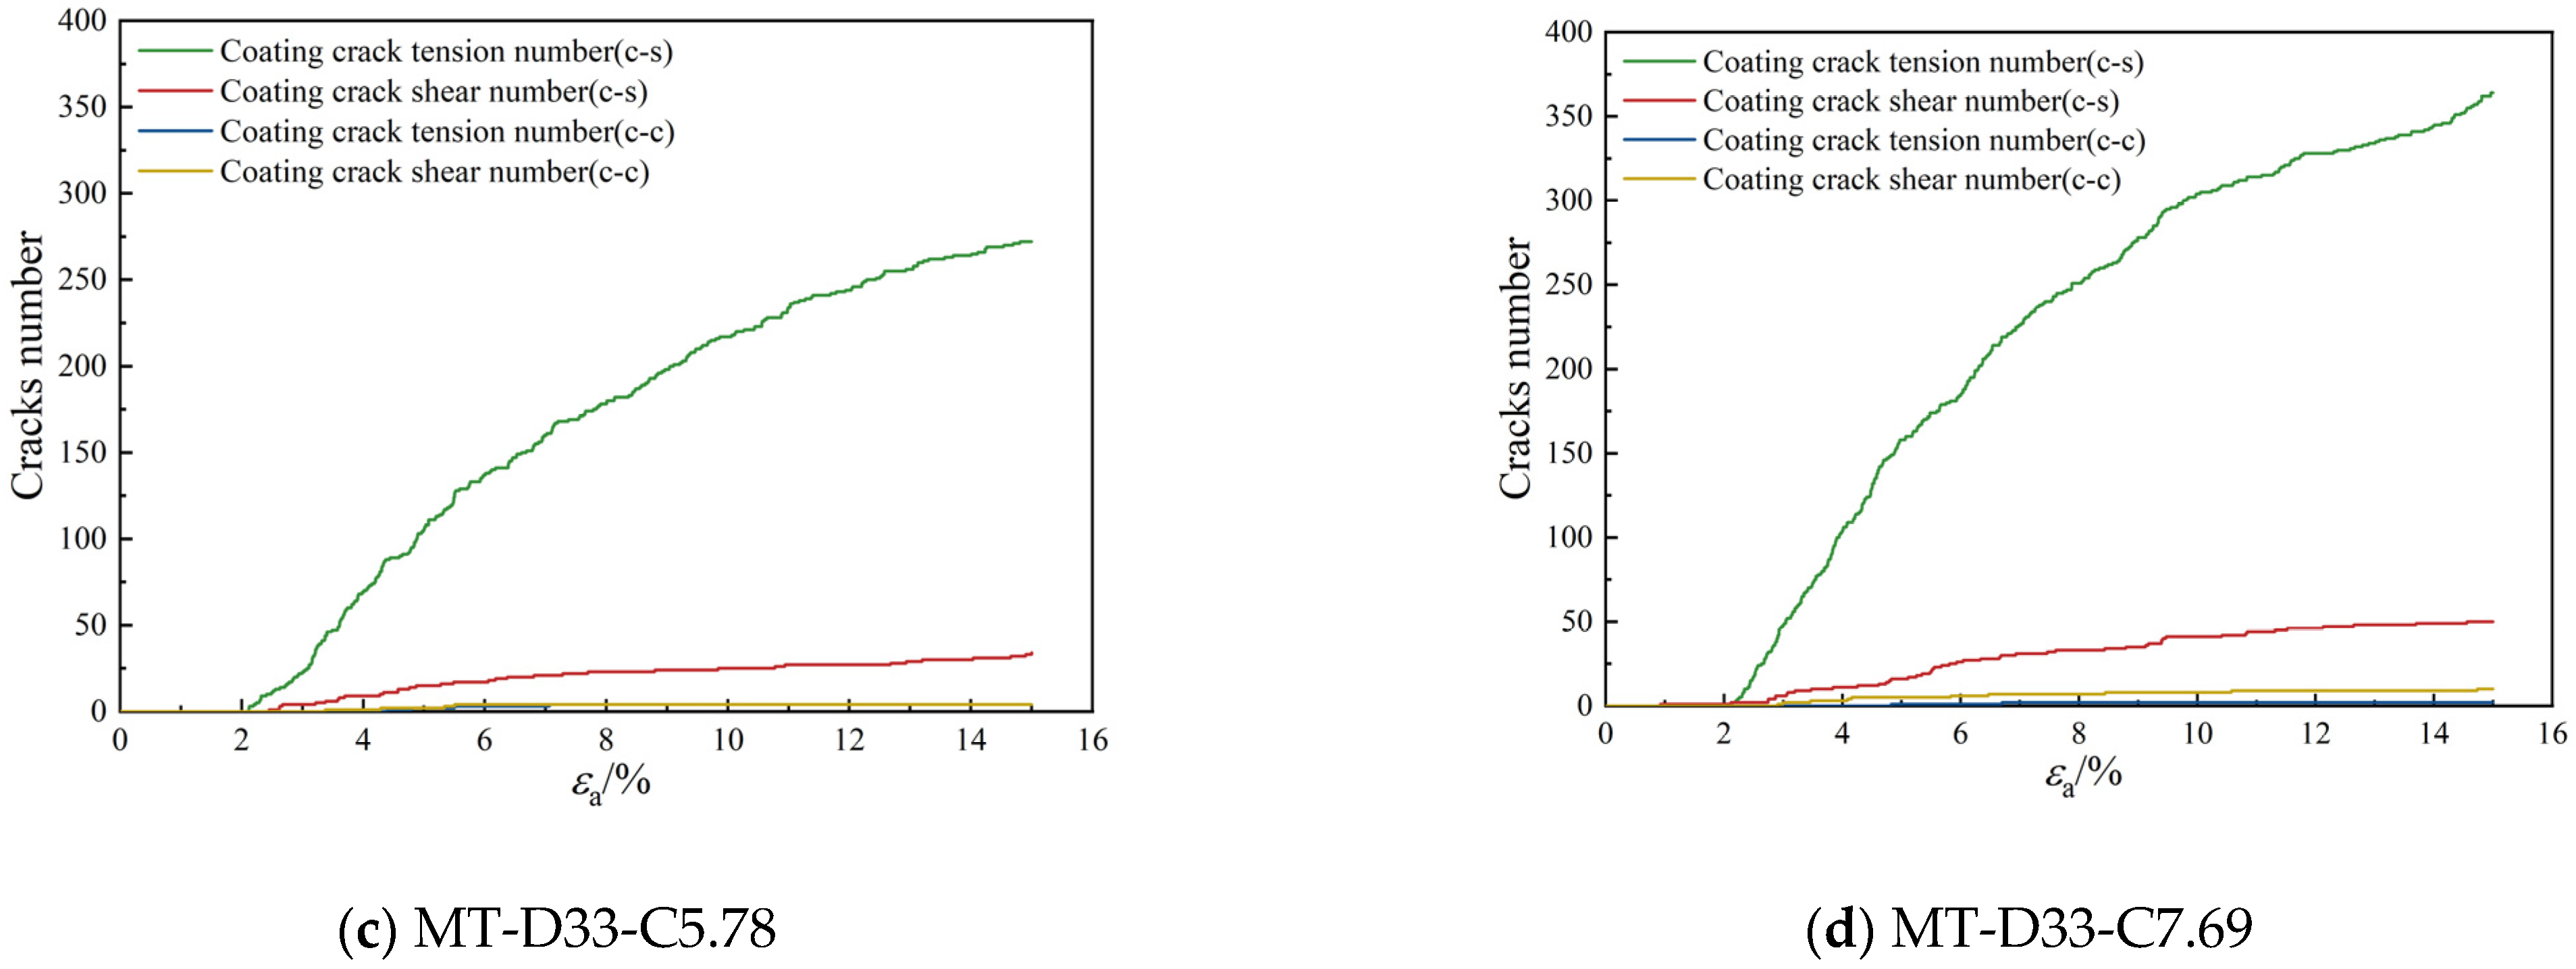
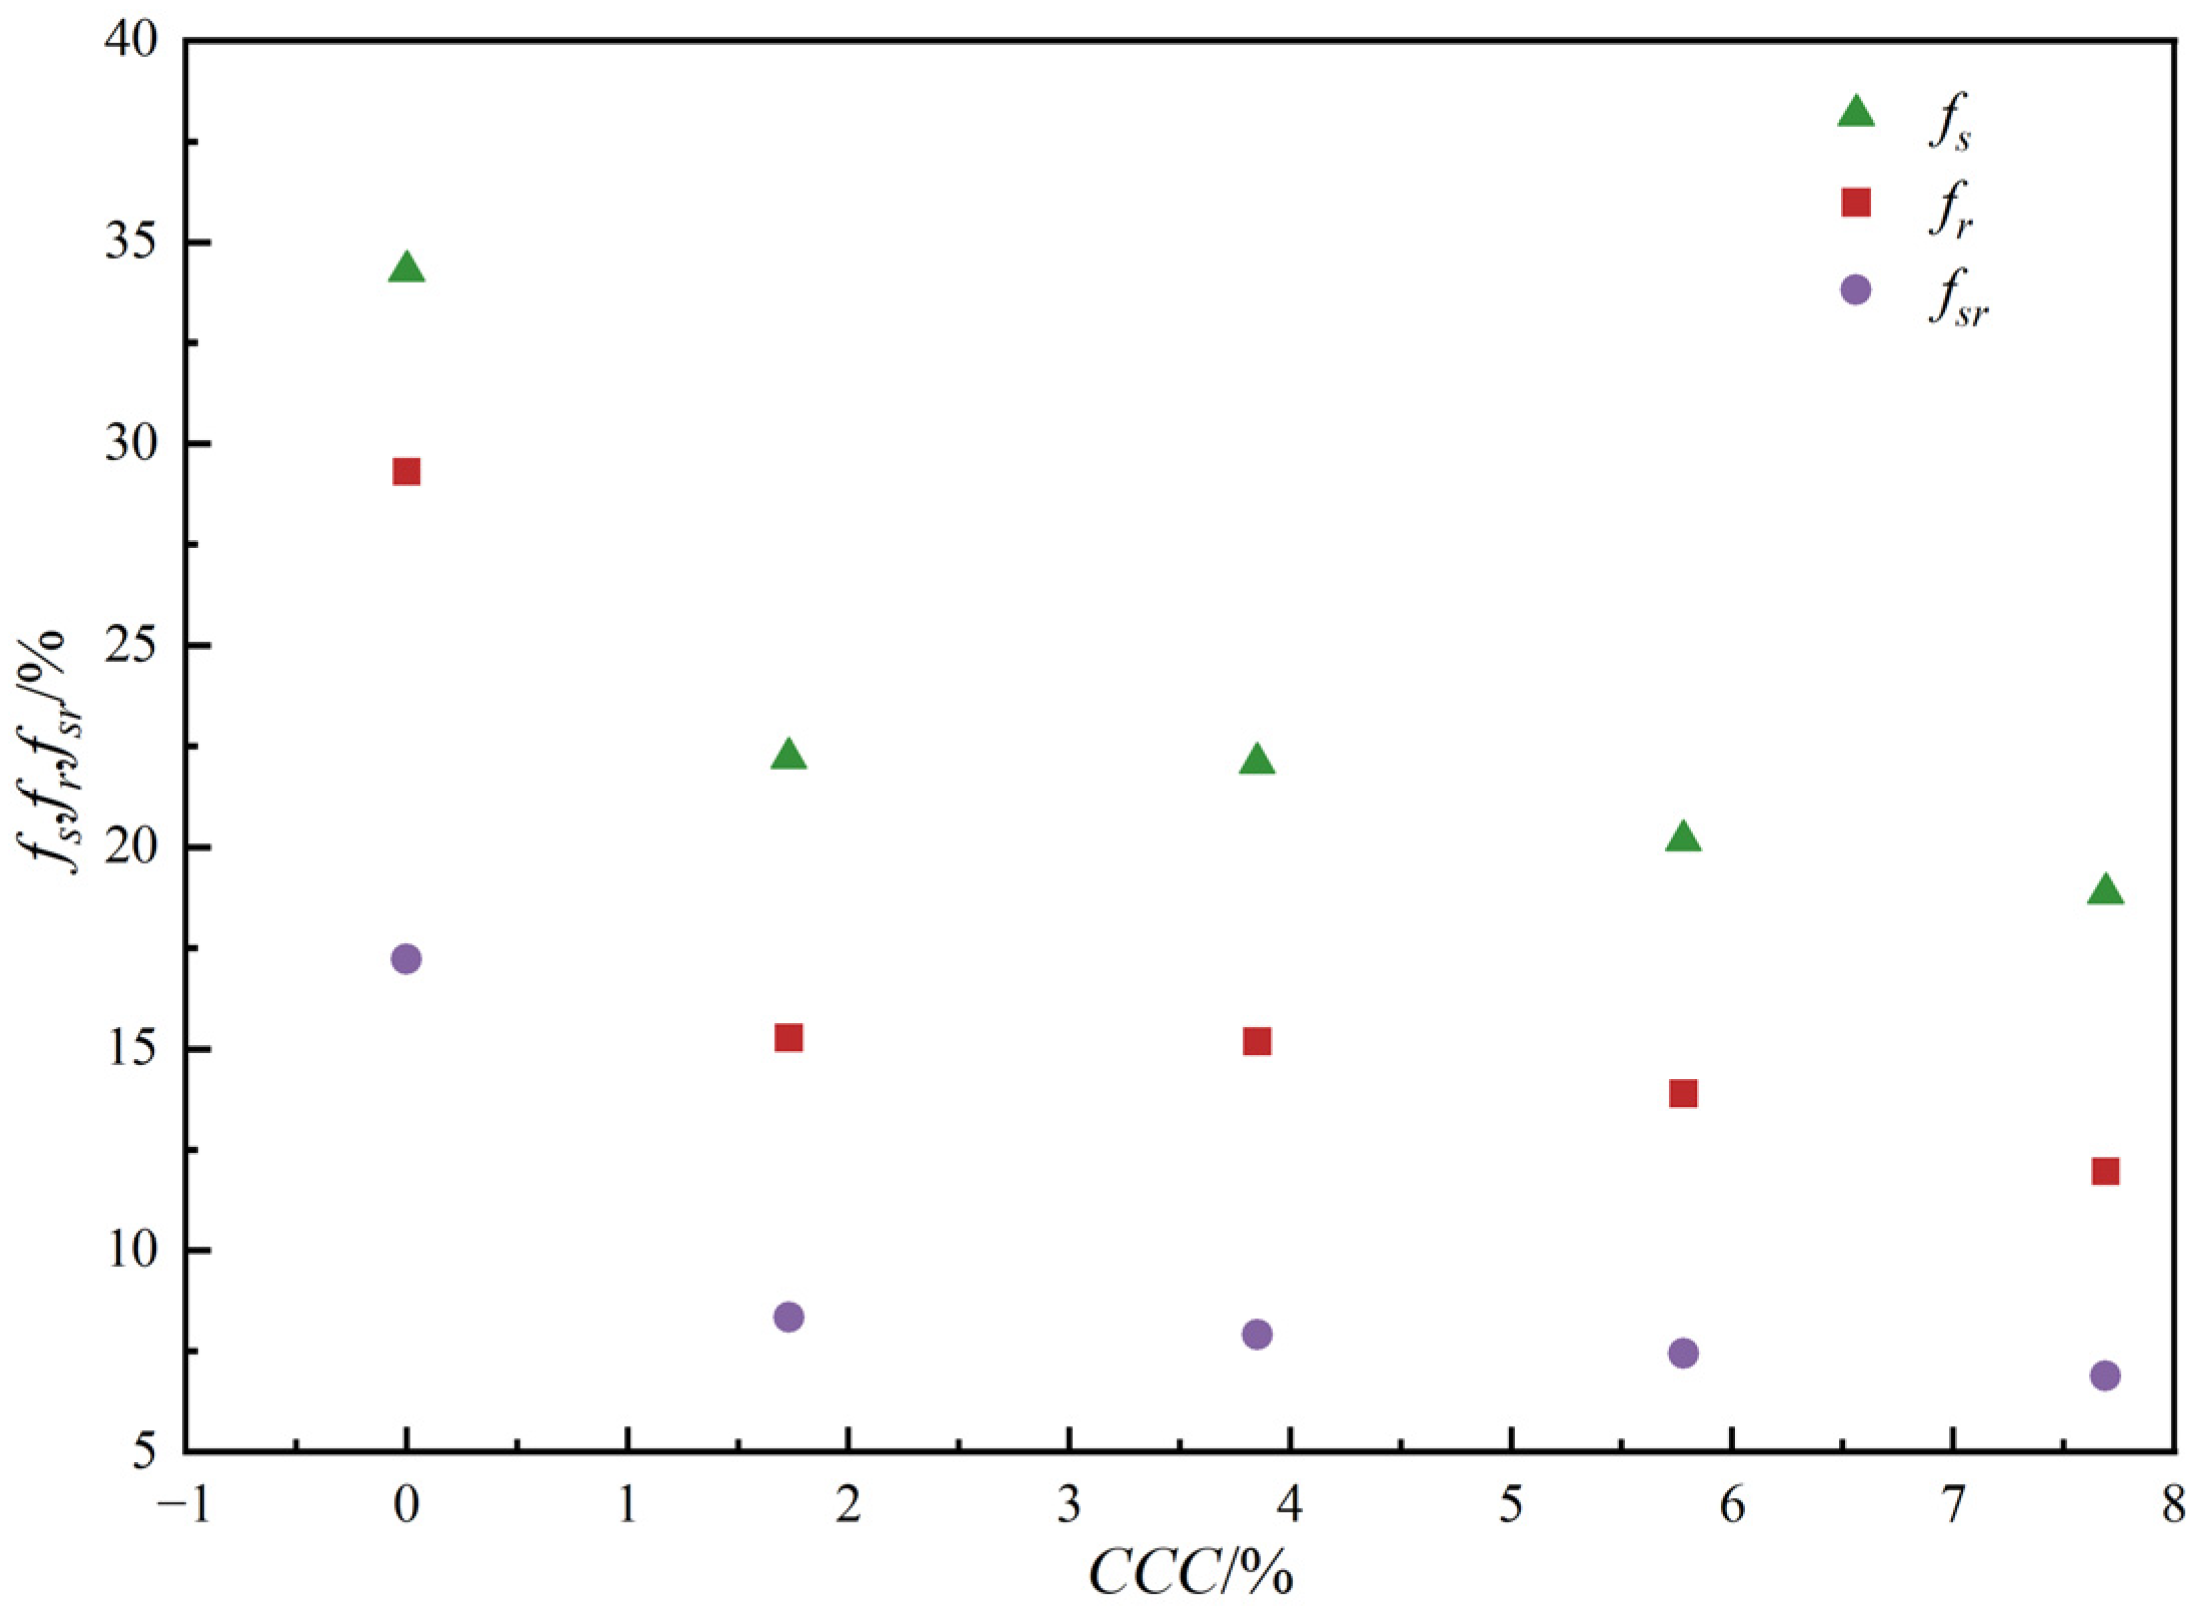
  • As the calcium carbonate content increases, so does the mechanical coordination number of the sand, signifying a more stable microstructure of the sand phase. The development of cracks involves varied fracture patterns corresponding to the different precipitation modes of calcium carbonate. In the case of contact cementing and bridging modes, shear cracks are the first to occur, followed by tensile cracks. In contrast, in the grain coating mode, tensile cracks appear first and are later followed by shear cracks. In both contact cementing and grain coating modes, the initial fractures occur between sand and calcium carbonate. However, in the bridging mode, fractures initially manifest between calcium carbonate particles themselves. Calcium carbonate contributes to a reduction in both sliding and rolling movements among sand particles.

Author Contributions

Conceptualization, Y.J.; methodology, J.Z., L.S. and Y.J.; validation, J.Z. and Y.J.; investigation, J.Z. and Y.J.; resources, L.X., L.S. and Y.C.; data curation, Y.J.; writing—original draft preparation, J.Z.; writing—review and editing, Y.J. and W.L.; visualization, J.Z. and Y.J.; supervision, L.X. and L.S.; project administration, L.X. and Y.C. All authors have read and agreed to the published version of the manuscript.

Funding

This research was funded by the Guangxi Science and Technology Major Program, grant number AA23062054.

Institutional Review Board Statement

Not applicable.

Informed Consent Statement

Not applicable.

Data Availability Statement

Datasets generated during the current study are available from the corresponding author on reasonable request.

Acknowledgments

We would like to extend our heartfelt thanks to Li Shen for their invaluable assistance in specimen preparation, which significantly contributed to the success of our research. We are also deeply grateful to Yifan Ji and Jingsong Zhou for their immense efforts in data collection and analysis, without which our findings would not have been as comprehensive. Lastly, we acknowledge Tongji University for providing the necessary equipment and facilities that were crucial to the completion of this project. We are truly thankful for all the support we have received.

Conflicts of Interest

Author Yaofei Cheng was employed by the company Guangxi Pinglu Canal Construction Co., Ltd., potentially relevant to the field studied in this paper. The remaining authors declare that all data and conclusions presented in this work are based on objective analysis and are not influenced by this relationship. The funders had no role in the design of the study; in the collection, analyses, or interpretation of data; in the writing of the manuscript; or in the decision to publish the results.

References

  1. Cheng, L.; Shahin, M.A.; Cord-Ruwisch, R. Bio-Cementation of Sandy Soil Using Microbially Induced Carbonate Precipitation for Marine Environments. Géotechnique 2014, 64, 1010–1013. [Google Scholar] [CrossRef]
  2. Kannan, K.; Bindu, J.; Vinod, P. Engineering Behaviour of MICP Treated Marine Clays. Mar. Georesources Geotechnol. 2020, 38, 761–769. [Google Scholar] [CrossRef]
  3. Yujie, L.; Zhen, G.; Zuqiang, Y.; Yilong, L.; MengTao, X. Experimental Study on the Reaction Process and Engineering Characteristics of Marine Calcareous Sand Reinforced by Eco-Friendly Methods. Appl. Ocean. Res. 2023, 138, 103641. [Google Scholar] [CrossRef]
  4. Whiffin, V.S.; Van Paassen, L.A.; Harkes, M.P. Microbial Carbonate Precipitation as a Soil Improvement Technique. Geomicrobiol. J. 2007, 24, 417–423. [Google Scholar] [CrossRef]
  5. Zhang, Q.; Ye, W.; Liu, Z.; Wang, Q.; Chen, Y. Influence of Injection Methods on Calcareous Sand Cementation by EICP Technique. Constr. Build. Mater. 2023, 363, 129724. [Google Scholar] [CrossRef]
  6. Ji, Y.; Xie, L.; Xiao, J.; Zheng, Y.; Ma, S.; Pan, T. Mechanical Properties and Acoustic Emission Characteristics of Microbial Cemented Backfill with Various Particle Size Distributions of Recycled Aggregates. Constr. Build. Mater. 2024, 417, 135269. [Google Scholar] [CrossRef]
  7. Chu, J.; Ivanov, V.; Stabnikov, V.; Li, B. Microbial Method for Construction of an Aquaculture Pond in Sand. Géotechnique 2013, 63, 871–875. [Google Scholar] [CrossRef]
  8. Chu, J.; Ivanov, V.; Naeimi, M.; Stabnikov, V.; Liu, H.-L. Optimization of Calcium-Based Bioclogging and Biocementation of Sand. Acta Geotech 2014, 9, 277–285. [Google Scholar] [CrossRef]
  9. Konstantinou, C.; Wang, Y.; Biscontin, G. A Systematic Study on the Influence of Grain Characteristics on Hydraulic and Mechanical Performance of MICP-Treated Porous Media. Transp. Porous Media 2023, 147, 305–330. [Google Scholar] [CrossRef]
  10. Dejong, J.T.; Soga, K.; Kavazanjian, E.; Burns, S.; Van Paassen, L.A.; Al Qabany, A.; Aydilek, A.; Bang, S.S.; Burbank, M.; Caslake, L.F.; et al. Biogeochemical Processes and Geotechnical Applications: Progress, Opportunities and Challenges. Géotechnique 2013, 63, 287–301. [Google Scholar] [CrossRef]
  11. Martinez, B.C.; DeJong, J.T.; Ginn, T.R.; Montoya, B.M.; Barkouki, T.H.; Hunt, C.; Tanyu, B.; Major, D. Experimental Optimization of Microbial-Induced Carbonate Precipitation for Soil Improvement. J. Geotech. Geoenvironmental Eng. 2013, 139, 587–598. [Google Scholar] [CrossRef]
  12. Qabany, A.A.; Soga, K. Effect of Chemical Treatment Used in MICP on Engineering Properties of Cemented Soils. Géotechnique 2013, 63, 331–339. [Google Scholar] [CrossRef]
  13. Li, Y.; Guo, Z.; Wang, L.; Yang, H.; Li, Y.; Zhu, J. An Innovative Eco-Friendly Method for Scour Protection around Monopile Foundation. Appl. Ocean Res. 2022, 123, 103177. [Google Scholar] [CrossRef]
  14. Wang, Z.; Zhao, X.; Chen, X.; Cao, P.; Cao, L.; Chen, W. Mechanical Properties and Constitutive Model of Calcareous Sand Strengthened by MICP. J. Mar. Sci. Eng. 2023, 11, 819. [Google Scholar] [CrossRef]
  15. Wang, Z.; Chen, W.; Tong, Z.; Wu, W.; Chen, X.; Deng, X.; Xie, Y. Research on the Effect of Natural Seawater in Domesticating Bacillus Pasteurii and Reinforcing Calcareous Sand. J. Mar. Sci. Eng. 2024, 12, 542. [Google Scholar] [CrossRef]
  16. Li, Y.; Guo, Z.; Wang, L.; Ye, Z.; Shen, C.; Zhou, W. Interface Shear Behavior between MICP-Treated Calcareous Sand and Steel. J. Mater. Civ. Eng. 2021, 33, 04020455. [Google Scholar] [CrossRef]
  17. Li, J.; Webb, C.; Pandiella, S.S.; Campbell, G.M. Discrete Particle Motion on Sieves—A Numerical Study Using the DEM Simulation. Powder Technol. 2003, 133, 190–202. [Google Scholar] [CrossRef]
  18. Zhou, B.; Huang, R.; Wang, H.; Wang, J. DEM Investigation of Particle Anti-Rotation Effects on the Micromechanical Response of Granular Materials. Granul. Matter 2013, 15, 315–326. [Google Scholar] [CrossRef]
  19. Zhao, J.; Jiang, M.; Soga, K.; Luding, S. Micro Origins for Macro Behavior in Granular Media. Granul. Matter 2016, 18, 59. [Google Scholar] [CrossRef]
  20. Wang, H.; Zhou, S.; Chen, Y.; Zhou, B.; Xue, S.; Zhu, X. Deformation Mechanisms of Coexistence Type Methane Hydrate-Bearing Sands: A Particulate-Scale Investigation. J. Nat. Gas Sci. Eng. 2022, 102, 104604. [Google Scholar] [CrossRef]
  21. Feng, K.; Montoya, B.M.; Evans, T.M. Discrete Element Method Simulations of Bio-Cemented Sands. Comput. Geotech. 2017, 85, 139–150. [Google Scholar] [CrossRef]
  22. Khoubani, A.; Evans, T.M.; Montoya, B.M. Particulate Simulations of Triaxial Tests on Bio-Cemented Sand Using a New Cementation Model. In Proceedings of the Geo-Chicago 2016: Sustainability, Energy, and the Geoenvironment, Chicago, IL, USA, 8 August 2016; pp. 84–93. [Google Scholar] [CrossRef]
  23. Lin, H.; Suleiman, M.T.; Brown, D.G. Investigation of Pore-Scale CaCO3 Distributions and Their Effects on Stiffness and Permeability of Sands Treated by Microbially Induced Carbonate Precipitation (MICP). Soils Found. 2020, 60, 944–961. [Google Scholar] [CrossRef]
  24. Gao, Y.; Hang, L.; He, J.; Chu, J. Mechanical Behaviour of Biocemented Sands at Various Treatment Levels and Relative Densities. Acta Geotech. 2019, 14, 697–707. [Google Scholar] [CrossRef]
  25. Zhang, A.; Dieudonné, A.-C. Effects of Carbonate Distribution Pattern on the Mechanical Behaviour of Bio-Cemented Sands: A DEM Study. Comput. Geotech. 2023, 154, 105152. [Google Scholar] [CrossRef]
  26. Wu, H.; Wu, W.; Liang, W.; Dai, F.; Liu, H.; Xiao, Y. 3D DEM Modeling of Biocemented Sand with Fines as Cementing Agents. Int. J. Numer. Anal. Methods Geomech. 2023, 47, 212–240. [Google Scholar] [CrossRef]
  27. Gu, X.; Zhang, J.; Huang, X. DEM Analysis of Monotonic and Cyclic Behaviors of Sand Based on Critical State Soil Mechanics Framework. Comput. Geotech. 2020, 128, 103787. [Google Scholar] [CrossRef]
  28. Xiao, Y.; Zhao, C.; Sun, Y.; Wang, S.; Wu, H.; Chen, H.; Liu, H. Compression Behavior of MICP-Treated Sand with Various Gradations. Acta Geotech. 2021, 16, 1391–1400. [Google Scholar] [CrossRef]
  29. Thornton, C. Numerical Simulations of Deviatoric Shear Deformation of Granular Media. Géotechnique 2000, 50, 43–53. [Google Scholar] [CrossRef]
  30. Huang, X.; O’Sullivan, C.; Hanley, K.J.; Kwok, C.Y. Discrete-Element Method Analysis of the State Parameter. Géotechnique 2014, 64, 954–965. [Google Scholar] [CrossRef]
  31. Huang, X.; Kwok, C.; Hanley, K.J.; Zhang, Z. DEM Analysis of the Onset of Flow Deformation of Sands: Linking Monotonic and Cyclic Undrained Behaviours. Acta Geotech. 2018, 13, 1061–1074. [Google Scholar] [CrossRef]
Figure 1. CT image of MICP-treated sand.
Jmse 12 01503 g001
Figure 2. Numerical sample preparation procedure of MICP-treated sand. (a) Sand particles are generated. (b) Calcium carbonate particles are generated. (c) Calcium carbonate particles are subject to random driving forces. (d) The state of the sample after the driving force is balanced. (e) Four deposition patterns are distinguished according to the location of calcium carbonate. (f) MICP-treated sand with coexisting calcium carbonate precipitation patterns.
Jmse 12 01503 g002aJmse 12 01503 g002b
Figure 3. Particle size distributions of sand.
Jmse 12 01503 g003
Figure 4. Comparison of (a) stress–strain behavior and (b) volumetric deformation with numerical simulation and test results for untreated sand samples with different relative densities.
Jmse 12 01503 g004
Figure 5. Comparison of (a) stress–strain behavior and (b) volumetric deformation with numerical simulation and test results for MICP-treated sand samples with different calcium carbonate contents.
Jmse 12 01503 g005
Figure 6. (a) Stress–strain curves and (b) volume change curves of untreated sand samples with different relative densities and MICP-treated sand samples with different calcium carbonate contents.
Jmse 12 01503 g006
Figure 7. Four precipitation modes with different calcium carbonate contents: (a) accumulative percentages; (b) numbers.
Jmse 12 01503 g007
Figure 8. SEM image of MICP-treated sand.
Jmse 12 01503 g008
Figure 9. Mechanical coordination numbers of MICP-treated sand samples with different calcium carbonate contents in coexisting calcium carbonate precipitation mode.
Jmse 12 01503 g009aJmse 12 01503 g009b
Figure 10. The mechanical coordination numbers of soil samples with different calcium carbonate contents.
Jmse 12 01503 g010
Figure 11. The crack development of MICP-treated sand samples with different calcium carbonate contents.
Jmse 12 01503 g011
Figure 12. The crack development in contact cementing mode of MICP-treated sand samples with different calcium carbonate contents.
Jmse 12 01503 g012
Figure 13. The crack development in bridging mode of MICP-treated sand samples with different calcium carbonate contents.
Jmse 12 01503 g013
Figure 14. The crack development in grain coatings of MICP-treated sand samples with different calcium carbonate contents.
Jmse 12 01503 g014aJmse 12 01503 g014b
Figure 15. Sliding and rolling contact fractions of samples with different calcium carbonate contents.
Jmse 12 01503 g015
Table 1. Simulation details of MICP-treated sand.
IDInitial Relative
Density of Sand (%)
CCC (%)CD Experiment
MU-D33-C033.1%
MU-D54-C054.1%
MU-D74-C073.9%
MU-D90-C089.3%
MT-D33-C0.433.1%0.40
MT-D33-C0.7833.1%0.78
MT-D33-C1.5133.1%1.51
MT-D33-C1.7333.1%1.73
MT-D33-C3.8533.1%3.85
MT-D33-C5.7833.1%5.78
MT-D33-C7.6933.1%7.69
‘MU’ refers to a sample that has not been treated with MICP technology, ‘MT’ refers to a sample that has been treated with MICP technology, ‘D33’ refers to a sample with a relative density of about 33%, and ‘C3.85’ refers to a calcium carbonate content of 3.85%.
Table 2. Parameters used in DEM simulations.
ParametersValue
Density of sand2650 kg/m3
Normal stiffness of sand particles (kn)kn = k0 × r
Shear stiffness of sand particles (ks)
Normal-to-shear stiffness ratio of sand particles (α)
ks = α × kn
Rolling resistance coefficient of sand particles (μr)0.5
Density of carbonate2444 kg/m3
Sand–carbonate contact effective modulus12 × 108 Pa
Normal-to-shear stiffness ratio of sand–carbonate contacts2.0
Sand–carbonate bond effective modulus12 × 108 Pa
Normal-to-shear stiffness ratio of sand–carbonate contacts2.0
Sand–carbonate tensile strength24 × 106 Pa
Sand–carbonate cohesion12 × 108 Pa
Sand–carbonate friction angle26°
Carbonate–carbonate effective modulus12 × 108 Pa
Normal-to-shear stiffness ratio of carbonate–carbonate contacts2.0
Carbonate–carbonate bond effective modulus12 × 108 Pa
Normal-to-shear stiffness ratio of carbonate–carbonate contacts2.0
Carbonate–carbonate tensile strength24 × 106 Pa
Carbonate–carbonate cohesion12 × 108 Pa
Carbonate–carbonate friction angle26°
Disclaimer/Publisher’s Note: The statements, opinions and data contained in all publications are solely those of the individual author(s) and contributor(s) and not of MDPI and/or the editor(s). MDPI and/or the editor(s) disclaim responsibility for any injury to people or property resulting from any ideas, methods, instructions or products referred to in the content.

