Article

The Effects of Controlling Gas Escape and Bottom Current Activity on the Evolution of Pockmarks in the Northwest of the Xisha Uplift, South China Sea

1
Sanya Institute of South China Sea Geology, Guangzhou Marine Geological Survey, 2 Yumin Road, Sanya 572025, China
2
Guangzhou Marine Geological Survey, China Geological Survey, 1133 Haibin Road, Guangzhou 510075, China
*
Author to whom correspondence should be addressed.
J. Mar. Sci. Eng. 2024, 12(9), 1505; https://doi.org/10.3390/jmse12091505
Submission received: 20 July 2024 / Revised: 27 August 2024 / Accepted: 30 August 2024 / Published: 1 September 2024
(This article belongs to the Special Issue Advances in Marine Gas Hydrate Exploration and Discovery)

Abstract

:
Submarine pockmarks are typical indicators of submarine gas escape activity. The deep strata of the Xisha Uplift are rich in biogenic and thermogenic gas, accompanied by strong bottom current activity. Investigating the effects of controlling submarine gas escape and bottom current activity on the formation and development of pockmarks in the Xisha Uplift is significant for understanding the evolution of submarine topography and geomorphology. This study utilized high-resolution multibeam data to identify 261 submarine pockmarks in the northwest of the Xisha Uplift. These pockmarks were categorized based on their morphology into circular, elliptical, elongated, crescent-shaped, and irregular types. The diameters of pockmarks in the study area range from 0.21 to 4.96 km, with maximum depths reaching 30.88 m. Using high-resolution multi-channel seismic data, we conducted a detailed analysis of the subsurface strata characteristics of the pockmarks, identifying chaotic weak reflections, bright spots, and high-angle reflectors. We believe that deep gas in the northwest of the Xisha Uplift escapes to the seafloor through migration pathways, such as faults, fractures, and gas chimneys, resulting in the formation of submarine pockmarks. Bottom current activity has a significant impact on already-formed pockmarks. Crescent-shaped and elongated pockmarks in the Xisha Uplift are largely the result of bottom current modifications of pre-existing pockmarks.

1. Introduction

Submarine pockmarks are common seabed features along continental margins, characterized by gas leakage through migration pathways in the strata, eroding seabed surface sediments to form negative seabed topographies. They typically develop in fine-grained mud sediment areas on the seabed [1,2,3,4]. Crater-like “pockmarks” were first discovered in Canada in the 1970s [5]. With the advancement of marine exploration technology, an increasing number of submarine pockmarks have been observed in different marine areas around the world, such as the Bering Sea [6], the Norwegian Trench [7], the North Sea [8], the Baltic Sea [9], the Black Sea [10], the Santos Basin [11], the western continental margin of India [12], the Gulf of Mexico [13], and the South China Sea [14]. Most pockmarks range in diameter from 10 to 250 m. The smallest pockmarks have diameters of less than 5 m, while the largest can reach several kilometers [2]. The largest known pockmark has a diameter of 3210 m and a depth of 165.2 m [14]. Based on their planar distribution characteristics, pockmarks are classified into isolated pockmarks, pockmark groups, and pockmark strings. Morphologically, most pockmarks are circular or elliptical. Under the influence of geological processes or marine environments, they can also exhibit crescent-shaped (semi-circular) or elongated forms. Vertically, the strata beneath pockmarks typically display three main shapes, “V”, “U”, and “W”, with asymmetrical sides in most cases [15]. Due to the destabilization of deep-seated pressure, localized gas rapidly escapes upwards, potentially causing the formation of pockmarks in seabed surface sediments. Subsequent continued gas leakage leads to the sustained existence of pockmarks [16,17]. There are also viewpoints suggesting that bottom currents contribute to the formation and maintenance of pockmarks [18].
Submarine pockmark distribution is controlled by seabed geological structures such as overpressure-related structures, diapirs, pores, and faults [18]. These geological structures typically form pathways for gas migration and accumulation, leading to the gradual formation and development of pockmarks as the gas escapes. Mud diapirs and salt diapirs are diapiric structures driven by gravity sliding, gravity spreading, and differential compaction. Mud layers and salt layers are soft plastic layers that can easily deform due to gravitational differences and compressive forces, providing gas pathways with higher permeability than the surrounding sediments [19]. Landslides, polygonal faults, and tectonic faults all belong to sediment fractures, and they are formed under the influence of gravity, compressive forces, and tectonic forces, respectively. Pockmarks typically appear at the end of linear paths above faults and fault anticlines [15]. Gas chimneys, paleo-channels, paleo-pockmarks, and sediment waves are the preferred pathways for the release of subsurface overpressure gas.
In the northern South China Sea, several typical pockmarks have been identified in the Taixinan Basin [19], Yinggehai Basin [20], Qiongdongnan Basin [21], Guangle Uplift [14], and Zhongjiannan Basin [22]. A significant number of pockmarks have also developed in the northwestern Xisha Uplift, where deep strata are rich in gas. Yet, the processes of deep gas migration and escape leading to the formation of these pockmarks have not been thoroughly discussed, and the impact of strong bottom current activity on pockmark morphology in the Xisha Uplift has not been revealed. This study reports on the pockmarks located near the Ganquan Platform in the northwestern Xisha Uplift (Figure 1). Utilizing multibeam bathymetric data and high-resolution multi-channel seismic data, we provide a comprehensive description and classification of the morphological characteristics of these pockmarks. By analyzing the stratigraphic changes beneath the pockmarks and the surrounding seabed topographic variations, we investigate the effects of gas escape and strong bottom current activity on the pockmarks.

2. Geological Setting

The Xisha Uplift is one of the numerous continental blocks that formed during the evolution of the South China Sea, situated at the junction of the Indochina Block, the South China Block, and the South China Sea. To the north, it borders the Xisha Trough, to the east lies the Northwest Sub-basin, to the southeast is the Zhongsha Trough and the Zhongsha Block, to the south is the Southwest Sub-basin, and to the west, it faces the Guangle Uplift (Figure 1). Surrounding the Xisha Uplift are several Cenozoic basins, including the Qiongdongnan Basin, the Pearl River Mouth Basin, the Zhongjiannan Basin, the Beibu Gulf Basin, and the Yinggehai Basin (Figure 1). These basins were formed due to large-scale extensional and thinning processes along the northern margin of the South China Sea [24,25]. Gravity inversion data indicate that the average crustal thickness of the Xisha Uplift is approximately 23 km [26], which contrasts sharply with the significantly thin crust of the surrounding basins. For example, the crust in the Northwestern Sub-basin of the South China Sea is 6 km thick [23], and the continental crust in the Changhua Depression of the Qiongdongnan Basin has a minimum thickness of 2.8 km [27].
The sedimentary layer of the Xisha Uplift overlies a Precambrian metamorphic crystalline basement [28]. From the Triassic to the Late Cretaceous, the continental margin of the South China Block was influenced by the subduction of the Pacific Plate, resulting in large-scale magmatic structures and causing heterogeneity in the crust [23,29]. Subsequently, the extensional processes and magmatic activities during the Cenozoic disrupted the early crystalline basement structure, establishing the overall structural characteristics of the present-day Xisha Uplift [30]. The Neogene sediments of the Xisha Uplift are primarily derived from carbonate debris of biogenic reefs growing on the Xisha Uplift. Terrigenous clastics from the South China Block and the Indochina Block cannot cross the central sag of the Qiongdongnan Basin and the Guangle Uplift to reach the Xisha Uplift [31,32]. Previous studies have utilized high-resolution multi-channel seismic data to conduct sequence stratigraphic division of the Xisha Uplift. Five sequence boundaries have been identified in the strata since the Neogene, namely T60, T50, T40, T30, and T20. These sequence boundaries divide the strata into five sequences. T60 marks the base of the Early Miocene sequence, characterized by moderately continuous seismic reflections and interpreted as siliciclastic–carbonate mixed debris. T50 marks the base of the Middle Miocene sequence, characterized by strong-amplitude mound-shaped reflections and interpreted as carbonates. T40 marks the base of the Late Miocene sequence, characterized by moderately continuous seismic reflections and interpreted as carbonate debris from biogenic reefs. T30 marks the base of the Pliocene sequence, and T20 marks the base of the Quaternary sequence. Both the Pliocene and Quaternary sequences display similar moderately continuous seismic reflections and are interpreted as semi-pelagic sediments [33,34,35,36] (Figure 2).
The study area is located in the northwestern part of the Xisha Uplift, between the Ganquan Platform and the Xisha Islands, with water depths ranging from approximately 800 m to 1300 m (Figure 3). The study area lies at the junction of the Xisha Uplift and the Xisha Trough, which is significantly affected by extensional processes, resulting in well-developed underground strata porosity and faults.

3. Materials and Methods
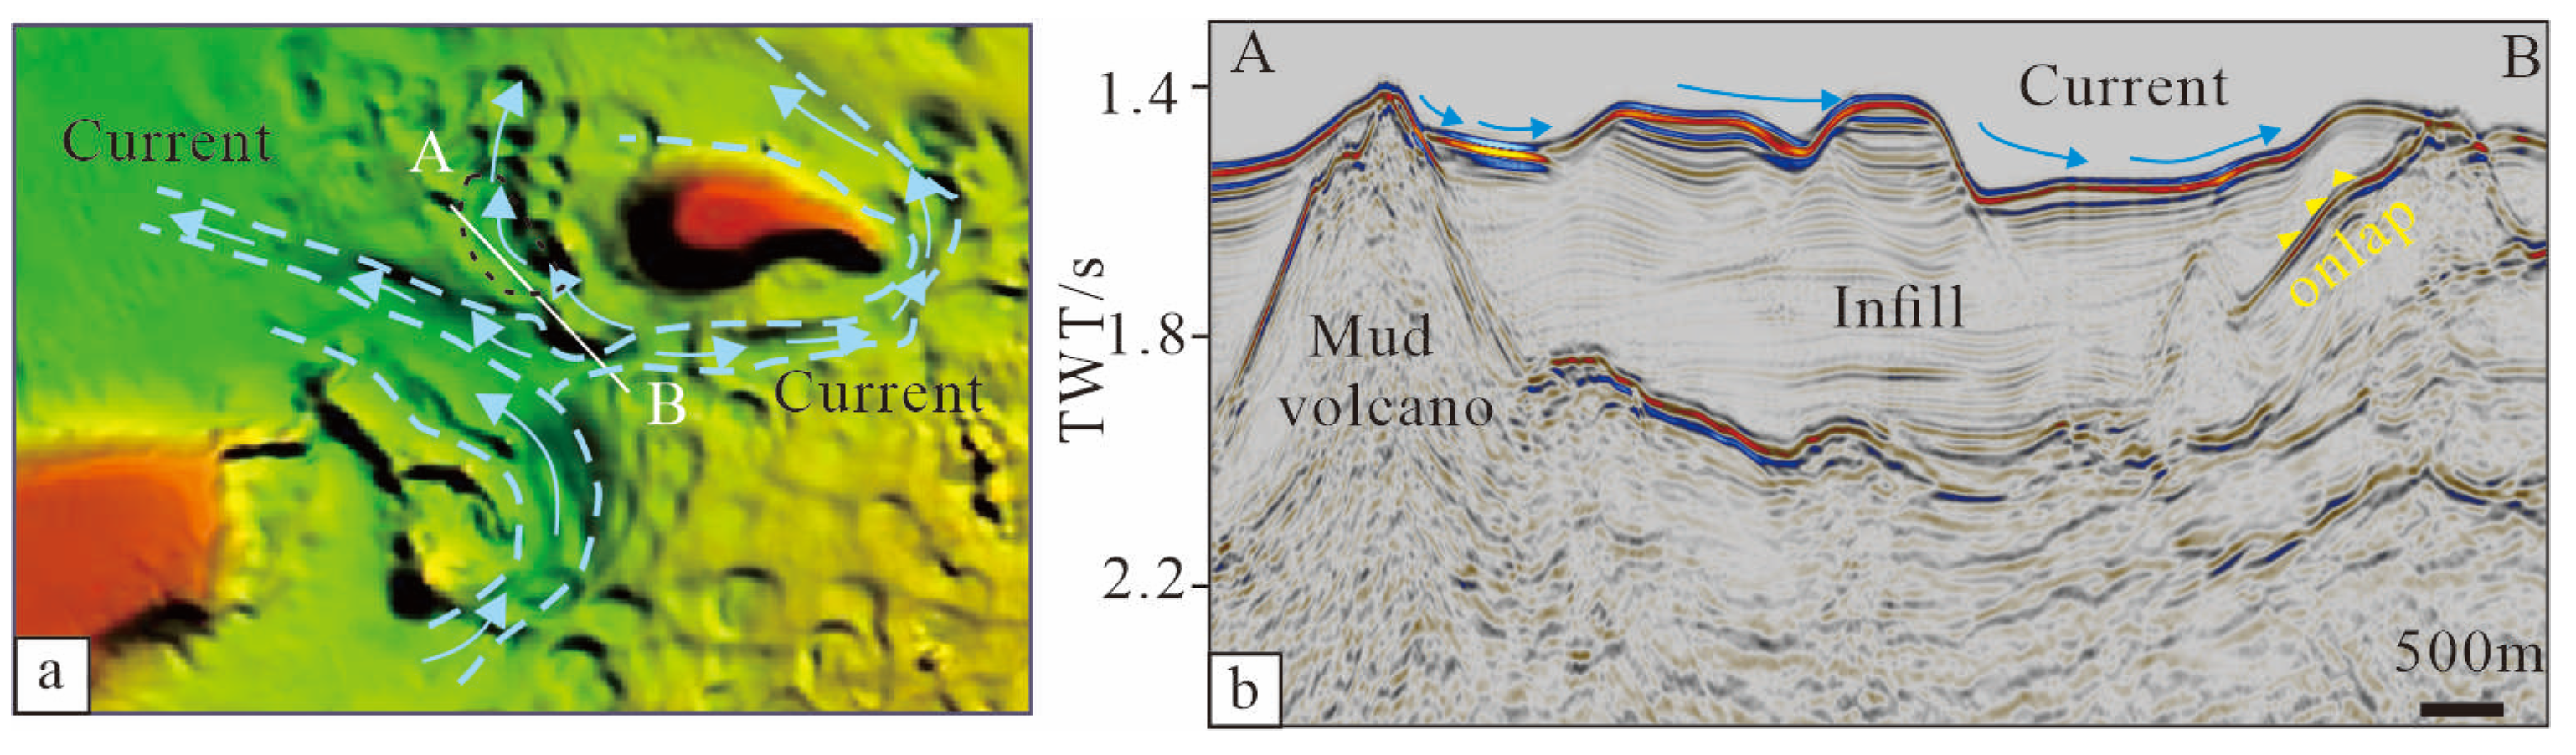
The base map for Figure 1 uses the 1 × 1 arc-minute global terrain data from GEBCO (General Bathymetric Chart of the Oceans), which is available for free download. The multibeam bathymetry data and 2D multi-channel reflection seismic data were provided by the Guangzhou Marine Geological Survey (GMGS), offering reliable information for describing the morphology, distribution, and stratigraphic characteristics of the pockmarks. The water depth in the study area ranges from approximately −300 m to −1500 m. Raster grids generated from the multibeam bathymetry data have a resolution of about 50 m × 50 m, with a vertical resolution of approximately 3‰ of the water depth. The 2D reflection multi-channel seismic data were collected using a single-cable acquisition system with non-zero offset, single-side shooting, and single-side receiving. The seismic source used was an airgun array, and the streamer was 4500 m long with a channel separation of 6.25 m. The source distance is 25 m, resulting in a 175 m migration distance for the seismic system. Data processing was accomplished using the Omega processing platform. The original seismic data were interpreted using the Petrel 2024 E&P software platform (Mark of Schlumberger). All vertical scales for the seismic profiles shown in the study represent two-way travel time.

4. Results

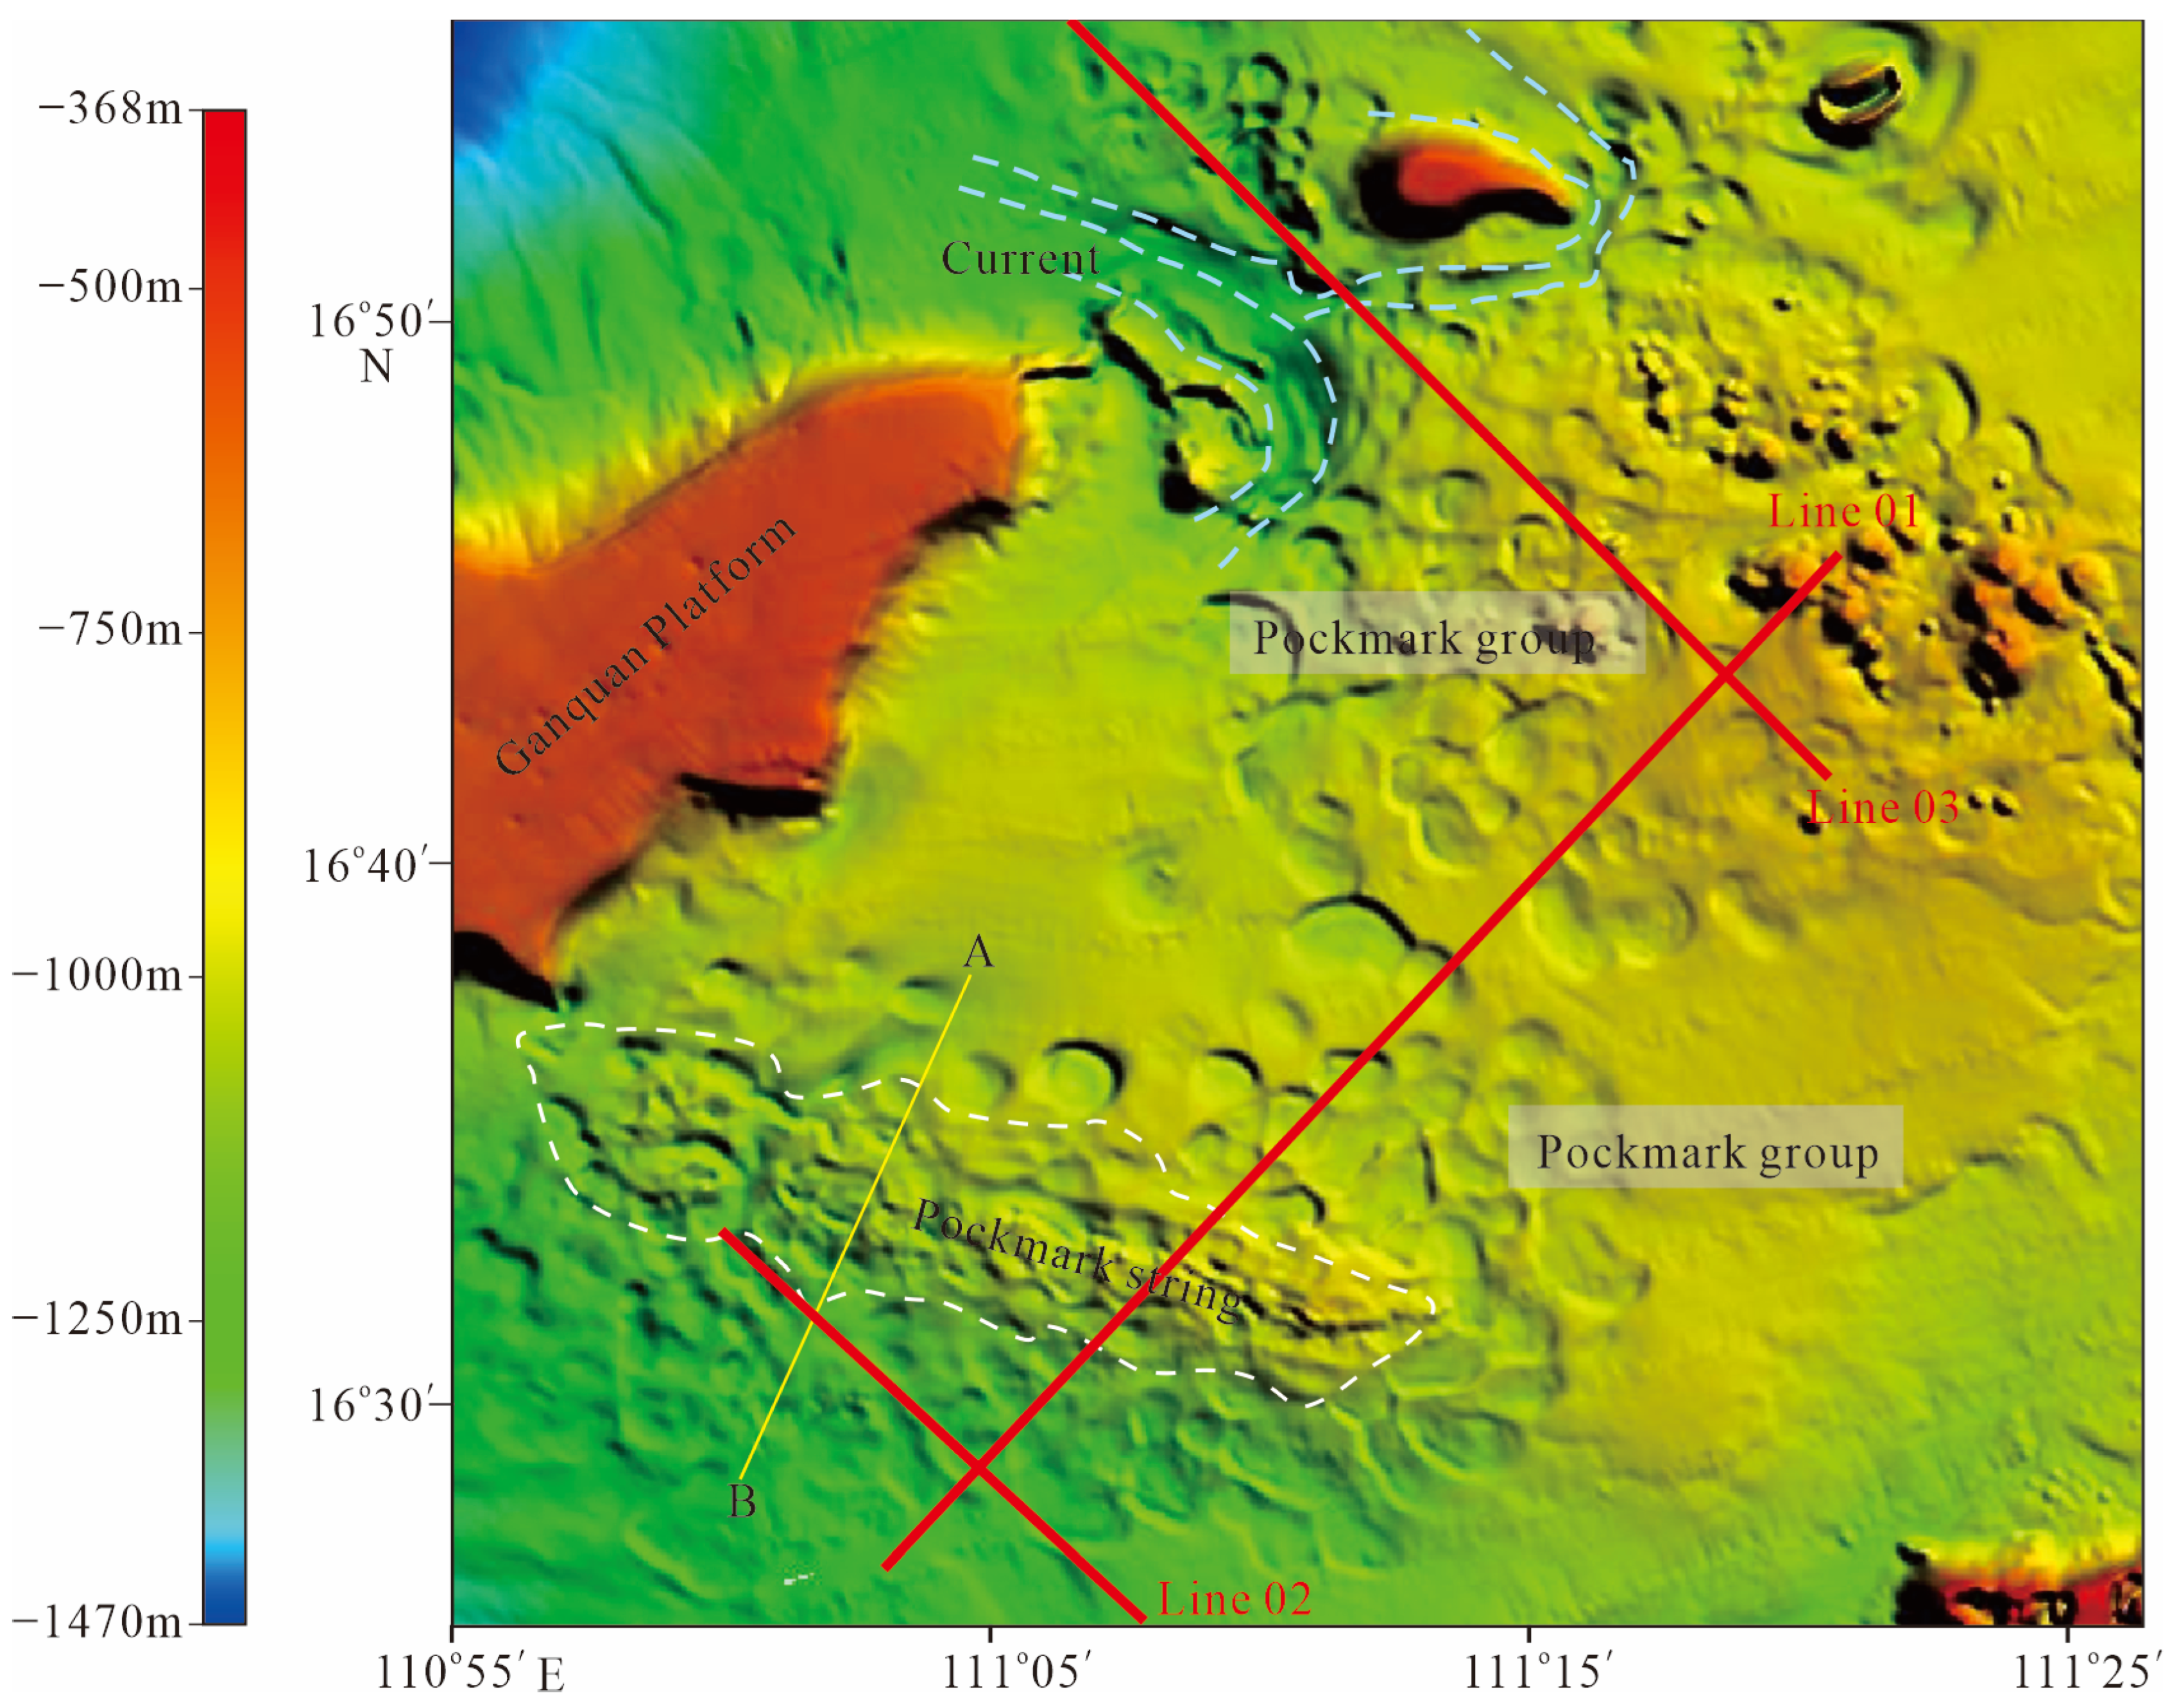
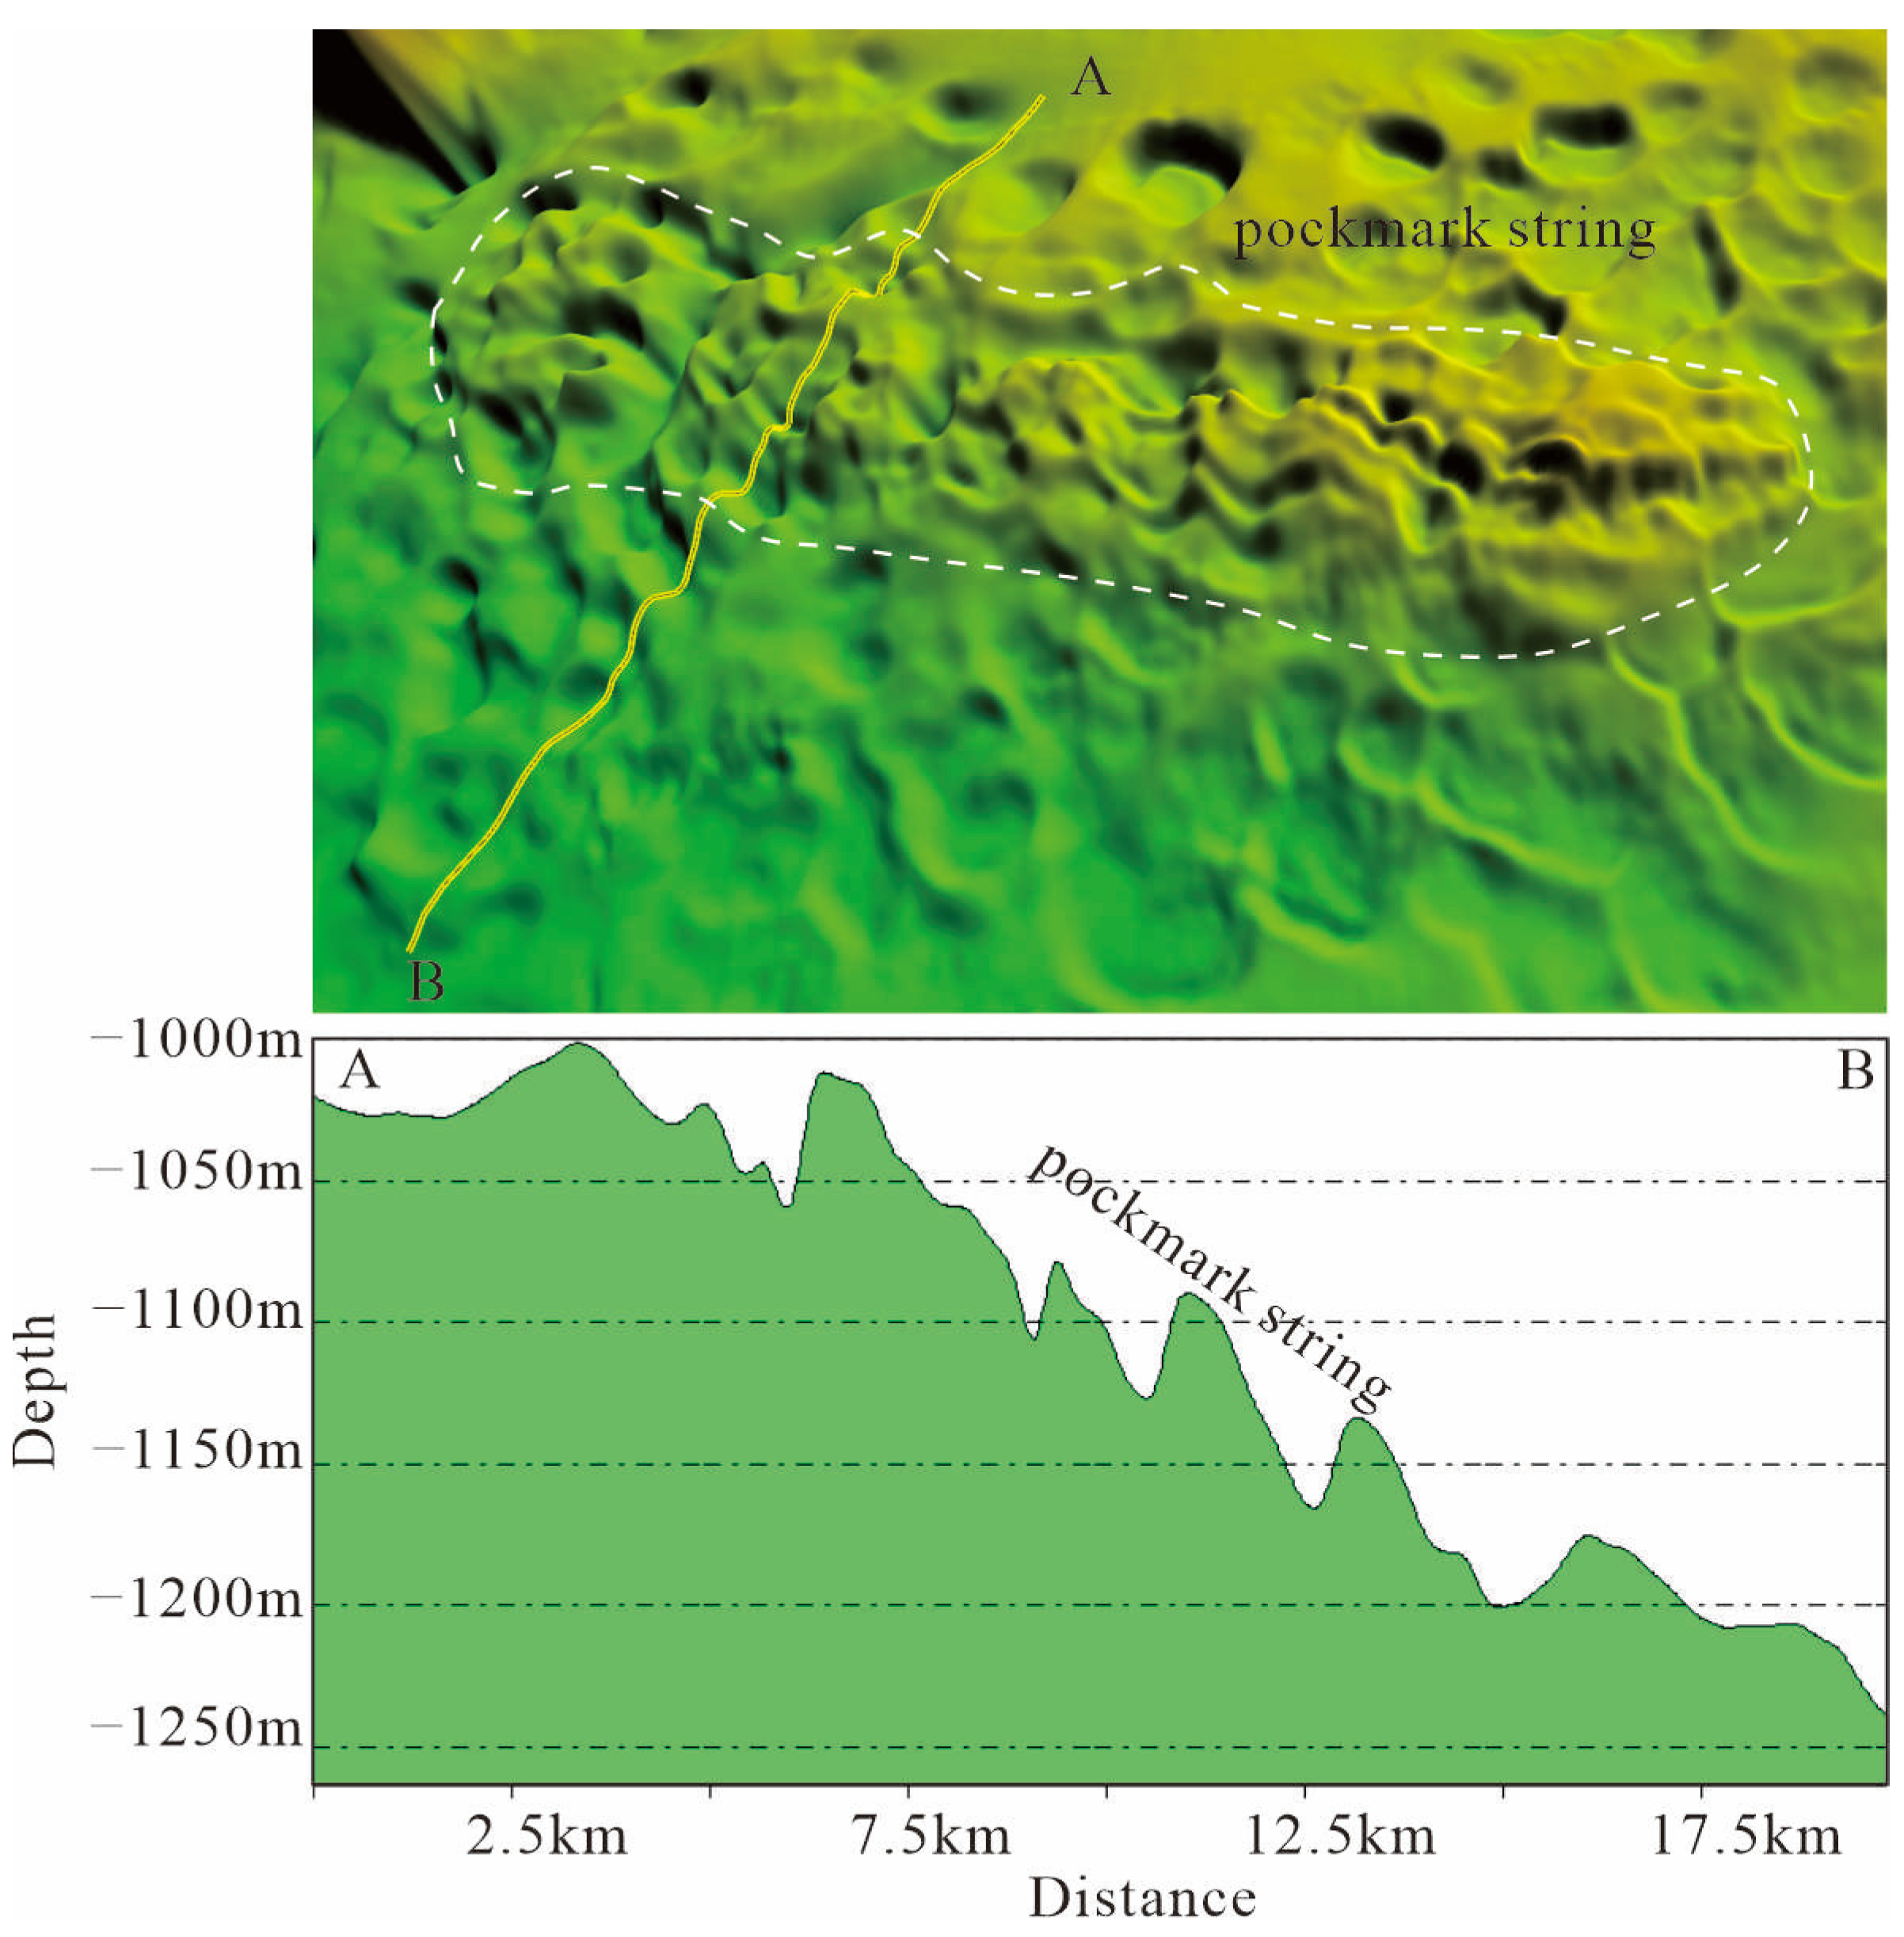
4.1. Interpretation of Multibeam Bathymetry Data

Pockmarks can be classified by their planar shapes into circular pockmarks, elliptical pockmarks, crescent-shaped pockmarks, elongated pockmarks, annular pockmarks, and irregular pockmarks [22,37]. Multibeam bathymetric data visually represent the geomorphic features of the seafloor in the study area (Figure 3). According to the bathymetric data, the morphology of the submarine pockmarks is delineated, compared, and verified, serving as a basis for morphological statistical research. In the study area, we identified 261 pockmarks, including 69 circular, 79 elliptical, 40 irregular, 28 crescent-shaped, 27 elongated, and 18 annular pockmarks (Table 1).
These pockmarks are distributed in pockmark groups and pockmark strings, with pockmark groups being the predominant form covering the study area. The pockmark strings are located in the southeastern part of the study area (Figure 3). The pockmarks within the string are generally smaller in area, mainly consisting of circular and irregular pockmarks distributed along the 800 m–1200 m depth transition zone (Figure 3). The pockmark strings are oriented in a northwest–southeast direction.
We calculated the long axes, short axes, perimeters, surface areas, volumes, and depths of the pockmarks and then conducted a statistical analysis. The results are shown in Figure 4. In the study area, the long axes of the pockmarks range from 0.28 to 4.96 km, the short axes range from 0.21 to 2.98 km, the perimeters range from 0.79 to 12.69 km, the areas range from 0.02 to 10.88 km2, and the volumes range from 0.34 to 80.43 km3 (Table 1). Hovland classifies pockmarks into small, large, and extra-large categories based on diameter. Small pockmarks have a diameter of less than 250 m, large pockmarks range from 250 to 1000 m in diameter, and extra-large pockmarks have a diameter greater than 1000 m [2,37]. In the study area, large pockmarks account for 47.2%, extra-large pockmarks account for 52.7%, while small pockmarks constitute only 0.1%. The depths of the pockmarks range between 8.965 and 31.002 m, with pockmarks less than 10 m deep accounting for 11% of the total, those with a depth of 10 to 25 m accounting for 76%, and those deeper than 25 m accounting for 13%.
Statistical studies of various types of pockmarks distributed in the study area, including parameters such as the diameter and depth, show that after first-order linear fitting, the highest linear regression coefficient is observed for irregular pockmarks (R2 = 0.3186) (Figure 4). This indicates that there is no significant linear relationship between the diameters and depths of circular, elliptical, crescent, elongated, annular, and irregular pockmarks in the study area. However, by fitting the linear relationship between pockmark perimeter and topographic slope, a good second-order correlation is found with R2 = 0.6164, indicating that larger topographic slopes generally correspond to smaller pockmark perimeters. This correlation is mainly due to the large pockmark string south of the Ganquan Platform. In this area, the water depth varies by nearly 250 m, with maximum slopes exceeding 1°. The pockmark string is primarily composed of small-scale pockmarks with smaller diameters and shallower depths densely distributed in a banded pattern (Figure 5).

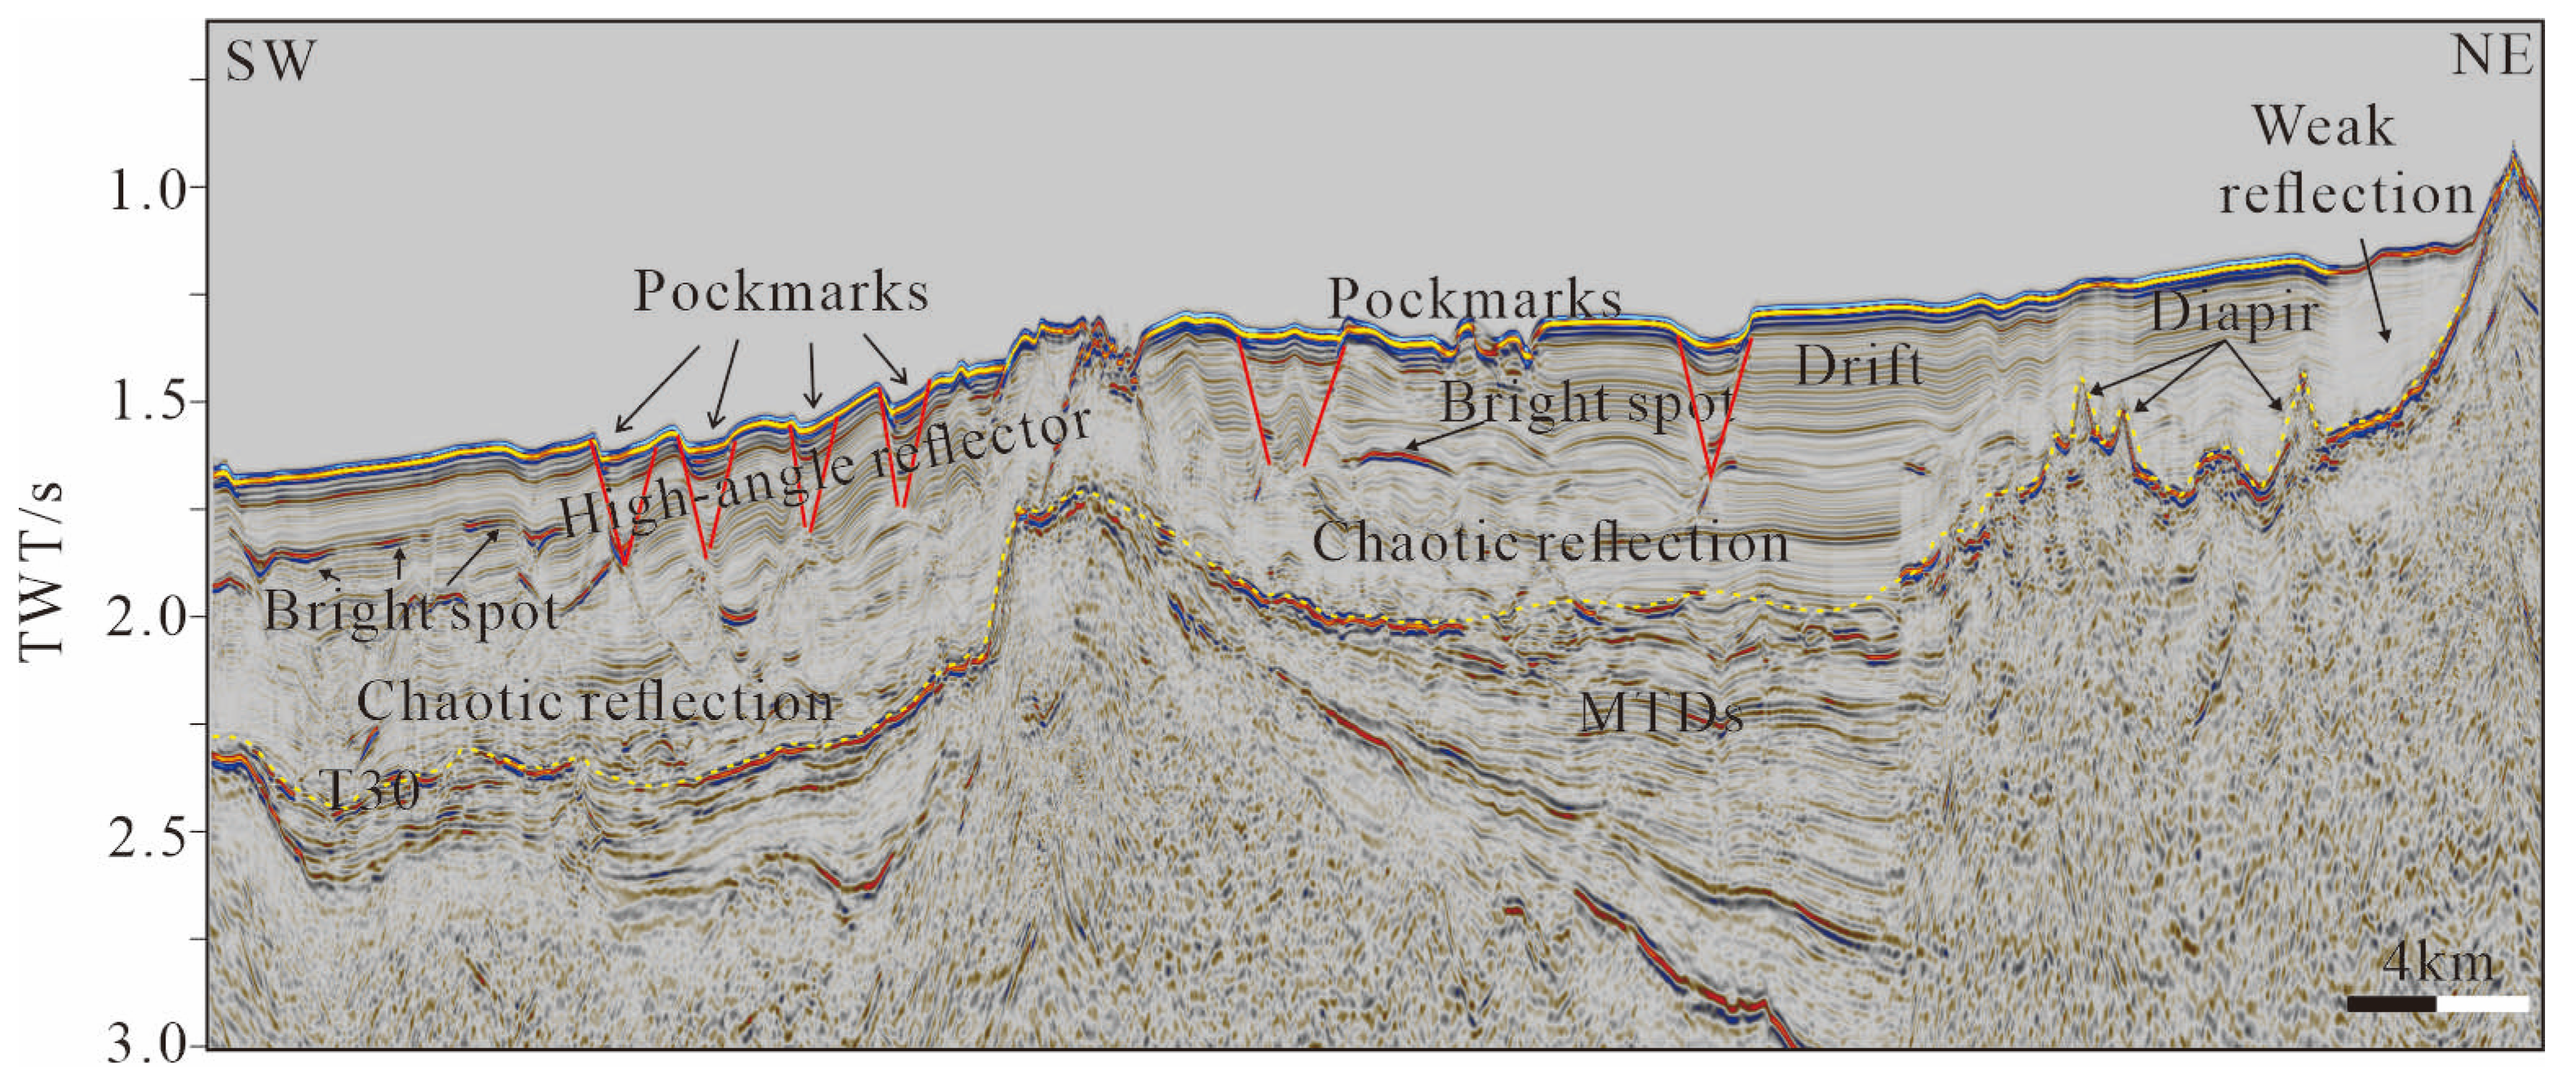
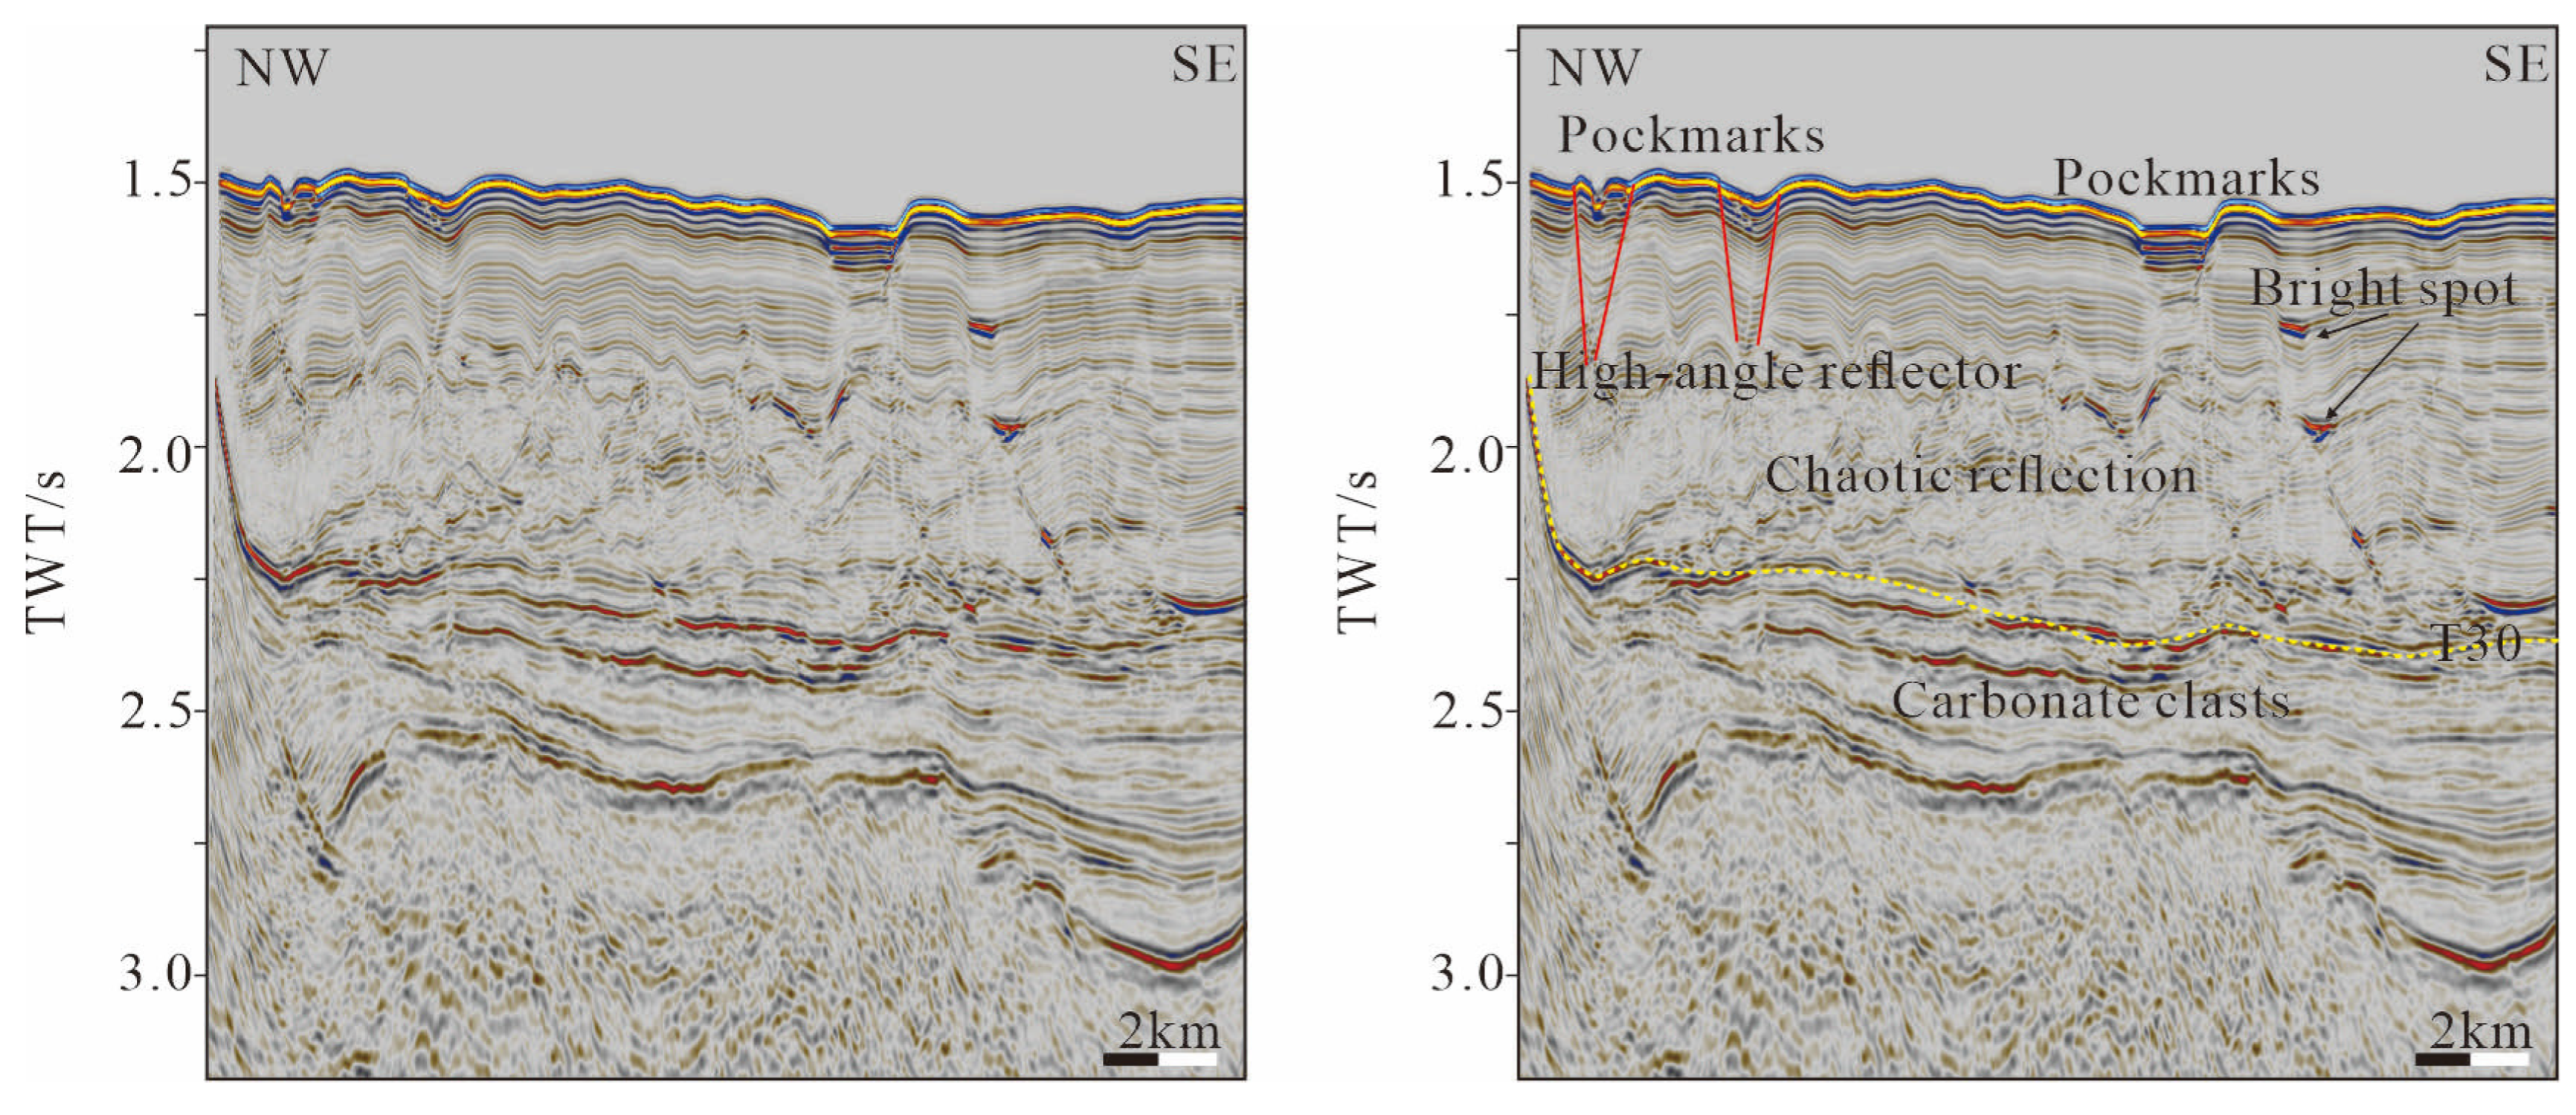
4.2. Interpretation of 2D Seismic Data

The seismic facies of lines 01, 02, and 03 in the study area were identified, revealing significant differences between the seismic facies in the southern and northern parts of the study area (Figure 6). The most notable difference is that paleo-volcanic activity is less pronounced in the southern region compared to the northern region (Figure 7 and Figure 8). Furthermore, drift development is common in the northern region, while it is less common in the southern region (Figure 6 and Figure 8). Detailed descriptions of the seismic facies in both the southern and northern parts are provided below.

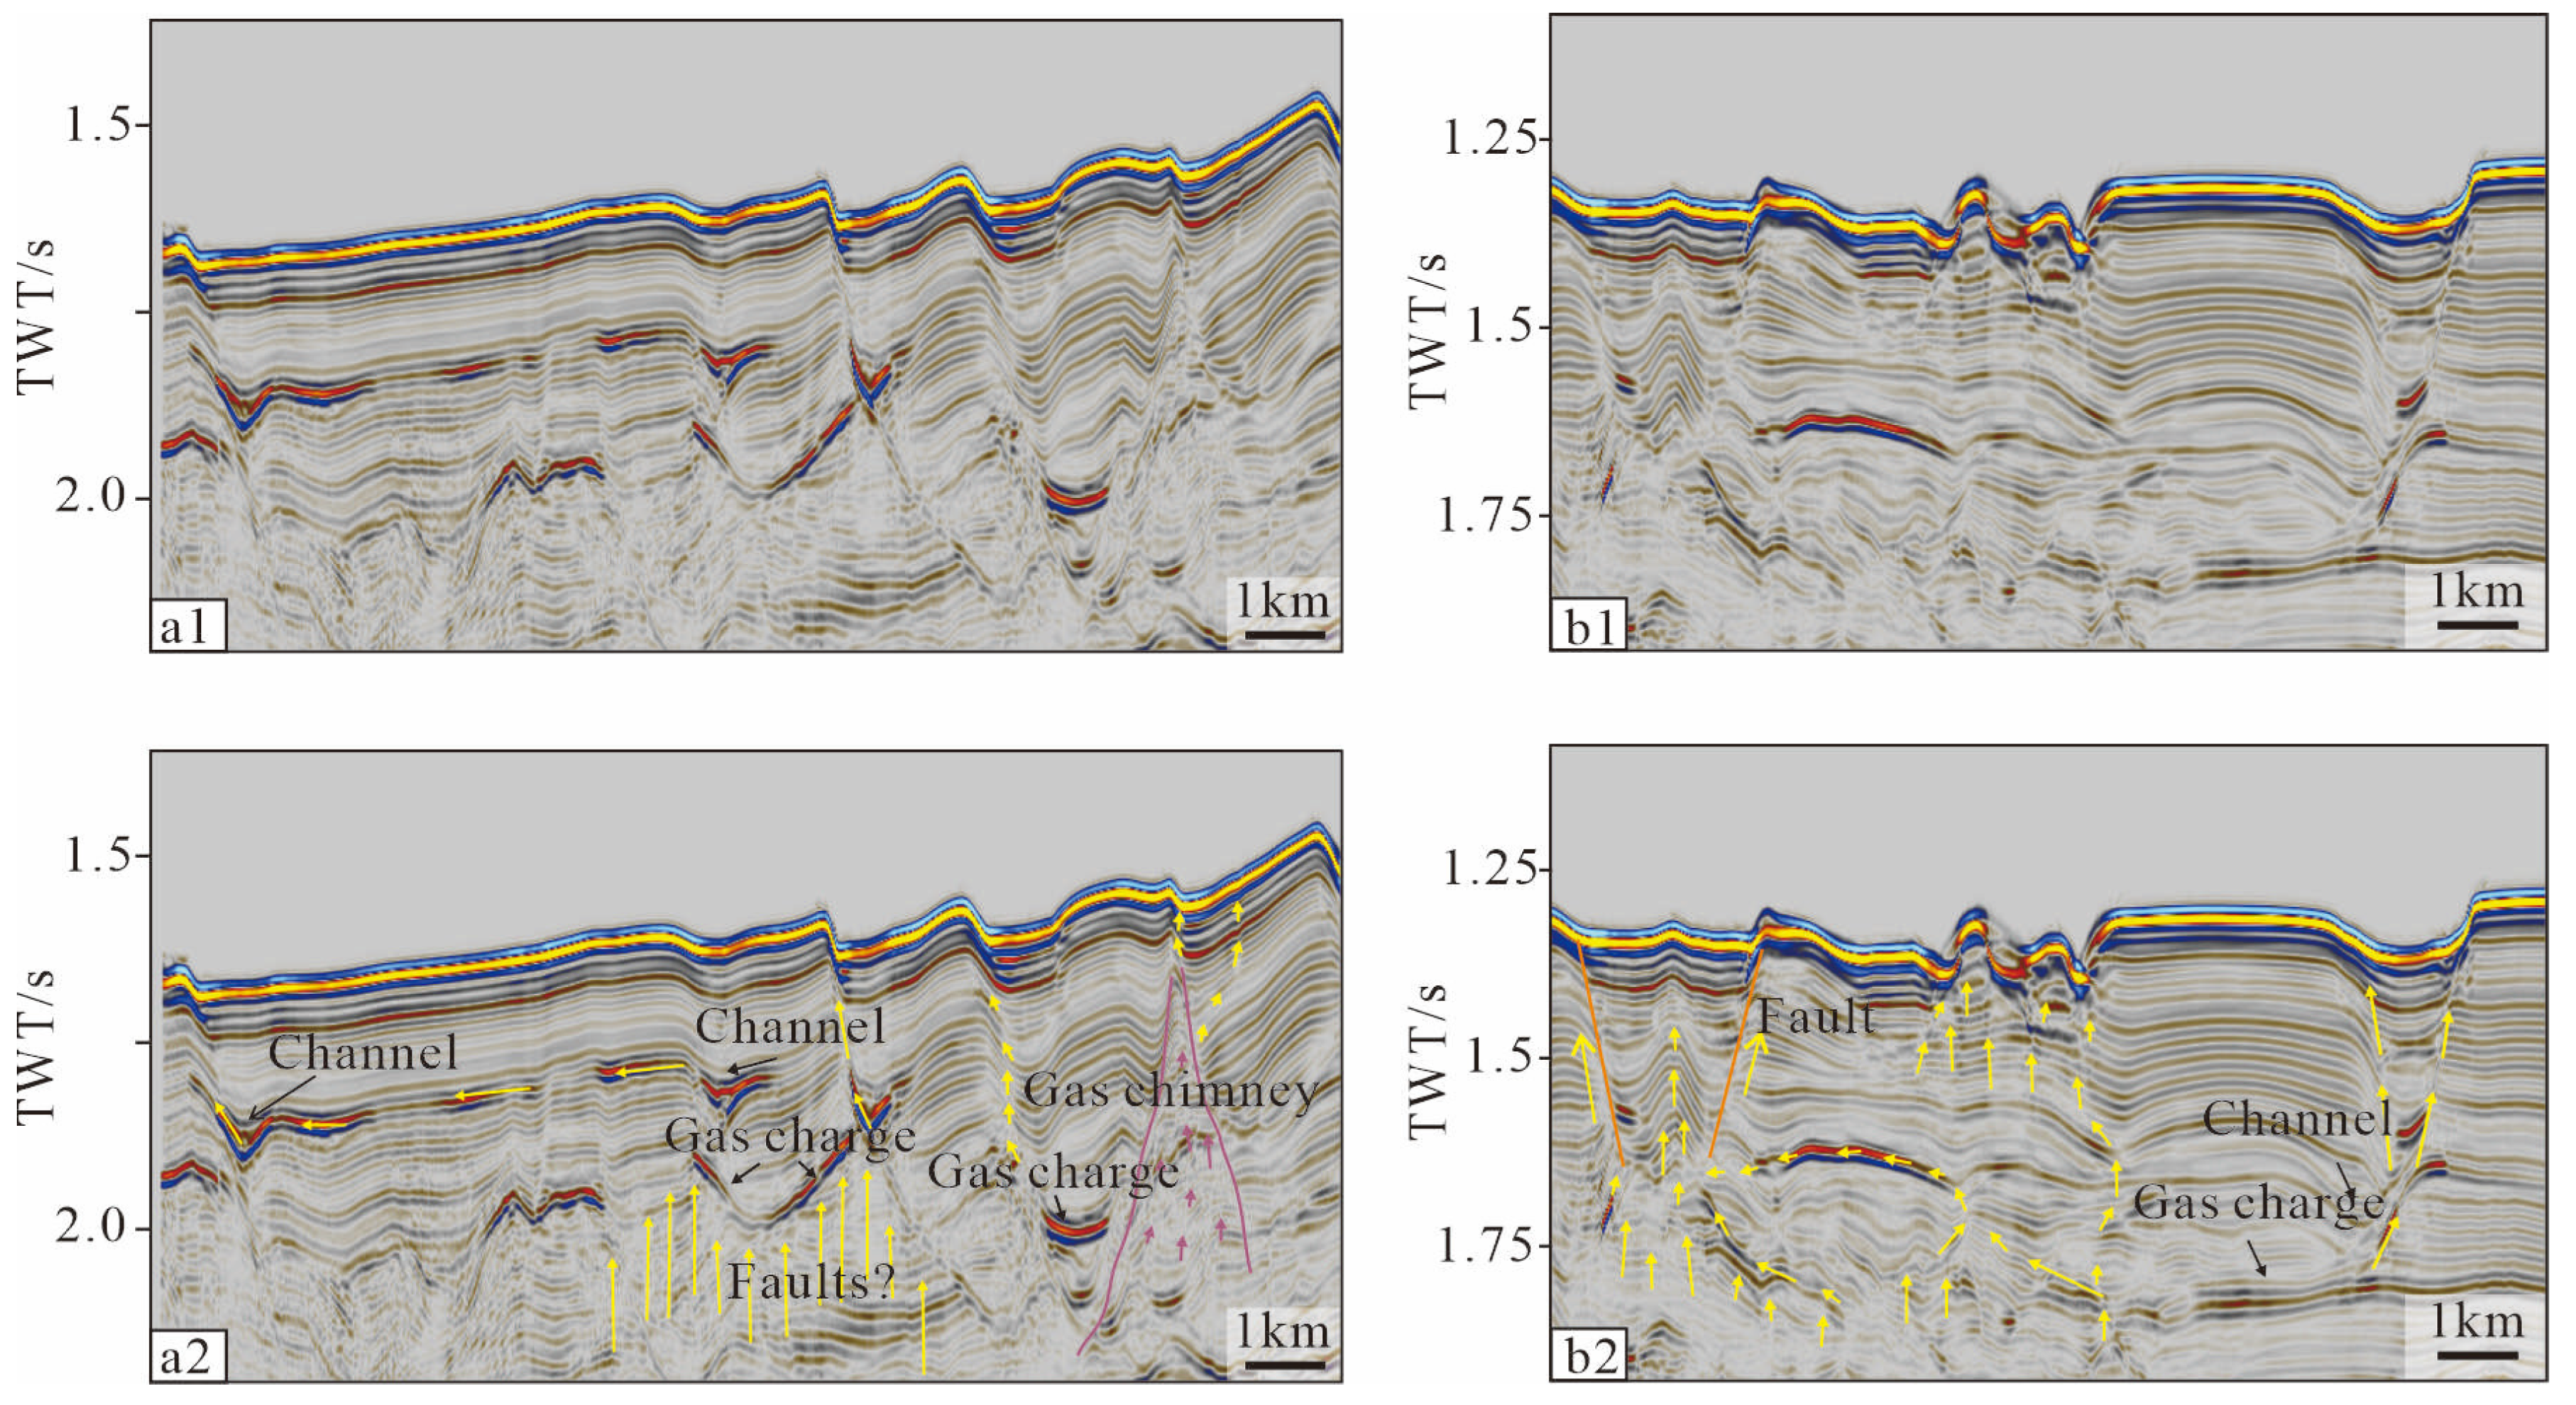
4.2.1. Seismic Facies in the Southern Part of the Study Area

In the southern part of the study area, Mass Transport Deposits (MTDs), diapir structures, and carbonate debris have been identified in strata below T30. Pockmarks appear as concave isochronous axes in seismic profiles. The strata beneath the pockmarks exhibit high-amplitude, high-continuity, parallel, curved, and medium-frequency reflection axes (Figure 6 and Figure 7). Several distinctive seismic facies have also been identified in the seismic profiles, such as chaotic weak reflections, bright spots, and high-angle reflectors.
Chaotic weak reflections exhibit a low amplitude and poor continuity, primarily occurring around 2.2–2.0 s on the seismic profile, and they are prevalent throughout the southern region, overlaying T30. When the gas content in the strata is high, it increases the wavelength of seismic waves, resulting in a decrease in frequency. Chaotic weak reflections generally exhibit lower frequencies compared to the underlying strata, indicating a presence of gas within these reflections. Bright spots are characterized by punctiform or short-line, high-amplitude, and low-frequency anomalies in the seismic profiles. When gas accumulates in the strata, the acoustic impedance significantly increases, the frequency of seismic pulses correspondingly decreases, and the amplitude increases. Because gas usually accumulates only in strata with high porosity, they appear as punctiform or short-line anomalies on stacked seismic profiles [38,39]. Bright spots are commonly found near pockmarks, and the underlying strata are chaotic weak reflections, while the overlying strata show a moderate amplitude, strong continuity, and high-frequency parallel reflections. High-angle reflectors are identified in the lateral flanks of the strata beneath the pockmarks, characterized by low-amplitude, discontinuous, and low-frequency seismic facies. When gas migrates upward, it deforms the strata, resulting in curved isochronous axes in the seismic profile. These regions with higher porosity gradually connect to form pathways for gas escape, presenting as high-angle reflectors.

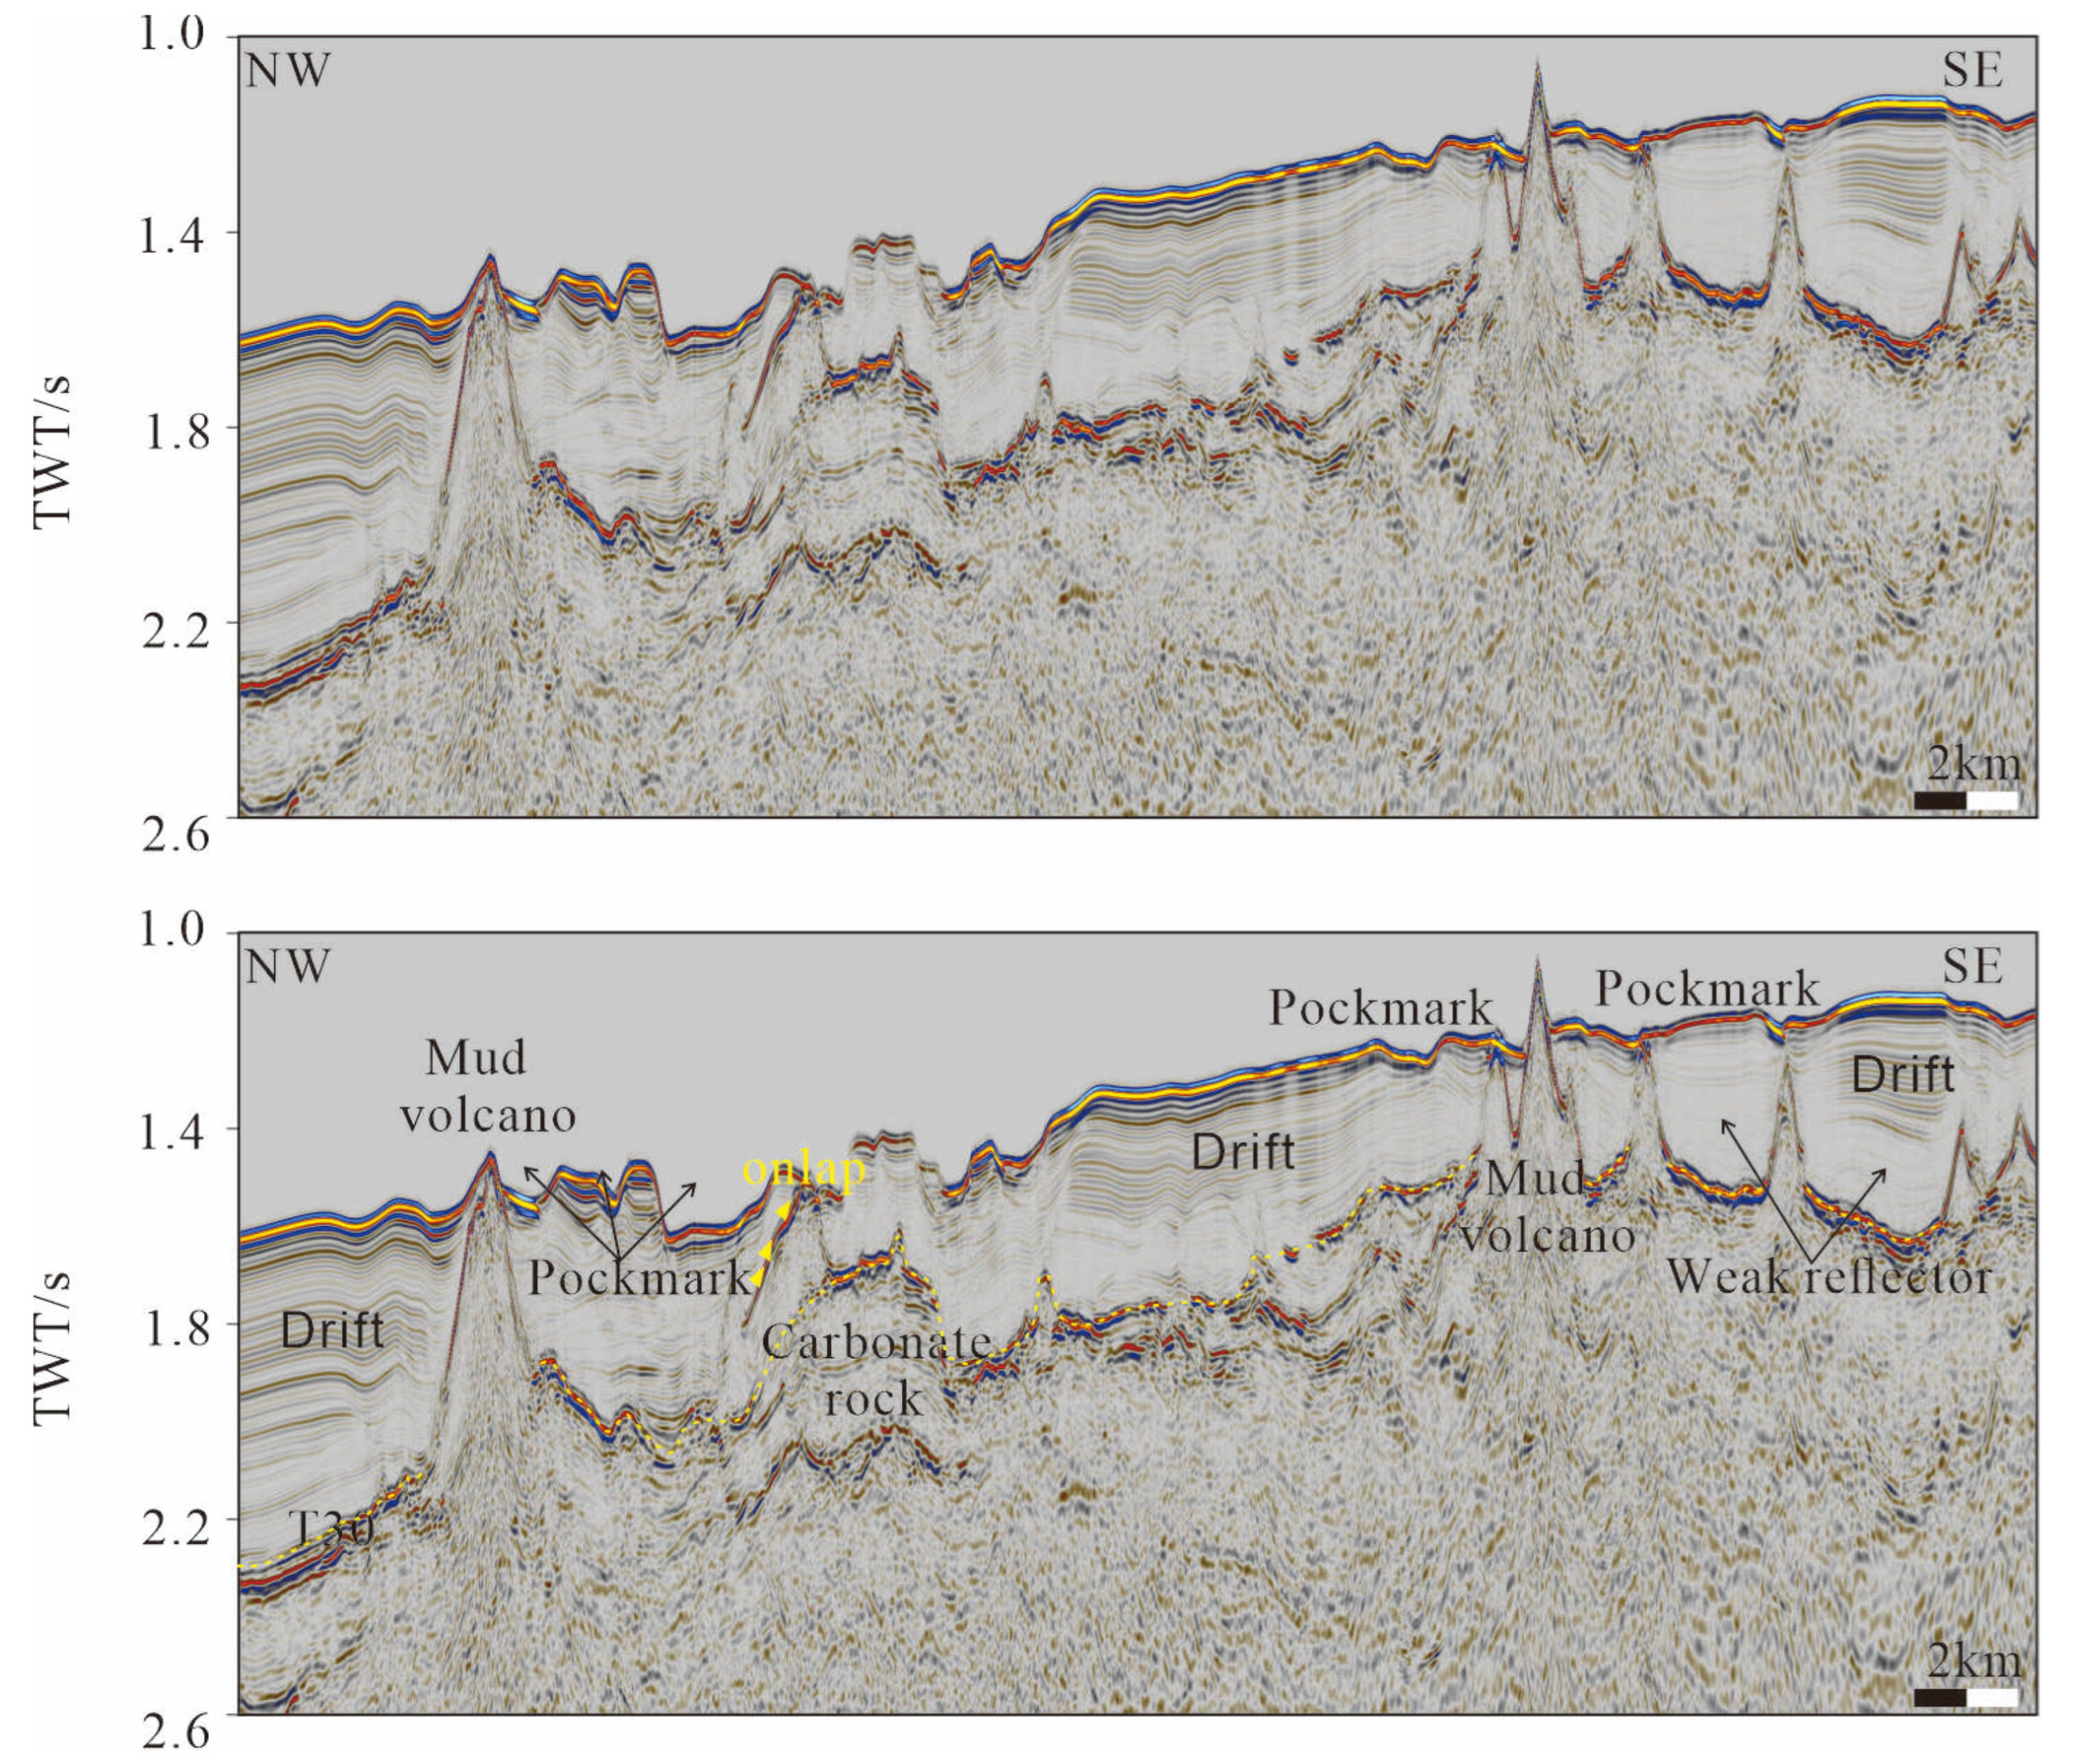
4.2.2. Seismic Facies in the Northern Part of the Study Area

In the northern part of the study area, seismic facies characteristics below T30 are predominantly chaotic with a moderate amplitude, representing the basement of the Xisha Block, possibly consisting of pre-Cambrian metamorphic rocks [33,40]. Small-scale carbonate platforms are also identified in the northern part of the study area, characterized by weak continuity and moderate-amplitude seismic facies. The demise of platform margins occurred later, overlain by the surrounding strata. Several mud volcanoes are identified in the seismic profiles, characterized by chaotic reflections internally and strong-amplitude isochronous axes at their boundaries. Some mud volcanoes penetrate through the seafloor, while others are buried by hemi-pelagic sediments. Pockmarks typically develop near mud volcanoes, appearing as depressions in isochronous axes. Unlike pockmarks in the southern part of the study area, those in the northern region exhibit overall higher frequencies in the underlying strata, and no chaotic weak reflections, bright spots, or high-angle reflectors are identified. This indicates that the underlying strata of pockmarks in the northern area do not contain gas. Numerous drifts are identified in the seismic profiles, characterized by moderate to weak amplitude parallel reflections, indicating strong hydrodynamic conditions in the northern part of the study area. These strong hydrodynamic conditions are primarily due to the development of strong bottom currents [14,20]. Between mud volcanoes and beneath drifting layers, weak blank reflections are identified. The seismic facies exhibit strong continuity and weak amplitude parallel reflections, indicating a weak hydrodynamic environment.

5. Discussion

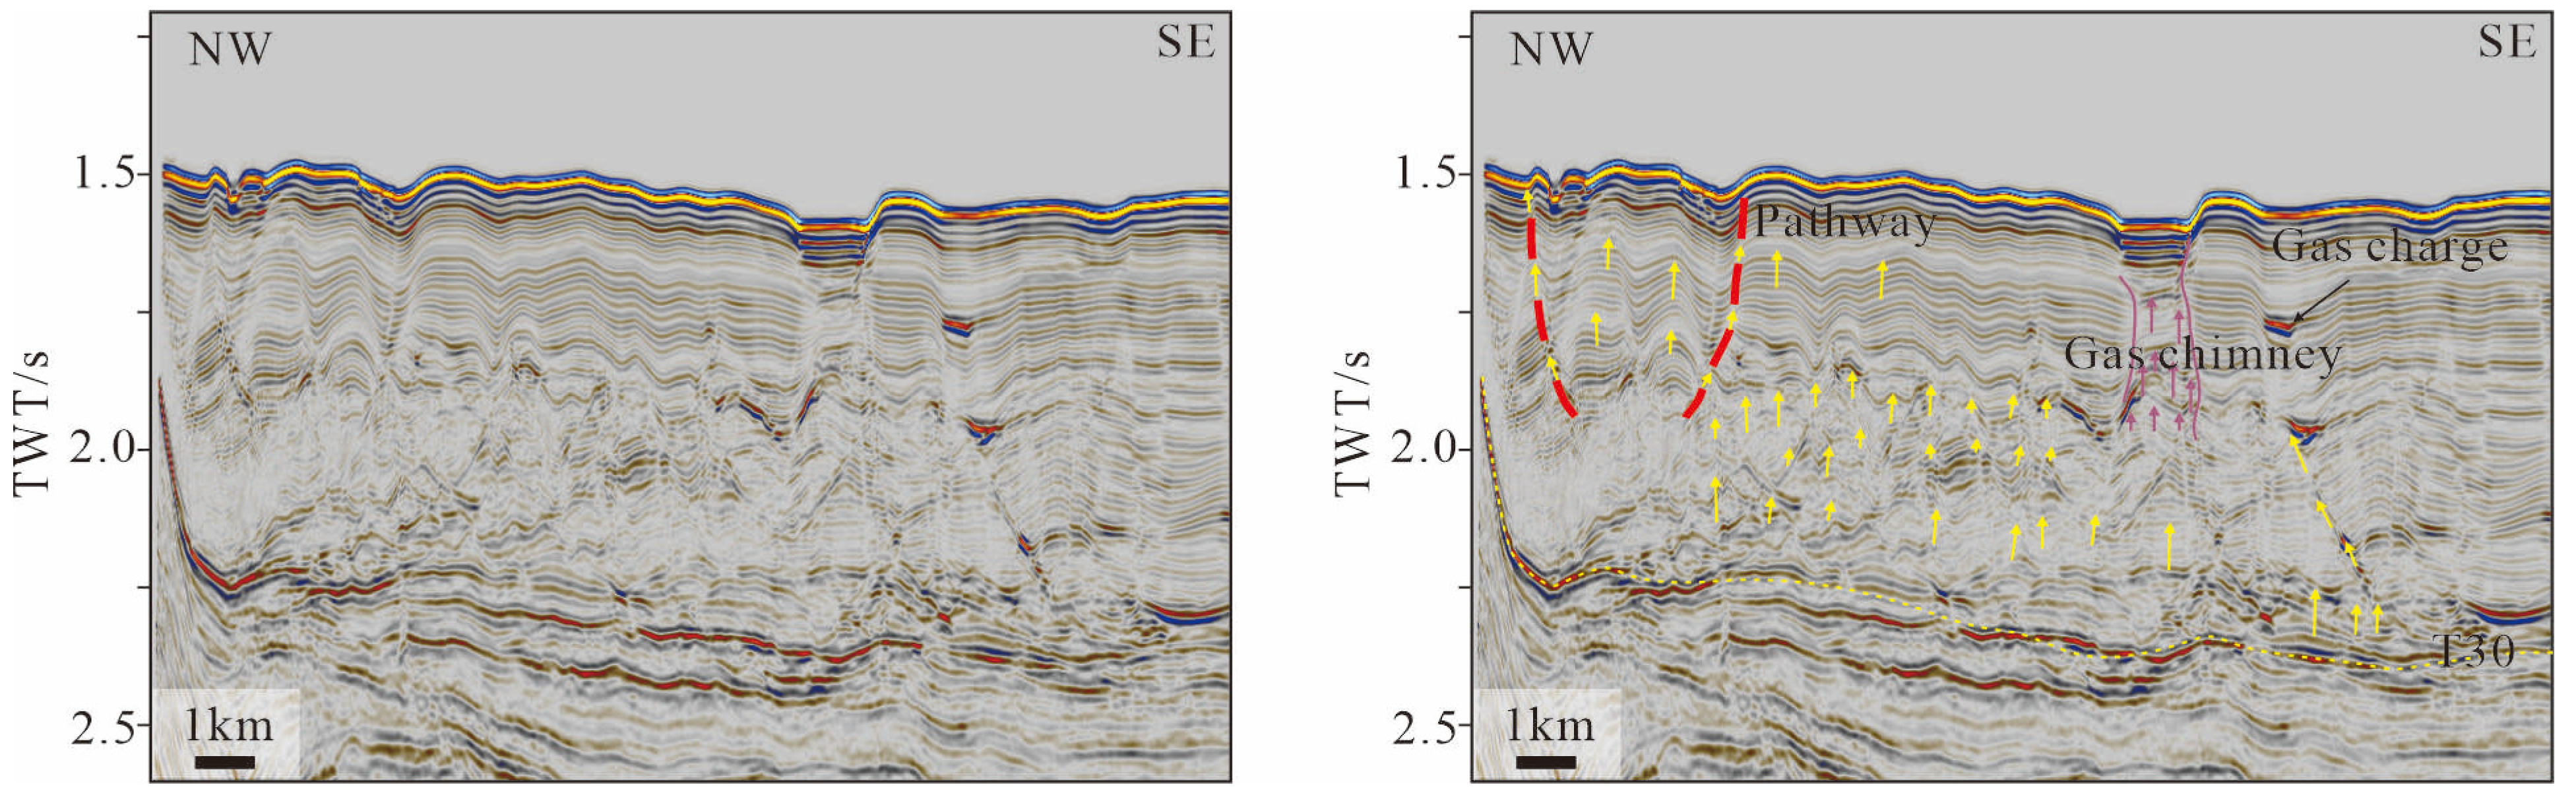
5.1. Gas Migration in the Southern Part of the Study Area

Seismic profiles show that there are abundant chaotic reflections in the Pliocene strata (above T30), indicating a significant amount of gas in the Pliocene strata. During the Miocene (T60-T30), a large number of biogenic reefs grew in the Xisha Uplift area (Figure 2) [41]. These reefs were buried by hemipelagic sediments due to the rapid rise in the sea level during the Pliocene [42]. Biogenic reefs contain substantial organic matter, which decomposes gradually after burial, producing large amounts of gas [43]. The sedimentary layers formed by the hemipelagic sediments are impermeable, trapping the gas produced from the decomposition of organic matter. Therefore, it is inferred that the gas in the Pliocene strata is biogenic in origin.
Various types of escape pathways have been identified in seismic profiles, including faults, fractures, and gas chimneys, which can connect deep strata with shallow strata. Faults are one of the main pathways for vertical gas migration, providing the path of least resistance for gas movement [44,45,46]. The high-angle reflectors in the underlying strata of the submarine pockmarks are most likely faults. Fractures often develop around faults, and both faults and fractures have the ability to disrupt the continuity of the strata, compromising the sealing capacity of the underlying strata of pockmarks (Figure 9(a1,a2)). Since the Piocene, gas migrates along fractures or faults to the shallower strata (Figure 9(b1,b2)).
The gas chimney structure is also a common escape pathway, and its formation requires three conditions: (1) a rich gas source in the deep strata; (2) the presence of structural weak zones in the strata, such as small fractures; and (3) a good cap rock structure [47]. The Xisha Uplift has abundant biogenic gas and deposited a good cap rock structure during the Piocene and Quaternary [48]. Biogenic gas continually accumulates, creating overpressure. Under the sealing effect of the cap rock, the pore pressure gradually increases. When the pore pressure exceeds the sealing pressure of the cap rock, episodic pressure release occurs [49]. As gas is released, the pore pressure in the underlying strata decreases, causing the weak zones to close. Pore pressure then accumulates again until the next episodic pressure release. Multiple episodic pressure releases ultimately form gas chimney structures.
In the southern part of the study area, gas primarily escapes through focused migration. The Pliocene strata contain significant amounts of biogenic gas and pore water. With the continuous deposition of overlying strata, the burial depth of gas-rich strata increases. This reduces the proportion of compressible materials, gradually increases the geotemperature, and causes gas expansion. This expansion generates overpressure within the Pliocene strata, promoting gas migration. The overlying strata contain numerous escape pathways, allowing gas to migrate upward or laterally along these pathways (Figure 9(b1,b2)). During migration, they accumulate in high-porosity areas, forming gas charges (Figure 9 and Figure 10).

5.2. The Genesis of Pockmarks in the Study Area Is Primarily Attributed to Gas Escape

The genesis of pockmarks is related to gas escape. Gas migrating along conduits enriches the shallow strata, causing overpressure and deforming weak seafloor layers to form pockmarks. The formation of pockmarks requires the presence of gas, with variations in velocity, rate, and properties potentially leading to different erosion levels on the seafloor sediments and influencing the formation of different pockmark morphologies. Based on the process of pockmark formation, the mechanisms by which gas influences pockmark development can be categorized into four types: pockmarks formed by gas escape leading to strata collapse, pockmarks formed by gas escape causing strata deformation, pockmarks related to gas chimneys, and pockmarks associated with diapirs.
Pockmarks formed by gas escape leading to strata collapse. High-amplitude gas pathways are typically identified in the deeper strata beneath the pockmarks, connecting to a downwarp seismic facies above (Figure 11a). This downwarp seismic facies is interpreted as a paleo-pockmark or paleo-channel [50]. Although the paleo-pockmark or paleo-channel has been filled, it still retains relatively high porosity. Gas from deeper strata migrates vertically or laterally along the pathway and accumulates in the paleo-pockmark, appearing as high-amplitude reflections in seismic profiles. As gas accumulates, pressure gradually increases. When the pressure becomes sufficiently high, weak points in the overlying strata rupture, allowing gas to escape rapidly. The escaping gas may distort the overlying strata. The significant escape of gas causes volume loss in the paleo-pockmark, leading to the collapse of the overlying strata and the formation of new pockmarks on the seafloor. Subsequently, gas continues to escape along the faults created by the collapse, allowing the pockmark to develop further. This mechanism typically forms irregular pockmarks (Figure 11a).
Pockmarks formed by gas escape causing strata deformation. This type of pockmark is typically underlain by thick hemipelagic sediments, beneath which chaotic reflections rich in gas are present. As biogenic and thermogenic gas continuously form, the pressure in the gas-bearing layer exceeds that of the overlying strata. With the continuous thermal subsidence of the Xisha Uplift, gas also migrates upwards. The upward migration of a large amount of gas causes the strata with lower porosity to arch upwards, resulting in positive topography on the seabed, with negative topography forming pockmarks around the positive topography. The upward migration of gas deforms the overlying sedimentary layers, eventually causing the porous areas to fracture and form faults. Later, most of the gas escapes along these faults, leading to the continued existence of the pockmarks. In the Xisha Uplift, this mechanism primarily generates elliptical pockmarks (Figure 11b).
Pockmarks related to gas chimneys. The formation of this type of pockmark is primarily influenced by the presence of a gas chimney below. As the pressure in the Pliocene strata gradually increases, the overlying sedimentary layers remain relatively dense, with only small pores. When the accumulation of gas in the Pliocene strata reaches a certain level, the enormous pressure causes the gas to rapidly surge upwards, disrupting the overlying strata and forming a gas chimney that escapes to the seabed. The formation of a gas chimney simultaneously causes the overlying strata to collapse, leading to the creation of a pockmark. Due to the continued escape of gas through the gas chimney, the pockmark remains unfilled and persists. This mechanism typically forms circular pockmarks (Figure 11c).
Pockmarks related to diapirs. The gas associated with this type of pockmark is primarily thermogenic, with the gas source located in diapir structures. After diapir activity ceases, gas continues to escape from the diapir structures, migrating through the pores of the overlying strata and eventually reaching the seabed. The continued escape of gas leads to the stabilization of the escape pathway, forming a closed circular shape at the seabed. The strata within the pathway collapse, resulting in the formation of a pockmark. Due to the uplift of the overlying strata caused by diapir activity, the center of the pockmark is elevated relative to its boundaries, giving the pockmark an annular shape (Figure 11d).

5.3. The Impact of Bottom Currents on Pockmarks in the Xisha Uplift

The development and evolution of submarine pockmarks are not only controlled by gas seepage activities but also influenced by bottom current scouring and transport processes [51,52]. During the formation of submarine pockmarks, gas seeps into shallow subsurface layers, eroding loose seabed sediments. Fine-grained sediments are suspended in the water column and swiftly transported by intense bottom currents, while coarse-grained sediments remain on the inactive walls of the pockmarks where gas seepage is minimal [53]. Bottom currents can prevent pockmarks from being filled and buried by other sedimentary deposits, thereby maintaining their morphology. However, when bottom current action and gas seepage weaken, pockmarks may eventually be buried by subsequent sedimentation [54,55]. Crescent-shaped and elongated pockmarks typically develop in regions with strong bottom current activity, which can erode the inner walls of early-formed pockmarks, thereby enlarging them and altering their geomorphic features [54].
In the South China Sea, there exists a unique three-layer cyclonic–anticyclonic–cyclonic circulation pattern (upper layer < 750 m, middle layer 750–1500 m, deep layer > 1500 m) [56]. Within the study area, crescent-shaped pockmarks are predominantly located within the influence of the middle-layer circulation, which currents from southwest to northeast [57,58]. According to simulations by Hammer [18], when bottom currents pass over submarine pockmarks, sedimentation rates increase on the upstream side of the pockmark and decrease or even erode on the downstream side. Crescent-shaped pockmarks are widespread in the study area, and multibeam and seismic profiles indicate that fillings on the northeast side are thinner compared to the southwest side, with signs of erosion on the northeast side. Therefore, crescent-shaped pockmarks on the Xisha Uplift are influenced by bottom currents.
In the northern part of the study area, bottom current activity is complex. When the northeastward middle-layer circulation encounters positive topography, such as a submarine platform, its flow direction is altered and accelerates around the platform (Figure 12a). The bottom currents pass over previously formed pockmark groups around the edges of the platform. These earlier-formed pockmark groups no longer release gas (Figure 12b). Due to the increased flow velocity, there is enhanced sediment transport and erosion. Intense erosion and transport cause the interconnected pockmarks traversed by the bottom currents to merge into elongated mega-pockmarks. Prolonged bottom current erosion may eventually transform these pockmark groups into narrow channels.

6. Conclusions

(1)
Based on multibeam bathymetric data and 2D seismic profiles, 261 seabed pockmarks have been identified near the Ganquan Platform. Among them, there are 69 circular pockmarks, 19 elliptical pockmarks, 40 irregular-shaped pockmarks, 28 crescent-shaped pockmarks, 27 elongated pockmarks, and 18 ring-shaped pockmarks. The diameters of these pockmarks range from 0.21 to 4.96 km, with maximum depths reaching up to 30.882 m. A large number of small-scale pockmarks arranged in strings have been discovered in the southern part of the study area.
(2)
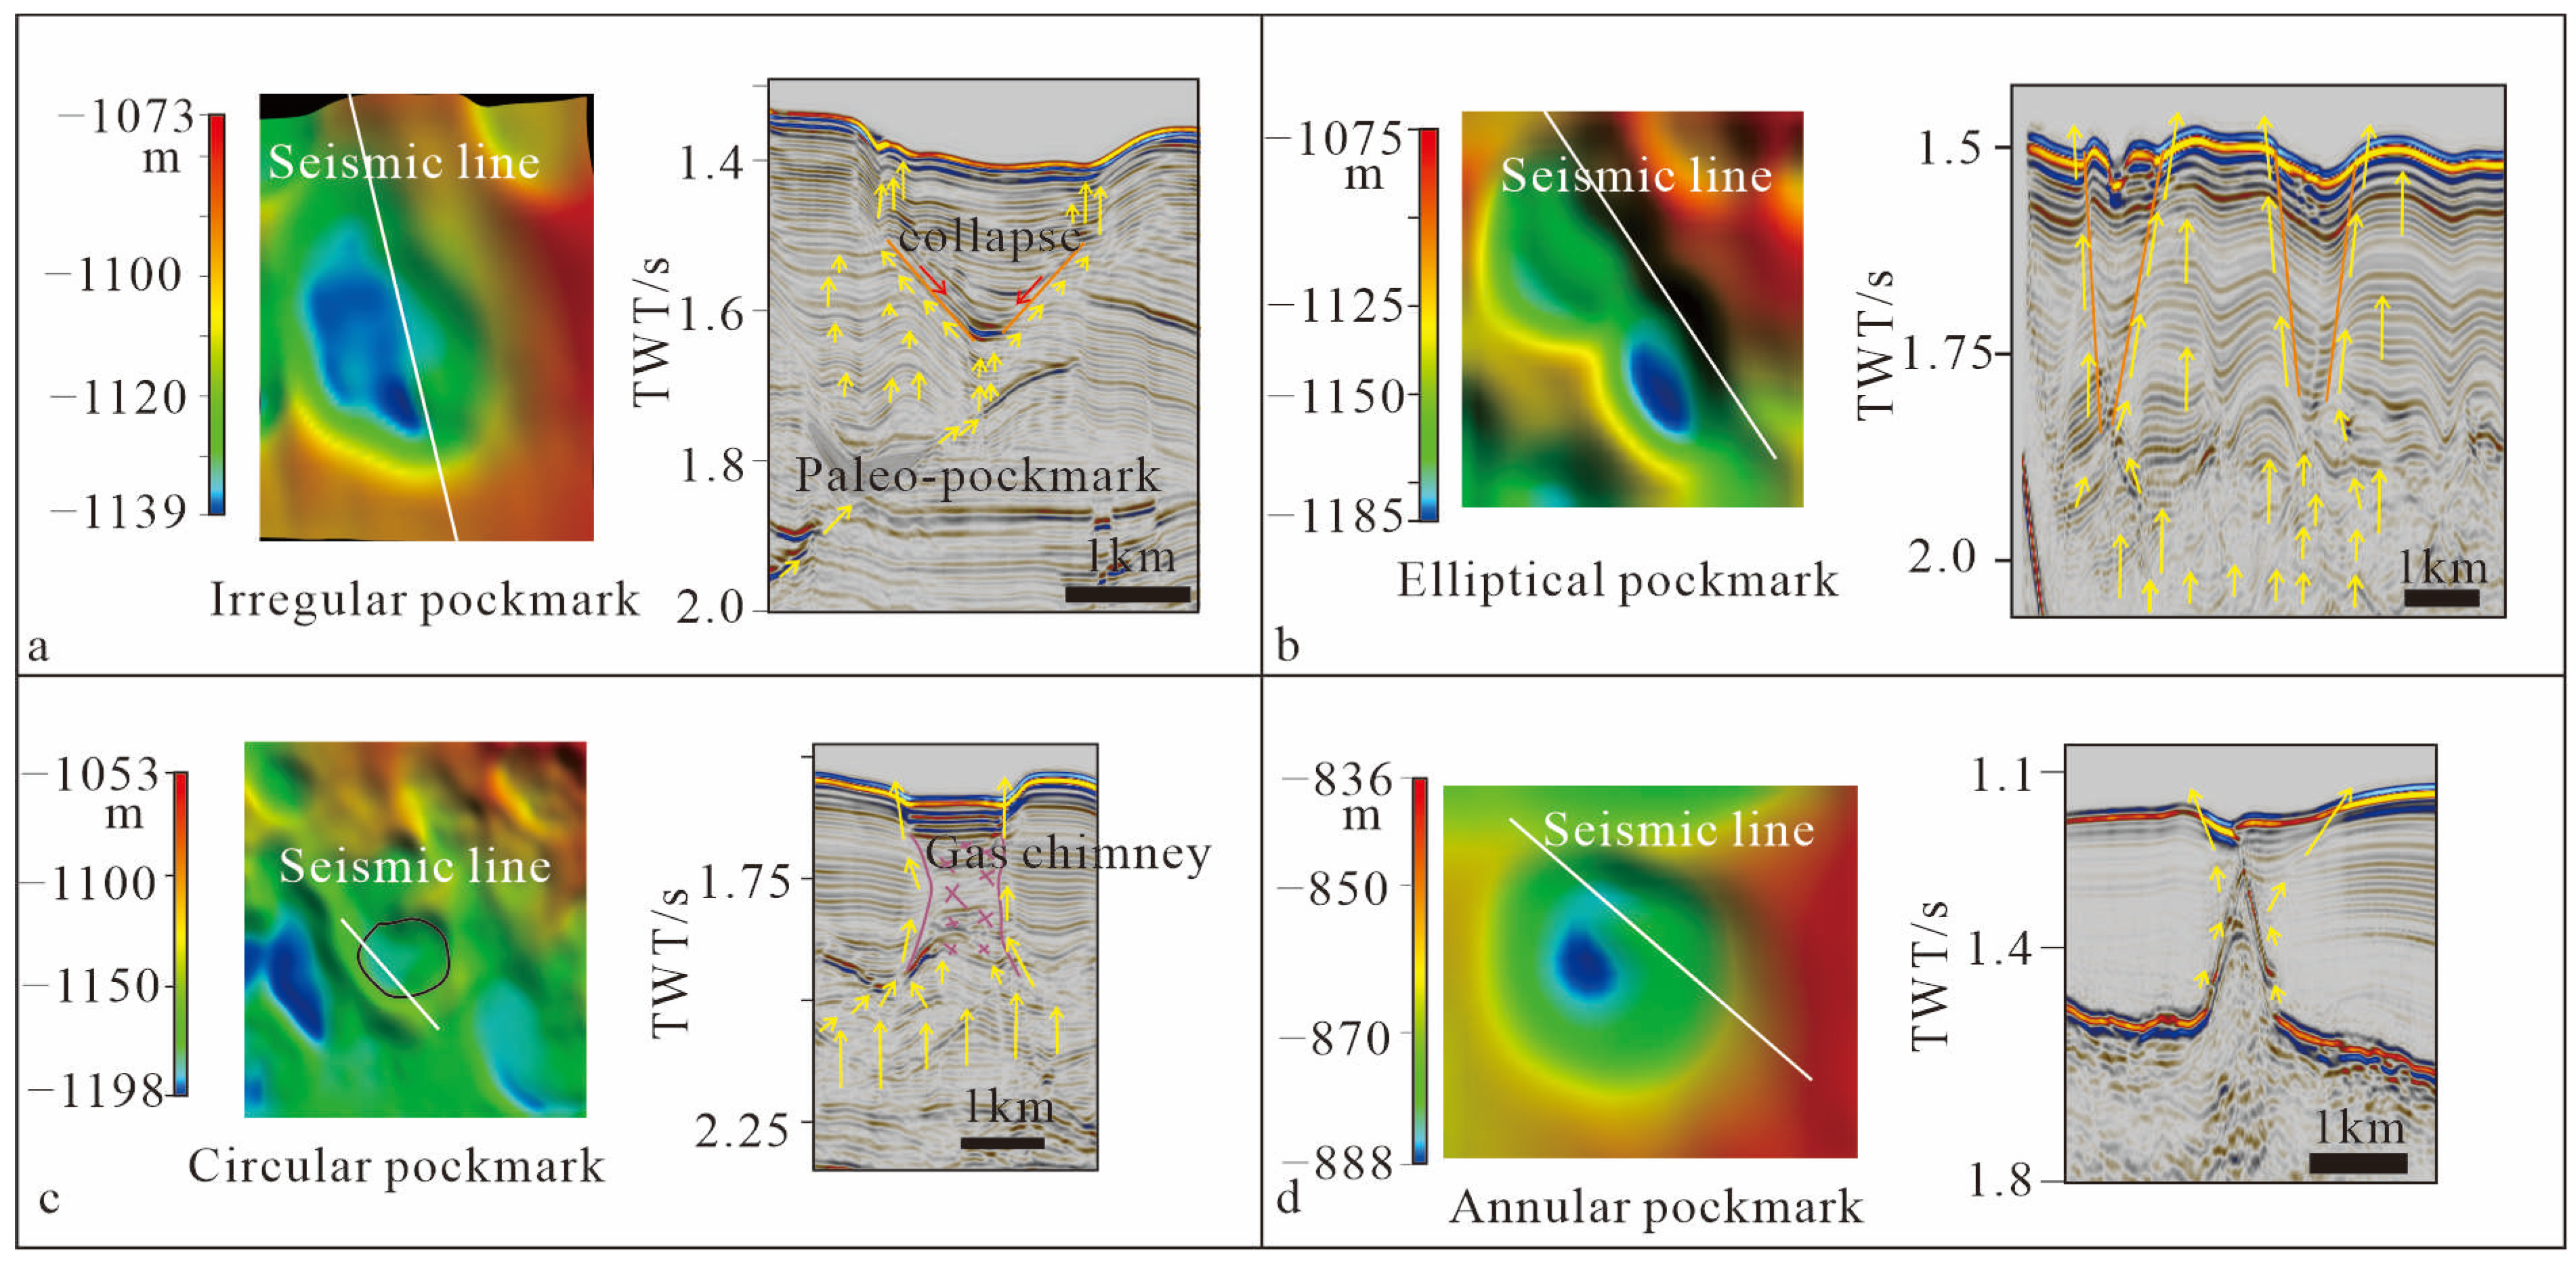
The genesis of pockmarks on the Xisha Uplift is primarily associated with the escape of gas. There are various types of escape pathways on the Xisha Uplift, such as faults, fractures, and gas chimneys. Based on the formation mechanism, pockmarks on the Xisha Uplift can be classified into four types: pockmarks formed by gas escape leading to strata collapse, pockmarks formed by gas escape causing strata deformation, pockmarks related to gas chimneys, and pockmarks related to diapirs.
(3)
Bottom current activity has a significant impact on already formed pockmarks. Crescent-shaped and elongated pockmarks on the Xisha Uplift are largely the result of bottom current modifications of pre-existing pockmarks. Crescent-shaped pockmarks form due to uneven sedimentation rates within the pockmark caused by bottom currents, while elongated pockmarks result from strong erosion by bottom currents connecting multiple pockmarks together.

Author Contributions

Conceptualization, Investigation, Data Curation, and Methodology, X.L. and X.F.; Writing—Original Draft, X.L. and X.G.; Writing—Review And Editing, F.T. All authors have read and agreed to the published version of the manuscript.

Funding

This research was funded by the National Science Foundation of China (grant number 42376078), the Project of Sanya Yazhou Bay Science and Technology City (grant number SCKJ-JYRC-2022-36), the Guangzhou Basic and Applied Basic Research Program (grant number 202201011367), and the China Geological Survey Project (grant number DD20221725).

Institutional Review Board Statement

Not applicable.

Informed Consent Statement

Not applicable.

Data Availability Statement

All data are provided in this paper. Further inquiries can be directed to the corresponding authors.

Conflicts of Interest

The authors declare no conflicts of interest.

References

  1. Judd, A.; Hovland, M. Seabed Fluid Flow: The Impact on Geology, Biology and the Marine Environment; Cambridge University Press: Cambridge, UK, 2009. [Google Scholar]
  2. Pilcher, R.; Argent, J. Mega-Pockmarks and Linear Pockmark Trains on the West African Continental Margin. Mar. Geol. 2007, 244, 15–32. [Google Scholar] [CrossRef]
  3. Riboulot, V.; Cattaneo, A.; Sultan, N.; Garziglia, S.; Ker, S.; Imbert, P.; Voisset, M. Sea-Level Change and Free Gas Occurrence Influencing a Submarine Landslide and Pockmark Formation and Distribution in Deepwater Nigeria. Earth Planet. Sci. Lett. 2013, 375, 78–91. [Google Scholar] [CrossRef]
  4. Xiong, P.; Cheng, C.; Kuang, Z.; Ren, J.; Liang, J.; Lai, H.; Chen, Z.; Lu, J.; Fang, X.; Jiang, T. Sedimentary Characteristics and Genetic Mechanism of the Giant Ancient Pockmarks in the Qiongdongnan Basin, Northern South China Sea. Acta Oceanol. Sin. 2023, 42, 120–133. [Google Scholar] [CrossRef]
  5. King, L.H.; MacLean, B. Pockmarks on the Scotian Shelf. Geol. Soc. Am. Bull. 1970, 81, 3141–3148. [Google Scholar] [CrossRef]
  6. Nelson, H.; Thor, D.; Sandstrom, M.W.; Kvenvolden, K.A. Modern Biogenic Gas-Generated Craters (Sea-Floor “Pockmarks”) on the Bering Shelf, Alaska. Geol. Soc. Am. Bull. 1979, 90, 1144–1152. [Google Scholar] [CrossRef]
  7. Hovland, M. Characteristics of Pockmarks in the Norwegian Trench. Mar. Geol. 1981, 39, 103–117. [Google Scholar] [CrossRef]
  8. Hovland, M.; Talbot, M.R.; Qvale, H.; Olaussen, S.; Aasberg, L. Methane-Related Carbonate Cements in Pockmarks of the North Sea. J. Sediment. Res. 1987, 57, 881–892. [Google Scholar]
  9. Bussmann, I.; Suess, E. Groundwater Seepage in Eckernförde Bay (Western Baltic Sea): Effect on Methane and Salinity Distribution of the Water Column. Cont. Shelf Res. 1998, 18, 1795–1806. [Google Scholar] [CrossRef]
  10. Çifçi, G.; Dondurur, D.; Ergün, M. Deep and Shallow Structures of Large Pockmarks in the Turkish Shelf, Eastern Black Sea. Geo-Mar. Lett. 2003, 23, 311–322. [Google Scholar] [CrossRef]
  11. Sumida, P.Y.G.; Yoshinaga, M.Y.; Madureira, L.A.S.-P.; Hovland, M. Seabed Pockmarks Associated with Deepwater Corals off SE Brazilian Continental Slope, Santos Basin. Mar. Geol. 2004, 207, 159–167. [Google Scholar] [CrossRef]
  12. Dandapath, S.; Chakraborty, B.; Karisiddaiah, S.M.; Menezes, A.; Ranade, G.; Fernandes, W.; Naik, D.K.; Raju, K.P. Morphology of Pockmarks along the Western Continental Margin of India: Employing Multibeam Bathymetry and Backscatter Data. Mar. Pet. Geol. 2010, 27, 2107–2117. [Google Scholar] [CrossRef]
  13. MacDonald, I.; Leifer, I.; Sassen, R.; Stine, P.; Mitchell, R.; Guinasso, N., Jr. Transfer of Hydrocarbons from Natural Seeps to the Water Column and Atmosphere. Geofluids 2002, 2, 95–107. [Google Scholar] [CrossRef]
  14. Sun, Q.; Wu, S.; Hovland, M.; Luo, P.; Lu, Y.; Qu, T. The Morphologies and Genesis of Mega-Pockmarks near the Xisha Uplift, South China Sea. Mar. Pet. Geol. 2011, 28, 1146–1156. [Google Scholar] [CrossRef]
  15. Xu, C.; Xu, G.; Xing, J.; Sun, Z.; Wu, N. Research Progress of Seafloor Pockmarks in Spatio-Temporal Distribution and Classification. J. Ocean Univ. China 2020, 19, 69–80. [Google Scholar] [CrossRef]
  16. Ramos, R.B.; Dossantos, R.F.; Schattner, U.; Figueira, R.C.L.; Bícego, M.C.; Lobo, F.J.; de Mahiques, M.M. Deep Pockmarks as Natural Sediment Traps: A Case Study from Southern Santos Basin (SW Atlantic Upper Slope). Geo-Mar. Lett. 2020, 40, 989–999. [Google Scholar] [CrossRef]
  17. Zhang, K.; Guan, Y.; Song, H.; Fan, W.; Li, H.; Kuang, Y.; Geng, M. A Preliminary Study on Morphology and Genesis of Giant and Mega Pockmarks near Andu Seamount, Nansha Region (South China Sea). Mar. Geophys. Res. 2020, 41, 2. [Google Scholar] [CrossRef]
  18. Hammer, Ø.; Webb, K.E.; Depreiter, D. Numerical Simulation of Upwelling Currents in Pockmarks, and Data from the Inner Oslofjord, Norway. Geo-Mar. Lett. 2009, 29, 269–275. [Google Scholar] [CrossRef]
  19. Chen, S.C.; Hsu, S.K.; Tsai, C.H.; Ku, C.Y.; Yeh, Y.C.; Wang, Y. Gas Seepage, Pockmarks and Mud Volcanoes in the near Shore of SW Taiwan. Mar. Geophys. Res. 2010, 31, 133–147. [Google Scholar] [CrossRef]
  20. Di, P.; Huang, H.; Huang, B.; He, J.; Chen, D. Seabed Pockmark Formation Associated with Mud Diapir Development and Fluid Activities in the Yinggehai Basin of the South China Sea. J. Trop. Oceanogr. 2012, 31, 26–36. [Google Scholar]
  21. Wang, L.J.; Zhu, J.T.; Zhou, H.T.; Sun, Z.; Sun, Z.P.; Zhang, H. Seismic Characteristics and Mechanism of Fluid Flow Structures in the Central Depression of Qiongdongnan Basin, Northern Margin of South China Sea. Int. Geol. Rev. 2020, 62, 1108–1130. [Google Scholar] [CrossRef]
  22. Chen, J.; Song, H.; Guan, Y.; Yang, S.; Pinheiro, L.M.; Bai, Y.; Liu, B.; Geng, M. Morphologies, Classification and Genesis of Pockmarks, Mud Volcanoes and Associated Fluid Escape Features in the Northern Zhongjiannan Basin, South China Sea. Deep Sea Res. Part II Top. Stud. Oceanogr. 2015, 122, 106–117. [Google Scholar] [CrossRef]
  23. Guo, X.R.; Zhang, M.H.; Huang, H.B.; Qiu, X.L.; Zhang, J.Z. Crustal Structure of Xisha Block and Its Tectonic Attributes. Chin. J. Geophys. 2016, 59, 288–300. [Google Scholar]
  24. Taylor, B.; Hayes, D.E. Origin and History of the South China Sea Basin. Geophys. Monogr. Ser. 1983, 27, 23–56. [Google Scholar]
  25. Li, C.; Zhi, P.; Ding, R.; Zhao, L.; Gong, W.; Li, Z.; Ge, J. Differences in Thermo-Rheological Structure between Qiongdongnan Basin and Pearl River Mouth Basin: Implications for the Extension Model in the Northwestern Margin of the South China Sea. J. Mar. Sci. Eng. 2023, 11, 443. [Google Scholar] [CrossRef]
  26. Bai, Y.; Wu, S.; Liu, Z.; Müller, R.D.; Williams, S.E.; Zahirovic, S.; Dong, D. Full-Fit Reconstruction of the South China Sea Conjugate Margins. Tectonophysics 2015, 661, 121–135. [Google Scholar] [CrossRef]
  27. Lei, C.; Alves, T.M.; Ren, J.; Tong, C. Rift Structure and Sediment Infill of Hyperextended Continental Crust: Insights from 3D Seismic and Well Data (Xisha Trough, South China Sea). J. Geophys. Res. Solid Earth 2020, 125, e2019JB018610. [Google Scholar] [CrossRef]
  28. Qin, G.Q. A Preliminary Study on Foraminiferal Assemblages of Well 1, Xiyong, Xisha Islands and Their Coral Reef Formation. Trop. Oceanol./Redai Haiyang 1987, 6, 10–20. [Google Scholar]
  29. Xia, S.; Fan, C.; Sun, J.; Cao, J.; Zhao, F.; Wan, K. Characteristics of Late Cenozoic Magmatic Activities on the Northern Margin of South China Sea and Their Tectonic Implications. Mar. Geol. Quat. Geol. Chin. 2017, 37, 25–33. [Google Scholar]
  30. Zhu, W.; Xie, X.; Wang, Z.; Zhang, D.; Zhang, C.; Cao, L.; Shao, L. New Insights on the Origin of the Basement of the Xisha Uplift, South China Sea. Sci. China (Earth Sci.) 2017, 60, 2214–2222. [Google Scholar] [CrossRef]
  31. Yang, Z.; Li, X.; Huang, L.; Wang, L.; Wu, S.; Zhang, X. Development of the Miocene Guangle Carbonate Platform in the South China Sea: Architecture and Controlling Factors. Acta Geol. Sin.-Engl. Ed. 2021, 95, 177–191. [Google Scholar] [CrossRef]
  32. Li, Y.; Liu, X.; Chen, W.; Yi, L. Magnetic Properties and Initiation of Biogenic Reefs in Xisha Islands, South China Sea, at the Oligo–Miocene Boundary. J. Mar. Sci. Eng. 2021, 9, 1031. [Google Scholar] [CrossRef]
  33. Wu, S.; Yang, Z.; Wang, D.; Lu, F.; Lüdmann, T.; Fulthorpe, C.; Wang, B. Architecture, Development and Geological Control of the Xisha Carbonate Platforms, Northwestern South China Sea. Mar. Geol. 2014, 350, 71–83. [Google Scholar] [CrossRef]
  34. Wu, X.; Pu, R.; Chen, Y.; Qu, H.; Shen, H. Seismic Analysis of Early-Mid Miocene Carbonate Platform in the Southern Qiongdongnan Basin, South China Sea. Acta Oceanol. Sin. 2018, 37, 54–65. [Google Scholar] [CrossRef]
  35. Wang, D.; Wu, S.; Qin, Z.; Spence, G.; Lü, F. Seismic Characteristics of the Huaguang Mass Transport Deposits in the Qiongdongnan Basin, South China Sea: Implications for Regional Tectonic Activity. Mar. Geol. 2013, 346, 165–182. [Google Scholar] [CrossRef]
  36. Ma, Y.B.; Wu, S.G.; Lv, F.L.; Dong, D.D.; Gu, M.F. Seismic Characteristics and Development of the Xisha Carbonate Platforms, Northern Margin of the South China Sea. J. Asian Earth Sci. 2011, 40, 770–783. [Google Scholar]
  37. Hovland, M.; Gardner, J.V.; Judd, A. The Significance of Pockmarks to Understanding Fluid Flow Processes and Geohazards. Geofluids 2002, 2, 127–136. [Google Scholar] [CrossRef]
  38. White, R.S. Seismic Bright Spots in the Gulf of Oman. Earth Planet. Sci. Lett. 1977, 37, 29–37. [Google Scholar] [CrossRef]
  39. Schroot, B.M.; Schüttenhelm, R.T. Shallow Gas and Gas Seepage: Expressions on Seismic and Otheracoustic Data from the Netherlands North Sea. J. Geochem. Explor. 2003, 78, 305–309. [Google Scholar] [CrossRef]
  40. Luo, W.; Zhang, D.J.; Liu, X.Y.; Wang, Z.F.; Hu, W.Y.; Wang, Y.H. A Comprehensive Stratigraphic Study of Well XK-1 in the Xisha Area. J. Stratigr. 2018, 42, 485–498. [Google Scholar]
  41. Sultan, N.; Marsset, B.; Ker, S.; Marsset, T.; Voisset, M.; Vernant, A.-M.; Bayon, G.; Cauquil, E.; Adamy, J.; Colliat, J. Hydrate Dissolution as a Potential Mechanism for Pockmark Formation in the Niger Delta. J. Geophys. Res. Solid Earth 2010, 115, B08101. [Google Scholar] [CrossRef]
  42. Riboulot, V.; Thomas, Y.; Berné, S.; Jouet, G.; Cattaneo, A. Control of Quaternary Sea-level Changes on Gas Seeps. Geophys. Res. Lett. 2014, 41, 4970–4977. [Google Scholar] [CrossRef]
  43. Dando, P.R.; Hara, S.C.M.; Schuster, U. Gas seepage from a carbonate-cemented sandstone reef on the Kattegat coast of Denmark. Mar. Pet. Geol. 1994, 11, 182–189. [Google Scholar] [CrossRef]
  44. Serié, C.; Huuse, M.; Schødt, N.H. Gas Hydrate Pingoes: Deep Seafloor Evidence of Focused Fluid Flow on Continental Margins. Geology 2012, 40, 207–210. [Google Scholar] [CrossRef]
  45. Hustoft, S.; Mienert, J.; Bünz, S.; Nouzé, H. High-Resolution 3D-Seismic Data Indicate Focussed Fluid Migration Pathways above Polygonal Fault Systems of the Mid-Norwegian Margin. Mar. Geol. 2007, 245, 89–106. [Google Scholar] [CrossRef]
  46. Faulkner, D.; Jackson, C.; Lunn, R.; Schlische, R.; Shipton, Z.; Wibberley, C.; Withjack, M. A Review of Recent Developments Concerning the Structure, Mechanics and Fluid Flow Properties of Fault Zones. J. Struct. Geol. 2010, 32, 1557–1575. [Google Scholar] [CrossRef]
  47. Zhong, G.; Gao, H. Sequence Characteristics of Cenozoic Stratigraphy in Zhongjiannan Basin, South China Sea. Geotecton. Metallog. 2005, 29, 403–409. [Google Scholar]
  48. Liang, Q.S.; Liu, Z.; Wang, D.J.; Li, W.L.; Chang, M. Gas Chimney and Hydrocarbon Exploration. Xinjiang Pet. Geol. 2006, 27, 288. [Google Scholar]
  49. Yang, T.; Lu, F.; Wang, B.; Fan, G.; Lu, Y.; Yang, Z. Geophysical Characteristics and Genetic Mechanism of the Gas Chimney in Deepwater Area of Southern Qiongdongnan Basin. Prog. Geophys. 2013, 28, 2634–2641. [Google Scholar]
  50. Dillon, W.P.; Nealon, J.W.; Taylor, M.H.; Lee, M.W.; Drury, R.M.; Anton, C.H. Seafloor Collapse and Methane Venting Associated with Gas Hydrate on the Blake Ridge: Causes and Implications to Seafloor Stability and Methanerelease. Geophys. Monogr. Ser. 2001, 124, 211–233. [Google Scholar]
  51. Bulat, J.; Long, D. Images of the Seabed in the Faroe-Shetland Channel from Commercial 3D Seismic Data. Mar. Geophys. Res. 2001, 22, 345–367. [Google Scholar] [CrossRef]
  52. Betzler, C.; Lindhorst, S.; Hübscher, C.; Lüdmann, T.; Fürstenau, J.; Reijmer, J. Giant Pockmarks in a Carbonate Platform (Maldives, Indian Ocean). Mar. Geol. 2011, 289, 1–16. [Google Scholar] [CrossRef]
  53. Paull, C.; Ussler Iii, W.; Borowski, W. Freshwater Ice Rafting: An Additional Mechanism for the Formation of Some High-Latitude Submarine Pockmarks. Geo-Mar. Lett. 1999, 19, 164–168. [Google Scholar] [CrossRef]
  54. Hovland, M.; Jensen, S.; Indreiten, T. Unit Pockmarks Associated with Lophelia Coral Reefs off Mid-Norway: More Evidence of Control by ‘Fertilizing’ Bottom Currents. Geo-Mar. Lett. 2012, 32, 545–554. [Google Scholar] [CrossRef]
  55. Michel, G.; Dupré, S.; Baltzer, A.; Ehrhold, A.; Imbert, P.; Pitel, M.; Loubrieu, B.; Scalabrin, C.; Lazure, P.; Marié, L. Pockmarks on the South Aquitaine Margin Continental Slope: The Seabed Expression of Past Fluid Circulation and Former Bottom Currents. Comptes Rendus. Géosci. 2017, 349, 391–401. [Google Scholar] [CrossRef]
  56. Gan, J.; Liu, Z.; Hui, C.R. A Three-Layer Alternating Spinning Circulation in the South China Sea. J. Phys. Oceanogr. 2016, 46, 2309–2315. [Google Scholar] [CrossRef]
  57. Sun, Q. Focused Fluid-Flow Escape System and Sediments Deformation in Deep-Water Basins of Northern South China Sea. Ph.D. Thesis, Chinese Academy of Sciences (Institute of Oceanology), Qingdao, China, 2011. [Google Scholar]
  58. Sun, Z.; Bian, M.; Ding, J.; Liu, J.; Zhang, H.; Xu, D. Study on the Wind and Wave Environmental Conditions of the Xisha Islands in the South China Sea. J. Mar. Sci. Eng. 2022, 10, 1459. [Google Scholar] [CrossRef]
Figure 1. The location of the study area (upper image) and the crustal velocity structure of the Xisha Block and its surrounding areas (lower image) [23].
Jmse 12 01505 g001
Figure 2. The sequence stratigraphy based on seismic reflection data around the study area. The dotted lines in different colors represent sequence boundaries. See the location in Figure 1.
Jmse 12 01505 g002
Figure 3. Pockmarks and bottom current channels are well shown on the multibeam bathymetry map. The white dashed line outlines the pockmark string in the study area, and the yellow line AB represents the profile AB passing through the pockmark string.
Jmse 12 01505 g003
Figure 4. (a) Correlation diagram of diameters and depths of circular and elliptical pockmarks. (b) Correlation diagram of diameters and depths of crescent-shaped and elongated pockmarks. (c) Correlation diagram of diameters and depths of annular and irregular pockmarks. (d) Correlation diagram of pockmark perimeters and slopes of study area.
Jmse 12 01505 g004
Figure 5. Three-dimensional view of pockmark string and cross section. The white dashed line outlines the pockmark string, and the yellow line AB represents the profile AB through the pockmark string shown in the lower image.
Jmse 12 01505 g005
Figure 6. Seismic reflection profile 01 in the southeastern part of the study area; the location is shown in Figure 3. The red line represents high-angle reflectors, and the yellow dashed line denotes the T30 interface.
Jmse 12 01505 g006
Figure 7. Seismic reflection profile 02 in the southwestern part of the study area; the location is shown in Figure 3. The red line represents high-angle reflector, and the yellow dashed line indicates the T30 interface.
Jmse 12 01505 g007
Figure 8. Seismic reflection profile 03 in the northern part of the study area; the location is shown in Figure 3. The yellow dashed line indicates the T30 interface, and the yellow triangle indicates onlap.
Jmse 12 01505 g008
Figure 9. Gas migration in profile line 01. Faults and gas chimneys are the main pathways for gas to escape from the seabed. The yellow arrows indicate the directions of gas migration, and the orange lines indicate faults, (a1,b1) are seismic profiles without interpretation, while (a2,b2) are interpreted seismic profiles. The pink solid circle indicates the shape of the gas chimney, and the pink arrow indicates the direction of gas migration in the gas chimney.
Jmse 12 01505 g009
Figure 10. Gas migration in profile line 02. The red dashed line represents high-angle pathways for gas migration. The yellow arrows indicate the direction of gas migration, and the red dotted lines indicate the pathway, the pink solid circle indicates the shape of the gas chimney, and the pink arrow indicates the direction of gas migration in the gas chimney.
Jmse 12 01505 g010
Figure 11. Formation mechanisms of various types of pockmarks. (a) Irregular pockmarks, (b) elliptical pockmarks, (c) circular pockmarks, and (d) annular pockmarks. Yellow arrows indicate direction of gas migration, orange lines indicate faults, gray lines outline gas chimneys, and red arrows indicate direction of collapse.
Jmse 12 01505 g011
Figure 12. Bottom currents modifying pockmark morphology. Blue arrows indicate direction of bottom currents, white lines represent positions of seismic profiles, and dashed black lines encircle elongated pockmarks. The dotted line AB indicates the position of seismic section AB in the base map. See Figure 3 for specific geographical locations in diagram. (a) shows the topographic and geomorphic map of the dominant bottom current region, while (b) presents the seismic imaging and interpretation of profile AB.
Jmse 12 01505 g012
Table 1. Main morphological parameters of pockmarks.
ShapeLong Axis Diameter/kmShort Axis Diameter/kmDepth/mNumber
Circular0.28–2.590.23–2.4310.334–30.88269
Elliptical0.34–4.620.21–2.989.228–28.16679
Crescent-shaped0.51–3.830.31–1.989.235–26.73128
Elongated0.75–4.960.25–2.218.965–26.55627
Annular0.66–2.620.51–2.3311.564–25.77618
Irregular0.35–2.630.29–2.3310.528–31.00240
ShapeVolume/106 m3Surface Area/km2Perimeter/kmOrientation/°
Circular0.5–73.160.05–4.910.79–7.856.3–351.8
Elliptical0.62–80.430.05–10.880.91–12.695.7–349.5
Crescent-shaped0.39–65.040.02–6.390.83–9.5712.3–355.2
Elongated0.34–38.760.03–6.240.93–11.7620.5–324.9
Annular0.38–54.260.28–5.411.81–8.224.6–358.2
Irregular0.65–75.480.06–10.761.12–9.727.1–342.5
Disclaimer/Publisher’s Note: The statements, opinions and data contained in all publications are solely those of the individual author(s) and contributor(s) and not of MDPI and/or the editor(s). MDPI and/or the editor(s) disclaim responsibility for any injury to people or property resulting from any ideas, methods, instructions or products referred to in the content.

