Article

Tidal Impacts on Zooplankton Dynamics in a Major Ocean-Lagoon Channel: Insights from a 25-Hour Intensive Survey in the Cotonou Channel, Benin

by
Hervé Hotèkpo Akodogbo
1,2,*,
Fridolin Ubald Dossou-Sognon
1,
François Talomonwo Ouinsou
1,
Thalasse Tchémangnihodé Avocegan
1,
Junior Patric Kouglo
1,
Olaègbè Victor Okpeitcha
3,
Arnaud Assogba
3,
Zacharie Sohou
2,3,
Yves Morel
4 and
Alexis Chaigneau
3,4,5
1
Unité de Recherche sur les Invasions Biologiques (URIB), Laboratoire de Recherche en Biologie Appliquée (LARBA), Université d’Abomey-Calavi, Cotonou P.O. Box 2009, Benin
2
Laboratoire d’Hydrobiologie et de Recherche sur les Zones Humides (LHyReZ), Faculté des Sciences et Techniques, Université d’Abomey-Calavi, Cotonou P.O. Box 526, Benin
3
Institut de Recherches Halieutiques et Océanologiques du Bénin (IRHOB), Cotonou P.O. Box 1665, Benin
4
Laboratoire d’Études en Géophysique et Océanographie Spatiales (LEGOS), Université de Toulouse, CNES, CNRS, IRD, UPS, 31555 Toulouse, France
5
International Chair in Mathematical Physics and Applications (ICMPA–UNESCO Chair), University of Abomey-Calavi, Cotonou P.O. Box 526, Benin
*
Author to whom correspondence should be addressed.
J. Mar. Sci. Eng. 2024, 12(9), 1519; https://doi.org/10.3390/jmse12091519
Submission received: 11 July 2024 / Revised: 23 August 2024 / Accepted: 27 August 2024 / Published: 2 September 2024

Abstract

:
This study investigates the effects of tidal cycles on the zooplankton community within the Cotonou Channel, an important waterway connecting the large Nokoué Lagoon to the Atlantic Ocean in Benin. From the determination of zooplankton composition from 25-hour samples collected in July 2020, alpha diversity indices and abundance were assessed, while relationships between biotic and abiotic parameters were analyzed through Pearson correlation, analysis of variance, and principal component analysis. A total of 66 zooplankton taxa were identified, with rotifers exhibiting the highest species richness (35 taxa), while copepods dominated in abundance (71%). Zooplankton abundance varied significantly, ranging from 2 to 95 ind L−1 depending on the tidal phase. A negative correlation was found between species richness (r = −0.51, p < 0.01) and increasing salinity (3–37), indicating that higher salinity reduced diversity (r = 0.06, p > 0.05). Resilient species like Synchaeta bicornis persisted despite salinity changes. The tidal cycle structurally altered the zooplankton community, with abundance and diversity peaking at different phases, notably higher at high tide (15 ind L−1.) These initial findings underscore the complex interactions between tidal dynamics and estuarine biodiversity, suggesting the need for further research across different tidal and seasonal conditions to inform effective management and conservation efforts.

1. Introduction

Coastal lagoons and the channels linking them to oceans or seas are among the most productive and dynamic ecosystems [1,2]. They offer essential ecological services, including nutrient cycling and carbon sequestration, and provide habitats for a wide variety of species. These systems support significant biodiversity and are crucial for the livelihoods of many coastal communities, contributing to economic activities and ecosystem services. The West African littoral is characterized by a series of coastal lagoons. Among them, the shallow Nokoué Lagoon in Benin, connected to the Atlantic Ocean by the Cotonou Channel, is internationally recognized as Ramsar Site 1018 for its significant ecological functions and biodiversity. It stands as one of the largest (15,000 hectares during the low-water season) and most biologically productive coastal lagoons in the region [3,4]. Providing approximately 22,000 tons of fish annually [5], this rich ecosystem accounts for 70% of Benin’s fisheries, ensuring food security for local populations [6].
This remarkable fish productivity is supported by the relatively high abundance of zooplankton, an important component of the lagoon’s biocenosis [7,8]. Indeed, in aquatic ecosystems, zooplankton, along with phytoplankton, forms the foundation of the food chain and facilitates the transfer of energy to upper trophic levels, including fry, carnivorous aquatic invertebrates, and zooplanktivorous fish at various life cycle stages [9]. Ensuring the sustainable productivity of zooplankton is therefore essential for maintaining food resources for upper trophic levels [10], thereby safeguarding the health of the ecosystem.
Certain fish exhibit preferences for specific groups of zooplankton depending on their developmental stages [11]. Consequently, the absence of certain zooplankton groups, influenced by environmental factors, can limit or impede the recruitment of fish populations. Understanding how environmental changes influence zooplankton composition and productivity in the ecosystem is essential for predicting potential ecosystem-wide impacts and planning effective management strategies.
Recent studies in the Nokoué Lagoon and Cotonou Channel have revealed significant seasonal variation in zooplankton composition and abundance depending on the hydrological season of this near-equatorial ecosystem [7,8]. This strong seasonality, characterized by an almost complete shift in zooplankton composition from rotifer-dominated to copepod-dominated communities, is primarily driven by variations in the lagoon’s salinity. These salinity changes result from the exchange and mixing of freshwater from the watersheds with oceanic saltwater, which penetrates the lagoon through tidal movements via the Cotonou Channel.
At a higher frequency scale, recent studies have highlighted the importance of semi-diurnal tides, originating from the ocean and propagating along the Cotonou Channel into the lagoon, as key drivers of salinity and water level fluctuations within the ecosystem [12,13,14,15]. While existing research has emphasized the significant impacts of tidal movements on zooplankton communities [1,10,16,17,18,19], detailed, site-specific investigations focusing on the effects of tidal dynamics on zooplankton in equatorial regions, especially within the unique context of the Cotonou Channel, remain scarce. This research aims to fill this gap by examining the impacts of tidal dynamics on zooplankton through an intensive 25 h survey in the Cotonou Channel. This high-resolution study captures the fine-scale temporal variations in zooplankton communities and their immediate responses to tidal cycles.
The findings will provide insights into how tidal forces influence zooplankton, highlighting their adaptive capacity to rapidly changing environmental conditions. Such understanding is crucial for predicting how these communities might respond to broader environmental changes, including those driven by climate change. Moreover, these insights will help assess the resilience and vulnerability of the lagoon’s ecosystem, informing conservation strategies and sustainable management practices that are essential for maintaining the ecological balance and supporting local economies.
The primary research questions guiding this study are: (1) How do tidal cycles influence the high frequency variations of physicochemical properties in the Cotonou Channel? (2) What are the short-term variations in zooplankton abundance and diversity in response to tidal movements? (3) Does the variation of physicochemical parameters drive those of zooplankton composition?
Our approach is based on the analysis of zooplankton composition, abundance, and diversity during different tidal phases and of their correlation with physicochemical variations and salinity in particular.

2. Materials and Methods

2.1. Study Area and Tide Characteristics

The Cotonou Channel is located in the southeast of Benin, between latitudes 2°25′50″ and 2°26′56″ north and longitudes 6°21′03″ and 6°23′39″ east (Figure 1). This Channel of ~4 km long and ~300 m wide serves as a zone for water mass exchanges between Nokoué Lagoon and the Atlantic Ocean [7,20].
The Cotonou Channel is primarily influenced by semi-diurnal microtidal oceanic tides with diurnal inequalities. In the ocean, the semi-diurnal tidal amplitude typically ranges from ~95 cm during spring tides to ~30 cm during neap tides, while the diurnal tidal amplitude is of ~15 cm [12]. Within the shallow Cotonou Channel, tidal amplitudes are strongly attenuated by frictional effects and interactions with river flows. These interactions also create asymmetry between the durations of tidal flood and ebb [12,13]. As a result, the tidal amplitude is reduced to only a few centimeters in the Nokoué Lagoon, which is consequently considered as a choked, flood-dominated lagoon. Additionally, the strong seasonality of river discharge into the lagoon, which varies from a few tens of m3/s during the dry season to ~1200 m3/s during the wet season due to the West African monsoon, causes seasonal variations in tidal amplitude and asymmetry [12,13]. During the dry season’s spring tides, the durations of the rising and falling tides are slightly unequal, resulting in minimal tidal asymmetry. In contrast, during the wet season, the semi-diurnal tidal amplitude decreases and the asymmetry between rising and falling tides increases.
In the Cotonou Channel where our study focused, typical tidal amplitudes are 0.1–0.2 m, tidal currents can be stronger than 1 m/s, and tidal flows of ±500–800 m3/s [12,13,21]. In July, the month during which our field campaign took place, typical river discharge in the Lagoon and net flow from the Lagoon to the Atlantic Ocean are ~100 m3/s [6,21].

2.2. Sample Collection and Analysis Techniques

2.2.1. Sampling Location and Duration

Zooplankton samples and physicochemical parameters were collected at a fixed point located at coordinates 6°21′54.2″ N; 2°26′19.9″ E, situated near the center of the Cotonou Channel (Figure 1). Sampling was conducted over a 25-hour period at around hourly intervals, starting from 4:00 p.m. on 24 July 2020, and concluding at 5:00 p.m. on 25 July 2020. The end of July was chosen due to its alignment with the end of the large wet season in Cotonou, characterized by significant salinity contrasts between the Nokoué Lagoon (Salinity~3–4) and the coastal ocean (Salinity~35). Moreover, in July, oceanic tides still penetrate into the lagoon without being fully attenuated by river discharge [12,13]. Additionally, during the specified dates of July 24–25, tidal coefficients ranged from 75 to 85, corresponding to intermediate tidal amplitudes and moderate spring tides.

2.2.2. Physicochemical Parameters

Physicochemical parameters including pH, water temperature, dissolved oxygen, salinity, and turbidity were measured using a WTW-3630IDS Multi-Parameter Probe (Xylem Analytics Germany GmbH, Weilheim, Germany) and a Valeport MIDAS CTD+ 300 Conductivity-Temperature-Depth (CTD) probe (Valeport Ltd., Totnes, Devon, UK) equipped with a turbidity sensor. A total of 70 vertical profiles of physicochemical parameters were conducted from the surface to the bottom of the channel, with a vertical resolution of 0.1 m and a sampling frequency of 20–30 min. For the purpose of this study, these 70 vertical profiles were averaged from the surface to a depth of 1 m to be consistent with zooplankton sampling.

2.2.3. Water Exchange Assessment

Water exchanges between the Atlantic Ocean and the Nokoué Lagoon were assessed using an Teledyne RDI WorkHorse 1200-kHz Acoustic Doppler Current Profiler (ADCP) (Teledyne RD Instruments, Poway, CA, USA). This instrument captured vertical current profiles at 1-s intervals along a nominal section oriented transversely to the channel’s banks (black line in Figure 1). Each section, completed in less than 5 min, allowed for the integration of currents between the two banks of the channel and, in turn, used to determine the net inflow or outflow through the section.

2.2.4. Zooplankton Collection, Preservation and Identification

Zooplankton community composition was determined from 25 samples collected using a plankton net with a 40 cm diameter opening and a 50 µm mesh size, equipped with a mechanical flowmeter (Model 2030R6, General Oceanics, Inc., Miami, FL, USA). The net was towed horizontally at a depth of approximately 50 cm for around 35 to 45 s, filtering a total volume of ~2.5 to 4.5 m3. Samples were preserved in 70% ethanol in 70 mL pill containers in the field and later examined under an OPTIKA B-290TB Optical Microscope (OPTIKA S.r.l., Ponteranica, Italy) [8].
Identification was conducted using taxonomic keys specific to Sahelo-Sudanian African zooplankton and other regions [22,23,24,25,26,27,28,29,30,31,32,33,34,35,36,37], allowing for identification to the lowest possible taxonomic level. Zooplankton were counted by analyzing diluted samples, with each 1 mL sample diluted fivefold. From each station, 1 mL of the diluted mixture was used as a replicate, and at least five replicates were analyzed until a species richness plateau was reached, defined as the absence of new species in three consecutive replicates [8].
The results from these replicates were pooled to determine the composition and relative abundance of zooplankton for each station. Zooplankton abundance (ind. L−1) was calculated by accounting for the number of replicates, dilution ratio, and total sample volume [8].
Certain organisms, referred to as “other zooplankton”, could not be formally identified and were distinguished based on specific morphological traits. These were classified as distinct, unnamed taxa of copepods, such as “calanoid spp1” [8]. The pooled results provided a comprehensive overview of the zooplankton composition and relative abundance for each station.

2.3. Statistical Analysis

2.3.1. Diversity Indices

The quantitative biological data obtained from the zooplankton counts were used to assess different parameters. The alpha diversity takes into account the number of species present (species richness) and their relative abundance (evenness) within the same environment through three indices [38,39]:
  • Species richness, which corresponds to the number of species present S.
  • Shannon–Wiener Diversity Index (H′, in bits), which evaluates the extent of species diversity in the environment using the formula:
    H = n i N × log 2 ( n i N )
    where ni is the number of individuals for species i, and N is the total number of individuals in the environment.
  • Piélou’s evenness index (J), which measures the evenness (or equitable distribution) of species in a population relative to a theoretical equal distribution among all species. It is calculated using the formula:
J = H log 2 ( S )
Piélou’s index ranges from 0 (dominance of a single species) to 1 (equal distribution of individuals among the populations).
Additionally, the occurrence frequency (Focc) of taxa is determined by the following relationship [40]:
F o c c = P a P × 100
where Pa is the total number of samples containing the considered taxon, and P is the total number of samples taken (25). This frequency of occurrence allows for categorizing taxa according to their distribution as either frequent (Focc > 50%), occasional (25% < Focc < 50%), infrequent (Focc < 25%), or rare (Focc < 5%) [40].

2.3.2. Univariate and Multivariate Analysis

The statistical analyses were conducted using R version 4.3.2 [41]. A Pearson correlation test assessed relationships among abiotic parameters and between salinity and key biological parameters such as species richness and abundance of main zooplankton taxa. To explore the relationships between environmental variables and zooplankton dynamics, a principal component analysis (PCA) was carried out in R. The aim of this analysis was to identify the main environmental factors explaining the distribution of zooplankton species in the Cotonou Channel. Given the significant temporal variations in salinity and its high correlation with other abiotic parameters, we investigated variations in zooplankton diversity and abundance in relation to salinity. Salinity is recognized as a crucial factor influencing both zooplankton and overall ecosystem dynamics (e.g., [8,42,43]).
The relationships between salinity and various abiotic parameters (pH, turbidity, dissolved oxygen, temperature) and biotic parameters (biodiversity indices, abundance) were graphically explored using the ggplot2 package [44] in R. Scatter plots and smoothing curves derived from generalized additive models (GAM) were employed to visualize trends, with the smoothing curves complemented by 95% confidence intervals to illustrate result robustness. This analysis aimed to characterize water bodies based on their salinity.
One–way ANOVA was performed to assess significant differences in physicochemical parameters (salinity, turbidity, temperature, pH, dissolved oxygen) and biological parameters (abundance, H′, J) across different water masses (freshwater, mixed, seawater). Post hoc comparisons between means of these parameters across water masses were conducted using the Student–Newman–Keuls test following ANOVA. Prior to ANOVA, the Shapiro–Wilk test was used to assess Gaussian distribution. Non-normally distributed data underwent a Kruskal–Wallis test (H test) at a 5% significance level, using the “agricolae” package [45] followed by a Dunn post hoc test.

3. Results

3.1. Variation of Physicochemical Parameters

Over the 25-hour observation period, parameters such as flow rate, salinity, temperature, turbidity, and pH showed two peaks and two troughs, corresponding to the semidiurnal tide cycle in the Cotonou Channel (Figure 2). The flow rate, estimated from ADCP measurements, was strongly negative, indicating incoming flow from the ocean to Nokoué Lagoon, between 6 and 8 p.m. on 24 July and between 7 and 9 a.m. on 25 July, reaching maximum negative values of −600 m3 s−1 (Figure 2a). In contrast, the flow rate was strongly positive, indicating outgoing flow from the lagoon to the ocean, between around 12 p.m. and 5 a.m., and again after noon on 25 July, with maximum positive values of 700 m3 s−1.
When the flow reversed from positive to negative, salinity rapidly increased from 2 to 36 within approximately 1 h (Figure 2b). Conversely, when the flow reversed from negative to positive, salinity decreased more gradually from 36 to 5 in 2–3 h, and then from 5 to 2 over the following 5 h.
Associated with salinity changes, the surface water temperature varied from 24 °C when seawater penetrated the channel and salinity was at its maximum, to 28 °C when freshwater exited the lagoon (Figure 2b). Similarly, turbidity significantly increased from 10 FTU with high salinity water to 200 FTU with low salinity water. The pH decreased from 8.1 to 7.7. Dissolved oxygen exhibited more complex variations, ranging from 7.0 to 7.9 mg L−1, but these changes were not in phase with the other physicochemical parameters (Figure 2c).
Thus, on a semi-diurnal scale (every 12 h), during flood tides, the advection of seawater into the channel (negative flow values) lasted from 5 to 6 h and was associated with an increase in salinity, a decrease in temperature, an increase in pH, and a decrease in turbidity. Conversely, during ebb tides, the outflow of freshwater from the lagoon to the ocean (positive flow values) was accompanied by a variation in physicochemical parameters opposite to the previous phase.
Correlation coefficients between the abiotic parameters were computed. A strong negative correlation exists between salinity and temperature (r = −0.93, p < 0.001), suggesting that higher salinity is associated with lower temperatures. pH has a strong positive correlation with salinity (r = 0.85, p < 0.001) and a strong negative correlation with turbidity (r = −0.87, p < 0.001), indicating that increased salinity leads to higher pH, while higher turbidity lowers pH. Temperature and turbidity also show a moderate positive correlation (r = 0.56, p < 0.01). Dissolved oxygen, however, exhibits weak correlations with the other parameters, indicating it is less associated with changes in salinity, temperature, pH, and turbidity.

3.2. Water Mass Characteristics

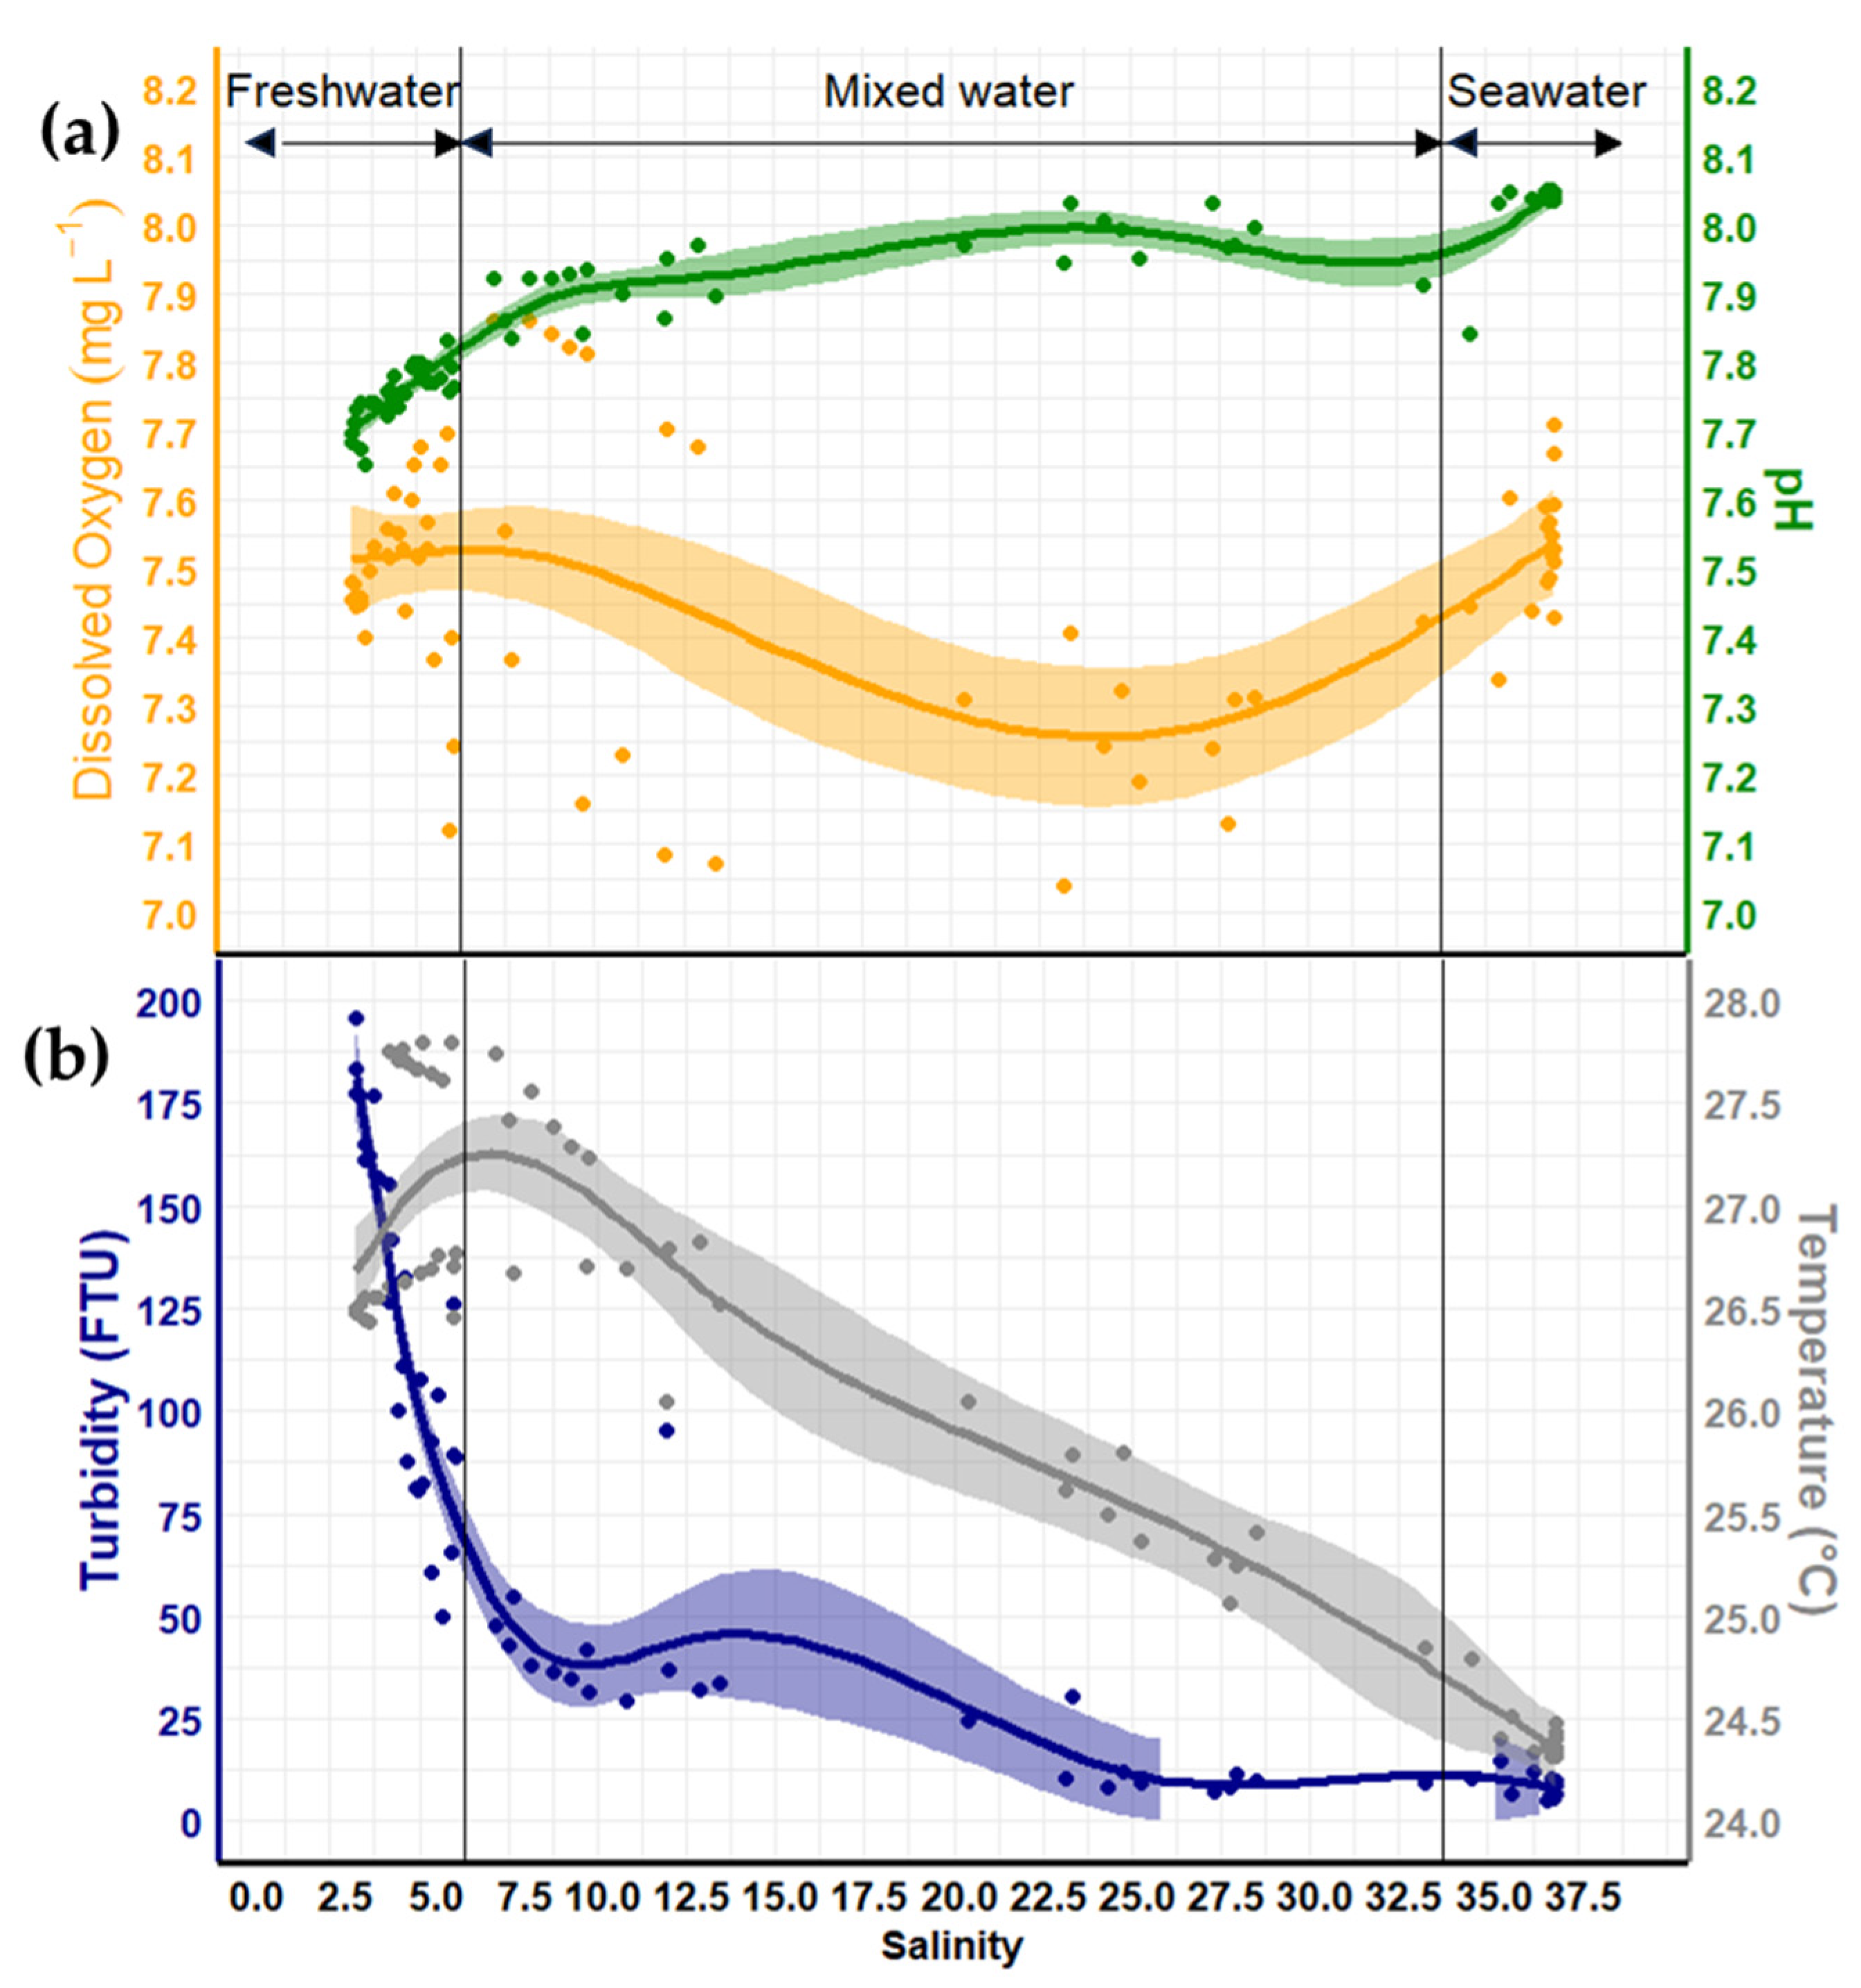
To better highlight the interconnectedness of salinity with other abiotic parameters, we examined the relationships of temperature, dissolved oxygen, pH, and turbidity as functions of salinity (Figure 3). Freshwater masses originating from the lagoon were characterized by relatively low salinity (S < 5), high temperature (26–28 °C), high turbidity (>40 FTU), and a pH of 7.8. In contrast, oceanic water masses exhibited high salinity (34–36), low temperature (<24.5 °C), very low turbidity (<10 FTU), and a pH of 8 (Figure 3). The mixing of these two water masses during tidal cycles resulted in water displaying intermediate and highly variable characteristics (from oligohaline to euhaline). Both water masses had similar dissolved oxygen concentrations, averaging around 7.5 mg L−1.
The Kruskal–Wallis test indicated highly significant differences in mean salinity and mean turbidity among the three water masses (p < 0.05) (Table 1). Additionally, it revealed a significant difference in temperature among the three water masses (p < 0.05), though the mean temperature was similar between freshwater and mixed water. The ANOVA test demonstrated a significant difference in mean pH values among the three water masses, while no significant difference was found for dissolved oxygen (p > 0.05).

3.3. Taxonomic Composition, Diversity, and Abundance of Zooplankton

During the study, 66 taxa of zooplankton belonging to four phyla and eight groups were identified: Rotifera (Rotifers), Arthropoda (Copepods, Cladocerans, Cirripeds, Decapods, and Ostracods), Mollusca (Molluscs), and Chaetognatha (Chaetognaths) (Table 2). Of these, 61 taxa were classified as species while 5 were categorized at a higher taxonomic level, encompassing more than one species.
During the study, rotifers were the group with the most species (35 species, Figure 4), followed by copepods (17 species, Figure 4).
The average zooplankton abundance over the 25-hour observation period was ~26 ind L−1. Copepods were the most abundant group, constituting 71.2% of the zooplankton, followed by rotifers at 25.1%. The other six groups were significantly less abundant, totaling less than 4% of the zooplankton abundance (Figure 4).
Within the copepods, nauplii, which are the larval stages of these organisms and could not be diagnosed at the species level, were pooled into one single taxon, accounting for 62.2% of the total abundance. Among the 20 other taxa (including 17 species) of copepods identified, Calanoid spp1 and Oithona sp. were the most abundant (accounting for 15.8% and 10.3% of the total copepod abundance, respectively), followed by Temora sp. (4.2%), Calanoid spp2 (2.0%), Euterpina acutifrons (1.2%), and Cyclopoid sp1 (1.1%) (Table 2).
Among the 35 species of rotifers present during the study, Synchaeta bicornis was the most abundant and largely dominant species, representing 61.7% of the total rotifer abundance. It was followed by Filinia longiseta (13.1%), Brachionus plicatilis (11.6%), and B. calyciflorus (8.5%) (Table 2).
The cladocerans were dominated by Penilia avirostris representing 74.5% of the total cladoceran abundance, followed by Moina micrura (23.8%) and Ceriodaphnia sp. (1.7%) (Table 2).

3.4. Occurrence of Zooplankton Taxa

The categorization of taxa based on their occurrence frequency provides valuable insights into their ecological significance within the environment. Among the 66 taxa identified during the 25-hour period, 17 were observed frequently, 15 occasionally, 20 infrequently, and 14 rarely. The top five most frequently observed zooplankton taxa were Calanoid spp1, Cyclopoid sp1, Oithona sp., Calanoid spp2, and Synchaeta bicornis. The naupliar stages of copepods and cirripeds were also frequent (Table 2).

3.5. Temporal Variation in Zooplankton Diversity and Abundance

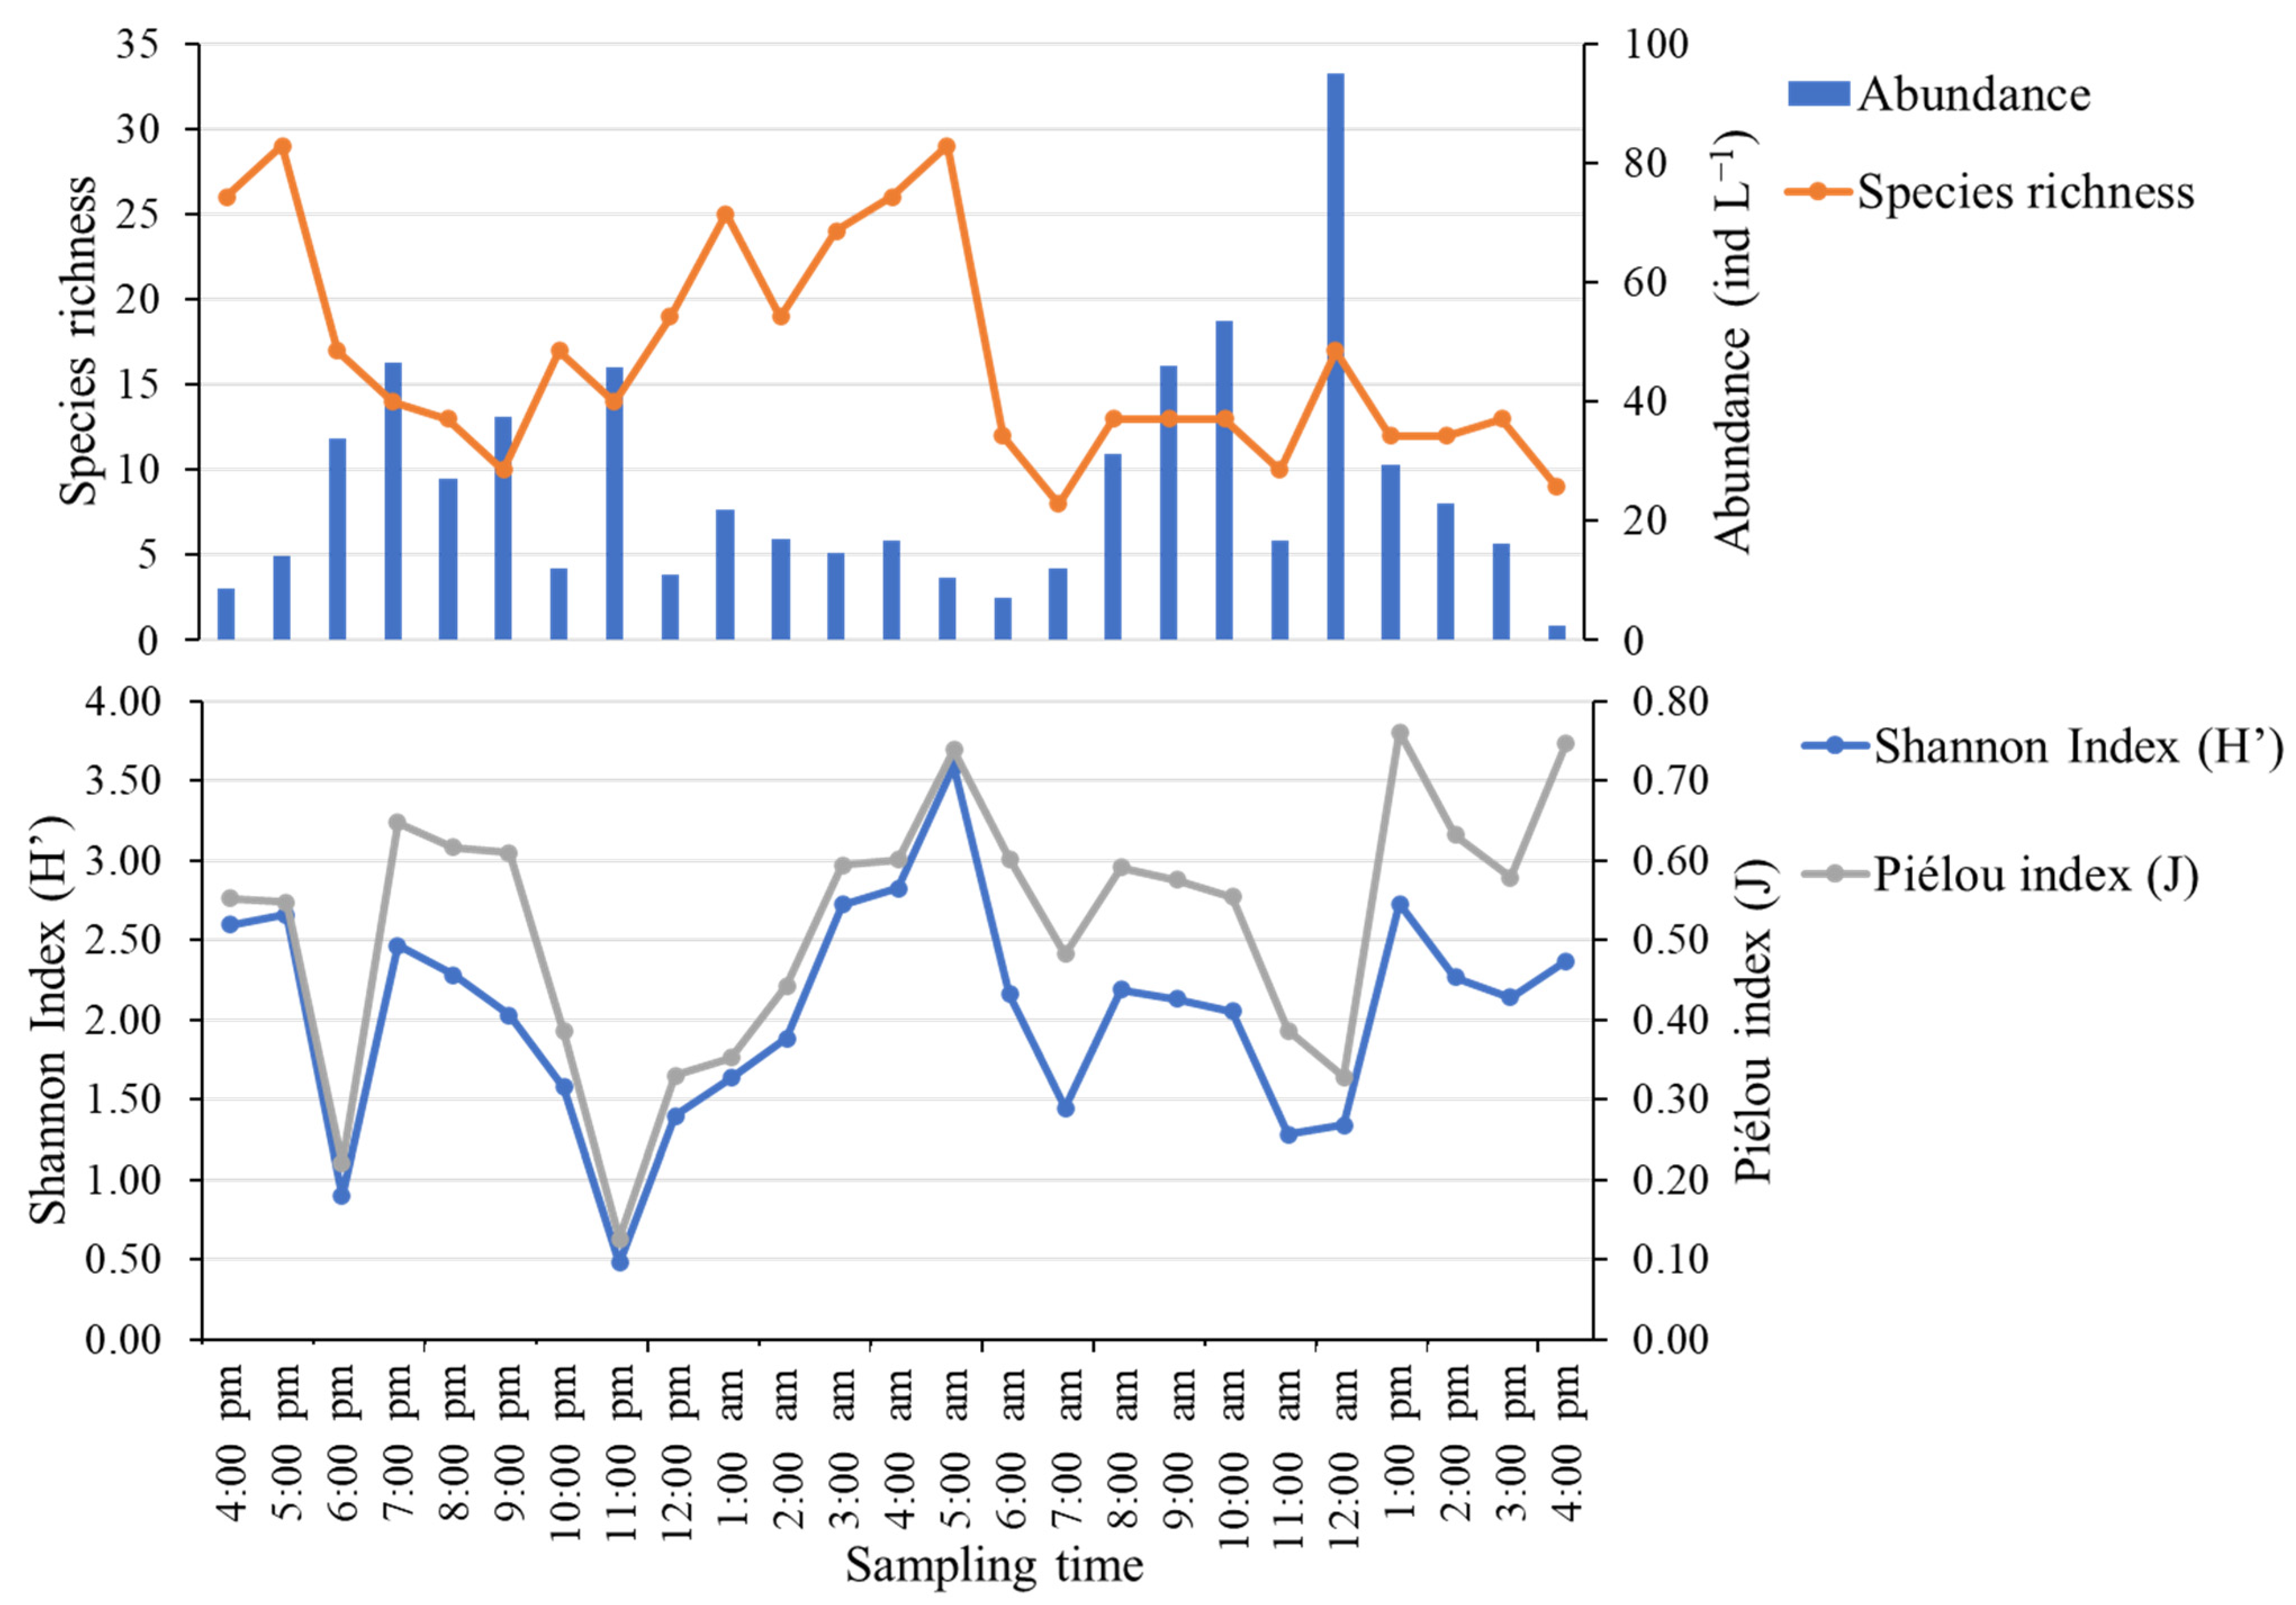
During the 25-hour period, species richness in each of the 25 samples varied between 8 and 29 species, while the total abundance of individuals ranged from 2 to 95 ind L−1. The Shannon diversity index ranged between 0.5 to 3.6, and Piélou’s evenness index ranged between 0.1 to 0.8 (Figure 5). The maximal species richness value was obtained at 5 p.m. on 24 July 2020 and at 5 a.m. on 25 July 2020. The abundance is maximal between 6 p.m. and 12 a.m. on 24 July, and then between approximately 9 a.m. and 1 p.m. on 25 July. These maximal abundance values are generally associated with minimal species richness values (<15 species), while low abundance values seem to be associated with maximal species richness values. The same trend is observed for diversity indices. The maximal abundance values are associated with minimal values of the Shannon index and Piélou’s index, whereas the low abundance values are associated with high diversity index values.

3.6. Relationship between Zooplankton and Environmental Parameters

The PCA indicated that salinity, temperature, pH, turbidity, and dissolved oxygen significantly influence zooplankton distribution in the studied environment (Figure 6). Among these, salinity and pH showed a positive correlation with each other, while both were negatively correlated with temperature and turbidity.
The abundance of species such as Oithona sp., Temora sp., Oncaea clevei, Penilia avirostris, and Euterpina acutifrons, as members of Chaetognatha is positively associated with high pH and salinity levels. Additionally, the Piélou index and Shannon diversity index are positively correlated with dissolved oxygen levels. In contrast, species like Filinia longiseta, Brachionus calyciflorus, Moina micrura, and Brachionus plicatilis are positively associated with temperature and turbidity but negatively associated with pH and salinity. Synchaeta bicornis did not show a strong association with any of the environmental variables.
These findings, along with previous research on the Nokoué Lagoon [8], underscore the pivotal role of salinity in influencing zooplankton communities. Consequently, the subsequent phase of this study will delve deeper into the impact of salinity variations on zooplankton populations, aiming to provide a comprehensive understanding of these dynamics.

3.7. Variation in Zooplankton Diversity and Abundance Relative to Salinity

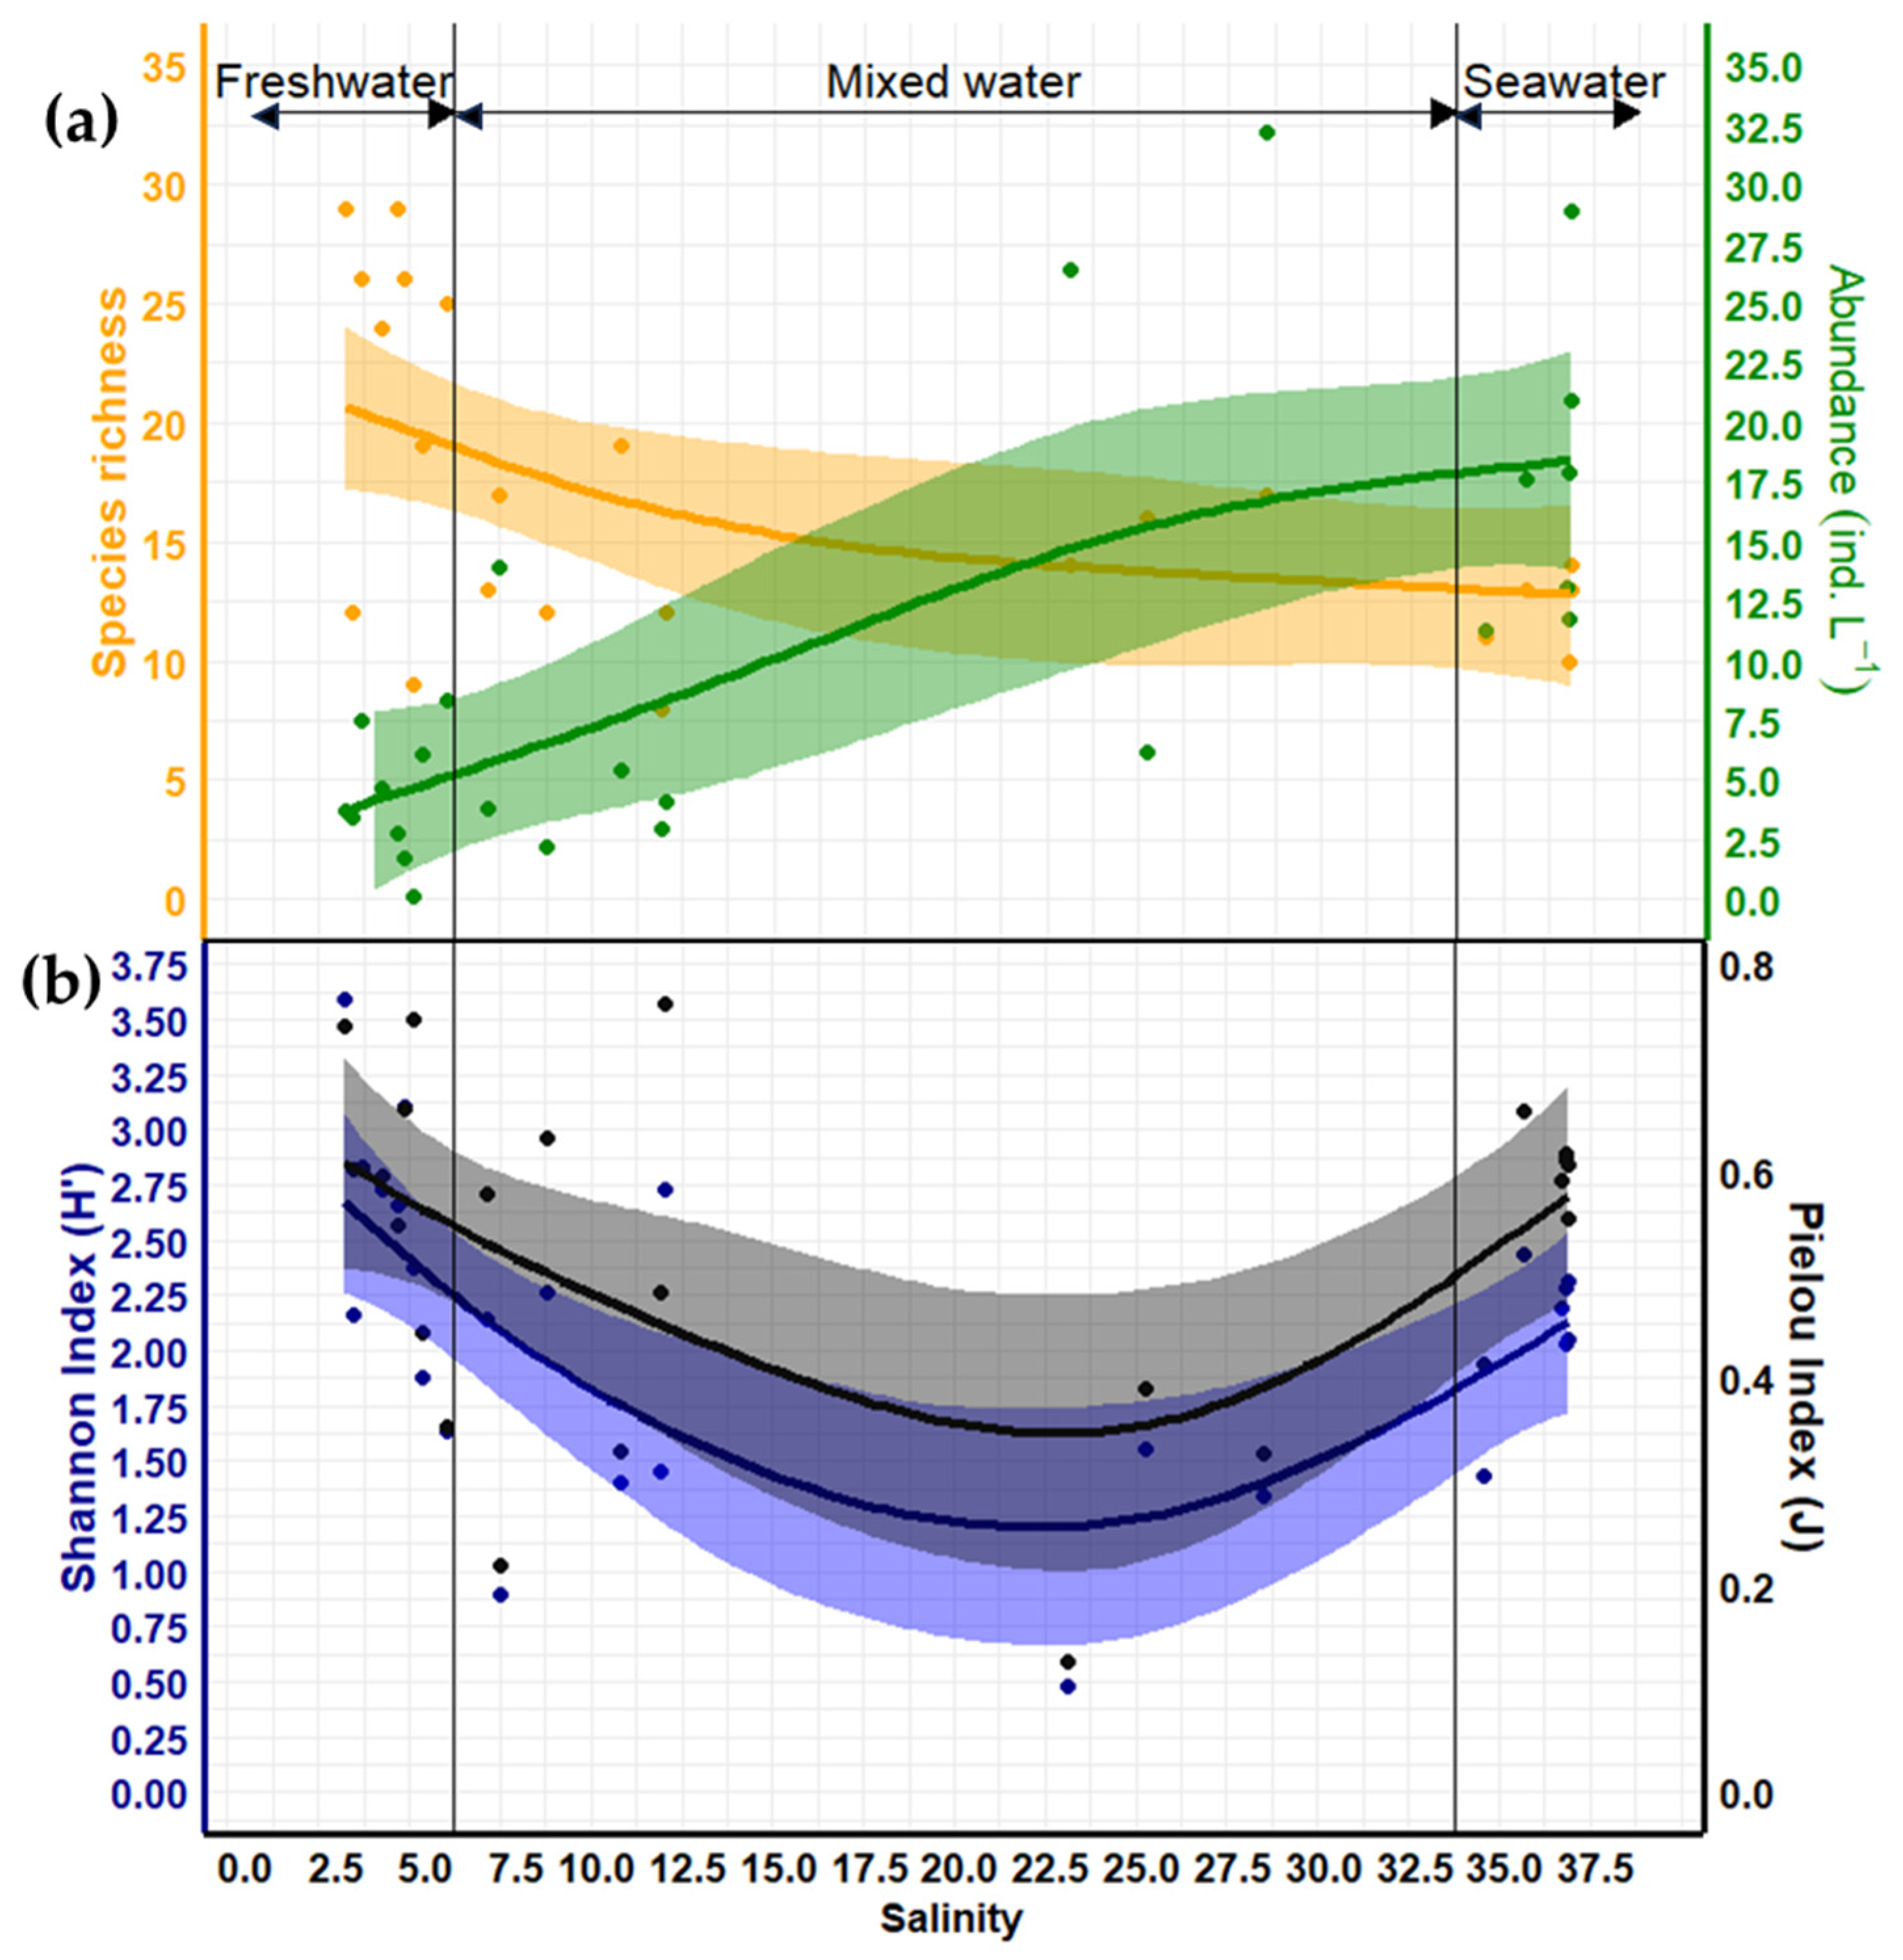
Species richness (abundance, respectively), tended to increase (decrease) during ebb tides when salinity was low and the flow in the Cotonou Channel was directed towards the Atlantic Ocean and to decrease during flood tides when salinity was high and the flow was directed towards the Nokoué Lagoon (Figure 7). Therefore, species richness was significantly negatively correlated with salinity (r = −0.51, p < 0.01), whereas abundance had a significant positive correlation (r = 0.60, p < 0.005).
In contrast, the Shannon diversity index and Piélou’s evenness index did not show significant negative correlations with salinity fluctuations (r = −0.26 and −0.08, respectively). However, these indexes reached their maximum values when salinity was extremely low (freshwater: ebb tide) or high (seawater: flood tide), and their minimum values at intermediate salinity levels correspond to mixed waters (Figure 7).
The Kruskal-Wallis test revealed a significant difference in mean zooplankton abundance among the three water masses (p < 0.05), although the mean values for freshwater and mixed water were similar (Table 3). In contrast, the ANOVA test demonstrated a significant difference in the mean Shannon index among the three water masses, particularly between freshwater and seawater. However, no significant difference was observed for the Piélou index (p > 0.05) (Table 3).
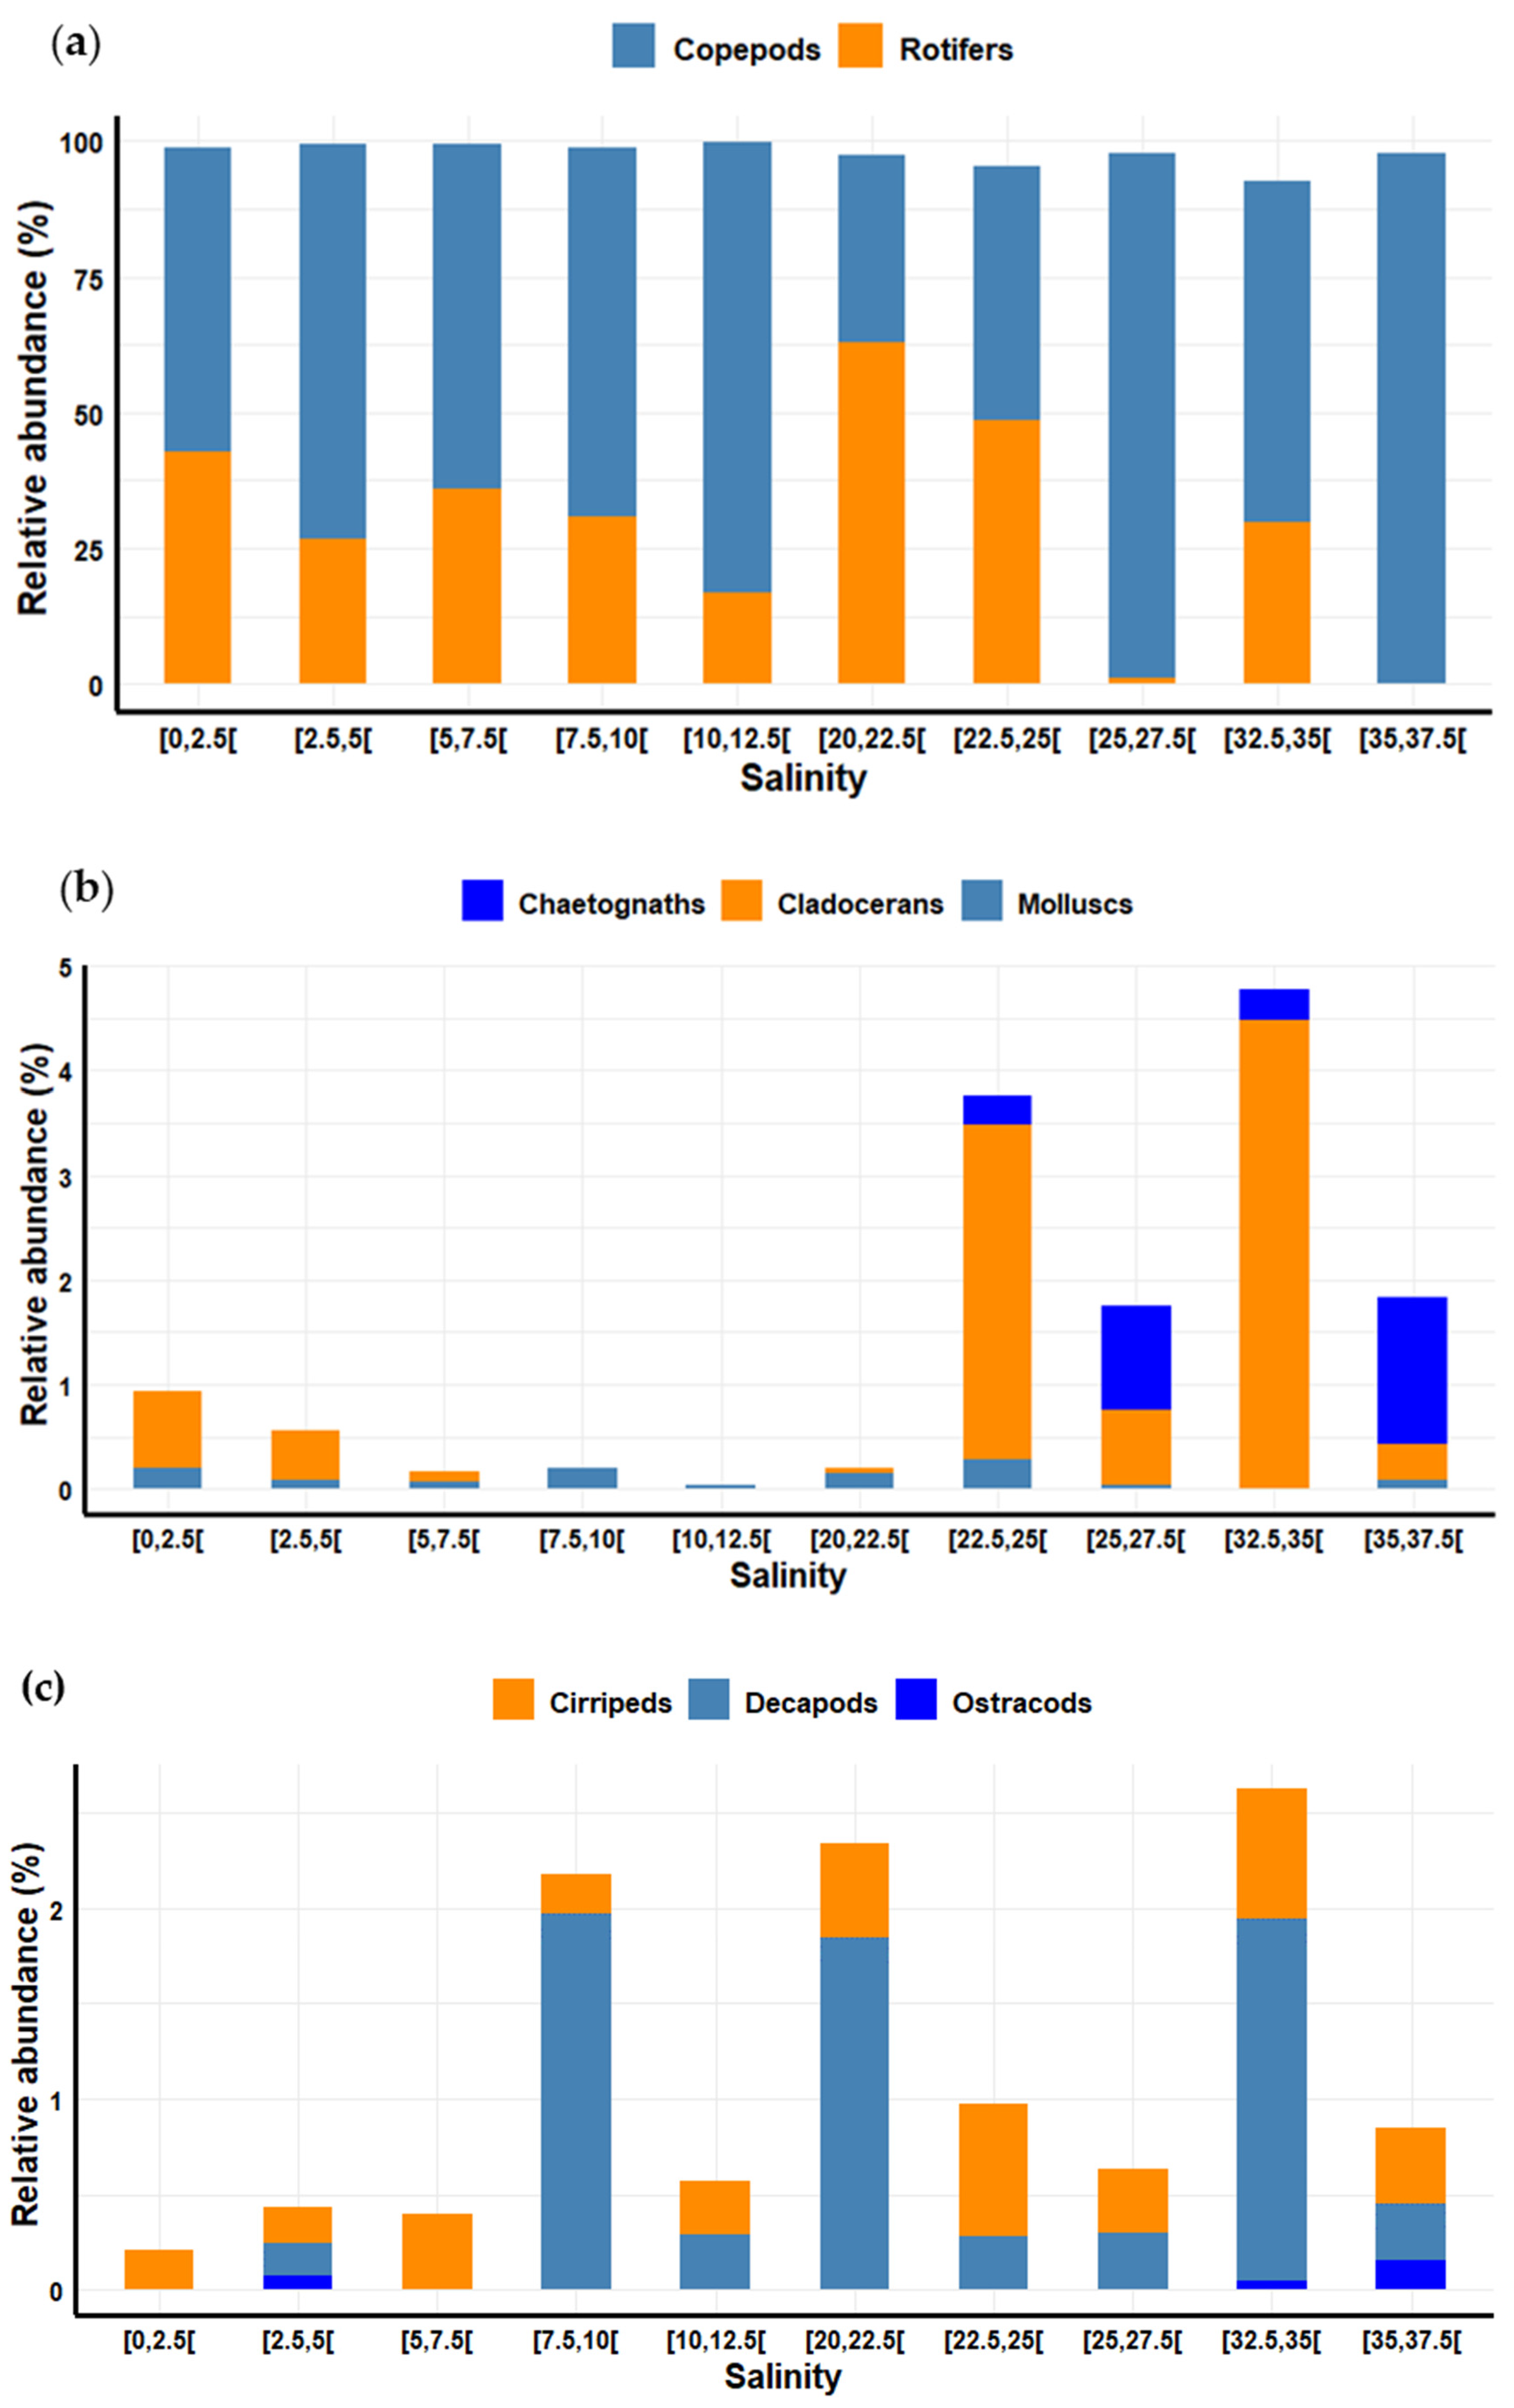
Copepods were continuously present regardless of salinity levels (Figure 8a), showing a positive but not significant correlation (r = 0.37, p > 0.05). In contrast, rotifers were abundant only in brackish or low salinity waters, primarily during ebb tides, and exhibited a significant negative correlation with salinity (r = −0.44, p < 0.05). Rotifers were completely absent when salinity exceeded 35 (Figure 8a).
Cladocerans and decapods were present across all salinity ranges but in very low proportions. Cladocerans did not show a significant correlation (r = 0.29, p > 0.05) with salinity (Figure 8b). Decapods also did not show a significant correlation (r = 0.27, p > 0.05) with salinity (Figure 8c). Other zooplankton groups were rarely observed and in very low abundance, preventing any definitive conclusions.
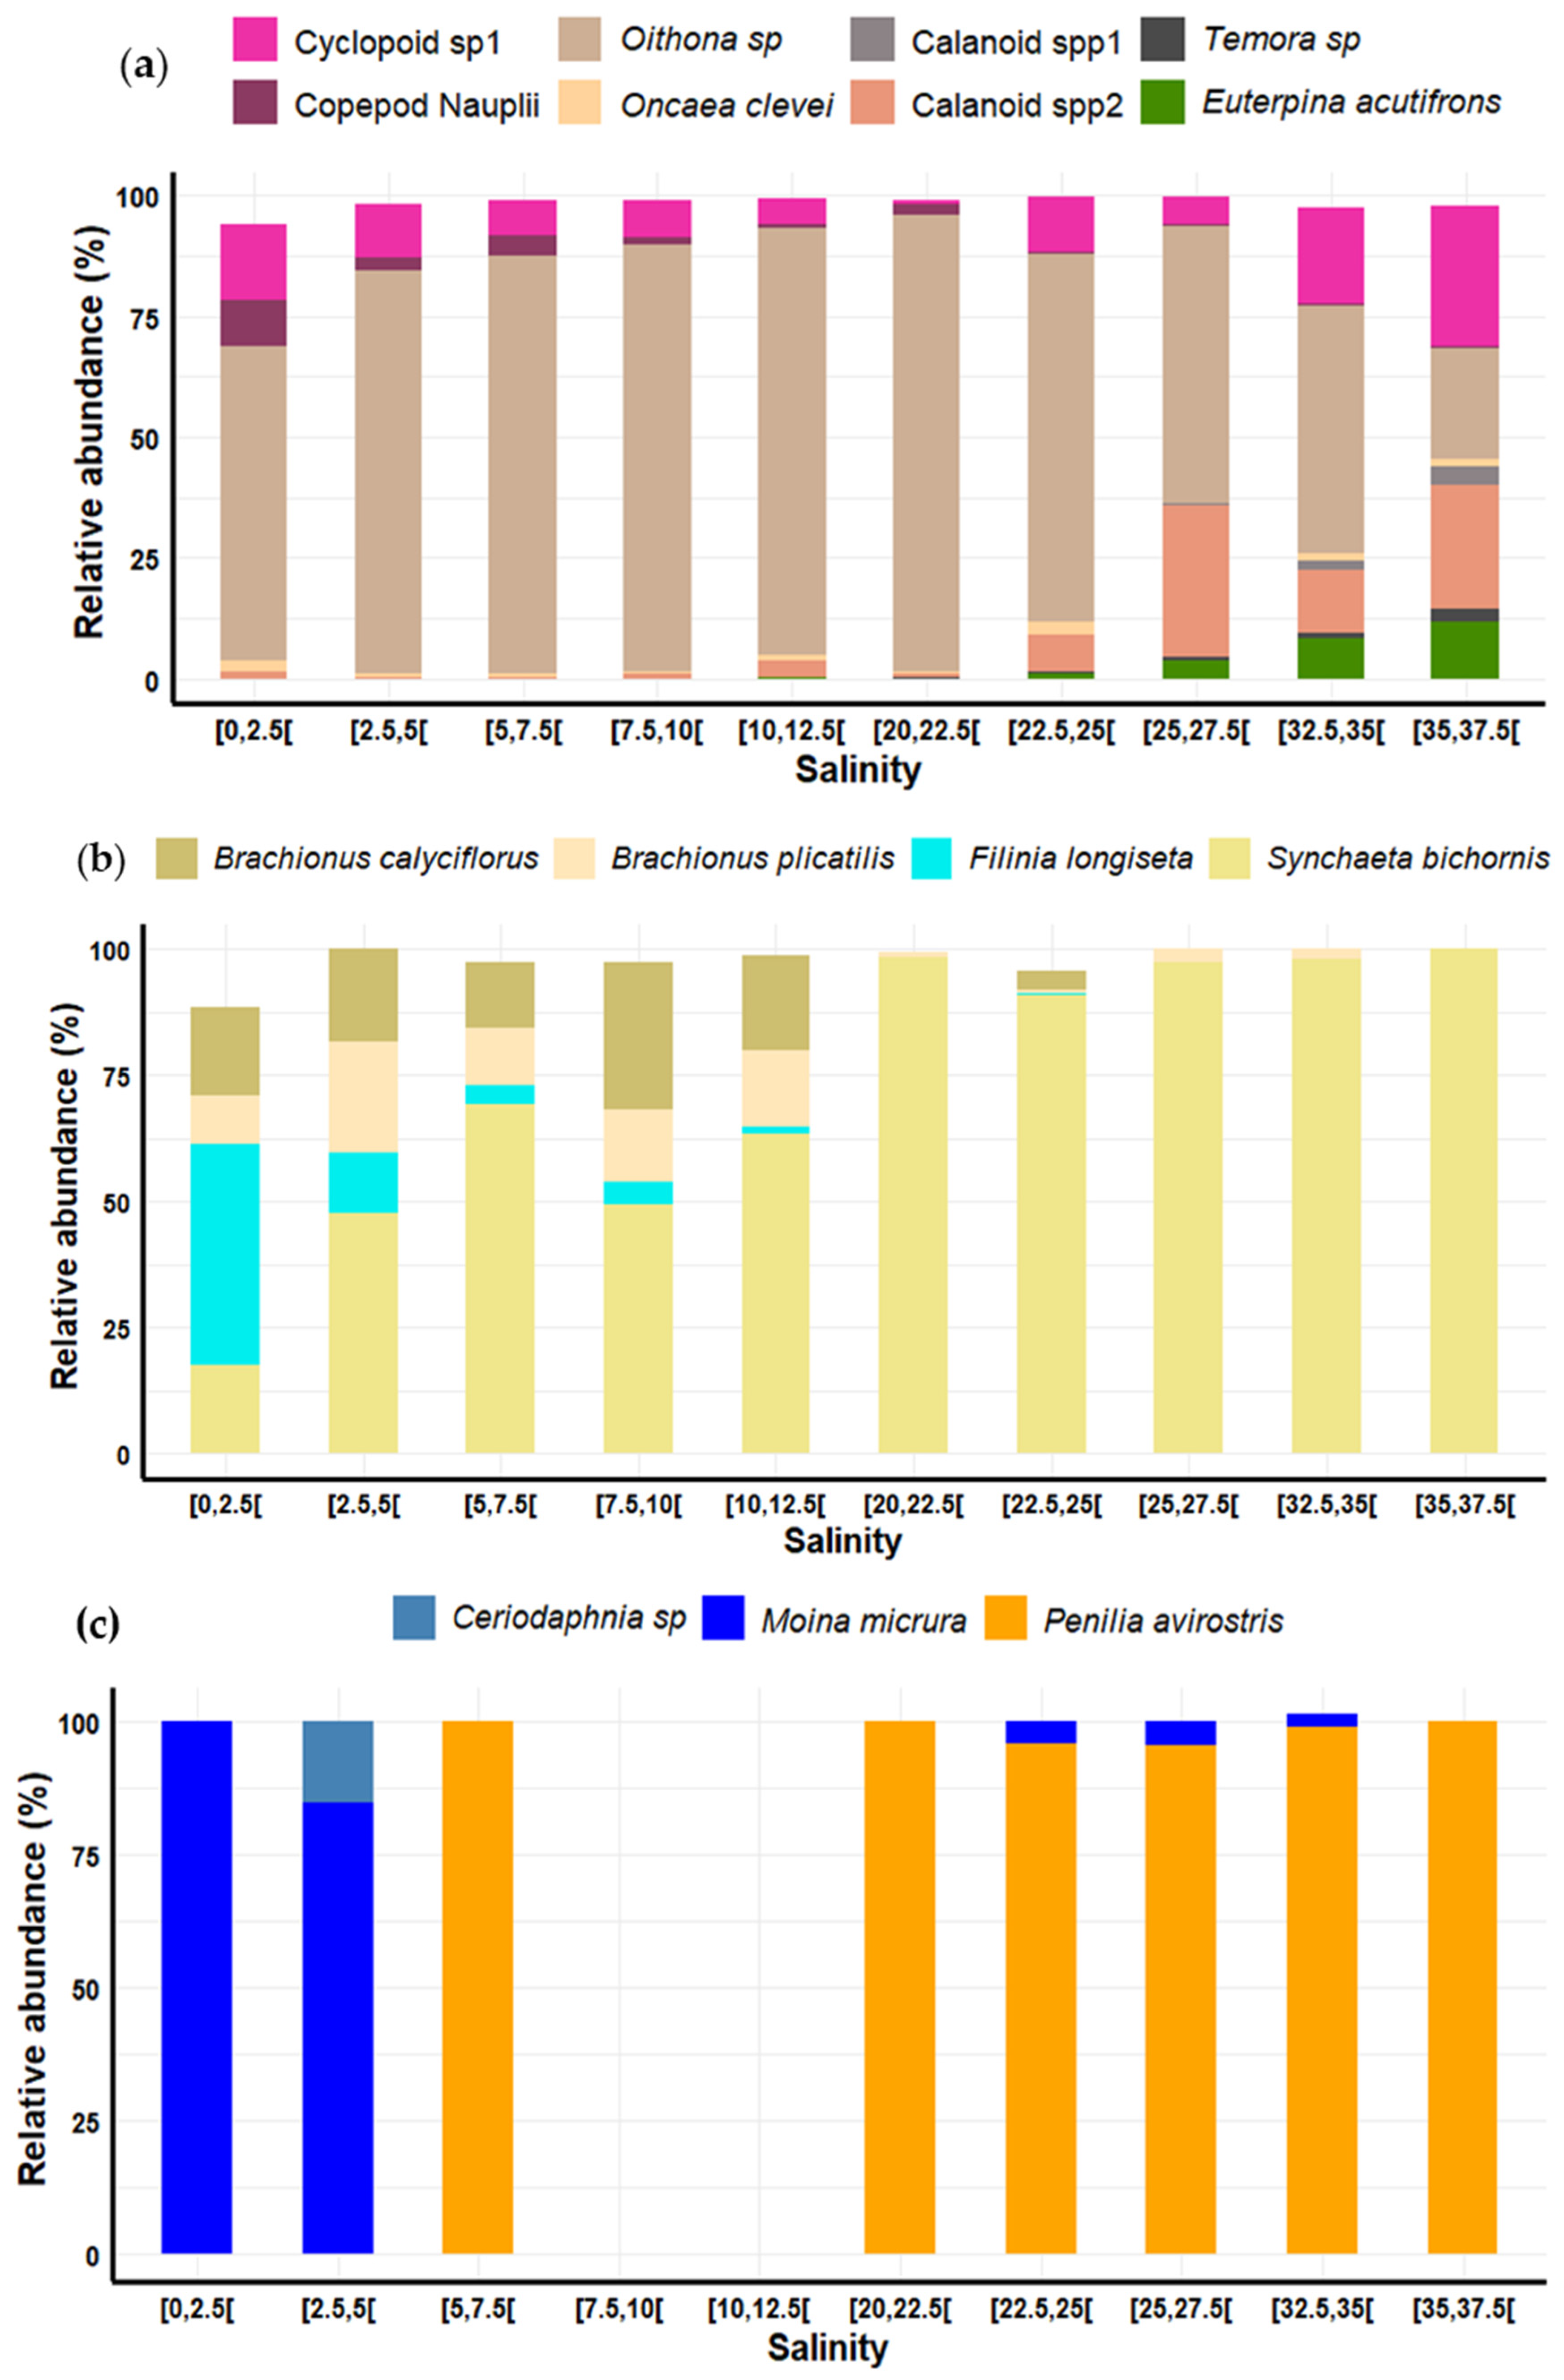
Within the copepods, nauplii were more abundant when salinity was low (during ebb tides) or intermediate (salinity < 22.5), showing significant negative correlations with salinity (r = −0.73, p < 0.001; Figure 9a). In contrast, Calanoid spp1 was more abundant when salinity was high (during flood tides), exhibiting a significant positive correlation with salinity (r = 0.53, p < 0.01). Temora sp., Oncaea clevei, Euterpina acutifrons were more abundant when salinity exceeded 20 (mainly during flood tides) and showed strong positive correlations with salinity (respectively r = 0.84, 0.83, 0.83, p < 0.001). Cyclopoid sp1 showed no significant correlation with salinity (r = 0.12, p > 0.05).
Within the rotifers, Brachionus calyciflorus, B. plicatilis, and Filinia longiseta were much more abundant at low salinity levels (salinity < 12.5) during ebb tides (Figure 9b). However, as salinity increased above 12.5, these species nearly disappeared from the environment, showing a significant negative correlation with salinity (r = −0.45, −0.55, −0.56, respectively). In contrast, Synchaeta bicornis became dominant during flood tide when salinity increased, though it did not show a significant correlation with salinity (r = −0.06, p > 0.05).
Among the cladocerans, Penilia avirostris was present when salinity exceeded 5 and completely dominated during flood tide at salinity levels above 20 (Figure 9c). It exhibited a strong and significant positive correlation with salinity (r = 0.89, p < 0.001). Conversely, during ebb tide when salinity was low, the presence of Moina micrura, which was the dominant species, and Ceriodaphnia sp. was noted (Figure 9c). Moina micrura showed a significant and strong negative correlation with salinity (r = −0.63, p < 0.001) but Ceriodaphnia sp. was not significantly correlated to salinity (r = −0.26, p > 0.05).
Very low salinity water masses, categorized as freshwater, were dominated by copepod nauplii, Filinia longiseta, Brachionus calyciflorus, and Moina micrura, exhibiting relatively high diversity and evenness among species. In contrast, high salinity marine water masses, on the other hand, were characterized by the dominance of Oithona sp., Temora sp., Oncaea clevei, Calanoid spp1, Cyclopoid sp1, Penilia avirostris, Euterpina acutifrons, showing moderately high diversity but high evenness. Intermediate salinity water masses, associated with mixed waters, were dominated by nauplii, Synchaeta bicornis, Brachionus plicatilis, and Ceriodaphnia sp., displaying a wide range of diversity and evenness indices, including the lowest values for these indices at salinity levels around 20.

4. Discussion

4.1. On the Physicochemical Parameter Variations

The physicochemical parameters in the Cotonou Channel exhibited significant fluctuations during the 25-hour study period. These variations were induced by the semidiurnal oceanic tide that controls the dynamics of the Cotonou Channel [12,13], bringing different water masses depending on the tidal phase. Our sampling took place in July, a month characterized by a strong salinity contrast between the Nokoué Lagoon, which is almost entirely filled with freshwater [14,15] and the coastal Atlantic Ocean, characterized by marine water. The mixing of these two water masses during tidal cycles results in the channel water exhibiting intermediate and highly variable characteristics, ranging from oligohaline to euhaline.
An asymmetry was observed in the flow rate values and the duration of the ebb and flow tides (Figure 2). Negative flow rates, with maximum values of −600 m3/s, were observed for 4–5 h, followed by positive flow rates, with a maximum of 700 m3/s, observed for 7–8 h. This non-homogeneous duration in both the positive and negative flow phases, as well as the changes in salinity, confirms the flow-dominated nature of the Cotonou Channel [12,13]. The total net outgoing flow was estimated to be 210 m3/s during the complete semidiurnal tidal cycle from 5:30 p.m. on 24 July to 6:30 a.m. on 25 July, and 180 m3/s for the cycle from 9:00 p.m. on 24 July to 11:00 a.m. on 25 July. These estimates suggest a net river discharge of approximately 200 m3/s exiting the lagoon through the Cotonou Channel, slightly stronger than the typical values of 50–100 m3/s generally observed between July and August [6,21].
The integration of flux measurements from the channel (Figure 2) shows that 7.4 × 10⁶ m3 of oceanic water enters the lagoon during flood tide, with 1.5 × 10⁷ m3 exiting during ebb tide. Despite the outgoing volume being more than twice the incoming volume, a portion of water remains trapped within the lagoon after each tidal cycle [14]. To assess the retention of oceanic water in the lagoon across tidal phases, we use a salt budget, leveraging salt as a reliable tracer for oceanic waters. Integrating the salt flux (derived from Figure 2 and salinity data from Figure 3), we estimate that approximately 3.8 × 10⁸ kg of salt enters the lagoon during flood tide, while around 2.8 × 10⁸ kg is expelled during ebb tide. Therefore, around 25% of the incoming oceanic waters remain in the lagoon per tidal cycle. This retention represents a substantial fraction, serving as a persistent source of biogeochemical tracers and oceanic plankton for the lagoon, though it is slightly less than the 30% estimated by [14] for the dry season when river flow is minimal. As the rainy season progresses and river flow increases, this fraction decreases until it eventually reaches 0%.
During the ebb tide phase, the surface temperature exiting the lagoon was ~1.2 °C higher during the day (27.7 °C at around 4 p.m. on both 24 July and 25 July) than during the night (~26.5 °C at the middle of the night between 24 July and 25 July). This suggests a diurnal warming of the lagoon’s water associated with solar heating. The net surface heat flux Q, necessary to warm the lagoon’s water was estimated as:
Q = ρ c p H Δ T t
where ρ~1000 kg m−3 is the lagoon’s water density, cp = 4186 J kg−1 °C−1 is the water’s specific heat capacity, H~1.5 m is the mean depth of the lagoon in July [12], ΔT~1.2 °C is the observed temperature anomaly, t~12 h is the duration of the warming.
Using these values, the estimated net surface warming heat flux during the day was approximately 175 W m−2.
The dissolved oxygen concentration was the only physicochemical parameter that has not shown a direct relationship with salinity and the tidal cycle. This discrepancy can be attributed to the dynamic of oxygen in aquatic ecosystems. Unlike conservative parameters, which maintain a relatively stable concentration irrespective of external influences, oxygen concentration is subject to significant modulation by biological processes. These processes include the respiration of aquatic organisms, which consume oxygen, and photosynthesis, which produces it. Thus, while other physicochemical parameters may be predominantly influenced by tidal fluctuations or external environmental factors, the dissolved oxygen concentration reflects the intricate interplay between biological activity and environmental dynamics within the aquatic ecosystem.
Turbidity exhibited significant variability, ranging from approximately 10 NTU in very clear marine waters to 150–190 NTU in the lagoon’s turbid freshwater conditions. By applying the mean relationship between surface turbidity and suspended particulate matter (SPM), as established by [6] using a comprehensive lagoon database (SPM = 0.86 × turbidity + 4.3), we estimated maximum SPM concentrations of approximately 165 mg L−1. These findings align with the substantial turbid plume extending from the Ouémé River—situated northeast of the Nokoué Lagoon—to the Cotonou Channel in July 2024, where SPM values of 150–200 mg L−1 were observed [6]. The peak turbidity of the lagoon’s water occurs annually in July-August, coinciding with the onset of river flooding associated with the West African monsoon and the early mobilization of fine sediments during rising river flows. However, the turbid plume observed in July 2020, constituted the most intense sediment-laden plume observed annually in July between 2018 and 2022 [6]. Consequently, the turbid water mass observed in the Cotonou Channel during the ebb tide phases of our 25-hour study period, along with the associated zooplankton community, likely originates primarily from the Ouémé River. However, the non-linear relationship between turbidity and salinity (Figure 3) also indicates that turbidity is not a conservative tracer. The concavity of this relationship suggests the existence of a turbidity sink, probably related to the settling and sedimentation of suspended matter during their transit between the Nokoué lagoon and oceanic waters.

4.2. On the Zooplankton Community

4.2.1. Taxonomic Composition and Abundance

The general taxonomic richness (66 taxa) obtained in this study exceeds the 41 taxa reported by [1] in a 24-hour study in the Grand-Lahou coastal lagoon, Ivory Coast. This discrepancy may be due to differences in the methodologies: our study used an hourly sampling compared to every 4 h in [1], and we used a finer mesh size (50 µm vs. 64 µm). Among the taxa identified, rotifers were the most species-rich group (35 species), a finding consistent with [7] in the Nokoué Lagoon, but contrasting with [1], where copepods dominated. This difference is likely due to the high salinity in the Grand-Lahou Lagoon, which favors copepods over rotifers.
On average, copepods were the most abundant group (71%) over the 25-hour period, followed by rotifers (25%). Similar dominance of copepods has been reported in various estuaries and lagoons globally [1,10,17,19,46]. According to [47], copepod predominance is typical in brackish environments due to their resilience to variations in turbidity and salinity in the environment [10] and their predation on rotifers [48].

4.2.2. Species-Specific Observations

Within the copepods, Oithona sp. was the most abundant species, consistent with findings in the Cananéia Lagoon, Brazil [47], and Grand-Lahou Lagoon, Ivory Coast [1]. This predominance could be due to the halotolerance of these species [11], which allows them to thrive in lagoons under marine influence.
Rotifer species such as Brachionus plicatilis, Keratella cochlearis, K. tropica, and Synchaeta bicornis are euryhaline, thriving in marine-influenced lagoons [49,50,51]. The prevalence of infrequent species over occasional and frequent species highlights the habitat’s instability, driven by tidal cycles that disrupt zooplankton population structures. This instability is reflected in significant temporal variations in the Shannon diversity index and Piélou evenness indices.

4.2.3. Salinity Effects

During the 25-hour period, salinity in the Cotonou Channel ranged from below 5 to above 30, causing significant shifts in zooplankton community structure.
Species richness decreased with increasing salinity, a pattern observed for instance by [52] in New Zealand coastal lakes, [50] in a tropical lagoon, and [53] in a subtropical lagoon. This trend can be attributed to the fact that euryhaline species, which tolerate wide salinity ranges, are fewer than stenohaline species, which tolerate only narrow salinity ranges.
Low Shannon and Piélou indices at intermediate salinities can be attributed to euryhaline species’ dominance, whereas high indices at constant salinities (low or high) are due to a more balanced distribution of stenohaline and halophilic species, respectively. The observed pattern of maximum Shannon’s diversity and Piélou’s evenness indices in both freshwater and marine waters suggest optimal conditions for species coexistence and resource use at extreme salinities. In these ecosystems, environmental conditions may favor a more even distribution of zooplankton individuals among species, with no single species dominating and many species represented by similar numbers of individuals.
Zooplankton abundance, however, varied with the tidal cycle, increasing with flood tides and decreasing with ebb tides, similar to [10] in the Bonny estuary but contrary to [46] in the Changjiang estuary.
This high overall abundance of zooplankton during flood tides can be due to the fulfillment of the channel by marine waters and, therefore by marine zooplankton. Actually, during this study period (July), which corresponds to the major upwelling period in the Gulf of Guinea, marine waters are characterized by a high abundance of zooplankton [54]. Conversely, the lower overall abundance of zooplankton during ebb tides can be explained by many factors. At ebb tides, there is freshwater in the channel. Freshwater environments around the Cotonou Channel offer diverse habitats (three distinct rivers, Nokoué Lagoon, and large wetland areas) characterized by a greater range of physicochemical properties than the ocean coastal zone. These habitats are resource-rich, fostering numerous species adapted to specific conditions and promoting greater species richness. However, competition for limited resources often maintains individual population sizes at relatively low levels, resulting in lower overall abundance. Additionally, despite habitat diversity, spatial constraints and fluctuations in water levels may prevent freshwater populations from reaching high densities even under favorable conditions. Lastly, some freshwater species prioritize reproduction over individual growth, leading to smaller population sizes as energy resources are allocated to reproduction rather than growth, contributing to lower overall abundance.
At salinities above 12.5, rotifer species become scarce, with Synchaeta bicornis dominating when salinity exceeds 35 (seawater), resulting in an almost total absence of rotifers, consistent with previous studies [1,44]. In Nokoué Lagoon, Synchaeta bicornis’ tolerance to wide salinity ranges is well documented [8], and our results confirm this on a tidal scale. Low salinity environments (ebb tide) favored Moina micrura and Ceriodaphnia sp., aligning with their known freshwater adaptation [1,7]. The presence of Penilia avirostris in marine-influenced waters is consistent and can be explained by its ability to tolerate a wide range of salinities [1,55].
In mixed waters for intermediate salinities, nauplii, Synchaeta bicornis, Brachionus plicatilis, and Ceriodaphnia sp. dominated, with low evenness and diversity indices, reflecting species’ adaptation challenges to fluctuating conditions [18]. This indicates that tidal cycles contribute significantly to environmental instability.
While species richness and abundance decrease between freshwater and marine environments, the interaction between salinity gradients and ecological processes affects diversity indices differently, highlighting the complexity of community dynamics in response to environmental gradients.

4.3. On the Limitations of Our Study

One of the primary limitations of our study is its relatively short duration, encompassing only one cycle of 25 h. This limitation restricts our ability to capture the full range of tidal and physicochemical variations. We conducted our measurements during intermediate tidal coefficients, which do not reflect the full spectrum of tidal influences. Spring tides could induce stronger vertical mixing due to higher tidal forces, while neap tides could result in weaker vertical mixing and stronger stratification. These variations could significantly alter the physicochemical parameters and zooplankton community structure. More physicochemical parameters such as nutrients and dissolved organic matter could be included in the present study. A broader range of chemical parameters could provide a more comprehensive understanding of environmental influences. A longer study period in more than one sampling point, incorporating different tidal cycles under neap and spring tides would provide a more comprehensive understanding of the system’s dynamics.
Our study was also conducted in July, at the beginning of the flood season, when the salinity contrast between the Nokoué Lagoon and the coastal Atlantic Ocean is at its peak. This seasonal constraint limits our understanding of the tidal impact across different times of the year. During other seasons, variations in rainfall, river discharge, and salinity conditions could significantly influence the biological communities. For instance, during the dry season, reduced freshwater input leads to higher salinity levels [14,15] and different zooplankton assemblages, as observed in the Nokoué Lagoon by [8]. A year-round study in the Cotonou Channel would help better understand the seasonal variations of the tidal impacts on zooplankton communities.
Another limitation of our study is the lack of vertical profiling in our measurements. We focused exclusively on surface water parameters, neglecting the vertical distribution and variability of physicochemical parameters, especially salinity, and zooplankton. Vertical stratification can be important in determining the habitat suitability for different zooplankton species and influencing physicochemical conditions. Additionally, we did not account for zooplankton nychthemeral movements in this study. Without vertical data, our understanding of the environmental gradients induced by tides and their impact on zooplankton distribution remains incomplete. Future studies should include nutrient measurements and vertical measurements to comprehensively capture depth-related variations in more comprehensive physicochemical parameters and zooplankton communities.

5. Conclusions

The present study highlighted the significant impact of tidal cycles on the zooplankton community in the Cotonou Channel that connects the Nokoué Lagoon to the coastal Atlantic Ocean in Benin. The results revealed pronounced variations in physicochemical parameters driven by tidal phases, which results in the advection of distinct freshwater and marine water masses within the channel. Salinity varied between 2 and 36, temperature between 24 °C and 28 °C, turbidity between 10 and 200 FTU, pH between 7.7 and 8.1, and dissolved oxygen between 7.0 and 7.9 mg L−1.
Copepods, particularly Oithona sp., emerged as the dominant taxa in terms of abundance. The study found that variations in physicochemical parameters, such as salinity, turbidity, pH, and temperature significantly affected the composition and abundance of zooplankton. Copepods and rotifers, in particular, showed pronounced responses to salinity gradients. High frequency fluctuations in species richness and abundance, peaking in species richness and reaching a minimum in abundance at low salinity during ebb tides, highlighting salinity as the key driver of the zooplankton composition. Copepods remained constantly observed, while rotifers’ and cladocerans’ presence/absence exhibited sensitivity to salinity changes.
These findings highlight the importance of considering tidal phases for effective zooplankton sampling in Nokoué Lagoon. The study confirms that tidal cycles exert a significant influence on the physicochemical environment of the Cotonou Channel, which in turn drives changes in the zooplankton community structure. Salinity was identified as the primary factor affecting zooplankton composition, with marked fluctuations in species richness and abundance corresponding to the tidal phases. This insight is crucial for understanding the ecological dynamics of the channel, particularly in relation to how marine and freshwater influences shape biological communities.
To deepen our understanding and extend the present study, future research should expand to include year-round studies that capture seasonal variations, especially during different water levels when the lagoon exhibits strongly different salinity conditions. Incorporating vertical profiling of both physicochemical parameters and zooplankton distribution will help understand depth-related variations. Additionally, studying the effects of tidal extremes such as spring and neap tides, and including a broader range of environmental factors like nutrient concentrations and dissolved organic matter, will offer a more comprehensive view. Finally, integrating zooplankton biomass measurements will provide insights into the productivity and ecological role of these communities in the Cotonou Channel and Nokoué Lagoon. This approach will help us better understand the potential impacts of salinity changes by tides on zooplankton communities and enhance our understanding of Nokoué Lagoon’s ecological functioning.

Author Contributions

Conceptualization and methodology, H.H.A. and A.C.; formal analysis, F.U.D.-S., Y.M. and A.C.; investigation, F.T.O., T.T.A., F.U.D.-S., O.V.O., A.A. and J.P.K. Contributed to zooplankton identification: F.T.O., F.U.D.-S.; writing—original draft preparation, F.U.D.-S. and H.H.A.; writing—review and editing, H.H.A., F.U.D.-S. and A.C; supervision: Z.S. All authors have read and agreed to the published version of the manuscript.

Funding

This research received no external funding.

Institutional Review Board Statement

Not applicable.

Informed Consent Statement

Not applicable.

Data Availability Statement

Data is contained within the article.

Acknowledgments

The authors wish to express their gratitude to the “French National Institute for Sustainable Development/Institut français de Recherche pour le Développement (IRD)” and “Benin Institute for Oceanological and Halieutic Researches/Institut de Recherches Halieutiques et Océanologiques du Bénin” for their support in instrumentation for field sampling and laboratory analysis in this study.

Conflicts of Interest

The authors declare no conflicts of interest.

References

  1. Etilé, R.N.; Kouassi, M.; Pagano, M.; Yao, S.; Aka, M.N.; Douba, V.N. Diel Variation of Zooplankton Community Composition, Abundance and Biomass in a West African Tropical Coastal Lagoon (Grand-Lahou, Côte d’Ivoire). Int. J. Agric. Innov. Res. 2015, 3, 1641–1655. [Google Scholar]
  2. Zandagba, J.; Moussa, M.; Obada, E.; Afouda, A. Hydrodynamic Modeling of Nokoué Lake in Benin. Hydrology 2016, 3, 44. [Google Scholar] [CrossRef]
  3. Gnohossou, P.; Lalèyè, P.; Atachi, P.; Magali, G.; Villanueva, M.C.; Moreau, J. Temporal Variations in the Food Habits of Some Fish Species in Lake Nokoué, Benin. Afr. J. Aquat. Sci. 2013, 38, 43–47. [Google Scholar] [CrossRef]
  4. Laleye, P.; Villanueva, C.; Entsua-Mensah, C.M.; Moreau, J. A Review of the Aquatic Living Resources in Gulf of Guinea Lagoons, with Particular Emphasis on Fisheries Management Issues. J. Afrotropical. Zool. 2007, 10, 123–136. [Google Scholar]
  5. Lederoun, D.; Amoussou, G.; Baglo, I.S.; Adjibogoun, H.; Vodougnon, H.; Moreau, J.; Lalèyè, P.A. Growth, Mortality and Yield of Sarotherodon melanotheron melanotheron (Rüppell, 1852) in the Lake Nokoué and Porto-Novo Lagoon Complex Benin, West Africa. Aquat. Living Resour. 2020, 33, 18. [Google Scholar] [CrossRef]
  6. Ntangyong, I.L.; Chaigneau, A.; Morel, Y.; Assogba, A.; Okpeitcha, V.O.; Duhaut, T.; Stieglitz, T.; Van Beek, P.; Baloitcha, E.; Sohou, Z.; et al. Seasonal and Interannual Variations of Suspended Particulate Matter in a West-African Lagoon (Nokoué Lagoon, Benin): Impact of Rivers and Wind. Estuar. Coast. Shelf Sci. 2024, 304, 108821. [Google Scholar] [CrossRef]
  7. Adandedjan, D.; Makponse, E.; Hinvi, L.C.; Laleye, P. Données Préliminaires Sur La Diversité Du Zooplancton Du Lac Nokoué (Sud-Bénin). J. Appl. Biosci. 2017, 115, 11476–11489. [Google Scholar] [CrossRef]
  8. Chaigneau, A.; Ouinsou, F.T.; Akodogbo, H.H.; Dobigny, G.; Avocegan, T.T.; Dossou-Sognon, F.U.; Okpeitcha, V.O.; Djihouessi, M.B.; Azémar, F. Physicochemical Drivers of Zooplankton Seasonal Variability in a West African Lagoon (Nokoué Lagoon, Benin). J. Mar. Sci. Eng. 2023, 11, 556. [Google Scholar] [CrossRef]
  9. Dorak, Z.; Gaygusuz, Ö.; Tarkan, A.S.; Aydin, H. Diurnal Vertical Distribution of Zooplankton in a Newly Formed Reservoir (Tahtalı Reservoir, Kocaeli): The Role of Abiotic Factors and Chlorophyll a. Turk. J. Zool. 2013, 37, 218–227. [Google Scholar] [CrossRef]
  10. Bubu-Davies, O.A.; Ugwumba, O.A. Effects of Tide on Zooplankton Community of a Tributary of Upper Bonny Estuary, Niger Delta, Nigeria. Int. J. Sci. Res. Knowl. 2013, 1, 325–342. [Google Scholar] [CrossRef]
  11. Mofu, L.; Woodford, D.J.; Wasserman, R.J.; Dalu, T.; Weyl, O.L.F. Diet of Glossogobius callidus (Teleostei: Gobiidae) in Freshwater Impoundments in the Sundays River Valley of the Eastern Cape, South Africa. Afr. J. Aquat. Sci. 2019, 44, 415–420. [Google Scholar] [CrossRef]
  12. Chaigneau, A.; Okpeitcha, O.V.; Morel, Y.; Stieglitz, T.; Assogba, A.; Benoist, M.; Allamel, P.; Honfo, J.; Awoulmbang Sakpak, T.D.; Rétif, F.; et al. From Seasonal Flood Pulse to Seiche: Multi-Frequency Water-Level Fluctuations in a Large Shallow Tropical Lagoon (Nokoué Lagoon, Benin). Estuar. Coast. Shelf Sci. 2022, 267, 107767. [Google Scholar] [CrossRef]
  13. Morel, Y.; Chaigneau, A.; Okpeitcha, V.O.; Stieglitz, T.; Assogba, A.; Duhaut, T.; Rétif, F.; Peugeot, C.; Sohou, Z. Terrestrial or Oceanic Forcing? Water Level Variations in Coastal Lagoons Constrained by River Inflow and Ocean Tides. Adv. Water Resour. 2022, 169, 104309. [Google Scholar] [CrossRef]
  14. Okpeitcha, O.V.; Chaigneau, A.; Morel, Y.; Stieglitz, T.; Pomalegni, Y.; Sohou, Z.; Mama, D. Seasonal and Interannual Variability of Salinity in a Large West-African Lagoon (Nokoué Lagoon, Benin). Estuar. Coast. Shelf Sci. 2022, 264, 107689. [Google Scholar] [CrossRef]
  15. Okpeitcha, O.V.; Chaigneau, A.; Morel, Y.; Duhaut, T.; Marsaleix, P.; Rétif, F.; Honfo, J.; Stieglitz, T.; Sohou, Z.; Sintondji, L.O.; et al. Modeling Seasonal Salinity Variations in a Large West African Lagoon (Nokoué, Benin): Major Drivers and Mechanisms. Reg. Stud. Mar. Sci. 2024, 69, 103330. [Google Scholar] [CrossRef]
  16. Menéndez, M.C.; Piccolo, M.C.; Hoffmeyer, M.S. Short-Term Variability on Mesozooplankton Community in a Shallow Mixed Estuary (Bahía Blanca, Argentina): Influence of Tidal Cycles and Local Winds. Estuar. Coast. Shelf Sci. 2012, 112, 11–22. [Google Scholar] [CrossRef]
  17. da Costa, K.G.; Bezerra, T.R.; Monteiro, M.C.; Vallinoto, M.; Berrêdo, J.F.; Pereira, L.C.C.; Costa, R.M. da Tidal-Induced Changes in the Zooplankton Community of an Amazon Estuary. J. Coast. Res. 2013, 29, 756–765. [Google Scholar] [CrossRef]
  18. Chazarreta, J.; Dutto, S.; Berasategui, A.A.; Paniagua, G.F.; Fritz, L.J.; Cuadrado, D.G.; Hoffmeyer, M.S. Zooplankton Community Modulated by Spatial and Tidal Changes in the Bahía Blanca Estuary, Argentina. Reg. Stud. Mar. Sci. 2020, 36, 101277. [Google Scholar] [CrossRef]
  19. Krumme, U.; Liang, T.-H. Tidal-Induced Changes in a Copepod-Dominated Zooplankton Community in a Macrotidal Mangrove Channel in Northern Brazil. Zool. Stud. 2004, 43, 404–414. [Google Scholar]
  20. Badahoui, A.; Fiogbe, E.; Boko, M. Les Causes de La Dégradation Du Lac Ahémé et Ses Chenaux. Int. J. Biol. Chem. Sci. 2011, 4, 882–897. [Google Scholar] [CrossRef]
  21. Honfo, K.J.; Chaigneau, A.; Morel, Y.; Duhaut, T.; Marsaleix, P.; Okpeitcha, O.V.; Stieglitz, T.; Ouillon, S.; Baloitcha, E.; Rétif, F. Water Mass Circulation and Residence Time Using Eulerian Approach in a Large Coastal Lagoon (Nokoué Lagoon, Benin, West Africa). Ocean. Model. 2024, 190, 102388. [Google Scholar] [CrossRef]
  22. Ahlstrom, E.H. A Revision of the Rotatorian Genera Brachionus et Platyias with Descriptions New Species et Two New Varieties. Bull. Am. Mus. Nat. Hist. 1940, 44, 148–184. [Google Scholar]
  23. Dussart, B.H. Copépodes. In Flore et Faune Aquatiques de l’Afrique Sahélo-Soudanienne: Tome 1; ORSTOM: Paris, France, 1980; pp. 333–356. [Google Scholar]
  24. Pourriot, R. Rotifères. In Flore et Faune Aquatiques de l’Afrique Sahélo-Soudanienne; Société Linnéenne de Lyon: Paris, France, 1980; pp. 219–244. [Google Scholar]
  25. Conway, D.V.P.; White, R.G.; Hugues-Dit-Ciles, J.; Gallienne, C.P.; Robins, D.B. Guide to the Coastal et Surface Zooplankton of the South-Western Indian Ocean; Marine Biological Association of the United Kingdom: Plymouth, UK, 2003. [Google Scholar]
  26. Fontaneto, D.; De Smet, W.H.; Melone, G. Identification Key to the Genera of Marine Rotifers Worldwide. Meiofauna Mar. 2008, 16, 75–99. [Google Scholar]
  27. Al-Yamani, F.Y.; Skryabin, V.; Gubanova, A.; Khvorov, S.; Prusova, I. Marine Zooplankton: Practical Guide for the Northwestern Arabian Gulf; Kuwait Institute for Scientific Research: Safat, Kuwait, 2011; Volume 1, 208p. [Google Scholar]
  28. Conway, D.V.P. Marine Zooplankton of Southern Britain. In Part 1: Radiolaria, Heliozoa, Foraminifera, Ciliophora, Cnidaria, Ctenophora, Platyhelminthes, Nemertea, Rotifera et Mollusca; Marine Biological Association of the United Kingdom: Plymouth, UK, 2012. [Google Scholar]
  29. Conway, D.V.P. Marine Zooplankton of Southern Britain. In Part 2: Arachnida, Pycnogonida, Cladocera, Facetotecta, Cirripedia et Copepoda; Marine Biological Association of the United Kingdom: Plymouth, UK, 2012. [Google Scholar]
  30. Conway, D.V.P. Marine Zooplankton of Southern Britain. In Part 3: Ostracoda, Stomatopoda, Nebaliacea, Mysida, Amphipoda, Isopoda, Cumacea, Euphausiacea, Decapoda, Annelida, Tardigrada, Nematoda, Phoronida, Bryozoa, Entoprocta, Brachiopoda, Echinodermata, Chaetognatha, Hemichordata and Chordata; Marine Biological Association of the United Kingdom: Plymouth, UK, 2015. [Google Scholar]
  31. Haney, J.F.; Aliberti, M.A.; Allan, E.; Allard, S.; Bauers, D.J.; Beagen, W.; Bradtr, S.R.; Carlson, B.; Carlson, S.C.; Doan, U.M.; et al. An Image-Based Key to the Zooplankton of North America “Version 5.0”. Available online: http://cfb.unh.edu/cfbkey/html/index.html (accessed on 10 July 2021).
  32. LaMay, M.; Hayes-Pontius, E.; Ater, I.; Mihuc, T. A Revised Key to the Zooplankton of Lake Champlain. Sci. Discipulorum 2013, 6, 1–41. [Google Scholar]
  33. Swadling, K.M.; Slotwinski, A.; Davies, C.; Beard, J.; McKinnon, A.D.; Coman, F.; Murphy, N.; Tonks, M.; Rochester, W.; Conway, D.V.P.; et al. Australian Marine Zooplankton: A Taxonomic Guide and Atlas. Version 1.0 February 2013. Available online: https://www.imas.utas.edu.au/zooplankton/image-key (accessed on 8 July 2021).
  34. Aboul Ezz, S.M.; Abdel Aziz, N.E.; Abou Zaid, M.M.; El Raey, M.; Abo-Taleb, H.A. Environmental Assessment of El-Mex Bay, Southeastern Mediterranean by Using Rotifera as a Plankton Bio-Indicator. Egypt. J. Aquat. Res. 2014, 40, 43–57. [Google Scholar] [CrossRef]
  35. Glime, J.M. Invertebrates: Rotifer Taxa—Monogononta Chapt. 4-7 a-b-c. Bryophyt. Ecol. 2017, 2, 7–37. [Google Scholar]
  36. Glime, J.M. Arthropods: Crustacea—Copepoda et Cladocera. Chapt. 10-1. In Bryophyte Ecology; Michigan Technological University: Houghton, MI, USA, 2017; pp. 10-1-1–10-1-20. [Google Scholar]
  37. Wilke, T.; Ahlrichs, W.H.; Bininda-Emonds, O.R.P. A Weighted Taxonomic Matrix Key for Species of the Rotifer Genus Synchaeta (Rotifera, Monogononta, Synchaetidae). ZooKeys 2019, 871, 1. [Google Scholar] [CrossRef]
  38. Magurran, A.E. Diversity Indices and Species Abundance Models. In Ecological Diversity and Its Measurement; Springer: Dordrecht, The Netherlands, 1988; pp. 7–45. ISBN 978-94-015-7360-3. [Google Scholar]
  39. Marcon, E. Mesures de La Biodiversité. Ph.D. Thesis, AgroParisTech, Kourou, France, 2015. [Google Scholar]
  40. Dajoz, R. Précis D’écologie, 5th ed.; Dunod Université; Dunod: Paris, France, 1985; ISBN 978-2-04-016439-3. [Google Scholar]
  41. R Core Team _R: A Language and Environment for Statistical Computing_. R Foundation for Statistical Computing: Vienna, Austria, 2023. Available online: https://www.R-Project.Org (accessed on 8 February 2024).
  42. Odountan, O.; de Bisthoven, L.J.; Koudenoukpo, C.; Abou, Y. Spatio-Temporal Variation of Environmental Variables and Aquatic Macroinvertebrate Assemblages in Lake Nokoué, a RAMSAR Site of Benin. Afr. J. Aquat. Sci. 2019, 44, 219–231. [Google Scholar] [CrossRef]
  43. Lalèyè, P.; Niyonkuru, C.; Moreau, J.; Teugels, G.G. Spatial and Seasonal Distribution of the Ichthyofauna of Lake Nokoué, Bénin, West Africa. Afr. J. Aquat. Sci. 2003, 28, 151–161. [Google Scholar] [CrossRef]
  44. Wickham, H. Ggplot2: Elegant Graphics for Data Analysis; Springer: New York, NY, USA, 2016. [Google Scholar]
  45. de Mendiburu, F. Agricolae: Statistical Procedures for Agricultural Research 2023. Available online: https://cran.r-project.org/web/packages/agricolae/index.html (accessed on 26 August 2024).
  46. Gao, X.; Song, J.; Li, X. Zooplankton Spatial and Diurnal Variations in the Changjiang River Estuary before Operation of the Three Gorges Dam. Chin. J. Oceanol. Limnol. 2011, 29, 591–602. [Google Scholar] [CrossRef]
  47. Ara, K. Temporal Variability and Production of the Planktonic Copepod Community in the Cananéia Lagoon Estuarine System, São Paulo, Brazil. Zool. Stud. 2004, 43, 179–186. [Google Scholar]
  48. Zhang, H.; Ekvall, M.K.; Xu, J.; Hansson, L. Counteracting Effects of Recruitment and Predation Shape Establishment of Rotifer Communities under Climate Change. Limnol. Oceanogr. 2015, 60, 1577–1587. [Google Scholar] [CrossRef]
  49. Attayde, J.L.; Bozelli, R.L. Assessing the Indicator Properties of Zooplankton Assemblages to Disturbance Gradients by Canonical Correspondence Analysis. Can. J. Fish. Aquat. Sci. 1998, 55, 1789–1797. [Google Scholar] [CrossRef]
  50. Kozlowsky-Suzuki, B.; Bozelli, R.L. Resilience of a Zooplankton Community Subjected to Marine Intrusion in a Tropical Coastal Lagoon. Hydrobiologia 2004, 522, 165–177. [Google Scholar] [CrossRef]
  51. Branco, C.W.C.; Kozlowsky-Suzuki, B.; Esteves, F.A. Environmental Changes and Zooplankton Temporal and Spatial Variation in a Disturbed Brazilian Coastal Lagoon. Braz. J. Biol. 2007, 67, 251–262. [Google Scholar] [CrossRef] [PubMed]
  52. Schallenberg, M.; Hall, C.J.; Burns, C.W. Consequences of Climate-Induced Salinity Increases on Zooplankton Abundance and Diversity in Coastal Lakes. Mar. Ecol. Prog. Ser. 2003, 251, 181–189. [Google Scholar] [CrossRef]
  53. Donadel, L.; Cardoso, L.D.S.; Torgan, L.C. Plankton Community Dynamics in a Subtropical Lagoonal System and Related Factors. An. Acad. Bras. Ciênc. 2016, 88, 249–267. [Google Scholar] [CrossRef] [PubMed]
  54. Wiafe, G.; Yaqub, H.B.; Mensah, M.A.; Frid, C.L.J. Impact of Climate Change on Long-Term Zooplankton Biomass in the Upwelling Region of the Gulf of Guinea. ICES J. Mar. Sci. 2008, 65, 318–324. [Google Scholar] [CrossRef]
  55. Aka, N.M.; Etile, R.N.; Joany, T.; N’Da, K. Peuplement Zooplanctonique Du Plateau Continental Ivoirien: Diversité, Abondance et Biomasse. Int. J. Biol. Chem. Sci. 2018, 12, 129–140. [Google Scholar] [CrossRef]
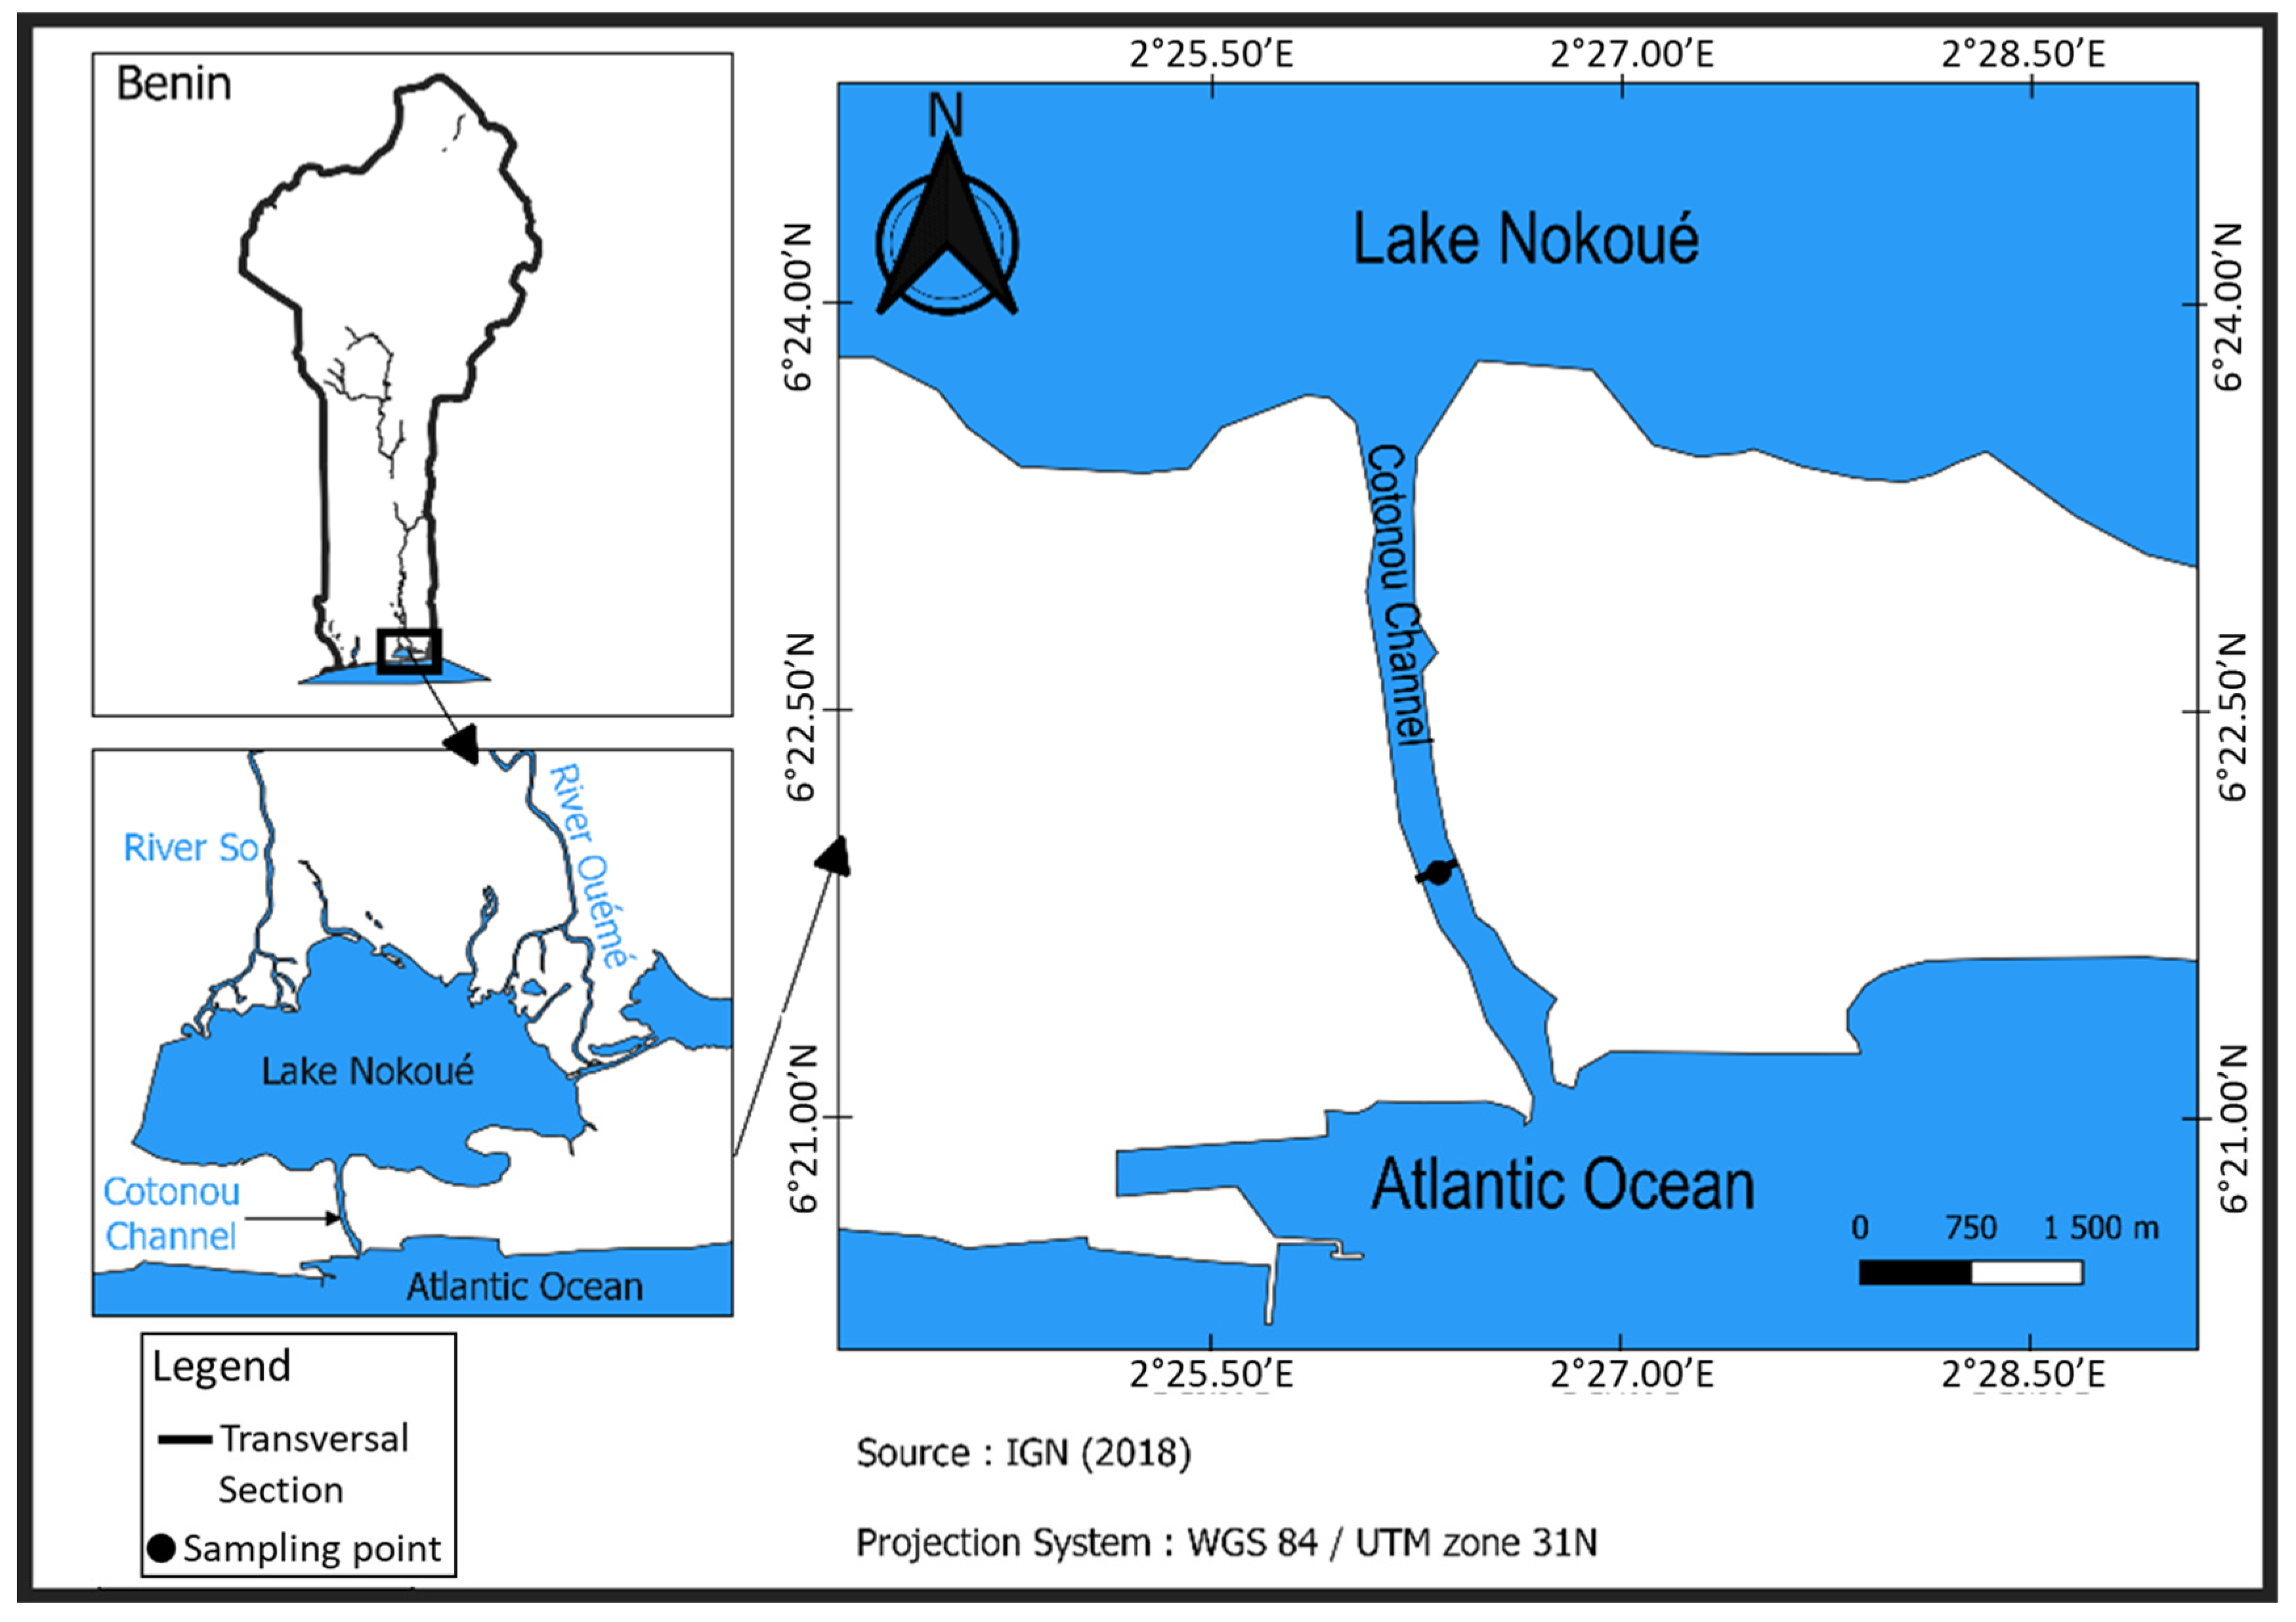
Figure 1. Study area and sampling point.
Jmse 12 01519 g001
Figure 2. The 25-hour temporal variation of (a) flows estimated from ADCP measurements, (b) temperature and salinity, and (c) dissolved oxygen, pH, and turbidity in the Cotonou Channel.
Jmse 12 01519 g002
Figure 3. Variation of (a) pH in green and dissolved oxygen in orange, (b) temperature in grey and turbidity in blue as a function of salinity in the Cotonou Channel. Individual data points are represented by colored dots, while the curves depict generalized additive models (GAMs). The shaded areas indicate the 95% confidence intervals.
Jmse 12 01519 g003
Figure 4. Species richness and relative abundance for each of the 8 zooplankton groups identified in the Cotonou Channel.
Jmse 12 01519 g004
Figure 5. Temporal variation in zooplankton abundance and diversity indices.
Jmse 12 01519 g005
Figure 6. Principal component analysis showing relationship between zooplankton and environmental parameters. Legend: Sal: salinity, Temp: temperature, Oxy: oxygen, pH: pH, Turb: turbidity, Abund: abundance, Shannon: H′, Rich: species richness, Piélou: J, Roti: Rotifers, Clad: Cladocerans, Cope: Copepods, Decap: Decapods, Cirr: Cirripeds, Ostra: Ostracods, Moll: Molluscs, Chaeto: Chaetognaths, Bra_cal: Brachionus calyciflorus, Bra_pli: Brachionus plicatilis, Fili: Filinia longiseta, Synch: Synchaeta bicornis, Cyclo1: Cyclopoid sp1, CopeNau: Copepod Nauplii, Oith: Oithona sp, Onca: Oncaea clevei, Cal1: Calanoid spp1, Cal2: Calanoid spp2, Tem: Temora sp, Eute: Euterpina acutifrons, Moina: Moina micrura, Peni: Penilia avirostris, Ceri: Ceriodaphnia sp.
Jmse 12 01519 g006
Figure 7. Variation in zooplankton diversity indices and abundance as a function of salinity: (a) Species richness in orange and abundance in green; (b) Shannon Index in blue and Pielou Index in grey. Individual data points are represented by colored dots, while the curves depict generalized additive models (GAMs). The shaded areas indicate the 95% confidence intervals.
Jmse 12 01519 g007
Figure 8. Variation in the abundance of zooplankton groups in relation to salinity (tides) in the Cotonou Channel: (a) Copepods and Rotifers; (b) Cladocerans, Chaetognaths, and Molluscs; (c) Cirripeds, Decapods, and Ostracods.
Jmse 12 01519 g008
Figure 9. Variation in the relative abundance of (a) dominant copepod species within the copepod group; (b) dominant rotifers species within the rotifers group; (c) dominant cladocerans species within the cladocerans group in relation to salinity in the Cotonou Channel.
Jmse 12 01519 g009
Table 1. Results of statistical analyses of physicochemical parameters across different water masses.
H Test Mean Value
VariablesX2 (df = 2)p-ValuesFreshwaterMixed WaterSeawater
Salinity (PSU)21.26 ***2.41 × 10−53.3 a13.8 b35.1 c
Temperature (°C)14.91 ***5.79 × 10−427.0 a26.5 a24.4 b
Turbidity (FTU) 18.24 ***1.09 × 10−4123 a35 b8c
ANOVAMean value
F–Value (df = 2)p-valuesFMS
Dissolved oxygen (mg L−1)0.56 n.s.5.79 × 10−17.5a7.4 a7.5 a
pH48.14 ***9.23 × 10−97.8a7.9 b8.0 c
Kruskal–Wallis test (H-test) and ANOVA test were applied to test the significance of overall variations observed between the three water masses. Significance levels (S.L.): *** p < 0.001, n.s. not significant. Mean values with different letters in the same row are significantly different (p < 0.05) according to the Dunn’s post hoc test.
Table 2. List of taxa identified in this study and their relative abundance and occurrence.
PhylumGroupsSpeciesTotal Relative Abundance Group-Specific AbundanceFocc (%)
RotiferaRotifersAnuraeopsis navicula Rousselet, 19110.0600.23716
Anuraeopsis fissa (Gosse, 1851)0.0170.06920
Brachionus angularis Gosse, 18510.1080.42832
Brachionus bidentatus Anderson, 18890.0120.0484
Brachionus calyciflorus Pallas, 17662.1288.47752
Brachionus caudatus Barrois and Daday, 18940.1540.61244
Brachionus falcatus Zacharias, 18980.0360.14424
Brachionus mirabilis Daday, 18970.0040.0174
Brachionus plicatilis Müller, 17862.90511.57376
Brachionus quadridentatus Hermann, 17830.0090.0358
Keratella cochlearis (Gosse, 1851)0.0040.0164
Keratella lenzi Hauer, 19530.0160.0654
Keratella sp.0.0310.12216
Keratella tropica Apstein, 1907)0.1210.48140
Plationus patulus (Müller, 1786)0.0260.10312
Trichotria sp.0.0040.0164
Filinia longiseta (Ehrenberg, 1834)3.27713.05764
Filinia opoliensis (Zacharias, 1898)0.1520.60432
Filinia terminalis (Plate, 1886)0.0180.07216
Lecane leontina (Turner, 1892)0.0240.09424
Monostyla closterocerca (Schmarda, 1859)0.0040.0154
Collurella uncinata (Müller, 1773)0.0100.0384
Lepadella sp.0.0160.06312
Cephallodella sp.0.0010.0034
Resticula melandocus (Gosse, 1887)0.0100.0388
Rotaria neptunia (Ehrenberg, 1830)0.0040.0174
Philodina sp.0.0330.13124
Philodina sp20.0010.0034
Polyarthra sp.0.0400.16024
Synchaeta bicornis Smith, 190415.47861.66480
Synchaeta pectinata Ehrenberg, 18320.0010.0044
Synchaeta grandis Zacharias, 18930.2220.88644
Synchaeta sp.0.1610.64352
Testudinella patina (Hermann, 1783)0.0120.0508
Trichocerca brachyura (Gosse, 1851)0.0040.0164
AthropodaCopepodsAcanthocyclops sp.0.0750.10332
Cyclopoid sp10.8361.14592
Cyclopoid sp20.0750.10328
Ectocyclops sp.0.3270.44776
Corycaeus sp.0.1070.14720
Corycaeus sp10.0010.0014
Oithona sp.7.53610.32488
Oithona plumifera Baird, 18430.0690.09528
Oncaea clevei Früchtl, 19230.6370.87344
Calanoid sp10.0130.0188
Temora turbinata (Dana, 1849)0.2280.31328
Temora sp.3.0924.23752
Harpacticoid sp.0.0620.08644
Microsetella norvegica (Boeck, 1865)0.3740.51344
Microsetella rosea (Dana, 1847)0.0350.04832
Macrosetella gracilis (Dana, 1846)0.1490.20452
Euterpina acutifrons (Dana, 1847)0.9061.24256
CladoceransMoina micrura Kurz, 18750.18423.79244
Penilia avirostris Dana, 18490.57574.48144
Ceriodaphnia sp.0.0131.7268
CirripedsCirripede larva0.0010.4634
DecapodDecapoda sp.0.40210052
OstracodOstracoda sp.0.01910016
MolluscaMollusc Gastropoda sp.0.08110064
ChaetognathaChaetognathsSagitta sp10.21161.55420
Sagitta sp20.13238.44616
Phylum GroupsOther zooplanktonTotal Relative abundanceGroup-specific abundanceFocc (%)
AthropodaCopepodsCyclopoid spp.0.0350.04720
Calanoid spp111.53415.800100
Calanoid spp21.4812.02984
Copepod Nauplii45.42362.227100
CirripedsCirriped Nauplii 0.28499.53780
Total relative abundance: Abundance relative to total zooplankton abundance; Group-specific abundance: Relative abundance of zooplankton species compared to the abundance of their specific group; Focc: Frequency of occurrence (in %).
Table 3. Results of statistical analyses of overall abundance and diversity parameters across different water masses.
H test Mean Value
VariablesX2 (df = 2)p-ValuesFreshwaterMixed WaterSeawater
Abundance (ind L−1)10.34 ***5.7 × 10−312.52 a30.92 a36.88 b
ANOVAMean value
F-Value (df = 2)p-valuesFreshwaterMixed waterSeawater
Shannon index (H′)5.54 *1.1 × 10−22.49 a2.06 ab1.59 b
Piélou index (J)2.67 n.s.9.2 × 10−20.58 a0.43 a0.57 a
Kruskal-Wallis test (H-test) and ANOVA test were applied to test the significance of overall variations observed between the three water masses. Significance levels (S.L.): * p < 0.05, *** p < 0.001, n.s. not significant. Mean values with different letters in the same row are significantly different (p < 0.05) according to the Dunn’s post hoc test.
Disclaimer/Publisher’s Note: The statements, opinions and data contained in all publications are solely those of the individual author(s) and contributor(s) and not of MDPI and/or the editor(s). MDPI and/or the editor(s) disclaim responsibility for any injury to people or property resulting from any ideas, methods, instructions or products referred to in the content.