Article

Research on Influencing Factors of Cable Clamp Bolt Elastic Interaction in Cross-Ocean Suspension Bridges

by
Fengrui Mu
1,
Bo Wang
1,
Yongjun Zhou
2,*,
Yuan Jing
1,
Yu Zhao
1 and
Zhiran Luo
1
1
School of Highway, Chang’an University, Xi’an 710064, China
2
Highway Large Structural Safety Engineering Research Center of the Ministry of Education, Chang’an University, Xi’an 710064, China
*
Author to whom correspondence should be addressed.
J. Mar. Sci. Eng. 2024, 12(9), 1531; https://doi.org/10.3390/jmse12091531
Submission received: 12 August 2024 / Revised: 2 September 2024 / Accepted: 2 September 2024 / Published: 3 September 2024
(This article belongs to the Section Ocean Engineering)

Abstract

:
Suspension bridges are the most common type of bridge used to cross the ocean. The cable clamps in suspension bridges clamp the main cables by bolt preload, but the elastic interaction of the bolts reduces the preload, which is detrimental to the force in suspension bridges. However, research on the factors influencing the elastic interaction of cable clamp bolts in suspension bridges is currently limited. This paper aims to explore the law of influence of external factors on the elastic interaction of bolts through a combined approach of theoretical analysis, full-scale experiment, and finite element simulation. The results indicate that the average preload loss was reduced by about 27% when the elastic modulus was increased by about 110%. The average preload loss was reduced by about 45% when the bolt center distance was increased by 75%. The number of bolts has a small effect on the elastic interaction, which can be ignored. When the preload of bolt installation was increased by 133%, the average preload loss was reduced by approximately 125%, which was almost a linear relationship. Tightening the bolt from the center bolt creates greater elastic interaction. The conclusions can provide suggestions for reducing the elastic interaction of bolts in the design and construction of suspension bridge cable clamps.

1. Introduction

Suspension bridges are the most common type of bridge used to cross the ocean. The clamps of suspension bridges clamp the main cable by the preload of high-strength bolts, which is the key component that transfers the load of the bridge deck to the main cable. When tightening the cable clamp, due to the limited working space, the clamp bolt group is usually tightened by the batch tightening method. Due to the deformation of the main cable and the clamps during the tightening process, the effect of tightening one bolt in the group has an effect on the preload in other previously tightened bolts in the group. Such an effect is called bolt elastic interaction. This significantly affects the uniform distribution of the preload on the cable clamp bolt.
In the theoretical study of the elastic interaction, Bible et al. [1,2] investigated the influence law of bolt preload at different locations and proposed the elastic interaction matrix of the bolt group. Li et al. [3] established a generalized mathematical model for evaluating bolt preload based on the deformation coordination equation and elastic interaction stiffness theory. Alkelani et al. [4] proposed an elastic interaction model for bolts with gaskets that was able to predict the change in the preload of the later tightened bolt on the previously tightened bolt. Nassar et al. [5] proposed a formula for the elastic interaction of bolt groups during fastener tightening in planar gasketed joints, which allows optimization of the tightening strategy. Zuo et al. [6] established the correlation model of the initial bolt preload and the contact stiffness of bolted flange. This model can be employed to reverse determine the tightening strategy of the bolt group according to working conditions. Jiang et al. [7], combined with the equivalent form of the bolted joint system, proposed a new stiffness model dependent on the strain energy method. Liu et al. [8] developed an analytical model of elastic interaction through gasket deformation and explored the effect of multidimensional dimensions such as bolt distance, joint width, and thickness on the loss of preload.
Considering the complexity of theoretical analysis, the finite element model has become a new tool to study the elastic interaction of bolt groups. Takaki et al. [9] investigated the elastic interaction matrix during the tightening of bolts in flanged joint structures by using a FE model to determine the optimum tightening procedure. Bouzid et al. [10] modeled the elastic interaction of flexible flange rotation and were able to predict the flange rotation angle and bolt preload during the bolt tightening process. Yuan et al. [11] studied the elastic interaction on a toothed coupling connecting bolt, and the results showed that the elastic interaction could cause non-uniform deformation of the connected parts. Zhu et al. [12,13,14] proposed a new numerical analysis method considering the nonlinear elastic property condition of the gasket and evaluated the distribution of the preload of the flange bolts. Abasolo et al. [15,16], based on the FE model, proposed a method capable of achieving a uniform distribution of preload in a bolt group for one or two tightening rounds. Wang et al. [17] analyzed the stress field of multiple bolted joints, established an analytical model of elastic interaction stiffness, and investigated the effect of elastic interaction stiffness on the initial preload of bolts. Coria et al. [18,19] proposed a four-parameter assembly method for a circular bolted joint, which was able to achieve a uniform load distribution of the bolt group in a single tightening sequence. Huang et al. [20] used the FE model to explore the influence of initial preload and tightening sequence on the elastic interaction and proposed a method to predict the change in the preload. Ding et al. [21] investigated the elastic interaction of anchorages such as CFRP plates and improved the pressure diffusion mechanism to have a more uniform contact pressure distribution. Most of the above were to study the basic elastic interaction of the bolt group and did not consider the influence of more external factors on the elastic interaction of the bolt group.
Related to the study of the factors influencing the elastic interaction of bolts using the FE model, some research has found that common influencing factors of the bolt group elastic interaction include tightening sequence, thickness of connected components, bolt spacing, and magnitude of applied fastening force [22,23]. Considered the influence of other factors on the bolt group’s elastic interaction, Pan et al. [24] established a prediction model for the residual preload in long plate bolted joint systems and believed that appropriate preloading sequence, increasing the number of preloading steps and having variable amplitude loading can effectively reduce the effect of elastic interaction. Bouzid et al. [25] established an FE model to investigate the influence of the operating temperature of the fluid inside the flange connection structure on the elastic interaction of the bolt group. Abid et al. [26,27] considered the thermal expansion of the connection components and explored the influence of different tightening sequences on the bolt elastic interaction of flange connection structures by using an FE model. Wang et al. [28] reduced the effect of bolt elastic interaction by optimizing the tightening sequence and used the kriging model to predict the best tightening sequence under different types and tightening clearance. Liu et al. [29] predicted the optimal tightening sequence of bolt groups by constructing a neural network agent model to obtain a more uniform preload. Wang et al. [30] considered the preload loss caused by pressure vessel flange connections under the influence of high temperature and creep to explore the law of bolt group elastic interaction.
The above research focuses on the study of elastic interactions in small bolt sets in mechanical engineering. Regarding the elastic interaction of large bolts, He [31] studied the bolt installation fastening process for up-and-down and left-and-right types of cable clamps and found that fastening the bolt from both ends to the center can effectively reduce the preload loss. Yang et al. [32] conducted tightening process fastening tests with one pair of tensioners and three pairs of tensioners to analyze the influence of the number of tensioners on the bolt elastic interaction. Miao et al. [33] investigated the influence of the length of the cable clamp, the number of bolts, and the fastening process on the elastic interaction through a real bridge experiment, and the results showed that symmetrical fastening from the ends of the cable clamps to the middle was a better fastening sequence.
Suspension bridge cable clamps can be regarded as long plate-shaped connection structures. The current research on elastic interactions mainly focuses on small bolt group structures with flange connections, and there is less research on elastic interactions in long plate-shaped connection structures. Due to the existence of strong nonlinearities in the main cables of suspension bridges, it leads that the elastic interaction of cable clamp bolts and their influencing factors in suspension bridges have not been sufficiently researched. This paper investigated the influence of external factors on the elastic interaction of cable clamp bolts of suspension bridges. Firstly, a theoretical model was derived for the elastic interaction of the cable clamp bolt. Secondly, the full-scale experiment was carried out to collect the bolt preload data, and the experiment results were used to verify the finite element model. Thirdly, based on the FE model, the influence of main cable material properties, cable clamp design parameters, and tightening technology on the elastic interaction of cable clamp bolts was discussed. Finally, an optimization method to reduce the effect of the elastic interaction of cable clamp bolts is proposed. This paper can be a guide for improving the tightening efficiency and preload uniformity of cable clamp bolts in suspension bridges.

2. Theoretical Analysis

The elastic interaction of the bolts is essentially reflected in the transfer of deformation or displacement in the connected structure under the action of the bolt preload, which in turn affects the preload of each bolt through the connected structure. In order to better investigate the mechanical relationships in elastic interaction, a double-bolt simplified model of the cable clamp structure is designed, which consists of bolt 1, bolt 2, top clamp, and bottom clamp. The simplified theoretical model is shown in Figure 1.
In the derivation of the mechanical model, it is assumed that the bolt elongation is equal to the compression deformation of the clamp in the tightened state and that the clamp does not produce distortion effects such as warping. As depicted in Figure 1, in the first stage, no preload is applied to bolt 1 when the gap between the top and bottom clamp is δ 1 .
Then, bolt 1 is tightened, and preload F is applied to bolt 1, which initiates the second stage. As can be seen in the second stage of Figure 1, the preload F makes the gap δ 1 = 0 . The part clamped between the top and bottom clamps is the main cable, which is assumed to have a stiffness K . The relationship between preload F , gap δ 1 , and stiffness K is shown in Equation (1).
δ 1 = F K
where δ 1 is the initial gap between the top and bottom clamps, F is the preload of bolt 1, and K is the stiffness of the clamped main cable.
Under the action of the preload F , the clamp gap at bolt hole 2 changes from δ 1 to δ 2 . According to the literature [3], the transfer of displacement in the connected structure is linear. Therefore, there exists a coefficient α between δ 1 and δ 2 such that it satisfies the relationship in Equation (2).
δ 2 = α δ 1
where δ 2 is the gap between the top and bottom clamps at bolt hole 2 after bolt 1 is tightened, and α is a linear coefficient and a constant.
After the second stage, bolt 2 is tightened, applying a preload to bolt 2, and at this point, the gap δ 2 between the top and bottom clamps at the bolt 2 position disappears. However, due to elastic interaction, the top and bottom clamps at bolt 1 will deflect slightly upward displacement under the preload of bolt 2, which causes the top and bottom clamps at bolt 1 to recreate a small gap, δ 3 . After deformation, there is an inclination angle θ between the top and bottom clamps, and the horizontal distance of the inclined section is L .
Similarly, the transfer of displacement in the connected structure is linear, Therefore, there exists a coefficient β between δ 2 and δ 3 such that it satisfies the relationship in Equation (3).
δ 3 = β δ 2
where δ 3 is the gap between the top and bottom clamps at bolt 1 after bolt 2 is tightened, and β is a linear coefficient and a constant.
Plug Equation (2) into Equation (3),
δ 3 = α β δ 1
Due to the small deformation, the relationship between gap δ 3 , inclination angle θ , and distance L is shown in Equation (5).
δ 3 = θ L
where θ is the angle resulting from the deformation, and L is the horizontal distance of the inclined section.
The gap δ 3 causes bolt 1 to produce an elongation of δ 3 , and the preload of bolt 1 at this point decreases by Δ F . Based on the relationship between deformation and force, Equation (6) is obtained.
Δ F = δ 3 E A l
where Δ F is the amount of change in the preload, E is Young’s modulus, A is the bolt area, and l is the length of bolt clamping section.
Plug Equations (1) and (4) into Equation (6),
Δ F = α β F E A l K
Plug Equation (5) into Equation (6),
Δ F = θ L E A l
Equations (7) and (8) represent the amount of change in preload caused by the elastic interaction of the bolts. The change in preload and the effect of elastic interaction are positively proportional. From Equation (7), it can be seen that the material and size of the bolts, the level of preload, and the stiffness of the main cable affect the elastic interaction of the cable clamp bolts. All other parameters being the same, larger bolt diameter, smaller bolt clamping section length, lower main cable stiffness, and larger preload result in more obvious elastic interaction of the bolts. From Equation (8), it can be seen that larger distance results in more obvious elastic interaction.
In order to verify the accuracy of the theoretical analysis, a full-scale experiment and a finite element analysis were performed.

3. Full-Scale Experiment

3.1. Experiment Setup

The indoor full-scale experiment device utilized the top and bottom hinged-type cable clamps. The main cable clamp had a diameter of 736 mm, a length of 1250 mm, and a wall thickness of 35 mm. The cable clamp was assembled using eight high-strength bolts and nuts, with a longitudinal spacing of 315 mm and a transverse spacing of 785 mm. The gap between the top and bottom clamps without preload was 48 mm. The main cable consisted of 127 cable strands, each composed of 127 galvanized high-strength steel wires. According to the literature [31], the stress distribution in the cross-section of the main cable, after being clamped, exhibits a characteristic of larger stress in the outer ring and smaller stress in the inner ring. It is considered that the radial deformation of the main cable and the creep of the galvanized layer mainly concentrate on the outer wires. Considering experimental cost and conditions, this research used a concrete-filled steel tube to replace the central part of the main cable, with strands wrapping around the outer layer. The concrete-filled steel tube was formed by pouring C30 concrete into a cylindrical seamless steel tube with an outer diameter of 610 mm and a thickness of 10 mm. Steel plates with dimensions of 80 mm × 120 mm and a thickness of 30 mm were welded at both ends. To ensure the gap ratio in the clamped section of the main cable, 40 strands were arranged in a circular pattern on the outer layer. The gaps were filled with galvanized high-strength steel wires, ensuring that the gap ratio of the galvanized outer wires can reach 20% in the pre-tensioned state and decrease to 18% during the clamping process.
A JMZX-3110HAT vibrating pressure sensor (Kingmach Measurement & Monitoring Technology Co. Ltd., Changsha, China) was installed between the bottom washer of each bolt and the cable clamp, and the preload of the bolts was measured using a JMZX-3006 (Kingmach Measurement & Monitoring Technology Co. Ltd., Changsha, China) comprehensive testing instrument. Before the experiment, calibration tests were conducted on the pressure sensors. A hydraulic tensioner was placed at the top end of the bolts to apply the preload. The experimental setup is shown in Figure 2.

3.2. Loading and Data Collection

The cable clamp bolts were numbered L1–L4 on one side and R1–R4 on the other side. Simultaneous tightening bolts of both sides with two tensioners tightened the cable clamp bolts in the experiment device from the middle to both ends ((L2,R3)→(L3,R2)→(L1,R4)→(L4,R1)). The tightening sequence of the bolts is shown in Figure 3. The tension force was set to 705 kN, which was the design preload of the bolt. When all the bolts were tightened in the tightening sequence, it was considered that one round of tightening was completed. Due to the main cable being composed of multiple sets of parallel steel wires, it had strong non-linearity, and its radial stiffness changed with the change in the void ratio of the main cable. To truly simulate the characteristics of the main cable in the finite element model, the experiment was conducted on the clamp bolts for two rounds of tightening. At the end of each round of tightening, the preload of the bolt was recorded by the JMZX-3110HAT vibrating pressure sensor. While recording the preload, an electronic vernier caliper measured the width of the gap between the top and bottom cable clamps. The data measurement is shown in Figure 4.
The preload and gap widths collected after the completion of each round of tightening are shown in Table 1.

4. Finite Element Analysis

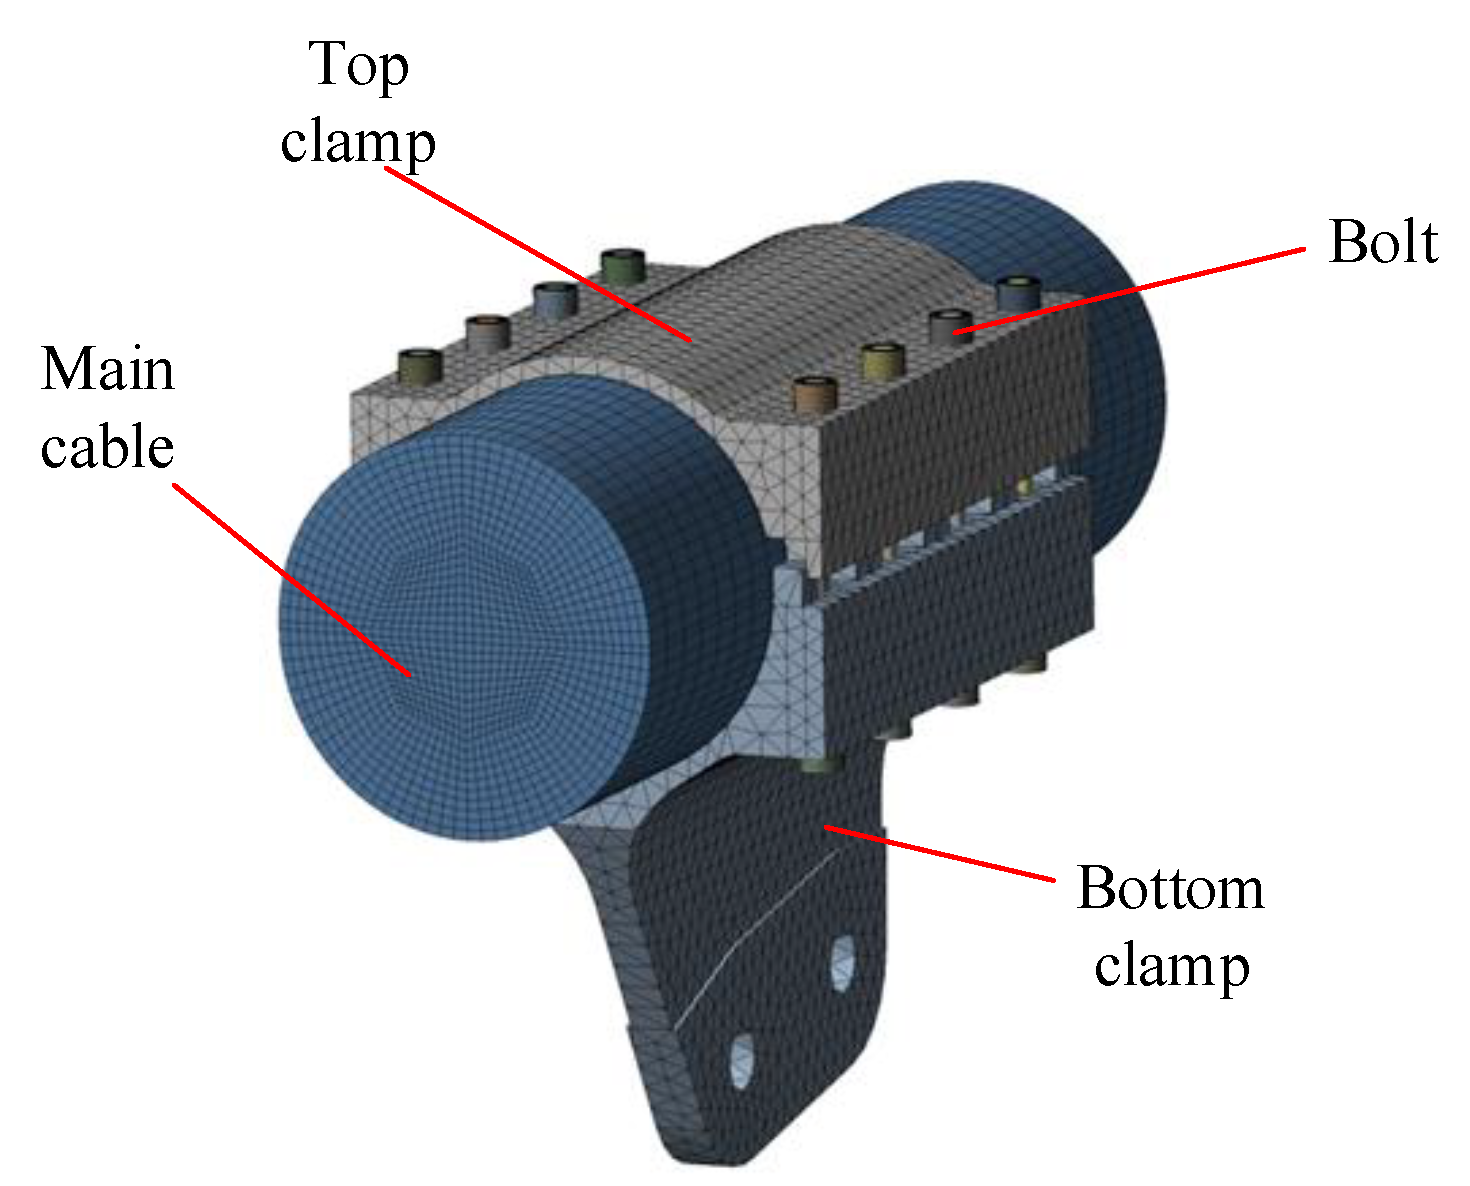
4.1. Finite Element Model Establishment

Established finite element model with ANSYS WORKBENCH 2021. The FE model represents the SJ5 top and bottom hinged-type cable clamps, with a main cable diameter of 736 mm and a clamp length of 1250 mm. The clamp was assembled using eight high-strength bolts and nuts, with longitudinal spacing of 315 mm and transverse spacing of 785 mm. The clamps and nuts were simulated using SOLID45 elements, while the high-strength bolts were simulated using SOLID185 elements along with a homogenized equivalent simulation of the main cable using SOLID45 elements.
“Surface to surface” contact was utilized between the main cable and the inner surface of the cable clamp and between the nut and the pressure-bearing surface of the cable clamp, with a friction coefficient of 0.15. Fixed constraints were applied to the nodes at one end facing the center position of the main cable segment, while displacement was specified for the nodes at the center position of the other end face, representing the boundary conditions of the model.
The clamp and bolts were simulated using linear elastic materials, with Young’s modulus as 2.1 × 10⁵ MPa and Poisson’s ratio as 0.3. The material for the main cable was represented using a multi-linear elastic material (MELAS) model to simulate transverse nonlinear compression deformation of the main cable cross-section. Nonlinear radial stiffness simulation of the main cable material was done by changing the stress-strain relationship in a multi-linear material (MELAS) model. The constitutive relation diagram of the material is shown in Figure 5.
Preload was applied using the BOLT PRELOAD function provided by the ANSYS WORKBENCH. The preloaded section displacement was locked by the LOCK command after the bolt was tightened and loaded. The unloaded bolt was set with the OPEN command. After the calculation was completed, the effective preload of the bolts was obtained using a preload probe. The FE model is shown in Figure 6.

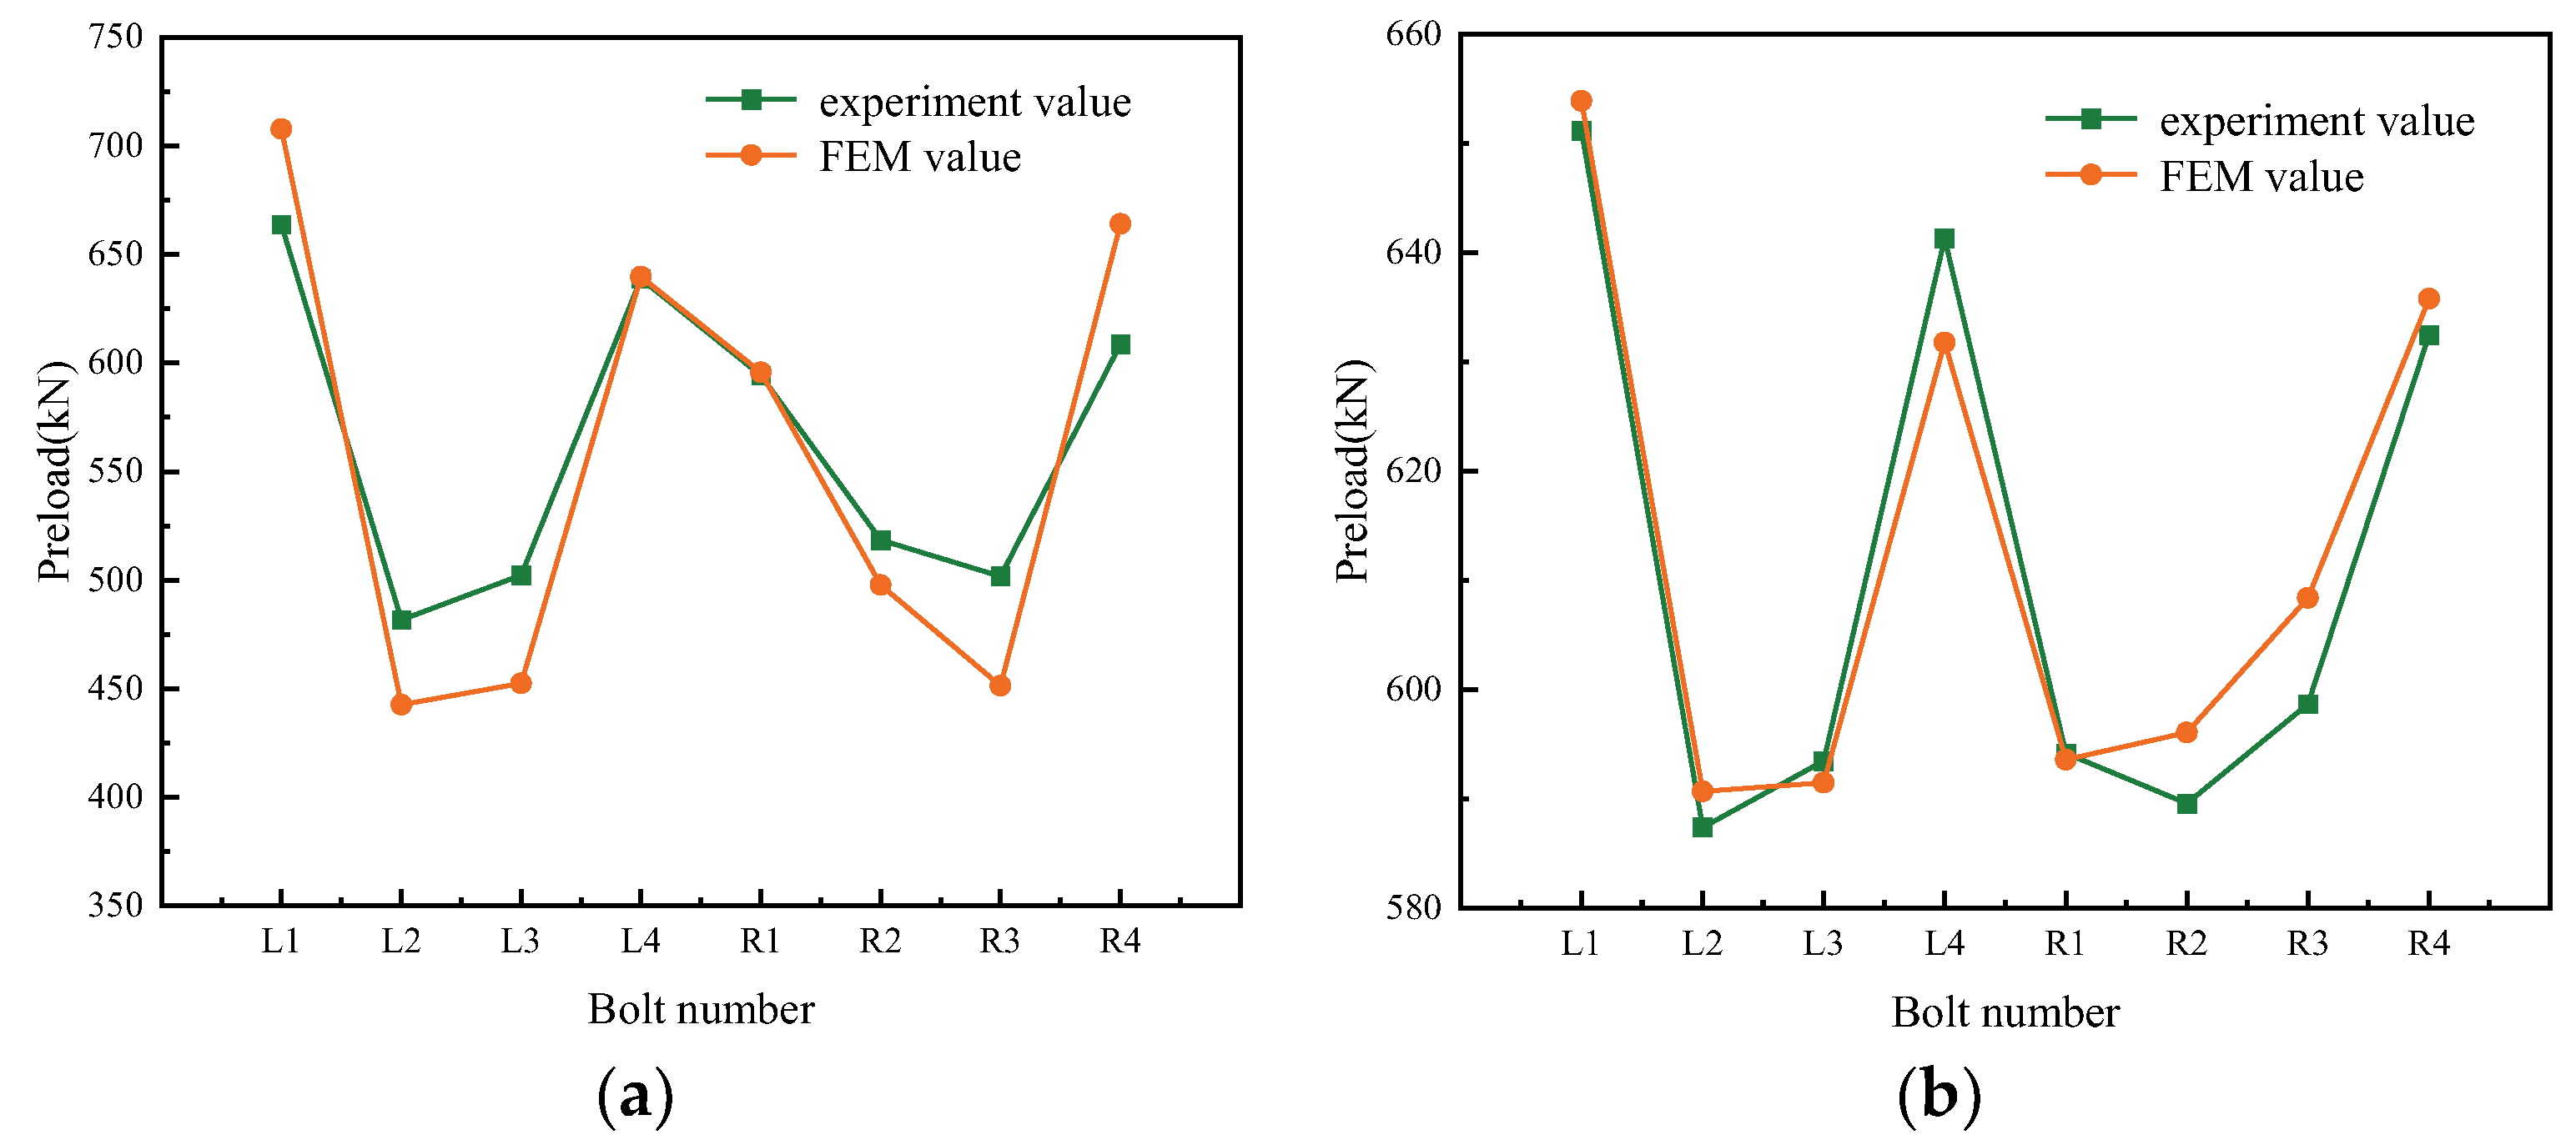
4.2. Finite Element Model Verification

Two rounds of tightening were carried out in the experiment, and after each round of tightening, the preload of each bolt and the gap of the cable clamp were recorded. The preload of each bolt obtained from the two rounds of experiments was applied to the corresponding bolt in the FE model. As the bolt preload was applied, the main cable in the FE model was compressed, and the gap between the cable clamps in the model was reduced. The size of the cable clamp gap in the FE model was obtained and compared with the experiment values as a means of verifying the accuracy of the homogenization equivalent simulation of the main cable material in the FE model. A comparison of experiment values and FE model calculations for the cable clamp gap is shown in Figure 7.
As depicted in Figure 7, the error between the clamp gap width simulated by the FE model and the measured value under the bolt preload was less than 1%. It showed that the fitted multi-linear elastic material (MELAS) stress-strain constitutive material can reasonably homogenize the main cable in the equivalent cable clamp and can better simulate the radial and circumferential mechanical properties of the main cable.
After verifying the main cable model, the overall finite element model was verified. The tightening rounds and tightening sequences in the model were consistent with the experiment. Two rounds of tightening were carried out in the FE model, and each round of tightening was carried out from the middle to both ends. Each round of the tightening process was simulated by setting the FE model to four analysis steps; in each analysis step, two bolts were tensioned diagonally, and the preload was set to 705 kN. After each round of tightening, the bolt preload data were collected in the FE model and compared with the experiment values. A comparison of the preload FE model calculation and experiment values is shown in Figure 8.
As depicted in Figure 8, the preload curve showed a w-shape, which was due to the variation of the preload generated by the elastic interaction of the bolts at this tightening sequence. The error between the experiment value and the FE model calculation value did not exceed 10%. The trend of the bolt preload was the same under the same tightening sequence. This showed that the cable clamp FE model established in this paper can simulate the force behavior of the actual cable clamp.

5. Influencing Factors of the Elastic Interaction

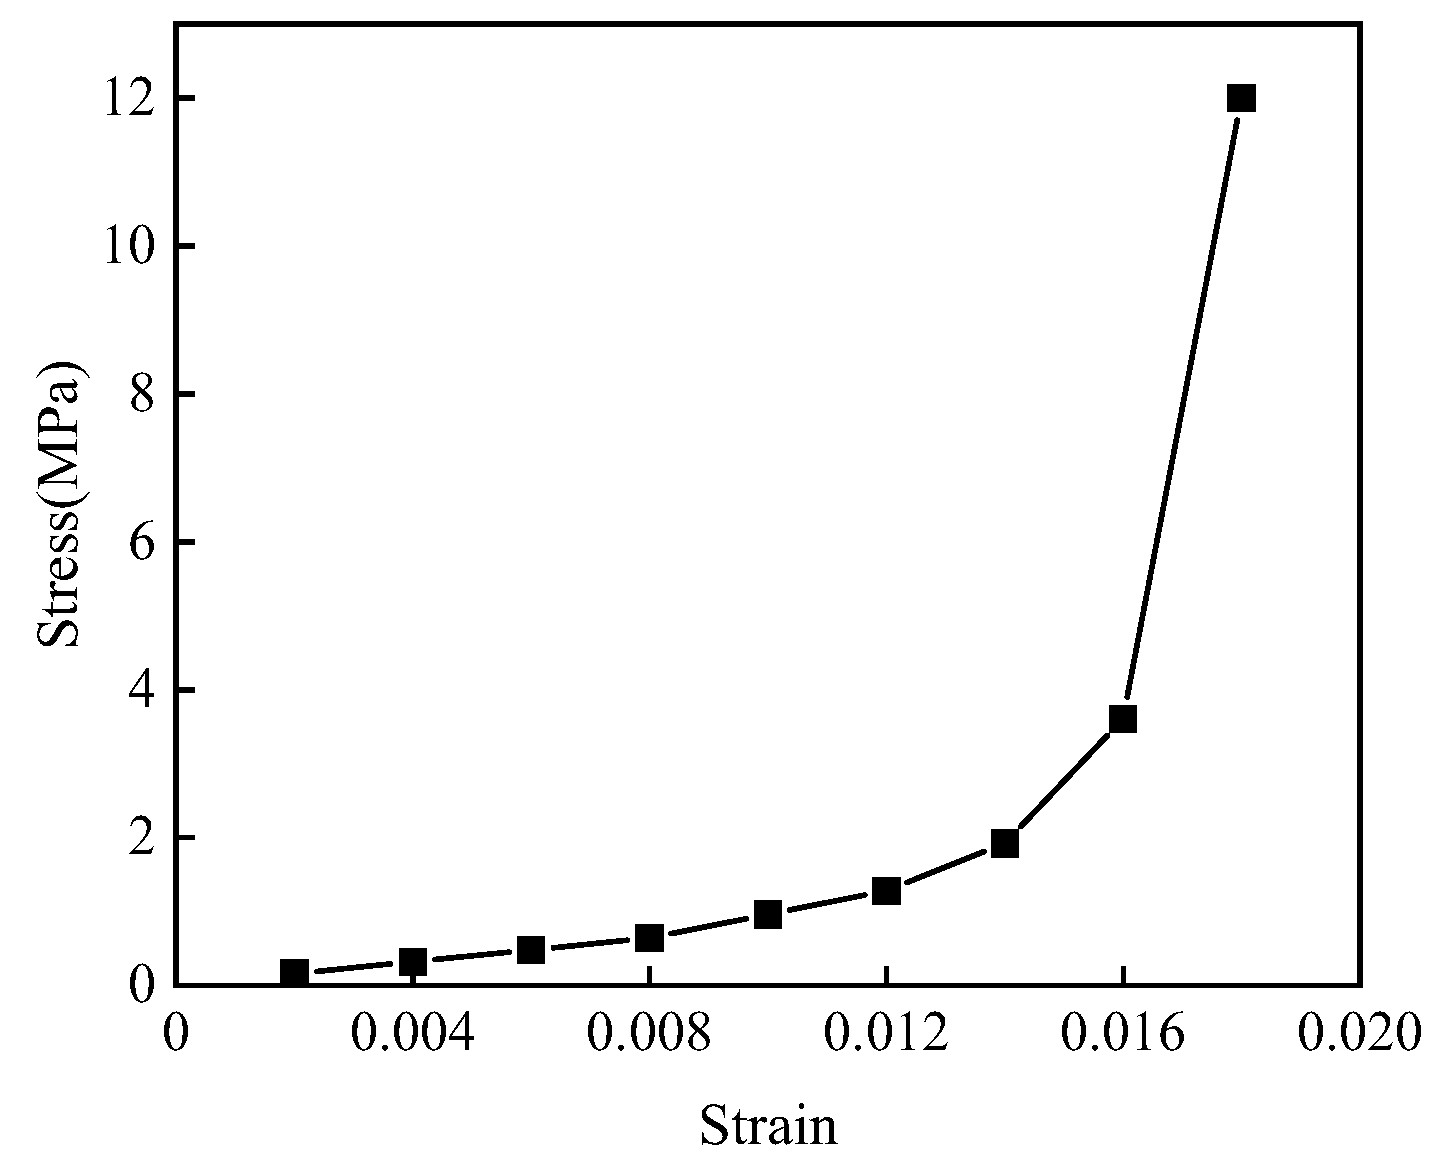
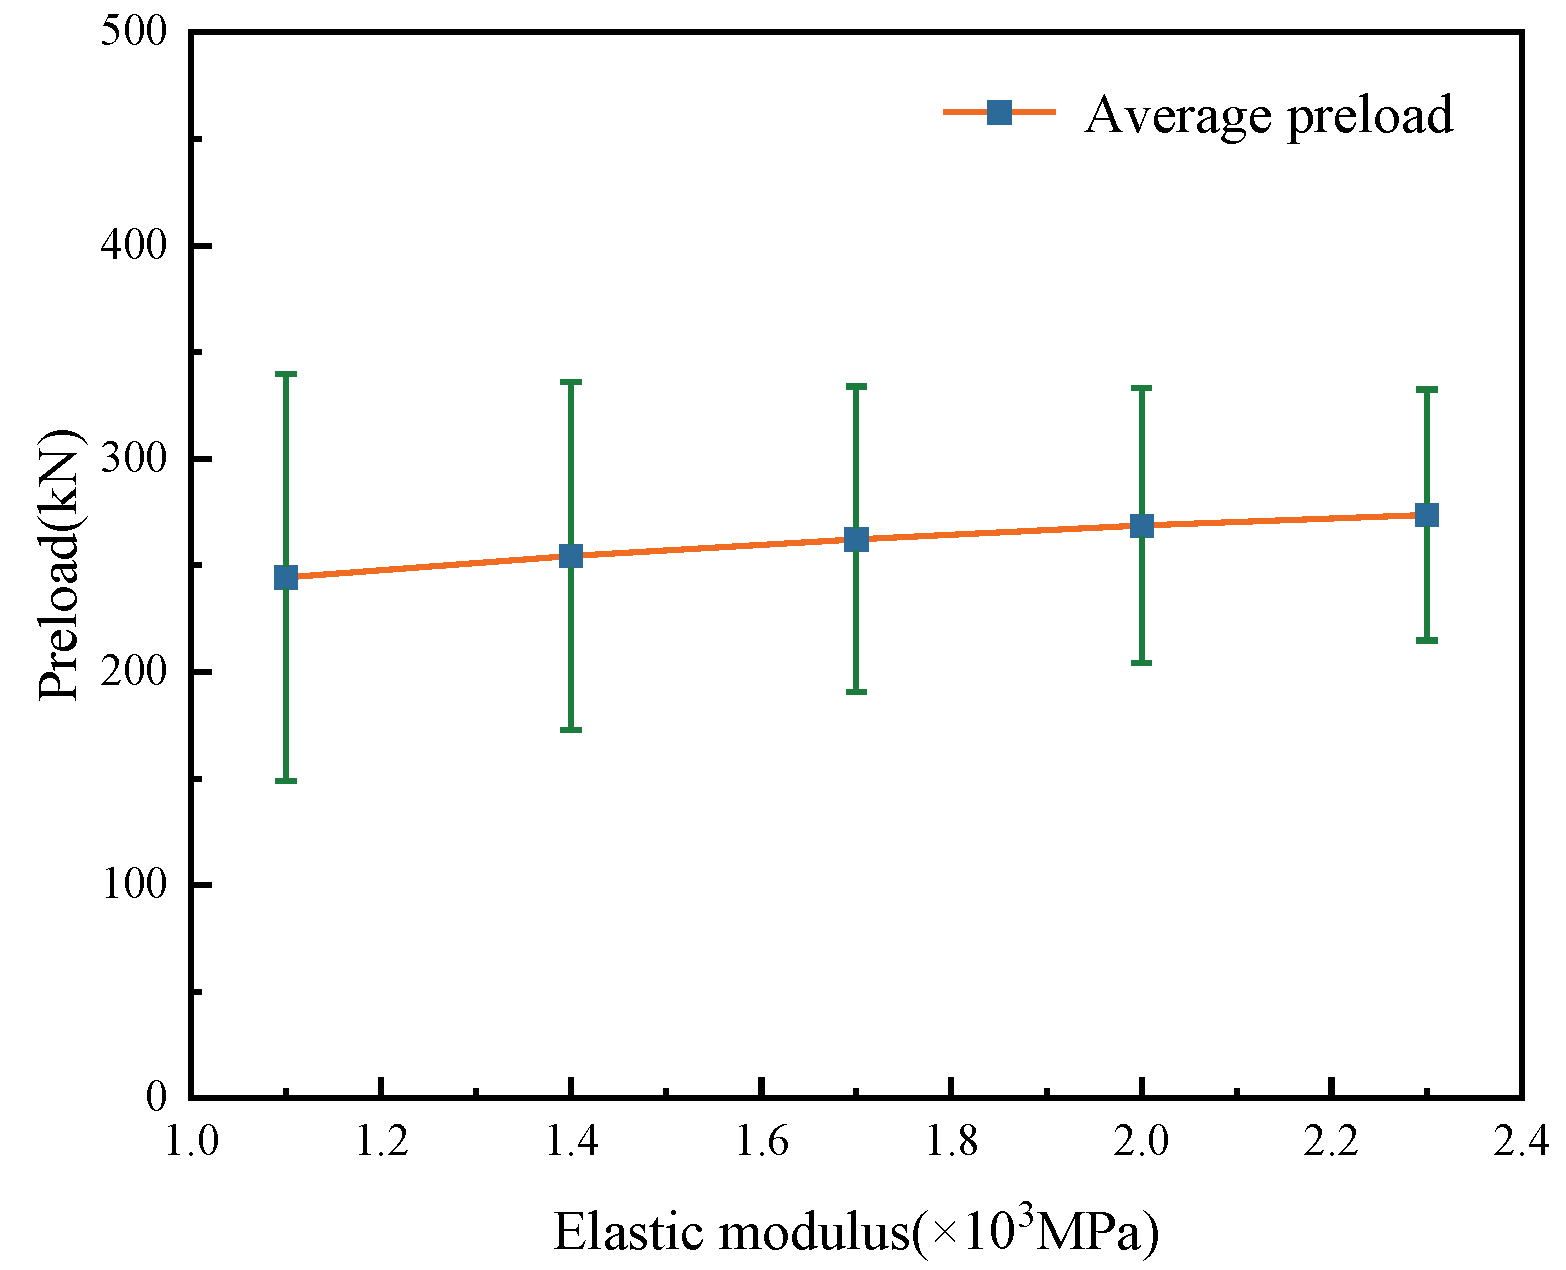
5.1. Main Cable Material Properties

During the clamp tightening process, the radial stiffness of the main cable cross-section gradually increased, which was related to the elastic modulus of the main cable material. Therefore, in the study of the main cable material properties, the main cable elastic modulus was mainly researched on the elastic interactions. Reference [33] found that the elastic modulus of the main cable in the later stage of tightening was approximately between 1.4 × 10³ MPa and 2.0 × 10³ MPa. Therefore, the elastic modulus of the main cable material was taken as 1.1 × 10³ MPa, 1.4 × 10³ MPa, 1.7 × 10³ MPa, 2.0 × 10³ MPa, and 2.3 × 10³ MPa.
The same sides of the bolts were tightened step by step in sequence ((L1, R1)→(L2, R2)→(L3,R3)→(L4, R4)). The tightening sequence is shown in Figure 9. The preload of the bolt was set to 352.5 kN, which was 0.5 times the design value. Both side bolts were tightened simultaneously in sequence.
Preload data were obtained from bolts with different elastic modulus values. Due to the simultaneous tightening of two bolts and the tightening sequence and the cable clamp being axisymmetric, one side of the bolt was taken for analysis. To see the change in elastic interaction more clearly, the average and standard deviation of the bolt preload were calculated. The preload data obtained from the FE model and the average and standard deviation data of the calculated preload are summarized in Table 2.
As depicted in Table 2, compared with the bolt preload when the elastic modulus of the main cable was 1.1 × 10³ MPa, the average value of preload when the elastic modulus of the main cable was 1.4 × 10³ MPa–2.3 × 10³ MPa increased by 10.0 kN, 17.7 kN, 24.2 kN, and 29.2 kN, with growth rates of 4.1%, 7.3%, 9.9%, and 12.0%, respectively; The standard deviation of the bolt preload was reduced by 14.0 kN, 23.8 kN, 31.0 kN, and 36.6 kN, with reduction rates of 14.6%, 24.9%, 32.4%, and 38.4%, respectively. When the elastic modulus increased from 1.1 × 10³ MPa to 2.3 × 10³ MPa, the average loss of preload was 108.1 kN, 98.1 kN, 90.4 kN, 83.9 kN, and 78.9 kN. This also meant that when the elastic modulus was increased by approximately 110%, the average preload loss was reduced by approximately 27%.
In order to more clearly observe the trend of the preload and the change law of the bolt elastic interaction effect under different main cable elastic modulus, the data for the bolt preload are shown in Figure 10. The average and standard deviation values of the bolt preload are shown in Figure 11.
As depicted in Figure 10, after the tightening of the clamp bolts, the preload decreased to different degrees, which caused an obvious elastic interaction. When the elastic modulus of the main cable increased from 1.1 × 10³ MPa to 2.3 × 10³ MPa, the loss of preload on bolt L1 increased; however, the loss of preload on bolts L2 and L3 was decreased. In addition, as the elastic modulus of the main cable increased from 1.1 × 10³ MPa to 2.3 × 10³ MPa, the distance between adjacent preload curves became smaller.
As depicted in Figure 11, the average of the bolt preload increased with the increase in the main cable elastic modulus, and the trend of increase gradually became slower. The standard deviation of the bolt preload decreased with the increase in the main cable elastic modulus, the decreasing trend gradually became slower, and the distribution of the bolt preload became more uniform.
In general, the influence of elastic interactions decreased as the elastic modulus of the main cable increased. A larger elastic modulus means greater stiffness, which is consistent with the results of Equation (7) in the theoretical analysis. Therefore, in the design of suspension bridges, the elastic modulus of the main cable in the clamping part of the cable clamp should be increased appropriately.

5.2. Cable Clamp Design Parameters

There are some differences in the designs of different types of clamps, mainly in the center distance of the bolts and the number of bolts. To study the influence of the changes in these two design parameters on the elastic interaction of the cable clamp bolt, two types of working cases were designed. The first was to change the center distance for the bolts at a certain number of bolts and the second was to change the number of bolts at the same center distance of the bolt. The other clamp design parameters, such as clamp width, were the same in all cases. The tightening sequence for each case was the same as step by step in sequence. The preload of the bolt was set to 352.5 kN, which was 0.5 times the design value. Both side bolts were tightened simultaneously in sequence.

5.2.1. Bolt Distance

The center distance between the clamp bolts on the same side is usually between four and seven times the bolt diameter. The FE model of the cable clamp used a high-strength bolt with a diameter of 45 mm, and the number of bolts on one side was set to four. To study the influence of the bolt center distance on the elastic interaction of the bolt, the bolt distance was set to four, five, six, and seven times the bolt diameter, 180 mm, 225 mm, 270 mm, and 315 mm, respectively. The four cases of different bolt center distances are shown in Figure 12.
For analysis, the bolt on the same side of the clamp was used. To see the change in elastic interaction more clearly, the average and standard deviation of the bolt preload were calculated. The preload data obtained from the FE model and the average and standard deviation data of the preload for different bolt center distances are summarized in Table 3.
As depicted in Table 3, compared with the data when the center distance of the bolt was 180 mm, the average value of preload when the center distance of the bolt was 225–315 mm increased by 32.8 kN, 51.5 kN, 61.4 kN, with growth rates of 15.2%, 23.9%, and 28.5%, respectively; the standard deviation of the bolt preload was reduced by 19.4 kN, 29.1 kN, and 32.4 kN, with reduction rates of 21.9%, 33.0%, and 36.7%, respectively. When the bolt center distance increased from 180 mm to 315 mm, the average loss of preload was 137.1 kN, 104.2 kN, 85.5 kN, and 75.7 kN. This also meant that when the bolt center distance was increased by 75%, the average preload loss was reduced by approximately 45%.
In order to more clearly observe the trend of the preload and the change law of the bolt elastic interaction effect under different center distance of bolt, the data for the bolt preload are shown in Figure 13. The average and standard deviation values of the bolt preload are shown in Figure 14.
As depicted in Figure 13, after the tightening of the clamp bolts, the preload decreased to different degrees, which caused an obvious elastic interaction. As the bolt center distance increased, the bolt preload increased, and the distribution of the preload became more uniform. When the center distance of the bolts was decreased from 315 mm to 180 mm, the loss of preload on bolts L1–L3 increased. As the center distance between the bolts decreased uniformly, the amount of preload loss of the bolts was non-uniformly and gradually increased. In addition, as the bolt center distance increased from 180 mm to 315 mm, the distance between adjacent preload curves became smaller.
As depicted in Figure 14, as the bolt center distance increased, the bolt average preload increased, and the trend of increase gradually slowed down. The standard deviation of the bolt preload decreased with the increase in the bolt center distance, and the distribution of the bolt preload became more uniform.
In general, the elastic interaction of the bolt decreased as the bolt center distance increased. The reason for this phenomenon is that larger bolt center distance means larger horizontal distance of the inclined section after deformation of the connection structure. From Equation (8) in the theoretical analysis, larger L leads to larger Δ F , and this is consistent with the results of the FE model. Therefore, in the design of the cable clamp, the center distance of the bolt should be increased appropriately

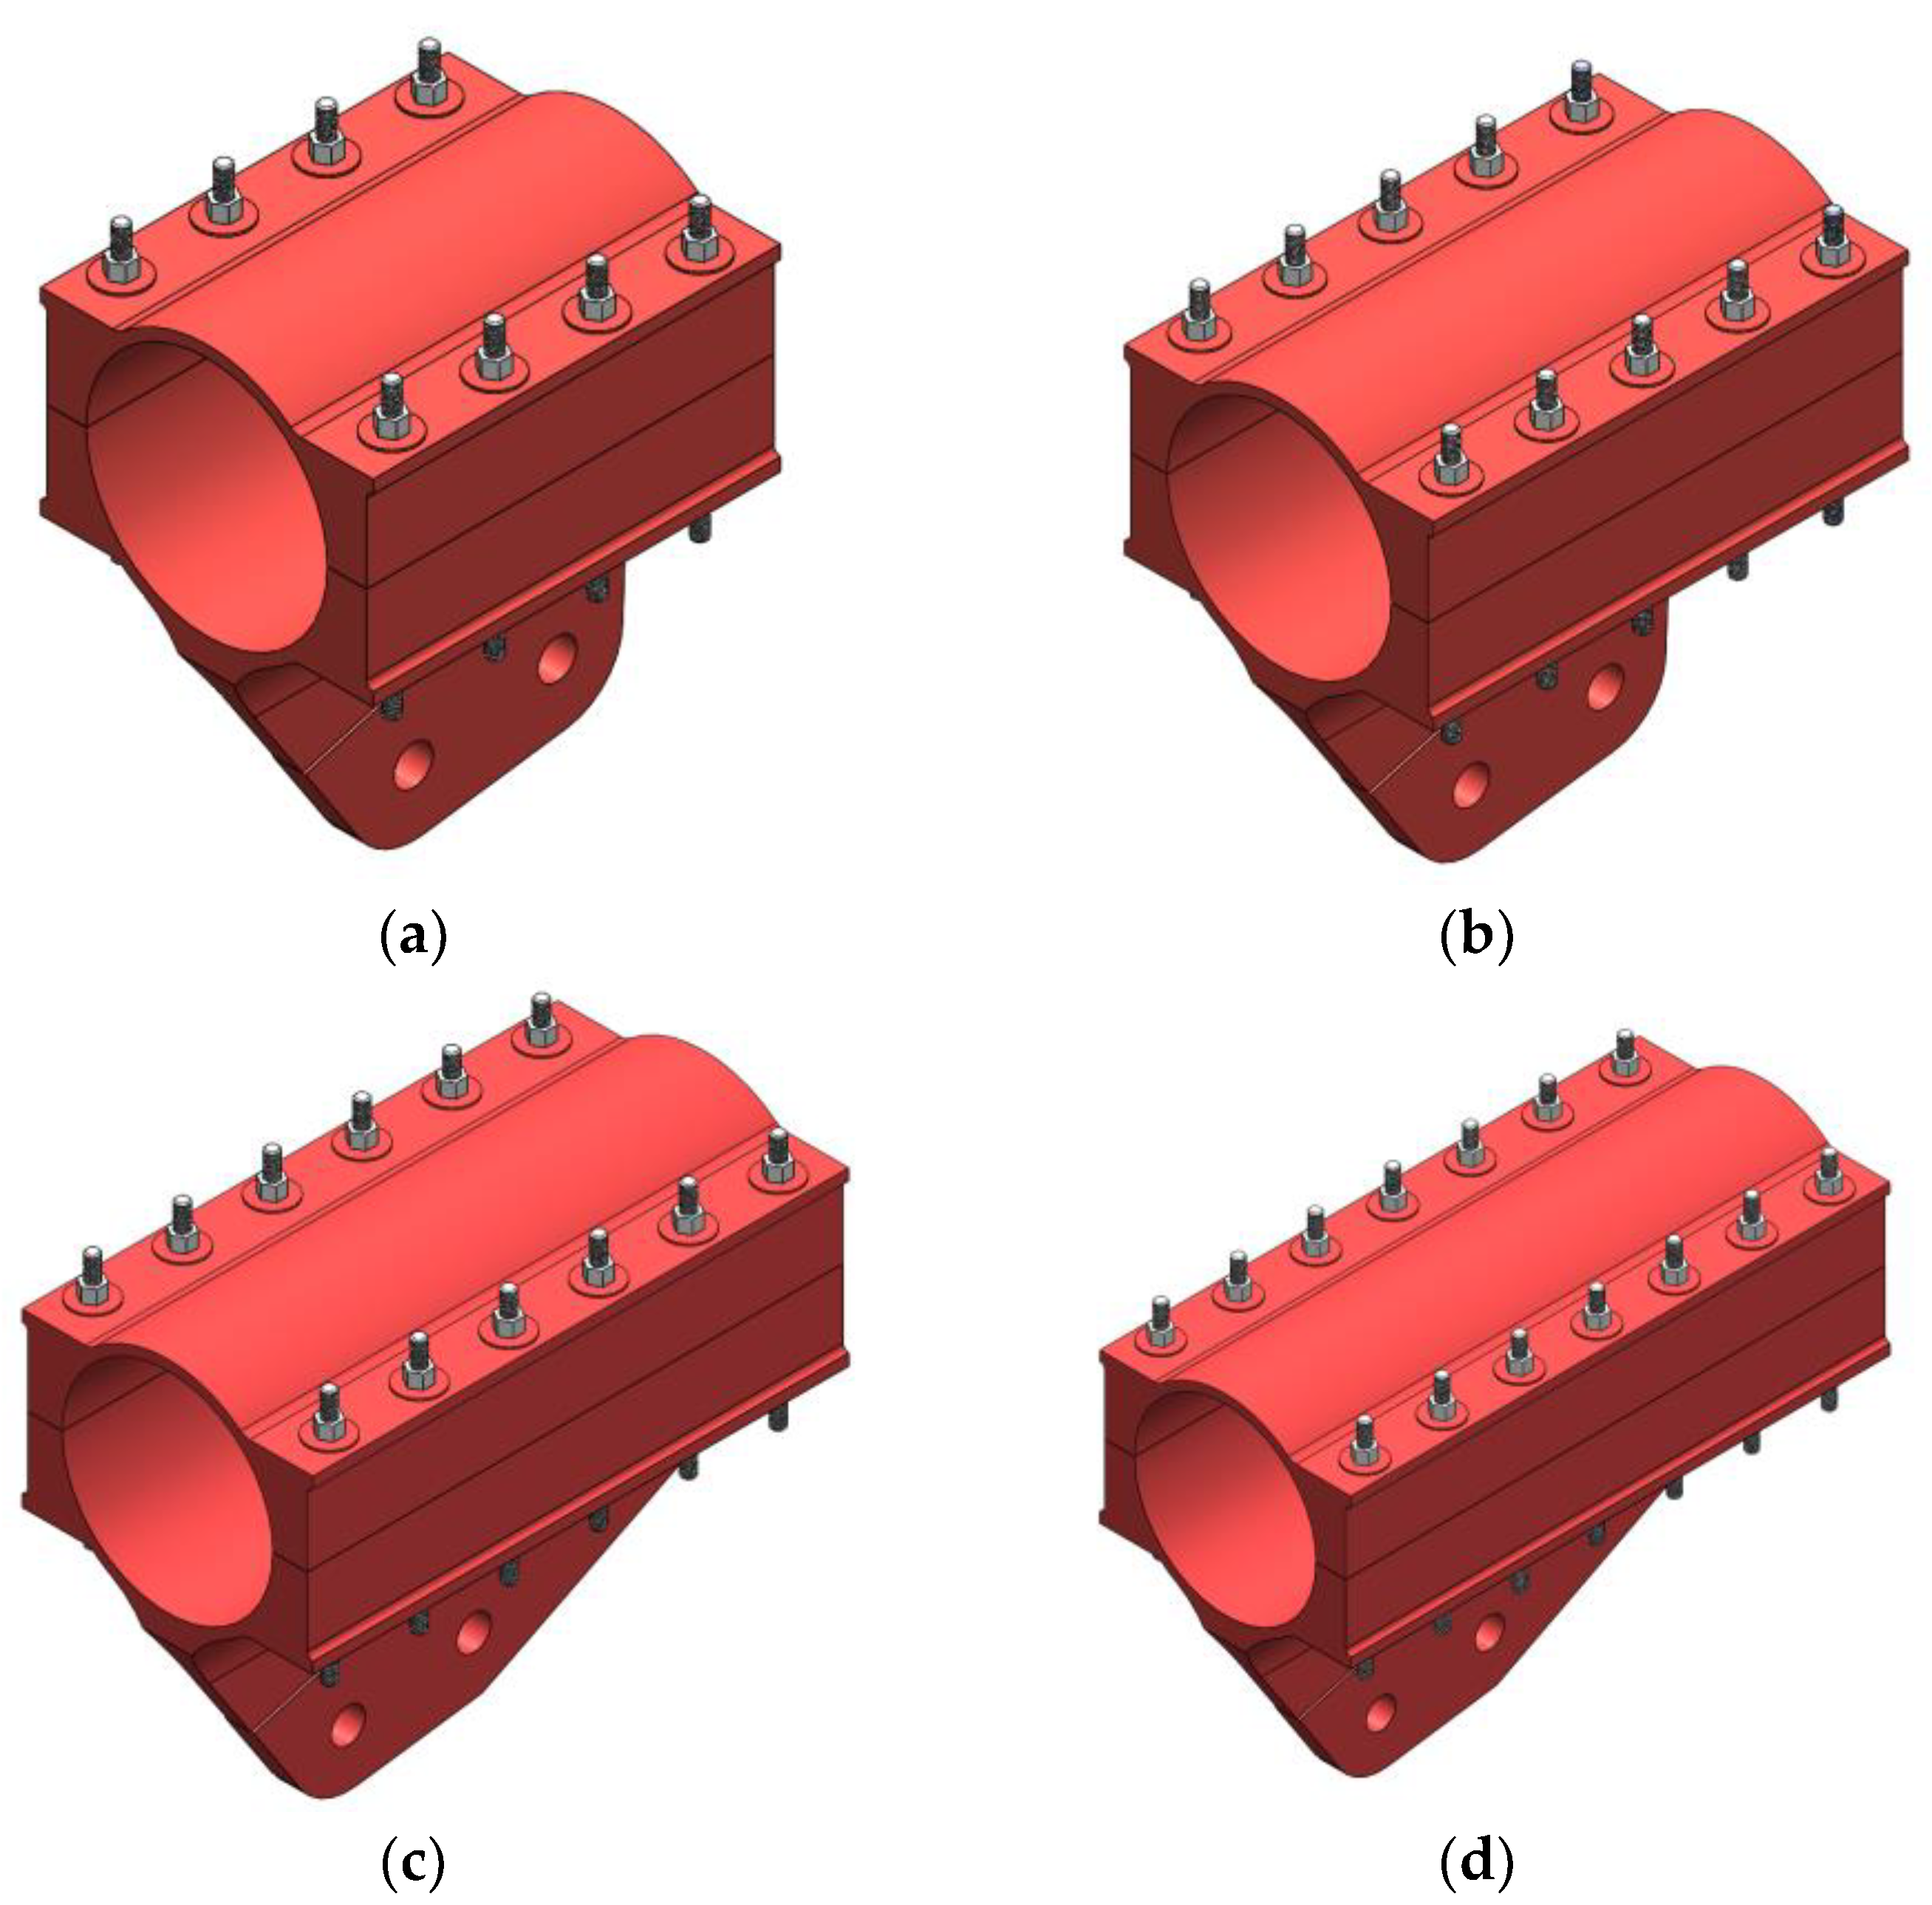
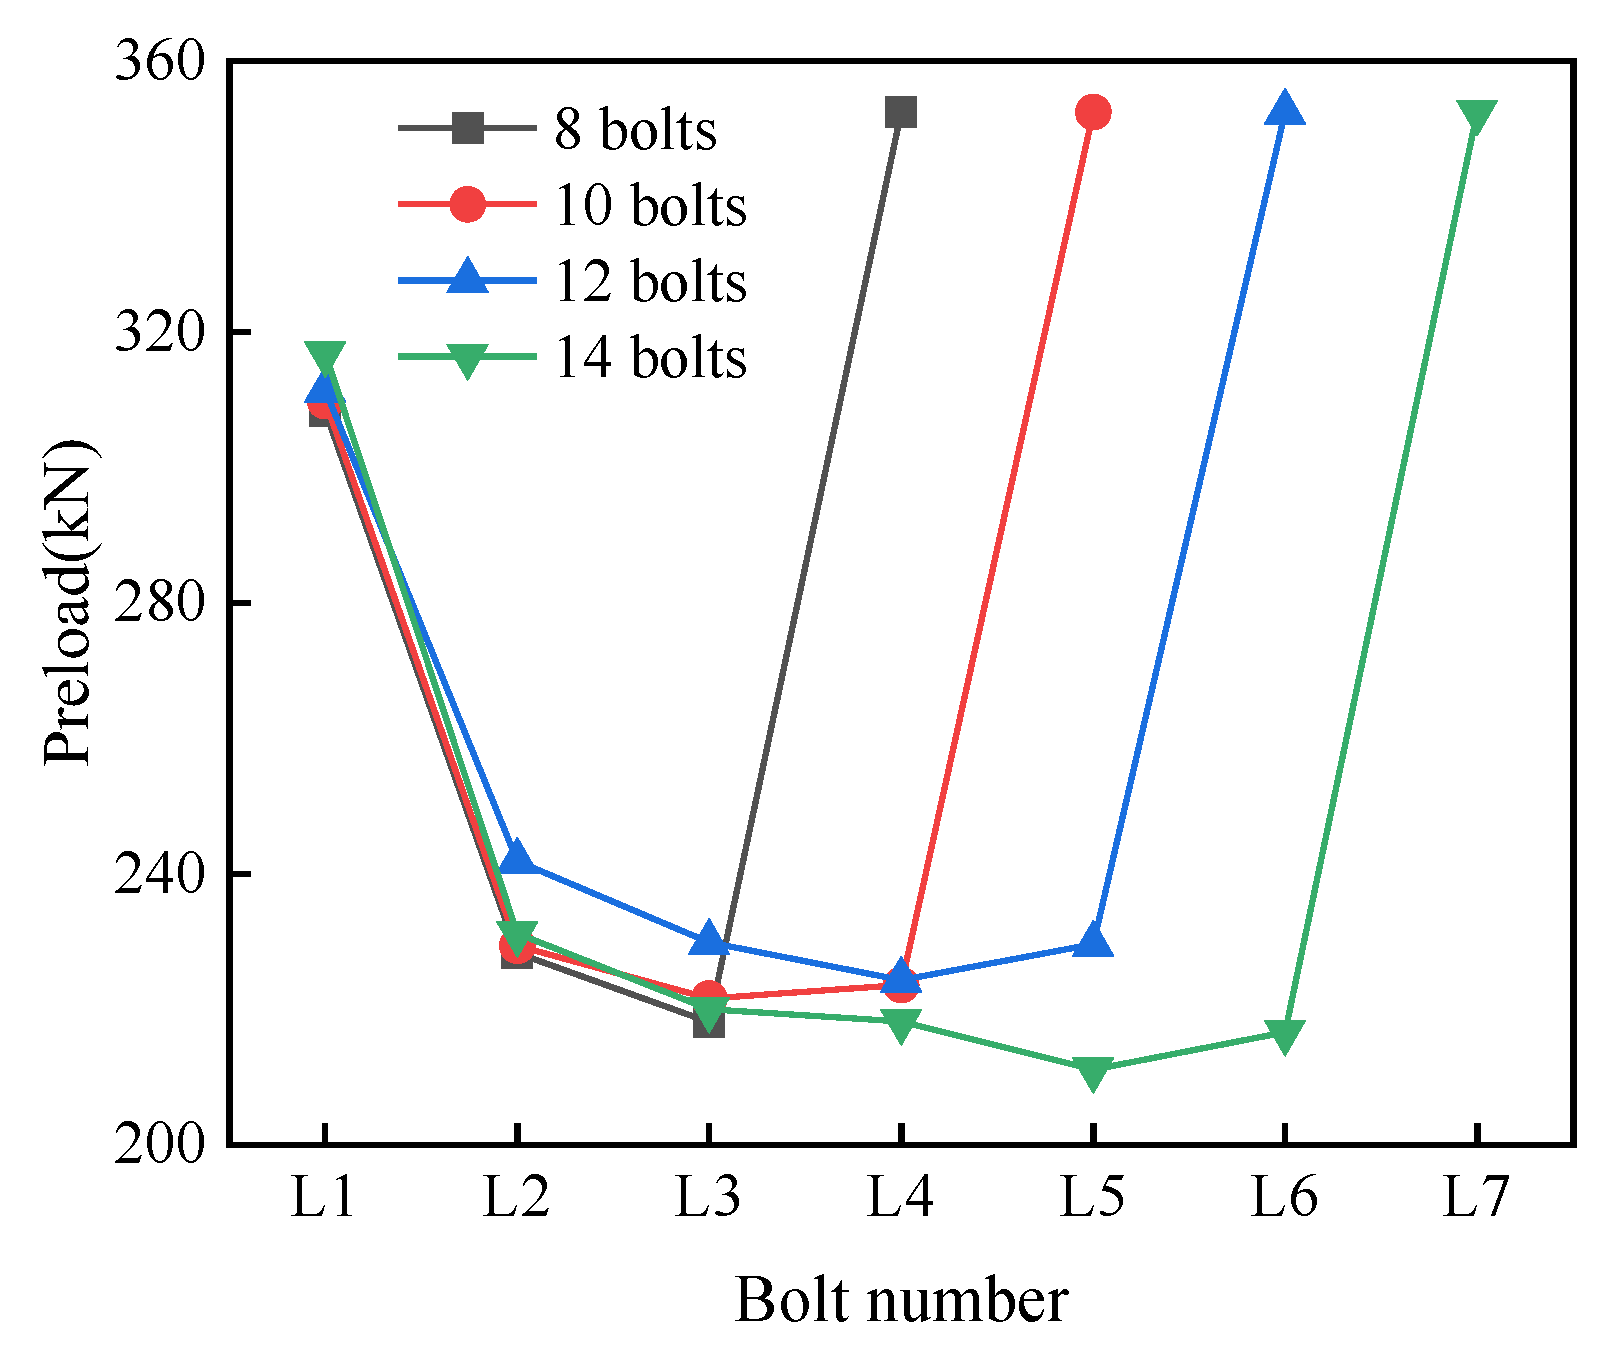
5.2.2. Number of Bolts

The main cable of suspension bridges is curved, and the clamps are usually clamped to the main cable with a certain inclination. Clamps with large inclinations require more preload to prevent the clamp from slipping. However, the amount of preload each bolt can provide is limited, so the number of bolts must be increased. To study the influence of the number of bolts on the elastic interaction of the bolt, the bolt center distance was set to 315 mm, and the number of bolts was 8, 10, 12, and 14, respectively. The four cases of different numbers of bolts are shown in Figure 15.
For analysis, the bolt on the same side of the clamp was used. To see the change in elastic interaction more clearly, the average and standard deviation values of the bolt preload were calculated. The preload data obtained from the FE model and the average and standard deviation data of the preload for different numbers of bolts are summarized in Table 4.
As depicted in Table 4, compared with the data when the number of bolts was 8, the average value of preload when the number of bolts was 10–14 mm decreased by 9.4 kN, 11.9 kN, and 24.5 kN, with reduction rates of 3.4%, 4.5%, and 9.2%, respectively; The standard deviation of bolt preload gradually decreased at 8–12 and increased at 12–14, but the change value was not large.
In order to more clearly observe the trend of the preload and the change law of the bolt elastic interaction effect for different numbers of bolts, the data for the bolt preload are shown in Figure 16. The average and standard deviation values of the bolt preload are shown in Figure 17.
As depicted in Figure 16, after the tightening of the clamp bolts, the preload decreased to different degrees, which caused an obvious elastic interaction. The preload curve was almost translational along the x-axis as the number of bolts increased.
As depicted in Figure 17, the average preload of bolts decreased with the number of bolts increased, and the decrease was minor. The standard deviation of the bolt preload remained almost constant with the increase in the number of bolts, indicating that the increase in the number of bolts had little effect on the uniformity of the bolt preload.
Overall, increasing the number of bolts increases the elastic interaction of bolts, but in smaller increments. The number of bolts affects the elastic interaction to a minor degree. This phenomenon may be due to the fact that the elastic interaction between the bolts only affects neighboring bolts to a greater extent and bolts farther away from each other to a lesser extent. Therefore, in actual engineering, the influence of the number of bolts on the elastic interaction can be ignored.

5.3. Tightening Method

In actual bolt tightening work, there are usually different tightening methods. The tightening method usually includes the preload of the bolt installation and the tightening sequence. To investigate the influence of the tightening method on the elastic interaction of the bolts, a finite element model was established. The FE model used a cable clamp with eight bolts, and the bolt center distance was 315 mm. The modeling method is described in Section 4.1.

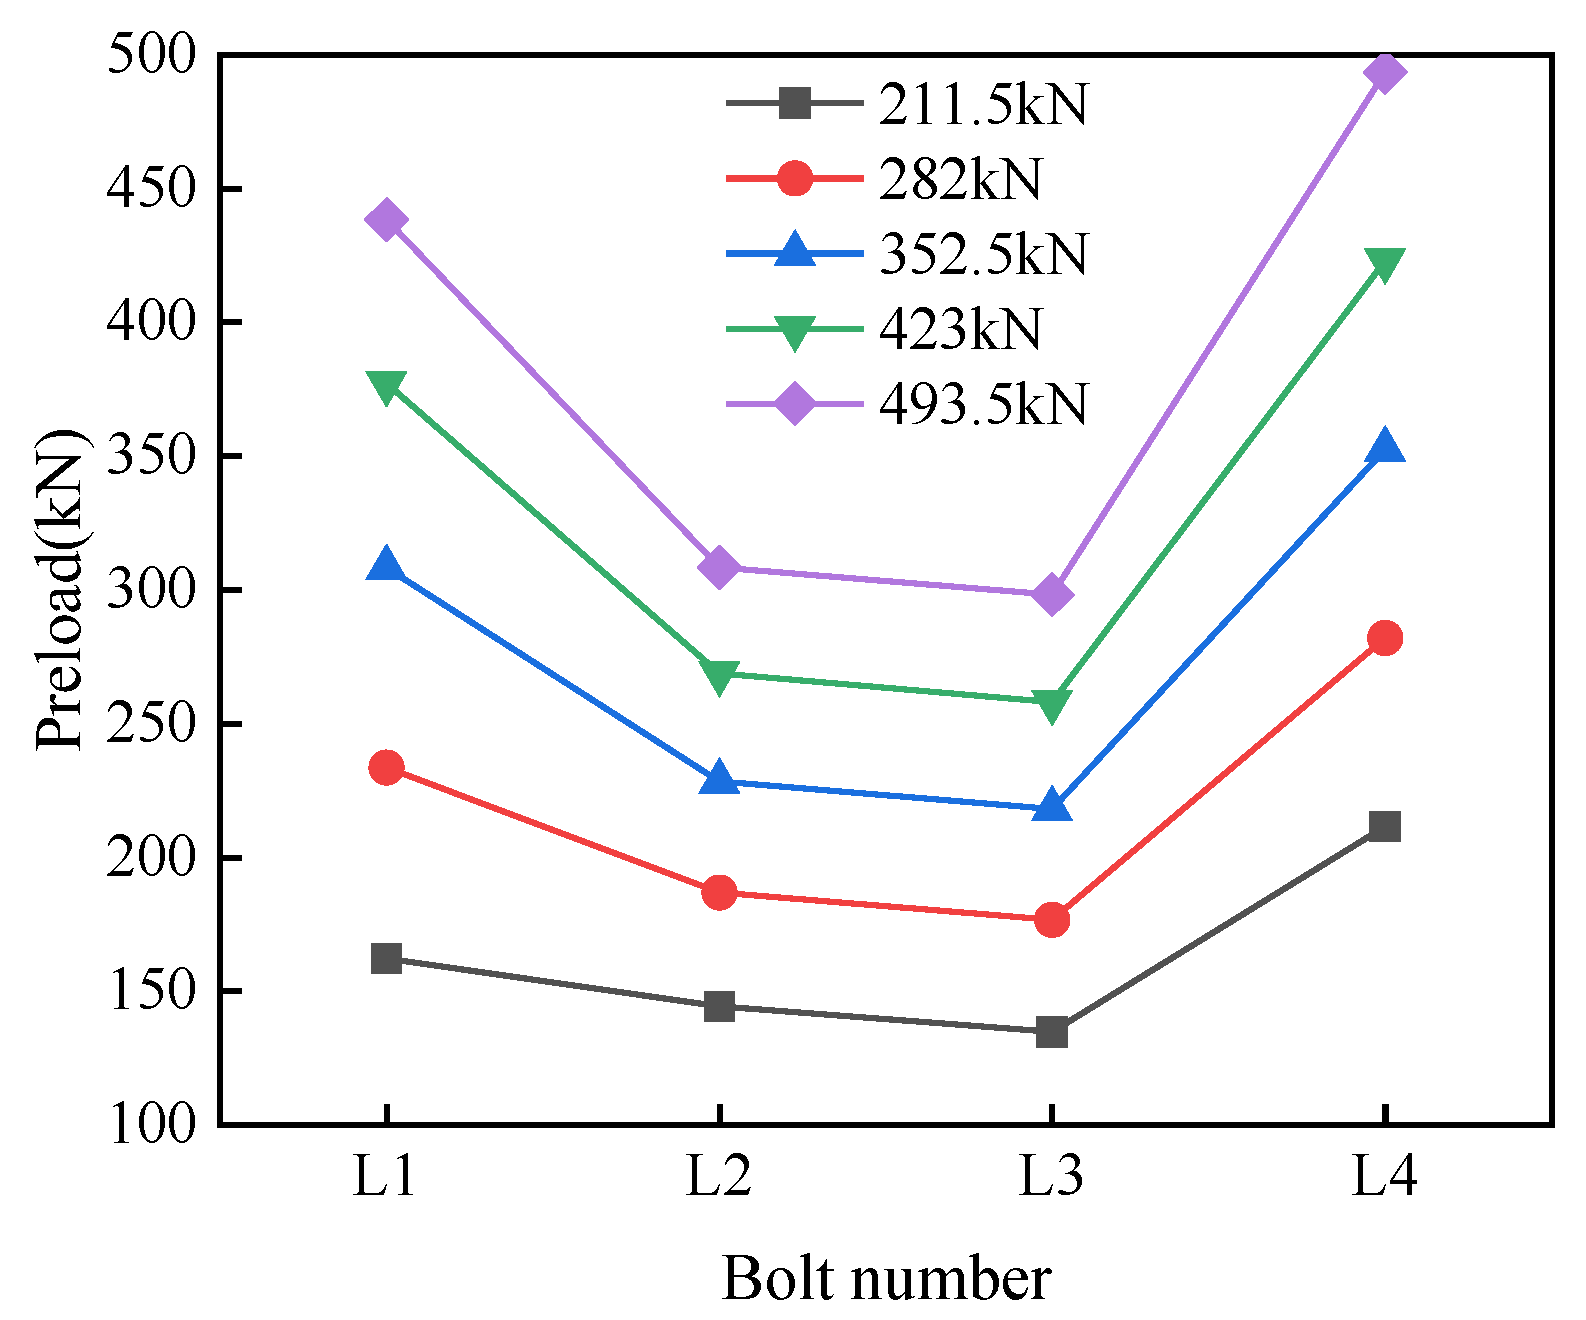
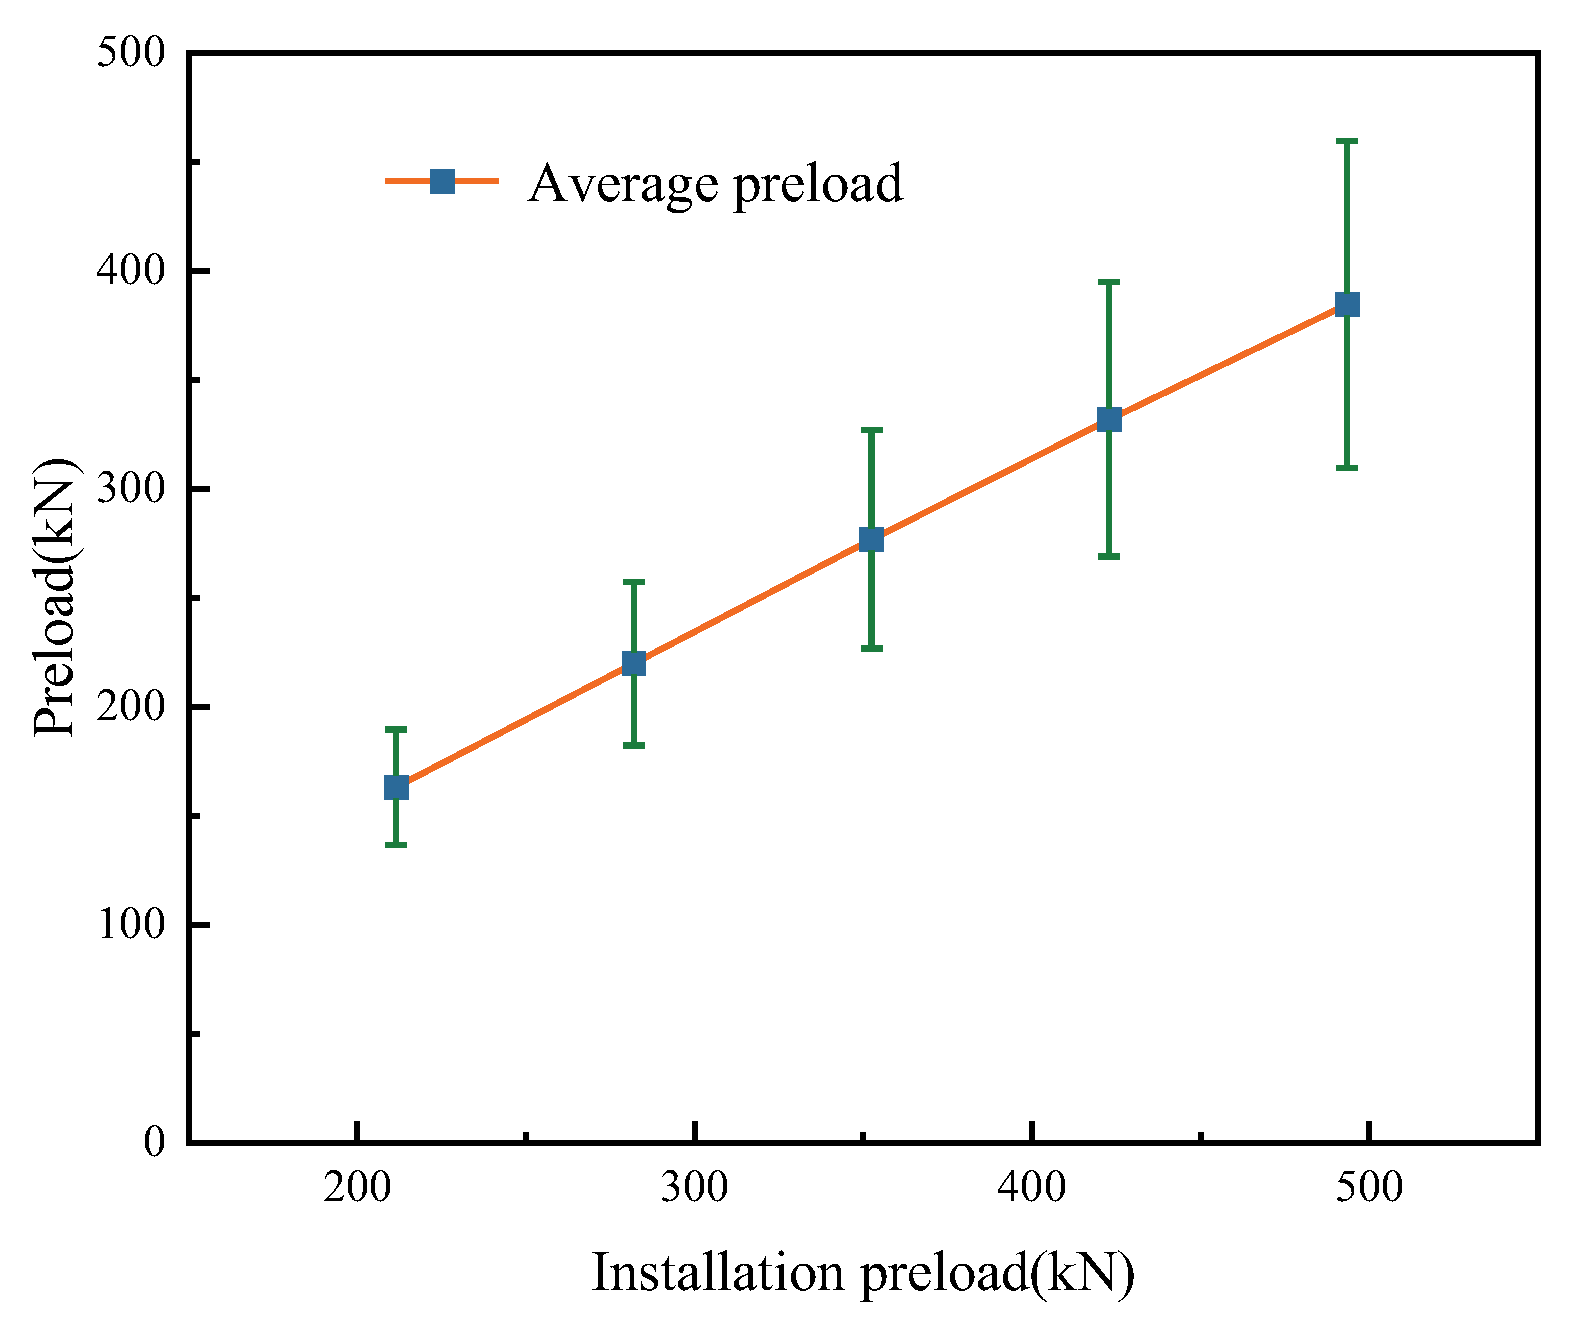
5.3.1. Preload of Bolt Installation

The bolts are usually tightened in one round with a preload less than the design value. Therefore, design preloads of 211.5 kN (0.3 times the installation design value), 282 kN (0.4 times the installation design value), 352.5 kN (0.5 times the installation design value), 423 kN (0.6 times the installation design value), and 493.5 kN (0.7 times the installation design value) were used to study the influence of the amount of preload on the elastic interaction of bolts during the tightening process.
For analysis, the bolt on the same side of the clamp was used. To see the change in elastic interaction more clearly, the average and standard deviation values of the bolt preload were calculated. The preload data obtained from the FE model and the average and standard deviation data of the preload for different bolt installation preload values are summarized in Table 5.
As depicted in Table 5, compared with the data when the bolt installation preload was 211.5 kN, when the preload of bolt installation was 282–493.5 kN, the average value of the preload increased by 56.7 kN, 113.7 kN, 168.7 kN, and 221.5 kN, with growth rates of 34.8%, 69.7%, 103.4%, and 136.1%, respectively; The standard deviation of bolt preload was increased by 11.0 kN, 23.5 kN, 36.4 kN, and 48.4 kN, with growth rates of 41.5%, 88.7%, 137.4%, and 182.6%, respectively. When the bolt installation preload increased from 211.5 kN to 493.5 kN, the average loss of the preload was 48.4 kN, 62.2 kN, 75.7 kN, 91.2 kN, and 108.9 kN. This also meant that when the bolt installation preload was increased by 133%, the average preload loss was reduced by approximately 125%, which was almost a linear relationship.
In order to more clearly observe the trend of the preload and the change law of the bolt elastic interaction effect under different bolt installation preload values, the data for the bolt preload are shown in Figure 18. The average and standard deviation values of the bolt preload are shown in Figure 19.
As depicted in Figure 18, after the tightening of the clamp bolts, the preload decreased to different degrees, which caused an obvious elastic interaction. As the installation preload increased, the bolt preload curve almost translated along the Y-axis, while the slope of each straight line segment increased slightly. In addition, as the installation preload increased from 211.5 kN to 493.5 kN, the distance between adjacent preload curves was almost the same.
As depicted in Figure 19, the average bolt preload increased linearly as the installation preload increased. The standard deviation of the bolt preload increased as the installation preload increased. This showed that as the installation preload increased, the distribution of the bolt preload became more non-uniform, and the elastic interaction became more obvious. From Equation (7) in the theoretical analysis, the relationship between Δ F and F is positively correlated. The results of the finite element modeling also verified the theoretical analysis.
Therefore, in the process of bolt tightening, the installation preload should be selected moderately to ensure that the bolt preload reaches a standard and uniform distribution.

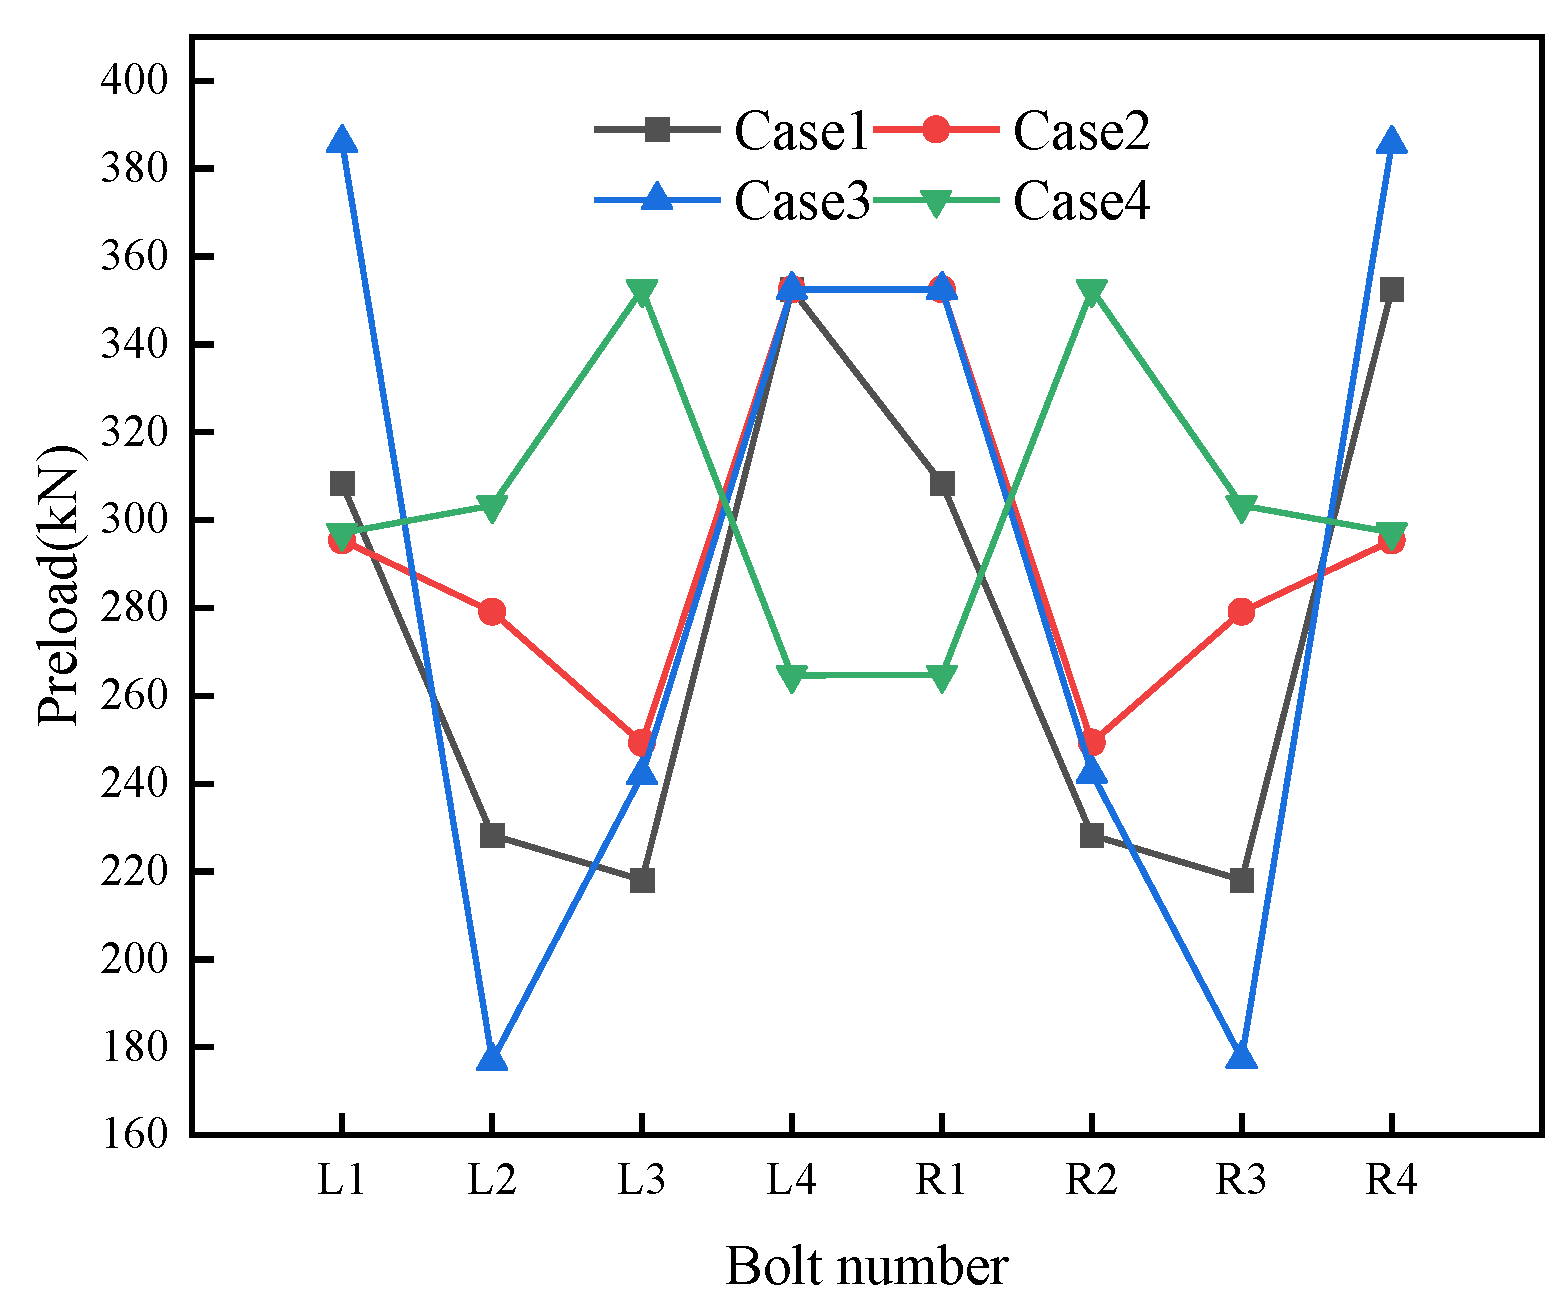
5.3.2. Bolt Tightening Sequence

The bolt was designed to be tightened under four cases, each corresponding to a tightening sequence. These four tightening sequences were step-by-step sequential tightening ((L1, R1)→(L2, R2)→(L3, R3)→(L4, R4)), double-side diagonal tightening ((L1, R4)→(L2, R3)→(L3, R2)→(L4, R1)), diagonal center-to-ends tightening ((L2, R3)→(L3, R2)→(L1, R4)→(L4, R1)) and diagonal ends-to-center tightening ((L1, R4)→(L4, R1)→(L2, R3)→(L3, R2)). The corresponding two bolts were tightened at the same time with a preload of 352.5 kN (0.5 times the installation design value). The tightening sequence for the four cases is shown in Figure 20.
Some tightening sequences are not axisymmetric, so the preload of all bolts needs to be analyzed. The preload data obtained from the FE model and the average and standard deviation data of the preload for different numbers of bolts are summarized in Table 6.
As depicted in Table 6, when the tightening sequence changed from case 1 to case 4, the average loss of preload was 75.7 kN, 58.4 kN, 63.1 kN, and 48.1 kN. The loss of preload was maximum when the tightening sequence was case 1 and minimum when it was case 4.
In order to more clearly observe the trend of the preload and the change law of the bolt elastic interaction effect under different tightening sequences, the data for the bolt preload are shown in Figure 21. The average and standard deviation values of the bolt preload are shown in Figure 22.
As depicted in Figure 21, after the tightening of the clamp bolts, the preload decreased to different degrees, which caused an obvious elastic interaction. There was a maximum preload and a minimum preload in each curve. The difference between the maximum preload and the minimum preload was arranged in descending order of the cases, as case 3, case 1, case 2, and case 4. This order of arrangement was also the order of preload non-uniformity.
As depicted in Figure 22, when tightened in the tightening sequence of case 1, the average loss of preload was the largest. When tightened in the tightening sequence of case 3, the standard deviation of the preload was the largest. The average and standard deviation of the preload for the other two cases were not much different when tightened according to the tightening sequences of cases 2 and 4. Although the average preload loss in case 1 was the largest, the maximum difference compared to the other cases was not to exceed 10%. In general, the tightening sequence in case 3 had the most obvious elastic interaction among these four tightening sequences. The tightening sequence of the tightening bolts from the center, as in case 3, should not be considered the preferred sequence. Therefore, when tightening the bolts, try to avoid tightening from the center bolt first.

6. Discussion

There are fewer studies on the factors affecting the elastic interaction of cable clamp bolts in suspension bridges. The purpose of this study was to investigate the laws governing the elastic interaction of bolts due to factors that may occur in the design and construction of cable clamps. Firstly, a theoretical model was derived for the elastic interaction of the cable clamp bolt. Secondly, an indoor full-scale experiment was conducted to validate the FE model using the experiment data. Thirdly, based on the FE model, the influence of main cable material properties, cable clamp design parameters, and tightening method on the elastic interaction of cable clamp bolts was discussed.
The research in this paper can provide suggestions for reducing the elastic interaction of bolts in the design and construction of suspension bridge cable clamps. In our conclusions, the number of bolts has a small effect on the elastic interaction, but in some literature [33], it is argued that a higher number of bolts leads to a higher elastic interaction effect. Comparison shows that the number of cable clamp bolts in the literature [33] is much larger than in this article. Our conclusions may be applicable for small changes in the number of bolts. A deeper study of the impact of the number of bolts is needed in the future. In addition, in our theoretical model, there are two linear coefficients, and the coefficients α and β require a more in-depth study. In the FE model, the last tensioned bolt holds the applied preload, but it also experiences a loss of preload in the experiment, which is transient loss due to the bolt thread gap rather than elastic interaction effects. In our research, much research has been done on eight-bolt clamps, and the applicability of the conclusions to clamps with other numbers of bolts needs to be verified. Most of the conclusions of the article are obtained from the FE model, and more experiments need to be conducted in the future to verify the conclusions.

7. Conclusions

From the study of the factors influencing the elastic interaction of cable clamp bolts based on theoretical analysis, full-scale experiment, and finite element analysis, the following conclusions were drawn.
(1)
From the theoretical model, when other parameters are the same, larger bolt diameter, smaller bolt clamping section length, lower main cable stiffness, and larger preload result in more obvious elastic interaction of the bolts.
(2)
The average preload loss was reduced by approximately 27% when the elastic modulus was increased by approximately 110%. The elastic interaction of the bolt decreases as the elastic modulus of the main cable increases. In the design of cable clamps, the elastic modulus of the main cable should be increased appropriately.
(3)
The average preload loss was reduced by approximately 45% when the bolt center distance was increased by 75%. The elastic interaction of the bolts decreases as the bolt center distance increases. In the design of the cable clamp, the center distance of the bolt should be increased appropriately.
(4)
The number of bolts affects the elastic interaction to a minor degree. In actual engineering, the influence of the number of bolts on the elastic interaction can be ignored.
(5)
When the bolt installation preload was increased by 133%, the average preload loss was reduced by approximately 125%, which was almost a linear relationship. When the installation preload increases, the elastic interaction becomes more obvious. In the process of bolt tightening, the installation preload should be selected moderately to ensure that the bolt preload reaches a standard and uniform distribution.
(6)
Among the four fastening sequences researched, the sequence of tightening from the center as in case 3 produces the most obvious elastic interactions. Therefore, when tightening the bolts, try to avoid tightening from the center bolt first.

Author Contributions

Conceptualization, F.M.; methodology, Y.Z. (Yongjun Zhou); software, B.W.; validation, F.M., Y.Z. (Yongjun Zhou) and Z.L.; formal analysis, F.M.; investigation, B.W.; resources, Y.Z. (Yu Zhao); data curation, F.M.; writing—original draft preparation, F.M. and Y.Z. (Yongjun Zhou); writing—review and editing, F.M., Y.Z. (Yongjun Zhou) and B.W.; visualization, F.M. and Y.J.; supervision, Y.Z. (Yongjun Zhou) and Y.J.; project administration, Y.Z. (Yu Zhao); funding acquisition, Y.Z. (Yongjun Zhou) and Y.J. All authors have read and agreed to the published version of the manuscript.

Funding

This research was funded by National Key R&D Plan of China (2021YFB1600300) and Guangxi Department of Science and Technology Key R&D Plan (AB23026125).

Institutional Review Board Statement

Not applicable.

Informed Consent Statement

Not applicable.

Data Availability Statement

The data presented in this study are available from the first and corresponding author upon request. The data are not publicly available due to the policy of the data provider.

Conflicts of Interest

The authors declare no conflicts of interest.

References

  1. Bibel, G.D. Experimental and analytical study of elastic interaction in a pipe flange. In Proceedings of the International Conference on Pressure Vessel Technology, Dusseldorf, Germany, 21–25 September 1992. [Google Scholar]
  2. Bibel, G.D.; Ezell, R.M. An improved flange bolt-up procedure using experimentally determined elastic interaction coefficients. J. Press. Vessel Technol. 1992, 439, 443. [Google Scholar] [CrossRef]
  3. Li, Y.; Liu, Z.; Wang, Y.; Cai, L.; Xu, W. Research on preload of bolted joints tightening sequence-related relaxation considering elastic interaction between bolts. J. Constr. Steel Res. 2019, 160, 45–53. [Google Scholar] [CrossRef]
  4. Alkelani, A.A.; Nassar, S.A.; Housari, B.A. Formulation of elastic interaction between Boltsduring the tightening of flatface gasketed joints. J. Mech. Des. 2009, 131, 021004. [Google Scholar] [CrossRef]
  5. Nassar, S.A.; Yang, X. Novel formulation of bolt elastic interaction in gasketed joints. J. Press. Vessel Technol. 2009, 131, 051204. [Google Scholar] [CrossRef]
  6. Zuo, W.; Liu, Z.; Zhao, Y.; Niu, N.; Zheng, M. Research on the tightening strategy of bolted flange for contact stiffness of joint surface. Struct. Eng. Mech. 2022, 83, 341. [Google Scholar]
  7. Jiang, K.; Liu, Z.; Yang, C.; Zhang, C.; Tian, Y.; Zhang, T. Effects of the joint surface considering asperity interaction on the bolted joint performance in the bolt tightening process. Tribol. Int. 2022, 167, 107408. [Google Scholar] [CrossRef]
  8. Liu, Z.; Chen, W.; Yan, X.; Zheng, M.; Li, M.; Li, Y. Research on movement of dimensional singularities without elastic interaction in gasketed joints. Structures 2024, 61, 106088. [Google Scholar] [CrossRef]
  9. Takaki, T.; Fukuoka, T. Effective bolting up procedure using finite element analysis and elastic interaction coefficient method. In Proceedings of the ASME Pressure Vessels and Piping Conference, San Diego, CA, USA, 25–29 July 2004; Volume 46733, pp. 155–162. [Google Scholar]
  10. Bouzid, A.H.; Galai, H. A new approach to model bolted flange joints with full face gaskets. J. Press. Vessel Technol. 2011, 133, 021203. [Google Scholar] [CrossRef]
  11. Yuan, S.; Zhang, Y.; Fan, Y.; Zhang, Y. A method to achieve uniform clamp force in a bolted rotor with curvic couplings. Proc. Inst. Mech. Eng. Part E J. Process Mech. Eng. 2016, 230, 335–344. [Google Scholar] [CrossRef]
  12. Zhu, L.; Bouzid, A.H.; Hong, J. Numerical and experimental study of elastic interact-ion in bolted flange joints. J. Press. Vessel. Technol. 2017, 139, 021211. [Google Scholar] [CrossRef]
  13. Zhu, L.; Bouzid, A.H.; Hong, J.; Zhang, Z. Elastic interaction in bolted flange joints: An analytical model to predict and optimize bolt load. J. Press. Vessel Technol. 2018, 140, 041202. [Google Scholar] [CrossRef]
  14. Zhu, L.; Bouzid, A.H.; Hong, J. Analytical evaluation of elastic interaction in bolted flange joints. Int. J. Press. Vessel Pip. 2018, 165, 176–184. [Google Scholar] [CrossRef]
  15. Abasolo, M.; Aguirrebeitia, J.; Avilés, R.; Fernández de Bustos, I. A tetraparametric metamodel for the analysis and design of bolting sequences for wind generator flanges. J. Press. Vessel Technol. 2011, 133, 041202. [Google Scholar] [CrossRef]
  16. Abasolo, M.; Aguirrebeitia, J.; Avilés, R.; Fernández de Bustos, I. Methodology for the optimization of bolting sequences for wind generator flanges. J. Press. Vessel Technol. 2014, 136, 061202. [Google Scholar] [CrossRef]
  17. Wang, Y.Q.; Wu, J.K.; Liu, H.B.; Kuang, K.; Cui, X.W.; Han, L.S. Analysis of elastic interaction stiffness and its effect on bolt preloading. Int. J. Mech. Sci. 2017, 130, 307–314. [Google Scholar] [CrossRef]
  18. Coria, I.; Abasolo, M.; Olaskoaga, I.; Etxezarreta, A.; Aguirrebeitia, J. A new methodology for the optimization of bolt tightening sequences for ring type joints. Ocean. Eng. 2017, 129, 441–450. [Google Scholar] [CrossRef]
  19. Coria, I.; Abasolo, M.; Aguirrebeitia, J.; Fernández de Bustos, I. Generalization of the tetraparametric as-sembly method for the optimization of bolt tightening sequences in ring-type joints. Proc. Inst. Mech. Eng. Part E J. Process Mech. Eng. 2019, 233, 991–1000. [Google Scholar] [CrossRef]
  20. Huang, H.; Wang, Y.; Wei, T.; Yao, J.; Xue, W. Study of preload relaxation and optimization of wind turbine bolted connections based on the improved elastic interaction coefficient method. Proc. Inst. Mech. Eng. Part B J. Eng. Manuf. 2023, 237, 1194–1206. [Google Scholar] [CrossRef]
  21. Ding, G.; Feng, P.; Wang, Y.; Ai, P.; Wang, Q. Long-term bolt preload relaxation and contact pressure distribution in clam** anchorages for CFRP plates. Compos. Struct. 2024, 329, 117780. [Google Scholar] [CrossRef]
  22. Nassar, S.A.; Alkelani, A.A. Effect of tightening speed on clamp load distribution in gasketed joints. SAE Trans. 2006, 115, 811–825. [Google Scholar]
  23. Alkelani, A.A.; Nassar, S.A.; Housari, B.A. A novel formulation of elastic interaction in gasketed bolted joints. In Proceedings of the ASME Pressure Vessels and Piping Conference, San Antonio, TX, USA, 22–26 July 2007; Volume 42800, pp. 139–150. [Google Scholar]
  24. Pan, W.; Li, X.; Sun, L.; Song, H.; Wang, M. General prediction model of residual pretightening force of bolt group with one-step and multi-step pretightening and analysis of influencing factors from the perspective of elastic interaction. Eng. Comput. 2023, 40, 921–956. [Google Scholar] [CrossRef]
  25. Bouzid, A.H.; Nechache, A. An analytical solution for evaluating gasket stress chan-ge in bolted flange connections subjected to high temperature loading. J. Press. Vessel Technol.-Trans. Asme 2005, 127, 414–422. [Google Scholar] [CrossRef]
  26. Abid, M.; Hussain, S. Relaxation behaviour of gasketed joints during assembly using finite element analysis. Sadhana 2010, 35, 31–43. [Google Scholar] [CrossRef]
  27. Abid, M.; Khan, Y.M. The effect of bolt tightening methods and sequence on the performance of gasketed bolted flange joint assembly. Struct. Eng. Mech. 2013, 46, 843–852. [Google Scholar] [CrossRef]
  28. Wang, Y.; Liu, Y.; Wang, J.; Ma, L.; Cao, R.; Xu, Z. Optimization of aerospace engine bolt tightening based on Kriging model. Proc. Inst. Mech. Eng. Part C J. Mech. Eng. Sci. 2024. [Google Scholar] [CrossRef]
  29. Liu, S.; Chu, J.; Wang, Y. Research on Prediction Method of Bolt Tightening for Aviation Components Based on Neural Network. Appl. Sci. 2023, 13, 6771. [Google Scholar] [CrossRef]
  30. Wang, Y.Q.; Wu, J.K.; Liu, H.B.; Xu, S.T. Modeling and numerical analysis of multi-bolt elastic interaction with bolt stress relaxation. Proc. Inst. Mech. Eng. Part C J. Mech. Eng. Sci. 2016, 230, 2579–2587. [Google Scholar] [CrossRef]
  31. He, K. Research on Main Cable Stress under Long Cable Clamps and Cable Clamp Anti-Sliding Bearing Capacity of Railway Suspension Bridges; Southwest Jiaotong University: Chengdu, China, 2017. (In Chinese) [Google Scholar]
  32. Yang, X.Y.; Yi, J.J.; Jing, G.Q.; Lu, X.W. Research on group tensioning technology of cable clamp screws for suspension bridges. World Bridges 2021, 49, 46–50. (In Chinese) [Google Scholar]
  33. Miao, R.; Shen, R.; Tang, F.; Chen, W.; Que, M. Nonlinear interaction effect on main cable clamp bolts tightening in suspension bridge. J. Constr. Steel Res. 2021, 182, 106663. [Google Scholar] [CrossRef]
Figure 1. Simplified theoretical model.
Jmse 12 01531 g001
Figure 2. Full-scale experiment device.
Jmse 12 01531 g002
Figure 3. Tightening sequence of the bolts.
Jmse 12 01531 g003
Figure 4. Data measurement of the gap width.
Jmse 12 01531 g004
Figure 5. The constitutive relation of MELAS.
Jmse 12 01531 g005
Figure 6. FE model of cable clamp.
Jmse 12 01531 g006
Figure 7. Main cable material verification.
Jmse 12 01531 g007
Figure 8. Overall model verification: (a) First round of tightening; (b) Second round of tightening.
Jmse 12 01531 g008
Figure 9. Tightening sequence of FEM.
Jmse 12 01531 g009
Figure 10. Bolt preload values of different elastic modulus values.
Jmse 12 01531 g010
Figure 11. Average and standard deviation of the bolt preload values of different elastic modulus values.
Jmse 12 01531 g011
Figure 12. Four cases of different bolt center distances: (a) 180 mm; (b) 225 mm; (c) 270 mm; (d) 315 mm.
Jmse 12 01531 g012
Figure 13. Bolt preload at different center distances.
Jmse 12 01531 g013
Figure 14. Average and standard deviation of the bolt preload at different center distances.
Jmse 12 01531 g014
Figure 15. Four cases of different numbers of bolts: (a) 8 bolts; (b) 10 bolts; (c) 12 bolts; (d) 14 bolts.
Jmse 12 01531 g015
Figure 16. Bolt preload of different numbers of bolts.
Jmse 12 01531 g016
Figure 17. Average and standard deviation of the bolt preload of different numbers of bolts.
Jmse 12 01531 g017
Figure 18. Bolt preload for different bolt installation preload values.
Jmse 12 01531 g018
Figure 19. Average and standard deviation of the bolt preload for different bolt installation preload values.
Jmse 12 01531 g019
Figure 20. The tightening sequence for the four cases: (a) Case 1; (b) Case 2; (c) Case 3; (d) Case 4.
Jmse 12 01531 g020
Figure 21. Bolt preload for different tightening sequences.
Jmse 12 01531 g021
Figure 22. Average and standard deviation of the bolt preload for different tightening sequences.
Jmse 12 01531 g022
Table 1. The preload and gap widths collected after the completion of each round of tightening.
Tightening RoundL1 Preload (kN)L2 Preload (kN)L3 Preload (kN)L4 Preload (kN)R1 Preload (kN)R2 Preload (kN)R3 Preload (kN)R4 Preload (kN)Gap Width (mm)
Round 1663.8481.7502.4638.9594.3518.5501.8608.841.7
Round 2 651.2587.4593.5641.3594.2589.6598.7632.541.5
Table 2. The preload of different elastic modulus values.
Elastic Modulus (MPa)L1 (kN)L2 (kN)L3 (kN)L4 (kN)Average (kN)Standard Deviation (kN)
1.1 × 103326.2157.5141.3352.5244.495.5
1.4 × 103316.8181.7166.5352.5254.481.5
1.7 × 103312.1199.6184.7352.5262.171.7
2.0 × 103310.2212.4199.4352.5268.664.5
2.3 × 103308.4222.1211.5352.5273.658.9
Table 3. The preload of different bolt center distances.
Center Distances (mm)L1 (kN)L2 (kN)L3 (kN)L4 (kN)Average (kN)Standard Deviation (kN)
180233.8138137.4352.5215.488.3
225268.4187.6184.5352.5248.369.0
270291.5216207.8352.5267.059.2
315308.3228.3218.1352.5276.855.9
Table 4. The preload values for different numbers of bolts.
Numbers of Bolts L1 (kN)L2 (kN)L3 (kN)L4 (kN)L5 (kN)L6 (kN)L7 (kN)Average (kN)Standard Deviation (kN)
8308.3228.3218.1352.5276.855.9
10309.8229.4221.6223.6352.5267.453.9
12311.4241.9229.9224.3229.6352.5264.949.1
14316.8231.2220218.2211.1216.6352.5252.353.2
Table 5. The preload values for different bolt installation preload values.
Preload of Bolt Installation (kN)L1 (kN)L2 (kN)L3 (kN)L4 (kN)Average (kN)Standard Deviation (kN)
211.5162.1144.2134.7211.5163.126.5
282.0233.6186.8176.6282.0219.837.5
352.5308.3228.3218.1352.5276.850.0
423.0377.2268.8258.0423.0331.862.9
493.5438.4308.4298.2493.5384.674.9
Table 6. The preload of different tightening sequences.
Tightening SequenceL1 (kN)L2 (kN)L3 (kN)L4 (kN)R1 (kN)R2 (kN)R3 (kN)R4 (kN)Average (kN)Standard Deviation (kN)
Case 1308.3228.3218.1352.5308.3228.3218.1352.5276.852.7
Case 2295.5279.15249.25352.5352.5249.335279.135295.31294.137.6
Case 3385.9177.0241.975352.5352.5242.31177.41385.71289.483.8
Case 4297.15303.4352.5264.64264.79352.5303.34297.2304.431.4
Disclaimer/Publisher’s Note: The statements, opinions and data contained in all publications are solely those of the individual author(s) and contributor(s) and not of MDPI and/or the editor(s). MDPI and/or the editor(s) disclaim responsibility for any injury to people or property resulting from any ideas, methods, instructions or products referred to in the content.

