Article

The Blockage Effect on Resistance Coefficients Estimation for AUVs with Different Configurations in the Towing Tank

by
Pengcheng Ye
1,2,
Hao Zhang
1,2,
Yao Shi
1,2,
Qiaogao Huang
1,2,
Guang Pan
1,2 and
Denghui Qin
1,2,*
1
School of Marine Science and Technology, Northwestern Polytechnical University, Xi’an 710072, China
2
Key Laboratory for Unmanned Underwater Vehicle, Northwestern Polytechnical University, Xi’an 710072, China
*
Author to whom correspondence should be addressed.
J. Mar. Sci. Eng. 2024, 12(9), 1532; https://doi.org/10.3390/jmse12091532
Submission received: 6 August 2024 / Revised: 27 August 2024 / Accepted: 2 September 2024 / Published: 3 September 2024
(This article belongs to the Section Ocean Engineering)

Abstract

:
When a resistance test of an underwater vehicle model is conducted in a towing tank, the blockage effect will inevitably occur, particularly since the experimental model is relatively large. This paper investigates the estimation of resistance coefficients for an Axisymmetrical Rotary Body Underwater Vehicle (ARBUV) and a Blended Wing Body Underwater Vehicle (BWBUV). The Computational Fluid Dynamics (CFD) method is employed to predict the resistance of Autonomous Underwater Vehicles (AUVs). In order to quantify the blockage effect on the resistance coefficients of AUVs with different configurations, the resistance coefficients of AUVs are calculated in the infinite domain and finite domain under various blockage ratios. Through analysis of the resistance results, velocity distribution, and pressure distribution, the action law of the blockage effect is provided. It indicates that blockage effects have a greater influence on the pressure resistance for ARBUV. Surprisingly, the resistance coefficients of BWBUV are less affected, though it is closer to the sidewalls. It suggests that the blockage ratio of ARBUV and BWBUV should be separately smaller than 0.375% and 2.5% in the towing tank test. The towing tank experiments satisfy the blocking ratio with a Reynolds number greater than 107, which saturates the blocking effect and further reduces the effect on the drag coefficient.

1. Introduction

The autonomous underwater vehicle is an unmanned and intelligent electromechanical system to carry out different equipment for different types of missions in the complex marine environment [1]. Since the 1970s, when early AUVs were developed at MIT, researchers have faced a number of challenges in developing robots capable of traveling autonomously in deep water [2,3,4]. Thereinto, the CFD method has been rapidly developed and used for the performance analysis of AUVs design due to the high cost of experimental measurements. Liu et al. [5] employ CFD simulations to investigate the hydrodynamic properties of a supercavitating vehicle at different angles of attack. Ji et al. [6] demonstrate a unique CFD simulation for calculating hydrodynamic coefficients in a quadrotor AUV. The mathematical link between propeller speed and thrust is calculated. Dantas and Barros [7] use the CFD approach to examine the hydrodynamic efforts created by an AUV while taking into account the combined effects of control surface deflection and angle of attack. The flow simulations reveal that the incidence of control surface stall is depending on a linear connection between angle of attack and control surface deflection. Luo et al. [8] use a CFD technique to assess the hydrodynamic interaction between the AUV and the submarine throughout the recovery phase. The findings indicate that the submarine has a considerable impact on the AUV during the recovery process, with sailing speed and relative locations identified as critical factors.
In recent decades, a number of numerical studies have investigated the effect of the near wall on fluid characteristics. At present, increased numbers of researchers are studying the blockage effect in wind. Kornilov and Popkov [9] discover a considerable blockage impact of the wind tunnel test section with limited dimensions by the airfoil on the flow character and aerodynamic parameters of the airfoil, despite a blockage ratio of just 5.7%. Zaghi et al. [10] present the efficient CFD approach for assessing the blockage effects in wind tunnel simulations. The turbine’s aerodynamic performances are examined and compared to existing experimental data. Eltayesh et al. [11] investigate the impact of wind tunnel obstruction on the performance of a horizontal axis wind turbine at varying tip speed ratios and input free stream speeds. It depicts how the wind tunnel walls impact the flow in a similar way to a shield for a wind turbine rotor, increasing the power coefficient. The blockage effect in a towing tank is clearly analogous to the concepts applied in a wind tunnel. The towing tank cannot replicate the ideal flow conditions of an infinite domain due to the constraints imposed by the tank walls [12]. In this case, the tank wall effect on the ship model tests has been drawing attention. Jachowski [13] provides a wide analysis into the modeling of the tank wall effects on ship motion using CFD. Kumar and Subramanian [14] quantify the influence of tank walls on ship model resistance estimates. The flow around a ship model has been numerically modeled, and the resistance coefficients have been estimated for different tank width conditions. The numerical results show that the influence of towing tank walls is not negligible when the ratio of tank width to model is less than five. Zhang et al. [15] propose mathematical models of the hydrodynamic pressure field generated by a moving ship in a limited tank. It discovers that the obstruction effect of tank walls may be ignored when the width of the rectangular wall is three times more than the ship’s length. Guo et al. [16] use CFD techniques and ship resistance experiments to determine the mechanism and adjustment strategy for the blockage effect in a specific ship. The blockage effect grows as the blockage ratio increases. It suggests that the blockage ratio of the ship model should be smaller than 1.5%.
With the large-scale and high-speed development of AUVs, model sizes and test velocities have expanded in tandem. The blockage effect has become an increasingly important element [17]. Therefore, it is of practical value to investigate its effect on hydrodynamic coefficient calculation for AUVs. However, compared to ship model experiments, there have been few simulation-based investigations of the blockage effect on AUVs in a towing tank. Li et al. [18] undertake research to evaluate the effect of blockage on the hydrodynamic performance of AUVs during tank testing. The numerical results reveal that as the size of the AUV models is reduced, the hydrodynamic coefficients remain steady. Huang et al. [19] employ tank non-dimensional width characteristics to measure the correlation between tank width and AUV models’ hydrodynamic coefficients. The researchers find that the predicted hydrodynamic coefficients are higher than the actual values for AUV model testing in a narrow tank. Da Silva et al. [20] explore the influence of the distance to the wall on the AUV’s resistance coefficient and propose modifications to account for flow obstruction. The proposed correlations can properly calculate the pressure resistance coefficient for open water values. The aforementioned research focuses more on the ARBUV models. In practice, AUVs with different configurations are applied to address different mission scenarios [21,22,23]. Blended wing body underwater vehicles have also been extensively studied as representatives of long range, low noise, and high lift-to-drag ratios [24]. Tian et al. [25] investigate the navigational efficiency of underwater gliders and model the energy consumption for a given net buoyancy and glide speed, respectively. The results show that navigation efficiency is positively correlated with the lift-to-drag ratio for a given net buoyancy. However, the optimum lift-to-drag ratio is only found at speeds above the minimum allowable speed. For a given speed, the lift-to-drag ratio is not as high as possible. The optimum lift-to-drag ratio is constant, and navigation efficiency is only related to the shape of the glider. In order to improve the accuracy of resistance coefficients of AUVs, this work investigates the blockage effect on the resistance coefficients of ARBUV and BWBUV. In this paper, the hydrodynamic characteristics of AUV models are simulated with the CFD method, and the simulation results are validated experimentally. Then, the blockage effects on resistance coefficients for ARBUV and BWBUV are estimated with different blockage ratios in relation to the towing tank wall. The influence of the blockage effect on the formation mechanism of the hydrodynamic forces and the hydrodynamic characteristics of the AUV models are systematically analyzed. The conclusions may be useful for correcting towing tank test results influenced by the blockage effect.
The remainder of the paper is organized as follows: Section 2 introduces the test models, numerical method, calculation domain, and grid independence. The numerical method’s correctness is confirmed by comparing the CFD findings to experimental experiments in Section 3. Section 4 presents the blockage effect on the resistance coefficients for AUVs with two representative configurations. Section 5 draws the conclusion.

2. Materials and Methods

When calculating AUVs resistance under experimental or numerical settings, the presence of an item that narrows the wall borders and obstructs the flow results in a blockage effect. The blockage effect causes streamline disruption and the formation of high-velocity areas. It can be determined with blockage ratio (BR), which is the ratio of the largest cross-sectional area of the AUV model to the calculation domain [26].
B R = W a × H a W c × H c ,
where Wa, Ha, Wc, and Hc, respectively indicate the width and height of the AUV and calculation domain. The numerical study on blockage effect for ARBUV and BWBUV is carried out in this paper.

2.1. AUV Models

The used geometric models and their key parameters are separately shown in Table 1 and Figure 1 and Figure 2. The adopted coordinate system has its origin at the head, and the test models move in an opposite direction to the x axis.

2.2. Numerical Method

The incompressible Reynolds Averaged Navier–Stokes (RANS) equations are used to solve the simulation calculations in this paper.
u i ¯ x i = 0 ,
u i ¯ t + u j ¯ u i ¯ x j = f ¯ i 1 ρ p ¯ x i + x j ( ν u i ¯ x j u i u j ¯ ) ,
where ρ is the density of the fluid, t indicates time, u i ¯ represents the time-averaged velocity component in the direction of the Cartesian coordinate system (i = 1, 2, 3), u i is the turbulent pulsating velocity component, f ¯ i is the external volumetric force, p ¯ is the time-averaged pressure, ν is the kinematic viscosity, and ρ u i u j ¯ means the Reynolds stress tensor. The realizable k-ε model is selected for flow simulations due to its wide application range, low cost, and reasonable accuracy [5]. It assumes that the flow field is completely turbulent and the molecules viscosity is negligible. The transport equations of the realizable k-ε model are formulated as
t ρ k + x j ρ k u j = x j μ + μ t σ k k x j + G k + G b ρ ε Y M + S k ,
t ρ ε + x j ρ ε u j = x j μ + μ t σ ε ε x j + ρ C 1 S ε ρ C 2 ε 2 k + ν ε + C 1 ε C 3 ε G b ε k + S ε ,
where Gk is the turbulent kinetic energy generated by the average velocity gradient, Gb represents the turbulent kinetic energy created by buoyancy, YM indicates the effect of turbulence pulsation on the total dissipation rate, C1ε, C3ε, C1, and C2 are empirical constants, σk and σε mean the Prandtl coefficient corresponding to turbulent kinetic energy and turbulence dissipation rate, and Sk and Sε represent the custom source items.
The CFD program STAR-CCM+ (version 16.02.009-R8) is employed to discretize the RANS equation with a second-order upwind scheme, and the solution is obtained using a coupled method. The time step is set to 0.005 s. It is determined by the Courant number and grid size. In fact, a large time step leads to computational dispersion, while a small-time step increases computational resource. The smallest residuals for the continuity equation and momentum equation are both less than 10−4.

2.3. Calculation Domain and Boundary Conditions

As the blockage effect exists, the calculation domain and boundary conditions differ between the infinite and finite domains. The calculation domain is a cuboid, and the solid body is a full-scale AUV model, which is positioned at the center of the cross-section. Additionally, a no-slip boundary requirement is enforced on the hull. Figure 3 depicts the calculating domain’s border conditions and sizes. In the infinite domain, the inlet, side, top, and bottom are all set as velocity inlets, while the exit is set to zero relative pressure. The infinite domain size is defined as 6Lc × 5Lc × 5Lc, referring to the literature [27,28]. In the finite domain, the difference is that the side is specified as the no-slip wall. The finite domain size is defined as 6Lc × Wb × Ht, where Wb represents the various widths of the calculation domain for assessing the various blockage ratios. The parameter Ht indicates the height of the calculation domain that is the same as the towing tank (170 m × 7 m × 6 m) at Northwestern Polytechnical University (NWPU), whereas the maximum velocity is 7 m/s. The front inlet and back outlet of the domain are separately placed at the distances 1.5Lc and 4.5Lc from the head, where the origin of the coordinate system is located.

2.4. Grid Independence

The iterative solution of discrete grids will result in discrete inaccuracies during numerical simulations [29]. Theoretically, a fine grid results in a smaller error and a lower sensitivity. An essential investigation is conducted to verify the grid independence. Table 2 provides five sets of grid numbers and the corresponding AUVs resistance values at a flow rate of 7 m/s. It can be observed that the resistance values of ARBUV fundamentally keep stability as the number of grid elements increases from 8.02 million to 12.32 million. It demonstrates that further reduction in the local mesh size has no effect on the computational conclusions. Similarly, the deviation of resistance values for BWBUV is quite small while the number of grids reaches 13.63 million. Therefore, 8.02 and 13.63 million grids are, respectively, used for ARBUV and BWBUV to ensure balanced accuracy and efficiency. The grid partitions of the ARBUV and BWBUV models are shown in Figure 4. In order to achieve the reasonable boundary layer, the y+ value range is controlled from 0 to 30 in this study [30].

3. Validation of Numerical Method

To validate the accuracy and reliability of the numerical method, the calculation results of ARBUV at flow velocities of 1–5 m/s are obtained. The resistance experiments of ARBUV (shown in Figure 5) at this velocity range are performed in the NWPU towing tank to test the validation of the numerical method. As seen in Table 3, the simulation resistance results are mostly compatible with the experimental data. In fact, the maximum relative error between the numerical and experimental results is less than 5%. In the field of AUV hydrodynamic prediction, the level of numerical prediction accuracy is sufficient to meet the requisite standards. Therefore, the numerical method used in this paper is valid and well estimates the actual resistance solutions with superior accuracy.

4. Results and Discussion

In order to analyze the blockage effect on resistance coefficients, different blockage ratios are chosen for estimating the resistance coefficients, as shown in Table 4. Tian and Ma et al. [31,32] indicate that the impact is deemed to be inconsequential when the AUV is maintained at a specified distance from the water surface and the bottom of the towing tank. Consequently, the variable influencing the blockage ratio is the width of the towing tank when the towing tank depth is adequate for AUVs. Nevertheless, numerous scholars have employed the concept of blockage ratio for the impact modification study of the blockage effect. The proposed blockage ratio can also serve as a foundation for subsequent correction studies. Based on the width calculated by the blockage ratio and the actual height of the towing tank, various computational domains for ARBUV and BWBUV models are established. The velocity range 1–7 m/s is selected for the infinite domain and the actual width of the towing tank. Additionally, the velocity of 7 m/s is both employed for other blockage ratios.

4.1. Resistance Component Analysis

The total resistance coefficient (CT) of AUV models is divided into the frictional resistance coefficient (CF) and pressure resistance coefficient (CP) [33]. They are defined as follows:
C T = R T 1 2 ρ V 2 S a ,   C F = R F 1 2 ρ V 2 S a ,   C P = R P 1 2 ρ V 2 S a ,
where RT, RF, and RP represent the total resistance, friction resistance, and pressure resistance, respectively. The symbol ρ means the water density, V indicates the sailing velocity, and Sa denotes the wetted surface area of the AUV hull.
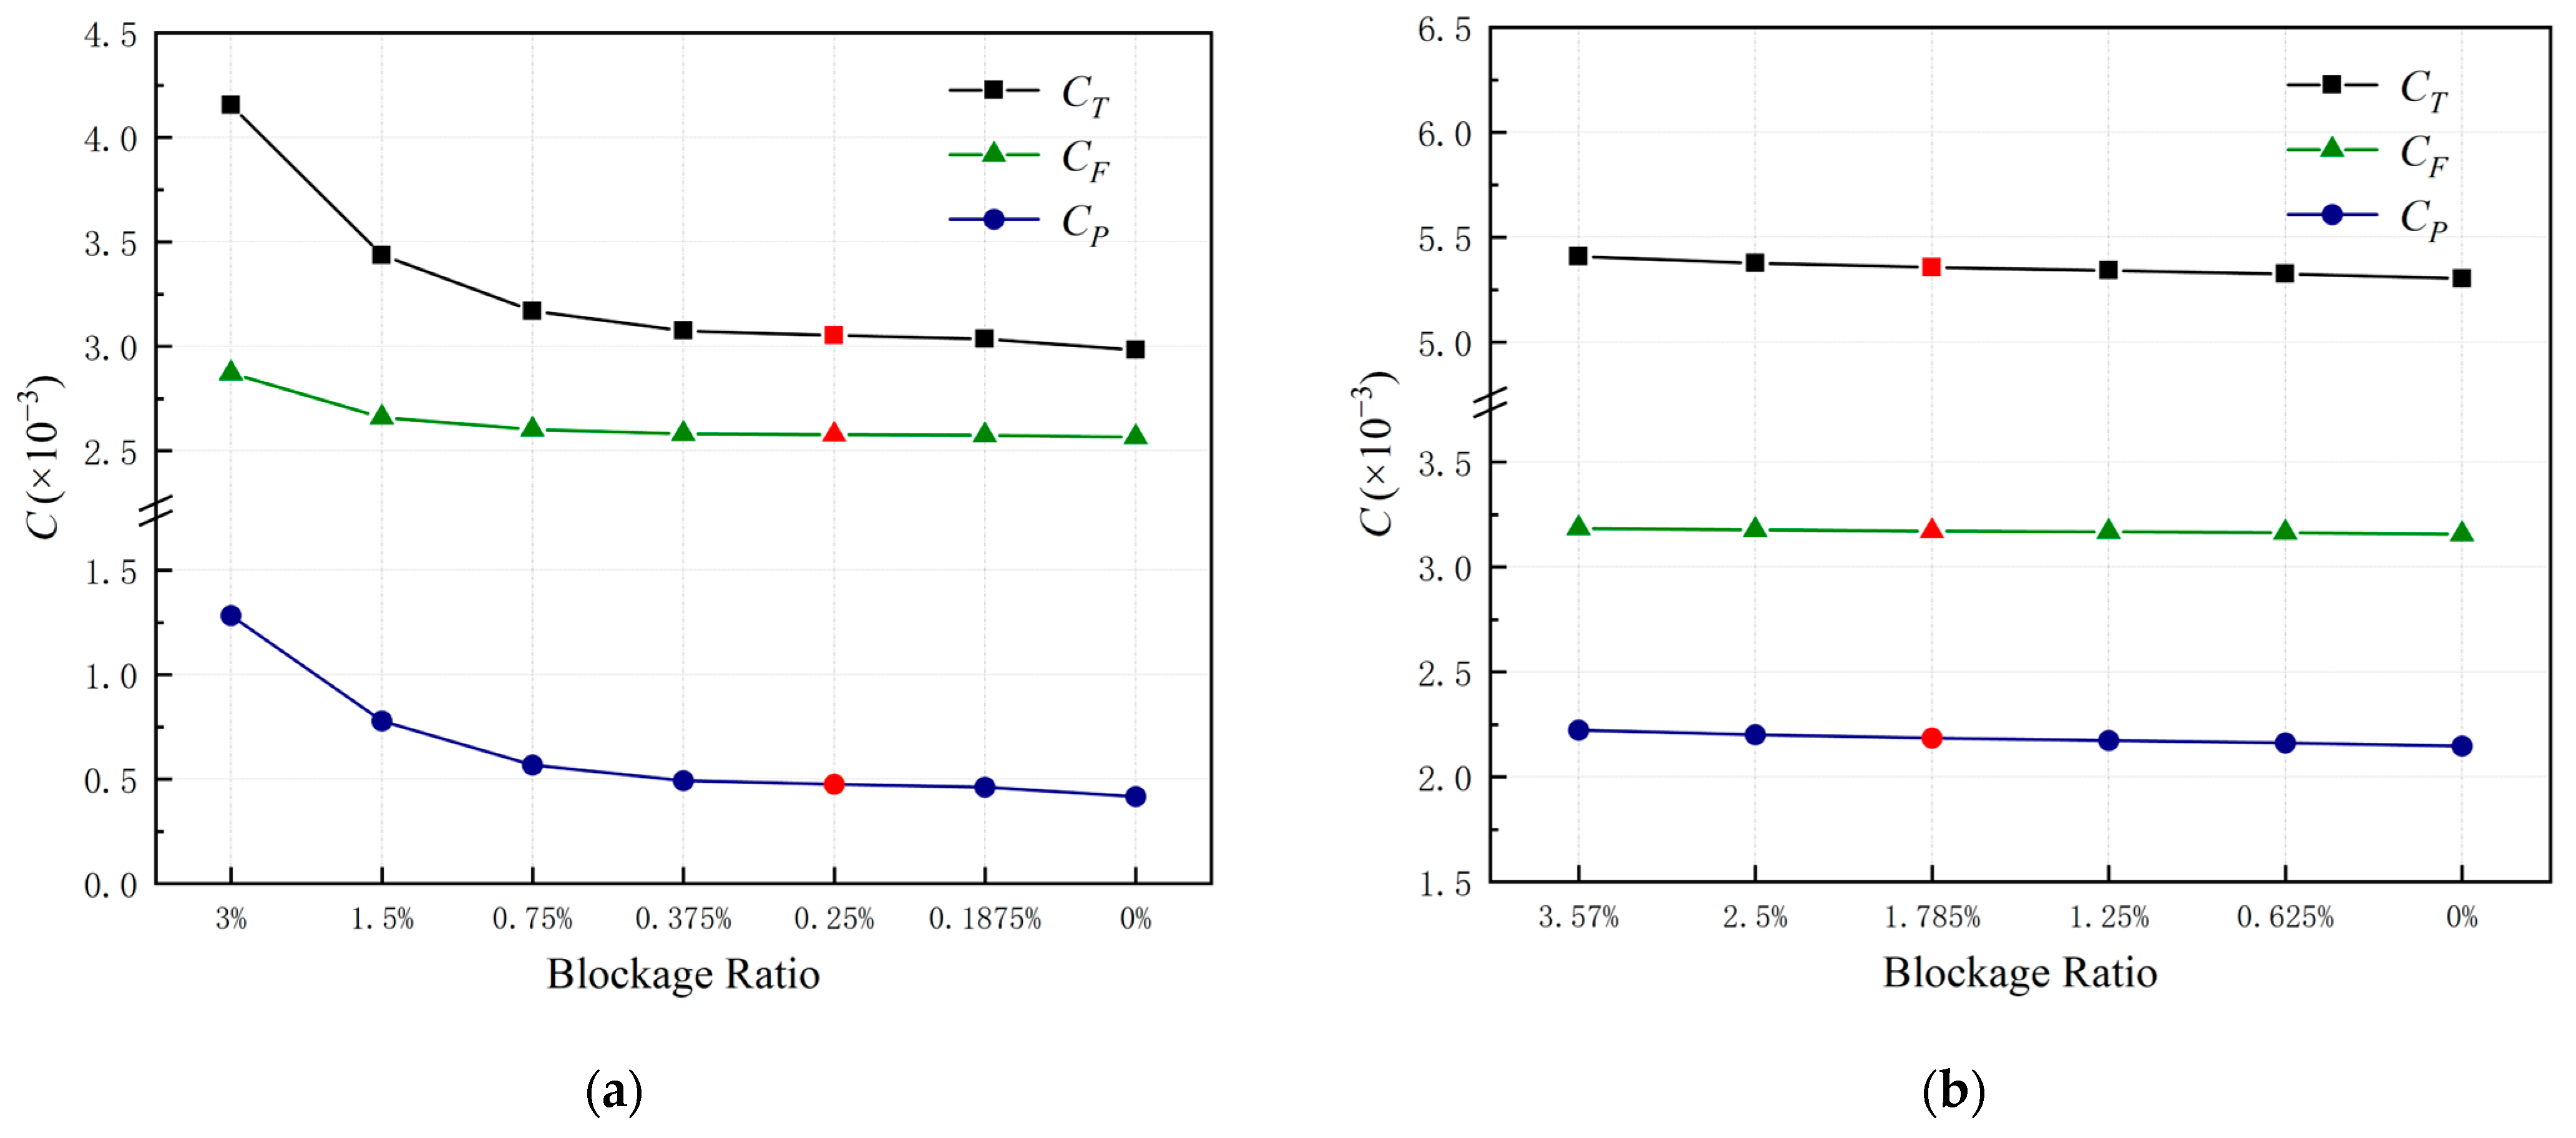
The calculated results, including the CT, CF, and CP under different blockage ratios for ARBUV and BWBUV at a speed of 7 m/s, are shown in Figure 6. The red dots indicate that the used computational domain size is the same as the actual towing tank. As seen in Figure 6, a significant reduction in frictional resistance coefficient and pressure resistance coefficient for ARBUV occurs when the blockage ratio BR is reduced from 3% to 0.375%. And the resistance coefficients CT, CF, and CP below a smaller blockage ratio BR 0.375% are essentially consistent with the infinite domain. In practice, the difference in the total resistance coefficient between the infinite domain and BR = 0.25% is only 2.37%. It demonstrates that the blockage effect on resistance coefficients for the ARBUV in the NWPU towing tank can be ignored. Unlike ARBUV, the resistance coefficients CT, CF, CP of BWBUV all have a little change as the blockage ratio varies. Moreover, the resistance coefficients of BWBUV are less affected, even though it is closer to the computational domain side compared to the ARBUV.
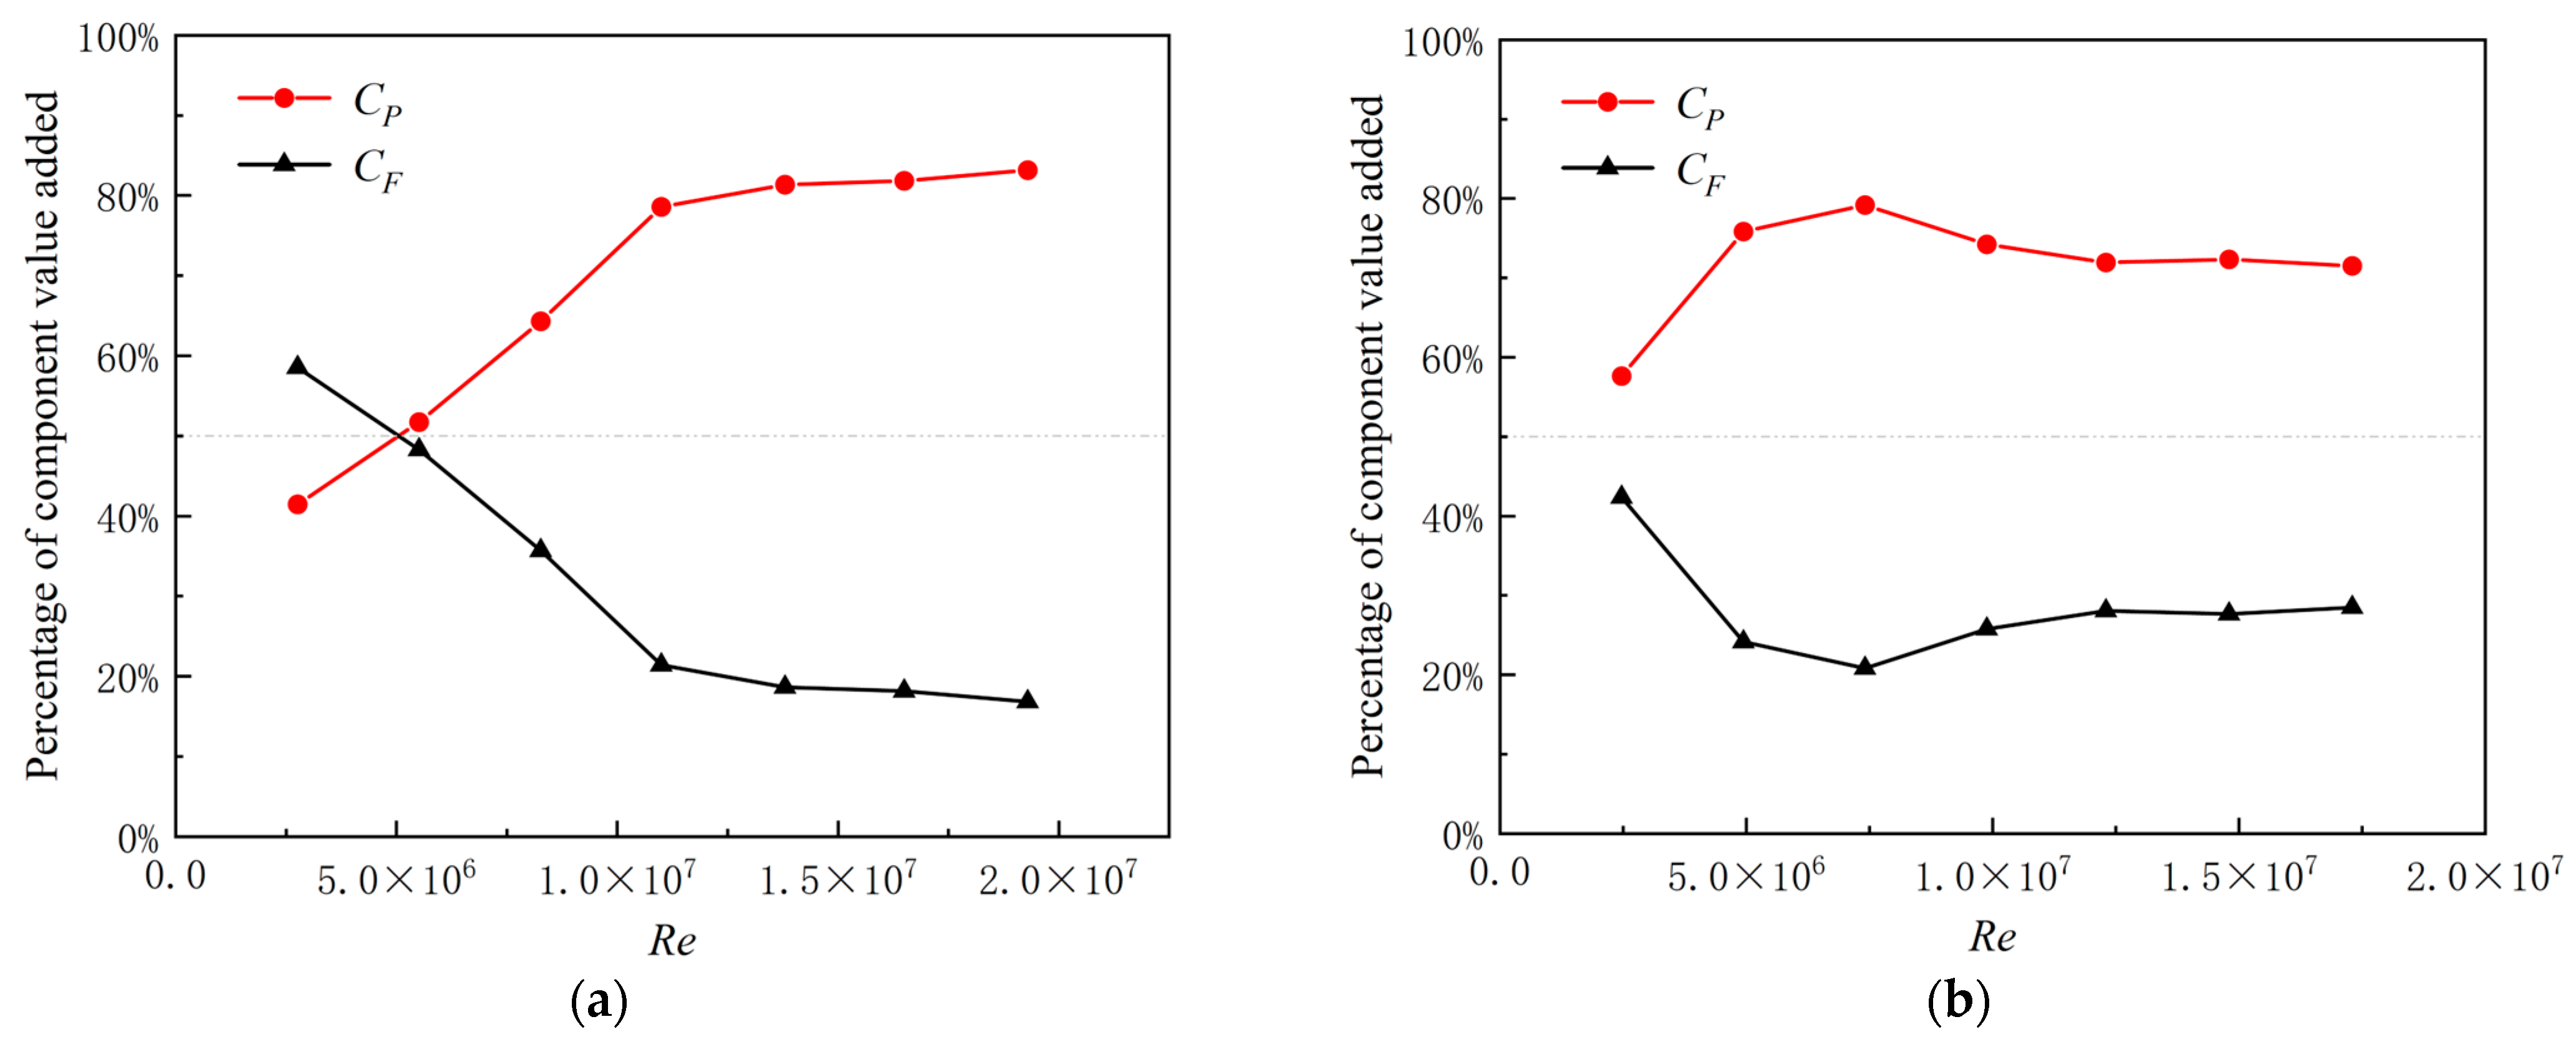
Table 5 presents the resistance coefficients of ARBUV with various Reynolds numbers in the infinite domain and finite domain whose size is equal to the NWPU towing tank. The contribution of frictional resistance to the total resistance is greater than 84%. The total resistance coefficients of a finite domain are mainly larger than those of an infinite domain. The improvement in percentage of CT is 5.40% for Re = 2.76 × 10⁶. Additionally, it is 2.37% for Re = 1.93 × 10⁶. On one hand, it proves the blockage effect on resistance coefficients. On the other hand, the blockage effect on resistance coefficients weakens while the Reynolds number increases. To further analyze the variation in each resistance component, the proportion of the increase in frictional resistance and pressure resistance to that of total resistance is given in Table 5. Moreover, the results are displayed using line charts in Figure 7a. It is noted that the pressure resistance dominates the increase in total resistance among various Re.
The resistance coefficients of BWBUV with various Re are provided in Table 6. The largest increase in percentage of CT is 1.32% for Re = 7.41 × 10⁶. That is, the blockage effect is smaller compared to the ARBUV in the NWPU towing tank. The proportion of the increase in resistance component for BWBUV is shown in Figure 7b. Most of the increase in total resistance comes from the increase in pressure resistance, which is similar to the ARBUV. In fact, the blockage effect for BWBUV is slighter than that for ARBUV, whether or not there is a small blockage ratio. As the Reynolds number increases, the deviation between the finite and infinite domains in Table 5 remains at a constant level. It can also be clearly seen from Figure 7 that when the Reynolds number is greater than 107, the increase in resistance component tends to be constant. It confirms that the blockage effect has reached saturation.

4.2. Velocity Analysis

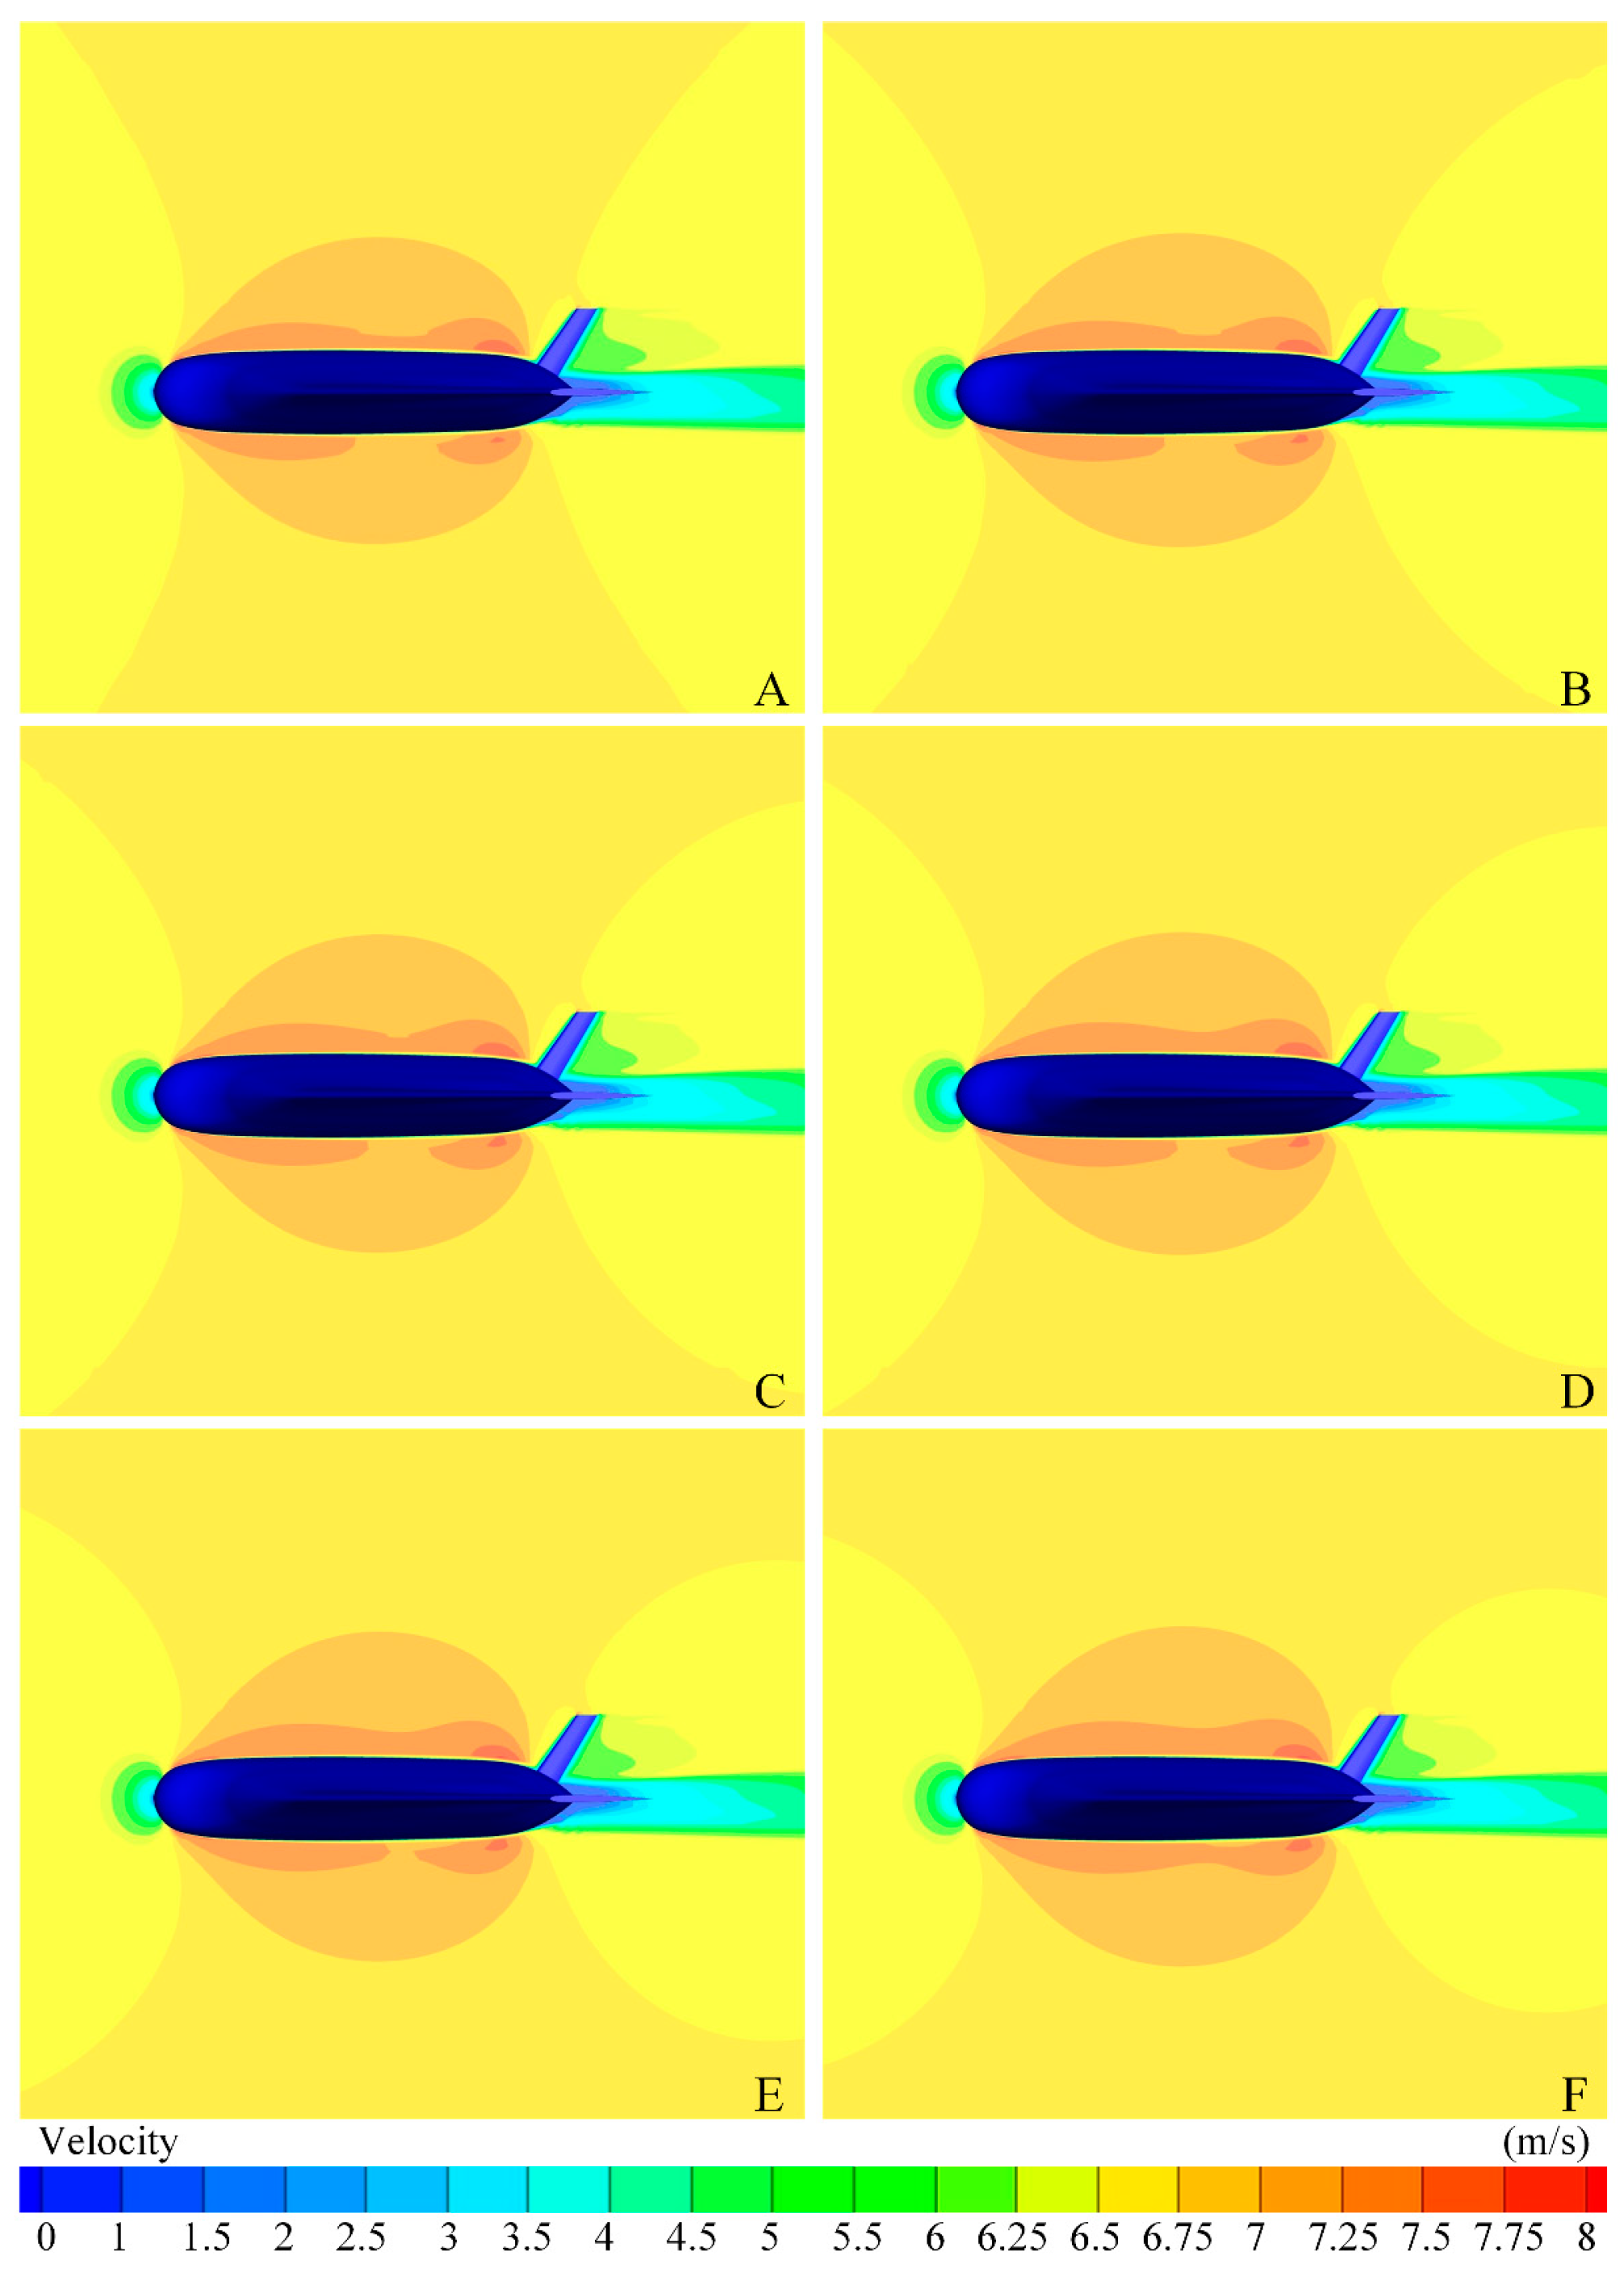
The velocity contour of the ARBUV axisymmetrical surface under different blockage ratios is shown in Figure 8. Specifically, a C-shaped local low-velocity region appears directly in front of the ARBUV model’s nose. Meanwhile, a low-velocity wake exists directly behind the stern rudder. In addition, the semi-circular high-velocity regions are displayed at the recessed areas of the nose and stern. The low-velocity zones at the nose and stern gradually diminish as the blockage ratio (BR) increases. On the contrary, the high-velocity regions at the recessed areas of the nose and stern become larger. The alterations in velocity ranges are particularly evident when comparing blockage ratios of 1.5% and infinite domain. The expansion of the high-velocity regions leads to a development in local frictional resistance. Moreover, the significant changes in the distribution of the high-velocity and low-velocity regions will affect the pressure distribution around the ARBUV model. It certainly results in an increase in pressure resistance.
Figure 9 presents the velocity contour in the BWBUV symmetrical surface under different blockage ratios. The velocity distribution around the BWBUG model just has a little change. A bow-shaped local low-velocity region appears in front of the model’s nose, and a C-shaped low-velocity region and a wake exist in the back of the stern rudder. In addition, the heart-shaped local high-velocity regions surround the hull. As the blockage ratio increases, the bow-shaped local low-velocity region and the C-shaped low-velocity region both slightly decrease in size. The distance between the two local high-velocity regions in the front and rear of the lower hull gradually decreases. In particular, these two regions completely merge with the maximum blockage ratio of 3.57%.
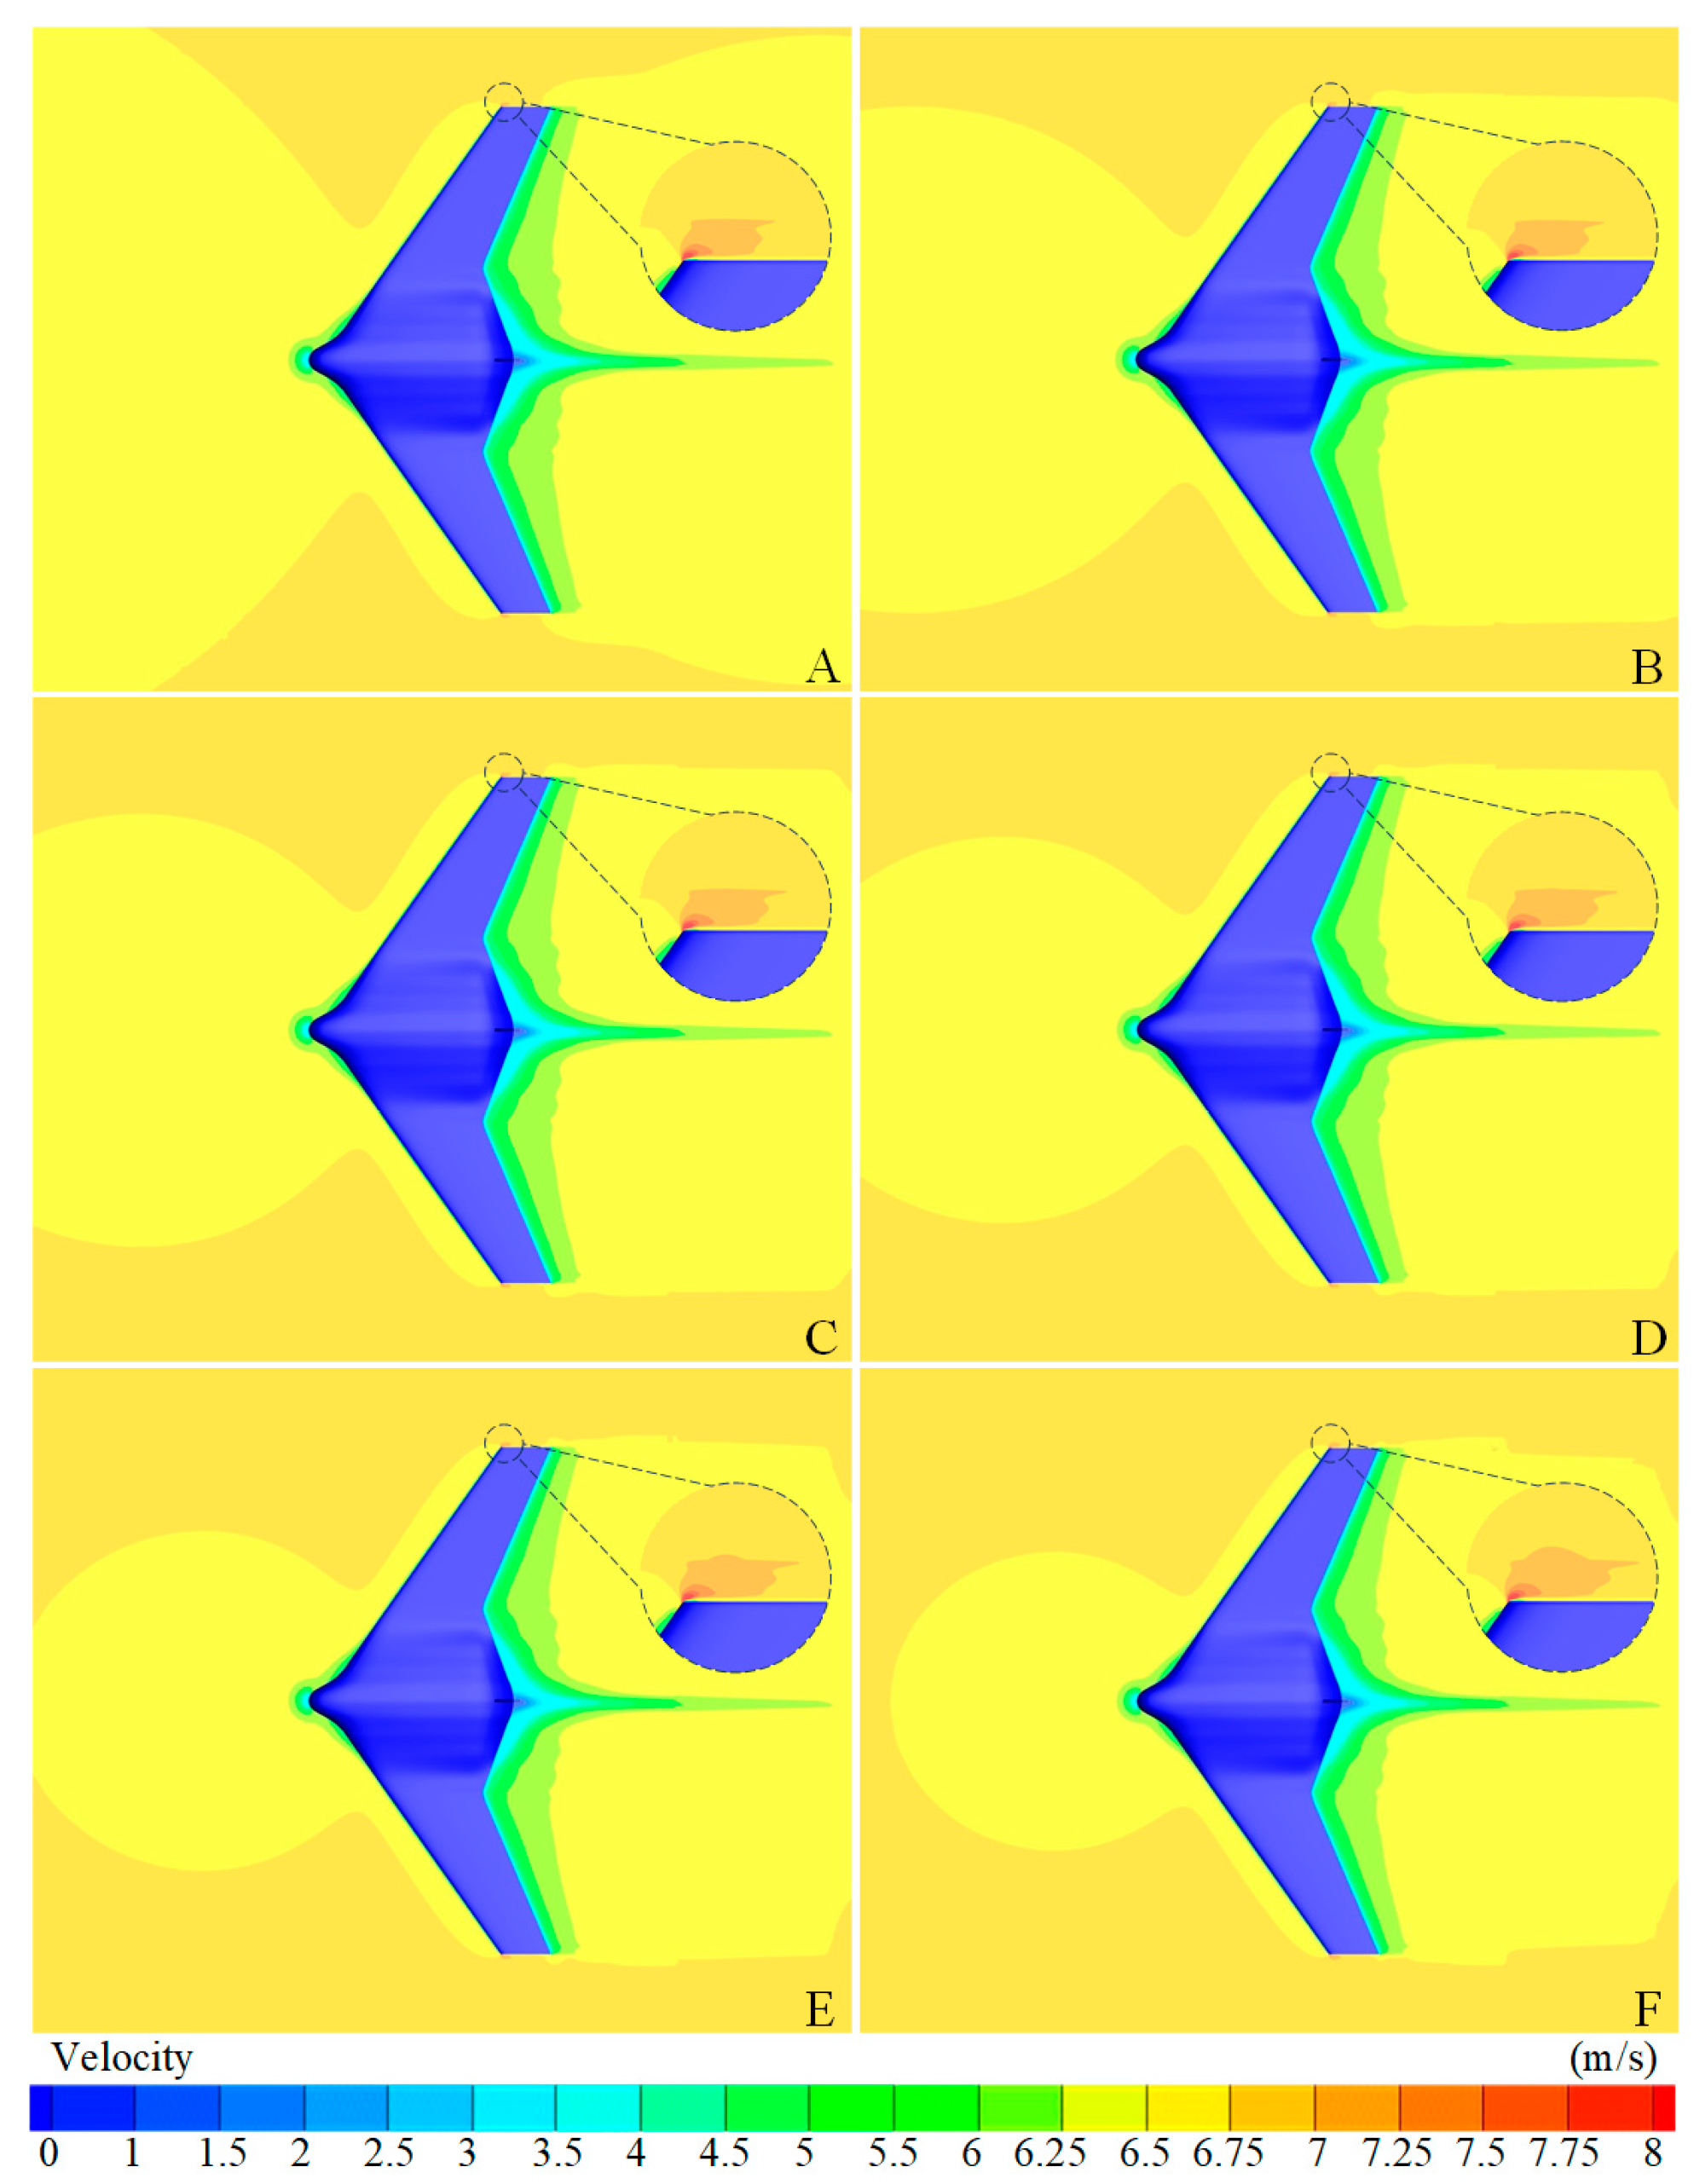
Figure 10 shows the velocity contour of the BWBUV upper surface under different blockage ratios. It is found that the small local high-velocity region near the leading edge of the wing tip is less affected, while the wake behind the wing tip decreases with increasing blockage ratio. The wing tip makes an exceedingly tiny contribution to overall resistance. Therefore, the changes in its flow field can be disregarded in terms of their impact on total resistance.
The variation in the velocity field around the BWBUV is significantly less affected compared to the ARBUV, owing to their distinct flow characteristics. The BWBUV exhibits high lift-to-drag characteristics where incoming flow generates pressure differences over its upper and lower surfaces. It results in a converging wake. The flow disturbances in the wake and lateral flow fields of the model are minimal, with a nearly uniform velocity distribution in the model nose. The BWBUV displays uniform flow characteristics across its 360° profile aside from its fins and rudders. Incoming flow disperses evenly around its hull and diffuses uniformly in all directions, lacking the concentration on upper and lower surfaces observed in the BWBUV. Consequently, the ARBUV is more susceptible to wall effects in the horizontal direction.

4.3. Surface Pressure Analysis

The pressure coefficient distribution along the cross section of the ARBUV and BWBUG models is separately shown in Figure 11. It is observed that the distribution patterns of surface pressure coefficients along the cross section of the ARBUV and BWBUV are nearly identical under various blockage ratios. In fact, it gradually decreases as the blockage ratio decreases. Significant changes in pressure coefficient occur near locations where the hull shape obviously changes. Two AUV models reach their maximum pressure coefficient values at the bow (when the position is 0 m). And it goes sharply to minimum values as moving to the back. Minimum pressure coefficient values also occur around the recessed areas of the hull and at the fins and rudder locations. There are some localized differences in details between ARBUV and BWBUV models. The minimum pressure coefficient occurs in the bow transition area for ARBUV, whereas it occurs at the stern hull transition for BWBUV.
Comparing the increments of pressure coefficient distribution along the cross-section of ARBUV and BWBUV, the impact of blockage ratio on the BWBUV is significantly smaller compared to the ARBUV.

5. Conclusions

This paper investigates the blockage effect on resistance coefficient estimation for ARBUV and BWBUV in a towing tank. The blockage ratio is a key parameter in the selection of the optimal model for testing, taking the available test facilities into account. It helps to reduce the scale effect, which is a critical consideration in the design of large AUVs. Firstly, the blockage ratio is defined, and numerical models with different calculation domains are established. Secondly, the validation of the numerical methods and grid independence are verified. Then, the total resistance, friction resistance, and pressure resistance of the ARBUV and BWBUV models are analyzed. Meanwhile, the velocity and pressure field around the AUV models are further studied to obtain the blockage effect. The main conclusions are made as follows:
  • The blockage effect of the towing tank wall mainly acts on the pressure resistance for ARBUV and BWBUV. However, the contribution of the pressure resistance component to the total resistance is smaller than that of the friction resistance.
  • Compared to the ARBUV, the BWBUV exhibits significantly less susceptibility to blockage effects. It advises to utilize towing tanks with a smaller blockage ratio in practical towing tank experiments. If necessary, the correction may be required for the resistance results for the ARBUV model. It suggests that the blockage ratio of ARBUV should be smaller than 0.375% in the NWPU towing tank test.
  • It can also yield accurate resistance results in a towing tank for BWBUG models, even the tank width is slightly larger than the wingspan of the model. The blockage ratio of BWBUV should be smaller than 2.5% in the NWPU towing tank test.

Author Contributions

Conceptualization, all authors; methodology, P.Y.; software, H.Z.; validation, P.Y., H.Z. and D.Q.; formal analysis, H.Z.; writing—original draft preparation, H.Z.; writing—review and editing, P.Y.; visualization, Y.S. and Q.H.; supervision, G.P. All authors have read and agreed to the published version of the manuscript.

Funding

This work is supported by the Fundamental Research Funds for the Central Universities (No. D5000240229).

Institutional Review Board Statement

Not applicable.

Informed Consent Statement

Not applicable.

Data Availability Statement

The data are available from the corresponding author on reasonable request.

Acknowledgments

The authors would like to express their gratitude to the editor and reviewers for their constructive comments and suggestions, which have contributed to the enhancement of the paper’s quality.

Conflicts of Interest

The authors declare no conflicts of interest.

Nomenclature

Latin symbols
WaWidth of the AUV
WbWidth of the towing tank
WcWidth of the domain
HaHeight of the AUV
HcHeight of the domain
HtWidth of the towing tank
BRBlockage ratio
Lalengths of the AUV
LcCharacteristic length
SaWetted surface area
aDisplacement volume
u i ¯ Time-averaged velocity component
u i Turbulent pulsating velocity component
f ¯ i External volumetric force
p ¯ Time-averaged pressure
Gk, GbTurbulent kinetic energy
YMDissipation of Turbulent Kinetic Energy Due to Pressure Strain
Sk, SεTurbulent Source Term
C1ε, C3ε, C1, C2Empirical constants
CTTotal resistance coefficient
CFFrictional resistance coefficient
CPPressure resistance coefficient
Greek symbols
ρDensity
νKinematic viscosity
σk, σεTurbulent Kinetic Energy Prandtl Number
μDynamic Viscosity
kTurbulent Kinetic Energy
εTurbulent Dissipation Rate
Abbreviations
CFDComputational Fluid Dynamics
RANSReynolds Averaged Navier-Stokes
AUVAutonomous Underwater Vehicle
ARBUVAxisymmetrical Rotary Body Underwater Vehicle
BWBUVBlended Wing Body Underwater Vehicle
ReReynolds number

References

  1. Yu, P.; Wang, T.; Zhou, H.; Shen, C. Dynamic modeling and three-dimensional motion simulation of a disk type underwater glider. Int. J. Nav. Archit. Ocean Eng. 2018, 10, 318–328. [Google Scholar] [CrossRef]
  2. Yang, H.; Gao, X.; Li, B.; Xiao, B.; Huang, H. Development of hydroacoustic localization algorithms for AUV based on the error-corrected wmchan-taylor algorithm. J. Mar. Sci. Eng. 2024, 12, 974. [Google Scholar] [CrossRef]
  3. Ye, P.; Pan, G. Shape optimization of a blended-wing-body underwater glider using surrogate-based global optimization method IESGO-HSR. Sci. Prog. 2020, 103, 1–21. [Google Scholar] [CrossRef] [PubMed]
  4. Cardenas, P.; De Barros, E.A. Estimation of AUV hydrodynamic coefficients using analytical and system identification approaches. IEEE J. Ocean. Eng. 2019, 45, 1157–1176. [Google Scholar] [CrossRef]
  5. Liu, X.; Yuan, X.; Luo, K.; Wang, Y. Blockage effect of a wall on the hydrodynamic characteristics of a supercavitating vehicle's aft body. Ocean Eng. 2022, 256, 111564. [Google Scholar] [CrossRef]
  6. Ji, D.; Wang, R.; Zhai, Y.; Gu, H. Dynamic modeling of quadrotor AUV using a novel CFD simulation. Ocean Eng. 2021, 237, 109651. [Google Scholar] [CrossRef]
  7. Dantas, J.L.D.; De Barros, E.A. Numerical analysis of control surface effects on AUV manoeuvrability. Appl. Ocean Res. 2013, 42, 168–181. [Google Scholar] [CrossRef]
  8. Luo, W.; Ma, C.; Jiang, D.; Zhang, T.; Wu, T. The hydrodynamic interaction between an AUV and submarine during the recovery process. J. Mar. Sci. Eng. 2023, 11, 1789. [Google Scholar] [CrossRef]
  9. Kornilov, V.I.; Popkov, A.N. Blockage effect induced by an airfoil model in the low-velocity wind tunnel test section. Thermophys. Aeromechanics 2020, 27, 359–369. [Google Scholar] [CrossRef]
  10. Zaghi, S.; Muscari, R.; Di Mascio, A. Assessment of blockage effects in wind tunnel testing of wind turbines. J. Wind Eng. Ind. Aerodyn. 2016, 154, 1–9. [Google Scholar] [CrossRef]
  11. Eltayesh, A.; Hanna, M.B.; Castellani, F.; Huzayyin, A.S.; El-Batsh, H.M.; Burlando, M.; Becchetti, M. Effect of wind tunnel blockage on the performance of a horizontal axis wind turbine with different blade number. Energies 2019, 12, 1988. [Google Scholar] [CrossRef]
  12. Sakamoto, N.; Ohashi, K.; Kobayashi, H.; Hino, T. Overset RaNS simulations and validations for the effect of false bottom to the KCS under static drift and static rudder in shallow water. J. Mar. Sci. Technol. 2023, 28, 248–269. [Google Scholar] [CrossRef]
  13. Jachowski, J. Assessment of ship squat in shallow water using CFD. Arch. Civ. Mech. Eng. 2008, 8, 27–36. [Google Scholar] [CrossRef]
  14. Kumar, M.; Subramanian, V.A. Numerical and experimental study on tank wall influences in drag estimation. Ocean Eng. 2007, 34, 192–205. [Google Scholar] [CrossRef]
  15. Zhang, Z.; Deng, H.; Wang, C. Analytical models of hydrodynamic pressure field causing by a moving ship in restricted waterways. Ocean Eng. 2015, 108, 563–570. [Google Scholar] [CrossRef]
  16. Guo, C.; Xu, P.; Wang, C.; Kan, Z. Numerical and experimental study of blockage effect correction method in towing tank. China Ocean Eng. 2019, 33, 522–536. [Google Scholar] [CrossRef]
  17. Bottner, C.; Anschau, P.; Shevchuk, I. Analysis of the flow conditions between the bottoms of the ship and of the waterway. Ocean Eng. 2020, 199, 107012. [Google Scholar] [CrossRef]
  18. Li, L.; Qin, H.; Li, P.; Wang, X. Influence of the blocking effect of circulating water channels on hydrodynamic coefficient estimation for autonomous underwater vehicles. J. Mar. Sci. Appl. 2023, 22, 411–420. [Google Scholar] [CrossRef]
  19. Huang, H.; Zhou, Z.; Li, H.; Zhou, H.; Xu, Y. The effects of the circulating water tunnel wall and support struts on hydrodynamic coefficients estimation for autonomous underwater vehicles. Int. J. Nav. Archit. Ocean Eng. 2020, 12, 1–10. [Google Scholar] [CrossRef]
  20. Da Silva, F.D.; Tancredi, T.P.; Silva, E. Corrections for the drag on submarines due to the blockage effect. Ocean Eng. 2023, 275, 114150. [Google Scholar] [CrossRef]
  21. Du, X.; Liu, X.; Song, Y. Analysis of the steady-stream active flow control for the blended-winged-body underwater glider. J. Mar. Sci. Eng. 2023, 11, 1344. [Google Scholar] [CrossRef]
  22. Jiang, Y.; Jeong, S.W.; Ahn, B.K.; Kim, H.T.; Jung, Y.R. Experimental investigation of drag characteristics of ventilated supercavitating vehicles with different body shapes. Phys. Fluids 2019, 31, 052106. [Google Scholar] [CrossRef]
  23. Guo, C.; Wang, X.; Chen, C.; Li, Y.; Hu, J. Numerical investigation of self-propulsion performance and noise level of DARPA suboff model. J. Mar. Sci. Eng. 2023, 11, 1206. [Google Scholar] [CrossRef]
  24. Wu, X.; Yu, P.; Zang, C.; Wang, Q.; Zhu, Z. Shape optimization of underwater glider for maximum gliding range with uncertainty factors considered. Ocean Eng. 2023, 287, 115869. [Google Scholar] [CrossRef]
  25. Tian, X.; Zhang, L.; Zang, H.; Wang, Y.; Liu, Y. The optimal lift–drag ratio of underwater glider for improving sailing efficiency. IEEE J. Ocean. Eng. 2021, 46, 808–816. [Google Scholar] [CrossRef]
  26. Sener, M.Z.; Aksu, E. The effects of head form on resistance performance and flow characteristics for a streamlined AUV hull design. Ocean Eng. 2022, 257, 111630. [Google Scholar] [CrossRef]
  27. Chen, Y.; Liu, Y.; Meng, Y.; Yu, S.; Zhuang, Y. System modeling and simulation of an unmanned aerial underwater vehicle. J. Mar. Sci. Eng. 2019, 7, 444. [Google Scholar] [CrossRef]
  28. Krishna, H.R.; Issac, M.T.; Ebenezer, D.D. Numerical investigation of two-dimensional axisymmetric and three-dimensional flow simulations over a benchmark underwater vehicle. Phys. Fluids 2023, 35, 015149. [Google Scholar] [CrossRef]
  29. Sezen, S.; Dogrul, A.; Delen, C.; Bal, S. Investigation of self-propulsion of DARPA Suboff by RANS method. Ocean Eng. 2018, 150, 258–271. [Google Scholar] [CrossRef]
  30. Wu, L.; Li, Y.; Su, S.; Yan, P. Hydrodynamic analysis of AUV underwater docking with a cone-shaped dock under ocean currents. Ocean Eng. 2014, 85, 110–126. [Google Scholar] [CrossRef]
  31. Tian, W.; Song, B.; Ding, H. Numerical research on the influence of surface waves on the hydrodynamic performance of an AUV. Ocean Eng. 2019, 183, 40–56. [Google Scholar] [CrossRef]
  32. Ma, Y.; Yin, G.; Janocha, M.J.; Xing, Y. Numerical investigation on near-bottom operation of an extra-large freight submarine. J. Offshore Mech. Arct. Eng. 2024, 146, 021901. [Google Scholar] [CrossRef]
  33. Bai, T.; Xu, J.; Wang, G.; Yu, K.; Hu, X. Analysis of resistance and flow field of submarine sailing near the ice surface. Chin. J. Ship Res. 2021, 16, 36–48. [Google Scholar]
Figure 1. ARBUV model.
Jmse 12 01532 g001
Figure 2. BWBUV model.
Jmse 12 01532 g002
Figure 3. Infinite and finite domain sizes and boundary conditions settings. (a) Infinite domain; (b) Finite domain.
Jmse 12 01532 g003
Figure 4. Grid distribution. (a) ARBUV model; (b) BWBUV model.
Jmse 12 01532 g004
Figure 5. Resistance experiments of ARBUV in NWPU towing tank. (a) BWBUV model; (b) Towing experiments.
Jmse 12 01532 g005
Figure 6. Resistance coefficients of AUVs with different blockage ratios. (a) ARBUV; (b) BWBUV.
Jmse 12 01532 g006
Figure 7. The proportion of the increase in frictional and pressure resistance to total resistance. (a) ARBUV; (b) BWBUV.
Jmse 12 01532 g007
Figure 8. Velocity contour of ARBUV axisymmetrical surface under different blockage ratios (A): BR = 0%, (B): BR = 0.1875%, (C): BR = 0.25%, (D): BR = 0.375%, (E): BR = 0.75%, (F): BR = 1.5%.
Jmse 12 01532 g008
Figure 9. Velocity contour of BWBUV symmetrical surface under different blockage ratios (A): BR = 0%, (B): BR = 0.625%, (C): BR = 1.25%, (D): BR = 1.785%, (E): BR = 2.5%, (F): BR = 3.57%.
Jmse 12 01532 g009
Figure 10. Velocity contour of BWBUV upper surface under different blockage ratios (A): BR = 0%, (B): BR = 0.625%, (C): BR = 1.25%, (D): BR = 1.785%, (E): BR = 2.5%, (F): BR = 3.57%.
Jmse 12 01532 g010
Figure 11. Pressure coefficient distribution of AUVs symmetrical cross-section under different blockage ratios. (a) ARBUV; (b) BWBUV.
Jmse 12 01532 g011
Table 1. Main parameters of ARBUV and BWBUV models.
AUV ParametersARBUV ValuesBWBUV Values
Length La2.8 m1.2 m
Width Wa0.324 m2.5 m
Height Ha0.324 m0.3 m
Characteristic length Lc2.8 m2.5 m
Wetted surface area Sa2.750 m22.597 m2
Displacement volume a0.190 m30.077 m3
Table 2. Comparison of resistance values with different numbers of grids.
ModelNumber of Grids (Million)Resistance Value (N)
ARBUV2.93196.21
3.80198.06
5.71200.46
8.02200.50
12.32200.58
BWBUV4.85332.97
6.41334.84
9.66336.05
13.63337.03
18.95337.19
Table 3. Comparison of numerical and experimental results.
ModelVelocity (m/s)CFD (N)Experimental (N)Relative Error
ARBUV15.7595.9843.76%
219.97920.5322.69%
341.91139.9724.85%
471.25573.0662.48%
5107.327106.8980.04%
Table 4. Different blockage ratios and the corresponding calculation conditions.
ModelDomainBlockage RatioDomain Width (m)Velocity (m/s)
ARBUVFinite3.0%0.587
1.5%1.167
0.75%2.337
0.375%4.667
0.25%7.001, 2, 3, 4, 5, 6, 7
0.1875%9.337
Infinite0%14.001, 2, 3, 4, 5, 6, 7
BWBUVFinite3.57%3.57
2.5%5.07
1.785%7.01, 2, 3, 4, 5, 6, 7
1.25%10.07
0.625%14.07
Infinite0%12.51, 2, 3, 4, 5, 6, 7
Table 5. Resistance coefficients of ARBUV with various Reynolds numbers.
ReDomain (×10−3)CT
Deviation
CF
Increase in CT
CP
Increase in CT
InfiniteFinite (BR = 0.25%)
CTCFCPCTCFCP
2.76 × 1064.19833.61650.58174.42503.74920.67585.40%58.54%41.48%
5.51 × 1063.64113.14430.49683.80353.22270.58084.46%48.26%51.74%
8.27 × 1063.39482.93050.46433.50692.97050.53643.30%35.69%64.31%
1.10 × 1073.24652.79950.44713.32962.81730.51232.56%21.45%78.55%
1.38 × 1073.12962.70120.42843.21282.71670.49612.66%18.58%81.42%
1.65 × 1073.04752.62880.41873.12792.64340.48452.64%18.16%81.84%
1.93 × 1072.98292.56630.41673.05362.57820.47542.37%16.83%83.17%
Table 6. Resistance coefficients of BWBUV with various Reynolds numbers.
ReDomain (×10−3)CT
Deviation
CF
Increase in CT
CP
Increase in CT
InfiniteFinite (BR = 0.25%)
CTCFCPCTCFCP
2.47 × 1067.24824.67122.57697.32874.70532.62341.11%42.36%57.64%
4.94 × 1066.55204.22112.33096.63404.24092.39311.25%24.15%75.85%
7.41 × 1065.86933.79692.07235.94673.81302.13371.32%20.80%79.20%
9.88 × 1065.77953.63332.14625.83463.64752.18710.95%25.77%74.23%
1.23 × 1075.58593.41432.17165.64473.43082.21391.05%28.06%71.94%
1.48 × 1075.43723.26412.17325.49293.27952.21351.02%27.65%72.35%
1.73 × 1075.30393.15642.14755.35693.17152.18551.00%28.49%71.51%
Disclaimer/Publisher’s Note: The statements, opinions and data contained in all publications are solely those of the individual author(s) and contributor(s) and not of MDPI and/or the editor(s). MDPI and/or the editor(s) disclaim responsibility for any injury to people or property resulting from any ideas, methods, instructions or products referred to in the content.