Abstract
Ore collection is very important in deep-sea mining for seafloor massive sulfide (SMS). In view of the characteristics of SMS ores produced by mechanical crushing, which contain coarse particles and a wide particle size distribution, in-depth research on the collection process with a device combining a rotary crushing head and a flat suction mouth was conducted. In this paper, solid–liquid two-phase flow in the hydraulic collection process with a drum rotation is carried out using the computational fluid dynamics-discrete element method (CFD-DEM), and the flow field characteristics and particle motion characteristics are analyzed. The results indicate that particles with a maximum diameter of 20 mm can be effectively collected when the suction velocity is 3 m/s. The collection process of SMS mainly goes through three stages: particle disturbance start-up, partial particle influx, and stable collection. In addition, the appropriate drum speed facilitates the collection of SMS ore. Finally, the correctness of the numerical method was assessed using similarity experiments. This work can be used to guide the design of underwater mining equipment.
1. Introduction
The deep-sea contains abundant mineral resources such as polymetallic nodules (PMNs), cobalt-rich crust (CRC), and seafloor massive sulfide (SMS) [1,2], which are of great importance in addressing potential resource supply crises in the future. Among them, SMS are considered to have great commercial mining prospects due to their large reserves, shallow water depth, and proximity to land [3]. However, deep-sea minerals exist in extreme environments of ultra-high pressure, darkness, low temperature, and complex ocean currents, requiring the development of new mining technologies and deep-sea equipment [4,5]. The pipeline-lift mining system is generally recognized as having the most potential in practical application, and a typical SMS mining system is shown in Figure 1. As a key component of deep-sea mining, ore collection is also one of the most important determinants of whether a mining project can be profitable.
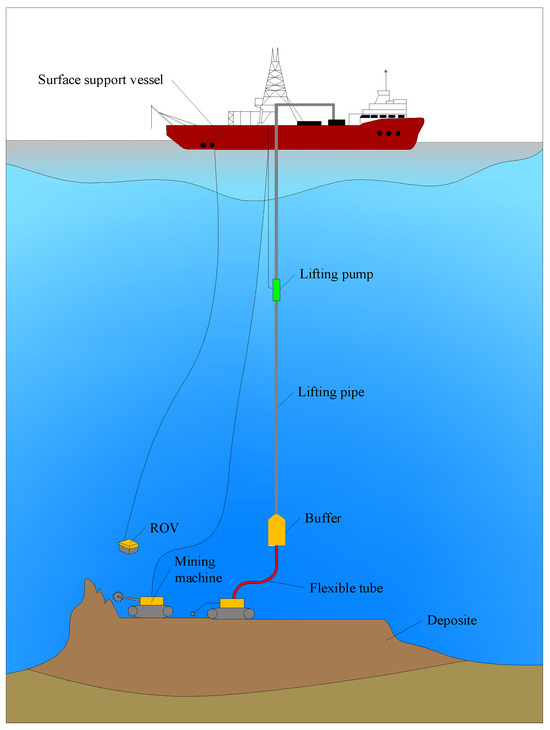
Figure 1.
Configure diagram of a typical SMS mining system.
Among the three minerals mentioned above, the collection study of PMNs started earlier. PMNs are oval in shape at a size of 20~100 mm and semi-buried, so they do not require cutting or blasting before collection [6,7]. Researchers have conducted extensive research on the collection mechanism of coarse-grained ores through experiments and numerical simulations. Some scholars have studied the collection process of a single particle, explored its flow field and particle motion state, and quantitatively analyzed the influence of parameters such as collection height and flow velocity on particle collection performance [8]. Xia et al. [9] simulated the hydraulic collection process of particles using the CFD-DEM method and analyzed the pressure and velocity characteristics of the flow field in terms of inhalation velocity on particle lateral displacement, drag coefficient, and Reynolds number. Chen et al. [10,11] investigated the effects of particle size, off-bottom clearance, and particle density on the initiation velocity and flow field distribution of single spherical particles aspirated from the bottom using the Particle Image Velocimetry (PIV) technique, and further investigated the single-particle collection mechanism using a fluid–solid coupling approach. Some scholars have focused on the collection scheme and performance of PMNs in multiple particles and have also achieved fruitful research results. Hong et al. [12] proposed a hydraulic collector with water jet pipes and baffle plates. They experimentally analyzed the collection effect of the hydraulic collector and determined the excellent operation parameters. Yue et al. [13] compared three hydraulic collection methods for polymetallic nodules in terms of collection efficiency and perturbation of the flow field near the seafloor and analyzed the similarities and differences in collection performance. Jia et al. [14] and Alhaddad et al. [15] conducted numerical simulations and experimental studies on the new Coandă—effect based hydraulic polymetallic nodule collector and achieved further improvements in ore collection performance and sediment disturbance. From the perspective of ore stress, the currently proposed collection schemes can be divided into mechanical type and hydraulic type, and the hydraulic type collector is preferred due to its advantages of high efficiency, great environmental protection, and low cost [16]. These studies have enriched and developed the theoretical system of deep-sea ore collection and provided guidance for the collection research on SMS mining.
Due to the differences in material properties and occurrence characteristics among different minerals, the research results of PMNs collection cannot be fully applied to SMS collection. SMS deposits form on and below the seabed from high-temperature hydrothermal fluids emitted along ridges and island arcs, and in rifted back-arc basins behind active subduction zones [2]. Because it is deposited on the seafloor as a continuous solid, it must be crushed prior to collection [17]. In addition, the underwater mining process for SMS and CRC is similar: both exist in a continuous solid state on the seafloor and require fragmentation before being collected by specialized tools [17], so investigations for SMS ore collection are often extended to CRC. Figure 2 shows some typical ore collection methods for SMS and CRC mining [17,18,19], and the mining process can generally be divided into two steps: mineral crushing and loose particle collection. First, the minerals are crushed using a rotating tool and the rock fragments are mixed with water to form a slurry. Then, the ore is lifted and collected by a special device and transported by hydraulic or mechanical means to a designated space on the mining vehicle. However, current research on SMS mining focuses mainly on crushing, and there are few publicly published studies on SMS ore collection. Meanwhile, the crushed SMS contains a large number of coarse particles with a particle size distribution, and its density is 1.9~3.6 × 10³ kg/m3 [20,21,22], which is usually higher than that of PMNs (average density is about 2.1 × 10³ kg/m3 [23]). As a result, the more complex particle size composition and higher density place higher demands on the ore collection for SMS mining.
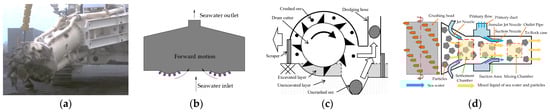
Figure 2.
Typical mining machines: (a) dredging collection; (b) 2-drum counter rotation collection [18]; (c) milling + suction collection [19]; (d) jet punching collection [17].
As mentioned above, it is necessary to conduct in-depth collection research on SMS ore aggregates with high density and coarse grain characteristics to guide the commercial and efficient mining of SMS. However, there are few published research results on SMS ore collection. Among the few studies that can be consulted, Liu et al. [24] and Li et al. [25] conducted research on the suction process under double-helix drum crushing and analyzed the influence of different parameters on ore collection performance using numerical simulation. However, the coarse-grained characteristic of SMS ore was not considered in the above study, so the results are not accurate. Therefore, a more comprehensive analysis of the collection process based on the SMS ore characteristics is important for deep-sea mining.
In this paper, an SMS collection device combining a rotary crushing head and a flat suction mouth is studied. First, the structural composition and working principle of the collector are introduced. Then, based on the CFD-DEM coupling method, a numerical model of the hydraulic collector is established to analyze the particle collection and transport process, and explore the flow field characteristics and ore collection mechanism of coarse particle collection. Furthermore, the influence of drum rotation motion was considered and the effect of different drum speeds on the particle collection process was investigated. Finally, a test system for the collection device was established and experiments were conducted to verify the correctness of the mining plan and the numerical modeling method. This study comprehensively considers the ore characteristics of high-density, coarse particles and particle size compositions, which can provide a theoretical basis and design reference for the development of mining equipment.
2. Numerical Method
2.1. Governing Equation
In the ore collection process, seawater is an incompressible fluid, and the basic equations for three-dimensional flow include continuity equations and momentum conservation equations. The continuity equation refers to the mass difference between the inflow and outflow of fluids in the computational domain being equal to the increase in fluid mass in the controlled body, which can be expressed as follows:
where u is the fluid velocity.
The Navier–Stokes conservation of momentum equation is a fundamental equation that describes fluid motion and the flow of fluids under viscous incompressible conditions. Due to the influence of particles on the flow field, the governing equation can be expressed as follows:
where t is time; is the fluid density; is the fluid pressure; is the dynamic viscosity of the fluid; is the fluid gravity; and is the particle force on the fluid.
For each particle in the solid–fluid two-phase flow field, the momentum conservation and the angular momentum conservation are expressed as follows:
where , , , and represent the mass, velocity, moment of inertia, and angular velocity of the particle, respectively; is the force of a fluid on a particle, which is a pair of interactions with mentioned above; is the gravitational acceleration; is the contact force between the particle and other particles; is the contact torque with other particles; and is the rotational resistance moment exerted by the fluid in the opposite direction of its rotation.
2.2. Force Acting on Particles
2.2.1. Fluid–Particle Interaction
In an unsteady incompressible fluid, the force originating from the fluid on the particle includes the drag force on the particle , the virtual mass force , the pressure gradient force , the Basset force , the Magnus force , and the Suffman force . The force balance equation of the particles can be expressed as Equation (5) [26]:
The fluid resistance for a particle moving in a viscous fluid can be described as follows [26]:
where is the resistance coefficient of the particle [27]; is the particle diameter; is the velocity of the particle; and is the particle Reynolds number. The Reynolds number is the most important factor affecting the drag coefficient of particles in fluid motion. In addition, particle shape, wall boundaries, and fluid turbulence all affect the drag coefficient.
The virtual mass force is the force exerted by the fluid due to the accelerated motion of the particles in the fluid. For spherical particles, it can be calculated using Equation (8):
When the fluid-to-particle density ratio is greater than 0.1, the virtual mass force cannot be neglected.
The pressure gradient can cause particles to move from high pressure to low pressure in the flow field, and the resulting pressure gradient force can be expressed as follows:
where is the pressure gradient. In a stationary fluid where gravity is considered, is the buoyant force on the particles.
Basset force is the fluid force due to variable particle velocity, which can be expressed as follows [26]:
where is the Basset coefficient and is the dynamic viscosity. If there is no significant velocity change in the motion of the particles in the flow field, the effect of the Basset force can be neglected.
Fluid lift consists mainly of Magnus lift and Saffman lift . Particles in the flow field rotation will lead to changes in the flow velocity on both sides, which leads to changes in the pressure on both sides of the particles to produce a pressure difference, so that the particles are subjected to a force perpendicular to the particles and the direction of the relative motion of the fluid, with the force being the Magnus lift, which is calculated using the following formula [26]:
where is the angular velocity of particle rotation.
The Saffman lift force is mainly due to the velocity gradients in the flow field, which can be described as follows [28]:
where is the slip-shear lift coefficient related to the magnitude of the Reynolds number of the particulate shear flow, and is the vorticity of the fluid.
2.2.2. Particle Collision Force
In the study of solid–liquid two-phase flow formed by SMS ore collection, it is necessary to consider the collisions between particles and walls as well as between particles. Particle collision refers to the process in which particles interact from far to near, changing their motion state or transforming into other particles. This study considers only the conversion of energy and motion between particles and does not consider particle fragmentation. The Hertz–Mindin non-sliding contact theory model [29] was used to explain and simulate the particle collisions, as shown in Figure 3.
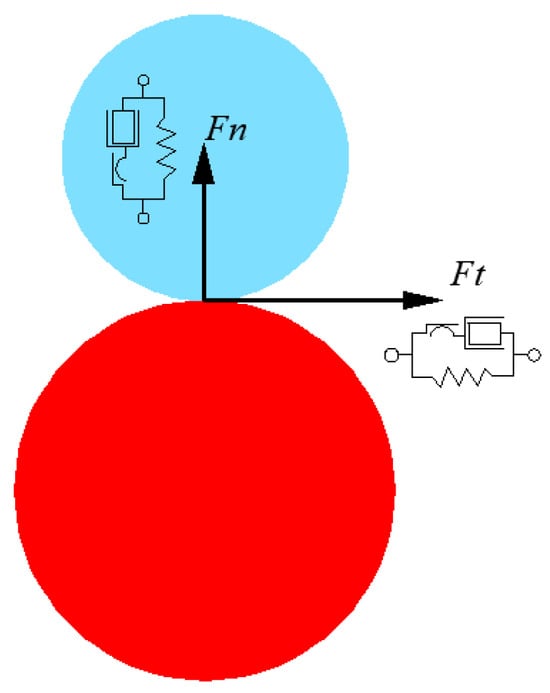
Figure 3.
Particle–particle collision model.
The force generated between two particles by collision can be decomposed as follows:
where and are the amplitudes of the normal and tangential components of the contact force, respectively. and are the normal and tangential unit vectors of the contact force.
The normal force amplitude can be simulated in the form of a spring damper, which can be expressed as follows:
where and are the normal spring stiffness coefficient and damping coefficient; is the normal overlap distance between the two particles; and is the normal component of the relative velocity at the contact point.
The tangential force amplitude can be expressed as follows:
where and are tangential spring stiffness and damping; is the static friction coefficient; is the tangential overlap distance during the collision; and is the tangential component of the relative velocity at the contact point.
When particles collide with the wall, the wall can be considered a sphere with a radius tending to infinity, and thus, the mass of the wall also tends to infinity. Therefore, the idea of collisions between particles can still be applied to collisions between particles and walls.
2.3. CFD-DEM Coupling Method
The CFD-DEM coupling method is a mature numerical simulation method for solid–liquid two-phase flow, which can effectively consider the interaction between particles and fluids and can use collision models to calculate and analyze particle–particle and particle–wall collisions. Therefore, this method was chosen for the numerical simulation of the hydraulic collection for an SMS ore. Figure 4 depicts the framework of the CFD-DEM coupling principle. In each iteration, the DEM calculates the position and velocity of each particle, and the CFD uses these data to solve the fluid flow field to obtain the fluid forces acting on the particles. The information interaction between the DEM and the CFD is realized through an Application Programming Interface (API) between them.
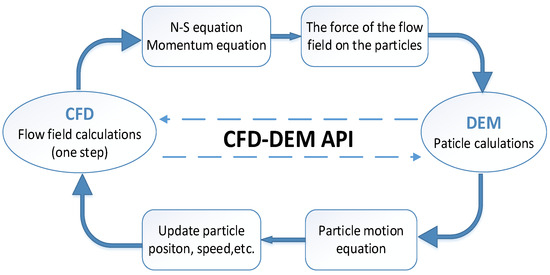
Figure 4.
CFD-DEM coupling schematic.
3. Design Parameters and Modeling
3.1. Design Parameters
The structural composition of the integrated collecting device proposed in this study is shown in Figure 5. The spiral drum crushes the SMS deposit and throws the ore backward using the high-speed cutting conical picks. The ore then falls into the front of the flat mouth collecting head and is collected by the suction of the water flow. In addition, a circular baffle is connected to the flat-mouth suction head to minimize splashing of the particles. The collecting device is arranged in front of the mining vehicle and moves forward accordingly to crush and collect the ore integrally. The specific structural parameters of the flat-mouth suction head are shown in Figure 6. The definition and values of each parameter are listed in Table 1.
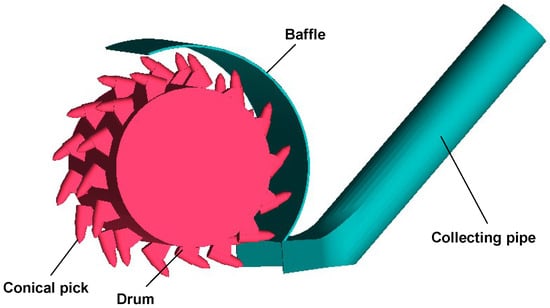
Figure 5.
Scheme model of the integrated collecting device.
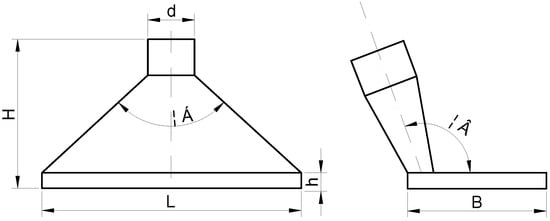
Figure 6.
Main structural parameters of the suction head.

Table 1.
Main design parameters of the collection head.
3.2. Numerical Modeling
3.2.1. Geometric Model and Mesh Model
Figure 7 shows the computational domain of the collection model. The inlet is defined as a velocity inlet, which simulates the motion of the geometry relative to the fluid, and the velocity magnitude is equal to the forward speed of the device. The outlet is also defined as a velocity inlet, where the magnitude is negative to represent fluid outflow. The bottom, pipe, baffle, and drum are set as no-slip solid boundaries. The other surfaces are set as free flow boundaries. The whole computational domain is divided into adaptable unstructured meshes, and the meshes near the drum, tube wall, and outlet are densified. In addition, a mesh independence test is performed for calculation efficiency and accuracy, resulting in a total of approximately 1.74 million mesh elements in the model.
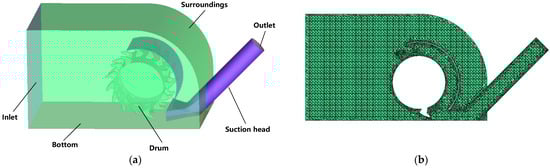
Figure 7.
(a) Basin model and (b) grid model.
3.2.2. Initial State of Particles
Synchronous simulation of crushing and collection is currently not possible due to the limitation of numerical simulation technology. Therefore, SMS ore bodies are regarded as a stable structure formed by the accumulation of many chips, and the initial state of the minerals is completed in the professional discrete element software EDEM2020. In the mineral formation stage, the particles with a density of 2670 kg/m3 are continuously generated and randomly distributed in a rectangular region with size of 1250 mm × 1100 mm × 250 mm, and an initial falling speed is given to accelerate the formation of the mineral structure. This density was chosen for consistency with subsequent experimental ore densities, and it is close to the average density of SMS. Subsequently, the particles are released to the right side of the rectangular region near the drum and then undergo sedimentation and cleaning to form the initial state of the SMS deposit, as shown in Figure 8.
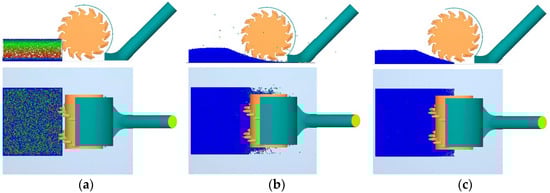
Figure 8.
The formation process of the ore deposit in EDEM: (a) particle generation; (b) particle sedimentation; (c) cleaning.
In order to make this study more meaningful engineering-wise, it is necessary to configure particles of different sizes in certain proportions. Here, the Rosin–Rammler distribution is temporarily adopted in consideration of the immaturity of the particle size distribution for underwater cutting.
where d is the particle diameter, and m and are the related variables of the particle distribution function. refers to the particle diameter size corresponding to the cumulative mass of particles accounting for 50% of the total particle mass. m is a parameter that characterizes the range of dust particle size distribution in particles. In this model, , with maximum and minimum particle sizes of 20 mm and 5 mm, and the corresponding particle size distribution is shown in Table 2. Finally, the initial state of the particle bed is shown in Figure 8c, with a height of 250 mm and 87,456 particles.
Table 2.
Particle size distribution.
3.2.3. Numerical Setups
In EDEM, all walls are defined as stainless steel with shear modulus and Poisson’s ratio of 78 GPa and 0.25, and other parameters are defined as defaults. For ease of analysis, the particles within the blue segment shown in Figure 9 are selected for subsequent time domain analysis and a velocity detection unit is added at the outlet of the pipe to monitor the velocity of the particles. In addition, the outlet boundary is set as the geometry, and a plug-in is added to measure the mass of particles passing through.
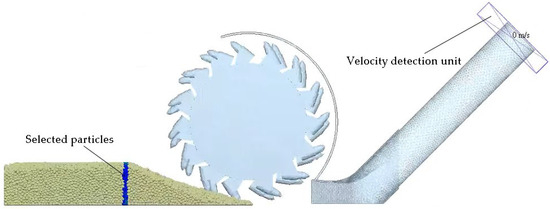
Figure 9.
Detection settings in EDEM.
The Fluent package of ANSYS 2022R, a general-purpose finite element software, is used to accurately calculate the flow field to obtain information such as velocity, pressure, and force in the fluid field and to achieve information exchange with the solid phase through the coupling interface API. The fluid is defined as seawater, with a density of 1025 kg/m3 and a viscosity of 0.015. The pressure-based solver and transient simulation are chosen, and the dynamic mesh technique is used to adapt to the rotation of the drum. The Discrete Phase Model (DPM) model is selected; Saffman lift, pressure gradient force, virtual mass force, the rotational traction model, and the Magnus lift model are added to the injected particles; and the RNG turbulence model is selected. In addition, the time step in Fluent and EDEM must match the integer times of the Rayleigh time step in EDEM. As a result, the time step for EDEM was 2.5 × 10⁻⁵ s, while the time step for Fluent was 2.5 × 10⁻⁴ s. Note that the EDEM model time must be reset after the above operation to ensure that the initial time is consistent with Fluent when coupled.
4. Results and Discussions
In order to facilitate the analysis of the ore collection mechanism and the effect of the drum rotation on the collection performance, a gentle suction flow velocity of 3 m/s is set at the outlet and the total simulation time is 10 s. Considering that the ore collection process is basically similar under different mining collection conditions, the mechanism analysis is carried out only for the case of 30 r/min.
4.1. Analysis of Flow Field Characteristics
The flow field characteristics are an important way to reveal the mechanism of hydraulic ore collection and also provide a basis for the structure optimization and parameter preference of the collecting device. Figure 10 is the static pressure contours of the flow field, which shows a significant negative pressure inside the suction head relative to the outer region and that the negative pressure increases as the distance from the inlet increases. As the particles move into the negative pressure region, the pressure difference causes the particles to accelerate and lift. Figure 11 further illustrates the velocity contour of the flow field on the symmetry plane. As shown in the figure, due to the inclination of the pipe and the sudden change in the suction head geometry, the water flow shows a significant acceleration in the suction head. Moreover, the flow velocity inside the inclined pipe is significantly higher due to the reduction in the cross section, and a clear stratification of the flow velocity inside the inclined pipe is shown in this figure. This is because under light suction, particles tend to stick to the wall due to gravity and the delay in particle movement causes a decrease in flow velocity.
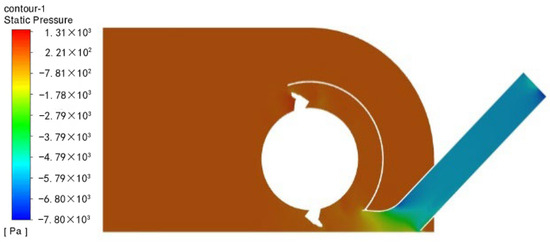
Figure 10.
Static pressure contour of the hydraulic collection.
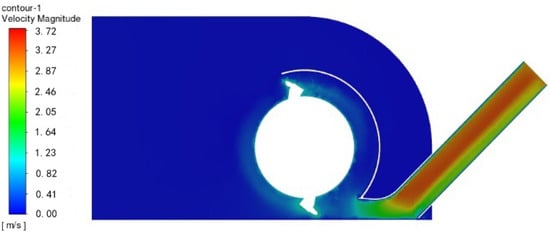
Figure 11.
Velocity contour of the hydraulic collection.
4.2. Ore Collection Mechanism
The ore hydraulic collection process can be described as a process in which particles are initiated, agglomerated, and transported through a pipeline to a designated region by being propelled by the fluid. Figure 12a is a diagram of the particle disturbance start-up. As the drum rotates, the particles are disturbed by the cutting picks and the disturbed mineral particles have start-up velocities, especially at the cutting of the drum head, where the particle velocities change significantly. After being disturbed, the particles are thrown backwards due to the driving of the picks. As shown in Figure 12b, the particles then enter the suction area and the mixture containing the particles is collected in the hard pipe. As time passes, more and more particles enter the pipe, and the closer the particle is to the wall, the lower the velocity, as shown in Figure 12c. This is mainly due to the gravity of the particles and the velocity distribution characteristics of the fluid inside the round pipe.
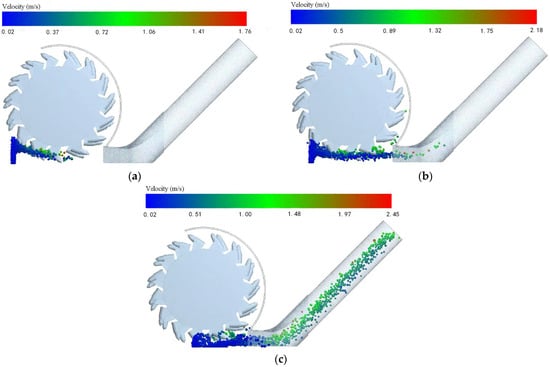
Figure 12.
Track diagram of the selected particles: (a) start-up; (b) partial inflow of particles; (c) stable collection.
4.3. The Effect of Drum Speeds on Collection Characteristics
The effect of the drum speeds on the collection characteristics were then investigated at drum speeds of 15 r/min, 30 r/min, 45 r/min, and 60 r/min.
4.3.1. Flow Field Characteristics
Figure 13 shows the velocity vectors of the flow field in the symmetric plane of the suction head at 4 s for different drum speeds. As the drum speed increases, the fluid flow around the drum accelerates, and the flow intensification in front of the drum by the bottom is more obvious. When the suction capacity is insufficient, the particles tend to settle due to gravity, so the stratified flow phenomenon in the pipe is obvious, while, as the drum speed increases, the uneven flow phenomenon in the whole suction head is reduced. However, due to the limited strength of the rotating flow field itself and the physical isolation of the collection head, the effect of the rotating flow field on the suction flow field is not obvious, as shown in Figure 13. However, the rotation of the drum mixes the particles more evenly at the inlet, allowing them to move more smoothly under the action of the high-speed fluid. Therefore, the reason for the improvement in the flow field in the suction head by the drum rotation speed is more likely to lie in the state of the particles than in the rotating flow field itself.
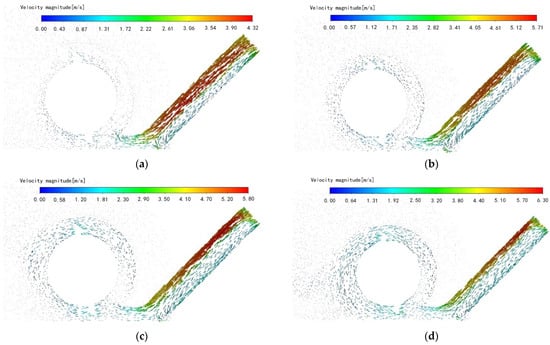
Figure 13.
Velocity vector diagram at different speeds: (a) 15 r/min; (b) 30 r/min; (c) 45 r/min; (d) 60 r/min.
4.3.2. Particle Dynamics Characteristics
Figure 14 shows the instantaneous state of the particles behind the drum at 10 s. As shown in Figure 14a, when the rotational speed is low, most of the particles cannot be lifted and basically slide along the bottom surface. As the rotational speed increases, the overall height of the lifted particles and the overall speed of the particles are increased. As shown in Figure 14d, a large number of particles are lifted to the front of the drum by the picks at 60 r/min.
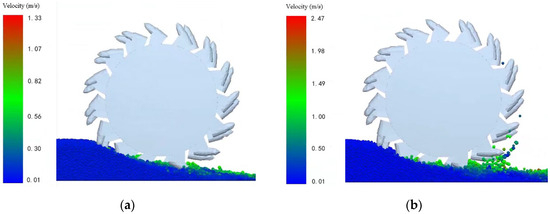
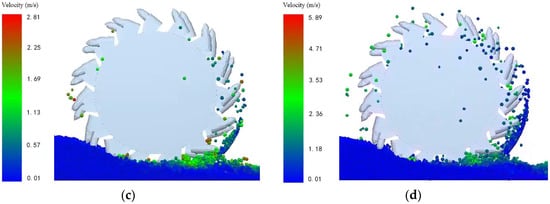
Figure 14.
Instantaneous state of particle lifting at 10 s: (a)15 r/min; (b) 30 r/min; (c) 45 r/min; (d) 60 r/min.
Subsequently, the view shifts to the top view of the model, as shown in Figure 15. The distribution of particles in the lifting pipeline did not show significant changes with the increase in drum speed. However, the remaining particles on the bottom have an asymmetrical distribution on the left and right sides of the suction head as the drum speed increases. As shown in Figure 15c,d, the number of particles in the red circle is significantly less than that in the black circle, and the difference is more pronounced in Figure 15d. This is because the rotation of the drum causes the particles to splash, and the spiral arrangement of the picks provides a certain guidance for the movement of the particles. For this reason, spiral blades are often used in practical engineering to guide particle collection.
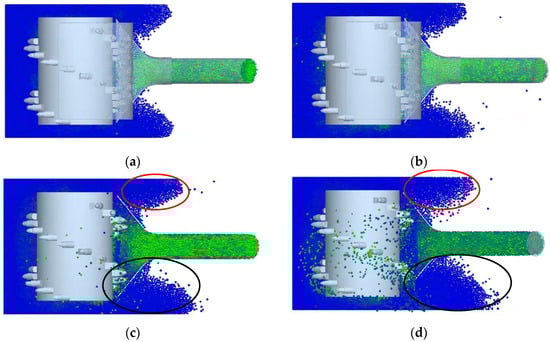
Figure 15.
Top view of the instantaneous state of particles at different drum speeds: (a) 15 r/min; (b) 30 r/min; (c) 45 r/min; (d) 60 r/min.
4.3.3. The Influence of Drum Speed on Ore Collection Performance
The instantaneous mass flow rate at the outlet at different speeds is shown in Figure 16. We can see that the curves of the mass flow rate over time are similar under the four operating conditions and can be roughly divided into three stages. In the initial stage, no particles were detected passing through the outlet because it takes some time for particles to move from the deposit to the outlet; in the second stage, the amount of particles passing through the outlet increases; in the stable collection stage, the particle through the outlet shows oscillatory characteristics within a certain range. To more intuitively distinguish the influence of rotational speed on ore collection performance, the average mass flow rate during the stable collection stage was calculated and is shown in Figure 17.
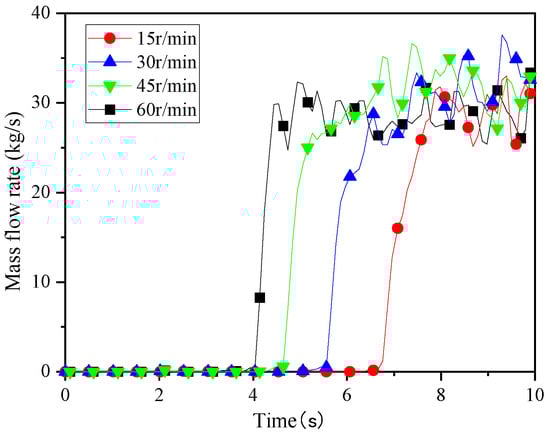
Figure 16.
Mass flow rate changes over time.
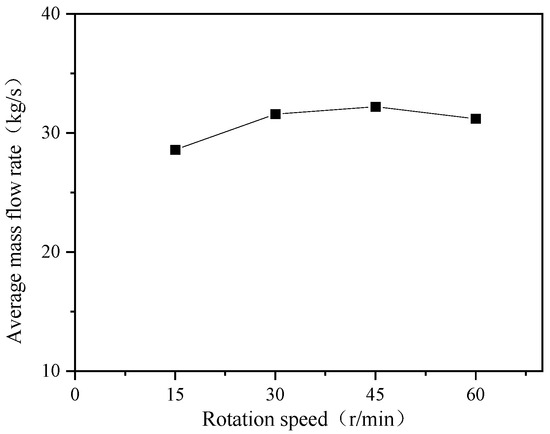
Figure 17.
Changes in mass flow rate with speed.
As the speed increases, the mass flow rate first increases and then decreases. As mentioned above, the rotation of the drum allows for uniform mixing of the particles, which facilitates ore collection. As shown in the figure, the mass flow rate at 45 rpm is 1.12 times the mass flow rate at 15 rpm. However, under the condition of limited cutting height of the ore bed, too high a speed will cause more particles to be brought to the front of the drum directly by the cutting teeth, which will be unfavorable for particle collection. Therefore, in practical engineering, it is necessary to control the drum speed within a reasonable range to ensure that the particle collection effect is improved without wasting energy.
The average particle velocity through the velocity sensor at the outlet are further summarized and shown in Figure 18. Like the mass flow rate, it increases and then decreases as the rotational speed increases. This is because higher drum speeds provide greater initial energy for particle collection, making it more favorable. However, excessive initial movement of the particles due to drum rotation will have a negative effect on the suction of the fluid. Overall, the rotation of the drum has some effect on particle lifting. However, within the normal speed range of the bowl, its effect is relatively limited.
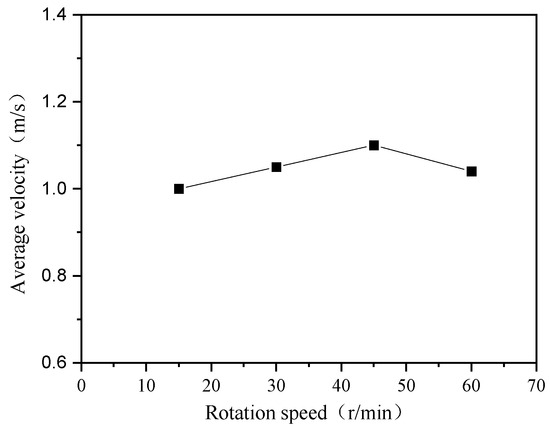
Figure 18.
Variation in outlet velocity with RPM.
5. Preliminary Assessment of Simulation Results
5.1. Experimental Setup and Materials
In order to assess the accuracy of the simulation results and the feasibility of the integrated collecting device, an experimental platform was built to perform the collection of SMS ores. However, the experimental system was designed and completed with a certain scaling ratio due to limited conditions. For the engineering flow problem investigated in this paper, the geometric, kinematic, and dynamic similarities between the model and the prototype must be satisfied. Based on the similarity theory, the similarity criteria between the model and the prototype are determined as shown in Table 3, where the similarity ratio between the model and simulation model is set as = 1:2.5.
Table 3.
Similarity ratios of the correlation parameters of the similarity model.
As shown in Figure 19, the experimental system consists of an observation tank, an execution device, a measurement and control system, etc., which can perform functions such as lateral movement of the collecting device, lifting and lowering of the collecting device, rotation of the drum, and conveying of the particle mixture. The drum was 3D printed from resin and is driven by an electric motor. The lateral movement of the collection head is driven by a winch and moves forward on the H-shaped guide rail at a constant speed. The drum lift is manually adjusted by a worm gear mechanism. The mixture is conveyed by a self-priming pump with a maximum flow rate of 100 m3/h.
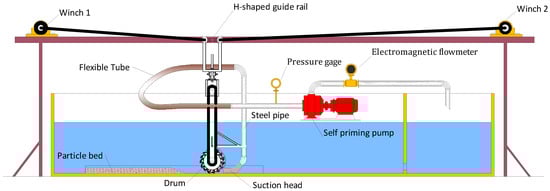
Figure 19.
Experimental configuration.
In ore collection similarity experiments, particle similarity must be considered. According to the particle motion equation and density criterion, when the fluid properties in similar systems are consistent, it is necessary to ensure that the particle density in the model and prototype systems are consistent and that the particle size similarity ratio is the same as the geometric similarity ratio. Thus, black gravel was selected as the simulated ore with a density of 2.67 × 10³ kg/m3, which is close to the average density of SMS. Sieving tests were then conducted at a scaling ratio of 1:2.5 based on the particle size distributions in Table 2, followed by mixing of particles of different sizes according to the mass percentages in Table 2 to form simulated ores. Figure 20 presents the arrangement of the experimental platform and the simulated ore, where the simulated ore is placed in a slot with a width of 600 mm and a default height of 100 mm for the ore.
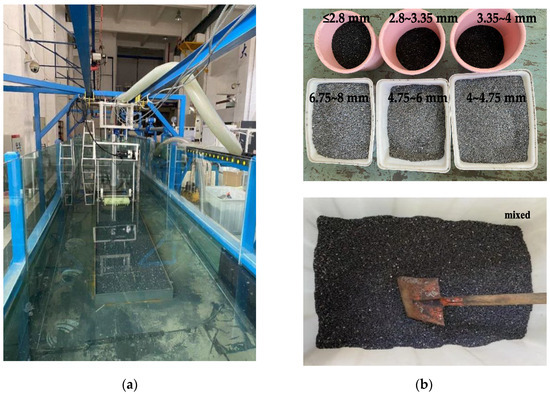
Figure 20.
Experimental system: (a) experimental platform; (b) simulated ore.
5.2. Experimental Assessment
Since the similarity ratio between the experimental model and the numerical model is 1:2.5, the working parameters and results between them should also be converted according to Table 3. In this work, experiments and simulations were performed for two cases, and detailed operating parameters are shown in Table 4.
Table 4.
The working parameters of the experiment and simulation.
As the collecting device advances forward over the particle bed, a trench (Figure 21a) is formed in the particle bed as a result of fluid suction and the mixture (Figure 21b) is collected at the outlet. Then, the mass flow rate and volume concentration under the stable collection stage of the experiments and the numerical models are obtained and compared. Here, the volume concentration is calculated by using the mass–volume method with the following equation:
wherein denotes the total mass of particles passing through the outlet per unit time and is the total volume of mixture passing through per unit time, which can be calculated by multiplying the cross-sectional area with the flow rate in the simulation. To eliminate the influence of the initial state, the above calculation is based on the stable collection stage.
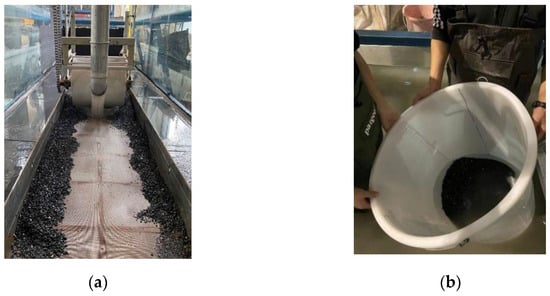
Figure 21.
Experimental result: (a) the grooves formed on the particle bed; (b) collected particles (most of the water was removed).
As shown in Table 5, the mass flow rate in Case 2 is higher than in Case 1 due to the higher suction velocity at the outlet, but in terms of volumetric concentration, the value for Case 2 is actually lower. This is because, with a limited supply of particles, higher suction velocities lead to an increase in the water content of the inhalation, which reduces the particle concentration. The errors in the experiment and simulation are very small in these two cases, with a maximum error of not more than 10%. Therefore, it can be concluded that the hydraulic ore collection simulation model established based on the solid–liquid two-phase flow method has high accuracy.
Table 5.
Results comparison of the experiment and simulation.
6. Conclusions
This study focuses on the collection of SMS ores containing coarse particles and conducts in-depth research on the collection process with a device combining a rotary crushing head and a flat suction mouth. This article adopts the CFD-DEM coupling method for modeling and establishes a similarity experimental model to assess the accuracy of the simulation method. The conclusions and recommendations are as follows:
- (1)
- For an SMS ore with a density of 2670 kg/m3 and a maximum diameter of 20 mm, effective collection can be achieved when the outlet flow velocity of the suction head is 3 m/s.
- (2)
- The collection process of deep-sea seafloor massive sulfide mainly goes through three stages: particle disturbance start-up, partial particle influx, and stable collection. The particle collection tracks have randomness. In addition, excessive rotation speed of the drum will cause particle splashing, which is unfavorable to the ore collection.
- (3)
- Appropriately increasing the drum rotation speed is conducive to improving the hydraulic ore collection efficiency, such as 45 r/min ore collection efficiency compared to 15 r/min to improve 11.2%. However, too high a rotational speed will reduce the ore collection performance. Therefore, in practical application, it is necessary to set the drum speed within a reasonable range.
- (4)
- The numerical results are in good agreement with the experimental results, which not only indicates the accuracy of the numerical simulation method but also demonstrates the feasibility of the collecting device.
Since this study does not consider factors such as high pressure and low temperature, there may be some discrepancy between the simulation model and real seabed mining. Further optimization of the structure and parameters is also necessary to improve the collection efficiency and reduce the energy consumption. In addition, how to crush the ore into small particles that meet the collection requirements after the first cut is an issue worthy of in-depth consideration.
Author Contributions
This paper emerged from the long-term cooperation of the authors. Conceptualization, Y.L. and H.D.; methodology, H.D.; test and analysis, H.D.; writing—original draft preparation, H.D.; writing—review and editing, Y.L. All authors have read and agreed to the published version of the manuscript.
Funding
This research was supported by the Hunan Provincial Natural Science Foundation of China, grant number 2021JC0014.
Institutional Review Board Statement
Not applicable.
Informed Consent Statement
Not applicable.
Data Availability Statement
Data are contained within the article.
Conflicts of Interest
The authors declare that they have no known competing financial interests or personal relationships that could have appeared to influence the work reported in this paper.
References
- Lusty, P.A.J.; Murton, B.J. Deep-ocean mineral deposits: Metal resources and windows into earth processes. Elements 2018, 14, 301–306. [Google Scholar] [CrossRef]
- Petersen, S.; Krätschell, A.; Augustin, N.; Jamieson, J.; Hein, J.R.; Hannington, M.D. News from the seabed—Geological characteristics and resource potential of deep-sea mineral resources. Mar. Policy 2016, 70, 175–187. [Google Scholar] [CrossRef]
- Webber, A.P.; Roberts, S.; Murton, B.J.; Mills, R.A.; Hodgkinson, M.R.S. The formation of gold-rich seafloor sulfide deposits: Evidence from the beebe hydrothermal vent field, cayman trough. Geochem. Geophys. Geosyst. 2017, 18, 2011–2027. [Google Scholar] [CrossRef]
- Leng, D.X.; Shao, S.; Xie, Y.C.; Wang, H.H.; Liu, G.J. A brief review of recent progress on deep sea mining vehicle. Ocean Eng. 2021, 228, 108565. [Google Scholar] [CrossRef]
- Wu, Q.; Yang, J.M.; Lu, H.N.; Lu, W.Y.; Liu, L. Effects of heave motion on the dynamic performance of vertical transport system for deep sea mining. Appl. Ocean Res. 2020, 101, 102188. [Google Scholar] [CrossRef]
- Hein, J.R.; Mizell, K.K.A.; Conrad, T.A. Deep-ocean mineral deposits as a source of critical metals for high-and green-technology applications: Comparison with land-based resources. Ore Geol. Rev. 2013, 51, 1–14. [Google Scholar] [CrossRef]
- Tao, C.H.; Li, H.M.; Jin, X.B.; Zhou, J.P.; Wu, T.; He, Y.H.; Deng, X.; Gu, C.H.; Zhang, G.Y.; Liu, W.Y. Seafloor hydrothermal activity and polymetallic sulfide exploration on the southwest indian ridge. Sci. Bull. 2014, 59, 2266–2276. [Google Scholar] [CrossRef]
- Zhao, G.C.; Xiao, L.F.; Peng, T.; Zhang, M.Y. Experimental research on hydraulic collecting spherical particles in deep sea mining. Energies 2018, 11, 1938. [Google Scholar] [CrossRef]
- Xia, Q.; Jia, H.; Sun, J.; Cui, J. Study on flow characteristics of hydraulic suction of seabed ore particles. Processes 2023, 11, 1376. [Google Scholar] [CrossRef]
- Chen, Y.X.; Xiong, H.; Cheng, H. Experimental study on the incipient motion of a single spherical particle in hydraulic collecting. J. Cent. South Univ. (Sci. Technol.) 2019, 50, 2831–2839. [Google Scholar]
- Chen, Y.X.; Xiong, H.; Cheng, H.; Yu, C.L.; Xie, J.H. Effect of particle motion on the hydraulic collection of coarse spherical particles. Acta Mech. Sin. 2020, 36, 72–81. [Google Scholar] [CrossRef]
- Hong, S.; Choi, J.S.; Kim, J.H.; Yang, C.K. Experimental study on hydraulic performance of hybrid pick-up device of manganese nodule collector. In Proceedings of the Third ISOPE Ocean Mining Symposium, Goa, India, 8–10 November 1999; pp. 69–77. [Google Scholar]
- Yue, Z.Y.; Zhao, G.C.; Xiao, L.F.; Liu, M.Y. Comparative study on collection performance of three nodule collection methods in seawater and sediment-seawater mixture. Appl. Ocean Res. 2021, 110, 102606. [Google Scholar] [CrossRef]
- Jia, H.; Yang, J.; Su, X.; Wang, Y.; Wu, K. Flow characteristics and hydraulic lift of coandă effect-based pick-up method for polymetallic nodule. Coatings 2023, 13, 271. [Google Scholar] [CrossRef]
- Alhaddad, S.; Mehta, D.; Helmons, R. Mining of deep-seabed nodules using a coandă-effect-based collector. Results Eng. 2023, 17, 100852. [Google Scholar] [CrossRef]
- Wang, P.J.; Li, L.; Wu, J.B. Research on the lightweight structural optimization design of the front collector of the polymetallic nodule miner. Ocean Eng. 2023, 113275, 113275. [Google Scholar] [CrossRef]
- Xie, C.; Wang, L.; Yang, N.; Agee, C.; Chen, M.; Zheng, J.R.; Liu, J.; Chen, Y.X.; Xu, L.X.; Qu, Z.G.; et al. A compact design of underwater mining vehicle for the cobalt-rich crust with general support vessel part a: Prototype and tests. J. Mar. Sci. Eng. 2022, 10, 135. [Google Scholar] [CrossRef]
- Liu, S.J.; Hu, J.H.; Zhang, R.Q.; Dai, Y. Development of mining technology and equipment for seafloor massive sulfide deposits. Chin. J. Mech. Eng. 2016, 29, 863–870. [Google Scholar] [CrossRef]
- Orita, K.; Seiya, K.; Nakamura, S.; Igarashi, Y.; Shiokawa, S.; Nojiri, S.; Ueyama, Y.; Watanabe, K. Development of new mining machine for cobalt-rich ferromanganese crust and achievement of excavation and dredging test on the deep seafloor. In Proceedings of the Thirty-Second (2022) International Ocean and Polar Engineering Conference, Shanghai, China, 5–10 June 2022. [Google Scholar]
- Dai, H.; Li, Y.; Li, M.D. Experimental study on failure mechanical properties of two kinds of seafloor massive sulfides. Minerals 2021, 11, 1144. [Google Scholar] [CrossRef]
- Spagnoli, G.; Jahn, A.; Halbach, P. First results regarding the influence of mineralogy on the mechanical properties of seafloor massive sulfide samples. Eng. Geol. 2016, 214, 127–135. [Google Scholar] [CrossRef]
- Yamazaki, T.; Park, S. Relationships between geotechnical engineering properties and assay of seafloor massive sulfides. In Proceedings of the Thirteenth (2003) International Offshore and Polar Engineering Conference, Honolulu, HI, USA, 25–30 May 2003. [Google Scholar]
- Shama, R. Deep-Sea Minig; Springer International Publishing: Berlin/Heidelberg, Germany, 2017. [Google Scholar]
- Liu, S.J.; Hu, J.H.; Dai, Y.; Hu, Q.; Lv, T. Flow field analysis and parameter optimization of deep-sea collector of SMS. J. Cent. South Univ. (Sci. Technol.) 2017, 48, 1120–1198. [Google Scholar]
- Li, Y.; He, J. Numerical simulation of solid-liquid two-phase flow of the gathering process of seafloor massive sulfide. J. Cent. South Univ. (Sci. Technol.) 2022, 53, 461–470. [Google Scholar]
- Crowe, C.T.; Sommerfield, M.; Tsuji, Y. Multiphase Flows with Droplets and Particles; CRC Press: Boca Raton, FL, USA, 2012. [Google Scholar]
- Brown, P.P.; Lawler, D.F. Sphere drag and settling velocity revisited. J. Environ. Eng. 2003, 129, 222–231. [Google Scholar] [CrossRef]
- Mei, R. An approximate expression for the shear lift force on a spherical particle at finite reynolds number. Int. J. Multiph. Flow 1992, 18, 145–147. [Google Scholar] [CrossRef]
- Renzo, A.D.; Maio, F.P.D. Comparison of contact-force models for the simulation of collisions in dem-based granular flow codes. Chem. Eng. Sci. 2004, 59, 525–541. [Google Scholar] [CrossRef]
Disclaimer/Publisher’s Note: The statements, opinions and data contained in all publications are solely those of the individual author(s) and contributor(s) and not of MDPI and/or the editor(s). MDPI and/or the editor(s) disclaim responsibility for any injury to people or property resulting from any ideas, methods, instructions or products referred to in the content. |
© 2024 by the authors. Licensee MDPI, Basel, Switzerland. This article is an open access article distributed under the terms and conditions of the Creative Commons Attribution (CC BY) license (https://creativecommons.org/licenses/by/4.0/).