Article

Analysis of Fluid Suction Characteristics of Polyhedral Particles in Deep-Sea Hydraulic Collection Method

1
School of Mechanical and Electrical Engineering, Central South University, Changsha 410083, China
2
State Key Laboratory of Safety Technology for Metal Mines, Changsha Mining Research Institute Co., Ltd., Changsha 410010, China
3
School of Infrastructure Engineering, Dalian University of Technology, Dalian 116024, China
*
Author to whom correspondence should be addressed.
J. Mar. Sci. Eng. 2024, 12(9), 1543; https://doi.org/10.3390/jmse12091543
Submission received: 18 August 2024 / Revised: 31 August 2024 / Accepted: 2 September 2024 / Published: 4 September 2024
(This article belongs to the Special Issue Deep-Sea Mining Technologies: Recent Developments and Challenges)

Abstract

:
Deep-sea hydraulic collection is a key technology for seabed mineral resource extraction, offering higher efficiency and environmental protection compared to other collection methods. However, due to their complex characteristics, the suction properties and influencing factors of polyhedral particles in hydraulic suction collection remain elusive. This study utilized dimensionless methods and conducted experiments to analyze the flow characteristics in cone-shaped collection hoods and the distribution of suction force on polyhedral particles, and researched the effect of various parameters, such as Φ, H/R, R/S, and H/dp (referring to the nomenclature given in the last part of this paper), on the suction force coefficients of polyhedral particles based on the suction force coefficients of spheres by acquiring the suction coefficient ratio (kc). The results indicate the following: (1) the presence of suction and coherent vortices in the horizontal positions of 0.1R to 0.2R within the central region, which move with changes in pump suction or cove height, benefiting particle collection; (2) the particle suction force (Fd) decreases with increasing sphericity (Φ), with a more pronounced decline in high-speed flow fields, exhibiting two peaks and one trough in the Fd curve within the hood’s flow field; (3) the kc generally increases with decreasing Φ at the same collection position, showing increasingly stable fluctuations, and kc is sensitive to surrounding flow velocities with a rapid growth trend at higher speed, revealing that the suction coefficient (Cd) of polyhedral particles is significantly larger than that of spherical particles with increasing flow speed in high-speed flow fields; (4) Fd decreases with increasing H/dp, with a noticeable slowdown when H/dp exceeds 3.5. This study reveals the force characteristics and influencing factors of non-spherical coarse particles in hydraulic suction collection flow fields, providing insights for the development of collection technologies and equipment for deep-sea solid mineral resources, particularly irregular coarse particles.

1. Introduction

The ocean harbors vast mineral resources. Among these, polymetallic manganese nodules (PMNs), cobalt-rich crusts (CRCs), and seafloor massive sulfide (SMS) are three recognized seabed mineral resources, which are rich in cobalt, manganese, copper, and nickel [1]. As terrestrial reserves diminish and human activity demands increase, deep-sea mineral resources are increasingly considered among the most promising alternatives and vital pathways for global sustainable development [2,3]. Since the 1960s, to obtain these resources, Western developed countries, represented by the United States, have developed deep-sea mining robot technology and commercial mining schemes [4], investing substantial financial and human resources to develop mining equipment, and achieving major successes [5]. Recently, with advances in deep-sea engineering technologies, deep-sea mining has regained prominence as a hotspot of interest [6,7]. Due to variations in ore body characteristics and deposit topography, the mining methods employed differ among the three types of mineral resources, and the complex geological characteristics and ore body properties of CRCs or SMS present greater challenges compared to PMNs [8].
Figure 1 illustrates deep-sea mining systems for mining CMC or SMS resources, comprising mineral lifting devices, relay stations, deep-sea mining robots, and mining vessels. In the mining system, deep-sea mining robots play a pivotal role in the collection of ore from the seabed to the vessel, thereby influencing the overall structure and composition of the deep-sea mining system. A mining robot scheme for SMS was proposed by Nautilus Minerals [9], and there are three robots mining the deposit, two of which are used to crush the rock, and another robot gathers the ore. Because of the complex geological characteristics and ore body properties of CRCs or SMS, a deep-sea mining robot was equipped with a crusher and a collector for acquiring CRC mineral particles in China [10], and a further sea trial was conducted in 2019, verifying the capacity of the hydraulic equipment for collecting crushed CRCs. The crusher located at the front of the mining robot is used to dig and crush the rock, and the collector placed at the rear of mining robot gathers the ore and feeds it to the buffer. Before they are picked up by the collection device, the minerals attached to the bed rock need to be crushed into irregular particles by the crush robot. However, the surface morphology characteristics of mineral particles, their disorganized, scattered distribution, and wavy terrain seriously affect collection. Therefore, the question of how to ensure high efficiency and high collection rates for irregular particles is an important technological challenge.
Recently, as critical parts of the front-end process in deep sea mining, collection devices were developed rapidly and applied by using a range of collection methods, including mechanical collection, airlift pumps, and hybrid collection [11,12]. Among these, hydraulic mining is recognized as the most efficient and environmentally friendly method [13]. As early as the 1980s, offshore trials validated the scientific rigor and reliability of hydraulic mining methods [14]. Currently, mainstream hydraulic collection methods include suction, attachment, and jetting–suction approaches [15,16].
To further elucidate the operational mechanisms and principles of hydraulic collection, subsequent scholars have conducted in-depth research using experimental models. Alhaddad et al. [17] explored the hydraulic collection method based on the Coandă effect through a series of experimental studies, highlighting the critical role played by pressure gradients in nodule elevation. Chen et al. [18] investigated the particle initiation characteristics in direct pipe hydraulic collection, analyzing flow field characteristics during particle initiation under various conditions. For multiple particles, El-Sapa et al. [19,20] researched the motion of spherical particles in fluid flow under the Stokesian approximation, and analyzed numerical results for the normalized drag force acting on each particle, with rapid convergence for various values. Zhao et al. [21] studied the stress laws of manganese nodules under suction flow fields, summarizing the relationships between particle forces, sizes, positions, and other variables, and conducted numerical simulations on the vertical forces and flow characteristics of individual spherical mineral particles under different mining conditions. Xiong et al. [22] employed numerical simulation methods to study the suction process of a single sphere in a straight pipe.
Current research on hydraulic collection primarily focuses on PMN, with limited studies on the hydraulic collection of SMS and CRCs. However, SMS and CRCs are also extremely important mineral resources, especially CRCs, whose cobalt content is tens of times that of land-based mines, and deep-sea reserves are thousands of times those of the total land reserves. With the rapid development of new energy and electronic products, the overall lack of cobalt metal on land has made it an important strategic metal in the world. Therefore, the related research on CRC and SMS collection technology is vital.
As is well known, SMS and CRCs must be peeled and crushed into irregular particles before collection. However, complex particles affect the efficiency of particle collection, and research on the rules of influence on the hydraulic collection of non-spherical particles is difficult. Therefore, most of the research objects are spherical or ellipsoidal. Particles move with a relative velocity in a fluid field, and the suction force characteristics of particles are affected by various factors, particularly for irregular particles, whose shape and surface area play crucial roles in the suction force [23]. The motion of non-spherical particles in fluid is also a relatively common phenomenon in reality. Given that the shapes of broken particles in the above two kinds mineral resources often differ significantly from spherical shapes, significant errors may occur if crushed polyhedral ore materials are treated as spherical particles in research.
The characteristics of the suction force and suction coefficient are two key physical quantities in the suction characteristics of particles in hydraulic collection, and the suction characteristics of spherical particles were acquired through the results of research on spherical particles, which was carried out by Zhao [12,24] and Xiong [22]. However, it was difficult to apply the empirical formulas or fluid-solid flow model of spherical spheres directly to non-spherical particles. Therefore, the suction force coefficient ratio (kc), a ratio of the suction force coefficient of polyhedral particles to that of spherical particles, was introduced to study the suction coefficient and suction force relation between sphere particles and polyhedron particles. Next, the influence of the suction coefficient and the suction force of polyhedral particles was established under different parameter conditions, based on the suction characteristics of the spheres.

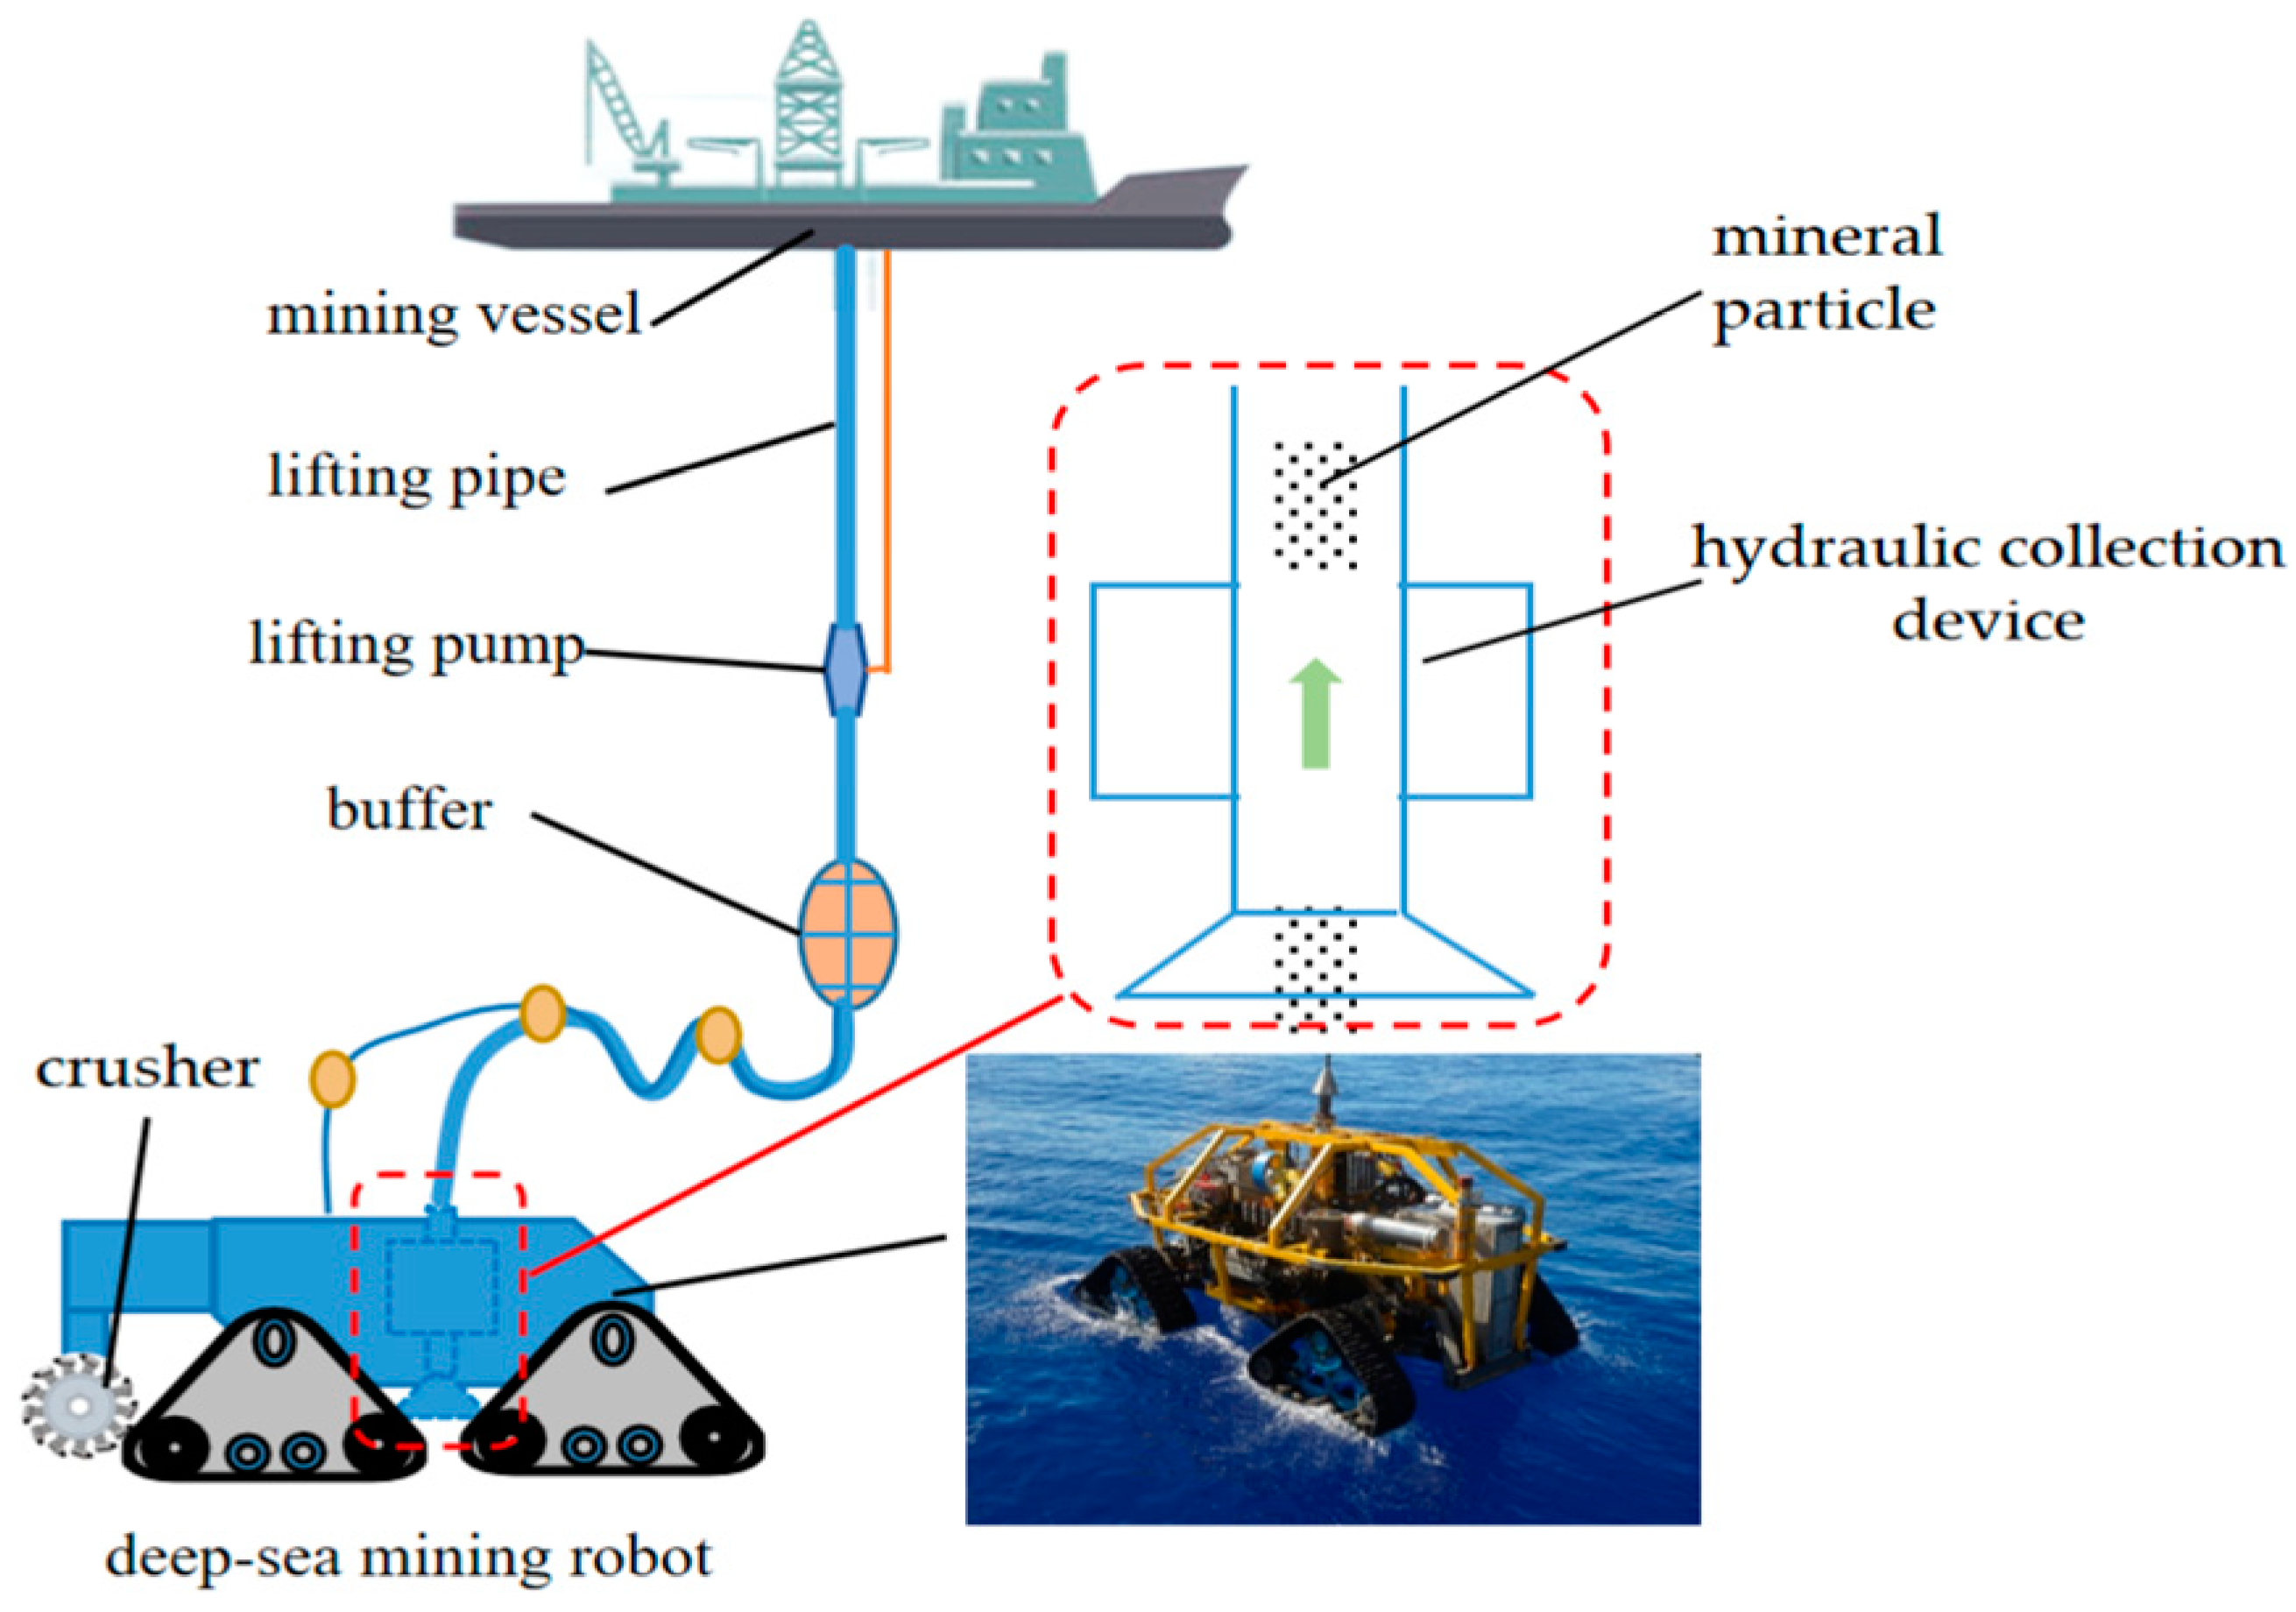
2. The Characteristics of a Suction-Based Hydraulic Collection Method

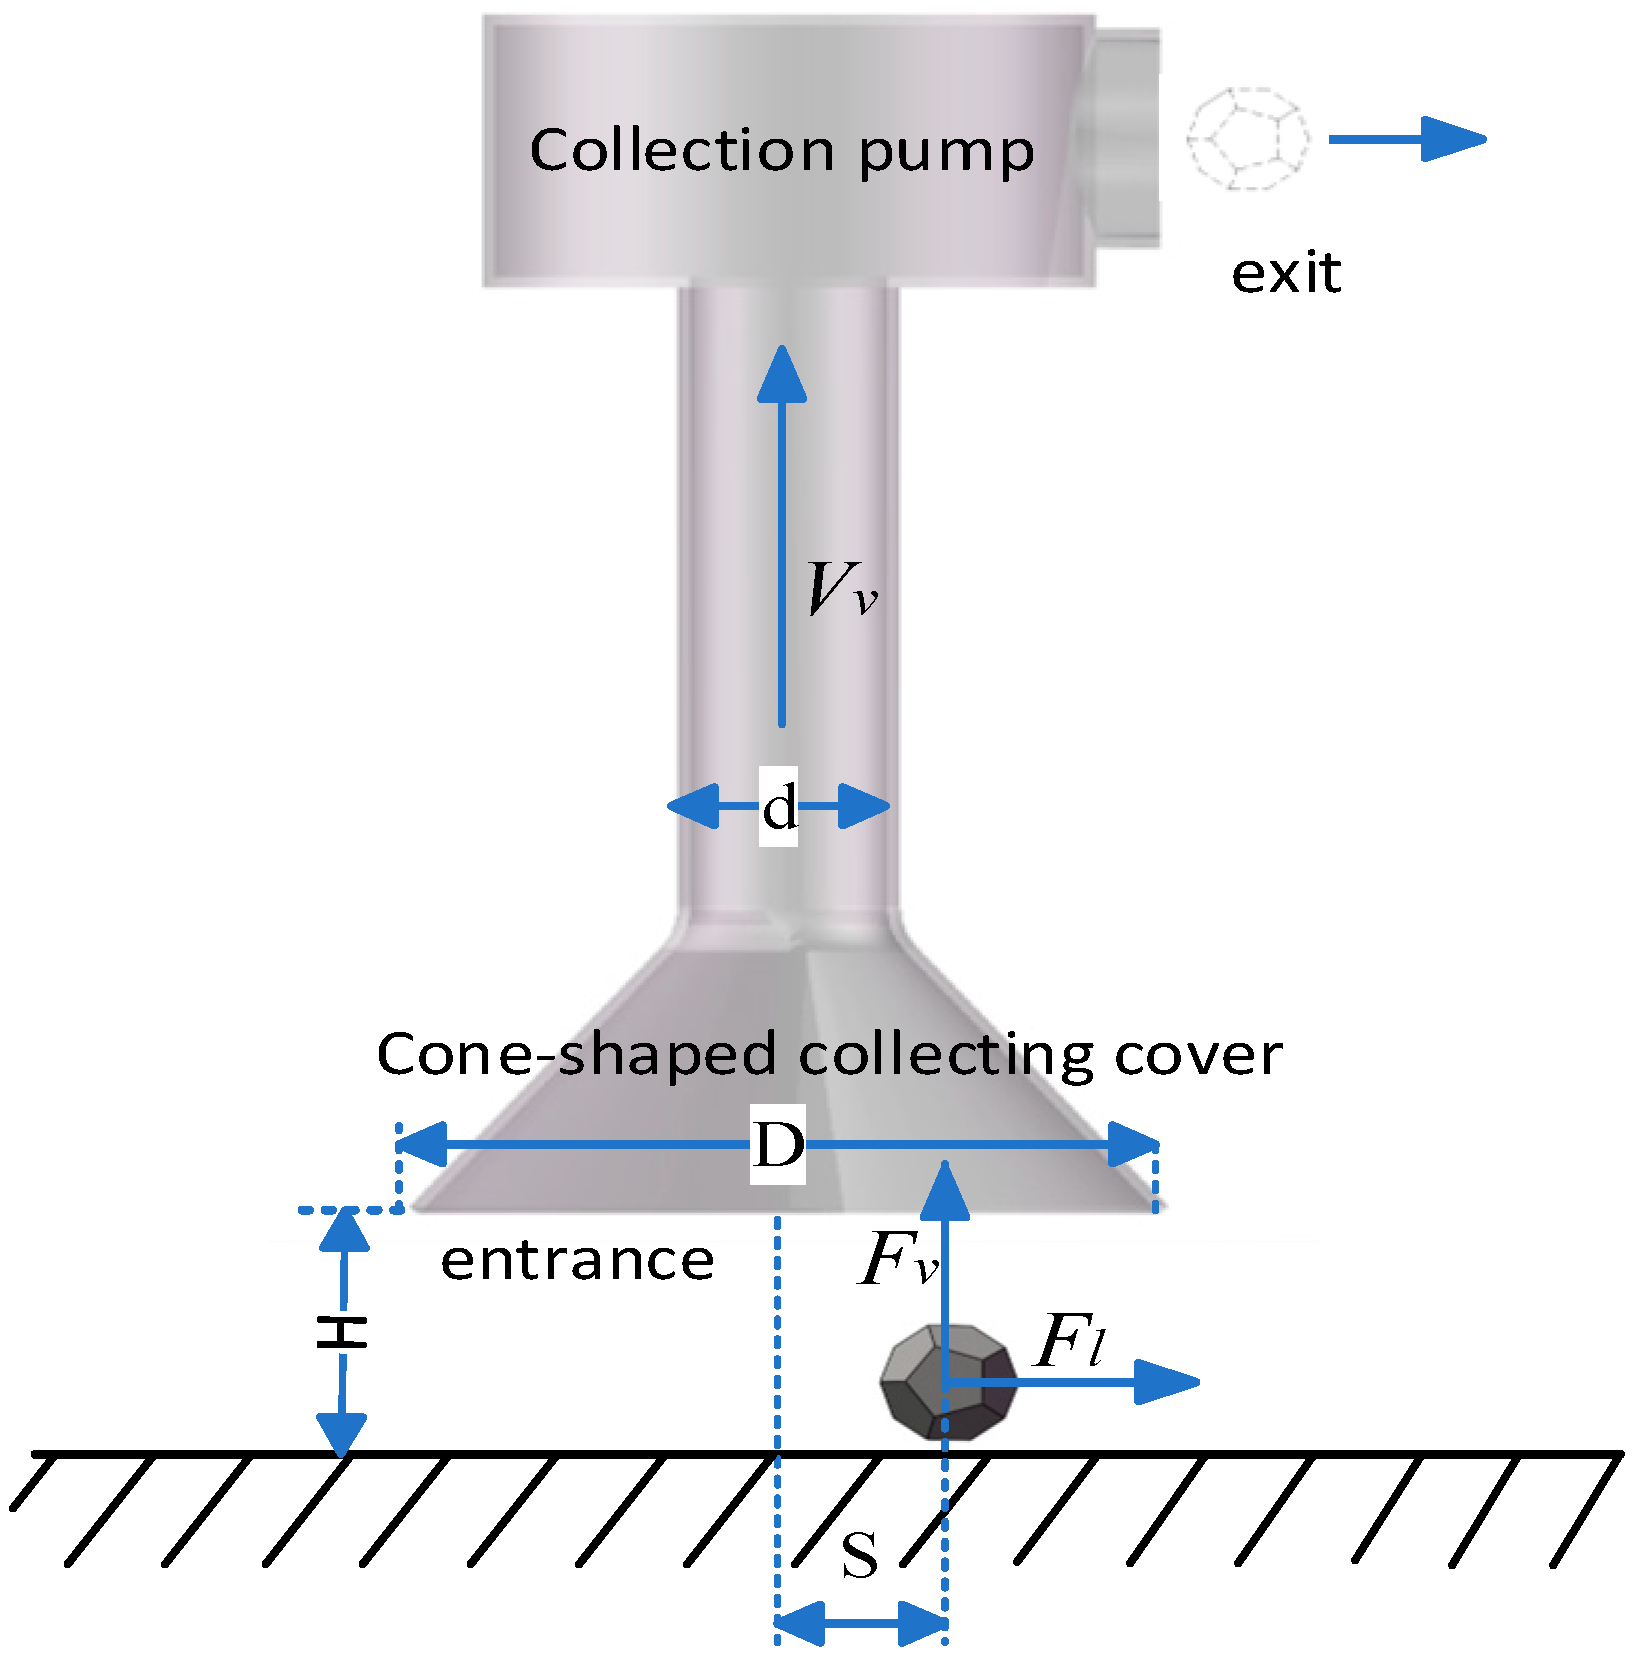
2.1. The Hydraulic Collection Model

Hydraulic collection is a key technology for seabed mineral extraction. Its basic principle relies on the hydrodynamic effects of water flow to collect solid seabed mineral particles in granular form and transport them to storage bin. As illustrated in Figure 2, water serves as the primary medium for particle transport during the process of hydraulic particle collection. Under the suction action of the collection pump, water flows through the inlet of cone-shaped collection hood into the pump and exits through the delivery pipe outlet. Particles are subjected to the fluid forces of the flow field in the process. When the resultant force exceeds gravity and surface friction, there is sufficient lift to cause particles to detach from the seabed or roll on the seabed surface. This force initiates particle movement from the ground and is crucial for assessing the effectiveness of collecting particles through hydraulic mining devices.
Figure 2 illustrates a simplified model of particle hydraulic collection. The mineral particles, which are polyhedral in shape, are scattered on the seabed surface and collected into a cone-shaped collection hood using a suction collection method. The diameter of the transportation pipe is denoted as d. To further increase the mining area, the mining inlet is designed with a bellmouth shape with a diameter of D. The distance between the cone-shaped mining inlet and the seabed surface is H. A mining pump provides the hydrodynamic force for the system, with the water transport velocity denoted as Vv. The horizontal distance of the particle from the center of the mining hood is S. When the suction inlet acts on the particle as it leaves the seabed surface, due to the symmetrical circular structure of the cone-shaped collection hood, the overall mining flow field can be divided into axial and radial forces, allowing the complex three-dimensional force model to be simplified into a two-dimensional force model. Here, the axial force, denoted as Fv, acts upward in value and is primarily responsible for lifting the particles from the seabed. The radial force, represented as Fl in the horizontal direction, mainly manifests by pushing the particles to roll along the seabed surface.

2.2. Control Equations

Deep-sea hydraulic collection involves the theory of fluid–solid two-phase flow, employing the Euler–Lagrange method to effectively simulate the particle-fluid two-phase flow model. In this model, the continuous phase is the carrier water treated as an incompressible, homogeneous, and viscous Newtonian fluid described by the Navier–Stokes equations (N-S) [25]. Mass and momentum conservation equations govern fluid motion, incorporating forces exerted by particles. Hence, the governing equations for the liquid phase [26] can be expressed as follows:
ρ f t + u f = 0
u f t + u f u f = 1 ρ f p + v 2 u f + f g + f p f
where ρ f represents the liquid density, u f is the liquid velocity,   p denotes the liquid pressure, v is the kinematic viscosity of the liquid, t stands for time, f g is the gravitational force acting on the fluid, and f ρ f represents the total momentum exchange between particles and the fluid, encompassing frictional drag, additional resistance, lift force, etc., between the two phases. Given the assumption of constant density during the liquid motion, ρ f t = 0 .
The force acting on particles through the fluid is a reaction force from the fluid phase. According to Newton’s laws, the governing equations for the discrete phase can be derived as follows:
m s d v s d t = m s g + F f s + F c t
I s d ω s d t = M c t + M f s
where m s represents the particle mass, v s is the particle velocity, I s denotes the particle moment of inertia, ω s is the particle angular velocity, F f s is the force acting on the particle through the fluid, including fluid drag, fluid lift, pressure gradient force, added mass force, and Basset force, and F c t represents the force between particles.
In the pre-initiation stage of particles, there is no rotation, collision, acceleration, or high relative velocity of particles. Therefore, the total drag force for particle initiation mainly considers fluid resistance, pressure gradient force, and gravity. However, in actual experiments, the fluid resistance is a positive force, namely suction force. The gravity of particles has been zeroed out, so the drag force obtained is mainly related to factors associated with the ore-collecting flow field.

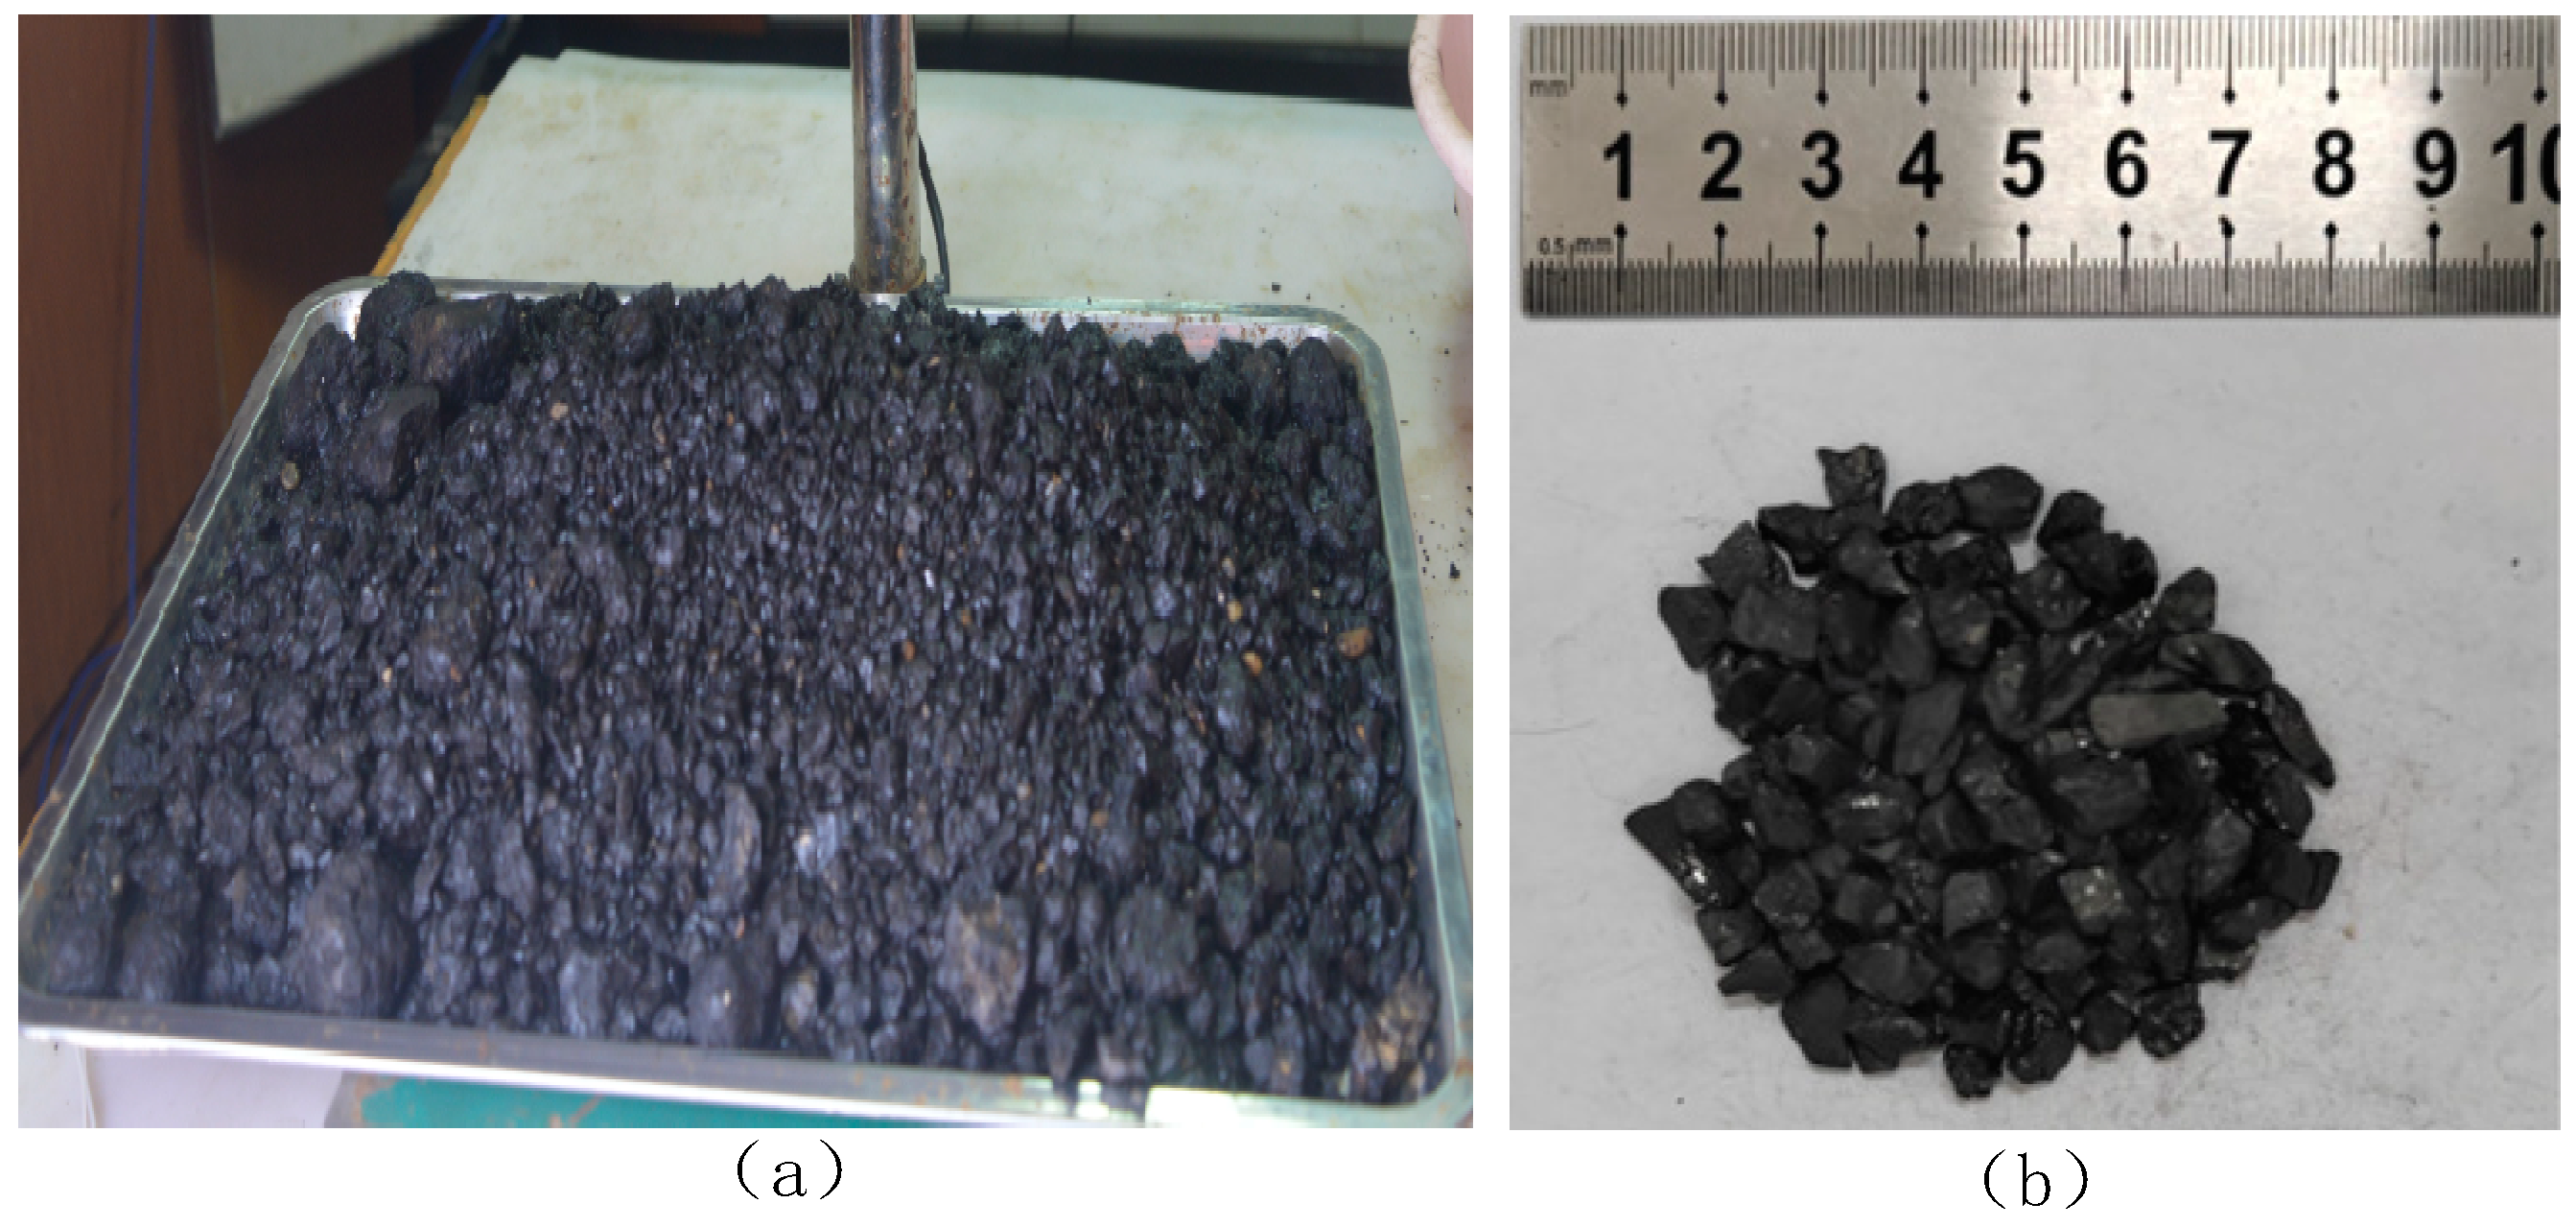
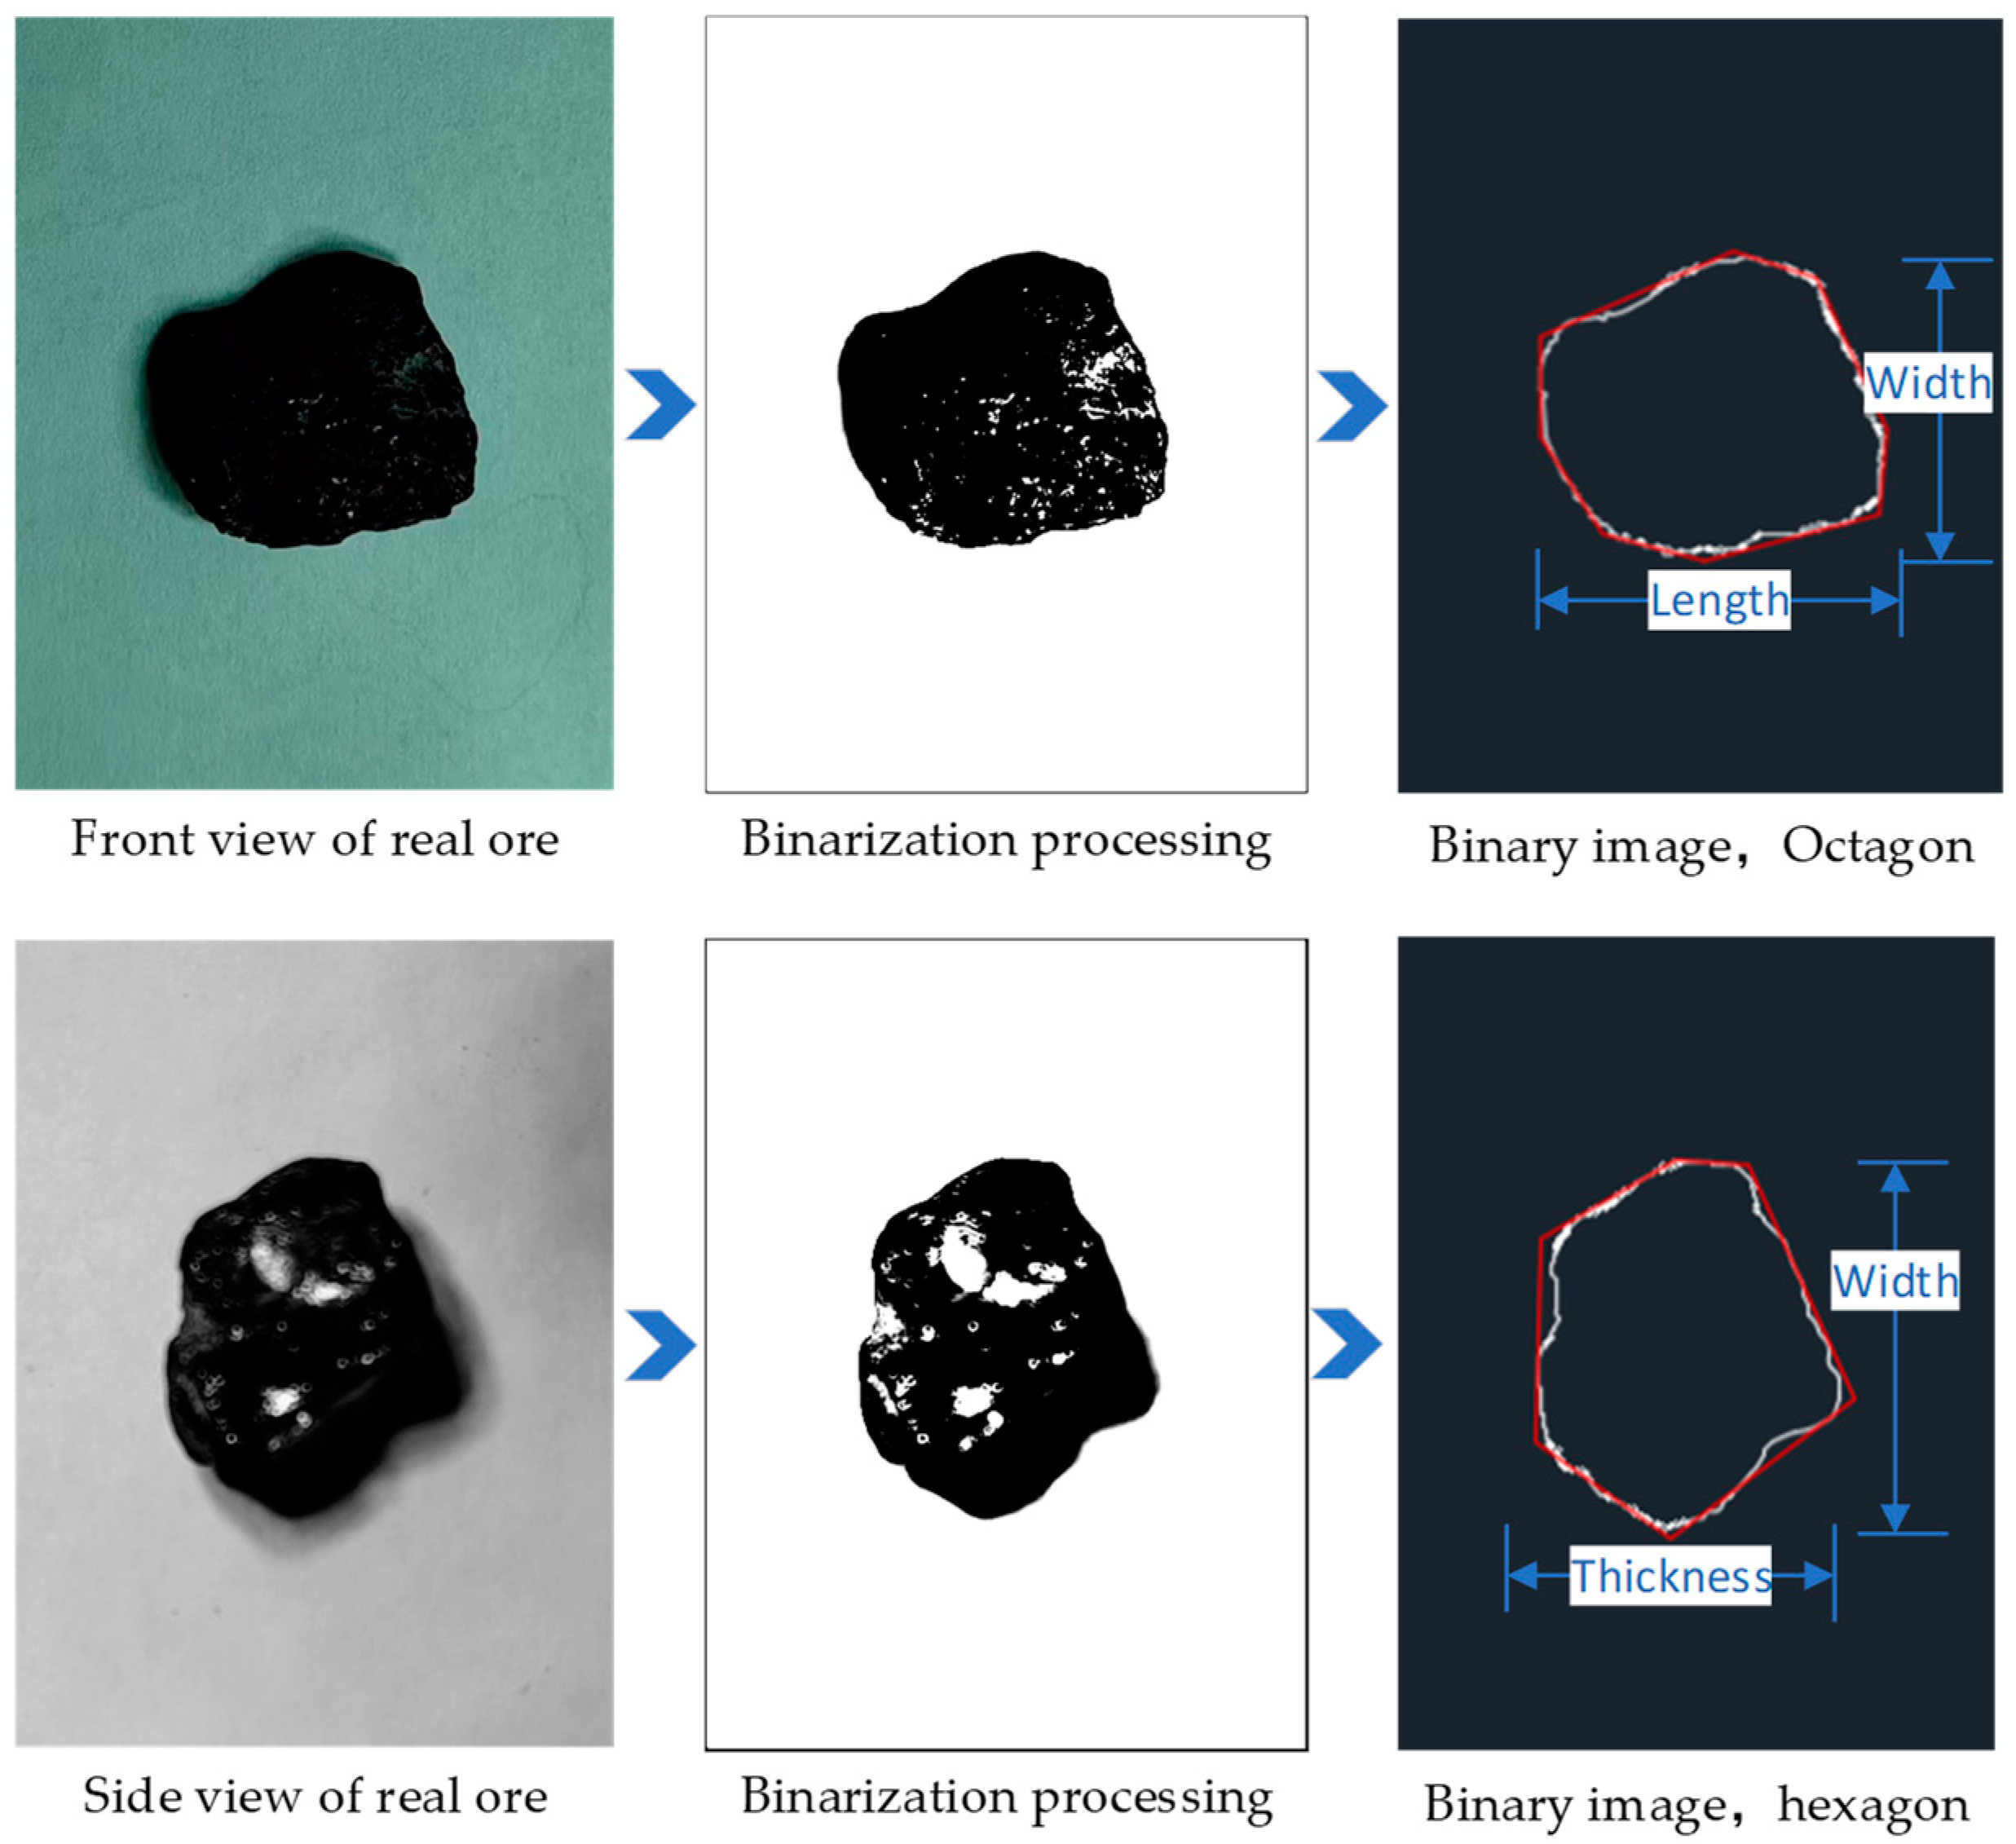
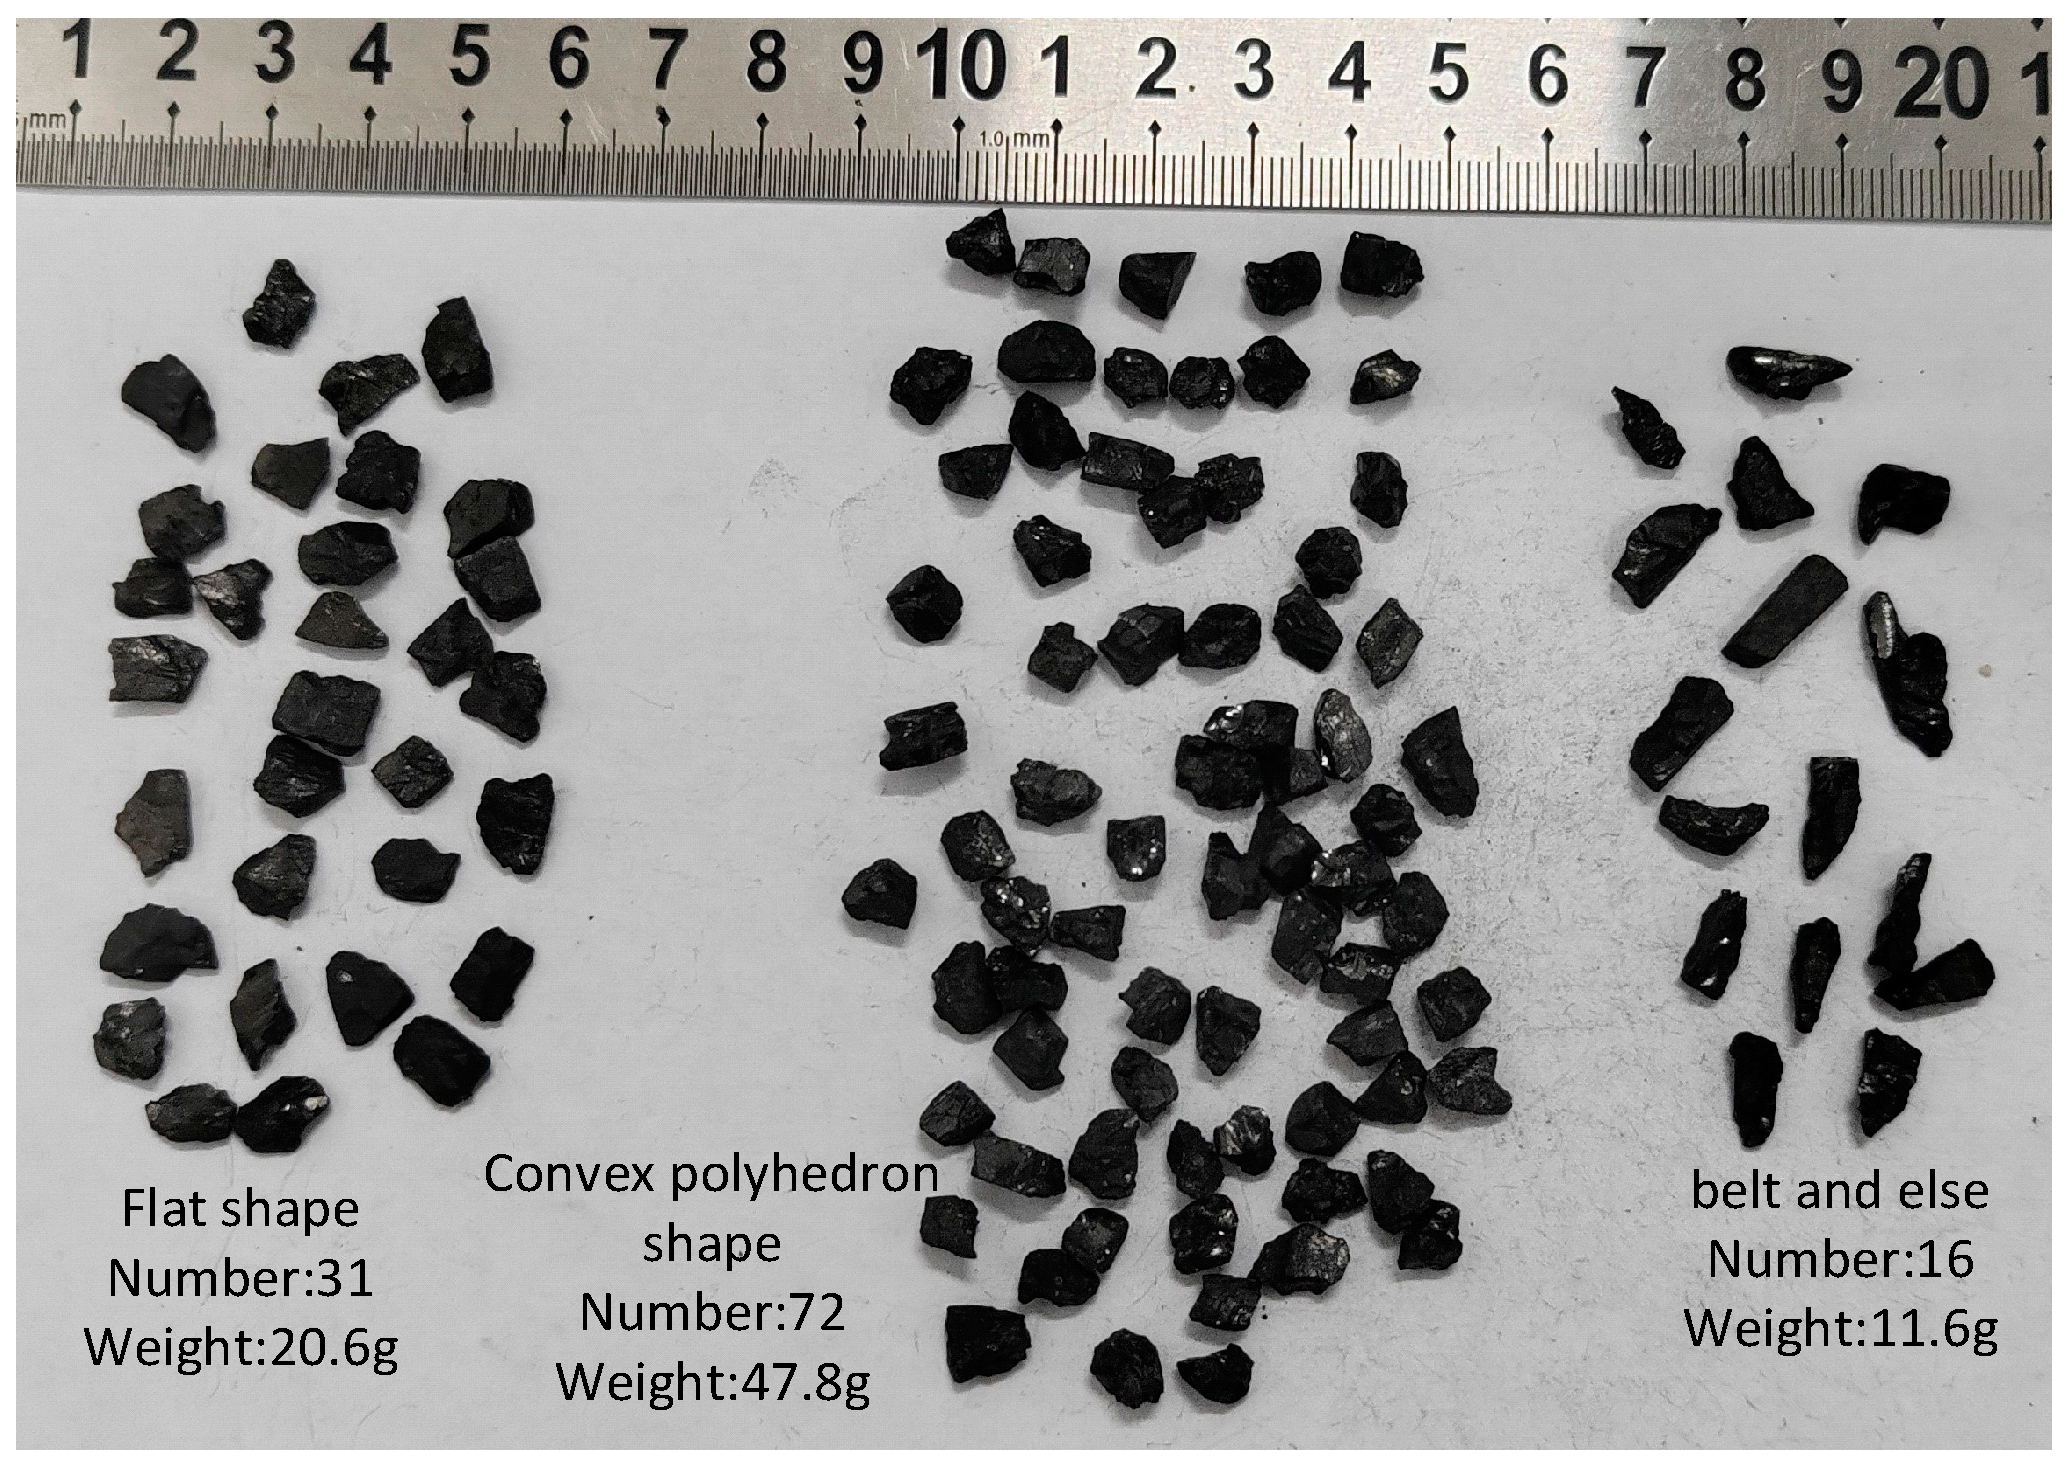
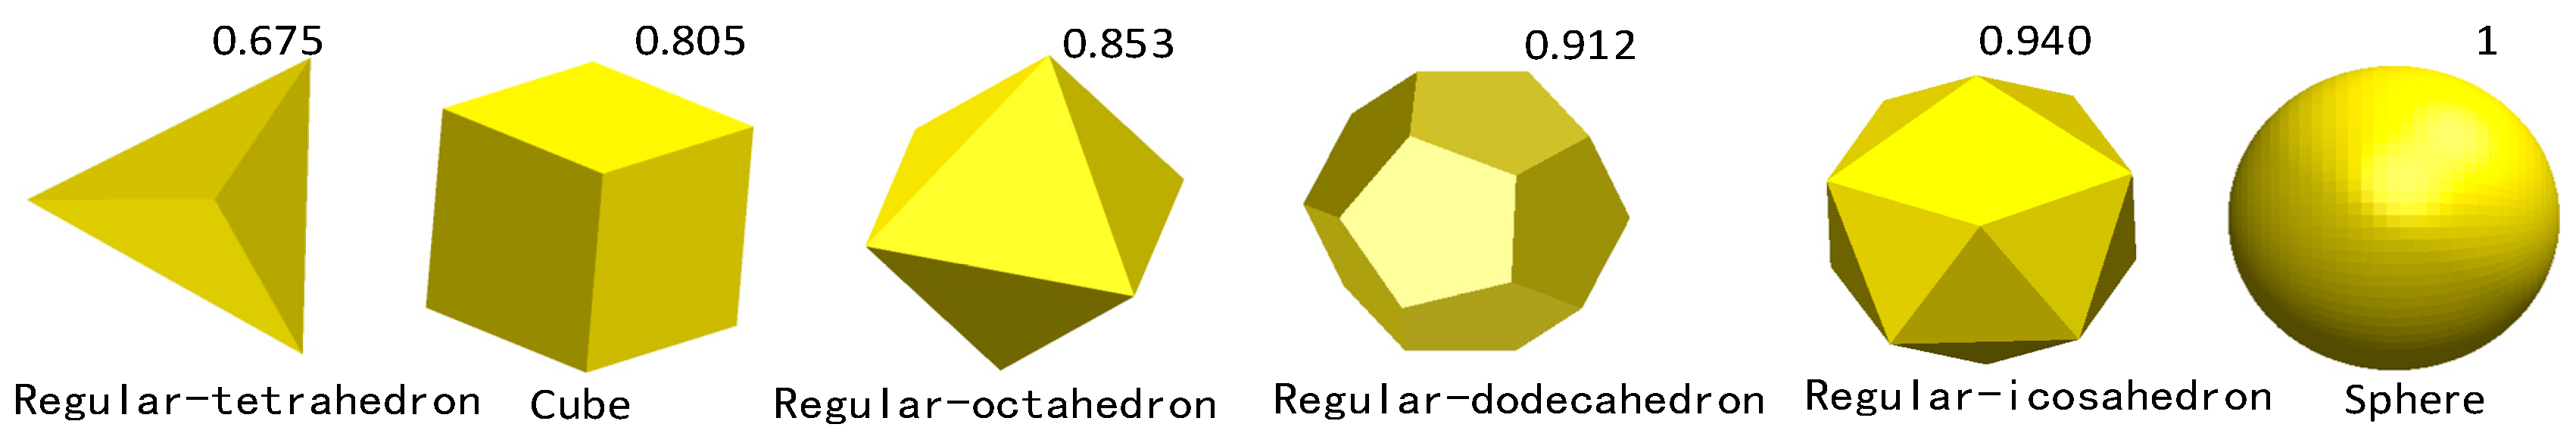
2.3. The Characters of Particles

Deep-sea cobalt-rich crust deposits are located on the surface layer of the bedrock, and the ore layer needs to be cut and crushed into mineral particles during the mining process. The distribution of particle shapes after stripping and crushing of the cobalt-rich crust ore material are shown in Figure 3a, and it can be observed that the particle characteristics after stripping and crushing of the cobalt-rich crust ore body are complex.
To further characterize the morphology of the particles, mineral particles with a diameter ranging from 0.005 to 0.010 m and weighing approximately 100 g were carefully selected using both sieve mesh and electronic balance, as illustrated in Figure 3b. Next, the shape of a particle was analyzed using particle shape extraction techniques to obtain shape characteristics, as shown in Figure 4, which revealed that the particles primarily exhibited polyhedral and multi-angular morphology.
After extraction of particle shapes, the size (length (L), width (W), and thickness (T)) of each particle were measured, and the form factors (elongation and flatness) were introduced to preliminarily classify the shape characteristics of particles. The elongation (e) was the ratio of W to L, while the flatness (f) was the ratio of T to L, which can be expressed as follows:
e = W L
f = T L
where L is the length of particle, W is the width of particle, T is the thickness of particle, e is elongation factor with a ratio of width to length, and f is flatness factor with a ratio of thickness to width. The length was defined as the maximum side of particle, while the thickness was defined as the minimum side.
According to Equations (5) and (6), as shown in Table 1, we acquired the e and f as follows.
According to the e and f in Table 2, these particles were divided into 3 parts based on the range of form factors, namely flat shape, approximate polyhedron, and belt and other. As depicted in Figure 5, the weight of approximate polyhedron particles with a number of 72 was 47.8 g, the weight of flat-shaped particles with a number of 31 was 20.6 g, and the weight of belt and other particles with a number of 16 was 11.6 g. Consequently, polyhedral particles constituted a significant proportion of the crushed mineral particles.
To further investigate the shape characteristics of non-spherical particles, the concepts of equivalent particle diameter d p and Wadell sphericity [27] were introduced, which can be expressed as follows:
d p = 6 V p π 3
= A s A p
where the equivalent particle diameter d p is the diameter of a sphere with the same volume as the non-spherical particle, V p is the actual volume of the non-spherical particle, is the wadell sphericity, A s is the surface area of a sphere with the same volume as the particle, and A p is the actual surface area of the particle.
In order to reduce the complexity of the particle shapes and decrease the research workload, a series of regular polyhedral structures were adopted as the research objects for hydraulic particle mining. Therefore, based on the properties of regular polygons and Euler’s formula on polyhedra, five types of geometric particle (tetrahedron, cube, octahedron, dodecahedron, and icosahedron) and spherical particles were adopted to represent real ore materials for research purposes.
As shown in Figure 6, it is visually apparent from the shapes of these polyhedrons that as the number of edges increases, the surface undergoes continuous deformation, gradually evolving towards a spherical surface, which, overall, conforms to the distribution characteristics of particle shapes.
The geometric characteristics of each regular polyhedron can be obtained using Equations (7) and (8) and geometric parameter relationships, as detailed in Table 3. From the sphericity values, it can be seen that as the number of faces increases, the sphericity value gradually approaches that of a sphere.

2.4. Analysis of Dimensionless Parameters

Polyhedral particles have more complex surfaces than spherical particles, and the fluid suction they experience during fluid motion is also more complex. Since there have been extensive studies and research results on spherical fluid drag force or suction force, in order to study the relationship between the suction coefficients of polyhedral particles and spherical particles under different factors, the ratio k c of the suction force coefficient of polyhedral particles to that of spherical particles is introduced. This study first adopts the dimensional analysis method to obtain the general law of the relationship between various physical quantities through experimental data analysis.
Based on the particle–fluid suction dynamics model, the physical quantities influencing particle suction and suction coefficient are analyzed. The primary parameters influencing the suction force coefficient ratio k c of particles in the flow field of the cone-shaped collection hood are as follows: fluid density ρ , the inlet radius R of the cone-shaped collection hood, the height H of the cone-shaped hood from the bottom, the average flow velocity V f around the particle, the fluid viscosity coefficient μ, the horizontal distance S of the particle from the center, the equivalent particle diameter d p , and the sphericity n of the particles. Thus, the relationship between the suction coefficient ratio k c and these physical parameters can be derived as follows:
f ( k c , ρ , μ , V f , R , H , S , d p , n )
Using the Buckingham Π theorem for dimensional analysis, the dimensionless quantities obtained are as follows:
π 1 = k c
π 2 = ρ V f d p μ = R e
π 3 = S R
π 4 = H d p
π 5 = R H
π 6 = n
where n is the dimensionless sphericity of the polyhedral particle, Re is the dimensionless Reynolds number, and subscript n denotes face number of polyhedral.
The following is from the Π theorem:
π 1 = φ ( π 2 , π 3 , π 4 , π 5 , π 6 )
Combining Equations (10)–(16) produces the following:
k c = φ ( R e , S R , H d p , R H , n )
Since particles experience suction forces in both horizontal and vertical directions, we define the vertical drag coefficient ratio k c v and the horizontal drag coefficient ratio k c l , such that
k c v = φ v ( R e , S R , H d p , R H , n )
k c l = φ l ( R e , S R , H d p , R H , n )
According to the drag force formula for particle fluids [22], for regular polyhedral particles, the equivalent particle diameter d p can be used, and the suction force formula can be expressed as follows:
F = 1 2 C d ρ V f 2 A = π 8 C d ρ V f 2 d p 2
where C d is the fluid drag coefficient of the particle, and A is the incoming flow area of the particle moving in the fluid.
Using Equation (20) and the definitions of the suction coefficient ratios for different particles, specific values can be obtained through calculations. Thus, the ratio of drag coefficients between particles can be expressed as follows:
k c = C d n C d s = F a v f b 2 A b F b v f a 2 A a
For horizontal and vertical directions, the ratio of drag coefficients between particles can be expressed as follows:
k c l = C l n C l s
k c v = C v n C v s
where C d is the fluid drag coefficient of the particle, F is the fluid drag force of particle, A is the incoming flow area of particles, v f is the flow velocity of fluid around the particle, and the velocity is same at the same position. k c l is the ratio of horizontal drag coefficients between particles, while k c v is that of vertical drag,   C l n is the horizontal drag coefficient, and C v n is the vertical drag coefficient. The subscripts n and s denote the polyhedron and sphere, respectively. For example, C v 8 and   C l s are the vertical drag coefficient of octahedron particle and the horizontal drag coefficient of sphere.

3. Description of the Hydraulic Collection Experiment

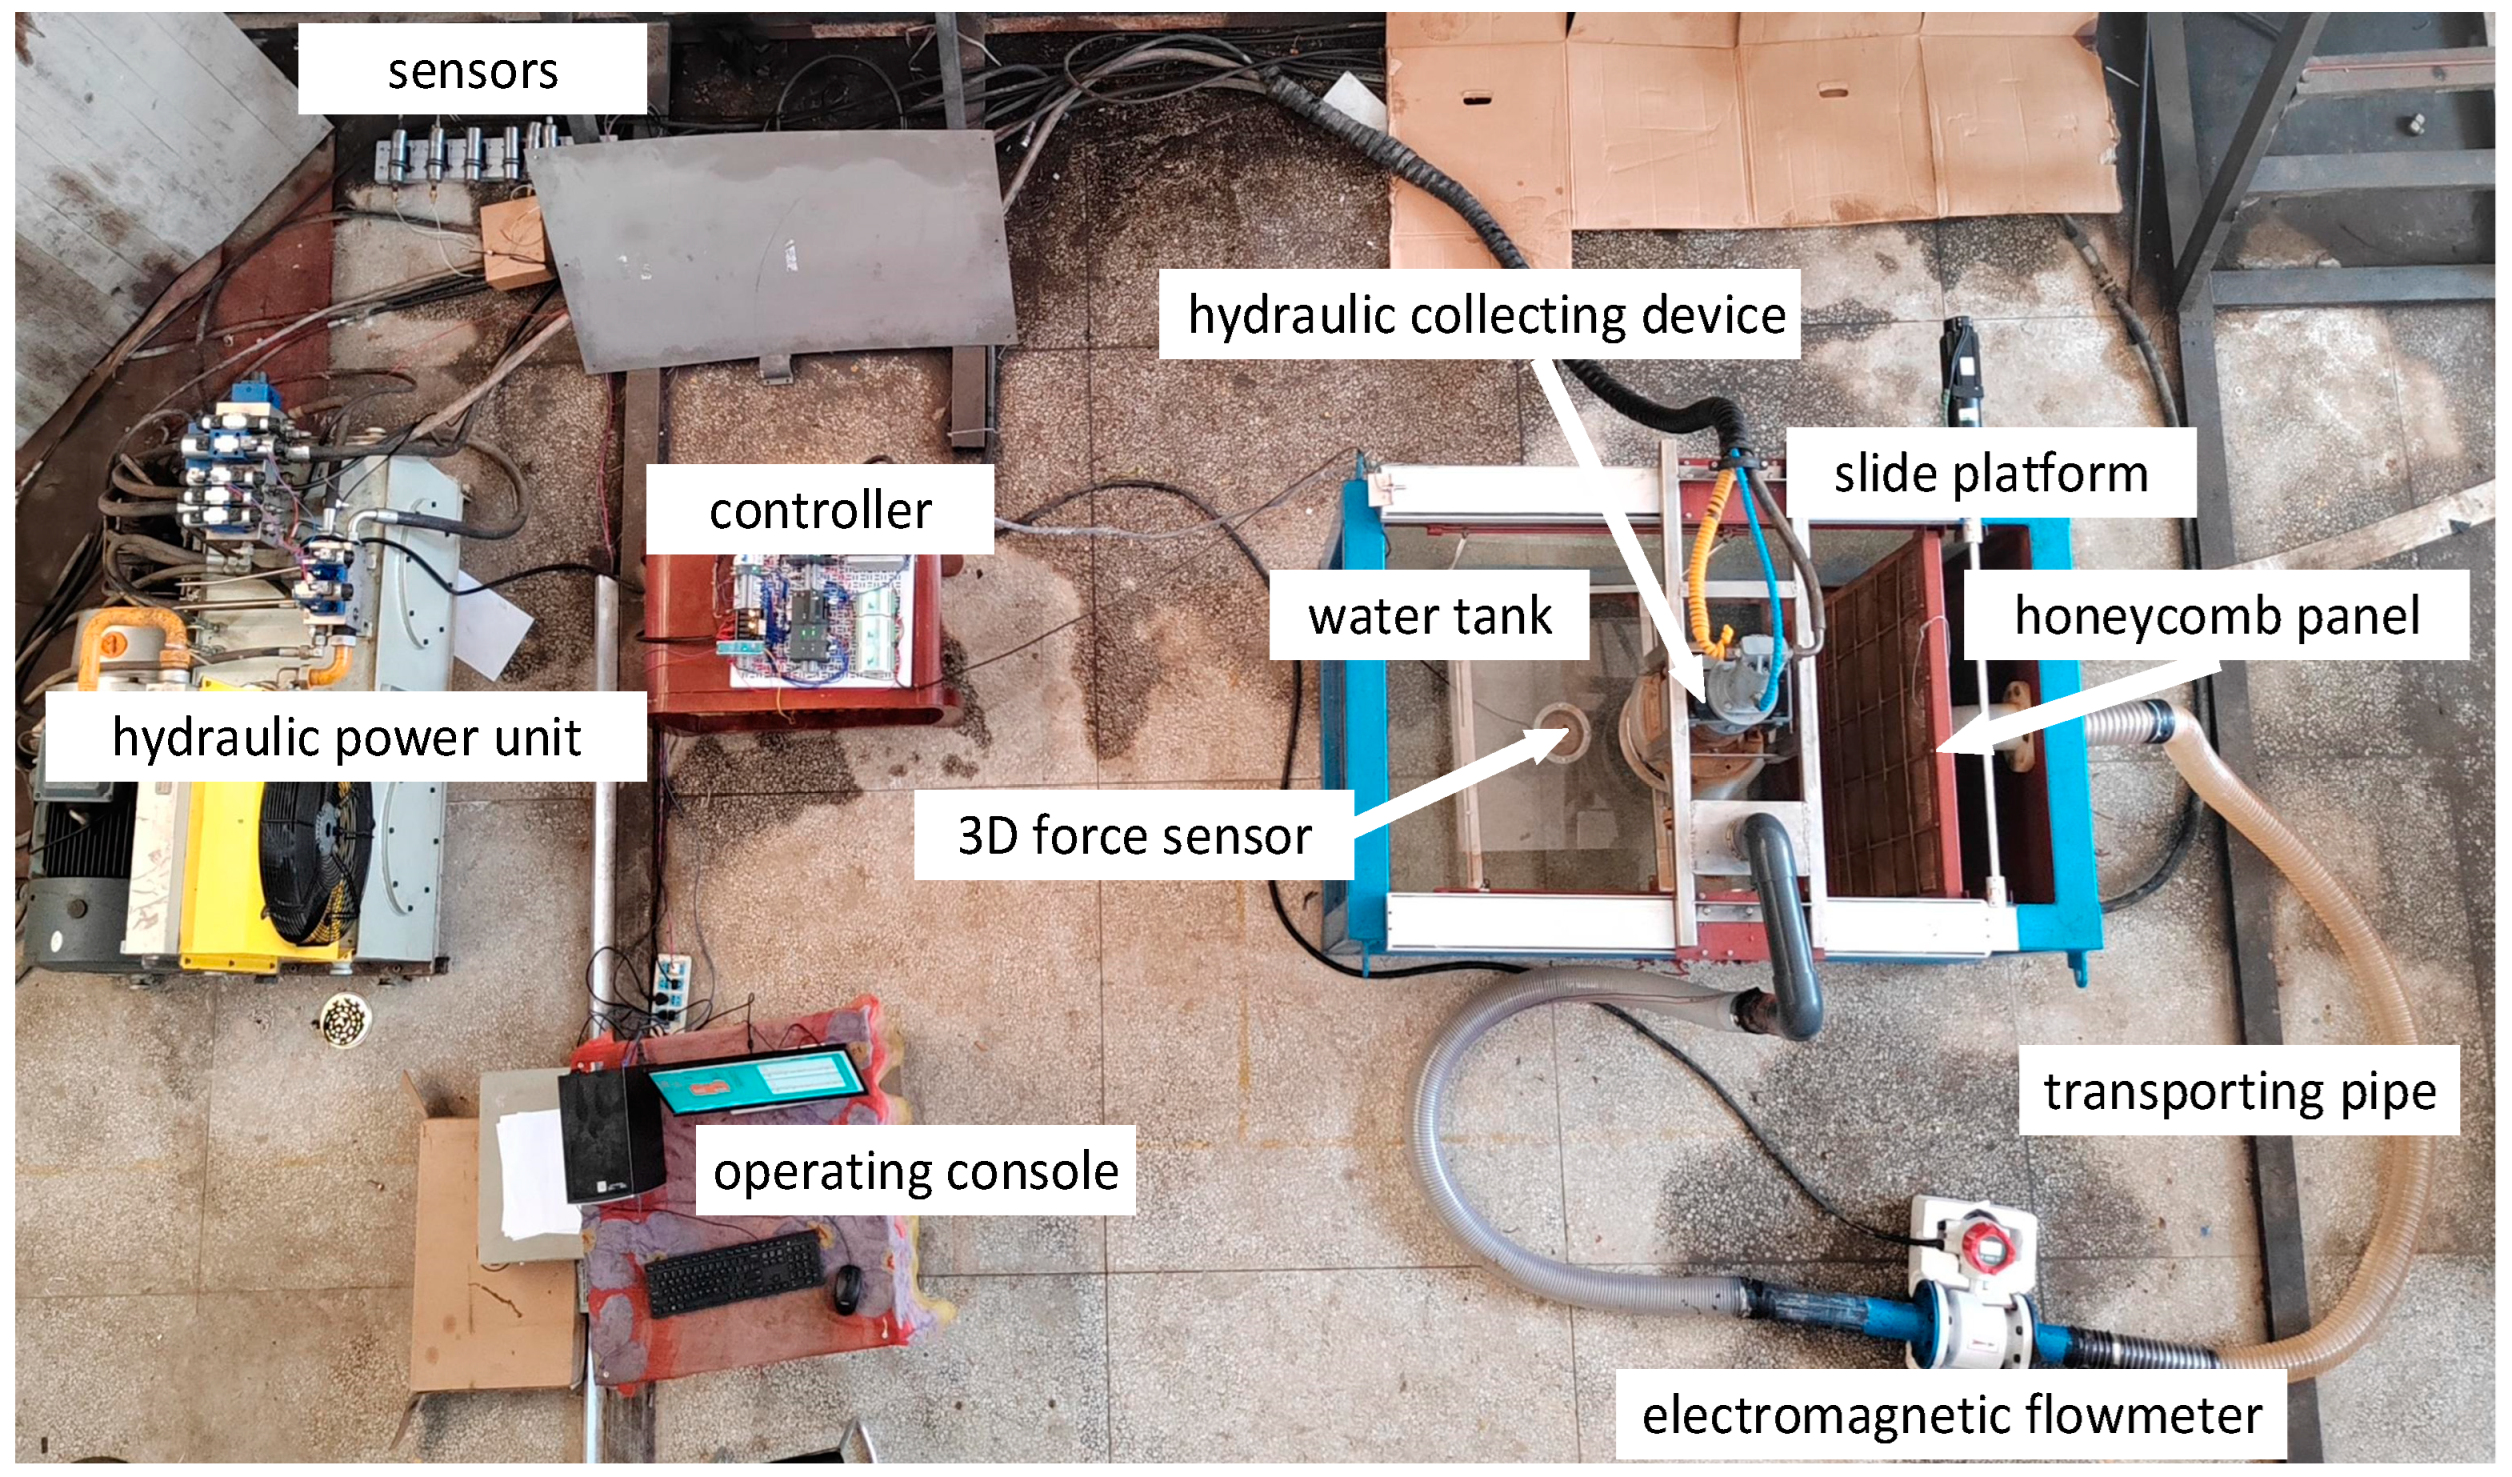
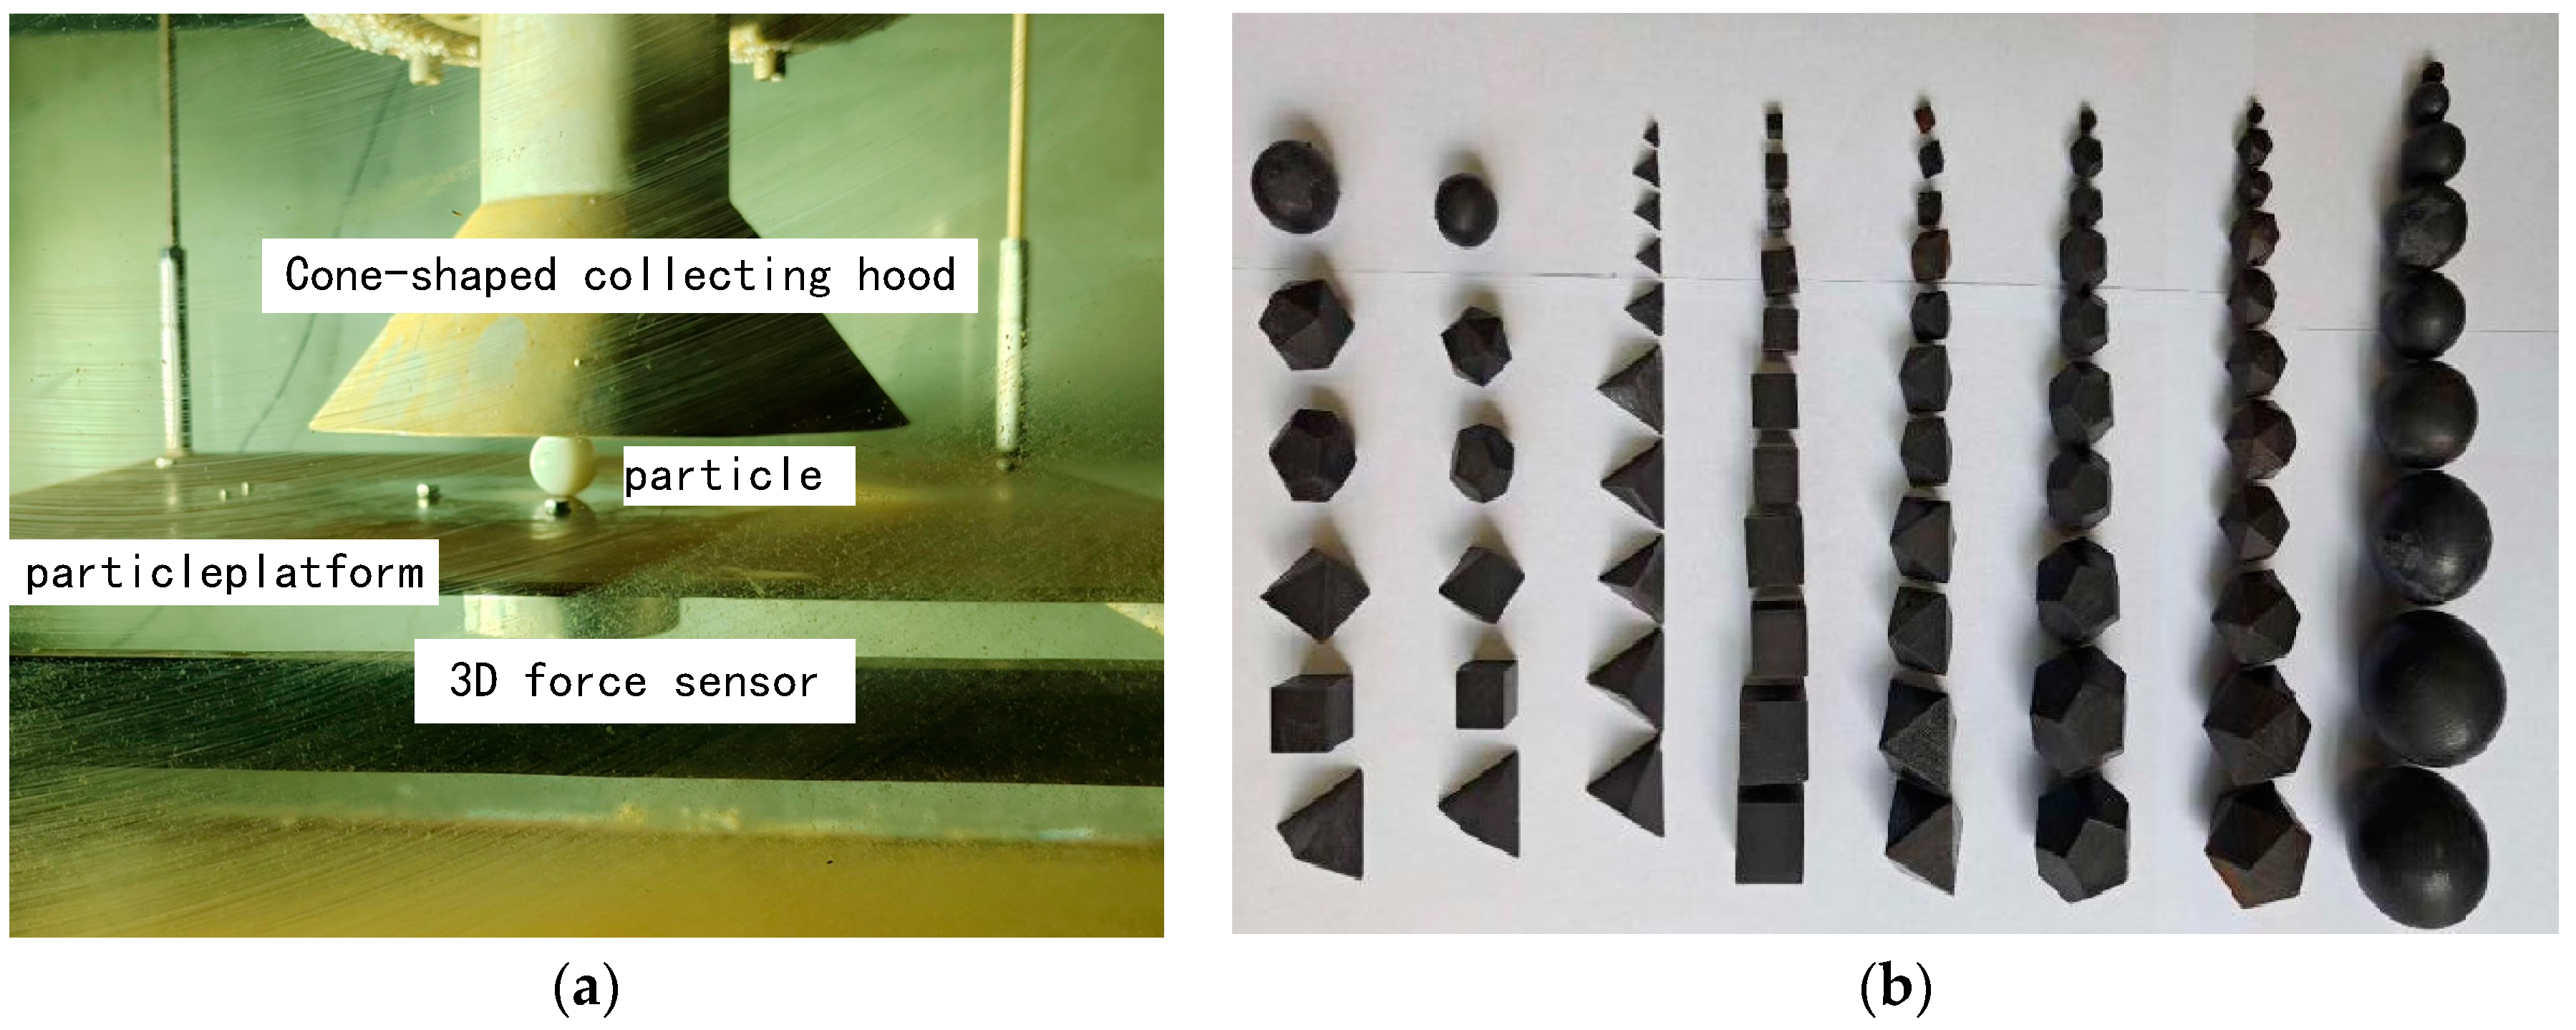
3.1. The Experimental Platform

In order to measure the drag force of particles in fluid field and obtain the suction force of non-spherical particles in a mineral collection flow field, experimental platform was built, as shown in Figure 7, which is composed of water tank, hydraulic pump station, operating console, controller, hydraulic collecting device, electromagnetic flow-meter, slide platform, 3D force sensor, transport pipe, honeycomb rectifier, sensor assembly, and particles. The water tank with three sides constructed of glass measures 2 m × 1.2 m × 1 m, and the hydraulic pump station with a suction flow-rate 120 m3/h has a maximum output power of 25 kW. The cone-shaped collecting hood is bellmouth-shaped, with an inlet radius of 0.160 m, the electromagnetic flow-meter with a measuring range of 150 m3/h is installed at the outlet of hydraulic collecting device to measure the flow of water, and the transporting pipe diameter is 0.090 m. The 3D force sensor is used to measure the force of particles in three directions, with a range of −50 N to 50 N and an accuracy of 0.001 N.
As shown in Figure 8, non-spherical particles are fixed to the force-measuring end of the three-dimensional force sensor, which is then mounted on the particle platform. The height between the mineral collection hood and the particle platform can be adjusted, and the cone-shaped hood, mounted on a mobile platform, can move laterally relative to the particles. The experimental subjects included six types of particle, including five regular tetrahedrons and spheres, with particle diameters ranging from 0.005 m to 0.025 m. The particles were made of high-polymer resin material, with a density of 1.4 g/cm3.

3.2. The Experimental Conditions

As previously elaborated in Section 2.4, the fluid suction force experienced by particles is inherently correlated with various parameters, and a dimensionless characteristic analysis was conducted. To further investigate the influence patterns of parameters S / R , R / H , H / d p , , and Q f on the suction force F d and the drag coefficient ratio k c , the sets of experimental conditions in Table 4 were designed and set up.

4. The Flow Characteristics of the Hydraulic Collection Flow Field

4.1. The Characteristics of the Time-Averaged Velocity of Flow Field

To investigate the fundamental flow properties near the cone-shaped collecting hood, as shown in Figure 9, a PIV measurements were conducted on the external flow field under various conditions, including different heights (H) of the cone collecting hoods relative to their bottoms and different particle positions (S) within the center of hydraulic collection flow field.
The particle image velocimetry system on the hydraulic collection field includes a high-speed camera, pulsed laser, tracer particles, pump, cone-shaped hood, and glass tank. The water tank with a glass wall measures 1 m × 1 m × 1 m, and the hydraulic pump station has maximum output power of 7.5 kW. A laser source (Litron LDY-304, manufactured by LaVision, Gottingen, Germany) was used to light a sheet through the pipe center with a pulsed energy of 20 mJ. A high-speed camera (Photron Fastcam Nova R2, manufactured by Photron Fastcam, Tokyo, Japan) was mounted perpendicularly to this sheet with a shooting frequency of 1440 Hz. The tracer particles (Dantec Polyamid Seeding Particles (PSP-20),manufactured by Dantec Dynamics A/S, Copenhagen, Danmark) were full of water, with a mean diameter of 20 μm and a density of 1.05 g/cm3. During the pump’s operation, the tracer particles seamlessly coalesced with the hydraulic fluid in the collection field, enabling the camera to capture their trajectories as a representation of the fluid flow dynamics.
The hydraulic particle collection field is a very complex turbulent flow field. As shown in Figure 10, the flow characteristic is very complex over the whole flow process. The flow field outside the collection hood was measured by the PIV under different conditions, including different heights of the cone collecting hood from the bottom and different particles located in the center of the hydraulic collection flow field. The radius of the cone-shaped collecting hood was R, and the heights H were 0.2R, 0.4R, and 0.6R, respectively. The measured horizontal positions of the time-averaged velocity field were −1.5R to 1.5R.
With a decrease in the height of the H, the overall flow trend of the external flow field was distributed along the wall of the cone hood, and the flow velocity at the bottom of the center was small, which was primarily influenced by the hood structure and the fluid Coandă effect. The mean flow velocity at the bottom of the hydraulic collection exhibited an increase as the H decreased. The velocity cloud map in the figure reveals that when H was less than 0.4R, the particle vicinity exhibited velocities (V) surpassing half of the mean suction velocity (Vm). Conversely, the parameter V/Vm of the center bottom of the hydraulic decreased with decreases in the H, which revealed that the main intensity of the collection flow flied was dispersed when the height H was low. Additionally, the impact of diverse particles on the flow field became negligible when the H was greater than 0.6R.
In order to closely investigate the time-averaged characteristics of the flow field around the particles, we magnified the time-averaged flow field around the particles in Figure 11. As can be seen from the figure, the streamline of the fluid flow exhibited an upward direction that facilitated particle adsorption at distances of H = 0.4R–0.6R. However, the streamline intensity was relatively weak. Moreover, when the height of the hood was set H = 0.2R, there was an evident increase in streamline intensity, which enhanced the particle collection efficiency within a range of 0.1R to 0.2R from the experimental platform. Nevertheless, it should be noted that near the center of the hydraulic collection flow field, a robust coherent vortex with a rotation direction opposing the particle lifting direction was formed, which may not favor efficient particle collection due to this counteracting effect of the opposite fluid flow. Additionally, owing to the spiral agitation caused by the pump blades and structural features of the cone collection hood, fluid passing through central area during ascent could form an upward vortex (suction vortex), thereby facilitating particle collection in this specific region.

4.2. The Vortex at the Inlet of the Cone Hood

In the process of the hydraulic collection, a suction vortex was mainly caused by the local eddy current formed by the wall shape of the collection hood, the suction of the inlet, and the spiral agitation of the pump blade. This vortex can be defined as the motion tendency of the fluid twisting or rotating, and it is inevitable [28].
As depicted in Figure 12, a suction vortex under the cone-shaped hydraulic collection hood rotated and moved around a specific center captured by a camera. With the increasing flow rate Q f of the hydraulic collecting device, both the intensity and frequency of the suction vortex escalated. The suction vortex tube remained in the center of the cone-shaped hydraulic collection hood at a flow rate of 105 m3/h and a height of 0.045 m (Figure 12a). However, the suction vortex tube moved to the maximum position approximately 0.020 m (approximately 0.1R–0.2R) from the center of the hydraulic collection hood with a flow rate of 115 m3/h and a height of 0.035 m (Figure 12b). Therefore, the generation of the suction vortex is related to the suction flow rate and the height from the bottom of the hydraulic collection hood, which can provide a large lifting force for particles near the center and is conducive to the collection of particles.

4.3. The Vertical Force of Central Particles Based on the Vortex

The suction forces acting on a particle are changed by the suction vortex and other fluid interference effects. In order to closely study the force characteristics of the particle in the center of the hydraulic collection fluid field, the force intensity of the particles at the center of the flow field was investigated through the analysis of the mean force and load fluctuation of the particles. The experimental data were collected by the collection system with a frequency of 500 ms. The force sample generally conformed to a Gaussian distribution, with the mathematical expectation representing the mean force and the variance reflecting its fluctuation.
As shown in Figure 13a, the mean force (or force strength) of the regular dodecahedron (dp = 0.015 m) initially increased and then decreased with increasing distance at four positions (S = 0 m, 0.010 m, 0.020 m, 0.040 m). At a horizontal position of 0.020 m, the peak was reached at 0.2004 N, indicating that the largest fluctuation intensity caused by the suction vortex and other coherent vortices occurs at this position. Subsequently, the fluctuation intensity gradually decreased towards both sides, with the minimum values observed for Fv and fluctuations at the center position. Next, the Fv values of the dodecahedron (dp = 0.015 m) at S = 0 m and S = 0.020 m were tested based on Q f = 95 m3/h and Q f = 110 m3/h, respectively. As shown in Figure 13b, the Fv increased with the increase in Q f , and the centre placement of the maximum lifting force also moved with the increase in Q f , which was mainly related to the movement of the suction vortex with the increase in Q f . These results are consistent with the experimental findings presented in Figure 12.
Figure 14 shows the FV of the spherical particles (dp = 0.025 m) at H = 0.045 m and S = 0 m with different suction flow rates ( Q f = 95 m3/h, Q f = 105 m3/h, Q f = 115 m3/h). The Fv of the particles increased with the increase in Q f . Moreover, both the μ and the σ2 exhibited increments, from 0.1521 to 0.2811 and from 0.1221 to 0.1814, respectively. These results indicate an augmentation in both the frequency and the amplitude of the force fluctuations, leading to a decrease in the stability of Fv. However, compared with Figure 13, the centre placement of the maximum lifting force did not move when Q f = 115 m3/h, which showed that the centre placement of the maximum lifting force was related to the height H.

5. Results and Discussion

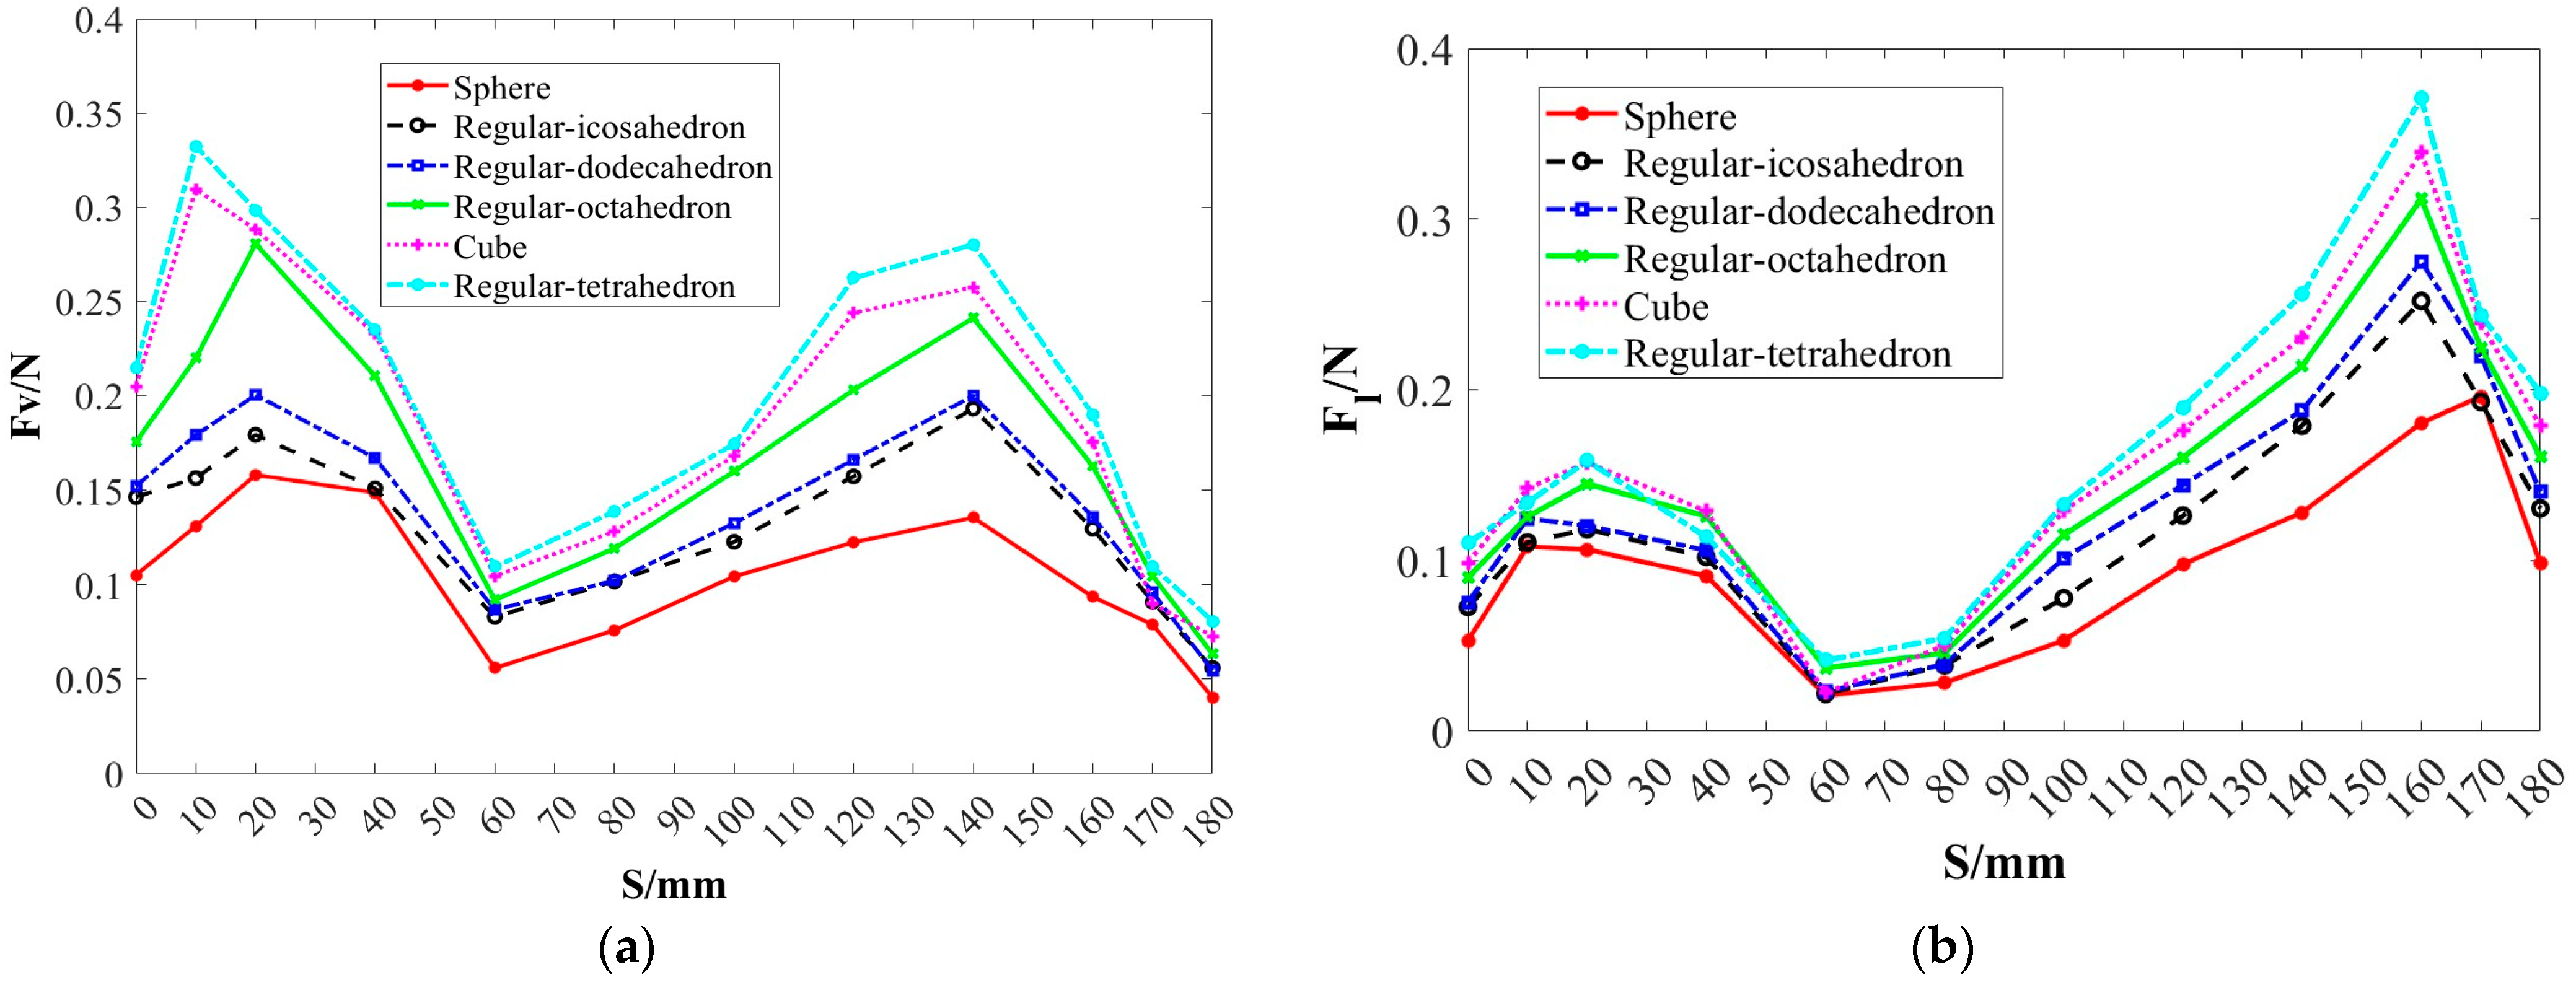
5.1. The Effect of Different Positions S and Different Particles on Suction Force Fd

In order to investigate the impact of the particle shape on the fluid forces, we conducted experiments using regular tetrahedron, cube, octahedron, dodecagon, icosahedron, and spherical particles (dp = 0.015 m, H = 0.035 m, Q f = 110 m3/ h, and R = 0.16 m).
The vertical force and horizontal force are illustrated in Figure 15. Figure 15a,b represent the vertical component Fv and the horizontal component Fl of the starting suction, respectively. The cone-shaped hood had an inlet diameter of D = 0.320 m, and the particles (At S = 0 m) were precisely positioned at the center of the ore-collecting flow field; the particles at S = 0.160 m reached the edge of the cap, while the particles at S = 0.180 m exceeded the range of the hood. Under the same conditions, the Fd of the tetrahedron was the largest, while the sphere was the smallest. There were two peaks in the force curve, with a slightly different position in Figure 15a,b, which was mainly related to the cone-shaped collecting hood and the characteristics of the flow field. Additionally, as illustrated in Figure 15a, the Fv exhibited two identical peaks, at S = 0.020 m and S = 0.140 m, respectively. The first peak was primarily attributed to the influence of the suction vortex and other coherent vortices, discussed in Section 4, and the occurrence of the second peak was mainly close to the sharp narrowing between the hood edge and the particle platform, where there was a high fluid flow velocity, resulting in increased fluid drag force on the particles. Furthermore, the flow velocity was small due to Coandă effect of the fluid flow at positions 0.060–0.080 m, as shown by the PIV figure in Figure 10, and both F v and F l exhibited similar characteristics within this range. The fluid in the vertical direction in the center was bidirectional superimposed by the surrounding flow, but the fluids in the horizontal direction were canceled by each other or formed into an entrainment vortex, and there were other disturbance flow field effects in the centre of the collecting field, according to the results in Section 4. Therefore, the comprehensive suction force at the center was greater than that at positions 0.060–0.080 m, and the vertical suction force ( F v ) was significantly greater than the horizontal suction force ( F v ) at both locations.
In summary, based on the model of the particles’ starting suction force, it can be observed that the positions conducive to particle collection were mainly distributed in the range of 0.1–0.2R and 0.8–1R, while the weakest positions were between 0.4R and 0.6R, which is not favorable for ore collection.

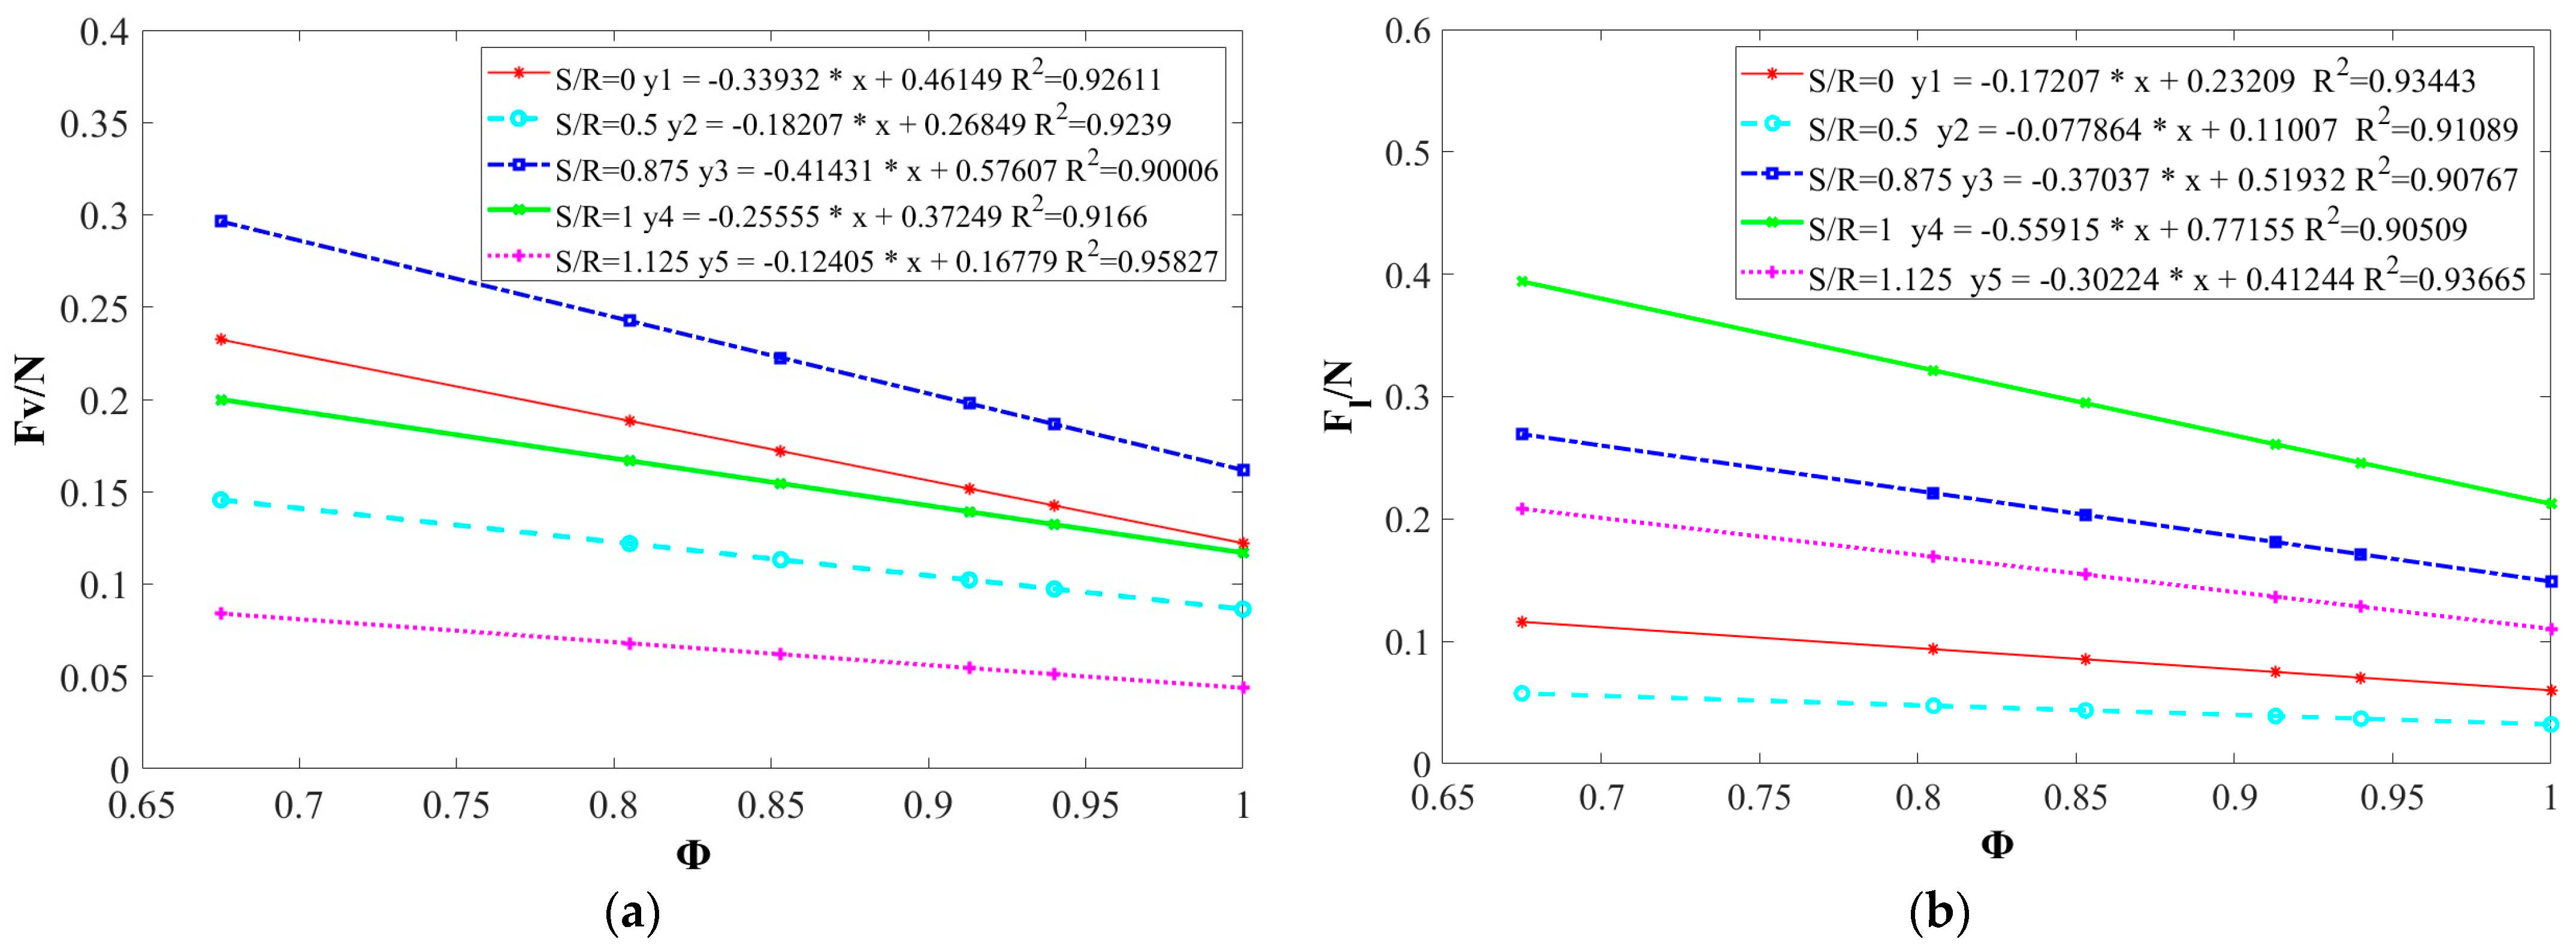
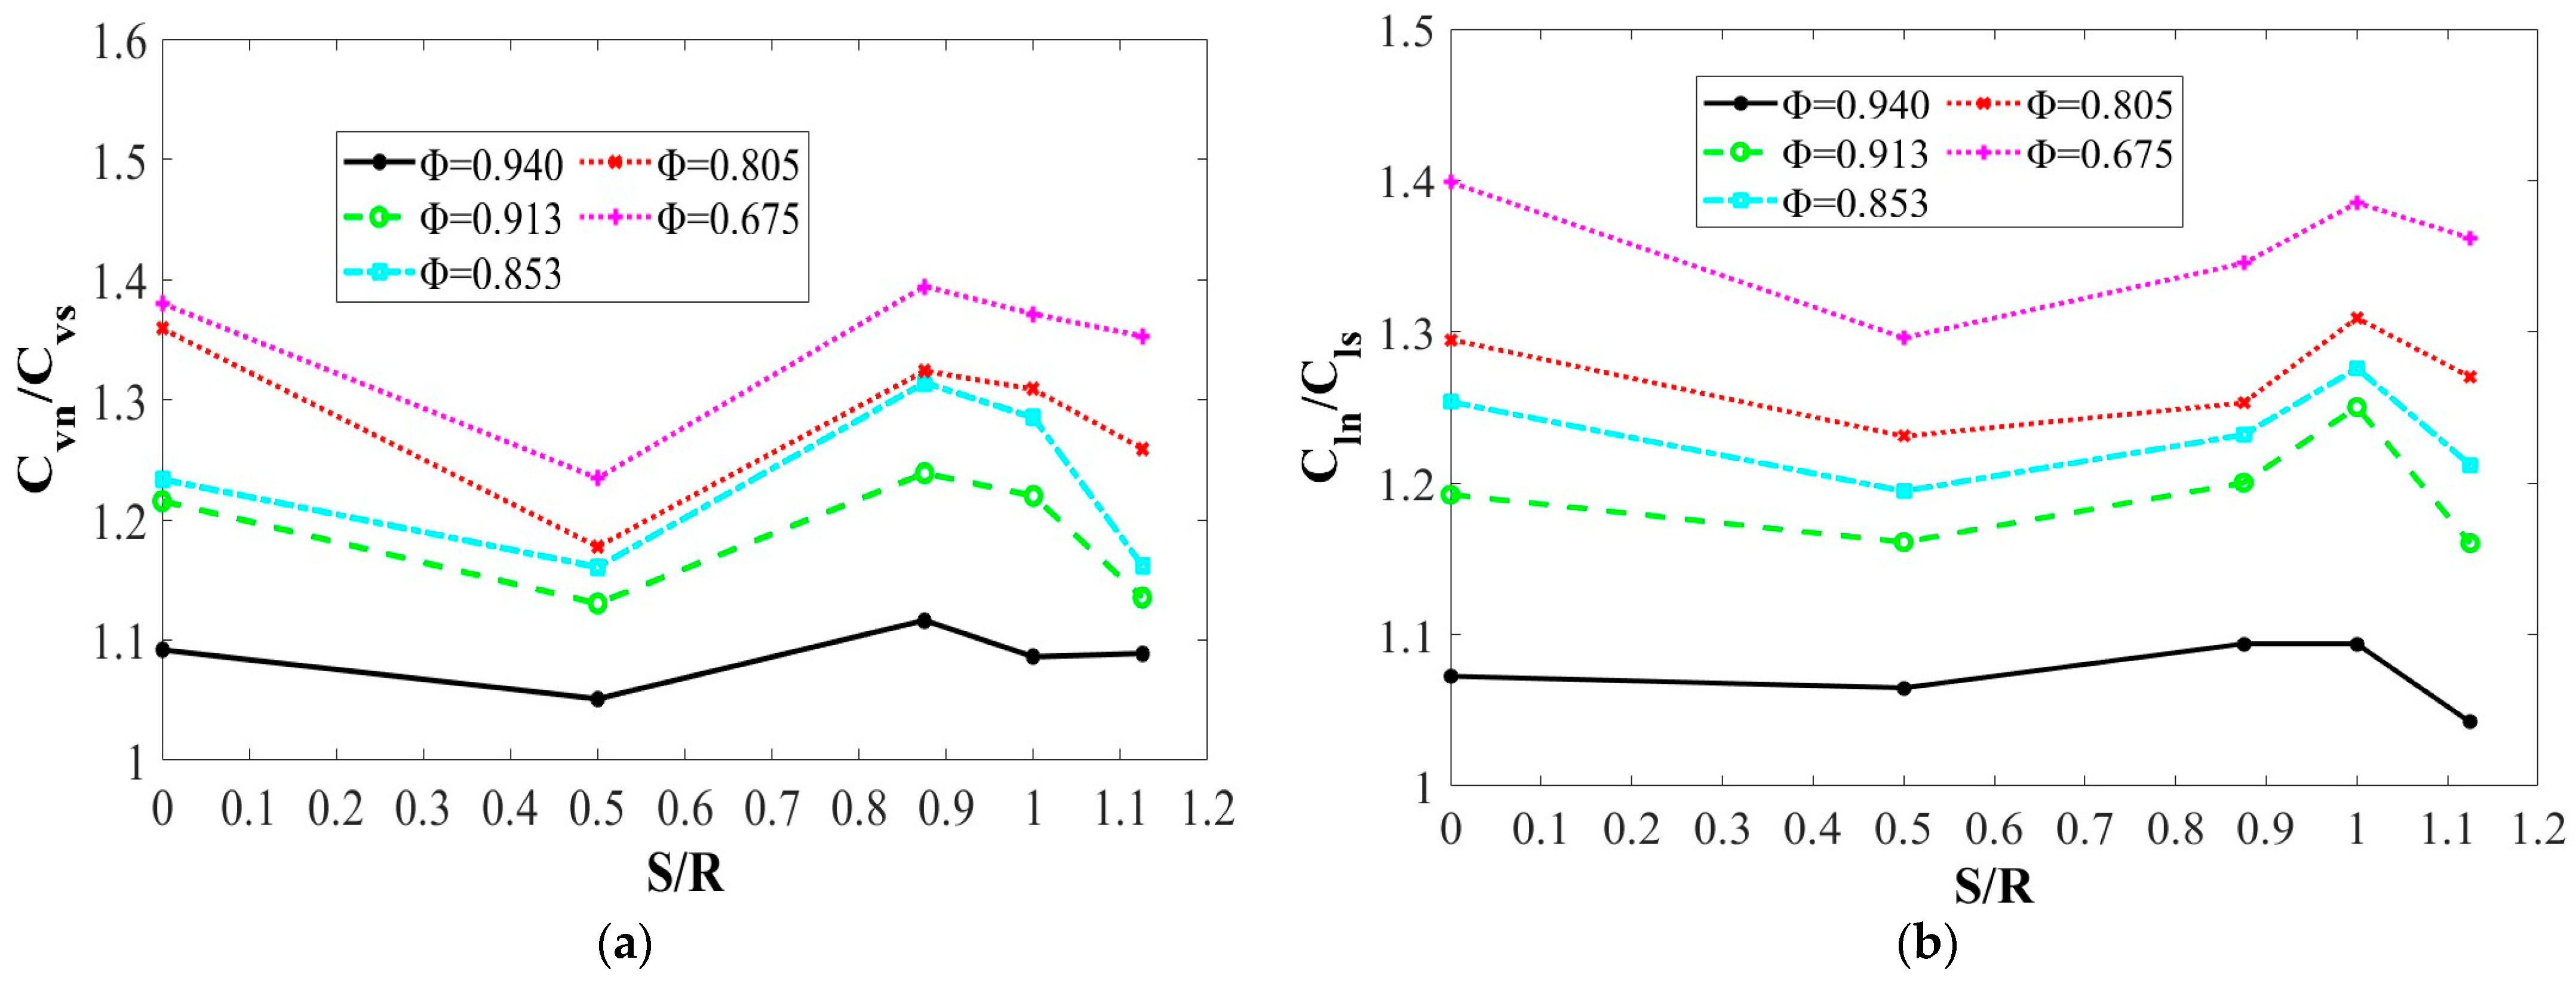
5.2. The Effect of Parameters Φ and S/R on the Suction Coefficient Ratio k c

To further investigate the relationship between the sphericity (Φ) of the polyhedrons and the suction coefficient ratio ( k c ), the particle force data (dp = 0.015 m) obtained at five positions (S = 0 m, 0.080 m, 0.140 m, 0.160 m, and 0.180 m) for six types of particles (Φ = 0.675, 0.805, 0.853, 0.913, 0.940, and 1) were separately fitted, and the specific relationship and degree of fitting R2 are indicated in Figure 16. The figure shows that the position of the fitted line with a maximum slope was in the peak range of the curve in Figure 15, and Fd exhibited a decreasing trend as Φ increased, namely the closer the Φ to the sphere, the smaller Fd was. Moreover, the decline in Fd was more pronounced in the high-velocity flow fields compared to the low-velocity ones when Φ increased.
The relationship between the ratio ( k c ) and the sphericity (Φ) in the hydraulic collection process is shown in Figure 16. It can be observed from the figure that the k c generally increased with an increase in Φ at different locations. The k c of the same particle exhibited significant variation at different hydraulic collection positions. Among the polyhedrons, the regular icosahedral (Φ = 0.940) demonstrated the best overall stability of k c , with a value of approximately 1.1 and low fluctuation, indicating its similarity to the spherical particles in terms of hydraulic collection characteristics. However, the k c of the tetrahedral (Φ = 0.675) varied from 0.45 to 0.85, and showed less stability. Additionally, it can be seen from Figure 17 that the maximum k c v of the F V and the maximum k c l of the F L were observed at S/R = 0.875 (S = 0.140 m) and S/R = 1 (S = 0.160 m), respectively, which reveals that the k c was more sensitive to the high-velocity flow fields. Namely, the value of k c became obviously large where there was a suction force peak.

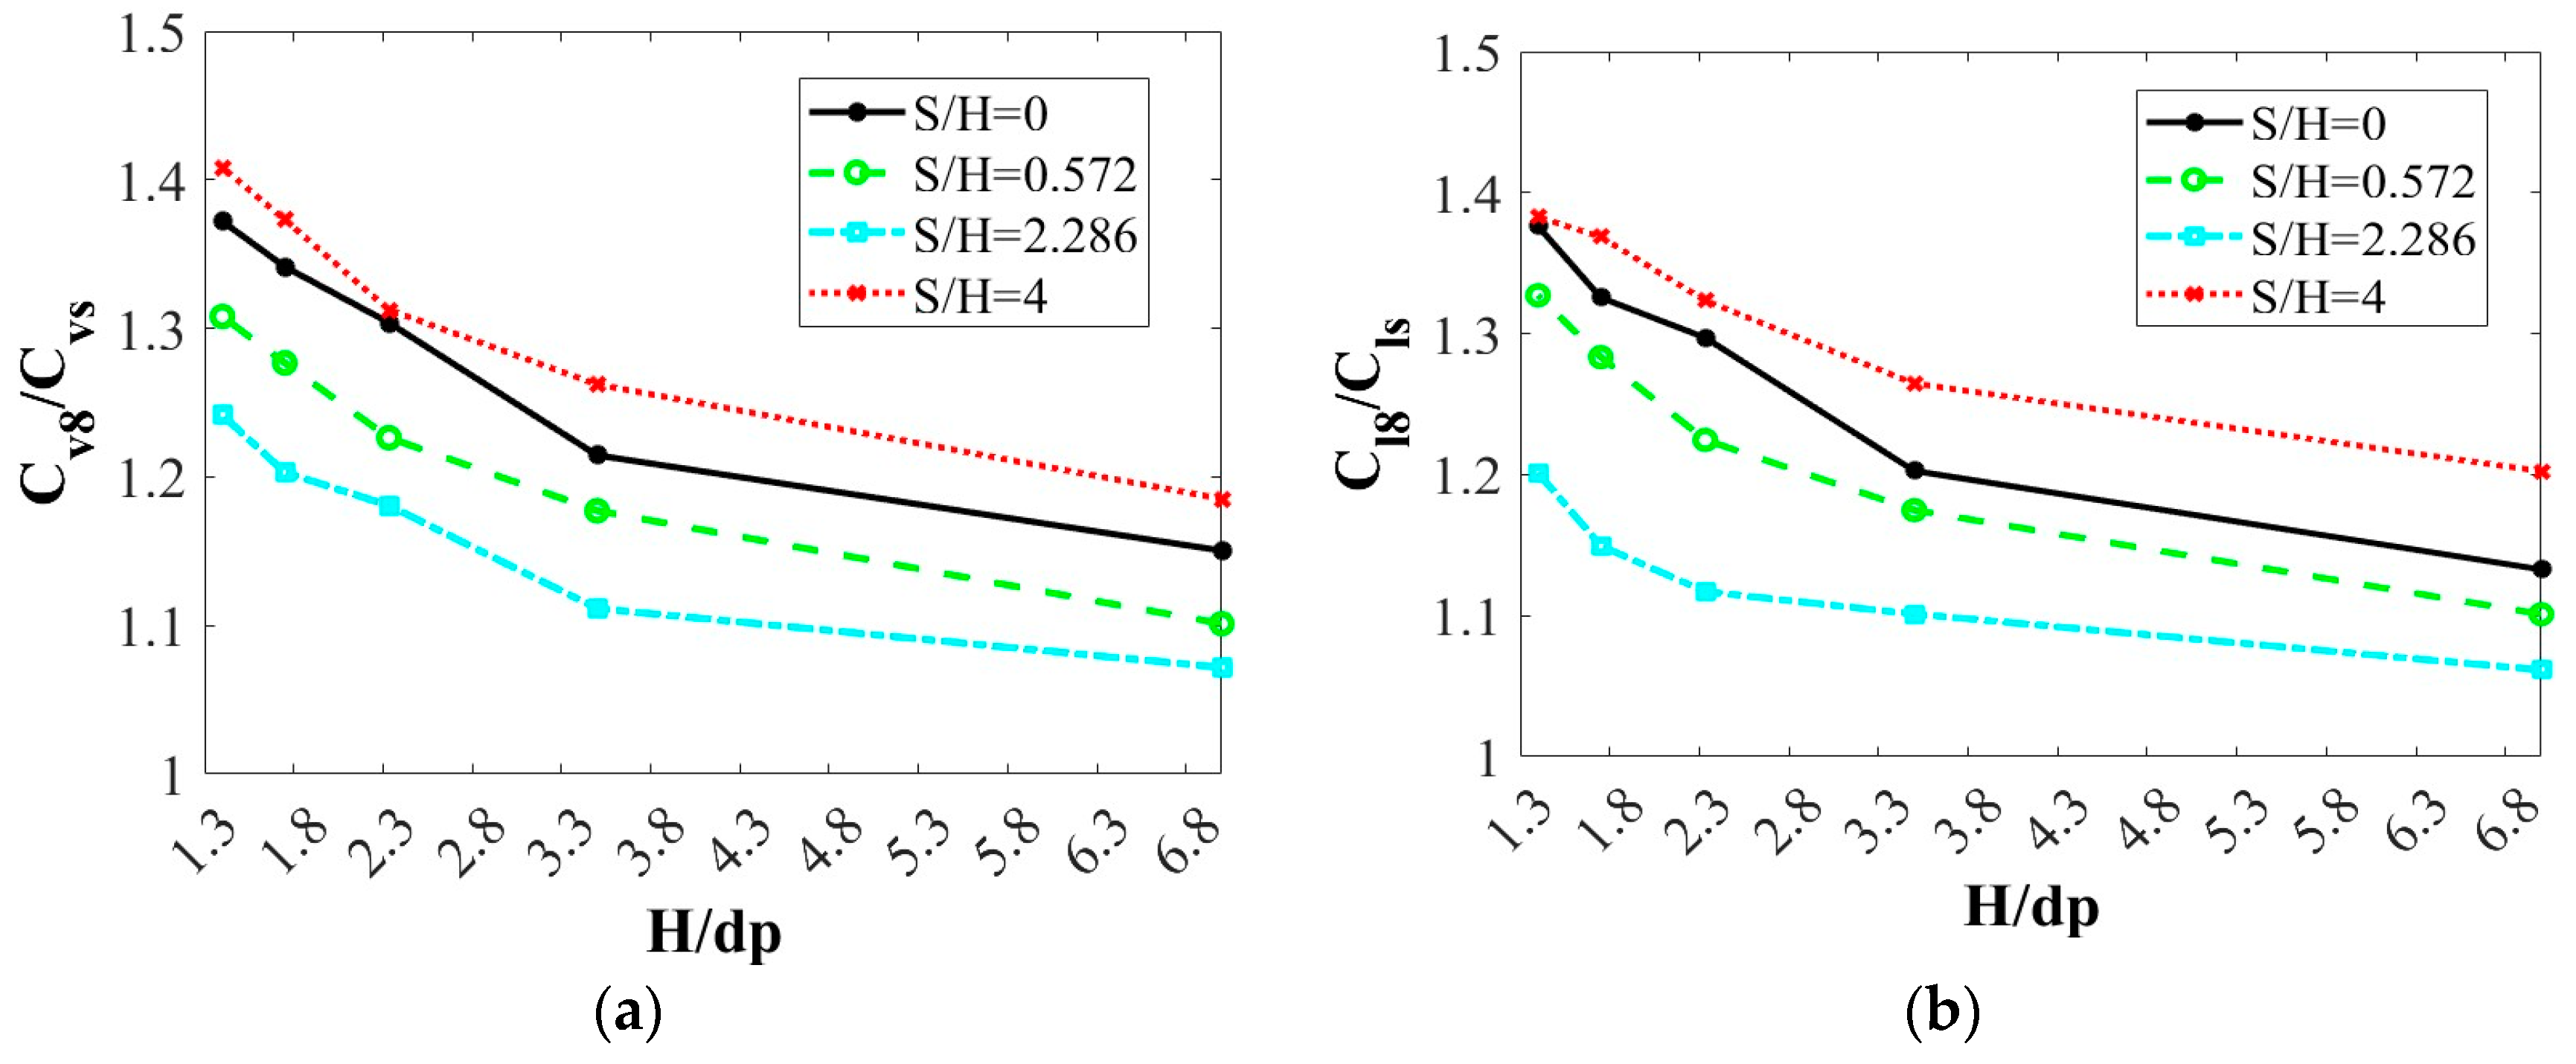
5.3. The Effect of Parameter H/dp and S/H on the Suction Coefficient Ratio k c

The relationship between F d and dp, Vf, and other factors can be deduced from Equation (20). Furthermore, the parameter H/dp reflected the correlation between dp and Vf. Figure 17 illustrates the study of the ratio k c between the regular octahedron and the sphere (dp = 0.005 m, 0.010 m, 0.015 m, 0.020 m, and 0.025 m) at different positions (S = 0 m, 0.020 m, 0.080 m, 0.140 m, and 0.160 m). The suction flow rate Q was set to be constant at a value of 105 m3/h, while a height H was maintained at 0.035 m.
The influence of H/dp and R/H on the ratios of k c was investigated under varied S/H (0, 0572, 2.286, and 4), as shown in Figure 18. It can be observed that both kcv and kcl decreased with increasing H/dp; however, the rate of decrease slowed down with an increase of H/dp. Furthermore, compared to Figure 15, it was found that k c was directly proportional to F d at the same position under identical conditions. Additionally, according to Equation (20), an increase in H or a decrease in dp would result in an enlargement of the parameter H/dp, leading to a decrease in F d and, subsequently, k c .

5.4. The Effect of Parameters R/H and S/R on the Suction Coefficient Ratio k c

As shown in Figure 19, the influence of different R/H parameters on the k c ratio between the irregular octahedron and the sphere (dp = 0.015 m) was investigated at various positions (S = 0 m, 0.020 m, 0.080 m, 0.140 m, and 0.160 m) and heights (H = 0.035 m, 0.045 m, 0.055 m, and 0.065 m). The suction flow rate Q f was set to be 105 m3/h. The data were separately fitted, and the specific relationship and the degree of fit (R2) are indicated in Figure 19.
As depicted in Figure 19, the ratio k c exhibited an upward trend with an increase in R/H, which was primarily attributed to a reduction in the circulation area beneath the cone-shaped hood resulting from a decrease in H. The kcv and kcl were also sensitive to a high flow rate, and the uptrend of the kcv and kcl was biggest near S/R = 0 and S/R = 1, where the peak suction force appeared.

6. Conclusions

In this work, a suction coefficient ratio (kc) was introduced to study the relation between the spherical particle fluid suction coefficient and the polyhedral particle fluid suction coefficient. Based on the dimensionless method and experimental research, the flow field characteristics of the cone-shaped collection hood were analyzed, the influence of different parameters on kc was studied, and then the effects of different parameters, such as Φ, H/R, R/S, and H/dp, on the suction force coefficient of the polyhedral particles based on the suction force coefficient of the spherical particles. The effects of different parameters on the fluid suction characteristics of the polyhedron, based on spherical particles with definite fluid suction characteristics, can be determined. The main findings are as follows:
(1)
As height H decreased, the pattern of the external flow field was observed, which showed that the fluid flow distributed along the wall of the hood and the flow velocity distribution at the center bottom were relatively low. The occurrence and movement of the suction vortex and coherent vortex were found in the central region between 0.1R and 0.2R, which can be attributed to the height H, the flow rate Q f , and the structural characteristics of the cone-shaped collecting hood. The suction and coherent vortex can provide favorable conditions for particles collection.
(2)
The suction force (Fd) generally decreased with the increase in the Φ, and the downward trend of the Fd in the flow field with the high velocity was more obvious compared to the low-velocity flow fields. Notably, there were two peaks on the curve, at S = 0.010–0.020 m and S = 0.140–0.160 m, respectively. The positions favorable for particle collection were mainly distributed within the range of 0.1–0.2R and 0.8–1R, while the weakest collection occurred between 0.4R and 0.6R, which is not conducive to ore collection.
(3)
The ratio   k c generally increased with the decreasing sphericity Φ at the same hydraulic collection location, while the fluctuation of k c became more stable as the Φ increased. The regular icosahedral shape (Φ = 0.940) exhibited a k c value of approximately 1.1, which indicates its superior overall stability and similarity to a spherical shape, so the suction coefficient (Cd) of the icosahedra was close to the sphere. Moreover, it was observed that the k c was highly sensitive to the high-speed field, and the maximum k c v of FV and the maximum k c l of FL appeared at the peak points of their force values, S/R = 0.875 (S = 0.140 m) and S/R = 1(S = 0.160 m), respectively, where k c is significantly larger. The k c decreases as the parameter H/dp increases, and the decreasing trend of k c significantly slows down when H/dp exceeds 3.5.
(4)
In terms of suction force, polyhedral particles exhibit greater hydraulic collection efficiency compared to spherical particles of the same weight, which is more obvious in high-speed flow fields. However, due to their complex surface structures and larger geometric shapes, polyhedral particles may undergo more intricate motion. Therefore, our future research will focus on investigating the dynamics of polyhedral particle motion.

Author Contributions

Conceptualization, M.J.; methodology, M.J.; validation, M.J.; formal analysis, M.J. and B.C.; data curation, K.L.; writing—review and editing, M.J.; visualization, M.J. and K.L.; supervision, B.C.; funding acquisition, M.J. All authors have read and agreed to the published version of the manuscript.

Funding

This research was funded by the National Natural Science Foundation of China (grant number 52171295) and the Key R&D Program of Hunan Province (grant number 2022GK2066).

Institutional Review Board Statement

Not applicable.

Informed Consent Statement

Not applicable.

Data Availability Statement

The data presented in this study are available on request from the corresponding author. The data are not publicly available due to privacy.

Conflicts of Interest

Author Min Jiang, Binzheng Chen were employed by the company Changsha Mining Research Institute Co., Ltd. The remaining authors declare that the research was conducted in the absence of any commercial or financial relationships that could be construed as a potential conflict of interest.

Nomenclature

Dinlet diameter of cone hood
Hdistance from the hood inlet to the seabed
Vlwater velocity
Fvvertical force
Flhorizontal force
V p actual volume of the non-spherical particle
d p equivalent diameter
ducircumcircle diameter
Q f suction flow rate
sphericity of particle
n sphericity of polyhedron particle
S horizontal distance between particles and the collecting center
Aincoming flow area of particles
R inlet radius of cone collecting hood
Fdsuction force
Cdsuction force coefficient
ρ fluid density
v f fluid mean velocity
ReReynolds number
μ viscosity coefficient of fluid
k c v vertical force coefficient ratio
k c l horizontal force coefficient ratio
Vnormal water velocity
Vmmean suction velocity
Uhorizontal water velocity
eelongation factor of particle
fflatness factor of particle
Subscripts:
nface number of polyhedron particle
lhorizontal direction
vvertical direction

References

  1. Pelleter, E.; Fouquet, Y.; Etoubleau, J.; Cheron, S.; Labanieh, S.; Josso, P.; Bollinger, C.; Langlade, J. Ni-Cu-Co-rich hydrothermal manganese mineralization in the Wallis and Futuna back-arc environment (SW Pacific). Ore Geol. Rev. 2017, 87, 126–146. [Google Scholar] [CrossRef]
  2. Volkmann, S.E.; Kuhn, T.; Lehnen, F. A comprehensive approach for a techno-economic assessment of nodule mining in the deep sea. Miner. Econ. 2018, 31, 319–336. [Google Scholar] [CrossRef]
  3. Sharma, R. Deep-Sea Mining: Economic, Technical, Technological, and Environmental Considerations for Sustainable Development. Mar. Technol. Soc. J. 2011, 45, 28–41. [Google Scholar] [CrossRef]
  4. Wijk, J.M. Vertical Hydraulic Transport for Deep Sea Mining. Ph.D. Thesis, University of Delft, Delft, The Netherlands, 2016. [Google Scholar]
  5. Masanobu, S.; Takano, S.; Kanada, S.; Ono, M. Pressure Loss Due to Hydraulic Transport of Large Solid Particles in Vertical Pipes Under Pulsating Flow Conditions. J. Offshore Mech. Arct. Eng. 2021, 143, 061801. [Google Scholar] [CrossRef]
  6. Liu, L.; Li, X.; Tian, X.-L.; Zhang, X.-T.; Xu, L.-X.; Zhang, X.-Z. Numerical Investigation on Inclined Hydraulic Transport of Large Particles for Deepsea Mining. China Ocean Eng. 2023, 37, 420–432. [Google Scholar] [CrossRef]
  7. Cao, Y.; Gu, H.; Guo, H.; Li, X. Modeling and dynamic analysis of integral vertical transport system for deep-sea mining in three-dimensional space. Ocean Eng. 2023, 271, 113749. [Google Scholar] [CrossRef]
  8. Guo, X.; Fan, N.; Liu, Y.; Liu, X.; Wang, Z.; Xie, X.; Jia, Y. Deep seabed mining: Frontiers in engineering geology and environment. Int. J. Coal Sci. Technol. 2023, 10, 23. [Google Scholar] [CrossRef]
  9. Fairley, P. Robot miners of the briny deep. IEEE Spectr. 2015, 53, 44–47. [Google Scholar] [CrossRef]
  10. Li, B.; Chen, Z.; Chai, X.; Hou, B.; Liu, Y.; Chen, L.; Wei, D. Overall Development of the Internet Plus Initiative Against the Backdrop of Intelligence Plus. Strateg. Study Chin. Acad. Eng. 2020, 22, 1–9. [Google Scholar] [CrossRef]
  11. Liao, S. A buoyancy vertical transport system of deep-sea mining. J. Ocean Eng. Sci. 2020, 5, 294–295. [Google Scholar] [CrossRef]
  12. Zhao, G.; Xiao, L.; Yue, Z.; Liu, M.; Peng, T.; Zhao, W. Performance characteristics of nodule pick-up device based on spiral flow principle for deep-sea hydraulic collection. Ocean Eng. 2021, 226, 108818. [Google Scholar] [CrossRef]
  13. Oebius, H.U.; Becker, H.J.; Rolinski, S.; Jankowski, J.A. Parametrization and evaluation of marine environmental impacts produced by deep-sea manganese nodule mining. Deep Sea Res. Part II Top. Stud. Oceanogr. 2001, 48, 3453–3467. [Google Scholar] [CrossRef]
  14. Leng, D.; Shao, S.; Xie, Y.; Wang, H.; Liu, G. A brief review of recent progress on deep sea mining vehicle. Ocean Eng. 2021, 228, 108565. [Google Scholar] [CrossRef]
  15. Zou, L.; Dong, Y.; Jin, G.; Yu, Z.; Sun, T. Analysis of non-dimensional parameters for double-row jet hydraulic collection method on flow field characteristics. Ocean Eng. 2024, 303, 117600. [Google Scholar] [CrossRef]
  16. Kim, S.; Cho, S.G.; Lee, M.; Kim, J.; Lee, T.H.; Park, S.; Hong, S.; Kim, H.-W.; Min, C.-H.; Chi, S.B.; et al. Reliability-based design optimization of a pick-up device of a manganese nodule pilot mining robot using the Coandă effect. J. Mech. Sci. Technol. 2019, 33, 3665–3672. [Google Scholar] [CrossRef]
  17. Alhaddad, S.; Mehta, D.; Helmons, R. Mining of deep-seabed nodules using a Coandă-effect-based collector. Results Eng. 2023, 17, 100852. [Google Scholar] [CrossRef]
  18. Chen, Y.X.; Xiong, H.; Cheng, H.; Chen, Y. Experimental study on the incipient motion of a single spherical particle in hydraulic collecting. J. Cent. South Univ. 2019, 50, 2831–2838. [Google Scholar]
  19. El-Sapa, S.; Saad, E.; Faltas, M. Axisymmetric motion of two spherical particles in a Brinkman medium with slip surfaces. Eur. J. Mech. B/Fluids 2018, 67, 306–313. [Google Scholar] [CrossRef]
  20. Sherief, H.; Faltas, M.; El-Sapa, S. Interaction between two rigid spheres moving in a micropolar fluid with slip surfaces. J. Mol. Liq. 2019, 290, 111165. [Google Scholar] [CrossRef]
  21. Zhao, G.; Lu, H.; Xiao, L.; Hu, J. Shape Effect of Polymetallic Nodules on Suction Forces and Flow Field During Seabed Hydraulic Collection. J. Offshore Mech. Arct. Eng. 2021, 144, 011204. [Google Scholar] [CrossRef]
  22. Xiong, H.; Chen, Y.; Yang, N.; Xiao, J.; Li, L. Numerical Study on Settling and Floating Movements of a Sphere Particle Flowing in a Vertical Pipe. In Proceedings of the 28th International Ocean and Polar Engineering Conference, Sapporo, Japan, 10–15 June 2018. [Google Scholar]
  23. Loth, E. Drag of non-spherical solid particles of regular and irregular shape. Powder Technol. 2007, 182, 342–353. [Google Scholar] [CrossRef]
  24. Zhao, G.; Xiao, L.; Peng, T.; Zhang, M. Experimental Research on Hydraulic Collecting Spherical Particles in Deep Sea Mining. Energies 2018, 11, 1938. [Google Scholar] [CrossRef]
  25. Galdi, G.P. Navier–Stokes EquationsNavier–Stokes equations: A Mathematical Analysis. In Encyclopedia of Complexity and Systems Science; Meyers, R.A., Ed.; Springer: New York, NY, USA, 2009; pp. 5925–5959. [Google Scholar]
  26. Zhu, H.P.; Zhou, Z.Y.; Yang, R.Y.; Yu, A.B. Discrete particle simulation of particulate systems: Theoretical developments. Chem. Eng. Sci. 2007, 62, 3378–3396. [Google Scholar] [CrossRef]
  27. Lin, C.; Miller, J. 3D characterization and analysis of particle shape using X-ray microtomography (XMT). Powder Technol. 2005, 154, 61–69. [Google Scholar] [CrossRef]
  28. Arocena, V.M.; Abuan, B.E.; Reyes, J.G.T.; Rodgers, P.L.; Danao, L.A.M. Reduction of Entrained Vortices in Submersible Pump Suction Lines Using Numerical Simulations. Energies 2020, 13, 6136. [Google Scholar] [CrossRef]
Figure 1. The schematic diagram of the deep-sea mining system.
Jmse 12 01543 g001
Figure 2. The suction-based hydraulic collection model.
Jmse 12 01543 g002
Figure 3. The accumulation of cut and crushed ore bodies. (a) Cut and crushed real particles from mining areas in the Western Pacific, (b) 0.005–0.010 m mineral particles with a weight of 100 g.
Jmse 12 01543 g003
Figure 4. Extraction of particle shapes.
Jmse 12 01543 g004
Figure 5. The accumulation of cut and crushed ore bodies.
Jmse 12 01543 g005
Figure 6. Shape deformation process from regular polyhedral particles to spherical particles.
Jmse 12 01543 g006
Figure 7. The experimental platform of particle hydraulic collection.
Jmse 12 01543 g007
Figure 8. The measuring device for drag force of particles. (a) The measuring device for fluid drag force of particle, (b) tested particles.
Jmse 12 01543 g008
Figure 9. PIV measurement platform on hydraulic collection field.
Jmse 12 01543 g009
Figure 10. The time-averaged velocity field of the flow field around the hood (V is normal water velocity, Vm is mean suction velocity).
Jmse 12 01543 g010
Figure 11. Magnification of the time mean velocity field of the flow field around the hood (V is normal water velocity, Vm is mean suction velocity, and U is horizontal water velocity).
Jmse 12 01543 g011
Figure 12. The suction vortex appearing and moving on hydraulic collection flow field (L = 0.02 ± 0.005 m, the suction vortex tube appearing between two green curves and blue arrows indicates the moving direction of suction vortex tube). (a) the flow-rate Q = 105 m3/h, (b) the flow-rate Q = 115 m3/h.
Jmse 12 01543 g012
Figure 13. The probability density of the vertical suction force FV of the regular dodecahedral particles (dp = 0.015 m, h = 0.035 m). (a) Flow rate, Q = 110 m3/ h, the probability density of suction force of particles at S = 0, 0.01, 0.02, and 0.04 m, respectively; (b) the probability density of suction force of particles at different flow rates (Q = 95 m3/ h and Q = 110 m3/h) and positions (S = 0 and S = 0.020 m, respectively).
Jmse 12 01543 g013
Figure 14. The probability density of the vertical starting suction force FV with different suction flows (S = 0 m, dp = 0.025 m, H = 0.045 m).
Jmse 12 01543 g014
Figure 15. The effect of different particles and different displacements on Fd (dp = 0.015 m, H = 0.035 m, Q f = 110 m3/h, R = 0.16 m). (a) Vertical mean of pulling force F v , (b) horizontal mean drag force F l .
Jmse 12 01543 g015
Figure 16. The vertical and horizontal distributions of suction force Fd with different Φ and S/R ( Q f = 110 m3/h, H = 0.035 m). (a) The vertical suction force F v , (b) the horizontal suction force F l .
Jmse 12 01543 g016
Figure 17. Effect of Φ and S/R on the k c (dp = 0.015 m, Q f = 110 m3/h, H = 0.035 m). (a) Vertical suction coefficient ratio kvl = Cvn/Cvs, (b) horizontal suction coefficient ratio kcl = Cln/Cls.
Jmse 12 01543 g017
Figure 18. Effect of H/dp and R/H on the k c . (a) Vertical suction coefficient ratio kcv = Cv8/Cvs, (b) horizontal suction coefficient ratio kcl = Cl8/Cls.
Jmse 12 01543 g018
Figure 19. Effect of R/H and S/R on the k c . (a) Vertical suction coefficient ratio kcv = Cv8/Cvs, (b) horizontal suction coefficient ratio kcl = Cl8/Cls.
Jmse 12 01543 g019
Table 1. The e and f of particles.
ef
Value RangeQuantityValue RangeQuantity
0.9–1180.9–17
0.7–0.9550.7–0.919
0.5–0.7340.5–0.742
0.3–0.5110.3–0.531
<0.31<0.320
total119 119
Table 2. Type of polyhedron.
Approximate ShapeGeometric FigureRange of Form FactorsQuantityWeight/g
convex polyhedron shapeJmse 12 01543 i001e > 0.4 and f ≥ 0.47247.8
flat shapeJmse 12 01543 i002e > 0.4 and f < 0.43120.6
belt shapeJmse 12 01543 i003e ≤ 0.4 and f ≤ 0.4128.9
other irregular shape42.7
total 11980
Table 3. Geometrical properties of particles.
PolyhedronRegular TetrahedronRegular HexahedronRegular OctahedronRegular DodecahedronRegular IcosahedronSphere
equivalent grain/dp0.61L41.24L60.97L82.45L121.61L20dpb
sphericity/ 0.6750.8050.8530.9130.9401.000
circumcircle/du2.012dp41.397dp61.464dp81.146dp121.182dp20dps
Note: Ln is the edge length of the regular polyhedron, and dpn is the equivalent particle diameter of the regular polyhedron.
Table 4. The experimental conditions for the hydraulic collection of particles.
Order Number Sphericity / Horizontal Position/S (m)Height of Hood to Bottom/H (m)Equivalent Diameter/dp (m) Suction   Flow - Rate / Q f (m3/h)Cone-Shaped Hood/R (m)Remarks
10.805, 100.02, 0.04, 0.060.008350.05Section 4.1
2100.0350.015105, 1150.16Section 4.3
30.9400, 0.01, 0.02, 0.040.0350.01595, 1100.16Section 4.3 Figure 13
4100.0450.02595, 105, 1150.16Section 4.3 Figure 14
50.675, 0.805, 0.853, 0.913, 0.940, 10, 0.01, 0.02, 0.04, 0.06, 0.08, 0.10, 0.12, 0.14, 0.16, 0.17, 0.180.0350.0151100.16Section 5.1
60.675, 0.805, 0.853, 0.913, 0.940, 10, 0.02, 0.08, 0.14, 0.160.035 0.015 110 0.16 Section 5.2
70.853, 10, 0.02, 0.08, 0.14, 0.160.035 0.005 ,   0.01 ,   0.015 ,   0.02 ,   0.025 105 0.16 Section 5.3
80.853, 10, 0.02, 0.08, 0.14, 0.160.035, 0.045, 0.055, 0.065 0.015 105 0.16Section 5.4
Disclaimer/Publisher’s Note: The statements, opinions and data contained in all publications are solely those of the individual author(s) and contributor(s) and not of MDPI and/or the editor(s). MDPI and/or the editor(s) disclaim responsibility for any injury to people or property resulting from any ideas, methods, instructions or products referred to in the content.

