Abstract
Marine soft clay is widely distributed in coastal areas. Aiming at the characteristics of low strength and stress level of marine soft clay, the effects of normal stress, water content, and resting time on the pile–soil interface shear characteristics of marine soft clay–jacked piles were investigated using improved direct shear test equipment. On this basis, a practical interface shear strength prediction model considering the above factors is proposed. The test results show that the relationship between shear stress and shear displacement at the pile–soil interface can be divided into three stages—initial, transitional, and stable—and the relationship is in accordance with the hyperbolic model. Under the same water content and resting time, the interface peak shear stress increases linearly with the increase in normal stress. The interface peak shear displacement decreased with the increase in normal stress. Under different water content conditions, the peak shear stress decreases with increasing water content, while the corresponding peak shear displacement increases. The internal friction angle and adhesion at the pile–soil interface decreased rapidly and exponentially with increasing water content of the soil around the pile. The interfacial adhesion varies in the range of 1.07–13.76 kPa and the internal friction angle in the range of 1.8–6.1°. The change in water content when the water content of marine soft clay is less than the liquid limit has a great influence on the interface shear strength. The peak shear stress increases with increasing resting time, while the corresponding peak shear displacement decreases for different resting times. The Internal friction angle and adhesion at the pile–soil interface increases exponentially with the resting time. Interfacial adhesion changes in the range of 1.8–4.9 kP, and the internal friction angle is 2.8–4.7°. The strength of the pile–soil interface grows with the advancement of the resting time, and the bearing performance of the jacked pile is improved, with the most significant effect in 14 days. Based on multiple linear regression analyses, the effects of normal stress and water content on interfacial shear strength are comparable and the effect of normal stress on the shear strength is more significant compared with the resting time. The test results provide valuable reference for the design and construction of jacked piles in marine soft ground.
1. Introduction
Marine soft clay is widely distributed in coastal, marine, and deltaic sedimentary environments, such as the southeast coast of China [1], the southeast delta of Vietnam [2], and the eastern and western coasts of India [3]. It has undesirable engineering properties, such as high compressibility, high water content, and low shear strength [4,5,6,7]. This makes it difficult for general engineering of pile types to effectively and economically meet the foundation-bearing capacity and settlement requirements for engineering construction [8,9]. High-strength concrete pipe piles with static jacking pressure method have been widely used in soft soil areas due to their advantages of high bearing capacity, reliable quality, short forming and maintenance time, low construction noise, fast construction speed, little environmental pollution, and low cost [10,11,12,13]. The jacking force of jacked piles during pile driving and the bearing capacity after pile driving are composed of pile skin friction and pile end resistance [14]. Most scholars have studied the penetration mechanism and bearing capacity of jacked piles by field tests, model tests, and numerical simulation methods, revealing the distribution law of soil pressure at the pile–soil interface and the influence of pile–soil contact parameters [15,16,17,18]. Pra-ai et al. [19] and Westgate et al. [20] showed that the mechanical behaviour of the interface has a substantial effect on the structural response. The shear characteristics between the jacked pile and the surrounding soil on the piles during and after pile driving play an important role in revealing the bearing mechanism of the jacked pile [13,21,22]. Furthermore, in terms of material constitutive modelling for clays, the progress is substantial and the analyses provide more accurate estimations to engineers [23,24]. Therefore, it is important to study the contact characteristics and mechanical laws of jacked piles with the surrounding strata.
The interfacial shear properties between soil and structure are influenced by factors such as soil water content, soil density, structural surface roughness, normal stress, cyclic loading amplitude, and cyclic loading frequency [25,26,27,28,29,30,31,32,33,34]. Chuang et al. [35] investigated the factors affecting water migration and shear strength at the cement mortar–soil interface using a large number of samples. The results showed that at the same pore ratio, water content, and water–cement ratio, the water migration in clay was greater than that in sandy clay. After pouring cement mortar, the shear strength of the soil decreased due to local softening. The shear failure surface occurred about 3.175 mm from the surface of the cement mortar. Lin et al. [36] evaluated the shear properties of structure–silty clay interfaces through a series of direct shear tests on a 30 cm2 shear area and proposed a multivariate linear regression model to predict the interface shear strength parameters for different structural materials, soil densities, water content, and freeze–thaw cycles. Zhang et al. [37] studied the shear performance of a carbonized soil-permeable concrete interface through a series of direct shear tests, taking into account factors such as carbonation time, MgO content, and initial water content, and proposed a practical model for predicting the shear strength of the interface. Zhou et al. [17] investigated the frictional bearing capacity of a precast concrete pile–soil interface through a series of shear tests. The tests showed that the frictional bearing capacity of the precast pile–soil interface depends largely on the strength of the soil, and a correlation coefficient between the maximum frictional resistance of the interface and the strength of the soil was proposed. Wang et al. [38] used a large-scale direct shear test system to conduct an experimental study on the interface shear characteristics of silty clay–concrete under different roughness conditions. Liu et al. [39] studied the interfacial shear and mechanisms of soil–concrete, sand–concrete, clay–concrete, and other materials in different curing periods by using a large-scale interfacial shear device developed by themselves under variable normal stress repeated loading and continuous loading modes. The results showed that the curing effect of soil–cement can significantly improve the shear mechanical properties of the interface and that the friction coefficient of the soil–cement interface will increase gradually with the increase in soil–cement curing time. Li et al. [40] conducted a series of direct shear tests on a concrete pipe–sand interface with different water content in the laboratory. They found that the increase in normal stress makes the interface more prone to strain hardening, and the influence of the change In water content on the Interface strain characteristics Is gradually weakened. DeJong and Westgate [20,30] considered the relative density of sandy soils, particle angle, particle hardness, and structural surface roughness on sand–structure interaction through a series of direct shear tests over a 63.5 cm2 shear area. Konkol et al. [41] studied the frictional behaviour of organic clay, organic silt, peat, and silty loam at an interface with concrete based on a 36 cm2 shear area constant normal load direct shear test, which showed that the adhesion force varied significantly with the interface and soil type, and they established hyperbolic interface model parameters. Kuo et al. [42] investigated the interfacial friction behaviour between marine soft clay and concrete, steel, and wood using a modified direct shear device with a soil sample area of 28.3 cm2 and a structural surface area of 100 cm2, taking into account the effects of structural surface roughness, moisture content, and interfacial friction angle factors. It was found that the interface friction angle decreases with the increase in water content. For the interface with different roughness, when the water content exceeds a certain value, the interface friction angle will be less than the friction angle of the soil. The effects of interface roughness and soil water content on the friction coefficient are coupled with each other.
The above studies mainly Investigated the shear characteristics between different soils and different structural materials. The influence of soil properties and structural interface characteristics were considered, but there are few studies on the interface of jacked piles and marine soft clay considering normal stress, water content, and resting time. Field tests have shown that the bearing capacity of jacked piles may increase with time [43,44,45]. Natural soft soils reach a state of remoulding due to external disturbance of the soil, followed by a gradual recovery of strength and stiffness with time [46]. It can be seen that the influence of resting time on the bearing capacity of jacked piles cannot be ignored. Moreover, regarding the determination of water content of soil samples, most of the studies ranged from 16.7% (34.4% of the liquid limit) to 60% (62% of the liquid limit) [32,37,42]. In contrast, marine soft clay is mostly located in coastal areas, where the water content is greater than its liquid limit value [5,6]. This point is less considered by researchers in terms of interfacial shear characteristic tests.
Based on the previous research, this paper investigates the shear characteristics of the contact surface of marine soft clay and jacked piles using an improved direct shear test method, considering the factors of normal stress, water content, and resting time for the characteristics of the contact surface of pile–soil for the nature of low stress level in marine soft clay. The changing characteristics of the interface stress–deformation law and shear strength and its parameters are analysed. On this basis, a practical interface shear strength prediction model considering normal stress, water content, and resting time is proposed. The test results provide a reference for the design and construction of jacked piles in marine soft clay.
2. Interface Shear Characteristic Test Scheme
2.1. Preparation of Test Materials
Marine soft clay was taken from the offshore area of Lianyungang, Jiangsu Province. The soil samples were air-dried, crushed, and stored through a 2 mm sieve. The basic physical properties of marine soft clay were determined according to the standard for geotechnical testing [47], as shown in Table 1. The material of the jacked pile is concrete, and its sand–binder ratio is 4 and water–binder ratio is 0.45 [48]. A copper shear box lower container of the same size as the ring cutter was prepared by pouring a well-mixed slurry of pile material into it and placing it on a vibrating table to vibrate it to remove pores from the slurry. Subsequently, the pile material was cured for 3 days [49] and the pile material was moulded. The inside of the container in the lower part of the shear box is coated with Vaseline for the purpose of easy demoulding of the specimen after the maintenance is completed. The sample size is 30 cm2 cross-sectional area [36] and thickness is 2 cm. Then, the pile material specimen is placed in the tray, the upper layer is filled with the disturbed soil sample with a certain water content, and left to be maintained. The centre of the specimen placement is marked on the soil surface. At the appropriate maintenance time, the pile material and the marine soft clay combine were taken out using a ring cutter and placed in a shear box for testing. Sample disturbance should be reduced during sampling. The sample making process Is shown In Figure 1.

Table 1.
Physical property indexes of marine soft clay.
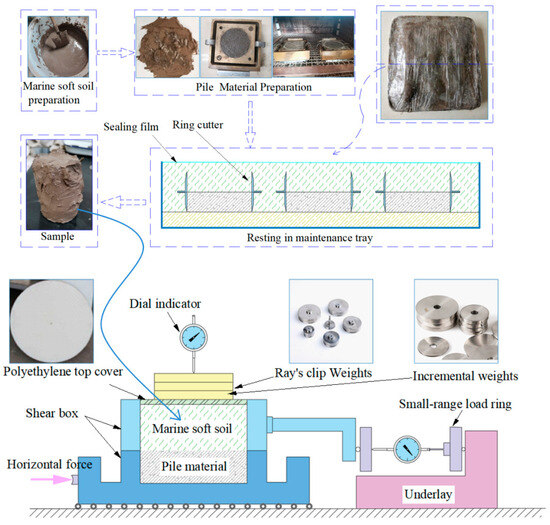
Figure 1.
Schematic diagram of shear test.
2.2. Improvement of Test Methods and Equipment
Currently, there is no agreement on specimen sizes for interfacial shear tests because of the lack of consensus in the academic community [20,30,31,34,36,42,50,51]. This experiment was aimed at characterising the low strength of marine soft clay in order to prevent lateral extrusion occurring during the specimen loading process that would result in flow damage. In this paper, an SDJ-1-type electric constant strain direct shear instrument is improved. Specific improvement measures are as follows. (1) Replace the 50 kg load ring with 6 kg. (2) In order to accurately read the normal stress below 25 kPa load, the lever loading method was cancelled in the test. A combination of customised Ray’s clip weights and incremental weights was used directly. (3) In order to reduce shear resistance, the upper shear box and the pressurized top cover are processed with high-density polyethylene. During the test, apply Vaseline to the upper and lower shear box contact surfaces. The improved direct shear device is shown in Figure 1. (4) Through many attempts, the normal loading stages of the interface direct shear test of the marine soft clay–jacked pile were determined, which were 3.125 kPa, 6.25 kPa, 12.5 kPa, 25 kPa, 50 kPa, 100 kPa, and 200 kPa. Load step by step from small to large, and adjust the loading stage according to the strength of the soil sample.
2.3. Test Scheme
(1) Considering the working conditions of the jacked pile, the direct shear test is carried out under undrained conditions. That is, the quick direct shear test method was used and the shear rate was set to 0.8 mm/min [36,47].
(2) The water content of soil samples varied between 20% and 60% in previous studies [37,42]. In this paper, five specimens of remoulded marine soft clay with different water content were prepared. The measured water content of the five specimens was 42.7%, 52.7%, 62.7%, 67.7% and 72.7%. It should be noted that the measured densities ranged from 1.70 to 1.58 g/cm3 and the dry densities ranged from 1.13 to 0.92 g/cm3 due to the water content of the soils being between 42.7% and 72.7%. The dry density of the soil with water content of more than 55% was around 1.00 g/cm3. The marine soft clay is widely distributed in the coastal area, the natural water content is large, mostly in the saturated state, and the range of variation in dry density is small, which is difficult to control during the test. Therefore, the effect of soil density on the interfacial shear test was not considered in this study.
(3) When the water content of the soil samples is in the liquid limit, the design resting time is 0, 3, 7, 14, and 28 days. The sample with a resting time of 0 days is achieved by direct daubing. Samples requiring a resting time were carved directly from the maintenance tray together with the pile material samples for maintenance, as shown in Figure 1.
(4) Due to the low strength of the test soil samples, to avoid lateral extrusion during the tests resulting in unsuccessful specimen production, the test loading after adjusting the load level was 3.125 kPa, 6.25 kPa, 12.5 kPa, 25 kPa, 50 kPa, 100 kPa, and 200 kPa. For specimens with low water content, the load level is high, and for specimens with high water content, the load level is low.
(5) Parallel tests were conducted for each operating condition.
3. Shear Stress–Shear Displacement Curve of the Interface
The relationship curves between the shear stress and shear displacement at the interface of marine soft clay–jacked pile under different water content and resting time were obtained through experiments, as shown in Figure 2, Figure 3 and Figure 4. The τ–s curve of resting time T = 0 days can be seen in Figure 2c.
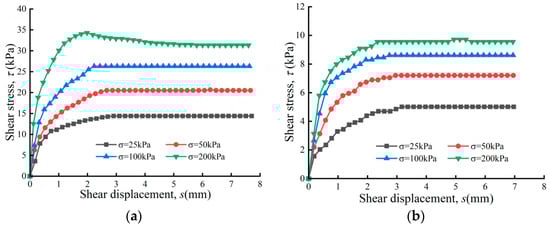
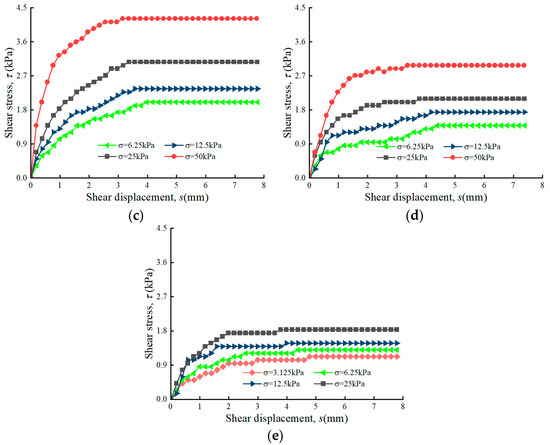
Figure 2.
Relationship between interfacial shear stress and shear displacement (τ–s) at different water content: (a) w = 42.7%; (b) w = 52.7%; (c) w = 62.7% (T = 0 days); (d) w = 67.7%; (e) w = 72.7%.
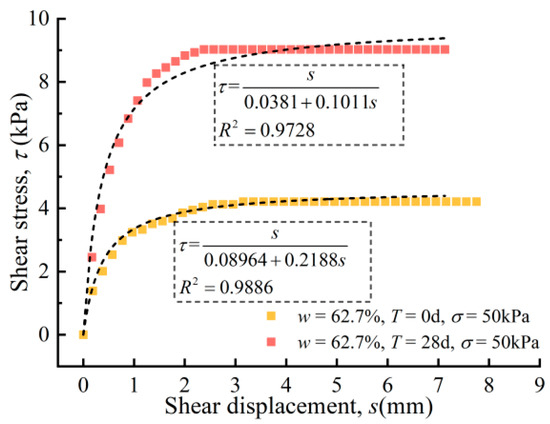
Figure 3.
Typical curve fitting relationship between shear stress and shear displacement (τ–s).
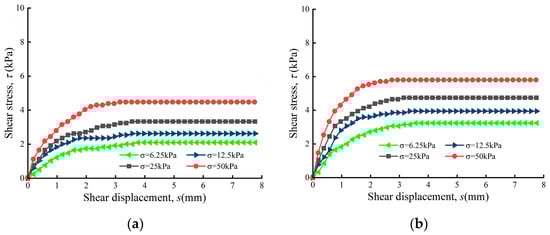
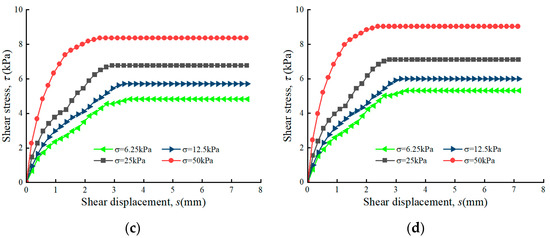
Figure 4.
Interface shear stress–shear displacement (τ–s) relationship at different resting time: (a) T = 3 days; (b) T = 7 days; (c) T = 14 days; (d) T = 28 days.
(1) The relationship between interfacial shear stress and shear displacement change can be divided into three stages. At the initial stage, the shear stress increases linearly with the increase in shear displacement. In the transition stage, the shear stress presents a nonlinear increase and the growth rate gradually slows with the increase in shear displacement. In the stable phase, the shear stress peaks and then tends to stabilise, showing basically a strain hardening phenomenon, which is consistent with the findings of Kuo [42]. Figure 2a shows that the shear stress reaches its peak at 200 kPa normal stress and then decays, i.e., strain softening occurs. This shows that the interfacial shear stress–shear displacement relationship changes from strain hardening to strain softening when the soil sample has low water content and high normal stress. Additionally, it can also be seen that the interface shear stress–shear displacement relationships all approximate the ideal elastoplastic model relationship changes after the higher water content of the marine soft clay on the side of the pile reaches the liquid limit value. The transition stage is not obvious.
(2) The relationship between the change in interface shear stress and shear displacement can be fitted by the hyperbolic model τ = s/(a + bs), and the correlation is significant. Data fitting follows the principle of least squares where a and b are the fitting parameters. The shear stress–shear displacement curves with 62.7% water content and 0 and 28 days (normal stress 50 kPa) of resting time were selected as typical examples, and the fitted relational equations were τ = s/(0.0381 + 0.1011 s) and τ = s/(0.08964 + 0.2188 s), respectively, as shown in Figure 3.
(3) The interfacial shear stress increases with the increase in normal stress and shear displacement. Under the same normal stress condition, the interfacial shear stress decreases with the increase in water content and increases with the passage of standing time.
4. Influence of Normal Stress on Shear Characteristics of Pile–Soil
4.1. Peak Shear Stress
Figure 5 and Figure 6 show the variation in peak shear stress τf with normal stress σ for different water content w and resting time T, respectively. In Figure 5 and Figure 6, it can be seen that the peak interfacial shear strength τf increases nearly linearly with the increase in normal stress σ for the same water content or resting time. This indicates that as the depth of the jacked pile into the soil increases, the pile–soil interface shear strength also increases linearly (i.e., the pile skin friction increases), thus improving the bearing capacity of the jacked pile. Furthermore, as can be seen in Figure 5, the water content of the marine soft clay increases from 42.7% to 52.7% and the interfacial peak shear strength decreases from 34.30 kPa (200 kPa normal stress) to 9.55 kPa (200 kPa normal stress), which is a more significant attenuation. The peak strength decay slows down after the water content is greater than 62.7%. Figure 6 shows that the peak intensity increases faster at resting times of 3–7 days and 7–14 days, which will be analysed in detail later.
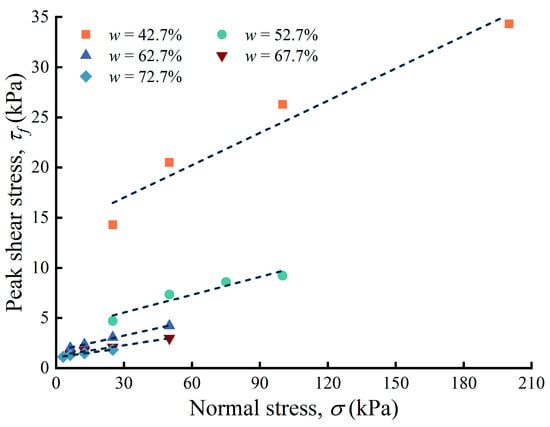
Figure 5.
Curve of τf–σ relationship (variation in water content w).
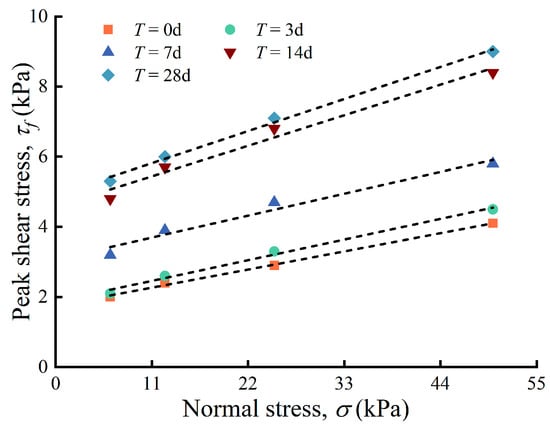
Figure 6.
Curve of τf–σ relationship (variation in resting time T).
Based on the relationship of τf–σ curves in Figure 5 and Figure 6 to obtain the fitting formula of shear strength under different water content and resting time, the correlation between the two is significant, which is in line with the Coulomb strength equation. See Table 2 and Table 3 for details. The measured adhesion varied from 13.76 to 1.07 kPa and the angle of internal friction varied from 6.1° to 1.8° at 42.7–72.7% water content (resting time 0 days). Under the condition of 0–28 days of resting time (water content 62.7%), the variation in adhesion was in the range of 1.8–4.9 kPa and the variation in internal friction angle was in the range of 2.8–4.7°.
Table 2.
Fitting results of τf–σ relationship for different water content.
Table 3.
Fitting results of τf–σ relationship for different resting times.
4.2. Peak Shear Displacement
Figure 7 and Figure 8 show the variation in peak shear displacement sf with normal stress σ for different water content w and resting time T, respectively. In Figure 7 and Figure 8, it can be seen that the peak interfacial shear displacement sf decreases with the increase in normal stress σ at the same water content or resting time. This indicates that the higher the normal stress, the smaller the relative displacement required for shear damage at the pile–soil interface.
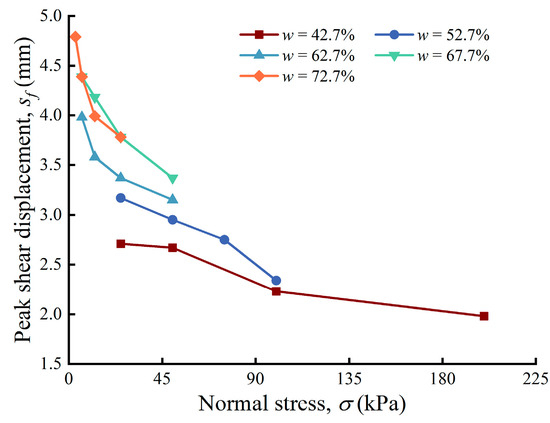
Figure 7.
Curve of sf–σ relationship (variation in water content w).
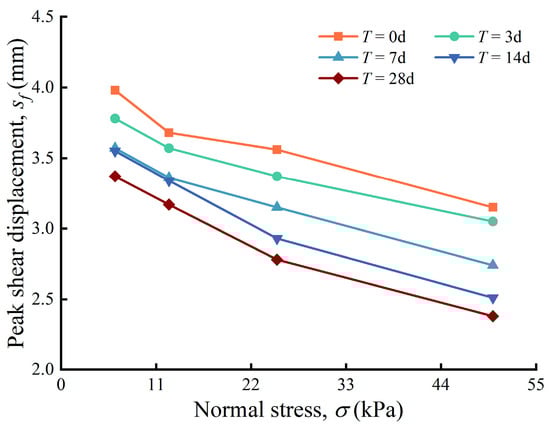
Figure 8.
Curve of sf–σ relationship (variation in resting time T).
5. Influence of Water Content on Shear Characteristics of Pile–Soil Interface
5.1. Peak Shear Stress and Peak Shear Displacement
Figure 9 shows the relationship curves between the peak shear stress τf and the corresponding peak shear displacement sf for different water content conditions. As can be seen from Figure 9, at 42.7% water content, the normal stress is 25–200 kPa, the peak shear stress increases from 14.25 kPa to 34.30 kPa, and the peak shear displacement decreases from 2.71 mm to 1.98 mm. At 52.7% water content, the normal stresses are the same, the peak shear stresses vary between 5.01 and 9.55 kPa, and the peak shear displacements are between 3.17 and 2.34 mm. When the water content is 72.7%, the peak shear stress and peak shear displacement vary in the ranges of 1.12–1.83 kPa and 4.79–3.78 mm, respectively (normal stress 6.25–50 kPa). It can be seen that the peak shear stress τf decreases with increasing water content, while the corresponding peak shear displacement sf is increasing. This indicates that as the water content of the soil around the pile increases, the strength of the soft marine soil becomes less and less, and the strength of the pile–soil interface also decreases. At this point, the strength of the pile–soil interface is in full play and the required shear displacement is greater.
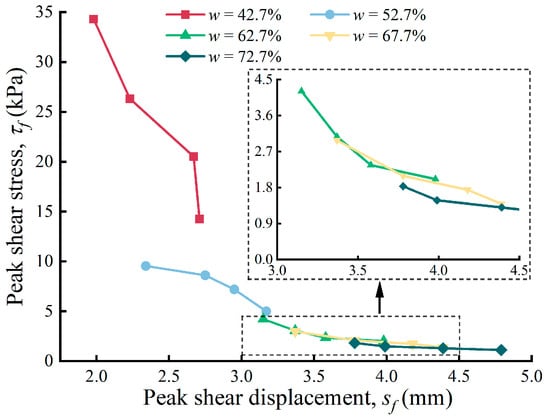
Figure 9.
Curve of sf–τf relationship (variation in water content w).
5.2. Variation Rules of Shear Strength Parameters
The shear strength parameters, namely, the internal friction angle φ and adhesion c, were determined by fitting the τf–σ curve relationship in Table 2 under various moisture content conditions. The relationship equations of internal friction angle φ, adhesion c, and water content w were obtained by fitting Equation (1) and Equation (2), respectively, which are shown in Figure 10.
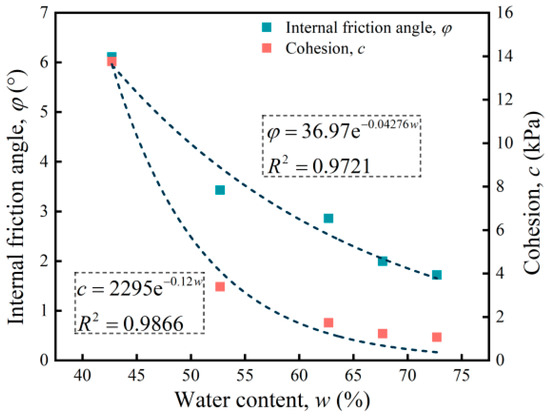
Figure 10.
Relationship between angle of internal friction angle φ, adhesion c, and water content w.
In Figure 10, it can be seen that the internal friction angle φ and adhesion c of the jacked pile–soil interface decrease rapidly and exponentially with the increase in the water content of the soil around the pile, and the correlation is significant. This shows that the change in water content of the marine soft clay around the pile has a great influence on the shear strength of the pile–soil interface, which in turn affects the bearing performance of the static pile. According to the strength parameter decay rate, the water content of the soil around the pile increased from 42.7% to 62.7%, the strength parameter decay reached about 95%, and the decay rate slowed down significantly after it was greater than the liquid limit. It is shown that the change in water content before the liquid limit of the marine soft clay has a significant effect on the interfacial shear strength.
6. Influence of Resting Time on Shear Characteristics of Pile–Soil Interface
6.1. Peak Shear Stress and Peak Shear Displacement
Figure 11, Figure 12 and Figure 13 show the relationship curves between the peak shear stress τf and the corresponding peak shear displacement sf, the peak shear stress τf and the peak shear displacement sf, and the resting time T for different resting times T, respectively. In Figure 12, the peak shear stress increases more rapidly from 3–14 days. That is, at a normal stress of 6.25 kPa, the peak shear stress changes to 2.01 kPa (0 days) → 2.10 kPa (3 days) → 4.80 kPa (14 days). The growth rate at 3 days of resting time is 4.5% (based on 0 days) and reaches 138.8% at 14 days. At 50 kPa normal stress, the peak shear stress varied from 4.21 kPa (0 days) → 4.50 kPa (3 days) → 8.40 kPa (14 days), with the growth rate increasing from 6.9% at 3 days to 99.5%. The growth in peak shear stress slows at 14–28 days. This is mainly due to the loss of structural strength of the marine soft clay in the remoulded state and the gradual recovery of the structural strength between the soil particles with the resting time [46], which makes the peak shear stress at the pile–soil interface grow less during the periods of 0–3 days and 14–28 days. This explains the similarity in the pattern of change in peak shear stress versus shear displacement for 0 days and 3 days and 14 days and 28 days, exhibited in Figure 11. This shows that the shear strength of the interface between the jacked pile and the surrounding soils grows faster and reaches the peak growth rate from 7 to 14 days. The peak shear strength after 14 days does not grow much.
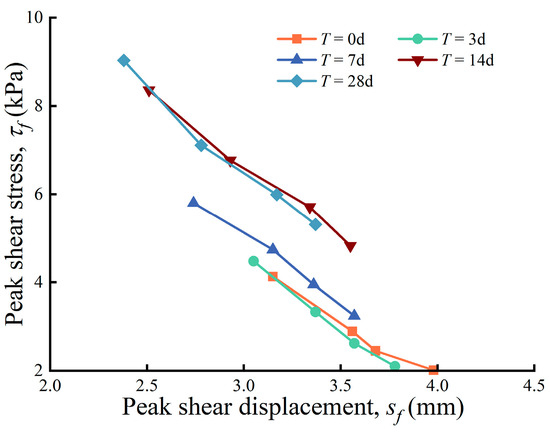
Figure 11.
Curve of sf–τf relationship (variation in resting time T).
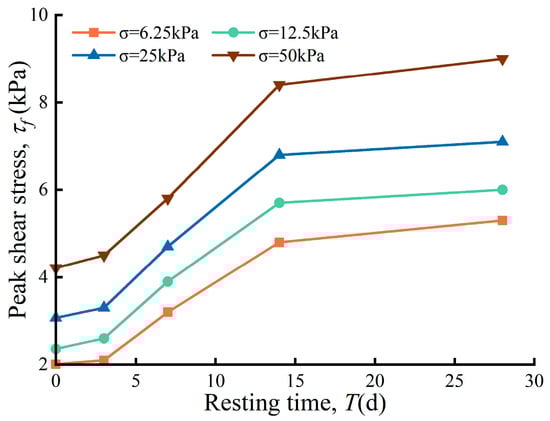
Figure 12.
Curve of the τf–T relationship (variation in normal stress σ).
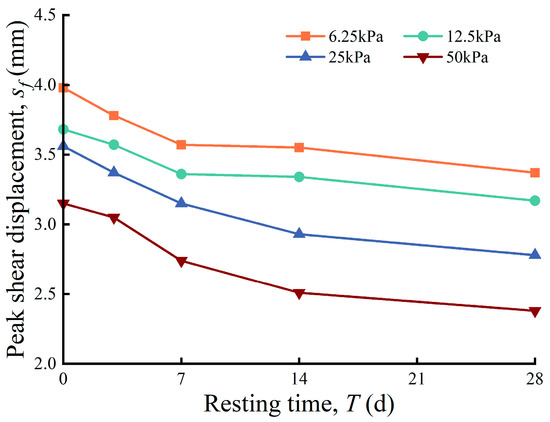
Figure 13.
Curve of sf–T relationship (variation in normal stress σ).
Figure 11 and Figure 13 show the relationship curves between the peak shear stress τf and the corresponding peak shear displacement sf, peak shear displacement sf and the resting time T for different resting times T, respectively. It can be seen that the peak shear stress τf increases with the increase in the resting time T, while the corresponding peak shear displacement sf is decreasing. This indicates that the longer the resting time, the greater the peak shear strength of the pile–soil interface and the smaller the peak shear displacement at which the pile–soil interface reaches damage. Conversely, the shorter the resting time, the smaller the peak shear stress at the pile–soil interface and the larger the peak shear displacement at which the pile–soil interface reaches damage. To maximise the pile–soil interface strength, the required shear displacement needs to be greater.
6.2. Variation Rules of Shear Strength Parameters
The shear strength parameters, internal friction angle φ, and adhesion c at different resting times T were calculated from the τf–σ curve-fitting relationship in Table 3. The fitted equations for the relationship between the internal friction angle φ, the adhesion c, and the resting time T were obtained as Equations (3) and (4), respectively, as detailed in Figure 14. In Figure 14, the internal friction angle φ and adhesion c of the pile–soil interface of the jacked pile all increase exponentially with the increase in the resting time T, and the correlation is significant. According to the change in shear strength parameters, the interfacial adhesion increased by 90.4% within 14 days of resting (based on resting time T = 0 days), and the interfacial internal friction angle increased by 83.4%, whereas the strength increase during the resting time is very small over 15–28 days. This indicates that after the jacked pile is driven into the stratum, with the prolongation of resting time, the marine soft clay disturbed around the pile produces consolidation and restores the structural strength such that the strength of the pile–soil interface is gradually improved, which in turn improves the bearing performance of the jacked pile. The improvement effect in the first 14 days especially is more obvious. This is in good agreement with experimental results in the literature [43,45].
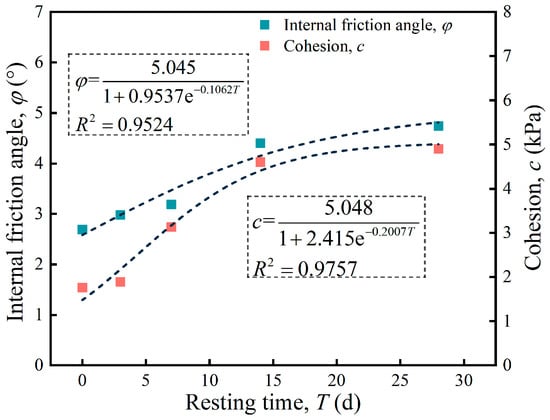
Figure 14.
Relationship between internal friction angle φ, adhesion c, and resting time T.
7. Prediction Model of the Marine Soft Clay–Jacked Pile Interface
In order to optimise the effects of normal stress, soil water content, and resting time on the peak shear strength of the marine soft clay–jacked pile interface, a practical interface peak shear strength prediction model is established to provide reliable theoretical support for engineering applications. The results of the above analyses show that the water content and the resting time of the marine soft clay vary linearly with the interfacial shear strength. The literature [37] has shown that the factors influencing the shear properties of the soil–structure interface are coupled with each other. Therefore, we used Matlab software to analyse the results of the marine soft clay–jacked pile shear test by binary linear regression. The influencing factors were classified into two groups, i.e., normal stress and soil water content coupling, and normal stress and resting time coupling. The main reason for considering the influencing factors separately is that the resting time factor was only considered in the test data at 62.7% water content of soft soil. Therefore, it was not possible to perform a multivariate linear analysis of normal stress, water content, and resting time.
Due to the high water content of the marine soft clay storage environment, the clay exists as a crust layer with low water content only by surface weathering. As such, the regression analyses consider marine soft clay with water content between 52.6% and 72.7%, normal stresses in the range of 6.25–50 kPa, and resting time of 0–14 days. The influencing factors were set as the independent variables and the interface shear strength as the dependent variable. The binary linear regression equations for interfacial shear strength are:
where w, T, and σ are the initial water content, resting time, and normal stress of the marine soft clay, respectively.
Equation (5) is the binary linear prediction model of interfacial peak shear strength versus normal stress and soil water content for a resting time of 0 days. Equation (6) is the binary linear prediction model of interfacial peak shear strength versus normal stress and resting time for soil water content of 62.7%. The correlation coefficients (R2) of the two binary regression models were 0.966 and 0.996, respectively, which shows that the predictive model has a strong linear fit. This indicates that the linear relationship between the interfacial shear strength and the influencing parameters is reasonable and that the effects of normal stress and soil water content on the interfacial shear strength are coupled with each other. In addition, the standardised regression coefficients obtained by fitting the two sets of respective variables were −0.443 and 0.484 and 0.406 and 0.792, respectively. The results show that the influence of normal stress and water content on interfacial shear strength is similar, and the influence of normal stress on shear strength is more significant than that of resting time. This is consistent with the conclusion obtained by Hu et al. [33] using particle swarm optimization to obtain a sensitivity analysis of the shear strength of marine soft clay and that normal stress has a significant influence on the peak shear strength of marine soft clay.
8. Conclusions
Focusing on the very low strength of marine soft clay, the loading method of direct shear testing was improved and the low stress level loading was determined. A series of quick shear direct shear tests on marine soft clay–jacked pile interface were carried out on marine soft clay in Lianyungang, and the effects of normal stress, water content, and resting time on the shear characteristics of the pile–soil interface were investigated. Based on the analysis of the influencing factors, an interface shear strength prediction model was established. The main findings are as follows.
- (1)
- The peak interfacial shear strength τf increases with the normal stress σ at the same water content or resting time, nearly linearly, in accordance with the Coulomb equation. The peak interfacial shear displacement sf decreases with increasing normal stress σ. Under different water content conditions, the peak shear stress τf decreases with increasing water content, while the corresponding peak shear displacement sf increaswa. Under different resting times, the peak shear stress τf increases with increasing resting time T, while the corresponding peak shear displacement sf decreases.
- (2)
- The internal friction angle φ and adhesion c at the pile–soil interface varied as a power function of soil water content and resting time. At the soil water content of 42.7–72.7%, the interfacial internal friction angle φ and adhesion c change were in the range of 13.76–1.07 kPa and 6.1–1.8°, respectively. For the resting time of 0–28 days, the internal friction angle and adhesion varied in the range of 1.8–4.9 kPa and 2.8–4.7°, respectively. The water content increased from 42.7% to 62.7%, and the decay of the interface strength parameter reached about 95%. The strength parameters increased by more than 80% within 14 days of resting time.
- (3)
- Based on multiple regression analyses, it is found that normal stress and water content have equivalent effects on interfacial shear strength. The influence of normal stress on the shear strength is more significant when compared to the resting time.
This study reveals that as the water content of the soil around a jacked pile increases, and the shorter the resting time is, the lower the pile–soil interface frictional resistance. A greater shear displacement is required to give full play to the strength of the pile–soil interface. As the depth of the jacked pile in the soil increases, the pile–soil interface shear strength also increases linearly (i.e., the pile skin friction increases), and the pile bearing capacity is improved. With the prolongation of resting time, the consolidation effect can improve the strength of the pile–soil interface, thus enhancing the bearing performance of the jacked pile, especially the most obvious effect in the first 14 days.
Jacked piles are widely used in coastal engineering, and the measurement of pore water pressure plays an important role in the time-dependent change in the shear characteristics of the marine soft clay–jacked pile interface, which can reveal the evolution of the bearing mechanism of the jacked piles after they are driven in. Future in-depth studies on pore water pressure dissipation characteristics during the shear process at the marine soft clay–jacked pile interface are also necessary.
Author Contributions
Conceptualization, C.Y. and F.C.; methodology, F.C. and C.Y.; formal analysis, C.Y., F.C., Z.W. and T.Z.; investigation, F.C., Z.W., T.Z. and H.S.; writing—original draft preparation, C.Y. and F.C.; writing—review and editing, C.Y., F.C. and T.S.; funding acquisition, C.Y. and T.S. All authors have read and agreed to the published version of the manuscript.
Funding
This research was funded by China Railway 11 First Group Co., Ltd. Scientific Research Project (50200010594) and the National Natural Science Foundation of China (52178340).
Institutional Review Board Statement
Not applicable.
Informed Consent Statement
Not applicable.
Data Availability Statement
The datasets used during the current study are available from the corresponding author upon reasonable request.
Acknowledgments
Thanks to Ziwei Xu and Xinye Li for their assistance in laboratory tests.
Conflicts of Interest
The authors declare no conflicts of interest.
References
- Guo, L.; Jin, H.X.; Wang, J.; Shi, L. Undrained monotonic shear behavior of marine soft clay after long-term cyclic loading. Mar. Georesources Geotechnol. 2020, 38, 854–866. [Google Scholar] [CrossRef]
- Giao, P.H.; Thoang, T.T.; Hiep, H.; Hien, D.H.; Van Long, P.; Van Kieu, N.; Dung, N.T. Geological-geotechnical correlation of a deltaic subsoil profile and characterization of its uppermost soft marine clay deposit with reference to infrastructure development in the Saigon-Dong Nai delta, Vietnam. Bull. Eng. Geol. Environ. 2023, 82, 441. [Google Scholar] [CrossRef]
- Rajasekaran, G.; Murali, K.; Srinivasaraghavan, R. Microfabric, chemical and mineralogical study of Indian marine clays. Ocean Eng. 1998, 26, 463–483. [Google Scholar] [CrossRef]
- Zhao, L.Y.; Shan, Z.G.; Wang, M.Y.; Ni, W.D.; Jin, H.X.; Shi, L. Undrained deformation behavior of marine clay under two-way cyclic loading. Mar. Georesources Geotechnol. 2024, 42, 465–474. [Google Scholar] [CrossRef]
- Xiao, W.B.; Wu, K.; Xu, W.B.; Liu, Y.J.; Lu, H.J.; Chen, R. Experiment and analysis on dynamic characteristics of marine soft clay. Mar. Georesources Geotechnol. 2024, 42, 1–21. [Google Scholar] [CrossRef]
- Wang, X.Y.; Sun, H.; Niu, F.J. Microstructure study of natural marine clay in loading and unloading processes. Eng. Geol. 2023, 327, 107363. [Google Scholar] [CrossRef]
- Pineda, J.A.; Suwal, L.P.; Kelly, R.B.; Bates, L.; Sloan, S.W. Characterisation of Ballina clay. Geotechnique 2016, 66, 556–577. [Google Scholar] [CrossRef]
- Ma, L.; Shen, S.L.; Luo, C.Y.; Xu, Y.S. Field Evaluation on the Strength Increase of Marine Clay under Staged Construction of Embankment. Mar. Georesources Geotechnol. 2011, 29, 317–332. [Google Scholar] [CrossRef]
- Chai, J.C.; Shrestha, S.; Hino, T. Failure of an Embankment on Soil-Cement Column-Improved Clay Deposit: Investigation and Analysis. J. Geotech. Geoenviron. 2019, 145, 05019006. [Google Scholar] [CrossRef]
- Kou, H.L.; Chu, J.; Guo, W.; Zhang, M.Y. Field study of residual forces developed in pre-stressed high-strength concrete (PHC) pipe piles. Can. Geotech. J. 2016, 53, 696–707. [Google Scholar] [CrossRef]
- Han, F.; Ganju, E.; Salgado, R.; Prezzi, M. Comparison of the load response of closed-ended and open-ended pipe piles driven in gravelly sand. Acta Geotech. 2019, 14, 1785–1803. [Google Scholar] [CrossRef]
- Wang, Y.H.; Sang, S.K.; Zhang, M.Y.; Bai, X.Y.; Su, L. Investigation on in-situ test of penetration characteristics of open and closed PHC pipe piles. Soils Found. 2021, 61, 960–973. [Google Scholar] [CrossRef]
- Li, Y.N.; Zheng, R.Y.; Deng, Y.B. Model Tests on Jacked Pile Penetration Characteristics Considering a Static Press-in Piling Machine. Appl. Sci. 2024, 14, 1985. [Google Scholar] [CrossRef]
- Igoe, D.; Gavin, K.; O’Kelly, B. Field tests using an instrumented model pipe pile in sand. In Proceedings of the 7th International Conference on Physical Modelling in Geotechnics (ICPMG 2010), Zurich, Switzerland, 28 June–1 July 2010; pp. 775–780. [Google Scholar]
- Kou, H.L.; Yu, F.; Liu, T. Strain Monitoring on PHC Pipe Piles Based on Fiber Bragg Grating Sensors. J. Perform. Constr. Facil. 2019, 33, 04019003. [Google Scholar] [CrossRef]
- Wang, Y.H.; Wang, X.; Li, S.Q.; Wang, J.; Zhang, C.T.; Li, Y. Field testing study on jacked pile penetration characteristics in laminated clay based on FBG sensing technology. Soil Dyn. Earthq. Eng. 2023, 168, 107848. [Google Scholar] [CrossRef]
- Zhou, J.J.; Yu, J.L.; Gong, X.N.; El Naggar, M.H.; Zhang, R.H. The effect of cemented soil strength on the frictional capacity of precast concrete pile-cemented soil interface. Acta Geotech. 2020, 15, 3271–3282. [Google Scholar] [CrossRef]
- Ding, X.B.; Shi, Y.; Chen, R.; Zhou, M. Friction anlysis of large diameter steel cylinder penetration process using 3D-DEM. Granul. Matter 2021, 23, 1–5. [Google Scholar] [CrossRef]
- Pra-ai, S.; Boulon, M. Soil-structure cyclic direct shear tests: A new interpretation of the direct shear experiment and its application to a series of cyclic tests. Acta Geotech. 2017, 12, 107–127. [Google Scholar] [CrossRef]
- Westgate, Z.J.; DeJong, J.T. Role of Initial State, Material Properties, and Confinement Condition on Local and Global Soil-Structure Interface Behavior during Cyclic Shear. J. Geotech. Geoenviron. 2023, 149, 04023088. [Google Scholar] [CrossRef]
- Wang, Y.H.; Sang, S.K.; Zhang, M.Y.; Liu, X.Y.; Yang, S.C. Field test of earth pressure at pile-soil interface by single pile penetration in silty soil and silty clay. Soil Dyn. Earthq. Eng. 2021, 145, 106666. [Google Scholar] [CrossRef]
- Xi, B.L.; Li, G.Z.; Chen, X.C. Experimental Study on Bearing Behavior and Soil Squeezing of Jacked Pile in Stiff Clay. Buildings 2023, 13, 2609. [Google Scholar] [CrossRef]
- Kavvadas, M.; Amorosi, A. A constitutive model for structured soils. Geotechnique 2000, 50, 263–273. [Google Scholar] [CrossRef]
- Savvides, A.A.; Papadrakakis, M. A computational study on the uncertainty quantification of failure of clays with a modified Cam-Clay yield criterion. SN Appl. Sci. 2021, 3, 659. [Google Scholar] [CrossRef]
- Zhou, J.; Liu, C.J.; Zhu, K.F.; Shen, P.P. Macroscopic behaviour and mesoscopic mechanism of shear strength characteristics of pile-soil interface under cyclic loading. Ocean Eng. 2024, 297, 116998. [Google Scholar] [CrossRef]
- Li, Y.H.; Lv, M.F.; Guo, Y.C.; Huang, M.S. Effects of the soil water content and relative roughness on the shear strength of silt and steel plate interface. Measurement 2021, 174, 109003. [Google Scholar] [CrossRef]
- Samanta, M.; Punetha, P.; Sharma, M. Effect of roughness on interface shear behavior of sand with steel and concrete surface. Geomech. Eng. 2018, 14, 387–398. [Google Scholar] [CrossRef]
- Samanta, M.; Punetha, P.; Sharma, M. Influence of surface texture on sand-steel interface strength response. Geotech. Lett. 2018, 8, 40–48. [Google Scholar] [CrossRef]
- Chu, L.M.; Yin, J.H. Comparison of interface shear strength of soil nails measured by both direct shear box tests and pullout tests. J. Geotech. Geoenviron. 2005, 131, 1097–1107. [Google Scholar] [CrossRef]
- DeJong, J.T.; Westgate, Z.J. Role of Initial State, Material Properties, and Confinement Condition on Local and Global Soil-Structure Interface Behavior. J. Geotech. Geoenviron. 2009, 135, 1646–1660. [Google Scholar] [CrossRef]
- Yu, S.W.; Wang, J.; Liu, J.W.; Wang, T. Experimental Studies on Cyclic Shear Behavior of Steel-Clay Interface Under Constant Normal Load. China Ocean Eng. 2023, 37, 519–524. [Google Scholar] [CrossRef]
- Pan, J.J.; Wang, B.X.; Wang, Q.; Ling, X.Z.; Fang, R.C.; Liu, J.Q.; Wang, Z.H. An adhesion-ploughing friction model of the interface between concrete and silty clay. Constr. Build. Mater. 2023, 376, 131039. [Google Scholar] [CrossRef]
- Hu, S.; Li, Z.; Wang, H.; Xue, Z.; Tan, P.; Tan, K.; Wu, Y.; Feng, X. Estimating Shear Strength of Marine Soft Clay Sediment: Experimental Research and Hybrid Ensemble Artificial Intelligence Modeling. Water 2024, 16, 1664. [Google Scholar] [CrossRef]
- Yu, X.; Sun, H.; Liu, J.; Zhao, H.; Han, Y. Experimental Study on Cyclic Simple Shear Test of Coastal Tidal Soft Soil. J. Mar. Sci. Eng. 2024, 12, 1066. [Google Scholar] [CrossRef]
- Chuang, J.W.; Reese, L.C. Studies of Shearing Resistance between Cement Mortar and Soil; Center for Highway Research, University of Texas: Austin, TX, USA, 1969. [Google Scholar]
- Lin, C.; Wang, G.F.; Guan, C.; Feng, D.C.; Zhang, F. Experimental study on the shear characteristics of different pile-soil interfaces and the influencing factors. Cold Reg. Sci. Technol. 2023, 206, 103739. [Google Scholar] [CrossRef]
- Zhang, C.Z.; Zhang, Y.; Liu, S.Y.; Liu, Y.Z.; Cai, G.H.; Jiang, C. Experimental Study of Interface Shear Characteristics of Pervious Concrete and Carbonated Soil in the MgO-Carbonated Composite Pile. Int. J. Geomech. 2024, 24, 04024020. [Google Scholar] [CrossRef]
- Wang, Y.H.; Liu, X.Y.; Zhang, M.Y.; Bai, X.Y. Effect of Roughness on Shear Characteristics of the Interface between Silty Clay and Concrete. Adv. Civ. Eng. 2020, 2020, 8831759. [Google Scholar] [CrossRef]
- Liu, H.; Zhu, M.; Li, X.; Dai, G.; Yin, Q.; Liu, J.; Ling, C. Experimental Study on Shear Behavior of Interface between Different Soil Materials and Concrete under Variable Normal Stress. Appl. Sci. 2022, 12, 11213. [Google Scholar] [CrossRef]
- Li, T.L.; Zhao, W.; Liu, R.; Han, J.Y.; Jia, P.J.; Cheng, C. Visualized direct shear test of the interface between gravelly sand and concrete pipe. Can. Geotech. J. 2024, 61, 361–374. [Google Scholar] [CrossRef]
- Konkol, J.; Mikina, K. Some Aspects of Shear Behavior of Soft Soil-Concrete Interfaces and Its Consequences in Pile Shaft Friction Modeling. Materials 2021, 14, 2578. [Google Scholar] [CrossRef] [PubMed]
- Kou, H.L.; Huang, J.M.; Cheng, Y. Friction Characteristics Between Marine Clay and Construction Materials. J. Ocean Univ. China 2024, 23, 427–437. [Google Scholar] [CrossRef]
- Li, J.P.; Li, L. Theoretical analysis of long-term setup of driven piles considering soil anisotropy, destructuration and creep effects. Ocean Eng. 2021, 239, 109821. [Google Scholar] [CrossRef]
- Li, L.; Li, J.P.; Sun, D.A.; Gong, W.B. Semi-analytical approach for time-dependent load-settlement response of a jacked pile in clay strata. Can. Geotech. J. 2017, 54, 1682–1692. [Google Scholar] [CrossRef]
- Li, L.; Li, J.P.; Sun, D.A.; Gong, W.B. Analysis of Time-Dependent Bearing Capacity of a Driven Pile in Clayey Soils by Total Stress Method. Int. J. Geomech. 2017, 17, 04016156. [Google Scholar] [CrossRef]
- Ren, Y.B.; Yang, S.L.; Andersen, K.H.; Yang, Q.; Wang, Y. Thixotropy of soft clay: A review. Eng. Geol. 2021, 287, 106097. [Google Scholar] [CrossRef]
- GB/T50123-2019; Standard for Geotechnical Testing Method. China Planning Press: Beijing, China, 2019.
- JGJ 55-2011; Specification for Mix Proportion Design of Ordinary Concrete. China Building Industry Press: Beijing, China, 2011.
- GB 50010-2010; Code for Design of Concrete Structures. China Building Industry Press: Beijing, China, 2010.
- Borana, L.; Yin, J.-H.; Singh, D.; Shukla, S.K. Interface behavior from suction-controlled direct shear test on completely decomposed granitic soil and steel surfaces. Int. J. Geomech. 2016, 16, D4016008. [Google Scholar] [CrossRef]
- Uesugi, M.; Kishida, H. Frictional resistance at yield between dry sand and mild steel. Soils Found. 1986, 26, 139–149. [Google Scholar] [CrossRef]
Disclaimer/Publisher’s Note: The statements, opinions and data contained in all publications are solely those of the individual author(s) and contributor(s) and not of MDPI and/or the editor(s). MDPI and/or the editor(s) disclaim responsibility for any injury to people or property resulting from any ideas, methods, instructions or products referred to in the content. |
© 2024 by the authors. Licensee MDPI, Basel, Switzerland. This article is an open access article distributed under the terms and conditions of the Creative Commons Attribution (CC BY) license (https://creativecommons.org/licenses/by/4.0/).