Article

System Structural Error Analysis in Binocular Vision Measurement Systems

by
Miao Yang
1,
Yuquan Qiu
2,*,
Xinyu Wang
2,
Jinwei Gu
3 and
Perry Xiao
4
1
Electronic Engineering Department, Jiangsu Ocean University, Lianyungang 222005, China
2
Marine Engineering Department, Jiangsu Ocean University, Lianyungang 222005, China
3
Ganyu Agricultural Development Group Co., Ltd., Lianyungang 222199, China
4
School of Engineering, London South Bank University, London SE1 0AA, UK
*
Author to whom correspondence should be addressed.
J. Mar. Sci. Eng. 2024, 12(9), 1610; https://doi.org/10.3390/jmse12091610
Submission received: 5 August 2024 / Revised: 28 August 2024 / Accepted: 8 September 2024 / Published: 10 September 2024

Abstract

:
A binocular stereo vision measurement system is widely used in fields such as industrial inspection and marine engineering due to its high accuracy, low cost, and ease of deployment. An unreasonable structural design can lead to difficulties in image matching and inaccuracies in depth computation during subsequent processing, thereby limiting the system’s performance and applicability. This paper establishes a systemic error analysis model to enable the validation of changes in structural parameters on the performance of the binocular vision measurement. Specifically, the impact of structural parameters such as baseline distance and object distance on measurement error is analyzed. Extensive experiments reveal that when the ratio of baseline length to object distance is between 1 and 1.5, and the angle between the baseline and the optical axis is between 30 and 40 degrees, the system measurement error is minimized. The experimental conclusions provide guidance for subsequent measurement system research and parameter design.

1. Introduction

Binocular stereo vision measurement is an efficient, non-contact measurement technology that achieves precise object measurement by determining three-dimensional coordinates. It is widely used in fields such as autonomous driving and industrial inspection [1,2,3]. In recent years, discussions within the field of binocular vision systems have predominantly centered on “camera calibration, feature point matching, and stereo matching” [4,5,6] while largely overlooking the impact of system architecture design on measurement accuracy. An unreasonable camera system layout can cause issues such as a limited field of view, shooting occlusion overlap, reduced effective field of view, and increased disparity noise. Research on the layout of binocular stereo vision systems aims to optimize the disparity range, reduce disparity noise, and minimize occlusion problems to ensure the system’s reliability and stability [7]. In a binocular vision system, a reasonable system structure is arranged to complete the task of measuring the three-dimensional parameters of an object [8,9].
This paper analyzes the factors affecting the measurement accuracy of binocular systems through mathematical modeling and experimental verification. The main contributions are as follows:
  • The error analysis model for binocular stereo vision measurement systems is refined in this study by considering the relationships among object distance, baseline length, and the angle between the baseline and the optical axis. This provides a comprehensive model for analyzing the impact of system structural parameters on measurement accuracy.
  • Experimental verification and nonlinear analysis are conducted to determine the impact of baseline length and object distance variations on binocular measurement errors, suggesting an optimal range for the K value (the ratio of baseline length to object distance).
  • The impact of the angle between the optical axis and the baseline on measurement accuracy is analyzed, and the optimal range is determined to be between 30° and 40°.
The structure of this paper is as follows: Section 2 introduces recent research related to the parameters of binocular stereo vision systems. Section 3 constructs an error analysis model for binocular stereo vision and delves into the impact of system structural parameters on measurement errors. A detailed description of the experimental design, including the specific arrangement of the binocular stereo vision experimental setup, as well as the analysis of the experimental data, is illustrated in Section 4. Finally, Section 5 summarizes this paper, offering theoretical and practical suggestions to optimize measurement accuracy.

2. Related Work

This section primarily reviews research on factors that cause measurement errors in binocular stereo vision. Notably, a detailed study of binocular stereo vision measurement system layout based on modeling is introduced.

2.1. Research on System Intrinsic Parameters

Currently, the factors affecting the accuracy of binocular vision measurement mainly involve intrinsic and extrinsic system parameters. Among them, intrinsic system parameters include the effective focal length of the two cameras, the size of the field of view, and the nonlinear distortion coefficients [10,11]. The extrinsic system parameters mainly include the angle between the optical axes of the two cameras, the baseline distance (B), and the object distance [12,13]. The measurement errors caused by the differences in these system structural parameters are referred to as systematic errors [14]. Pan et al. [14] proposed a distortion coefficient estimation method based on linear least squares to eliminate measurement errors caused by camera distortion in 2D digital image technology. David et al. [15] introduced a rational function model and applied it to radial lens distortion correction in wide-angle and catadioptric lenses. Jia et al. [16] developed a camera’s intrinsic parameter calibration method based on active vision and vertical compensation, eliminating the impact of non-perpendicular camera movement on calibration accuracy. Mikko et al. [17] proposed a method for evaluating binocular camera accuracy by changing focal length, validating the impact of focal length changes on measurement accuracy. Sunil et al. [18] discovered, through theoretical derivation and Monte Carlo simulation, that noise significantly affects the intrinsic parameters of the camera, especially the image center and scale factor. However, intrinsic system parameters are often fixed once the cameras and lenses are selected. Extrinsic system parameters have a greater influence and need to be considered more.

2.2. Research on System Extrinsic Parameters

Recent advancements in stereo camera systems, particularly in underwater environments, underscore the importance of accurately understanding and calibrating system extrinsic parameters. For example, Su et al.’s [19] precise 3D measurements of marine propeller deformation using stereo digital image correlation, Williams et al.’s [20] method for accurate volumetric fish density estimation incorporating seafloor adjustments and range-based detectability, and Pi et al.’s [21] stereo Visual SLAM system for autonomous underwater vehicles all demonstrate how critical these parameters are in achieving reliable results under challenging conditions.
Current research on extrinsic system parameters, such as baseline distance, object distance, and the angle between the baseline and optical axis, primarily involves deriving geometric relationships and using numerical simulations to evaluate changes in system accuracy. For instance, Xu et al. [22] concluded, through semi-physical simulations, that intrinsic and extrinsic parameters, including baseline distance and the angle between the camera and the optical axis, determine reconstruction accuracy. Similarly, Xing et al. [23] found that camera baseline and pixel capturing accuracy directly impact camera positioning accuracy through resolution error modeling. Shiqigao et al. [24] introduced uncertainty into error analysis models, showing that measurement errors within the Fov (field of view) increase with object distance. Zhang et al. [25] created mathematical models based on structural parameters to guide system design, while Zhou et al. [26] developed an underwater refraction model for more accurate calibration. Research on the influence of external system structural parameters, such as baseline distance, on measurement accuracy has been conducted for a considerable time. David F. Llorca et al. examined the impact of baseline distance on depth error in pedestrian detection, finding that increasing baseline length effectively reduces depth estimation error at greater object distances [27]. Tao Zhang et al. analyzed depth reconstruction errors in stereo vision, proposing a noise–ray intersection model; they found an optimal finite baseline, challenging the idea that largeris better [28]. Lu Yongkang et al. found that while a longer baseline reduces depth error, it introduces other errors, requiring balanced optimization [29]. These studies provide only partial analysis and lack a comprehensive assessment of extrinsic parameter impacts on accuracy. Moreover, the experimental validations are often limited.

3. Measurement Error Analysis Model for Binocular Vision

In a traditional binocular stereo vision measurement system, as illustrated in Figure 1, under ideal conditions, two CCD cameras are placed horizontally. CCD1 and CCD2 represent the image planes of the two cameras. The coordinate systems of the left and right cameras are denoted as O 1 X 1 Y 1 and O 2 X 2 Y 2 , respectively. The optical centers of the two cameras are O 1 and O 2 , and the line connecting the image plane centers o 1 and o 2 is denoted as O 1 o 1 and O 2 o 2 , respectively. These lines represent the optical axes of the left and right cameras. The straight line O 1 O 2 represents the baseline B, which is the distance between the two cameras. A point P in space with coordinates ( X , Y , Z ) projects onto the image planes of the two cameras as p 1 and p 2 , with coordinates ( x 1 , y 1 ) and ( x 2 , y 2 ) , respectively [30,31,32,33,34]. The real angles formed by the lines O 1 P and O 2 P with their respective optical axes in the image plane are φ 1 and φ 2 . The horizontal projection points are denoted as P , and the real angles formed by O 1 P and O 2 P with the optical axes are ω 1 and ω 2 . It is important to note that θ 1 and θ 2 represent the angles α 1 + ω 1 and α 2 + ω 2 , respectively. The corresponding image points p 1 and p 2 on the left and right cameras have focal lengths f 1 and f 2 , respectively. We establish a world coordinate system ( O , X w , Y w , Z w ) with the optical center of the left camera O 1 as the origin, and the Z axis as the baseline B [35,36,37].
From the geometric relationships depicted in Figure 1, the spatial coordinates of point P can be determined, as shown in Equation (1).
X = B cot θ 1 cot θ 1 + cot θ 2 Y = Z sin θ 1 · y 1 cos w 1 f 1 = Z sin θ 2 y 2 cos w 2 f 2 Z = B cot θ 1 + cot θ 2
To simplify the analysis, we assume ideal conditions with a distortion-free camera and infinite resolution. The coordinates of the spatial measurement point P can be obtained by solving a multivariable function composed of the system’s structural parameters [38], as shown in Equation (2).
( X , Y , Z ) = F B , α 1 , α 2 , f 1 , f 2 , x 1 , x 2 , y 1 , y 2
According to the error propagation theory [39], the systematic error of the spatial point P can be expressed as a combination of errors in X , Y , Z , as shown in Equation (3).
γ = ( Δ X ) 2 + ( Δ Y ) 2 + ( Δ Z ) 2 = i j F j · δ j
where γ is the total error, including three directions X , Y , Z . i represents the direction of X , Y , Z . j is one of the parameters including B , α 1 , α 2 , ω 1 , ω 2 , f 1 , f 2 , x 1 , x 2 , y 1 , and y 2 , and δ j is the error coefficient.
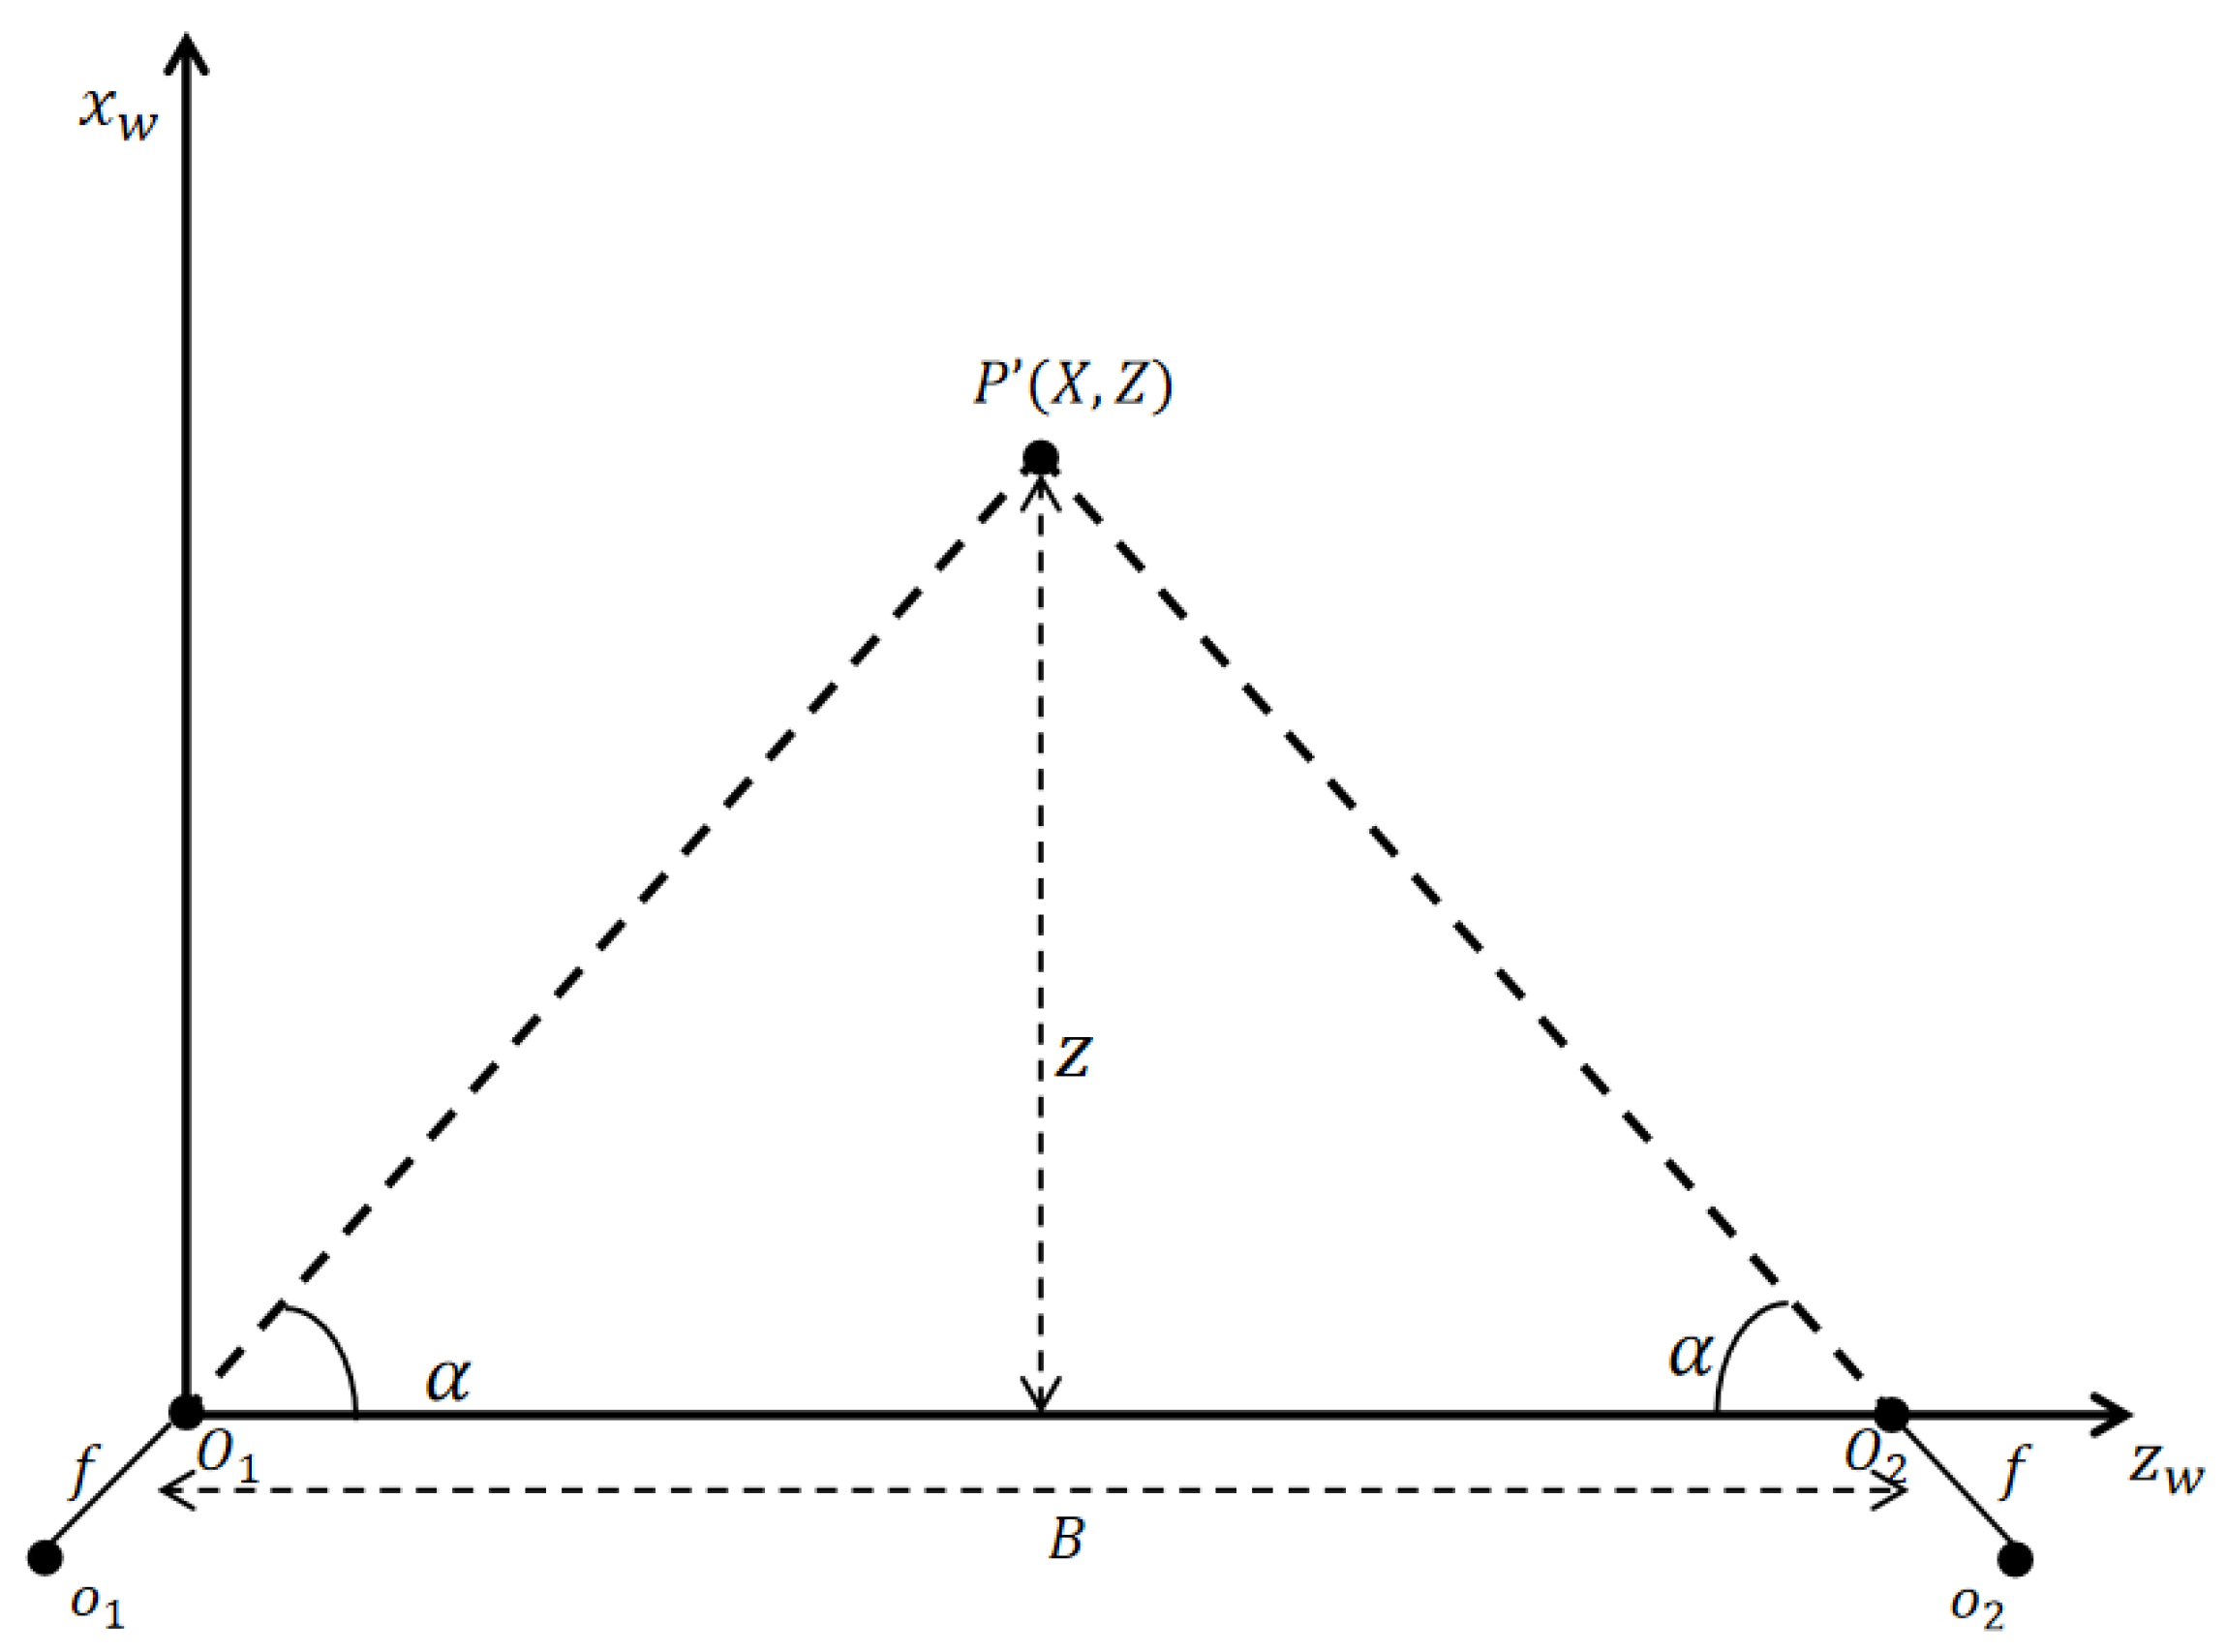
The propagation coefficients in the X , Y , Z directions can be determined based on the structural model of the binocular system [25,39,40]. To simplify the analysis and provide a clearer visualization, a top view of the system structure is illustrated in Figure 2.
We set φ 1 = φ 2 = 0 . At this point, the spatial point P is on the same horizontal plane as the baseline B , and therefore, the error propagation factor in the Y w axis direction is not considered. Let K = B / Z , ω 1 = ω 2 = 0 , α 1 = α 2 = α , and f 1 = f 2 = f . The systematic error can then be expressed as [25]:
γ = ( Δ X ) 2 + ( Δ Z ) 2 = e 1 2 + e 2 2 = 2 · z f · e 3 e 1 = 1 K · cot α · sin 2 α = 1 2 + k 2 8 , e 2 = 1 K · sin 2 α = 1 K + K 4 ,
The systematic error curve corresponding to parameter K is illustrated in Figure 3.
As can be seen from Figure 3, when K varies between 0 and 1.5, the variation in the e1 curve is relatively small, while the variation in the e2 curve is relatively large. Combined with Equations (4) and (5), it can be seen that the impact of the object distance Z on the systematic error is greater than that of the baseline length. However, when K is greater than 1.5, the opposite is true: the variation in the e1 curve is relatively large, and the variation in the e2 curve is relatively small. At this point, the key factor affecting the systematic error is the baseline length. Therefore, when setting up a binocular system, it is necessary to consider the application scenario and adjust the ratio between the baseline distance B and the object distance Z in a timely manner to meet the system’s accuracy requirements.
At the same time, the angle between the optical axis and the baseline α restricts the relative orientation and position of the cameras and, therefore, must also be taken into consideration. According to Equations (1) and (3), we set φ to to 45°, and the error transfer function α can be derived as [40]:
γ α , B = B cot 2 α + 1 2 ( 2 cot α ) 4 + cot 2 α cot 2 α + 1 2 ( 2 cot α ) 4 + cot 2 α sin 4 α ( 2 cot α ) 2
where γ α , B is the systematic error caused by α or B .
The variation curve of the systematic error with respect to the external parameter errors of the camera is shown in Figure 4. When the baseline distance is set to 120 mm, the systematic error variation curve of γ α is shown in Figure 4a.
According to Figure 4a, as α changes from 0° to 36°, the systematic error gradually decreases. When α exceeds 36°, the systematic error gradually increases again. Therefore, when designing a binocular stereo vision measurement system, the angle between the optical axis and the baseline should be set between 30° and 40°. At this range, the systematic error is relatively small.
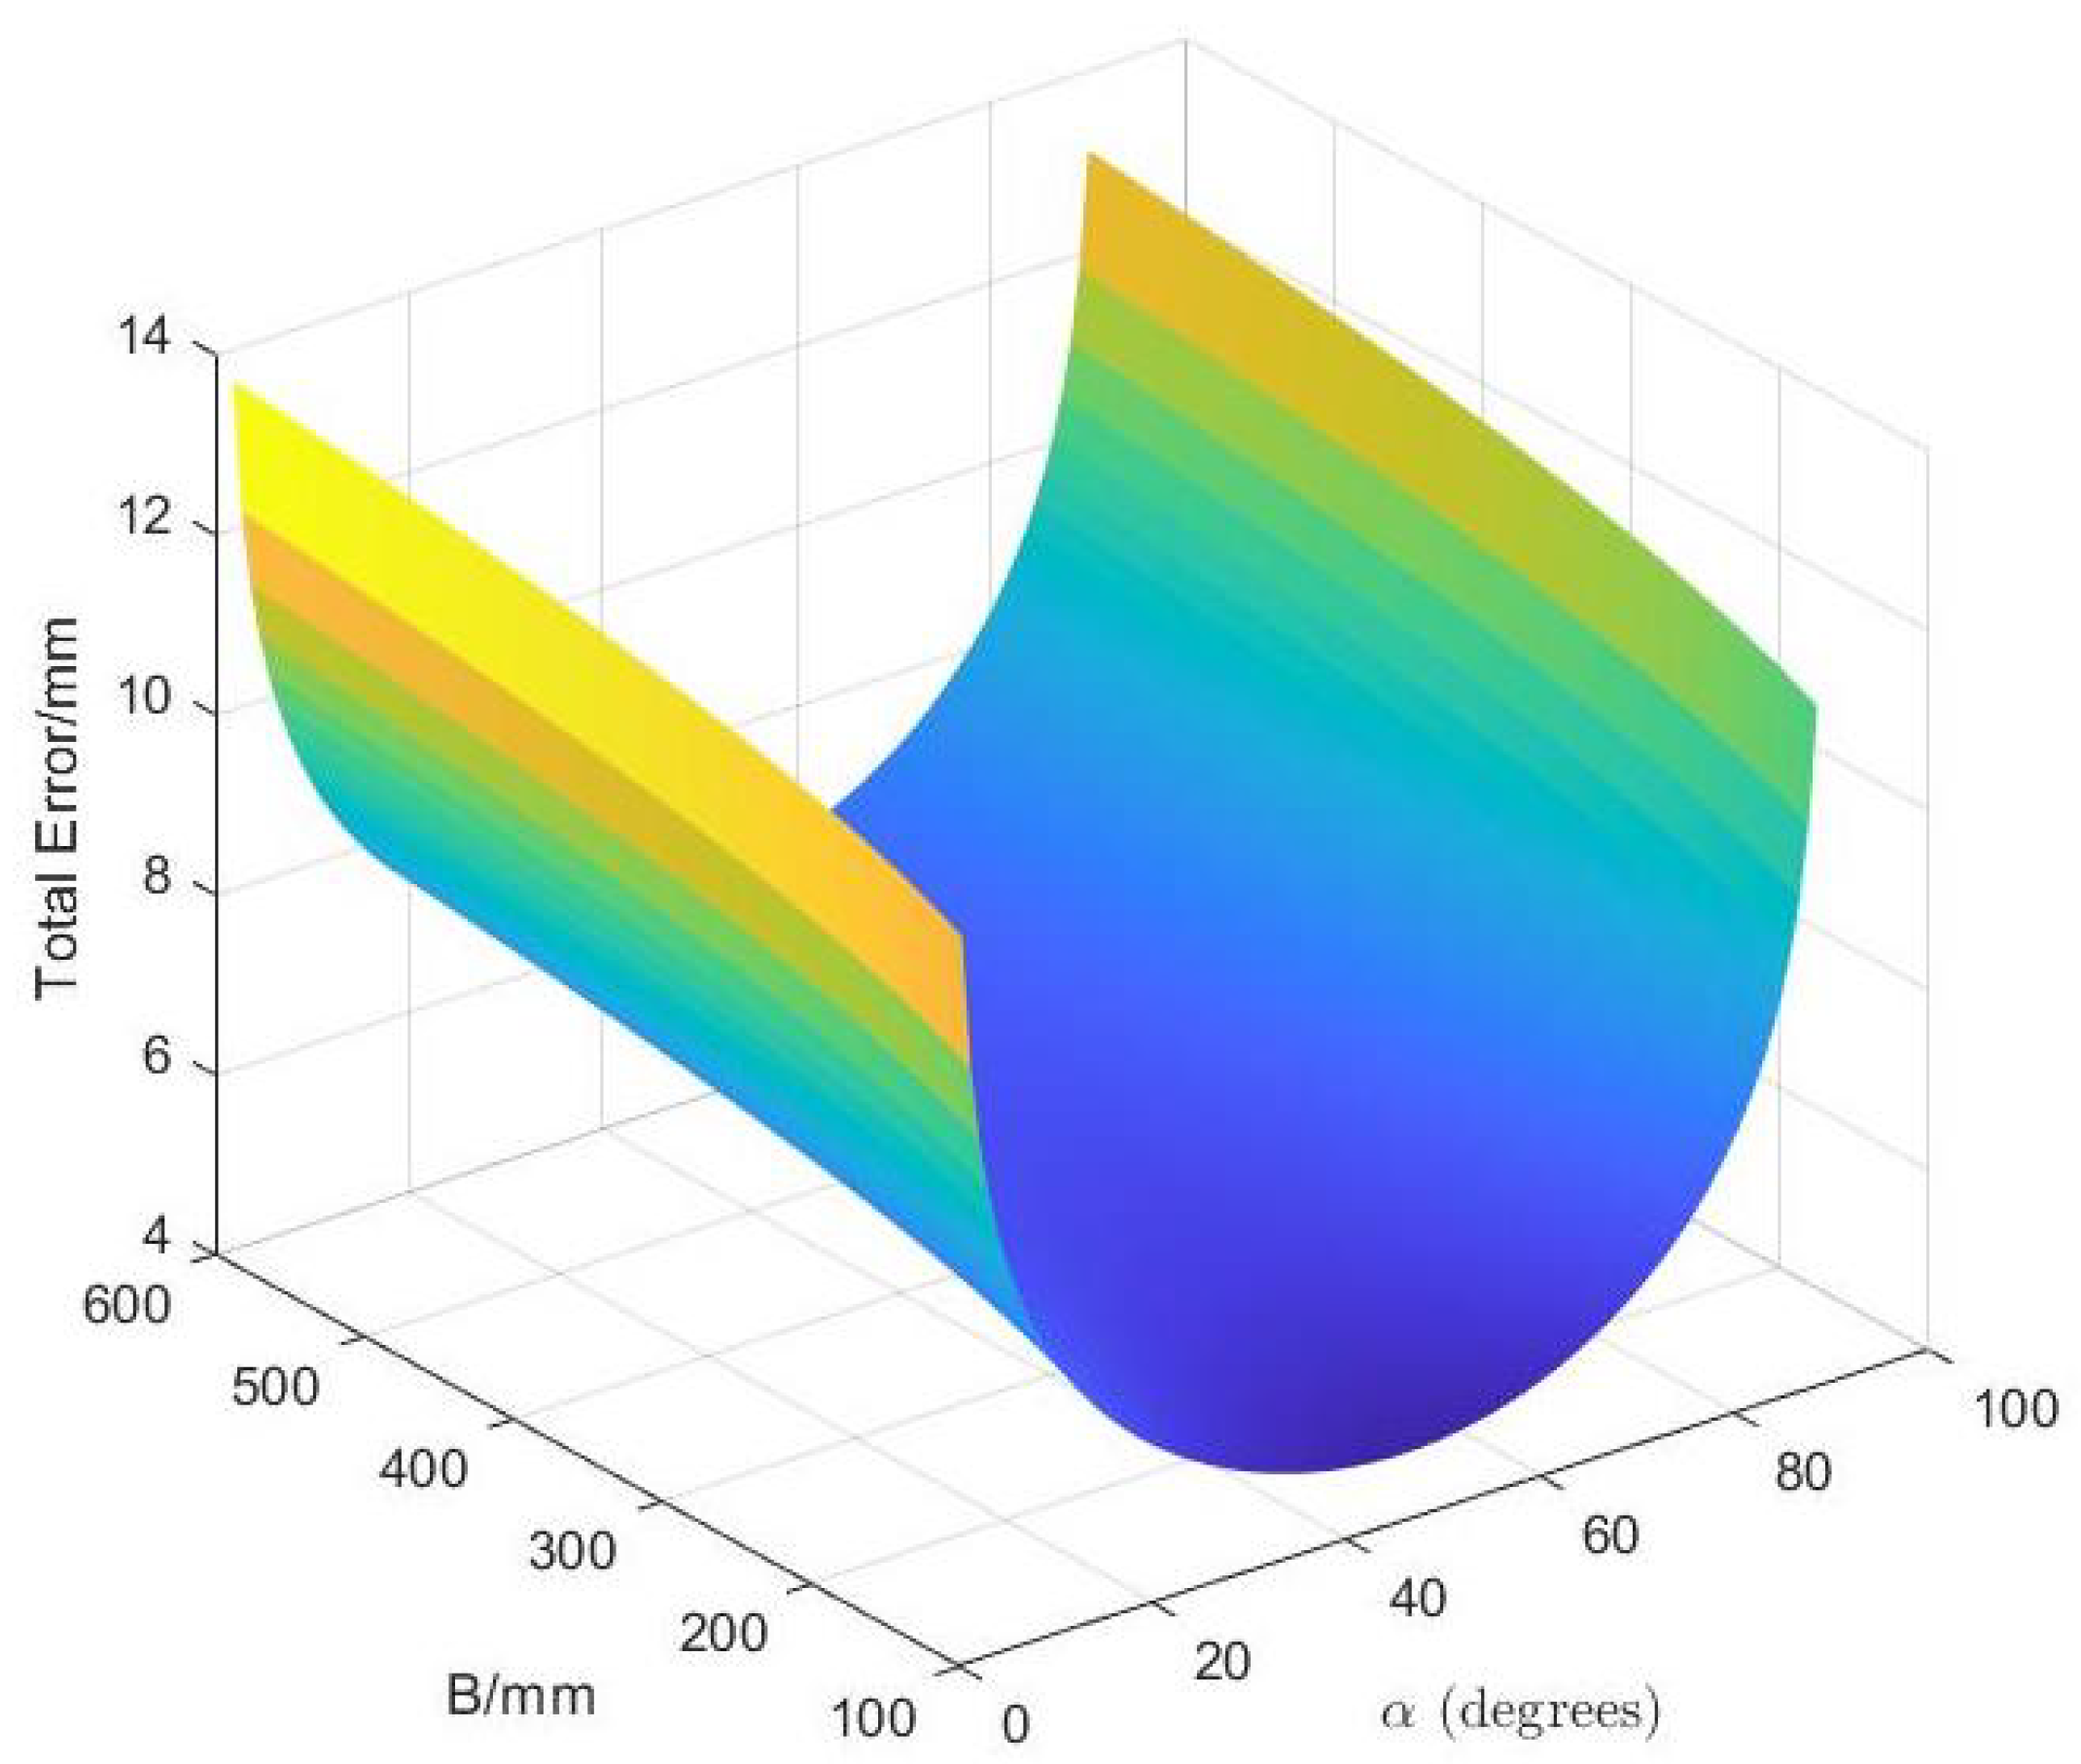
When the angle α is assumed to be 36°and φ = 45°, the error e1, which represents the systematic error in the X direction in Figure 3, shows a similar trend to that in Figure 4b. An analysis of Figure 4b reveals that when the angle between the camera and the optical axis is fixed, the systematic error increases gradually with an increase in the baseline distance, though it tends to level off. Therefore, it can be inferred that as the baseline length increases, this leads to an accumulation of triangulation errors in the X direction. Combining Figure 3 with Figure 4b indicates that when k is between 0 and 1.5, the systematic error of the e1 curve in the X direction gradually increases with the increase in baseline length. By combining Figure 4a,b, we construct an overall error surface that integrates baseline distance and object distance, as illustrated in Figure 5.
By analyzing Figure 3 and Figure 5, where different colors represent varying levels of total error (warmer colors indicating higher error and cooler colors indicating lower error)it can be inferred that when configuring a binocular vision measurement system, the angle between the baseline and the optical axis should ideally be maintained between 30° and 40°. Additionally, the K value should ideally be maintained between 1 and 1.5 to ensure the measurement accuracy of the system. This conclusion will be experimentally verified in Section 4.

4. Experiments and Results

4.1. Experiment System

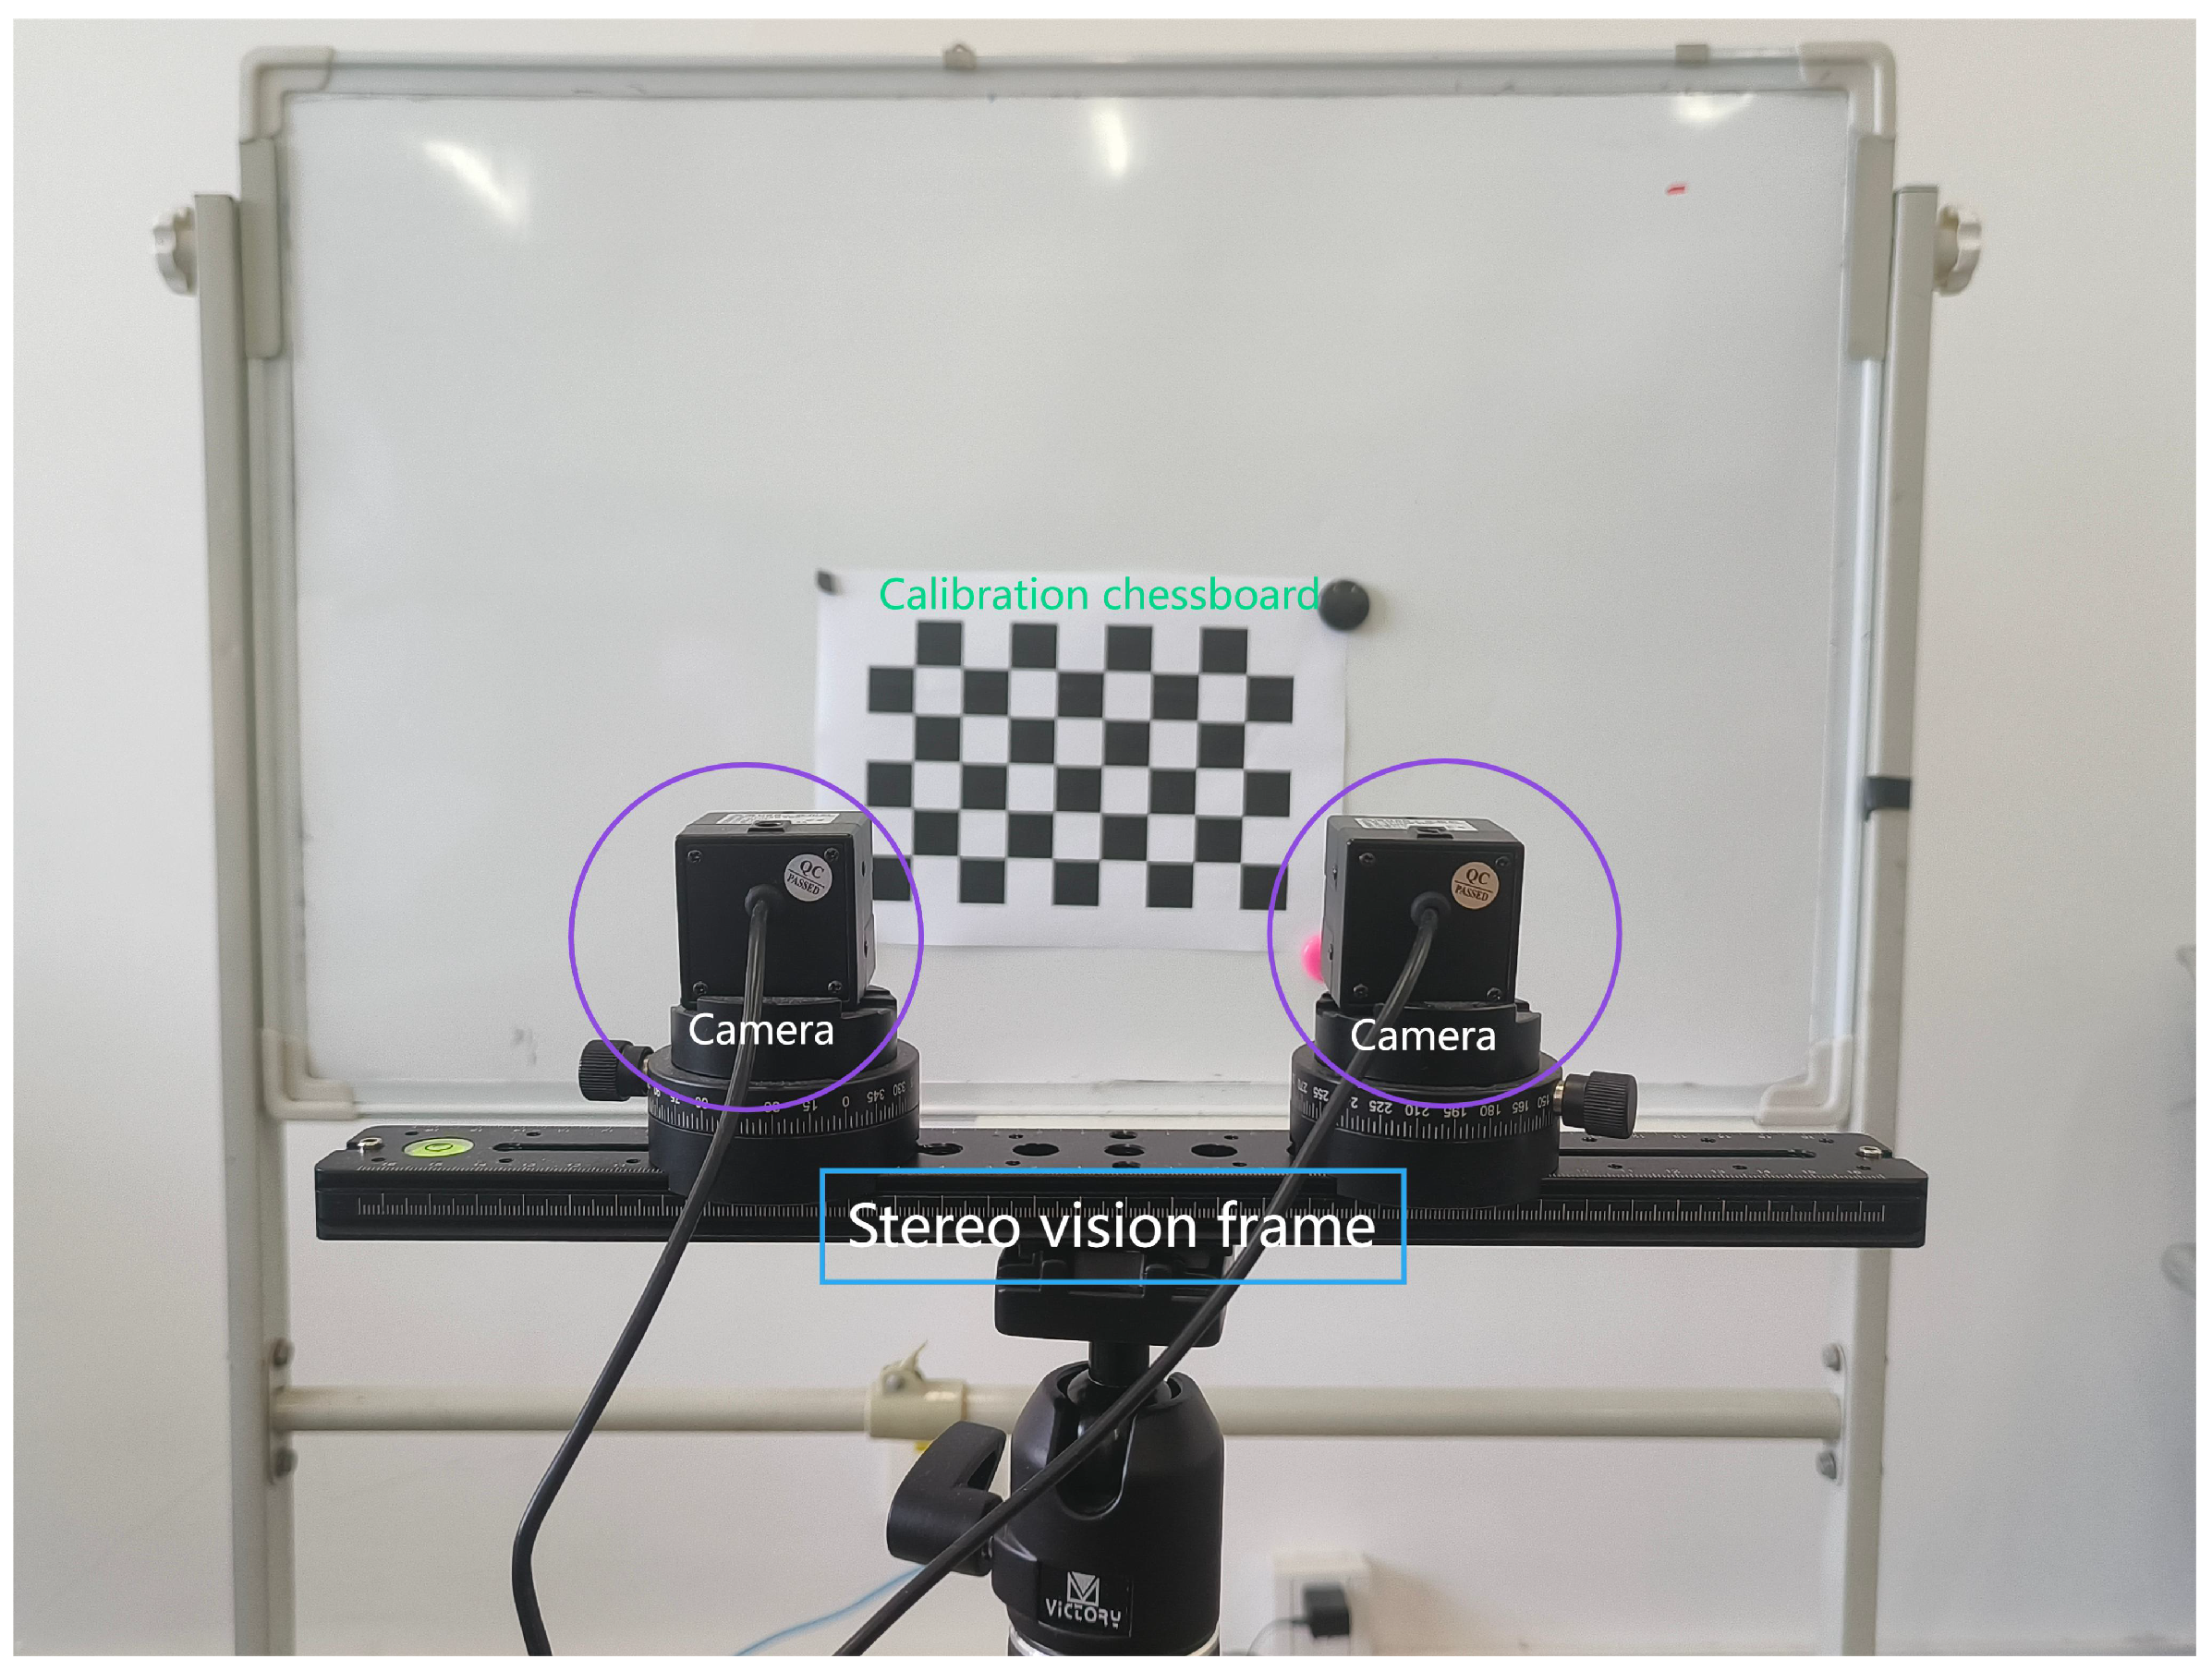
The binocular measurement system setting is shown in Figure 6. In this experiment, two sets of USB cameras with a resolution of 1960 × 1080, a focal length of 4 mm, and a pixel size of 3 µm × 3 µm were used, along with a high-precision calibration board measuring 3600 × 2700 mm with an error of 0.001 mm. The system also included a binocular camera tripod with an adjustable height ranging from 50 cm to 150 cm, a baseline adjustable range from 20 mm to 350 mm, and a pan–tilt adjustment range from 0 to 180 degrees. The object measured was a standard 27 mm chessboard pattern.

4.2. Experimental Results

In this chapter, we conducted two experiments to verify the accuracy of the simulation analysed in Section 3. In both experiments, We calibrated the stereo camera with the obtained intrinsic parameters and relative rotation and translation matrices, and imported them into Python (version 3.10) for distortion correction using OpenCV (version 4.8.1). To minimize errors, we manually selected feature points for stereo matching. Experiment one was designed to verify that the factors causing measurement errors change with variations in the K value, with the optimal range for K being 1–1.5. Experiment two confirmed the conclusion that the optimal angle setting between the optical axis and the baseline in the system is 35°.

4.2.1. Experiment I

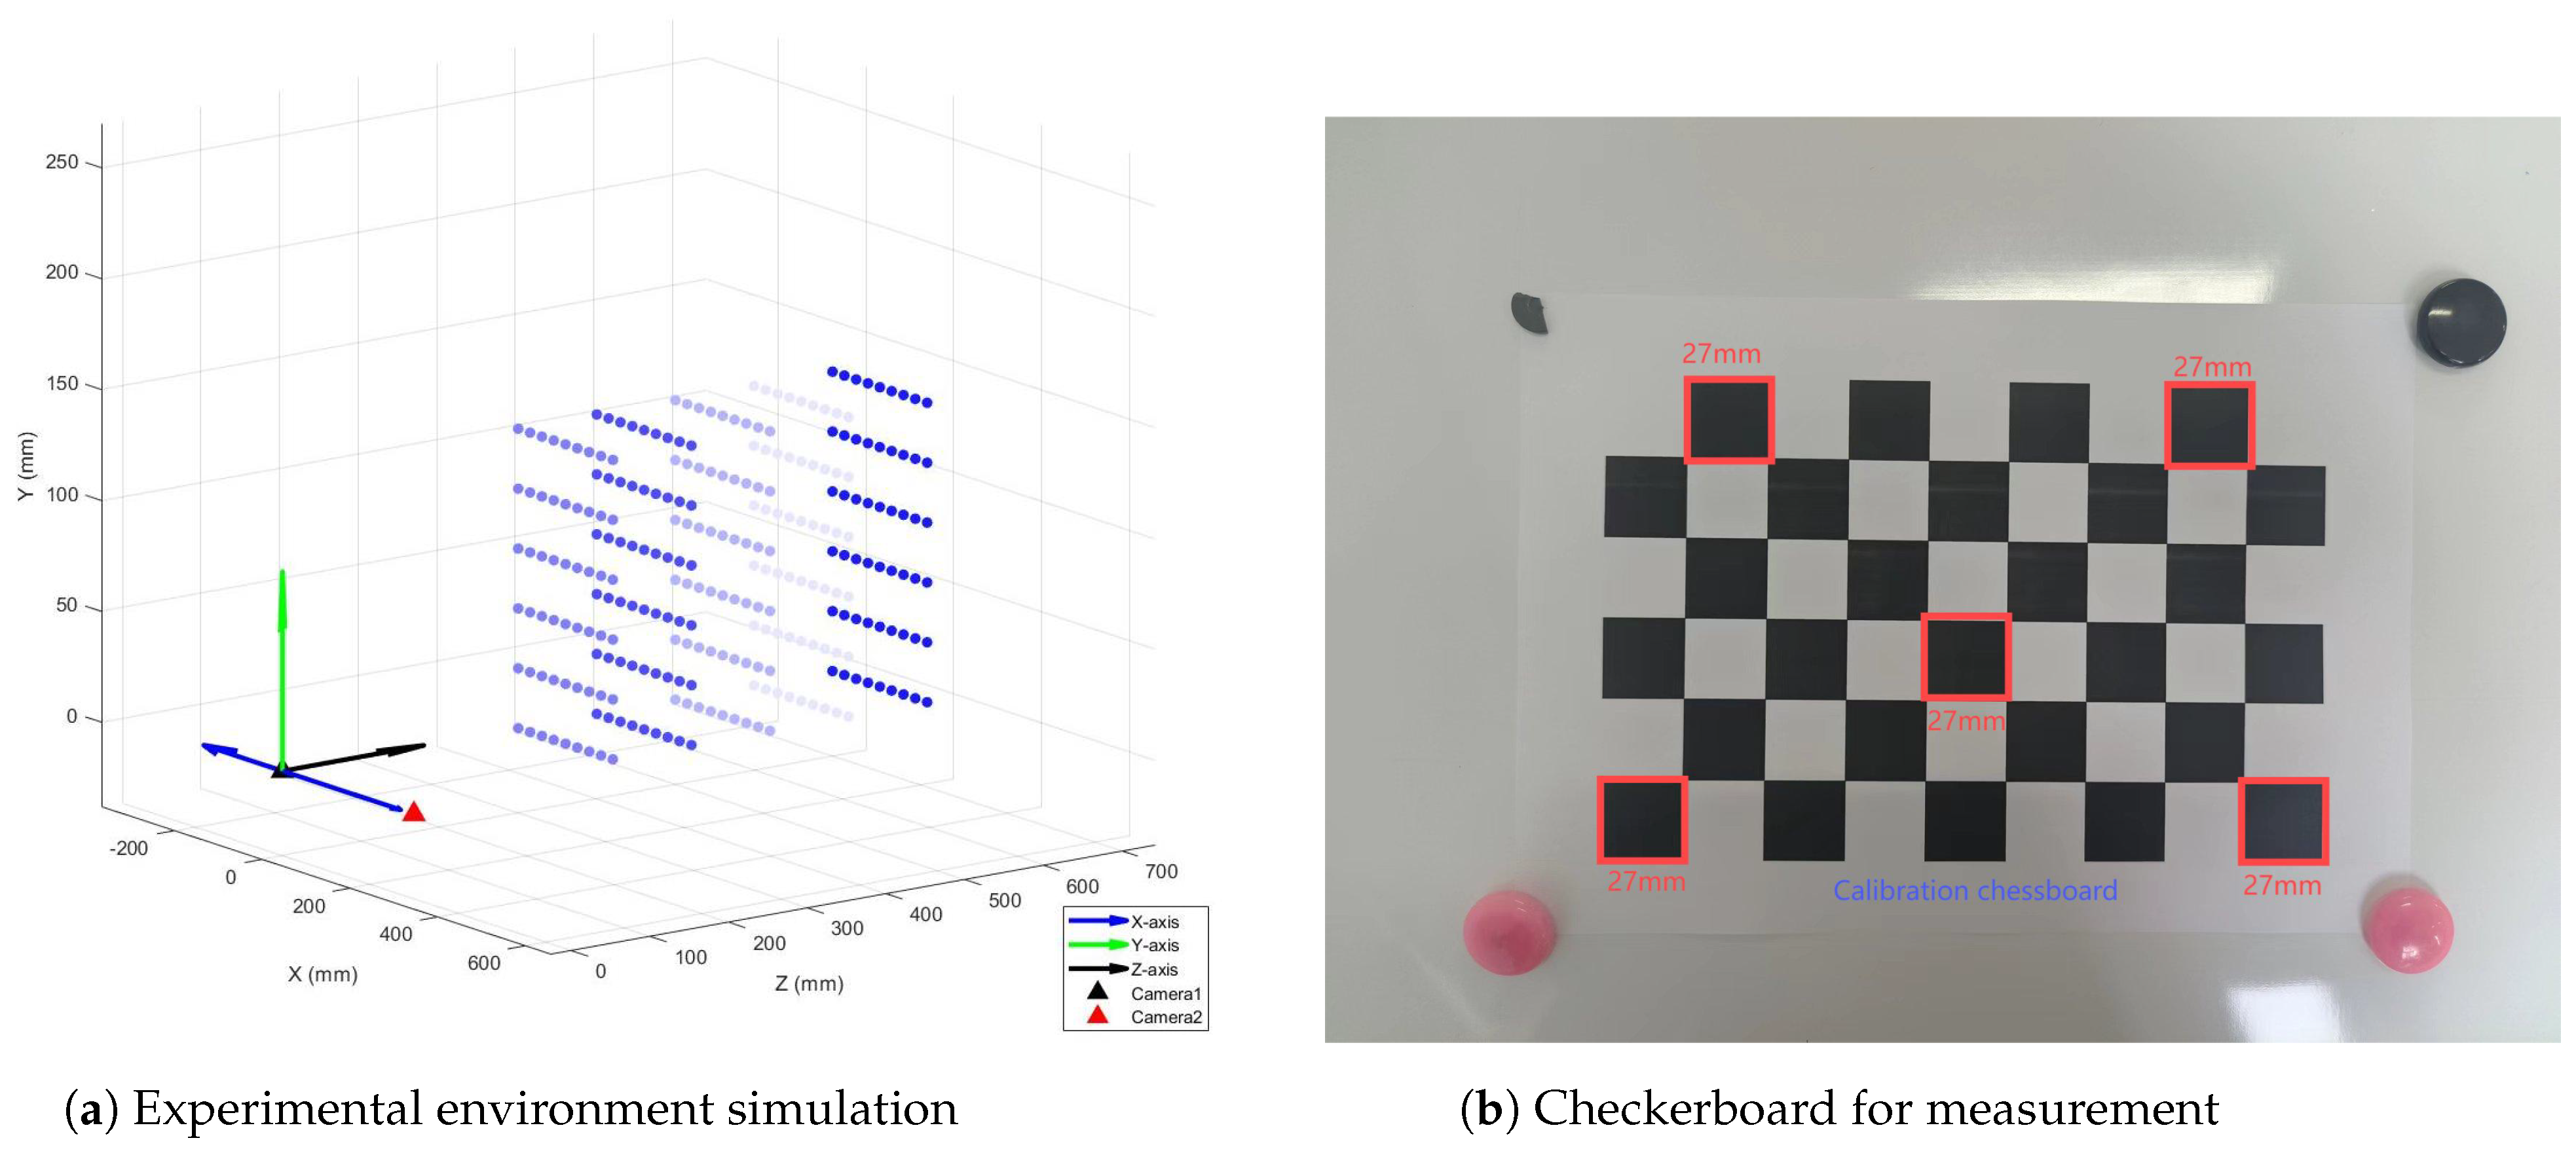
A schematic illustration of the experimental setup design is presented in Figure 7a. The measurement chessboard shown in Figure 7b was positioned at distances ranging from 300 mm to 700 mm from the camera for capturing images. The baseline length B was initially set to 50mm and subsequently adjusted in 50 mm increments up to 250 mm. The length of a single chessboard square (27 mm) was measured in each configuration.
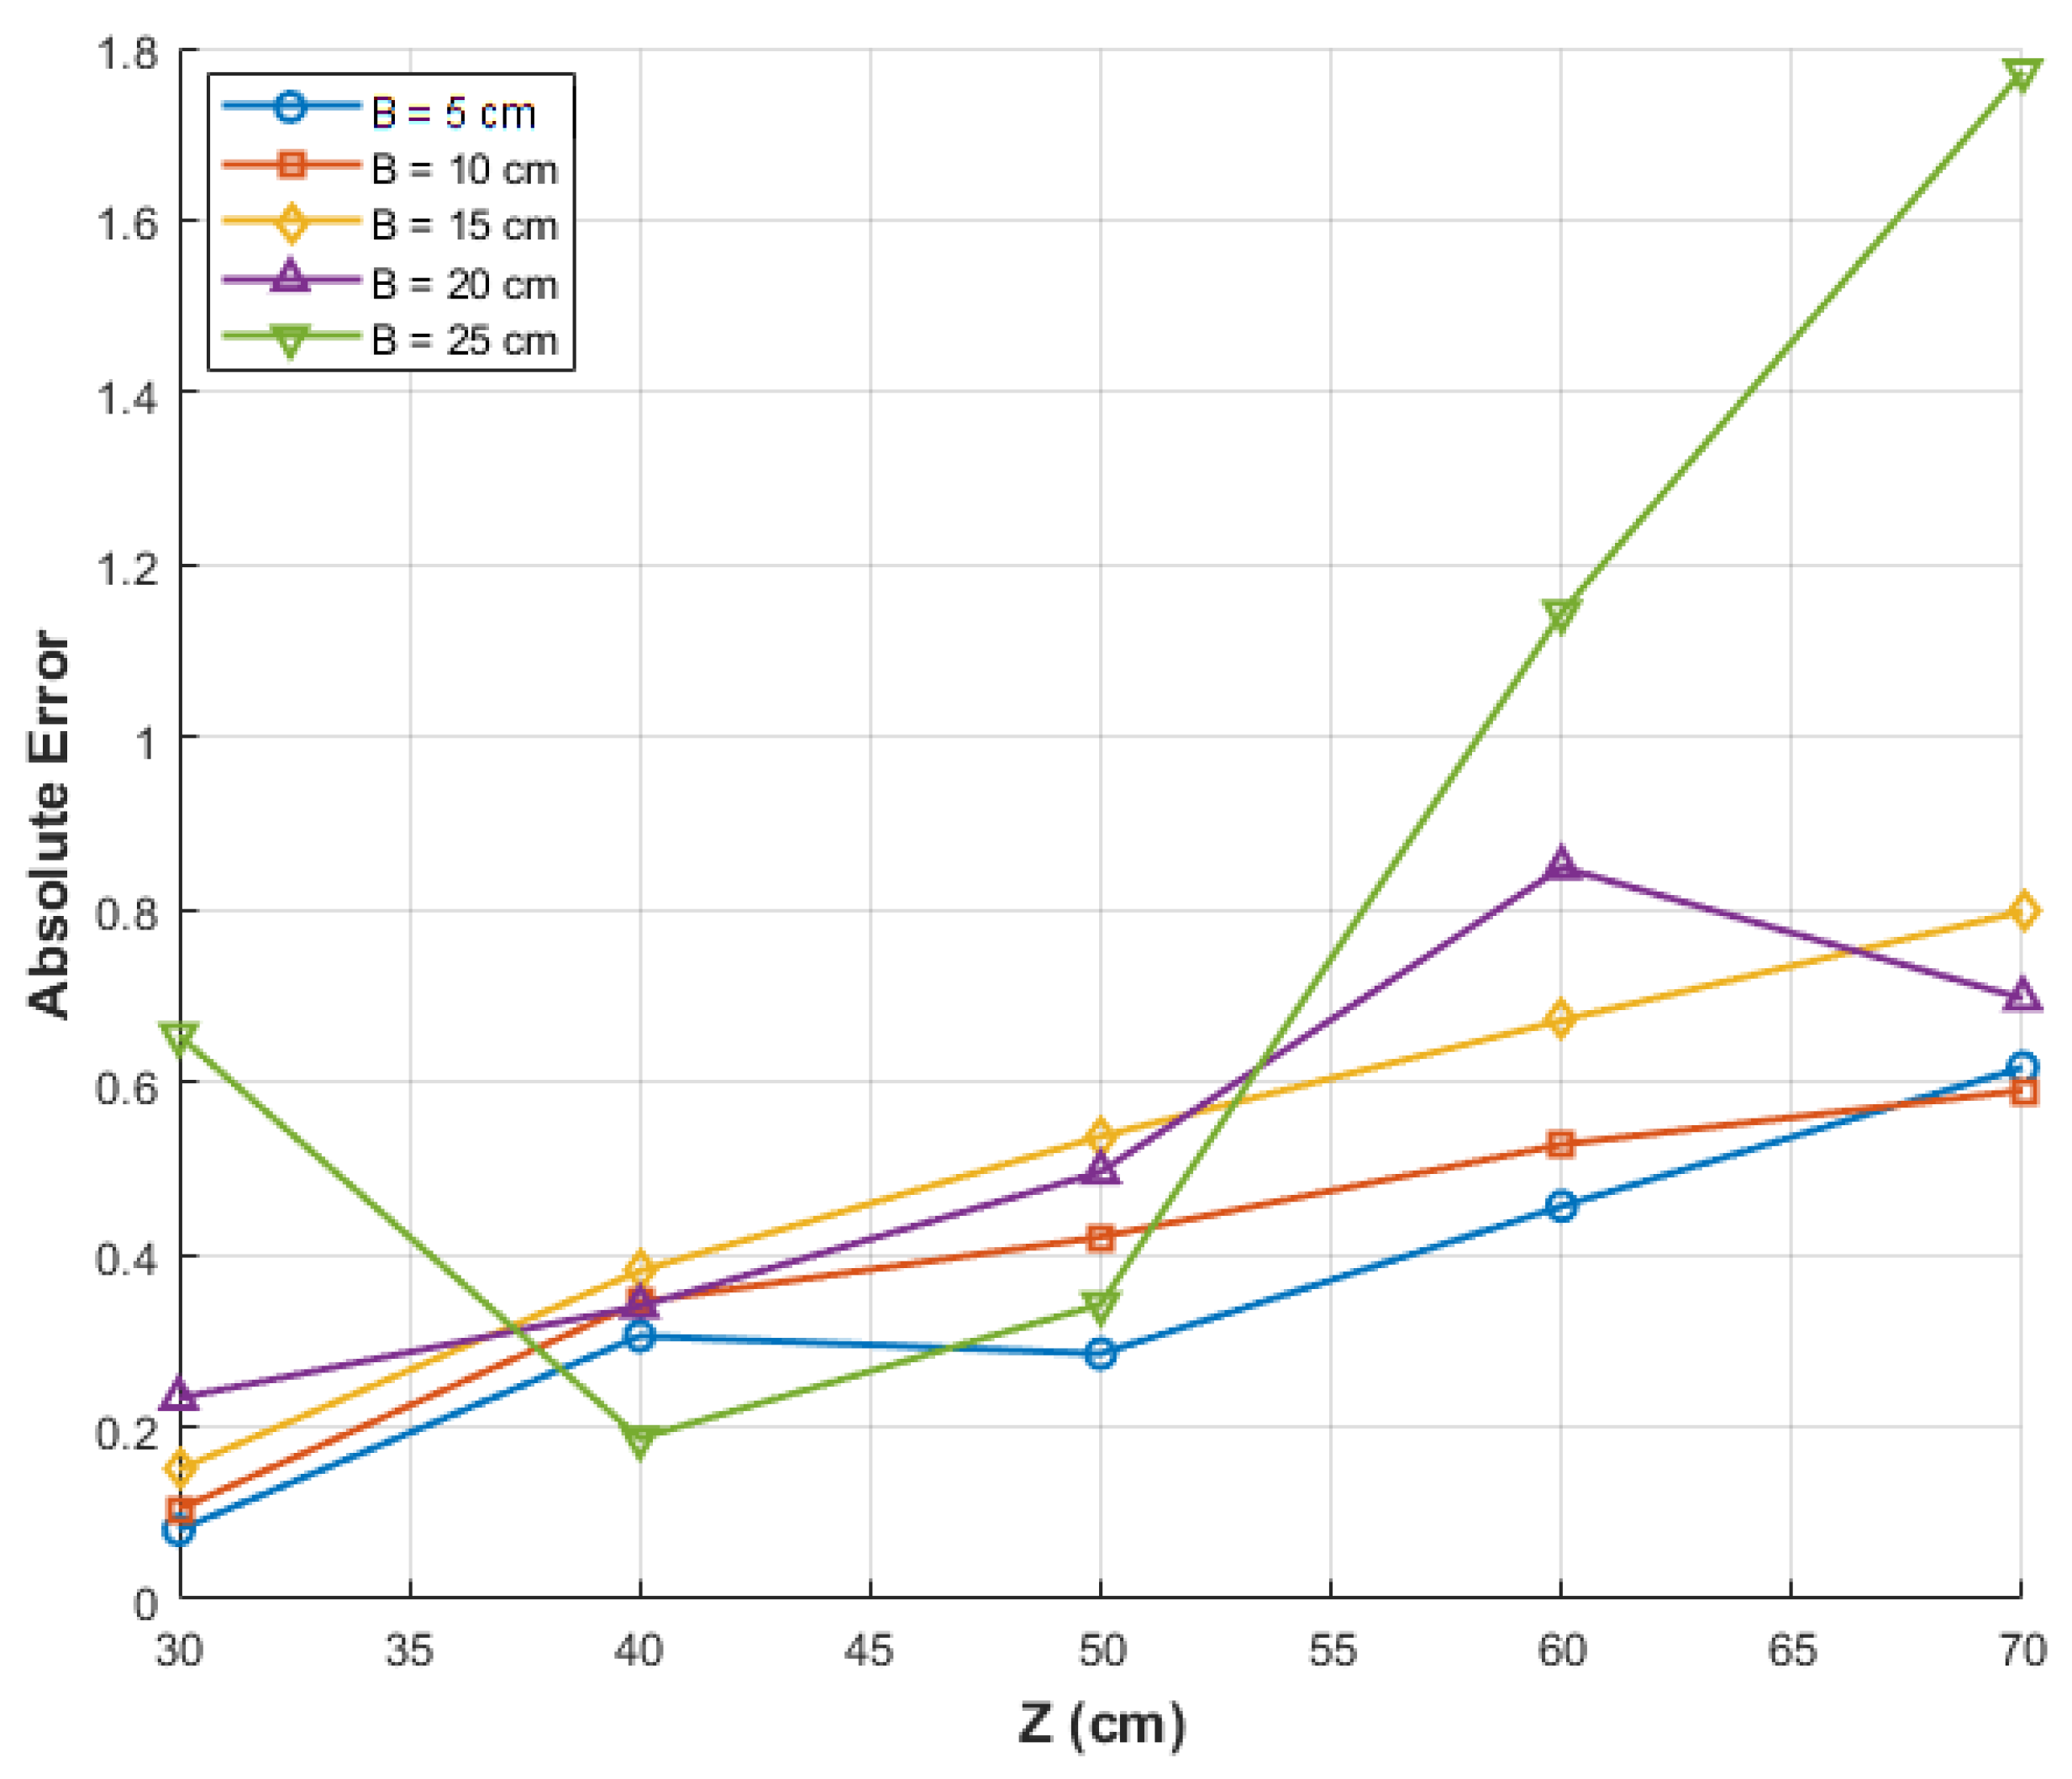
In the experiment, we utilized the intrinsic and extrinsic parameter matrices obtained from camera calibration to perform distortion correction on the captured chessboard images. To minimize noise and discontinuities during the stereo matching process, we manually selected image feature points multiple times, aiming to reduce experimental errors as much as possible. The measurement error curves are presented in Table 1 and Figure 8 and Figure 9.
Based on Figure 8, it can be observed that when the K value, defined as B / Z , is less than 1, with the same baseline length, as the object distance Z increases, the K value gradually decreases, leading to an increase in measurement error. Conversely, as shown in Figure 9, when the object distance is constant, the change in measurement error is not significant as the baseline length increases. Combining the analyses of Figure 5 and Figure 8, we can infer that when the K value is less than 1, the variation in object distance is the primary factor affecting measurement error. Therefore, to maximize measurement accuracy in a binocular measurement system, the camera should be positioned as close to the object as possible in this scenario. When the K value is greater than 1, the primary factor affecting measurement accuracy is the change in baseline length, which should be controlled within a certain range. Overall, when designing a binocular measurement system, the ratio of object distance to baseline length should be set within the range of 1 to 1.5 to ensure optimal imaging results.

4.2.2. Experiment II

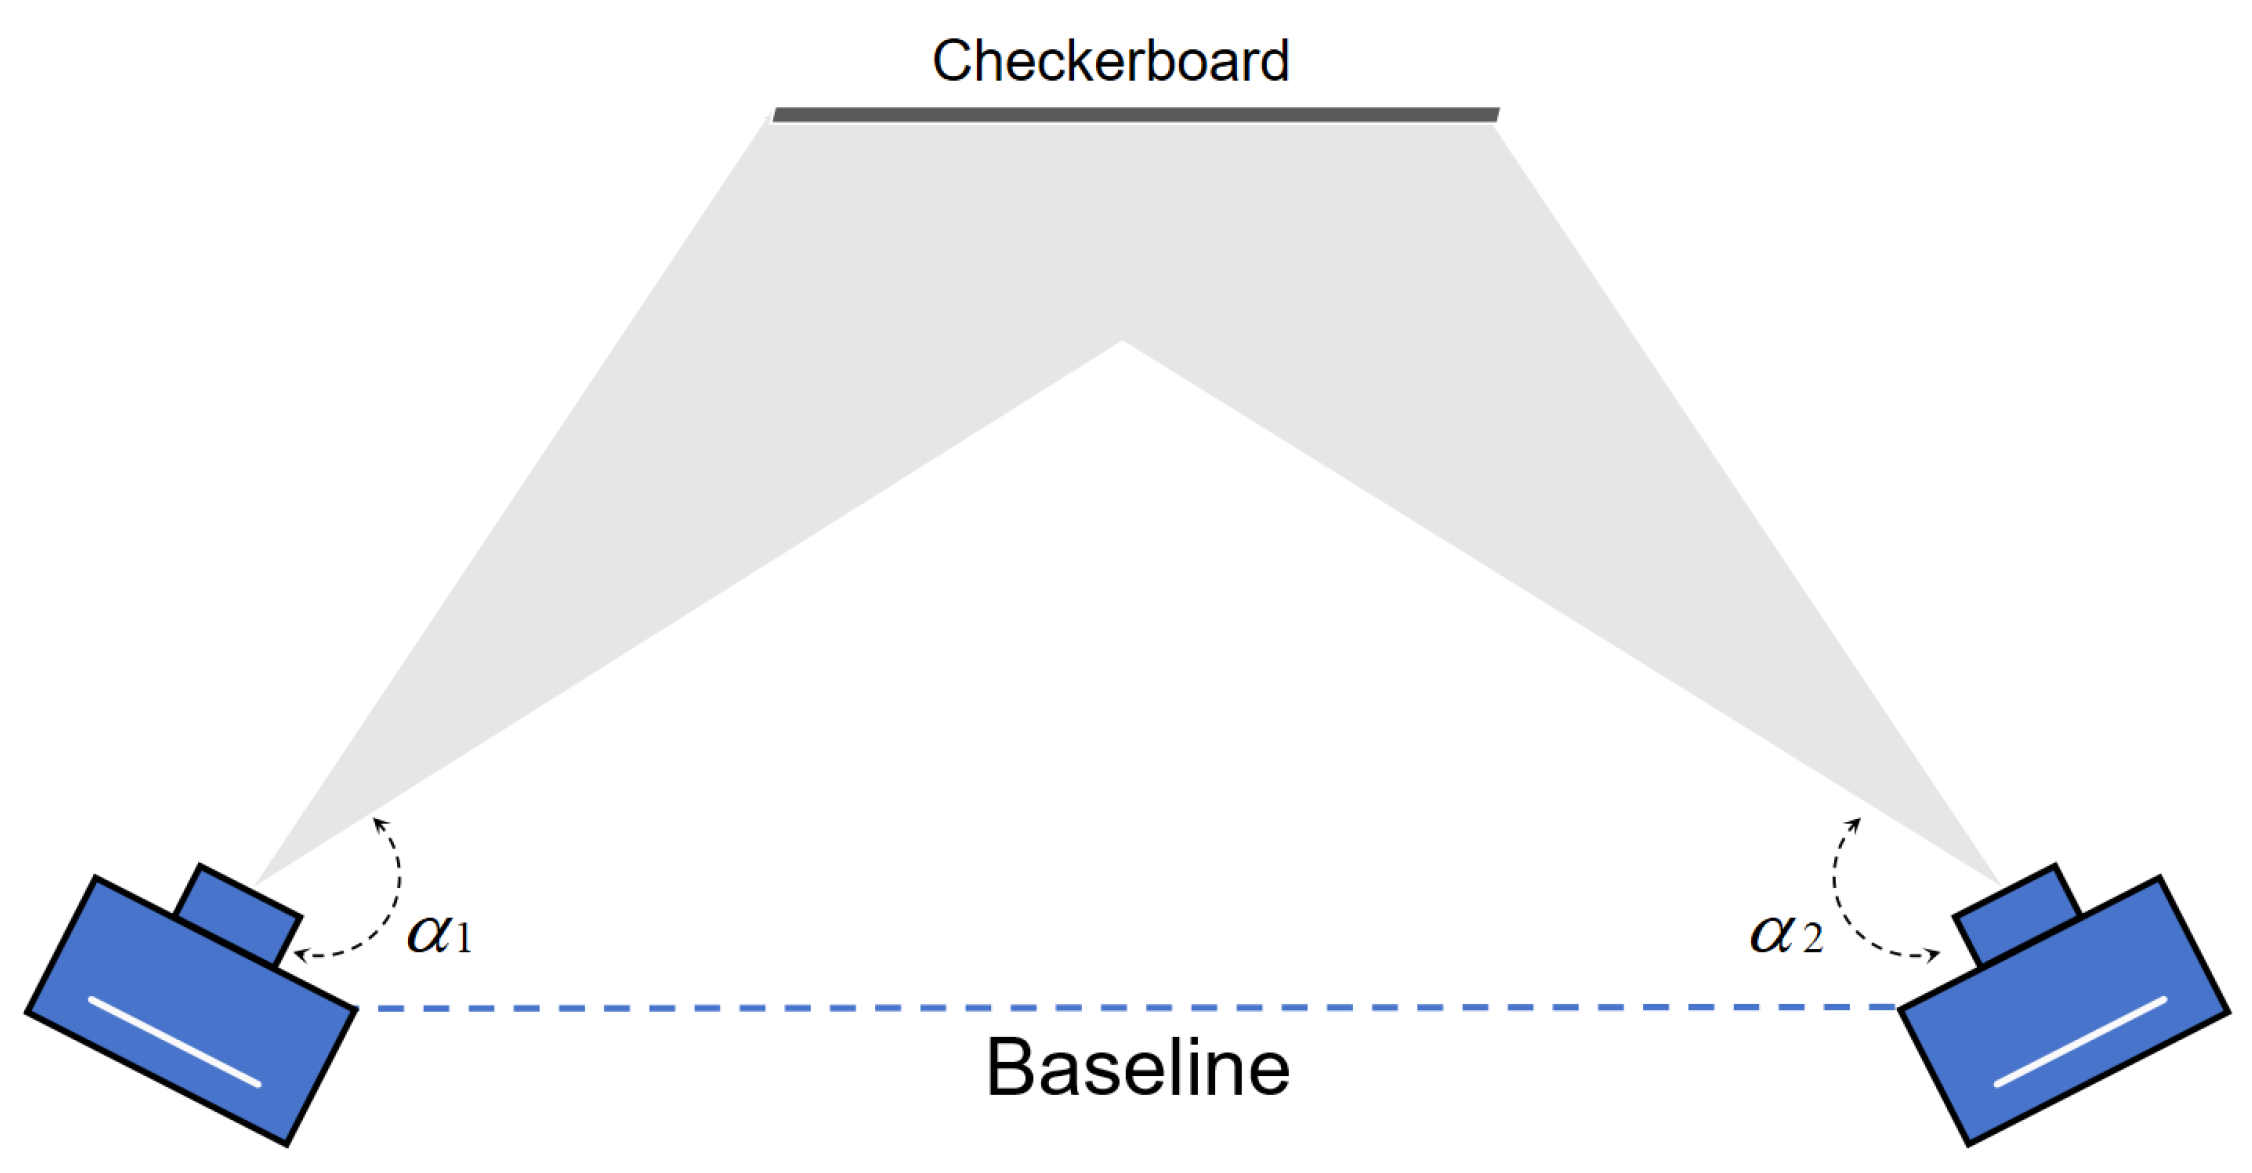
The binocular measurement system setup for Experiment II, as illustrated in Figure 10, is largely similar to that of Experiment I. With a fixed object distance Z of 500 mm and a baseline length of 100 mm; the angle between the baseline and the optical axis was adjusted to 5°, 15°, 25°, 35°, 45°, and 55°, respectively.
The measurement results and error curves are presented in Table 2 and Figure 11. It shows that the measurement error is minimized when the camera angle is 35 degrees. As the angle increases from 0 to 35 degrees, the measurement error decreases. However, when the angle exceeds 35 degrees, the measurement error gradually increases. This trend is consistent with the simulation results shown in Figure 4a.

5. Conclusions

This paper discusses an investigation of structural system parameters in binocular stereo vision systems that are prone to causing measurement errors. First, by establishing a binocular vision error analysis model and deriving the corresponding system error calculation formulas, this study analyzes and discusses how structural parameters, such as baseline distance, object distance, and the angle between the camera’s optical axis and the baseline, affect measurement accuracy. Secondly, through experimental design, the effectiveness of the error functions for the structural system parameters studied in this paper is validated. Specifically, when the ratio of baseline length to object distance is between 1 and 1.5, and the angle between the baseline and the optical axis is between 30 and 40 degrees, the system demonstrates high measurement accuracy with minimal error. This provides guidance for the research and design of subsequent binocular vision systems. In future research, we will focus on the design of an underwater binocular camera system to ensure that the binocular stereo vision measurement system can operate effectively and accurately under complex optical conditions, including low light, refraction, and scattering underwater.

Author Contributions

Conceptualization, M.Y. and Y.Q.; methodology, Y.Q. and X.W.; software, M.Y. and Y.Q.; validation, Y.Q. and X.W.; formal analysis, Y.Q. and X.W.; investigation, M.Y. and P.X.; resources, Y.Q. and P.X.; data curation, X.W. and J.G.; writing—original draft preparation, Y.Q.; writing—review and editing, Y.Q.; visualization, X.W. and J.G.; supervision, M.Y.; project administration, M.Y., J.G., and P.X.; funding acquisition, M.Y., J.G., and P.X. All authors have read and agreed to the published version of the manuscript.

Funding

This work was supported in part by NSFC (Grant 62271236), the National Key R&D Program Project (2023YFC3108205), the Key Country-Specific Industrial Technology R&D Cooperation Project (23GH002), and the Jiangsu University of Science and Technology Marine Equipment Research Institute Project (JOUH23590).

Institutional Review Board Statement

Not applicable.

Informed Consent Statement

Not applicable.

Data Availability Statement

All data supporting the findings of this study are included within the article.

Conflicts of Interest

Author Jinwei Gu was employed by the company Ganyu Agricultural Development Group Co., Ltd., China. The remaining authors declare that the research was conducted in the absence of any commercial or financial relationships that could be construed as a potential conflict of interest.

References

  1. Li, P.; Qin, T. Stereo vision-based semantic 3d object and ego-motion tracking for autonomous driving. In Proceedings of the European Conference on Computer Vision (ECCV), Munich, Germany, 8–14 of September 2018; pp. 646–661. [Google Scholar]
  2. Ma, Y.; Li, Q.; Chu, L.; Zhou, Y.; Xu, C. Real-time detection and spatial localization of insulators for UAV inspection based on binocular stereo vision. Remote Sens. 2021, 13, 230. [Google Scholar] [CrossRef]
  3. Guan, J.; Yang, X.; Ding, L.; Cheng, X.; Lee, V.C.; Jin, C. Automated pixel-level pavement distress detection based on stereo vision and deep learning. Autom. Constr. 2021, 129, 103788. [Google Scholar] [CrossRef]
  4. Kahmen, O.; Rofallski, R.; Luhmann, T. Impact of stereo camera calibration to object accuracy in multimedia photogrammetry. Remote Sens. 2020, 12, 2057. [Google Scholar] [CrossRef]
  5. Hamid, M.S.; Abd Manap, N.; Hamzah, R.A.; Kadmin, A.F. Stereo matching algorithm based on deep learning: A survey. J. King Saud Univ.-Comput. Inf. Sci. 2022, 34, 1663–1673. [Google Scholar] [CrossRef]
  6. Sarlin, P.E.; DeTone, D.; Malisiewicz, T.; Rabinovich, A. Superglue: Learning feature matching with graph neural networks. In Proceedings of the IEEE/CVF Conference on Computer Vision and Pattern Recognition, Seattle, WA, USA, 14–19 June 2020; pp. 4938–4947. [Google Scholar]
  7. Adil, E.; Mikou, M.; Mouhsen, A. A novel algorithm for distance measurement using stereo camera. CAAI Trans. Intell. Technol. 2022, 7, 177–186. [Google Scholar] [CrossRef]
  8. Zhang, B.; Zhu, D. Improved Camera Calibration Method and Accuracy Analysis for Binocular Vision. Int. J. Pattern Recognit. Artif. Intell. 2021, 35, 2155010. [Google Scholar] [CrossRef]
  9. Hua, L.; Lu, Y.; Deng, J.; Shi, Z.; Shen, D. 3D reconstruction of concrete defects using optical laser triangulation and modified spacetime analysis. Autom. Constr. 2022, 142, 104469. [Google Scholar] [CrossRef]
  10. Pollefeys, M.; Koch, R.; Gool, L.V. Self-calibration and metric reconstruction inspite of varying and unknown intrinsic camera parameters. Int. J. Comput. Vis. 1999, 32, 7–25. [Google Scholar] [CrossRef]
  11. Chen, B.; Pan, B. Camera calibration using synthetic random speckle pattern and digital image correlation. Opt. Lasers Eng. 2020, 126, 105919. [Google Scholar] [CrossRef]
  12. Feng, W.; Su, Z.; Han, Y.; Liu, H.; Yu, Q.; Liu, S.; Zhang, D. Inertial measurement unit aided extrinsic parameters calibration for stereo vision systems. Opt. Lasers Eng. 2020, 134, 106252. [Google Scholar] [CrossRef]
  13. Zimiao, Z.; Hao, Z.; Kai, X.; Yanan, W.; Fumin, Z. A non-iterative calibration method for the extrinsic parameters of binocular stereo vision considering the line constraints. Measurement 2022, 205, 112151. [Google Scholar] [CrossRef]
  14. Pan, B.; Yu, L.; Wu, D.; Tang, L. Systematic errors in two-dimensional digital image correlation due to lens distortion. Opt. Lasers Eng. 2013, 51, 140–147. [Google Scholar] [CrossRef]
  15. Claus, D.; Fitzgibbon, A.W. A rational function lens distortion model for general cameras. In Proceedings of the 2005 IEEE Computer Society Conference on Computer Vision and Pattern Recognition (CVPR’05), San Diego, CA, USA, 20–25 June 2005; Volume 1, pp. 213–219. [Google Scholar]
  16. Jia, Z.; Yang, J.; Liu, W.; Wang, F.; Liu, Y.; Wang, L.; Fan, C.; Zhao, K. Improved camera calibration method based on perpendicularity compensation for binocular stereo vision measurement system. Opt. Express 2015, 23, 15205–15223. [Google Scholar] [CrossRef] [PubMed]
  17. Kytö, M.; Nuutinen, M.; Oittinen, P. Method for measuring stereo camera depth accuracy based on stereoscopic vision. In Proceedings of the Three-Dimensional Imaging, Interaction, and Measurement, San Francisco, CA, USA, 24–27 January 2011; Volume 7864, pp. 168–176. [Google Scholar]
  18. Kopparapu, S.; Corke, P. The effect of noise on camera calibration parameters. Graph. Model. 2001, 63, 277–303. [Google Scholar] [CrossRef]
  19. Su, Z.; Pan, J.; Zhang, S.; Wu, S.; Yu, Q.; Zhang, D. Characterizing dynamic deformation of marine propeller blades with stroboscopic stereo digital image correlation. Mech. Syst. Signal Process. 2022, 162, 108072. [Google Scholar] [CrossRef]
  20. Williams, K.; Rooper, C.N.; De Robertis, A.; Levine, M.; Towler, R. A method for computing volumetric fish density using stereo cameras. J. Exp. Mar. Biol. Ecol. 2018, 508, 21–26. [Google Scholar] [CrossRef]
  21. Pi, S.; He, B.; Zhang, S.; Nian, R.; Shen, Y.; Yan, T. Stereo visual SLAM system in underwater environment. In Proceedings of the OCEANS 2014-TAIPEI, Taipei, Taiwan, 7–10 April 2014; pp. 1–5. [Google Scholar]
  22. Xu, Y.; Zhao, Y.; Wu, F.; Yang, K. Error analysis of calibration parameters estimation for binocular stereo vision system. In Proceedings of the 2013 IEEE International Conference on Imaging Systems and Techniques (IST), Beijing, China, 22–23 October 2013; pp. 317–320. [Google Scholar]
  23. Li, X.; Gao, S.; Yang, Y.; Liang, J. The geometrical analysis of localization error characteristic in stereo vision systems. Rev. Sci. Instrum. 2021, 92, 015122. [Google Scholar] [CrossRef]
  24. Gao, S.; Chen, X.; Wu, X.; Zeng, T.; Xie, X. Analysis of Ranging Error of Parallel Binocular Vision System. In Proceedings of the 2020 IEEE International Conference on Mechatronics and Automation (ICMA), Beijing, China, 13–16 October 2020; pp. 621–625. [Google Scholar] [CrossRef]
  25. Zhang, M.; Cui, J.; Zhang, F.; Yang, N.; Li, Y.; Li, F.; Deng, Z. Research on evaluation method of stereo vision measurement system based on parameter-driven. Optik 2021, 245, 167737. [Google Scholar] [CrossRef]
  26. Zhou, Y.; Li, Q.; Ye, Q.; Yu, D.; Yu, Z.; Liu, Y. A binocular vision-based underwater object size measurement paradigm: Calibration-Detection-Measurement (CDM). Measurement 2023, 216, 112997. [Google Scholar] [CrossRef]
  27. Llorca, D.F.; Sotelo, M.A.; Parra, I.; Ocaña, M.; Bergasa, L.M. Error analysis in a stereo vision-based pedestrian detection sensor for collision avoidance applications. Sensors 2010, 10, 3741–3758. [Google Scholar] [CrossRef]
  28. Zhang, T.; Boult, T. Realistic stereo error models and finite optimal stereo baselines. In Proceedings of the 2011 IEEE Workshop on Applications of Computer Vision (WACV), Washington, DC, USA, 5–7 January 2011; pp. 426–433. [Google Scholar]
  29. Yongkang, L.; Wei, L.; Zhang, Y.; Junqing, L.; Weiqi, L.; Zhang, Y.; Hongwen, X.; Zhang, L. An error analysis and optimization method for combined measurement with binocular vision. Chin. J. Aeronaut. 2021, 34, 282–292. [Google Scholar]
  30. Gai, S.; Da, F.; Dai, X. A novel dual-camera calibration method for 3D optical measurement. Opt. Lasers Eng. 2018, 104, 126–134. [Google Scholar] [CrossRef]
  31. Xiang, R.; He, W.; Zhang, X.; Wang, D.; Shan, Y. Size measurement based on a two-camera machine vision system for the bayonets of automobile brake pads. Measurement 2018, 122, 106–116. [Google Scholar] [CrossRef]
  32. Li, Z.y.; Song, L.m.; Xi, J.t.; Guo, Q.h.; Zhu, X.j.; Chen, M.l. A stereo matching algorithm based on SIFT feature and homography matrix. Optoelectron. Lett. 2015, 11, 390–394. [Google Scholar] [CrossRef]
  33. Tong, Z.; Gu, L.; Shao, X. Refraction error analysis in stereo vision for system parameters optimization. Measurement 2023, 222, 113650. [Google Scholar] [CrossRef]
  34. Zhang, Y.; Liu, W.; Wang, F.; Lu, Y.; Wang, W.; Yang, F.; Jia, Z. Improved separated-parameter calibration method for binocular vision measurements with a large field of view. Opt. Express 2020, 28, 2956–2974. [Google Scholar] [CrossRef]
  35. Huang, H.; Liu, J.; Liu, S.; Jin, P.; Wu, T.; Zhang, T. Error analysis of a stereo-vision-based tube measurement system. Measurement 2020, 157, 107659. [Google Scholar] [CrossRef]
  36. Zhou, Y.; Rupnik, E.; Meynard, C.; Thom, C.; Pierrot-Deseilligny, M. Simulation and analysis of photogrammetric UAV image blocks—Influence of camera calibration error. Remote Sens. 2019, 12, 22. [Google Scholar] [CrossRef]
  37. Zilly, F.; Kluger, J.; Kauff, P. Production rules for stereo acquisition. Proc. IEEE 2011, 99, 590–606. [Google Scholar] [CrossRef]
  38. Sha, O.; Zhang, H.; Bai, J.; Zhang, Y.; Yang, J. The analysis of the structural parameter influences on measurement errors in a binocular 3D reconstruction system: A portable 3D system. PeerJ Comput. Sci. 2023, 9, e1610. [Google Scholar] [CrossRef]
  39. Liu, X.; Chen, W.; Madhusudanan, H.; Du, L.; Sun, Y. Camera orientation optimization in stereo vision systems for low measurement error. IEEE/ASME Trans. Mechatron. 2020, 26, 1178–1182. [Google Scholar] [CrossRef]
  40. Yang, L.; Wang, B.; Zhang, R.; Zhou, H.; Wang, R. Analysis on location accuracy for the binocular stereo vision system. IEEE Photonics J. 2017, 10, 7800316. [Google Scholar] [CrossRef]
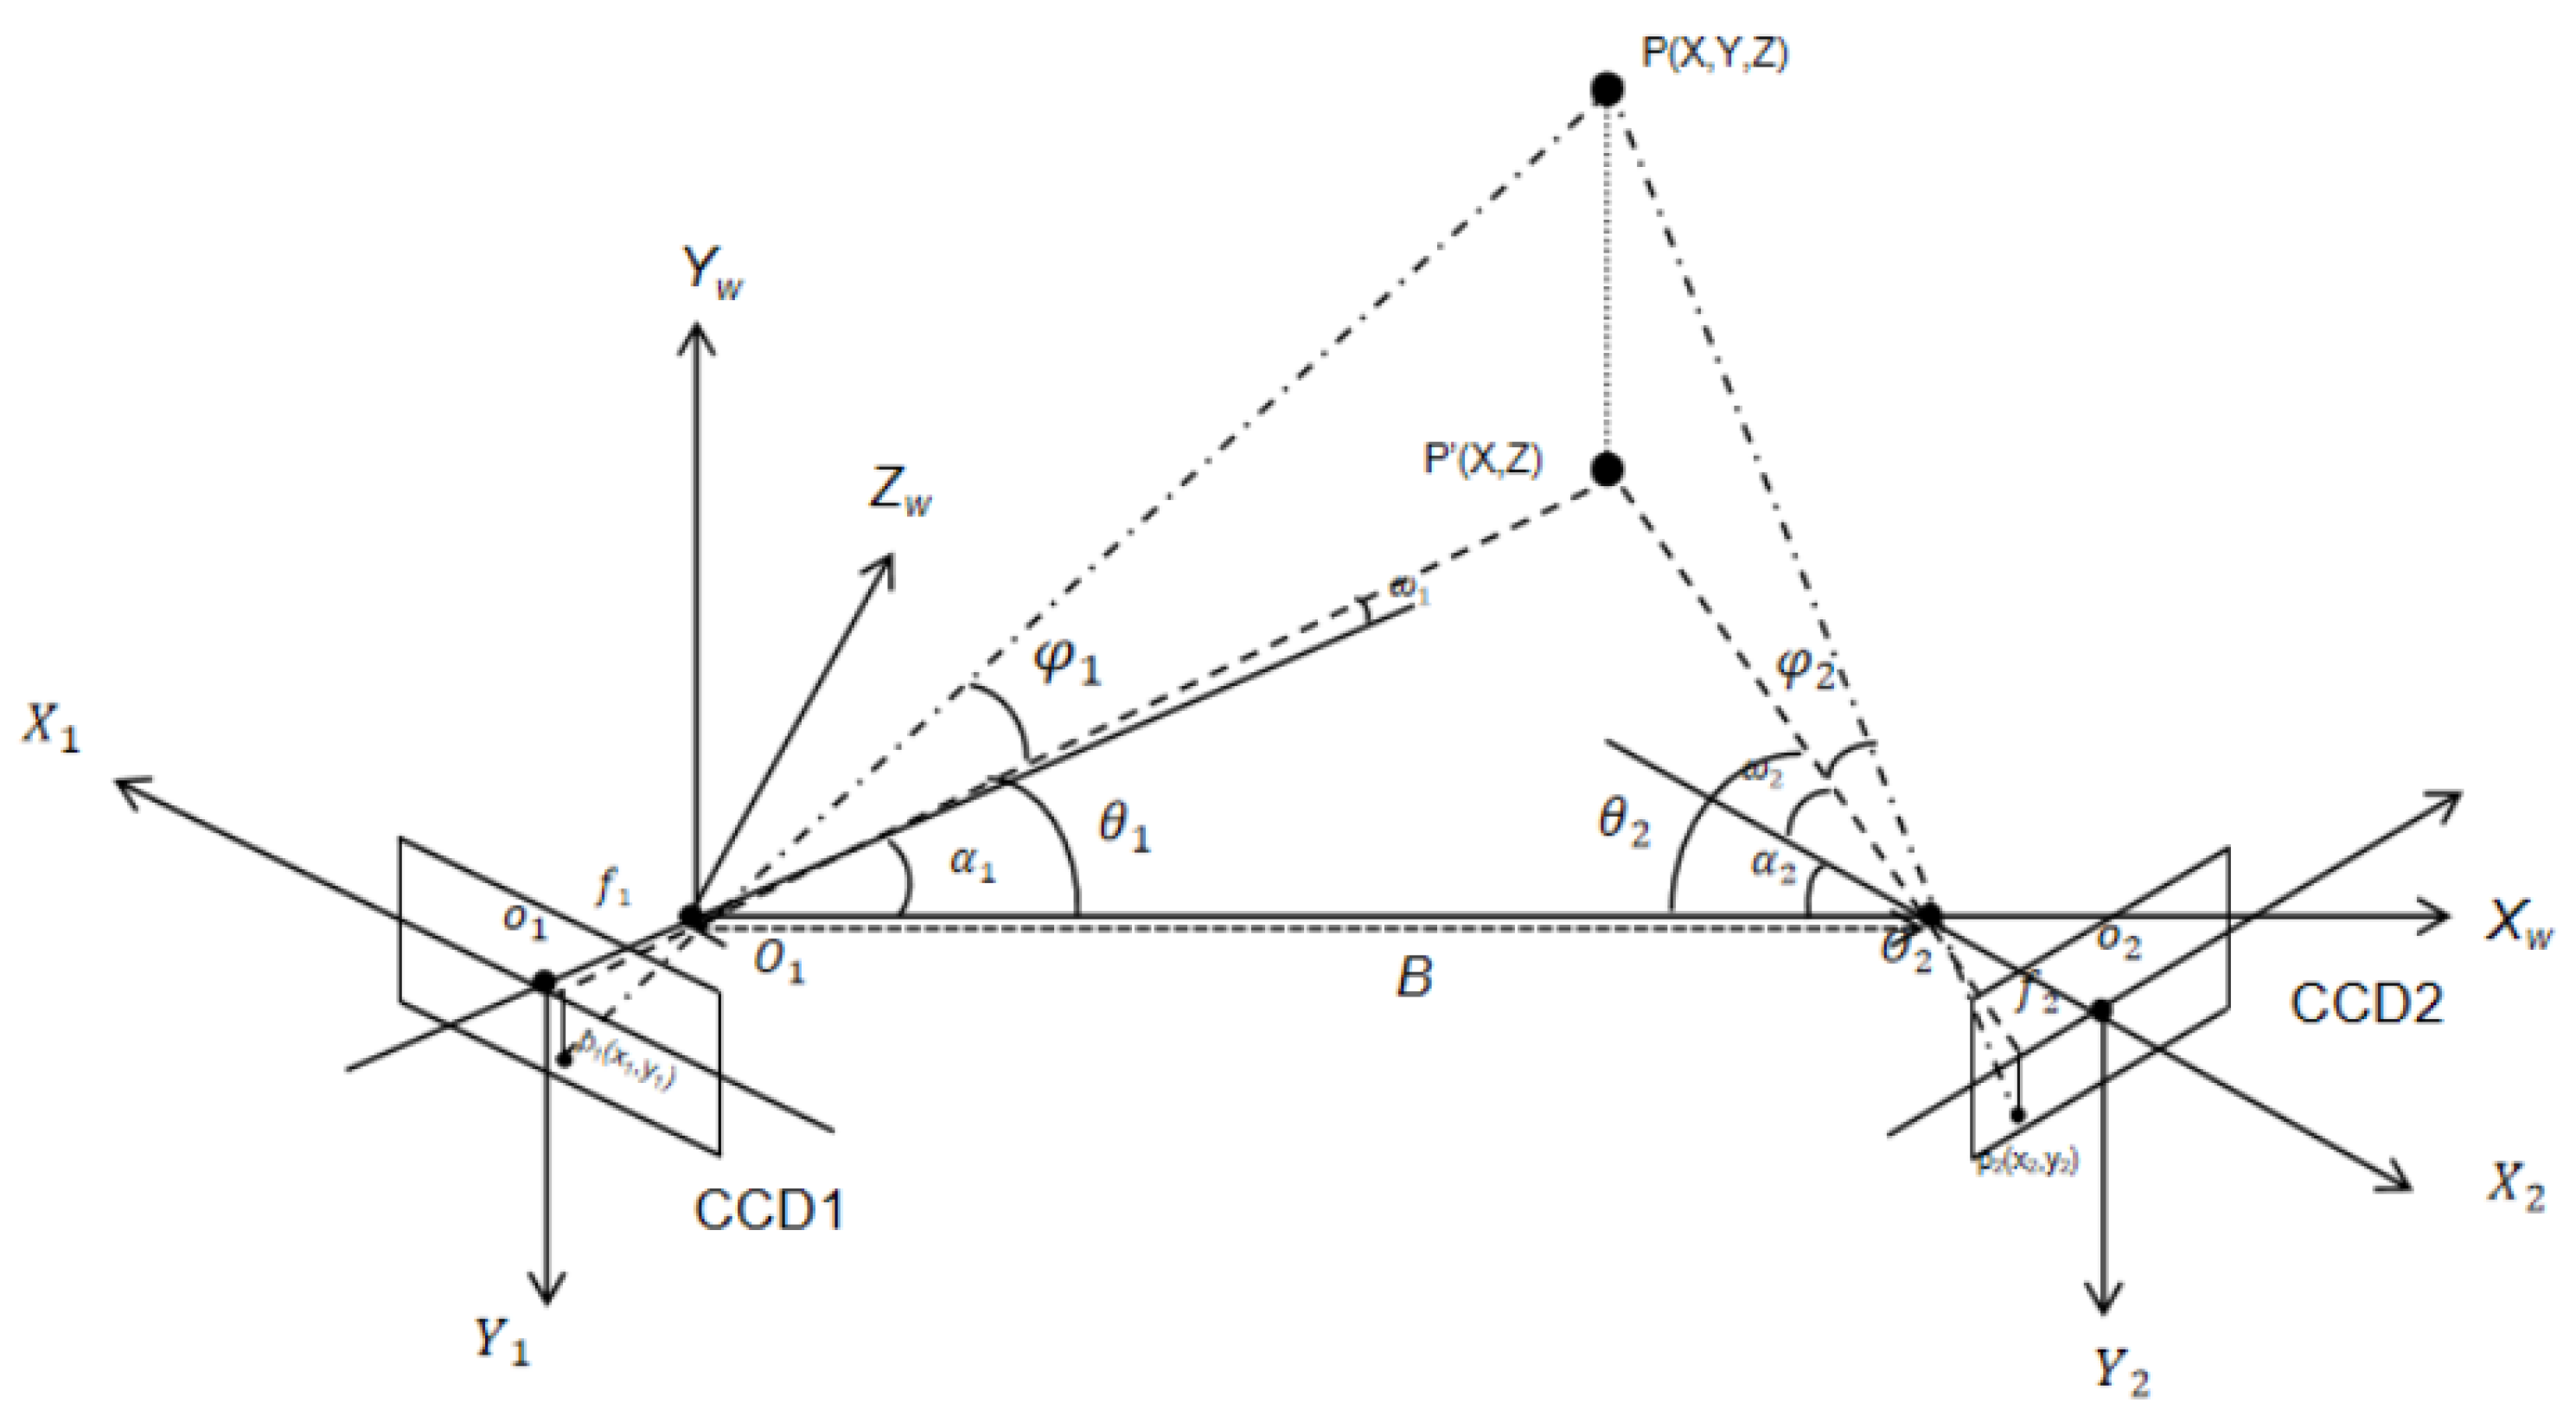
Figure 1. A structural model of a binocular vision measurement system.
Jmse 12 01610 g001
Figure 2. An overhead view of the binocular vision system architecture.
Jmse 12 01610 g002
Figure 3. The distribution curve of the systematic error for parameter K .
Jmse 12 01610 g003
Figure 4. Variation curve of systematic error relative to external camera parameter error. (a) Distribution curve of systematic error with respect to angle between baseline and optical axis; (b) variation curve of systematic error relative to baseline length.
Jmse 12 01610 g004
Figure 5. Total error distribution curve of system structural parameters.
Jmse 12 01610 g005
Figure 6. System structure.
Jmse 12 01610 g006
Figure 7. Experimental setup.
Jmse 12 01610 g007
Figure 8. Impact of Z on systematic error at different B .
Jmse 12 01610 g008
Figure 9. Impact of B on systematic error at different Z .
Jmse 12 01610 g009
Figure 10. Plan view of experimental apparatus.
Jmse 12 01610 g010
Figure 11. Measurement error curves of angle α between baseline and optical axis.
Jmse 12 01610 g011
Table 1. Measurement results of target (unit: mm).
B/Z30 cm40 cm50 cm60 cm70 cm
5 cm26.9195 mm27.3054 mm26.7151 mm26.5440 mm26.3830 mm
10 cm27.1043 mm26.6551 mm26.5797 mm26.4722 mm26.4097 mm
15 cm27.1504 mm26.6189 mm26.4629 mm26.3282 mm26.2018 mm
20 cm26.7665 mm26.6601 mm27.4959 mm27.8492 mm26.3031 mm
25 cm27.6544 mm26.8131 mm26.6576 mm25.8550 mm28.7729 mm
Table 2. Measurement results of target (unit: mm).
Angle15°25°35°45°55°
result28.0896 mm26.3043 mm26.7151 mm27.1043 mm27.3276 mm27.433 mm
Disclaimer/Publisher’s Note: The statements, opinions and data contained in all publications are solely those of the individual author(s) and contributor(s) and not of MDPI and/or the editor(s). MDPI and/or the editor(s) disclaim responsibility for any injury to people or property resulting from any ideas, methods, instructions or products referred to in the content.