Abstract
Anchor damage is one of the main risk factors for the safe operation of submarine cables. Additionally, due to a scour effect induced by seabed currents, submarine cables are prone to exposure or even suspension, increasing the risk of being dragged by anchors. Therefore, it is necessary to study the global response of exposed and suspended submarine cables subjected to anchor dragging. In this study, the tensile and bending stiffnesses of submarine cables are calculated by theoretical methods, and the accuracy of these calculations is verified by establishing a detailed finite element model. Then, the mechanical properties of the submarine cables are equivalently modeled using beam elements, and a large-scale finite element model for exposed and suspended cables under anchor dragging is established. Considering different dragging forces, exposed lengths, spanning lengths, and spanning heights, the overall deformation and mechanical responses of exposed and suspended cables are analyzed separately. The results show that under dragging forces, axial forces are uniformly distributed along exposed and suspended segments, while bending moments concentrate at the central hooking area and the ends of exposed and suspended segments. The influence of dragging force, exposed length, spanning length, and spanning height on the stress and deformation of submarine cables is significant. The results can be used for submarine cable damage assessments caused by anchor dragging.
1. Introduction
Submarine cables serve as crucial infrastructure for transmitting electricity and information, playing a vital role in island power supply, offshore wind farm connectivity, and electricity provision for oil platforms [1]. As inter-island and intercontinental power grids are constructed and marine resources are increasingly exploited, global demand for submarine cables is on the rise. The length of submarine cable laying is constantly increasing [2]. Submarine cables have a complex structure and operate in harsh environments, making them susceptible to various external loads that can lead to failures. According to recent statistics on cable faults, nearly 70% of damage to submarine cables results from anchor impacts and fishing activities [3,4]. The hooking and dragging of anchors and fishing nets by ships pose the primary threats to the safe operation of submarine cables. Once a submarine cable suffers a severe mechanical failure, it can severely disrupt normal production and daily life. The repair costs are prohibitively expensive [5,6]. Therefore, ensuring the safety of submarine cables deserves significant attention.
In submarine cable-laying projects, to protect against external damage, cables are typically buried shallowly beneath the seabed surface or protected by rockfill [7]. However, due to the harsh operational environment on the seafloor, including wave action and seabed currents, both the rock shielding above the cable and the seabed below can suffer erosion, resulting in cable exposure or even suspension. Inspections within the Hainan Power Grid Interconnection Projects have identified a growing trend over the years in the extent of cable exposure and suspension, with exposed segments reaching tens of meters [8]. The anchor may directly interact with these exposed or suspended segments of cable, causing them to be dragged and posing a potential risk of damage and failure.
Submarine cables typically feature a multi-layer helical structure, which results in intricate mechanical responses when subjected to loads. Several studies have been conducted to investigate the mechanical behavior of submarine cables under various loading conditions. Chang and Chen [9] studied the mechanical behavior of submarine power cables subjected to coupled tension, torsion, and compressive loads and compared numerical results with theoretical model predictions. Fang et al. [10] investigated the mechanical behavior of submarine power cables under axisymmetric loadings through both analytical and numerical methods, predicting the tension and torsion stiffnesses of cables and evaluating the stress of armor wires. Ménard and Cartraud [11] proposed a detailed finite element model for a submarine cable using homogenization theory and beam elements, and they investigated the nonlinear bending behavior of the cables. Ehlers et al. [4] conducted full-scale tensile experiments of one HVAC and one HVDC cable, determining the purely mechanical ultimate strength of the cable under axial load, which provided the necessary material properties for the numerical simulations of the submarine cables. Several researchers used numerical modeling to study the behavior of submarine cables under dynamic loading conditions. Salem Okpokparoro and Srinivas Sriramula [12] proposed an efficient analytical model for the prediction of configuration and loads of dynamic power cables. The model evaluated cable fatigue damage with realistic environmental random inputs and relevant uncertainties. Guo et al. [13] conducted a fatigue analysis on dynamic cables based on marine dynamic loading conditions by establishing global and local numerical analysis models.
The main causes of damage to submarine cables include dragging and impact by anchor. Falling anchors onto submarine cables can easily cause local depressions. Dragging of the anchor can cause excessive lateral movement of the cable, which undermines the ultimate limit state, accidental limit state, and serviceability limit state [14]. Gao et al. [15] proposed experimental and numerical methods for assessing the impact damage of a submarine photoelectric composite cable induced by anchoring and established a nonlinear finite element model to study the impact response of the cable. Zhang et al. [16] established a finite element model of anchors, three-core composite submarine cables, and soil to study how the impact angle of ship anchors influences the damage to submarine cables. Zhang et al. [17] established a numerical model of ship anchor impacts on submarine cables in ABAQUS and analyzed the local dynamic responses of the cable’s suspended and buried segments. Ou et al. [18] established finite element models of anchor damage of a 500 kV self-contained oil-filled submarine power cable and analyzed the stress and strain distributions of the armor layer, insulating layer, and conductor layer. Wang et al. [19] carried out finite element (FE) analysis and physical modeling to investigate the responses of submarine telecommunication cables to lateral seabed movements and proposed a simple but effective formula to predict the maximum cable strains induced by lateral seabed movements. In summary, current research on anchor damage to submarine cables primarily focuses on local deformation and failure due to anchor impact, with limited studies addressing the global response of submarine cables under anchor-dragging conditions. In addition, the research typically focuses on the mechanical properties of cables [4] or the penetration behavior of anchors that may cause damage to cables [20,21], but few studies have considered the drag behavior of anchors in conjunction with the mechanical response of cables.
When a ship’s anchor drags and collides with a submarine cable, the speed of impact is typically low [21,22,23]. Therefore, the local deformations caused by the hooking and collision of the anchor can be neglected for the slender and flexible structure of the cable. Instead, the focus is on the overall deformation of the cable under anchor dragging. The forces and deformation lengths of the cable can reach magnitudes of several hundred meters when subjected to anchor dragging [14]. To study the global response of exposed and suspended submarine cables under anchor dragging, a theoretical method is first employed to calculate the tensile and bending stiffnesses of the cables, considering the multiple internal layers of the cable structure. These theoretical calculations are validated using a full-scale numerical model of the cable. To simulate large-scale anchor dragging, beam elements are used to simulate its global response with the equivalent theoretical stiffness of the submarine cable. A finite element method is employed to establish a model for simulating the exposed and suspended cable under anchor-dragging conditions, in which the interaction between the cable and the seabed is considered. The effects of dragging force, exposed length, spanning length, and height on the overall deformation and stress distribution of both the exposed and suspended submarine cables are analyzed.
2. Problem Modeling
In order to analyze the global response of submarine cables subjected to anchor dragging, it is essential to model and analyze the problem of anchor dragging on cables. In this part, a load analysis model is first proposed, which reasonably analyzes and simplifies the loads experienced by the cable during the anchor-dragging process. Subsequently, a solution procedure is proposed to perform finite element simulation and analysis of the process of cable dragged by anchor.
2.1. Load Analysis
Figure 1 illustrates the load analysis model of a submarine cable subjected to anchor dragging. Submarine cables are exposed to wave and current erosion, leading to exposure and even suspension. During anchor dragging, the exposed and suspended segments of submarine cables may either hang entirely freely or partially contact the seabed. Both ends of the cable are buried in the seabed, possibly with rock protection at the top, constraining its lateral and axial displacements.

Figure 1.
Load analysis model of a submarine cable dragged by anchor.
During anchor dragging on the submarine cable, the worst-case scenario is the case that the dragging force acts perpendicular to the cable axis. Due to the small contact area between the anchor and the cable compared to the cable length, the dragging force is considered as a concentrated horizontal force applied at the midpoint of the exposed and suspended segment. The cable moves in the direction of anchor dragging, resulting in axial forces and bending moments. Additionally, the suspended segment of the cable experiences zero axial and lateral soil resistance, whereas the segment in contact with the seabed encounters axial soil resistance and lateral soil resistance from the surrounding seabed soil. The axial soil resistance mainly consists of friction between the cable and the soil, while the lateral soil resistance includes frictional force and passive soil resistance.
2.2. Solution Procedure
The deformation length of the submarine cable under anchor dragging is quite extensive. Consequently, the numerical model of the submarine cable needs to be considerably long in the anchor-dragging analysis. However, the structure of the cable is complex, and it features helically wound armor layers. It is nearly impossible to model each layer of the cables using the finite element method to study their global response. Therefore, the cables are modeled using beam elements with equivalent tensile and bending stiffnesses, which significantly reduces the computational complexity. The study firstly conducts a rational simplification of the cable structure, yielding the simplified structural and material parameters. Subsequently, theoretical models are employed to calculate the tensile and bending stiffnesses of the cable, and a full-scale finite element model of the submarine cable is established to compute these stiffness values. By comparing the theoretical and numerical results, accurate stiffness data are obtained. Based on these stiffness values, a finite element model for the anchor dragging of the cable using beam elements is constructed to analyze the global response of the exposed and suspended submarine cables. The solution process of this study is shown in Figure 2.
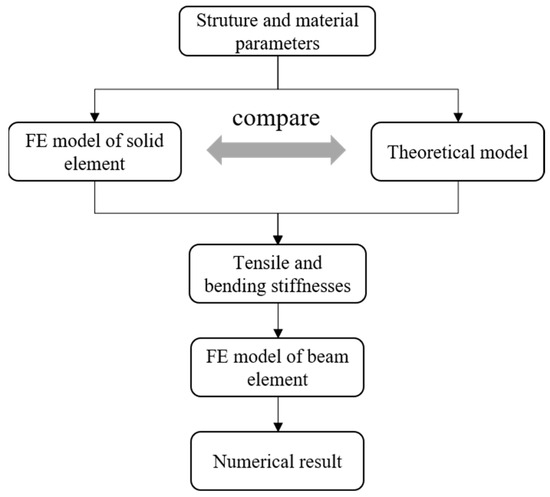
Figure 2.
Flowchart of solution procedure for cable dragged by anchor.
3. Finite Element Simulation
In this part, theoretical mechanical models and a full-scale finite element model of the submarine cable using solid elements are established. By comparing the results of these two models, the equivalent tensile and bending stiffnesses of the simplified cable are obtained. Based on these stiffness values, large-scale finite element models of the cable using beam elements under anchor dragging are established.
3.1. Stiffness Calculation
The stiffness of submarine cable is crucial for accurately predicting the overall deformation and stress distribution in the anchor drag analysis. This section first introduces the simplified structural and material parameters of the submarine cable, followed by the establishment of theoretical and numerical models for calculating cable stiffness. By comparing theoretical and numerical results, the accuracy of the stiffness calculations is validated.
3.1.1. Structure and Material Parameters
The research focuses on a self-contained oil-filled submarine cable, which adopts a composite structure. The cross-sectional structure, as shown in Figure 3, primarily consists of annular components fulfilling various functions and helically wound armored copper wires.
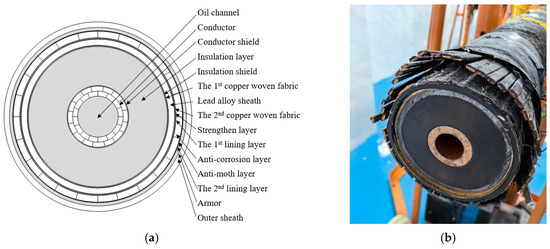
Figure 3.
Construction profile of submarine cable. (a) Cross-section of cable. (b) A real photo of cable.
The structure of submarine cable is complex. To reduce the computational costs of stiffness in the theoretical calculations and finite element analysis, this study simplifies the structure of submarine cables by neglecting low-strength, thin layers, such as conductor shield, insulation shield, and anti-corrosion layer. Table 1 shows the structure parameters of the submarine cable before and after simplification. The armor layer of the submarine cable is composed of several cold-drawn copper wires, which are helically wound at a specific angle and serve as a crucial load-bearing structure. The geometric parameters of the armor wires are shown in Table 2. Due to the special stick–slip mechanism of the helical armor layer, the bending response of the cable is highly nonlinear [24]. The material properties of the various components are shown in Table 3.

Table 1.
Structural parameters of submarine cable. (“—” indicates that the component is simplified).

Table 2.
Geometric parameters of the armor wires.

Table 3.
Material properties.
3.1.2. Theoretical Model for Stiffness Calculation
Based on the simplified structural and material parameters of the submarine cable model provided above, in this section, theoretical formulas are employed to calculate the tensile stiffness and bending stiffness of the cable. The tensile stiffness is computed using the following analytical formula derived by Knapp [25]:
where , , , and are the cross-sectional area, elastic modulus, helical winding radius, and helix angle of the i-th wire, respectively, denotes the total number of wires, is the equivalent Poisson’s ratio parameter, and and denote the radius and tensile stiffness of the circular ring components.
The bending stiffness is calculated using the Witz model [26], which disregards frictional effects and assumes uniform bending deformation among components within the same layer. The bending stiffness of a ring-shaped component is typically constant [27]. However, due to the presence of the helical armor layer in the cable, its bending response shows a pronounced hysteresis behavior. During the bending of a cable, when the friction between the wires is not sufficient to resist the tendency of the wires to slide relative to each other, sliding will occur between the wires. When the bending curvature of the cable is small, there is no slip between the layers, and the bending stiffness is referred to as stick stiffness . However, when the armor layer fully slips, the bending stiffness significantly decreases, and the bending stiffness at this stage is known as slip stiffness [28]. The calculation formulas are as follows:
where represents the bending stiffness of the ring component and and represent the bending stiffness of the i-th wire in the normal and bi-normal directions, respectively.
Table 4 summarizes the calculated tensile stiffness and bending stiffness based on the theoretical models.

Table 4.
Stiffnesses obtained by theoretical models.
3.1.3. Finite Element Model for Stiffness Calculation
Based on the structural and material parameters provided in Table 1 and Table 3, considering geometric nonlinearity and contact nonlinearity, a full-scale simulation model of the submarine cable is established using the implicit solver of general finite element software Abaqus/Standard (version 2021). The finite element model of the submarine cable is shown in Figure 4. All layers of the cable are modeled using C3D8R elements (eight-node continuum linear solid elements with reduced integration). This element type can avoid shear locking and reflect the variation in stress distribution without losing the accuracy [10]. The accuracy and convergence of finite element results depend on the quality of meshing. In this study, the model is appropriately segmented to ensure precise meshing. Two different mesh sizes are tested, as shown in Figure 5. The simulated tensile stiffness based on the coarse mesh and the fine mesh sizes are 428.5 and 430.9 , respectively, and the corresponding bending stiffnesses are 162.0 and 165.8 , respectively. The error between two mesh sizes regarding both tensile stiffness and bending stiffness is less than 2.3%. Therefore, in order to minimize the computation time, the coarse mesh size is used in the study.
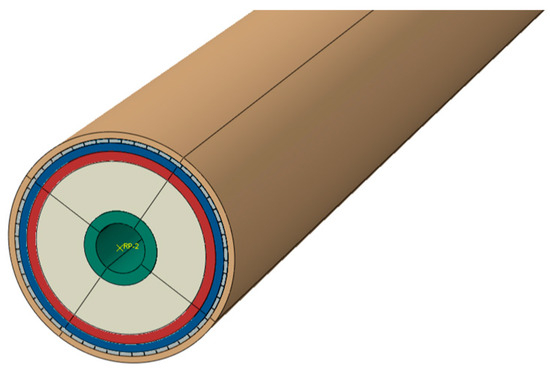
Figure 4.
Finite element model of the submarine cable.
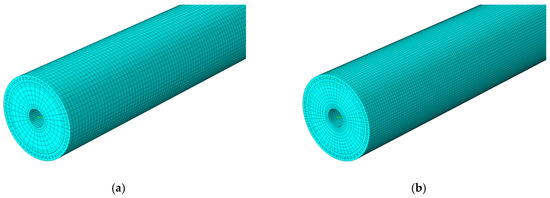
Figure 5.
Two different mesh sizes for the finite element model. (a) Coarse mesh. (b) Fine mesh.
All contact interactions between the components of the cable are considered as well as potential lateral contact between adjacent armor wires. To ensure convergence of the finite element model, node-to-surface discretization method is used to model the contact between the components. A penalty algorithm is chosen for numerical efficiency to impose normal and tangential contact conditions. The normal mechanical behavior is defined as “Hard Contact” with “Allow separation after contact”. A friction coefficient of 0.20 and an elastic slip limit of 0.005 are applied to all contact definitions in the tangential directions [29]. To ensure uniformity of end loading, two reference points are created at the centers of the cross-sections at both ends of the submarine cable. The degree of freedoms (DOFs) of the cross-sections in all directions are coupled with this point so that all layers and the end points of the wires are connected rigidly to the reference points (RPs). Table 5 summarizes the boundary conditions under tensile and bending load conditions. In Table 5, 1 denotes the corresponding DOF is fixed and 0 indicates it is free.

Table 5.
The boundary conditions for tension and bending cases.
Based on the established finite element model of the submarine cable, tensile and bending loads are separately applied to the left reference points. A force in the Z-direction and a rotation angle around the X-direction are employed to apply tensile and bending loads to the model, respectively (see Figure 6). The load–response curves are shown in Figure 7. The tensile stiffness of the cable is defined as the ratio of axial force to axial deformation, while the bending stiffness is defined as the ratio of the bending moment to curvature. Figure 7a illustrates the relationship between axial force and deformation of the cable. It can be observed that the mechanical response of the cable under tension is highly linear. Figure 7b shows the bending moment–curvature curve of the cable. As the curvature approaches around 0.01 , the slope of the curve decreases, indicating that the armor wires undergo slip, transitioning from stick stiffness to slip stiffness. This study investigates the large deformation characteristics of the cable under anchor dragging, when the bending curvature of the cable far exceeds the critical curvature of the armor layer when it completely slips. Therefore, the slip stiffness is used as the bending stiffness of the submarine cable for anchor-dragging analysis.
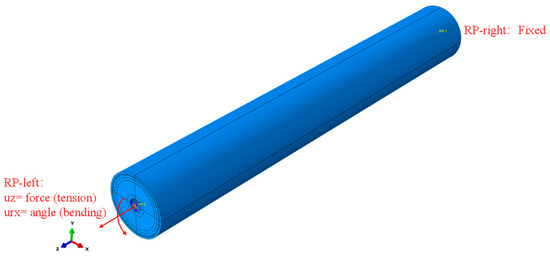
Figure 6.
Boundary conditions and loading.
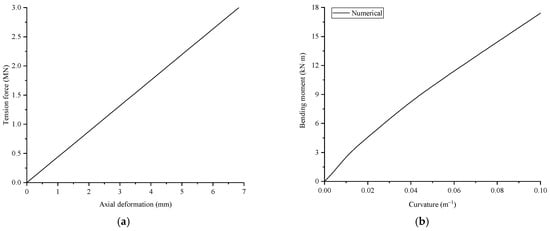
Figure 7.
Load response under different cases. (a) Tension. (b) Bending.
The tensile stiffness and bending stiffness of the submarine cable obtained from the numerical model are compared with the theoretical model results in Table 6. The errors between the theoretical and finite element results for both tensile and bending stiffnesses are within 3%, illustrating the stiffness from these two methods agree quite well with each other. The main reasons for the errors may include insufficient precision of the results due to the insufficiently fine mesh size of the finite element model and simplifications of the theoretical mechanics models, such as not accounting for the interactions between different layers. This validates the accuracy of both the finite element model and the theoretical model, providing accurate stiffness data for calculating the global response of the cable under anchor dragging.

Table 6.
Comparison between finite element model and theoretical data.
3.2. Finite Element Models for Anchor Dragging
Due to scouring by ocean currents, buried submarine cables may become exposed or suspended. When a submarine cable is exposed, it experiences lateral and axial movements under dragging forces, subjected to lateral and axial soil resistances. When the cable is suspended, the suspended segment undergoes lateral, vertical, and axial movements under dragging forces without resistance from the seabed. The sections on both sides of the exposed and suspended segments remain buried, allowing for minor lateral and axial deformations of the cable, and they are supported by lateral and axial resistances provided by the seabed or submarine cable protected by rockfill. Compared to exposed and suspended cables, the lateral deformations of buried segment cables are relatively small. Therefore, this study disregards the lateral deformation of buried segment cables.
In this part, a finite element model is established in ABAQUS/Standard by using “Dynamic implicit” procedure to study the overall deformation and mechanical response of submarine cables under dragging forces, focusing on the exposed and suspended segments. The multi-layer composite wound structure of the cables is simplified to a beam model based on the tensile and bending stiffnesses calculated in the previous section. Beam elements are used to construct a large-scale cable model under anchor dragging. The finite element models are categorized into the model of the exposed cable and the suspended cable subjected to anchor dragging, consisting of the submarine cable and the seabed, as illustrated in Figure 8.
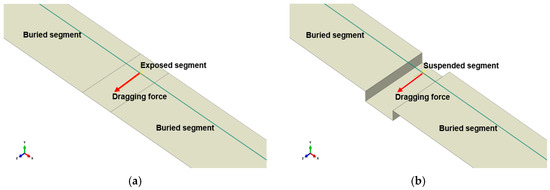
Figure 8.
Finite element model of the submarine cable subjected to anchor drag. (a) Exposed cable. (b) Suspended cable.
This study focuses primarily on the overall deformation of submarine cables. To simplify the calculation, the study does not account for potential soil behavior in scenarios where the anchor drags the cable. Beam elements (B31) are chosen to simulate the submarine cables, while rigid elements (R3D4) are used to model the seabed. The total model length is set to 2000 m to minimize boundary effects. Horizontal concentrated forces from the anchor are applied at the midpoint of the exposed and suspended segments. Surface-to-surface contact is employed to describe the contact properties between the cable and the seabed soil, reflecting the interaction between them. The cable–soil interaction in this study is similar to pipe–soil interaction. Therefore, the lateral friction coefficient between the cable and the soil is defined as 1.0, and the axial friction coefficient is defined as 0.5 referring to DNV-RP-114 [30]. Boundary conditions for the submarine cable include fixed ends and restrictions on lateral displacements in the buried segment to simulate constraints from the seabed and submarine cable protected by rockfill. Considering potential large rotations or bending deformations of the cable, the finite element model accounts for geometric nonlinearity. A mesh size of 1 m is chosen for the buried segment of the cable, and a mesh size of 0.2 m in the exposed and suspended span regions is enough to obtain a convergent and relatively accurate results. The implicit solver with an automatic incrementation scheme is adopted in the present model to guarantee solution convergence within each increment. Parameters for these models are shown in Table 7, and the tensile stiffness and bending stiffness are calculated based on theoretical formulas.

Table 7.
Values of parameters in finite element analysis.
4. Numerical Results
Based on the established finite element models, we discuss the global responses of exposed and suspended submarine cables under dragging forces by anchor. We analyze the effects of the dragging force , exposed length , spanning length , and spanning height on the cable’s overall deformation, axial force, bending moment, and other characteristics.
4.1. Response of Exposed Cable
4.1.1. Influence of Dragging Force
To investigate the effect of the dragging force on the overall displacement and mechanical response of exposed submarine cables, the overall deformations of the cables under different dragging forces are presented, as shown in Figure 9. In Figure 9a, as the dragging force increases, the lateral displacement of the exposed segment of the cable gradually increases. When the dragging force is 10 kN and 20 kN, significant lateral displacements occur in the central hooking area, while the lateral displacement near the ends of the exposed segment approaches zero. As the dragging force continues to increase, lateral displacements occur throughout the exposed segment of the cable, decreasing gradually from the central hooking area toward the ends. The shape of lateral displacement distribution gradually becomes triangular. At the ends, the displacement approaches zero due to constraints from the seabed and submarine cable protected by rockfill. As shown in Figure 9b, under different dragging forces, the axial deformation along the exposed length of the cable exhibits a similar trend. The axial displacement is largest at the ends of the exposed segment, then it gradually decreases toward both the midpoint and the ends of the segment, approaching zero at these locations. The peak axial displacement occurs at the ends of the exposed section. As the dragging force increases, the overall axial displacement of the exposed and buried segments of the cable increases.
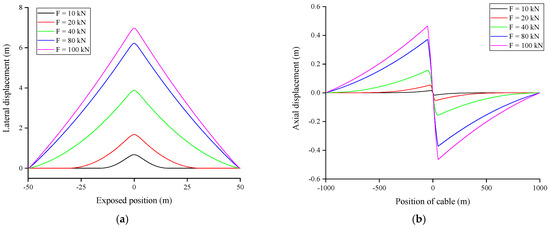
Figure 9.
Overall deformation with different dragging forces ( = 100 m). (a) Lateral deformation. (b) Axial deformation.
Figure 10 shows the distribution of axial force and bending moment along the exposed and buried segments of the submarine cable under varying dragging forces. Figure 10a shows that as the dragging force increases, the overall axial force of the cable also increases. Because the axial deformation of the exposed segment of the submarine cable is relatively uniform when subjected to dragging forces, the distribution of axial force along the exposed segment is also relatively uniform. In the buried segment, the seabed provides resistance to the axial deformation caused by the dragging force. As a result, the axial force in the buried segment gradually decreases as it moves away from the anchor-hooking location. The variation in bending moment with dragging force is presented in Figure 10b. When subjected to dragging forces, the submarine cable exhibits a distribution of maximum bending moments concentrated at the ends of the exposed segment and the midpoint, with smaller values elsewhere. The peak bending moments are concentrated within the range of 0 to 3 m from the anchor-dragging position and the ends. This distribution occurs because the curvature of the cable is significantly greater at the anchor-hooking center and the ends of the exposed segment when subjected to dragging forces, resulting in higher bending moments at these locations. As the dragging force increases, the bending moments at the midpoint and ends of the exposed segment also increase. Therefore, it can be observed that when the submarine cable is dragged by an anchor, the overall forces are significantly higher at the anchor-hooking area and the ends of the exposed segment. Hence, it is crucial to closely monitor deformation and potential damage near these areas when the submarine cable is subjected to anchor dragging.
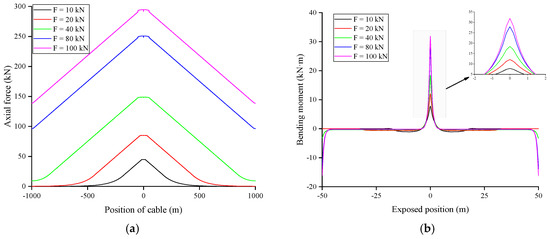
Figure 10.
Distribution of axial force and bending moment with different dragging forces ( = 100 m). (a) Axial force. (b) Bending moment.
Figure 11 illustrates the variation in lateral displacement, axial force, and bending moment at the midpoint of the exposed segment of submarine cables with different exposed lengths under varying dragging forces. The lateral displacement, axial force, and bending moment at the midpoint of the cable increase with increasing dragging force for different exposed lengths. As the dragging force increases, the lateral deformation at the anchor-hooking position of the cable becomes more pronounced, resulting in higher axial forces and bending moments. When the dragging force is constant, as the exposed length of the submarine cable increases, both the lateral displacement and the axial force at the midpoint of the cable gradually increase, while the bending moment decreases. Moreover, the greater the dragging force, the greater the impact of the exposed length on the lateral displacement, axial force, and bending moment at the midpoint.

Figure 11.
Lateral displacement, axial force, and bending moment at the midpoint of the submarine cable with different dragging forces. (a) Lateral displacement. (b) Axial force. (c) Bending moment.
4.1.2. Influence of Exposed Length
The length of the exposed segment determines the extent of lateral displacement response of the submarine cable under dragging forces. A longer exposed length results in a greater length over which lateral displacement occurs. As shown in Figure 12, for = 100 kN, the overall deformation of the submarine cable along its route is illustrated. From Figure 12a, it can be observed that the overall lateral deformation shapes of the exposed segments of the cable with different lengths are similar, approximating a triangular form. Larger exposed lengths correspond to greater lateral displacements. As shown in Figure 12b, under the same dragging force, increasing the exposed length of the cable leads to a greater overall axial displacement. The peak axial displacement of the cable also significantly increases with longer exposed lengths.
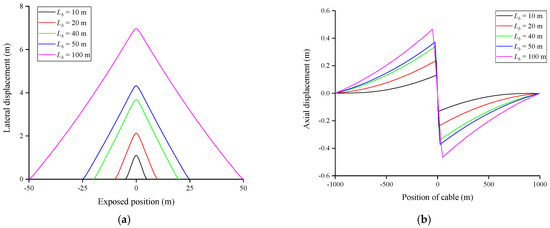
Figure 12.
Overall deformation with different exposed lengths ( = 100 kN). (a) Lateral deformation. (b) Axial deformation.
Figure 13 shows the overall stress distribution of submarine cables for different exposed lengths. As shown in Figure 13a, it is evident that longer exposed lengths result in higher axial forces in both the exposed and buried segments. This is because longer exposed segments undergo greater overall deformation, leading to increased axial forces. Additionally, the axial forces experience a significant reduction at the midpoint and ends of the exposed segment, where bending deformation is more pronounced. Figure 13b illustrates that as the exposed length increases, the bending moments at the midpoint and ends of the exposed segment decrease. This decrease occurs because, for a constant dragging force, longer exposed lengths lead to smaller bending curvatures at the anchor-hooking center and ends of the exposed segment, consequently reducing the corresponding bending moments. When the dragging force is constant, longer exposed lengths generally increase the overall axial forces in the exposed segment while decreasing the bending moments at the midpoint and ends of the exposed segment. Therefore, it is crucial to comprehensively consider the impact of exposed length on the stress distribution of the submarine cable.
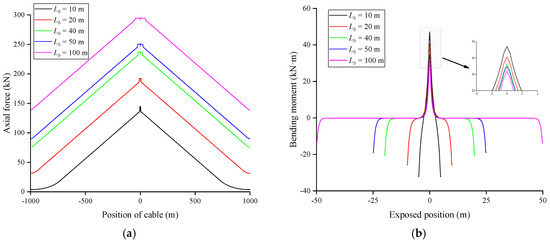
Figure 13.
Distribution of axial force and bending moment with different exposed lengths ( = 100 kN). (a) Axial force. (b) Bending moment.
Figure 14 illustrates the variation in mid-span axial force and bending moment along the exposed length of submarine cables under different dragging forces. Under various dragging forces, the mid-span axial force increases with increasing exposed length, while the mid-span bending moment gradually decreases with increasing exposed length. This is because the exposed length determines the length of the cable over which lateral displacement can occur. For a constant dragging force, a greater exposed length results in a larger resisting force from the seabed against lateral cable movement, thereby increasing internal axial forces of the cable. Additionally, greater exposed lengths lead to a smoother curvature at the midpoint of the exposed segment, resulting in smaller bending moments. An increase in the dragging force will cause both the axial force and bending moment at the midpoint of the submarine cable to increase. Additionally, it makes the impact of the exposed length on the axial force and bending moment at the midpoint more pronounced.
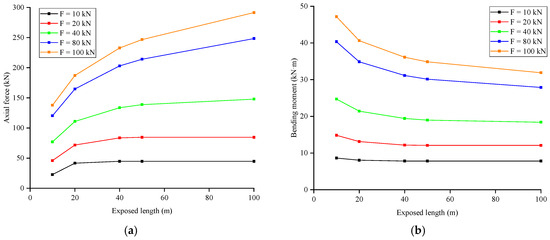
Figure 14.
Variation in axial force and bending moment at the midpoint of the exposed segments with exposed length. (a) Axial force. (b) Bending moment.
4.2. Response of Suspended Cable
4.2.1. Influence of Spanning Height
During the dragging process, the spanning height affects the interaction between the cable and the seabed, thereby influencing the global response of the cable by anchor dragging. Figure 15 shows the variation in spatial positions of the suspended segment at spanning heights = 0.1 m, 0.7 m, and 2 m with respect to the horizontal dragging force. It can be observed that the cable exhibits three spatial motion states under dragging force: contacting the seabed, suspended after contacting the seabed, and completely suspended. As illustrated in Figure 15a, for = 0.1 m, the cable initially sags under its own weight, making contact with the seabed mid-span, where the seabed provides support reaction forces. With increasing dragging force, it undergoes lateral displacement and simultaneously experiences frictional resistance from the seabed. Even for = 100 kN, the mid-span of the cable remains in contact with the seabed. As shown in Figure 15b, as the dragging force increases, the mid-span of the submarine cable gradually detaches from the seabed due to its length constraints. For = 40 kN, the submarine cable becomes completely suspended and it no longer interacts with the seabed. Figure 15c illustrates that at = 2 m, the cable remains completely suspended throughout the dragging process without interacting with the seabed. Moreover, as the horizontal dragging force increases, the lateral and vertical displacements of the cable increase, further distancing it from the seabed.
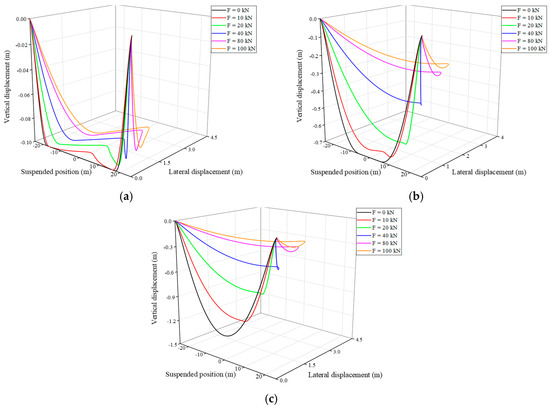
Figure 15.
Spatial configuration of submarine cables with different spanning heights ( = 50 m). (a) = 0.1 m. (b) = 0.7 m. (c) = 2 m.
Based on the above analysis, it is evident that the midpoint of the suspended segment experiences the highest forces, making it a critical risk point for cable failure. Therefore, this section investigates the influence of the spanning height on the axial force and bending moment at the midpoint of a submarine cable under different dragging forces, with a fixed spanning length, as shown in Figure 16. Figure 16a shows that under varying dragging forces, the axial force at the midpoint initially increases with increasing spanning height and then stabilizes. When the dragging force is low, increasing the spanning height reduces the contact between the cable and the seabed, increasing in axial force. As the spanning height reaches a certain level, the cable becomes completely suspended, and the axial force stabilizes. This is because the support from the seabed and soil resistance counteract a portion of the cable’s self-weight and dragging force, and the spanning height affects the interaction between the cable and the seabed. For higher dragging forces, the axial force of the cable is primarily determined by the dragging force, with the spanning height having a less significant impact. Figure 16b shows that at lower dragging forces, the bending moment at the midpoint is influenced by the spanning height. As the spanning height increases, the reaction force from the seabed decreases, resulting in greater overall deformation of the cable under the same horizontal dragging force, leading to a more gradual curvature in the cable. Therefore, the bending moment slightly decreases with increasing spanning height. However, the effect of spanning height on the midpoint bending moment is not significant. An increase in the dragging force causes the suspended span of the submarine cable to gradually detach from the seabed, thereby reducing the support and frictional resistance that the seabed provides to the cable. Consequently, an increase in the anchor-dragging load diminishes the influence of the spanning height on the axial force and bending moment at the midpoint of the cable.
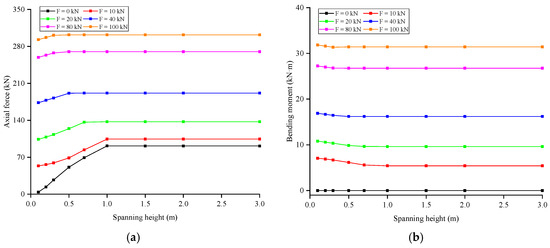
Figure 16.
Variation in axial force and bending moment at the midpoint of the suspended segments with spanning height ( = 50 m). (a) Axial force. (b) Bending moment.
4.2.2. Influence of Spanning Length
The spanning length of the submarine cable determines the length of its free span, resulting in different overall displacements and mechanical responses. Cables with longer spanning lengths sag under gravity and potentially contact the seabed. Figure 17 presents the displacement, axial force, and bending moment distributions of the suspended segments for various spanning lengths. As shown in Figure 17a, as the spanning length increases, the length of the free span also grows, leading to larger maximum vertical displacements. The vertical displacement of the suspended segments is maximum at the middle position and decreases toward the ends. For instance, the cable with a spanning length = 100 m makes contact with the seabed surface at its midsection achieving a maximum vertical displacement of 0.5 m. Figure 17b illustrates that longer spanning lengths result in larger free-spanning lengths and consequently larger overall lateral displacements of the cable. Figure 17c indicates that under a given dragging force, longer spanning lengths correspond to higher axial forces in the cable. The axial force in the buried segments is lower than in the suspended segments and decreases gradually away from the suspended segments. Figure 17d shows that as the spanning length increases, the bending moments at the anchor-hooking area and at the ends of the suspended segments decrease. This is because, with a longer spanning length, the bending deformation in these areas becomes more gradual, resulting in smaller bending moments.
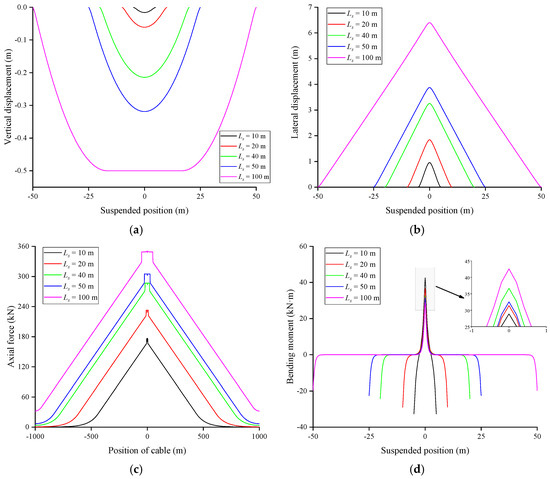
Figure 17.
Displacement and internal force distribution with different spanning lengths ( = 100 kN, = 0.5 m). (a) Vertical deformation. (b) Lateral deformation. (c) Axial force. (d) Bending moment.
Different spanning lengths of the submarine cable exhibit varying spatial position changes under dragging force, as shown in Figure 18. Figure 18a illustrates that the submarine cable with a suspended length = 20 m is in a completely suspended state. As the dragging force increases, both the vertical and lateral displacements gradually increase. Figure 18b shows that as the dragging force gradually increases, the cable initially makes partial contact with the seabed, then progressively detaches, eventually becoming fully suspended. Figure 18c shows that under the influence of horizontal dragging force, the suspended segments consistently maintain partial contact with the seabed. It is evident that longer spanning lengths result in greater overall lateral displacement of the cable. This is because, with a constant spanning height, the spanning length determines the length of the free-hanging segment. This length directly influences the interaction between the cable and the seabed, thereby affecting the cable’s global response under anchor dragging.
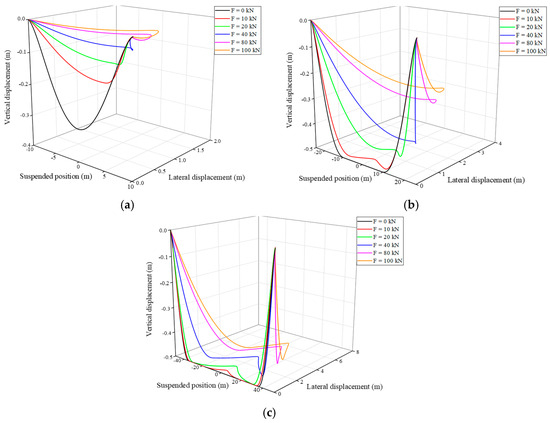
Figure 18.
Spatial configuration of submarine cables with different spanning lengths ( = 0.5 m). (a) = 20 m. (b) = 50 m. (c) = 100 m.
Figure 19 shows the variation in axial force and bending moment at the midpoint of the suspended segments with different spanning lengths under varying dragging forces. Figure 19a illustrates that at a lower dragging force, the axial force at the midpoint initially increases and then decreases with increasing spanning length. When the spanning length is shorter, the cable is fully suspended. Therefore, as the spanning length increases, the gravitational force acting on the suspended segments increases, leading to an increase in axial force. As the spanning length further increases, the cable transitions to partially touching the seabed. A longer spanning length results in increased contact between the cable and the seabed, thereby increasing the support reaction and frictional resistance from the seabed, which reduces the axial force. However, under a higher dragging force, the cable is fully suspended, and as the spanning length increases, the axial force also increases due to the combined effect of gravity and dragging force. As shown in Figure 19b, the bending moment at the midpoint of the cable decreases gradually with increasing spanning length. This is because, with a constant dragging force, a longer spanning length results in a longer free-hanging segment, causing the bending deformation at the midpoint of the cable to be smoother, thereby reducing the bending moment.
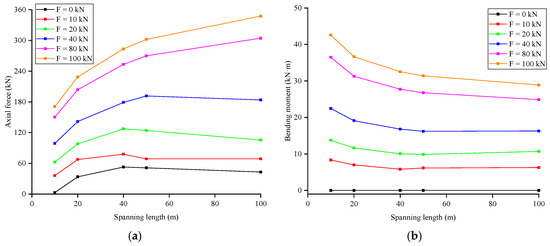
Figure 19.
Variation in axial force and bending moment at the midpoint of the suspended segments with spanning length ( = 0.5 m). (a) Axial force. (b) Bending moment.
5. Conclusions
This study focuses on the overall deformation and mechanical response of exposed and suspended submarine cables under anchor dragging. Firstly, theoretical methods are employed to calculate the tensile and bending stiffnesses of submarine cables. Then, a full-scale finite element model of the submarine cable is established to obtain numerical results for the stiffness of the cable. The accuracy of the stiffness data is validated by comparing theoretical and numerical results. Subsequently, the cross-section of the submarine cable with composite materials is simplified as a uniform cross-section with equivalent tensile and bending stiffnesses. The submarine cable is modeled using beam elements, and equivalent models are established for large-scale exposed and suspended submarine cables under anchor dragging. Finally, we carry out an extensive parametric analysis to study the influencing mechanisms on the response of the cable by anchor dragging.
From our detailed analyses, the following main conclusions are drawn:
(i) When submarine cables are subjected to a dragging force, axial forces distribute uniformly along the exposed segment, while bending moments concentrate at the midpoint and ends of the exposed segment. Therefore, during anchor-dragging conditions, special attention should be paid to the deformation and damage of the cable at the anchor-hooking area and the ends of the exposed segment.
(ii) Increasing the exposed length of the cable results in higher overall axial forces, while the bending moments at the midpoint and ends of the exposed segment reduce with increasing exposed length. Thus, the effect of exposed segment length on the cable stress and deformation should be considered comprehensively.
(iii) With a lower dragging force, increasing the spanning height of the suspended cables leads to corresponding increases in axial forces of the cable for a relatively small spanning height, but the axial force is barely affected by the spanning height for a relatively large spanning height. Under higher anchor-dragging loads, the influence of the spanning height on cable axial forces is less significant, and its effect on bending moments is negligible.
(iv) Under a lower dragging force, the impact of the spanning length for suspended cables on cable axial forces and bending moments is not significant. However, under a higher dragging force, increasing the spanning length of the suspended cables significantly increases cable axial forces and decreases bending moments.
There are certain limitations in this study. In order to simplify the model for anchor dragging, the seabed soil is modeled as rigid. We did not consider the potential soil behavior under the condition of the anchor-dragged cable. Therefore, future research can incorporate the soil response, which would contribute to the development of a more universally applicable framework.
Author Contributions
Conceptualization, Z.W. and H.L.; methodology, H.L.; software, Z.C.; validation, Z.C. and X.H.; data curation, D.J.; writing—original draft preparation, X.H.; writing—review and editing, Z.W. and Z.G.; funding acquisition, Z.G. All authors have read and agreed to the published version of the manuscript.
Funding
The authors would like to acknowledge the support from the China Southern Power Grid, Science and Technology Project (CGYKJXM20220141), the Zhejiang Province Natural Science Foundation (LR22E080005) and National Natural Science Foundation of China (52238008).
Institutional Review Board Statement
Not applicable.
Informed Consent Statement
Not applicable.
Data Availability Statement
The data presented in this study are available on request from the corresponding author due to privacy.
Conflicts of Interest
Author X.H., D.J. and Z.C. was employed by the company (EHV Transmission Company of China Southern Power Grid Co., Ltd.). The remaining authors declare that the research was conducted in the absence of any commercial or financial relationships that could be construed as a potential conflict of interest.
Nomenclature
| Cross-sectional area of the i-th wire | |
| Elastic modulus of the i-th wire | |
| Helical winding radius of the i-th wire | |
| Helix angle of the i-th wire | |
| Total number of wires | |
| Equivalent Poisson’s ratio parameter | |
| Radius of the circular ring components | |
| Elastic modulus of the circular ring components | |
| Cross-sectional area of the circular ring components | |
| Moment of inertia of the ring component | |
| Moment of inertia of the i-th wire in the normal direction | |
| Moment of inertia of the i-th wire in the bi-normal direction | |
| Tensile stiffness | |
| Stick stiffness | |
| Slip stiffness | |
| Submerged weight of the cable | |
| Total length of the model of the cable | |
| Exposed length | |
| Spanning length | |
| Spanning height | |
| Dragging force |
References
- Taormina, B.; Bald, J.; Want, A.; Thouzeau, G.; Lejart, M.; Desroy, N.; Carlier, A. A review of potential impacts of submarine power cables on the marine environment: Knowledge gaps, recommendations and future directions. Renew. Sustain. Energy Rev. 2018, 96, 380–391. [Google Scholar] [CrossRef]
- Purvins, A.; Sereno, L.; Ardelean, M.; Covrig, C.-F.; Efthimiadis, T.; Minnebo, P. Submarine power cable between Europe and North America: A techno-economic analysis. J. Clean. Prod. 2018, 186, 131–145. [Google Scholar] [CrossRef]
- Eleftherakis, D.; Vicen-Bueno, R. Sensors to Increase the Security of Underwater Communication Cables: A Review of Underwater Monitoring Sensors. Sensors 2020, 20, 737. [Google Scholar] [CrossRef] [PubMed]
- Ehlers, S.; Biglu, M.; von Bock und Polach, F.; Thießen, W. Experimental and numerical investigations of the ultimate strength of two subsea power-transmission cables. Mar. Struct. 2023, 88, 103346. [Google Scholar] [CrossRef]
- Yoon, H.-S.; Na, W.-B. Safety assessment of submarine power cable protectors by anchor dragging field tests. Ocean Eng. 2013, 65, 1–9. [Google Scholar] [CrossRef]
- Gulski, E.; Anders, G.J.; Jongen, R.A.; Parciak, J.; Siemiński, J.; Piesowicz, E.; Paszkiewicz, S.; Irska, I. Discussion of electrical and thermal aspects of offshore wind farms’ power cables reliability. Renew. Sustain. Energy Rev. 2021, 151, 111580. [Google Scholar] [CrossRef]
- Cao, Z.; Liang, X.; Deng, Y.; Wang, C.; Wang, L.; Zhu, R.; Zeng, J. Influence of multi-layered sediment characteristics on the thermal performance of buried submarine high-voltage cables. Ocean Eng. 2021, 242, 110030. [Google Scholar] [CrossRef]
- Zhu, J.; Ren, B.; Dong, P.; Chen, W. Vortex-induced vibrations of a free spanning submarine power cable. Ocean Eng. 2023, 272, 113792. [Google Scholar] [CrossRef]
- Chang, H.-C.; Chen, B.-F. Mechanical behavior of submarine cable under coupled tension, torsion and compressive loads. Ocean Eng. 2019, 189, 106272. [Google Scholar] [CrossRef]
- Fang, P.; Jiang, X.; Hopman, H.; Bai, Y. Mechanical responses of submarine power cables subject to axisymmetric loadings. Ocean Eng. 2021, 239, 109847. [Google Scholar] [CrossRef]
- Ménard, F.; Cartraud, P. A computationally efficient finite element model for the analysis of the non-linear bending behaviour of a dynamic submarine power cable. Mar. Struct. 2023, 91, 103465. [Google Scholar] [CrossRef]
- Okpokparoro, S.; Sriramula, S. Reliability analysis of floating wind turbine dynamic cables under realistic environmental loads. Ocean Eng. 2023, 278, 114594. [Google Scholar] [CrossRef]
- Guo, Z.; Zhao, X.; Ma, Q.; Li, J.; Wu, Z. Simulation Study on Methods for Reducing Dynamic Cable Curvature in Floating Wind Power Platforms. J. Mar. Sci. Eng. 2024, 12, 334. [Google Scholar] [CrossRef]
- Reda, A.; Thiedeman, J.; Elgazzar, M.A.; Shahin, M.A.; Sultan, I.A.; McKee, K.K. Design of subsea cables/umbilicals for in-service abrasion—Part 1: Case studies. Ocean Eng. 2021, 234, 108895. [Google Scholar] [CrossRef]
- Gao, Q.; Duan, M.; Xiaoxia, L.; Wang, Y.; Jia, X.; An, C.; Zhang, T. Damage assessment for submarine photoelectric composite cable under anchor impact. Appl. Ocean Res. 2018, 73, 42–58. [Google Scholar] [CrossRef]
- Zhang, T.; Li, L.; Du, A.; Wei, R.; Tan, H.; Wang, K.; Liu, S. Research on anchor damage and protection of three-core composite submarine cable considering impact angle. Ocean Eng. 2022, 265, 112668. [Google Scholar] [CrossRef]
- Zhang, T.; Du, A.; Li, L.; Wei, R.; Tan, H.; Wang, K.; Abu-Siada, A.; Li, Z. Analysis of Three-Core Composite Submarine Cable Damage Due to Ship Anchor. IEEE Access 2022, 10, 93910–93920. [Google Scholar] [CrossRef]
- Ou, X.; Xu, W.; Zang, Y.; Wang, H.; Wu, H.; Lv, A.; Zhou, Z. Mechanical analysis of 500 kV oil-filled submarine power cable in anchor and blade damage based on Finite element method. In Proceedings of the 2022 IEEE 6th Advanced Information Technology, Electronic and Automation Control Conference (IAEAC), Beijing, China, 3–5 October 2022; pp. 1068–1072. [Google Scholar]
- Wang, Y.; Fu, C.; Qin, X. Numerical and physical modeling of submarine telecommunication cables subjected to abrupt lateral seabed movements. Mar. Georesour. Geotechnol. 2021, 39, 1307–1319. [Google Scholar] [CrossRef]
- Moore, E.; Haigh, S.K.; Eichhorn, G.N. Anchor penetration depth in sandy soils and its implications for cable burial. Ocean Eng. 2021, 235, 109411. [Google Scholar] [CrossRef]
- Dao, D.A.; Alkateeb, D.; Schröder, M. Discrepancies between element tests and large-scale LDFE simulations: A case study on anchor kinematics during installation in clay. Comput. Geotech. 2023, 163, 105698. [Google Scholar] [CrossRef]
- Osthoff, D.; Heins, E.; Grabe, J. Impact on submarine cables due to ship anchor—Soil interaction. Geotechnik 2017, 40, 265–270. [Google Scholar] [CrossRef]
- Dao, D.A.; Grabe, J. Numerical Investigation of Ship Anchor Penetration in Cohesive Baltic Sea Soil. In Proceedings of the ASME 2022 41st International Conference on Ocean, Offshore and Arctic Engineering, Hamburg, Germany, 5–10 June 2022. [Google Scholar]
- Li, X.; Liu, Z.; Jiang, X.; Hopman, H. RVE model development for bending analysis of three-core submarine power cables with dashpot-enhanced periodic boundary conditions. Ocean Eng. 2024, 309, 118588. [Google Scholar] [CrossRef]
- Knapp, R.H. Derivation of a new stiffness matrix for helically armoured cables considering tension and torsion. Int. J. Numer. Methods Eng. 1979, 14, 515–529. [Google Scholar] [CrossRef]
- Witz, J.A.; Tan, Z. On the flexural structural behaviour of flexible pipes, umbilicals and marine cables. Mar. Struct. 1992, 5, 229–249. [Google Scholar] [CrossRef]
- Nassiraei, H. Local joint flexibility of CHS T/Y-connections strengthened with collar plate under in-plane bending load: Parametric study of geometrical effects and design formulation. Ocean Eng. 2020, 202, 107054. [Google Scholar] [CrossRef]
- Qin, X.; Zhang, M.; Fu, S.; Li, H.; Hou, J.; Xu, Y. Review on researches and main influencing factors on mechanical properties of offshore wind power cables. J. Ocean Eng. Sci. [CrossRef]
- Lu, H.; Caire, M.; Vaz, M. A finite element model for unbonded flexible pipe under combined axisymmetric and bending loads. Mar. Struct. 2020, 74, 102826. [Google Scholar] [CrossRef]
- Veritas, N. Pipe-Soil Interaction for Submarine Pipelines; Det Norske Veritas: Bærum, Norway, 2021. [Google Scholar]
Disclaimer/Publisher’s Note: The statements, opinions and data contained in all publications are solely those of the individual author(s) and contributor(s) and not of MDPI and/or the editor(s). MDPI and/or the editor(s) disclaim responsibility for any injury to people or property resulting from any ideas, methods, instructions or products referred to in the content. |
© 2024 by the authors. Licensee MDPI, Basel, Switzerland. This article is an open access article distributed under the terms and conditions of the Creative Commons Attribution (CC BY) license (https://creativecommons.org/licenses/by/4.0/).