Article

Experimental Study of Wave-Induced Pore Pressure Gradients around a Sandbar and Their Effects on Seabed Instability

1
Key Laboratory of Ministry of Education for Coastal Disaster and Protection, Hohai University, Nanjing 210024, China
2
China International Water & Electric Corporation, Beijing 101100, China
3
College of Harbor, Coastal and Offshore Engineering, Hohai University, Nanjing 210024, China
*
Authors to whom correspondence should be addressed.
J. Mar. Sci. Eng. 2024, 12(9), 1630; https://doi.org/10.3390/jmse12091630
Submission received: 19 August 2024 / Revised: 5 September 2024 / Accepted: 10 September 2024 / Published: 12 September 2024
(This article belongs to the Section Coastal Engineering)

Abstract

:
The position and morphology of offshore sandbars are highly dependent on wave conditions; however, the mechanisms driving sand movement by water waves remain elusive to scientists and coastal engineers. This study presents a series of experiments conducted in a wave flume to investigate the impact of wave-induced pore pressure gradients on seabed instability around a sandbar, observed in the Benin Gulf of Guinea. The Froude-Darcy similitude principle was developed to ensure the similarity of hydrodynamics and seepage forces between the experiments and field conditions. Pore pressure gradients and free surface elevations were measured using three arrays of pore pressure transducers and eleven wave probes, respectively. The results indicate a rapid increase in both the horizontal pressure gradient and the maximum downward pressure gradient during the shoaling process. Conversely, the maximum upward pressure gradient decreases prior to wave breaking. Wave-induced pressure gradients significantly influence seabed instability and sediment transport. The effective weight of sand particles is reduced by up to 52% due to the upward pressure gradient during the shoaling process, and momentary liquefaction is triggered by the horizontal pressure gradient near the breaking point based on the liquefaction criterion. When liquefaction occurs, shear granular flow forms on the seabed surface.

1. Introduction

Sandbars within the surf zone are prominent and dynamic features of beach profiles, playing a crucial role in wave dissipation and significantly influencing other nearshore processes [1,2]. Field observations have shown that during storm events, large waves and currents cause sandbars to migrate offshore on timescales comparable to those of the storms [3], highlighting the close connection between sandbar morphology and surf zone hydrodynamics. Understanding sandbar dynamics under the influence of water waves is vital for coastal protection, environmental management, and human activities [4].
To accurately predict coastal morphological changes around sandbars, it is essential to comprehend the mechanisms by which sand is transported by water waves [5]. Traditionally, it has been assumed that sediment particles on a bed surface begin to move when the shear stress induced by steady flows exceeds the resisting force due to the immersed weight of the sand particles. This mechanism was first proposed by Shields [6], and the Shields number, defined as the ratio of shear stress to the immersed weight of sand particles, has been widely used to characterize sediment transport states [7]. Experimental results have shown that sediment incipience, typically in the form of the rolling or sliding of particles on the bed surface, occurs when the Shields number falls within the range of 0.03 to 0.1 [8,9,10]. Therefore, some empirical sediment mobilization models (e.g., the Meyer–Peter and Müller model) have been proposed for bed-load transport over horizontal bottoms or slopes [11]. This criterion has been applied in numerous numerical models [12,13], with Soulsby [14] confirming its relevance to sediment motion under wave conditions. This perspective suggests that the sediment incipience mechanism for steady flows is valid under oscillatory wave flows. However, U-tube experiments indicate that horizontal pressure gradients can also mobilize sediment particles, a phenomenon not observed in steady flows [15,16], suggesting that pressure gradients are crucial in sediment incipience.
Wave-induced pressure gradients can generate seepage forces within the seabed, influencing its stability. Madsen [17] was the first to propose that horizontal pressure gradients induced by waves are critical in causing seabed failure, particularly under the steep front slope of a near-breaking wave. When bed failure occurs, the sandy seabed loses internal cohesion and behaves like a liquid. Packwood and Peregrine [18] confirmed that momentary liquefaction can occur in highly localized areas under the bore face when the ratio of bore height to water depth exceeds 1.0. The Sleath number, which compares the horizontal pressure gradient to the submerged unit weight of the soil skeleton, has been introduced to evaluate the potential for bed failure [19]. Zala Flores and Sleath [16] found that plug flow can occur in U-tubes when the Sleath number exceeds critical values of 0.92 for acrylic granules and 0.29 for sand. Field evidence of plug flow around sandbars, generated by water waves, has also been documented [20], although critical Sleath numbers for plug flow initiation in the field are notably lower than those observed in U-tube experiments.
In addition to horizontal pressure gradients, wave-induced vertical pressure gradients significantly impact sediment incipience and seabed stability [21,22]. According to Liu et al. [23], soil liquefaction within the seabed occurs when the wave-induced vertical upward pressure gradient exceeds the submerged unit weight of the soil skeleton. Laboratory experiments have demonstrated that both horizontal and vertical pressure gradients influence the initiation of onshore sediment movement beneath steep, near-breaking waves around sandbars [24,25]. Moreover, Islam et al. [26] suggested a strong dynamic correlation between the maximum phase-averaged vertical pressure gradient and sediment concentration, which significantly affects erosion predictions for surf zone sandbars.
Although recent studies have focused on the effects of wave-induced pore pressure gradients on sediment transport and sandbar morphology, there have been relatively few relevant experimental investigations. Previous experiments have not adequately addressed the similarity principle, particularly neglecting the critical similarity of seepage forces. Moreover, existing studies have primarily focused on shallow seabeds [24,26], despite earlier research indicating a strong dependence of wave-induced pressure gradients on seabed thickness [27,28]. Additionally, previous experiments have only examined wave-induced pressure gradients at the sandbar crest, overlooking gradients during the wave shoaling process. To address these gaps, this study conducted a series of experiments to explore wave-induced pore pressure gradients around a sandbar, ensuring similarity in hydrodynamics and seepage forces. The impact of these gradients on seabed instability was analyzed based on the experimental results.
The rest of this paper is organized as follows: Section 2 details the experimental setups, soil parameters, and test conditions. Section 3 presents and discusses the measured wave profiles, wave-induced pore pressure gradients, and seabed liquefaction around the sandbar. Finally, concluding remarks are provided in Section 4.

2. Experiments

In the experiments, an artificial sandbar was geometrically down-scaled from field observations at Grand Popo Beach in Benin, Gulf of Guinea, in 2013. The beach profile, displayed in Figure 1, is representative of the morphology of the Benin Bight coast [29]. This coast is an open, wave-dominated, and microtidal environment exposed to long-period swells generated at high latitudes in the South Atlantic. The field measurements indicated that the peak wave period ranges between 8 s and 16 s, with significant wave heights between 0.75 m and 1.60 m under normal conditions. Under extreme wave conditions, the period and height of the incident waves reach up to 21 s and 3 m, respectively. The seabed mainly consists of medium and coarse sand particles, with a grain size ranging from 0.3 mm to 1.0 mm. The mean grain size (d50) of the particles is about 0.45~0.6 mm. As can be seen from Figure 1, there is a sandbar located between x = 100 m and 125 m. The water depth over the sandbar crest is 0.8 m. The sand beach is relatively mild on the offshore side of the sandbar, with a mean slope smaller than 0.03. The experimental setups, soil parameters, and test conditions are as follows.

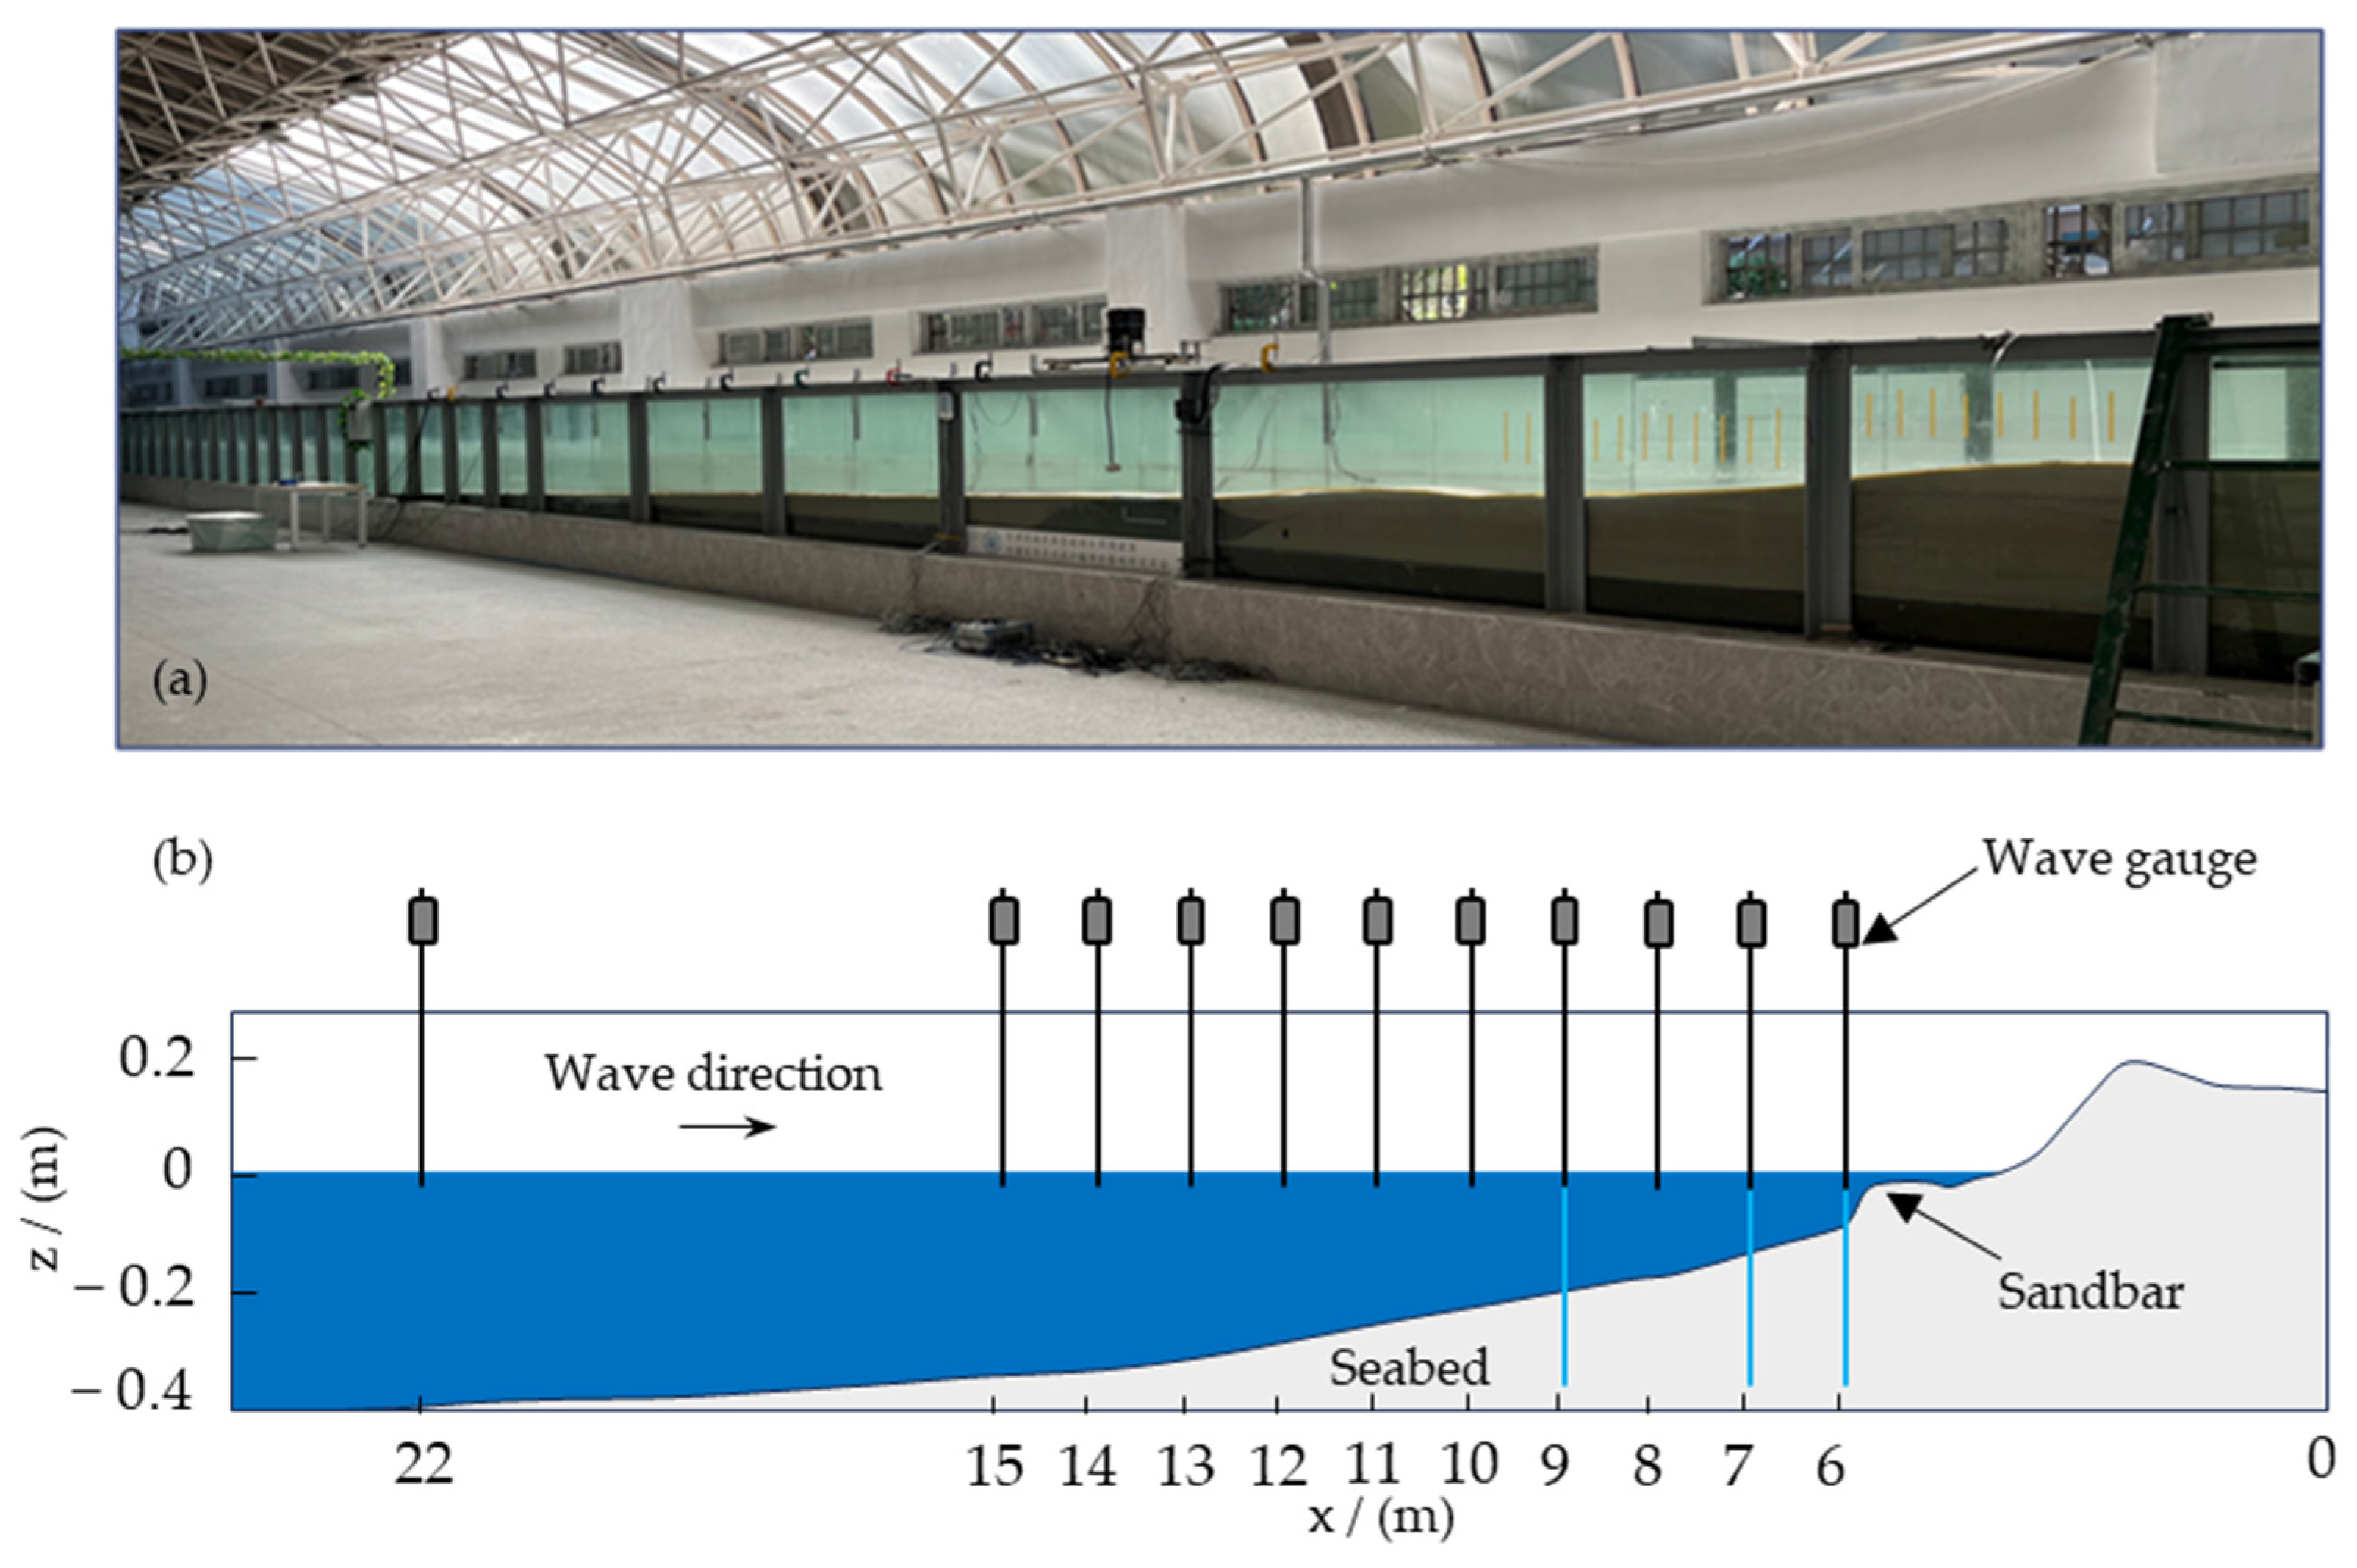
2.1. Experimental Setups

The experiments were conducted in a 70 m long, 1.0 m wide, and 1.5 m high wave flume at the sediment laboratory in Hohai University, China, as shown in Figure 2a. A piston-type wavemaker was installed upstream and operated through an electrohydraulic servo actuator, by which regular waves with a wave period of 0.5~5.0 s and wave height of 0.02~0.40 m can be generated. The artificial sandbar profile was located downstream. To ensure the similitude of the hydrodynamics and the seepage forces between the model and the natural environment, the Froude number (Fr) and Darcy number (Da) in the experiments are consistent with that in the field, and these two dimensionless parameters are given by [30,31]:
F r = A ω g h ,   and   D a = ρ k s ω μ ,
respectively, where A is the wave amplitude, ω is the wave frequency, g is the gravity acceleration, h is the water depth at the wavemaker, ρ is the water density, μ is the dynamic viscosity of water, and ks is the permeability of the soil. In the laboratory, the cross-shore profile of the sandbar was down-scaled at a ratio of 1:25, and according to the Froude similitude between the prototype and the model, the time scale was 1:5.
During the experiments, the free surface elevation over the beach was captured by 11 capacitance-type wave probes, each positioned at 1 m intervals. Additionally, three miniature pore pressure transducer arrays (PPTAs) were used to measure wave-induced pore pressure gradients at a depth of 0.5 cm below the water-seabed interface. Each PPTA consisted of four pore pressure transducers (PPT), with a diameter of 6 mm and covered by an argil filter. The horizontal row contained two transducers (p1 and p2), and the vertical column added two transducers (p3 and p4) (see Figure 3). The wave probes and PPTs had an accuracy of 0.5%, and the arrangement of the measuring instruments is shown in Figure 2b.

2.2. Soil Parameters

As suggested by Bear [32], the soil permeability is related to the soil porosity n and mean grain size of the sand particles d50 as
k s = n 3 d 50 2 180 ( 1 n ) 2 .
Therefore, the scale of the mean grain size of the soil particles is 1: 5 based on the Darcy similitude between the prototype and the model. In the experiments, the soil is the commercially available silica flour (mainly the mineral composition of silica and alumina), which is fine sand with a mean grain size of 0.2 mm. The porosity of the soil is 0.38. Since the soil particles are well-sorted, the sand particles are relatively uniform with a geometric standard deviation of particle size, σ = d 84 / d 16 , of 1.41. The physical properties of the soil are summarized in Table 1.

2.3. Test Conditions

In the experiments, the water depth at the wavemaker was set to 0.6 m, the wave height ranged from 4 cm to 12 cm, and the wave period was between 1.6 s and 4.4 s, based on the geometric and time scales. The incident wave conditions are summarized in Table 2. In the table, Ur is the Ursell number, which indicates the nonlinearity of the incident wave and is defined by [33]:
Ur = H h ( L h ) 2 = H L 2 h 3
where L is the wavelength of the incident wave. As can be seen from Table 2, Ur is generally larger than 1 under the long swell conditions. The Reynolds numbers for the wave (Re) and soil particles (Rep) are given by [34]:
Re = ρ A ω L μ ,   and   Re p = ρ A ω d 50 μ
respectively. The wave Reynolds number is estimated to be approximately O(105), while the sand particle Reynolds number varies from O(100) to O(101). Fr falls within the range of 0.0118 to 0.0647, and the Da ranges from O(10−5) to O(10−4).

3. Results and Discussion

In this section, the wave motion, wave-induced pore pressure responses, and seabed liquefaction potential around the sandbar are investigated and discussed.

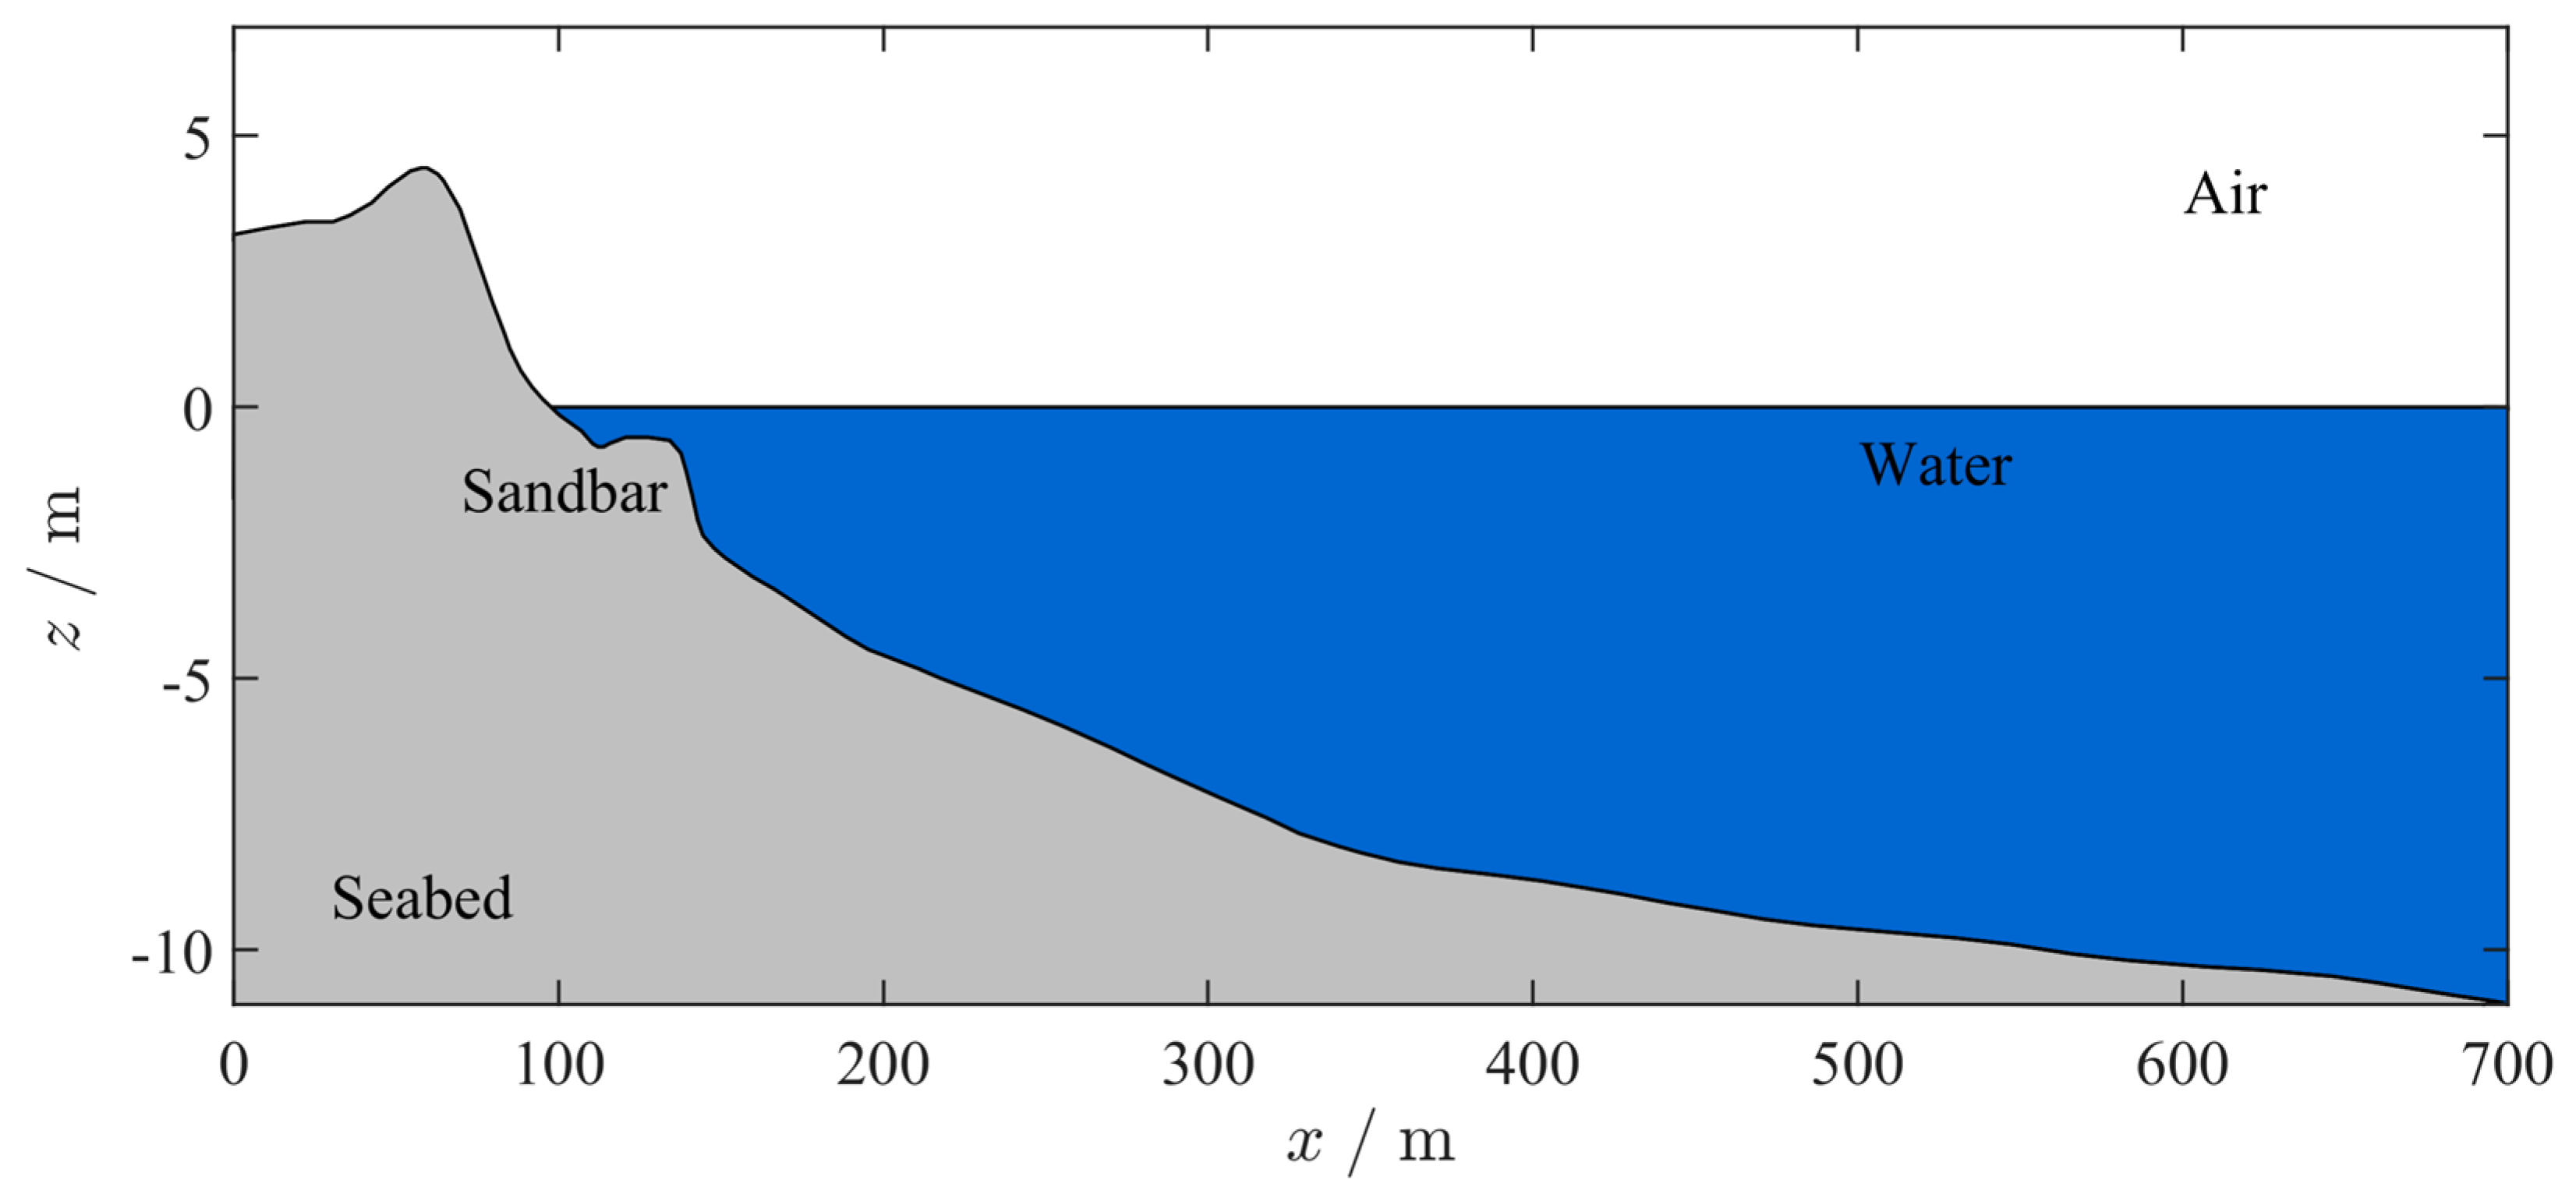
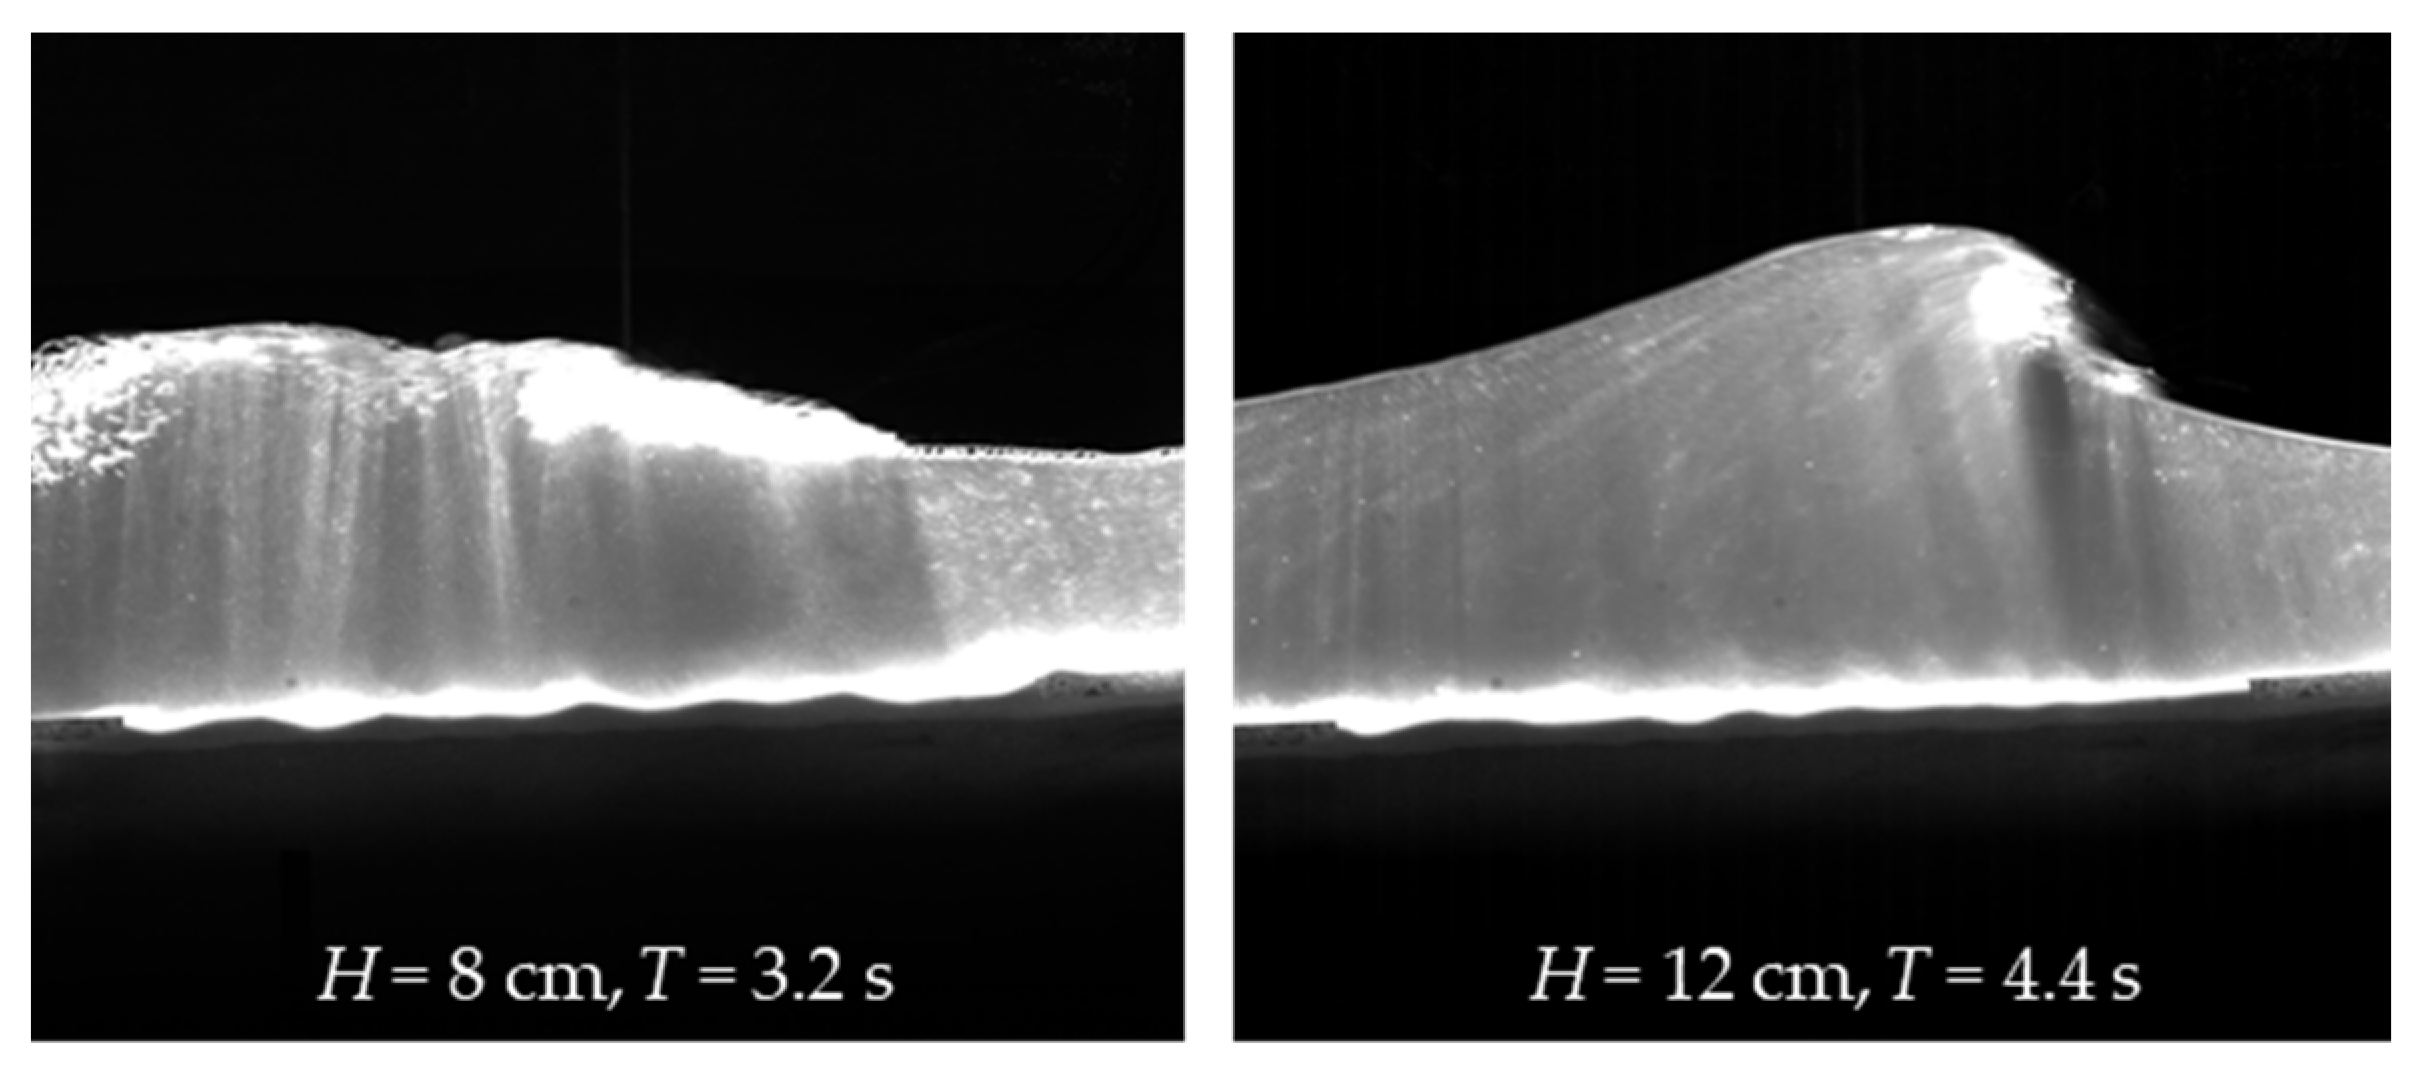
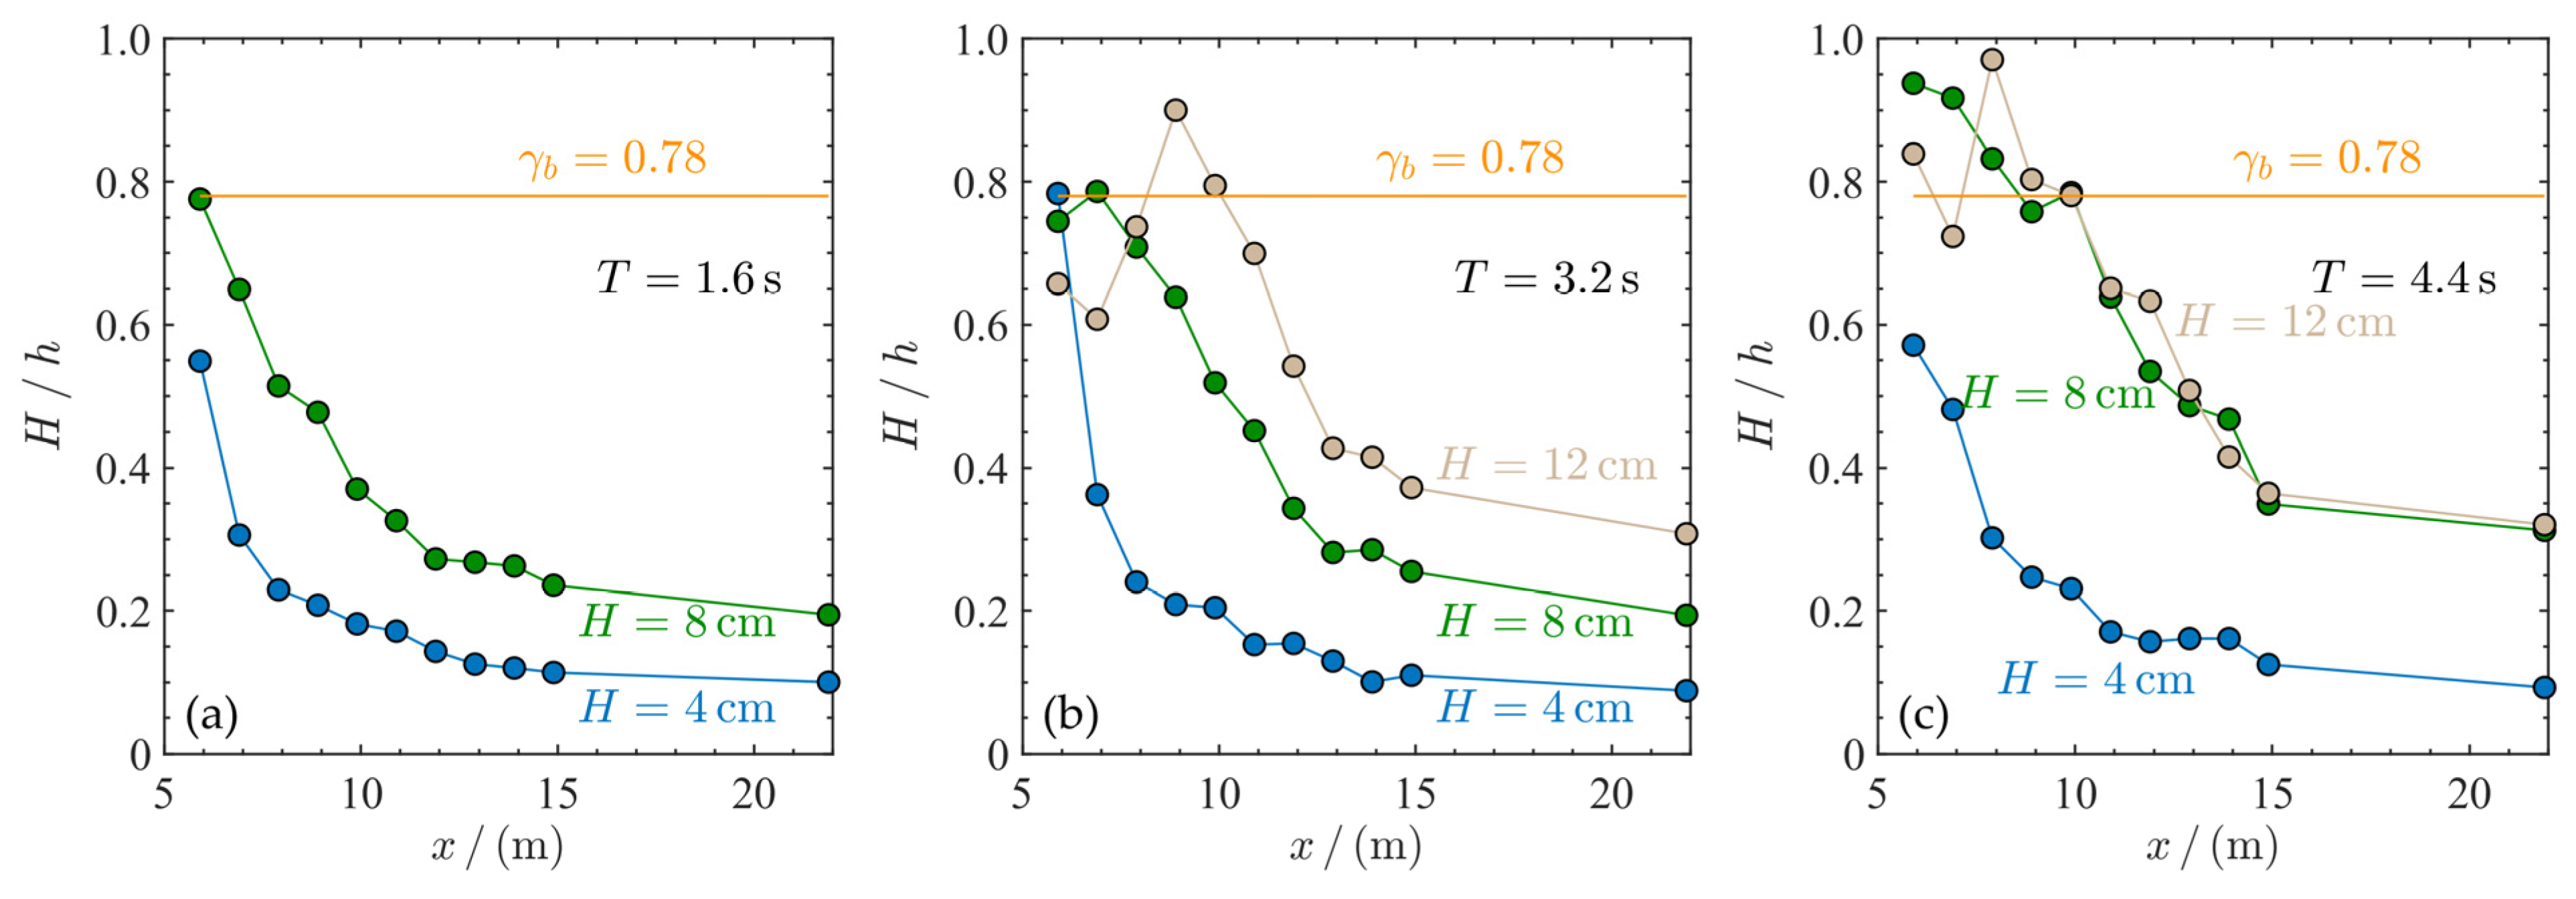
3.1. Wave Motion around the Sandbar

Figure 4 shows the 10 cycle-averaged wave profiles along the wave propagation direction for cases with H = 4 cm and T = 1.6 s, 3.2 s, and 4.4 s, respectively. In the figure, the blue solid lines indicate the average free surface elevations, and the shaded regions represent the standard deviation over 10 wave cycles. As can be seen from the figure, the wave height and asymmetry increase during the shoaling process. Notably, some small peaks appear when the Ur increases from 1.98 to 20.23, because the interaction between the harmonics is more significant in stronger nonlinear waves.
To show the harmonic interaction, the average free surface elevations are expanded into the Fourier series, i.e.,
η ( t ) = A 0 2 + n = 1 A n sin ( 2 n π t T + ϕ n )
where An and ϕn are the amplitude and initial phase angle of the harmonic of mode n, respectively. The variations of the amplitudes of the first four harmonics along the wave propagation direction are displayed in Figure 5. The results demonstrate that the amplitudes of higher-order harmonics increase with the increase of Ur. Meanwhile, the interactions of the harmonics are strong by increasing the wave period. In addition, the amplitudes of the first four harmonics damp rapidly in cases of H = 8 cm and 12 cm (see Figure 5d,e,g,h), when the wave approaches the sandbar. This is because the incident waves break before arriving at the sandbar, as shown in Figure 6. Since the beach is mild, the ratios of the wave height to the water depth are calculated and compared with the critical value of wave breaking, 0.78, in Figure 7. The results suggest that waves tend to break earlier when Ur is larger. For instance, when Ur = 3.96, waves break at x = 5.9 m, when Ur = 20.60, waves break at x = 6.9 m, and when Ur = 40.47, waves break at x = 8.9 m. As the waves break, their energy dissipates rapidly, and the amplitudes of the harmonics dampen quickly.

3.2. Wave-Induced Pore Pressure Responses around the Sandbar

In the experiments, the wave-induced pore pressure gradients are estimated by using the difference method [25,26]. The horizontal and vertical pore pressure gradient components are approximated by
p x = p ( x i + d x ) p ( x i ) d x + 2 p x 2 d x 2 + O ( d x 2 ) ,
p z = p ( z i 2 d z ) 4 p ( z i d z ) + 3 p ( z i ) 2 d z + O ( d z 2 ) ,
where (xi, zi) indicates the coordinates of the location of the PPTA. The second-order error introduced by using (6) is of the order of
2 p x 2 d x 2 1 c 2 2 p t 2 d x 2 ρ g H c 2 T 2 d x 2
where c is the phase velocity of the wave. The relative error is
ε = 2 p x 2 d x 2 / p x 1 c 2 p t 2 d x 2 / p t d x 2 c T O ( 10 3 ) .
The approximation of (7) has a third-order accuracy. Note that the horizontal pressure gradient force of a positive p / x is directed onshore, and the vertical pressure gradient force of a positive p / z is directed downward.
Figure 8 shows the time histories of the dimensionless pore pressure gradients in the horizontal and vertical directions. In the figure, the solid lines represent the average pore pressure gradient components, while the shaded regions indicate the standard deviation over 10 wave cycles. S is the Sleath number, which measures the horizontal pore pressure gradient, and ξ is the dimensionless horizontal pore pressure gradient. Mathematically, S and ξ can be expressed as [24]
S = 1 ( ρ s ρ ) g p x ,   ξ = 1 ( ρ s ρ ) g p z ,
where ρs denotes the density of sand particles. As shown in the figure, it is evident that at a distance of 8.9 m from the origin, the horizontal pore pressure gradient is relatively weak, while the vertical pore pressure gradient is relatively large. It is worth noting that as waves approach the sandbar, the wave height increases, and the wave profile becomes asymmetrical. Consequently, there is an increase in the horizontal pore pressure gradient and a decrease in the upward (negative) pressure gradient. Furthermore, the wave-induced pore pressure gradients increase with higher wave heights.
Figure 9 illustrates the time histories of the dimensionless horizontal and vertical pore pressure gradients, S and ξ, for various wave periods at x = 8.9 m, 6.9 m, and 5.9 m. The findings suggest that as the waves approach shallower waters, the wave-induced pressure gradients diminish with longer wave periods as the diffusion depth of the pore pressure increases [23]. Moreover, the positive pore pressure gradient at x = 5.9 m is significantly larger than that at x = 8.9 m, owing to the waves becoming sharper and steeper near the sandbar.

3.3. Wave-Induced Seabed Liquefaction Potential around the Sandbar

Wave-induced pore pressure gradients play an important role in seabed instability. As suggested by Packwood and Peregrine [18], the limiting condition for the seabed to liquefy is when the vertical net force on the particle falls to zero [35], i.e.,
ξ = 1 ( ρ s ρ ) g p z ( 1 n ) .
Meanwhile, Madsen [17] indicates that the horizontal pressure gradient is instrumental in causing a sandy bed to liquefy in the horizontal direction and suggests that the critical pressure gradient for momentary liquefaction is given by
| S | = | 1 ( ρ s ρ ) g p x | f ( 1 n ) ,
where f denotes the friction coefficient between the soil particles. For sand, f = 0.5 is used for analysis in the present study [24].
The wave-induced maximum pressure gradients are compared with the liquefied thresholds in Figure 10. In the figure, the experimental results are denoted by the symbols, and the thresholds are represented by the horizontal lines. The results show that the upward pressure gradient is relatively large at x = 8.9 m; for example, ξ = −0.324 under the condition of H = 8 cm and T = 1.6 s, which means that the wave-induced vertical pressure gradients can reduce the effective unit weight of the soil by 52%. In the vicinity of the sandbar, the upward pressure gradient is small; however, a large downward pressure gradient can be generated under the wave crest at the wave-breaking point, which prevents the sediment from suspension. Since the dimensionless upward pressure gradient is smaller than the submerged unit weight of the soil in the experiments, momentary liquefaction is unlikely to happen in the vertical direction. In the horizontal direction, the wave-induced horizontal pressure gradient is not strong enough to cause momentary liquefaction under a wave height of 4 cm. However, as the wave height increases to 8 cm, the pressure gradient increases under the wave crest and exceeds the threshold of 0.31 near the sandbar.
In addition, the findings show that wave-induced pore pressure gradients play an important role in sediment transportation. Under a mild wave condition, liquefaction does not happen, and some soil particles are suspended in the water by the viscous stress applied at the water-seabed interface (see Figure 11a). However, under extreme wave conditions (wave heights of 8 cm or 12 cm), liquefaction can be caused by the horizontal pressure gradient near the sandbar under the wave crest, and the liquefied soil particles are prevented from suspending by the downward pressure gradient. As a result, shear granular flow forms on the seabed surface (see Figure 11b).

4. Conclusions

This study conducted a series of controlled experiments in a wave flume to investigate the effects of wave-induced pore pressure gradients on seabed instability around a sandbar, as observed in the Benin Gulf of Guinea. The research introduced the Froude-Darcy similitude principle to ensure that the hydrodynamics and seepage forces observed in the experiments closely resembled those in the field. Key findings from this study are summarized as follows:
(1)
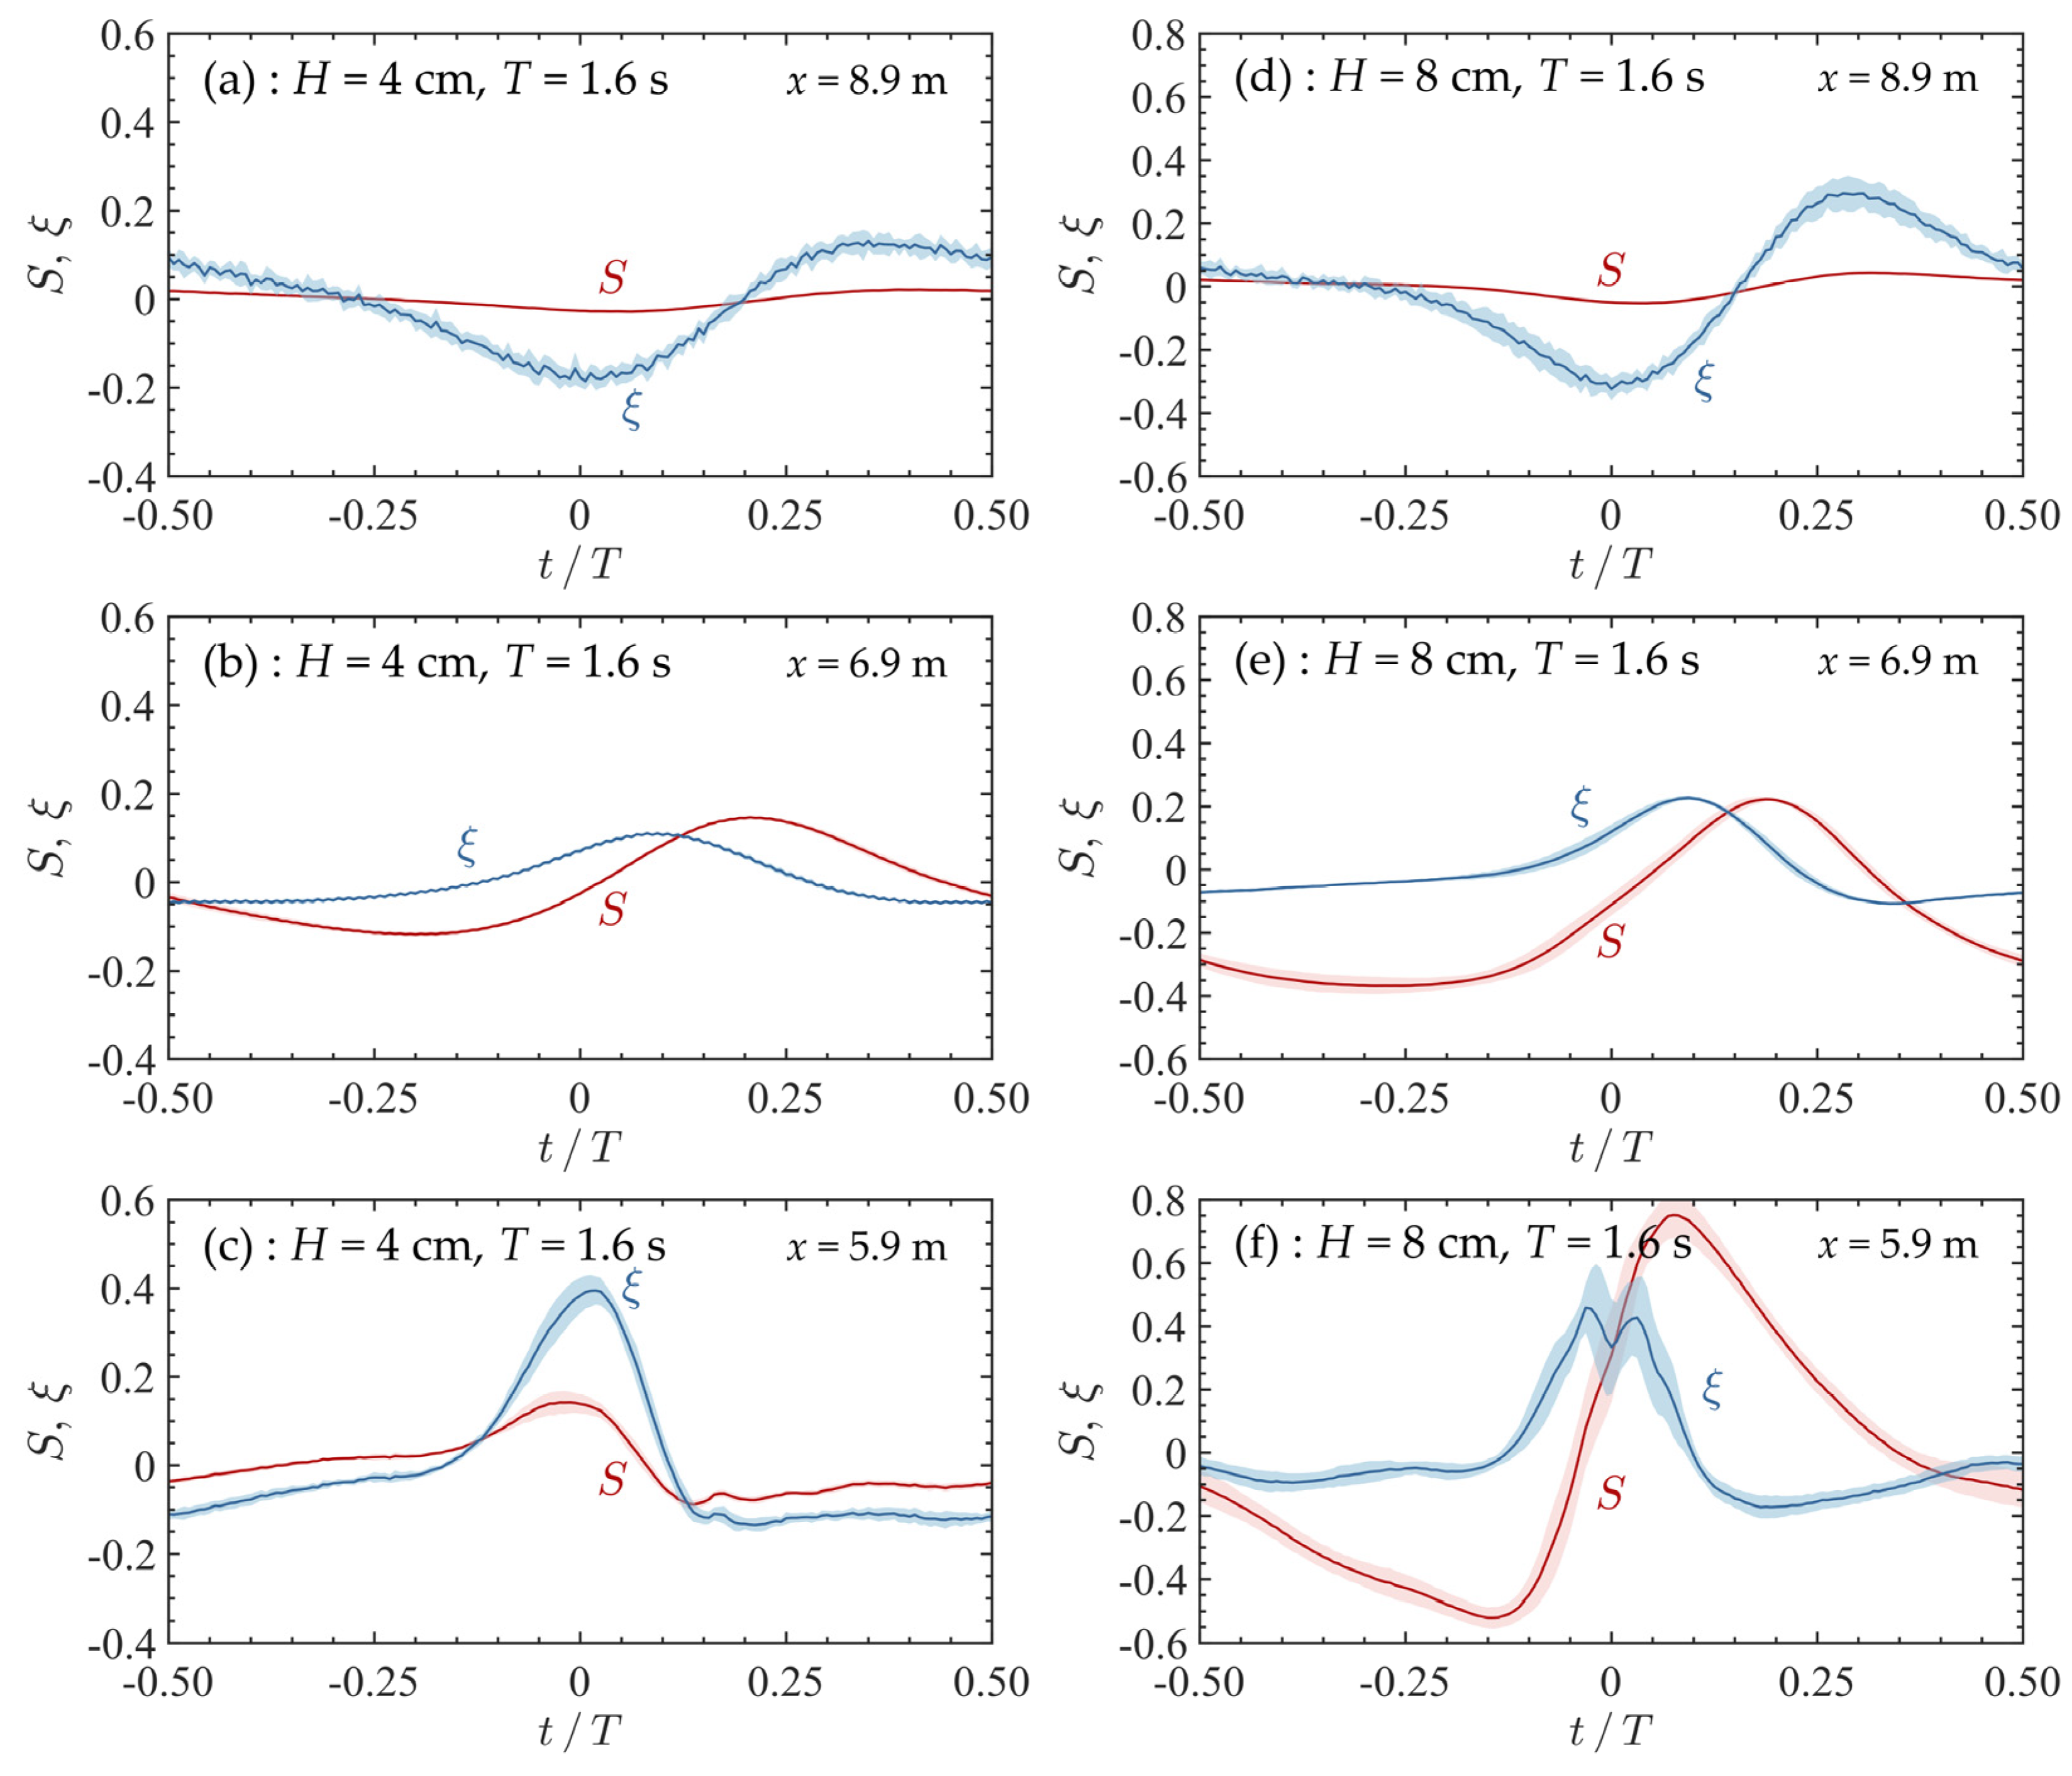
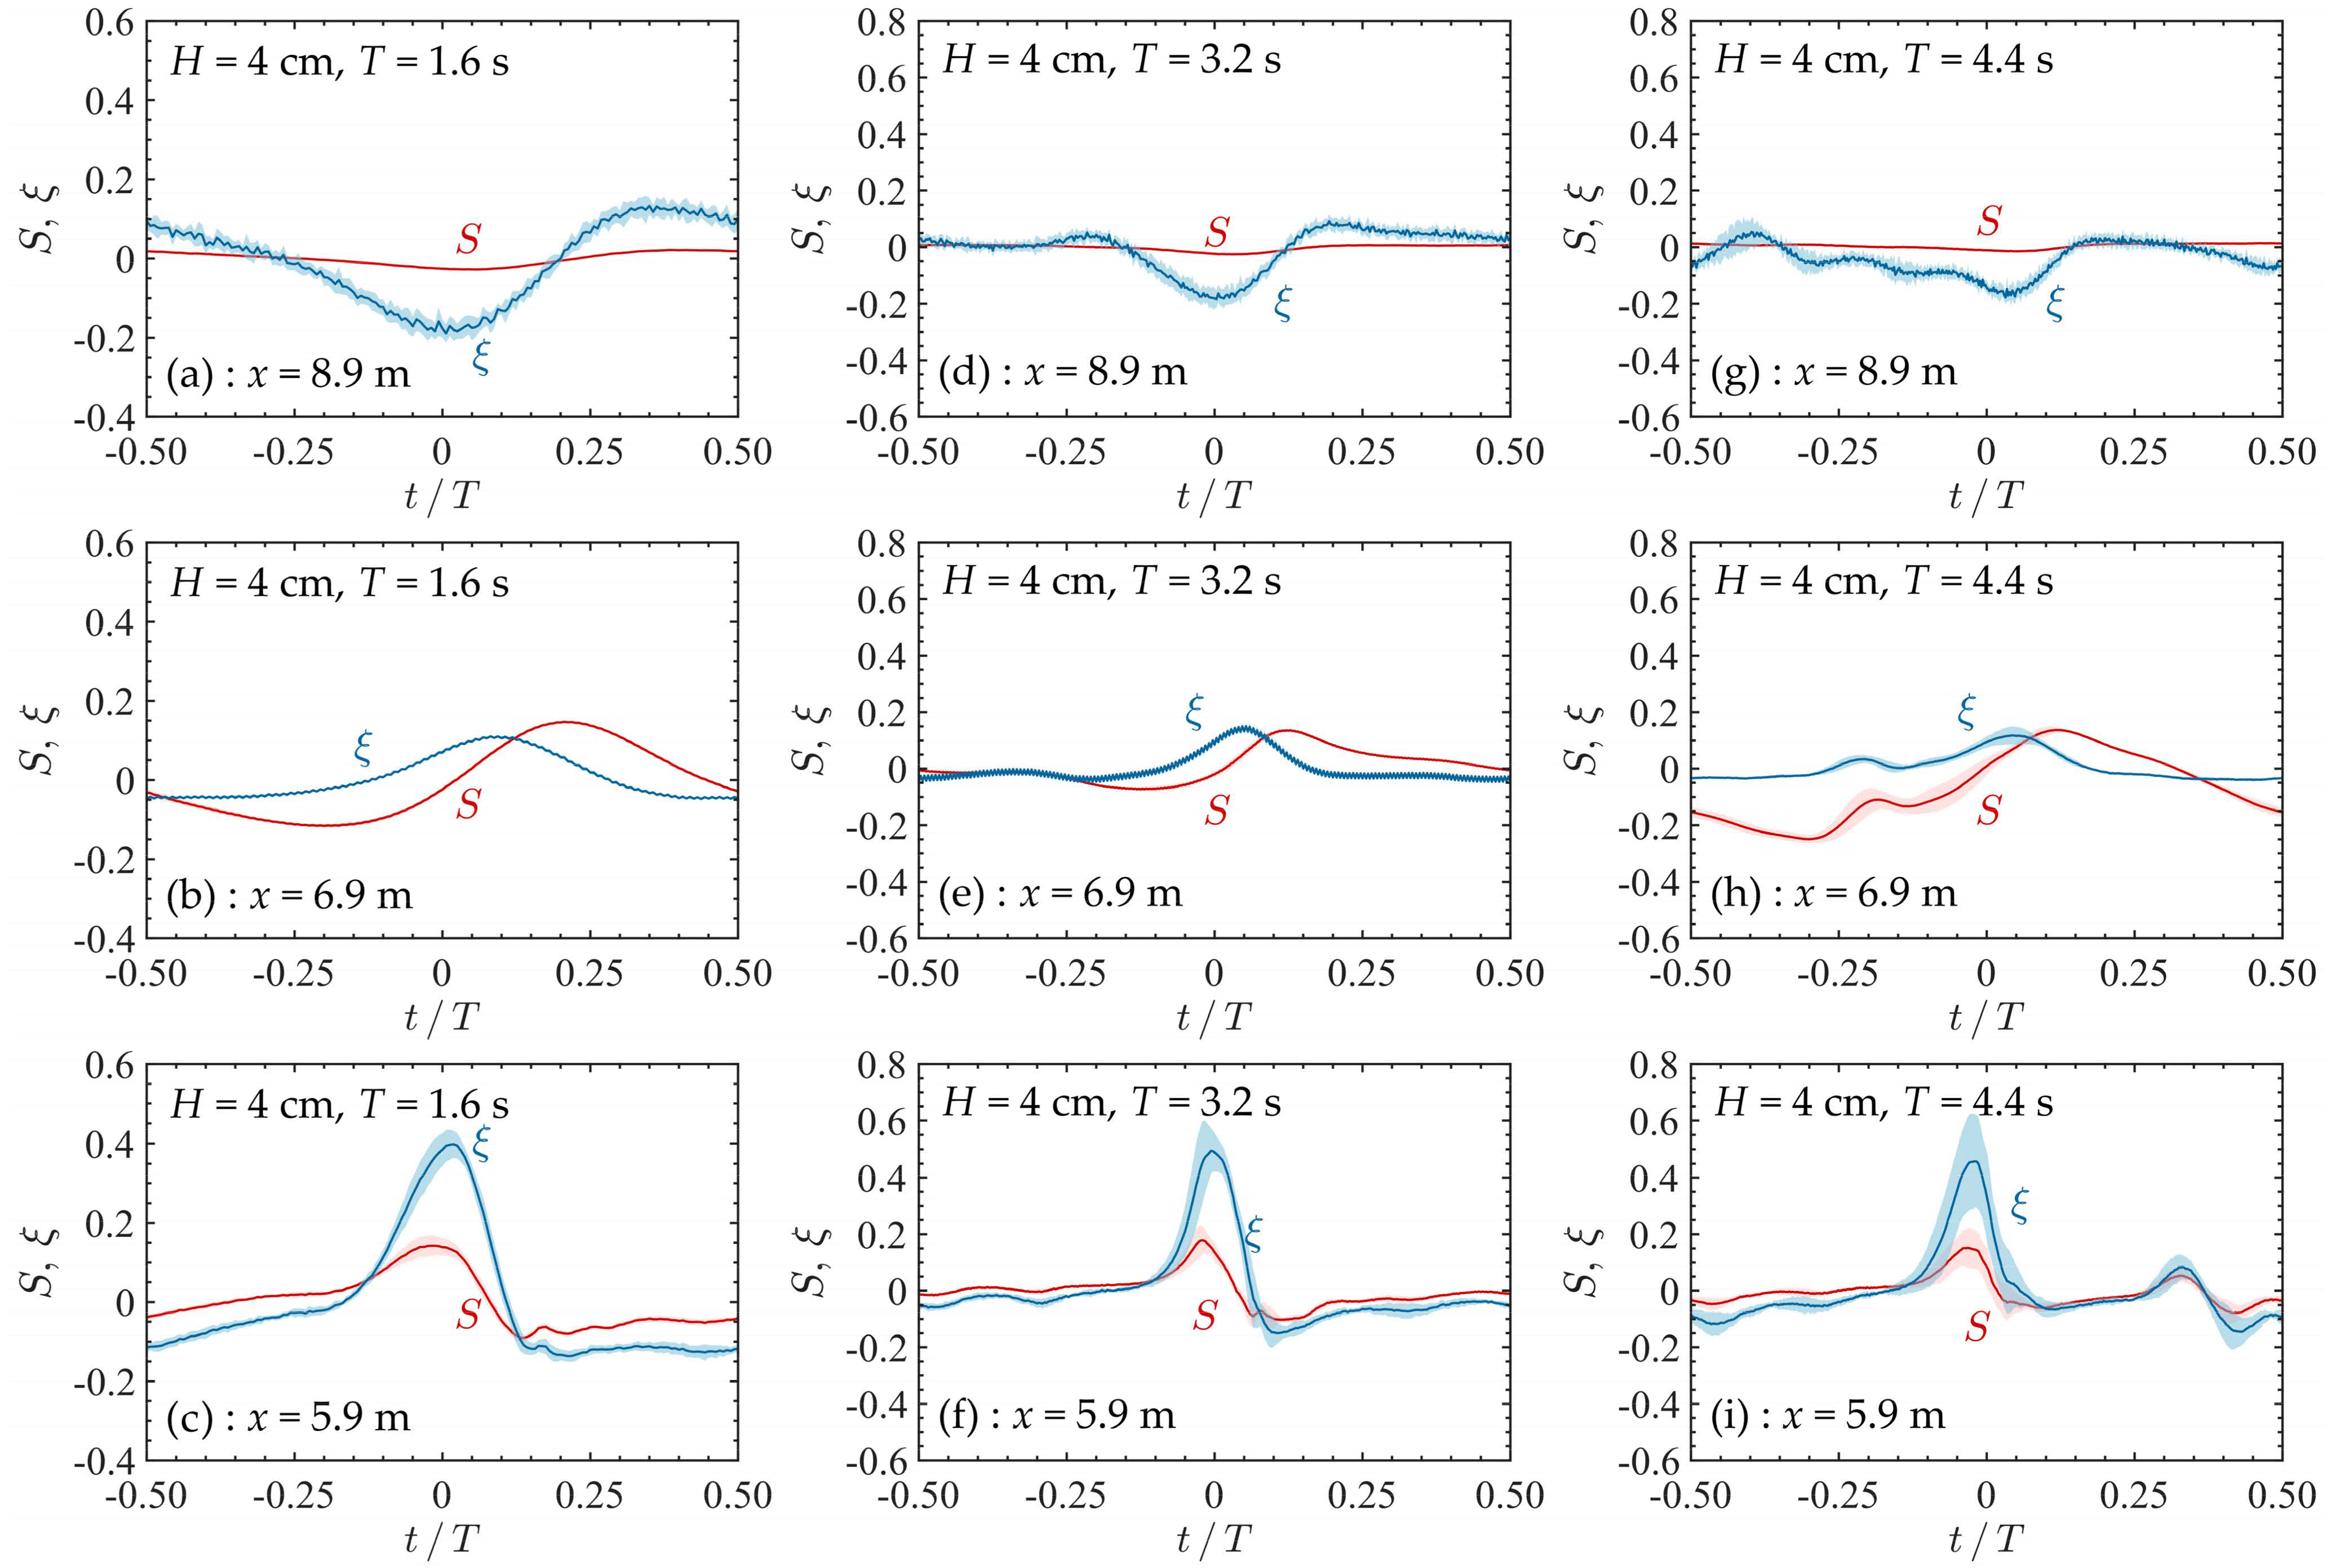
Wave-induced pore pressure gradients during the shoaling process: During the wave shoaling process over the sandbar, the horizontal pore pressure gradient increased, while the upward vertical pore pressure gradient decreased along the direction of wave propagation. This change is attributed to the sharpening and asymmetry of the free surface as the waves approach the sandbar.
(2)
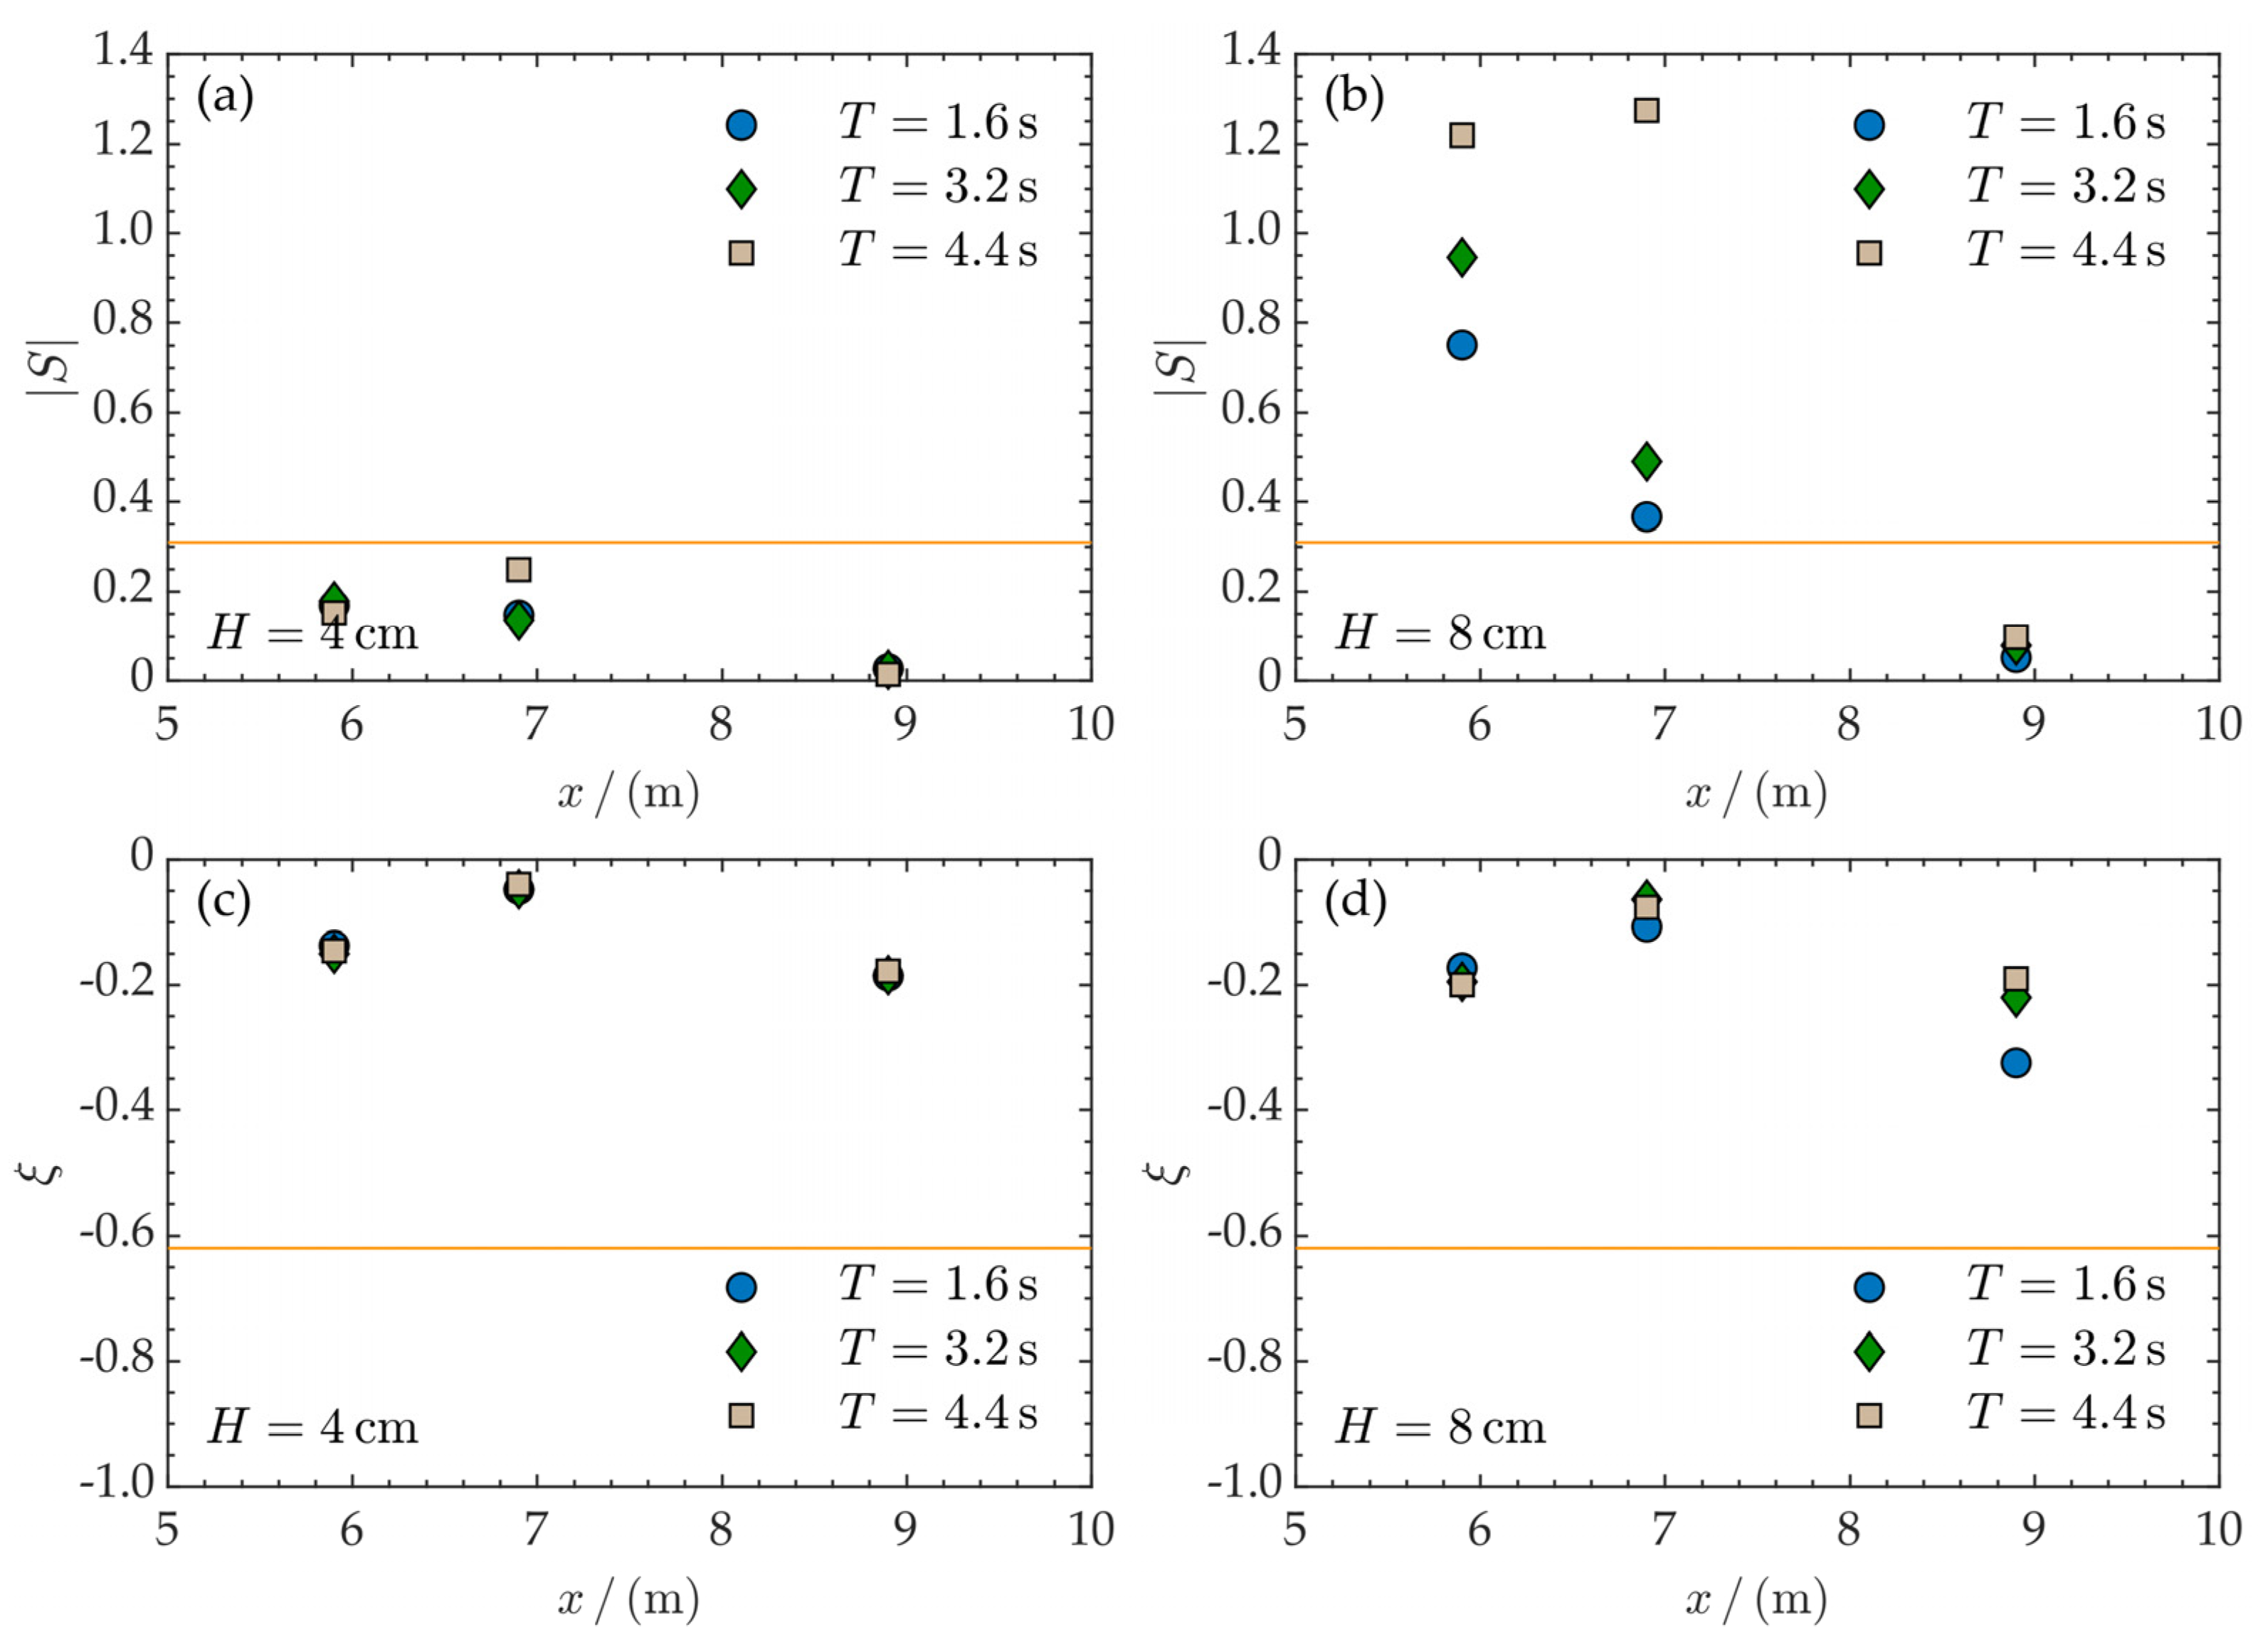
Seabed Liquefaction Potential: The study found that the wave-induced upward pore pressure gradient is generally insufficient to cause seabed liquefaction. However, under extreme wave conditions, with wave heights of 8 cm or 12 cm, the wave-induced horizontal pressure gradient under the wave crest exceeds the liquefaction threshold near the wave-breaking point. This highlights the potential for momentary liquefaction driven by horizontal pressure gradients in such scenarios.
(3)
Sediment Transport Mechanism: Wave-induced pore pressure gradients play a significant role in sediment transport. Under mild wave conditions, the absence of liquefaction results in some soil particles being suspended in the water by viscous stress at the water-seabed interface. In contrast, under extreme wave conditions, liquefaction induced by horizontal pressure gradients near the sandbar leads to shear granular flow on the seabed surface, as the downward pressure gradient prevents soil particles from suspension.
Overall, the results of this study emphasize the importance of wave-induced pore pressure gradients in determining seabed stability and sediment transport processes around sandbars. The findings contribute to a better understanding of the physical mechanisms underlying these processes, which are critical for accurate predictions of coastal morphological changes and for informing coastal management practices.

Author Contributions

Conceptualization, J.Z. (Jinhai Zheng) and L.T.; methodology, M.C., L.T. and J.Z. (Jisheng Zhang); formal analysis, M.C., J.Z. (Jinhai Zheng), L.T. and J.Z. (Jisheng Zhang); investigation, M.C. and L.T.; data curation, M.L. and N.C.; writing—original draft preparation, M.C., L.T. and M.L.; writing—review and editing, J.Z. (Jinhai Zheng) and J.Z. (Jisheng Zhang); visualization, M.C. and L.T.; supervision, J.Z. (Jinhai Zheng) and J.Z. (Jisheng Zhang).; project administration, J.Z. (Jinhai Zheng) and L.T.; funding acquisition, J.Z. (Jinhai Zheng) and L.T. All authors have read and agreed to the published version of the manuscript.

Funding

This research was funded by the National Key Research and Development Program of China (2023YFE0126300), the National Natural Science Foundation of China (52101309), and the Fundamental Research Funds for the Central Universities (B240201117).

Institutional Review Board Statement

Not applicable.

Informed Consent Statement

Not applicable.

Data Availability Statement

All data results and relative information to this study are available, please contact the corresponding author.

Conflicts of Interest

Author Mili Chen was employed by the company China International Water & Electric Corporation. The remaining authors declare that the research was conducted in the absence of any commercial or financial relationships that could be construed as a potential conflict of interest.

References

  1. Roelvink, J.A.; Stive, M.J.F. Bar-generating cross-shore flow mechanisms on a beach. J. Geophys. Res. Oceans 1989, 94, 4785–4800. [Google Scholar] [CrossRef]
  2. Dupont, R.; Bouchette, F.; Mohammadi, B. Modelling beaches morphodynamic by Hadamard sensitivity analysis. Ocean Model. 2024, 189, 102370. [Google Scholar] [CrossRef]
  3. Mieras, R.S.; Puleo, J.A.; Anderson, D.; Hsu, T.-J.; Cox, D.T.; Calantoni, J. Relative contributions of bed load and suspended load to sediment transport under skewed-asymmetric waves on a sandbar crest. J. Geophys. Res. Oceans 2019, 124, 1294–1321. [Google Scholar] [CrossRef]
  4. Marchesiello, P.; Chauchat, J.; Shafiei, H.; Almar, R.; Benshila, R.; Dumas, F.; Debreu, L. 3D wave-resolving simulation of sandbar migration. Ocean Model. 2022, 180, 102127. [Google Scholar] [CrossRef]
  5. Dubarbier, B.; Castelle, B.; Marieu, V.; Ruessink, G. Process-based modeling of cross-shore sandbar behavior. Coast. Eng. 2015, 95, 35–50. [Google Scholar] [CrossRef]
  6. Shields, A. Anwendung der Aehnlichkeitsmechanik und der Turbulenzforschung auf die Geschiebebewegung. Ph.D. Thesis, Technical University Berlin, Berlin, Germany, 1936. [Google Scholar]
  7. Fredsoe, J.; Deigaard, R. Mechanics of Coastal Sediment Transport; World Scientific Publishing Company: Singapore, 1992. [Google Scholar]
  8. Yang, C.T. Incipient motion and sediment transport. J. Hydraul. Div. 1973, 99, 1679–1704. [Google Scholar] [CrossRef]
  9. Beheshti, A.A.; Ataie-Ashtiani, B. Analysis of threshold and incipient conditions for sediment movement. Coast. Eng. 2008, 55, 423–430. [Google Scholar] [CrossRef]
  10. Ling, C.H. Criteria for incipient motion of spherical sediment particles. J. Hydraul. Eng. 1995, 121, 472–478. [Google Scholar] [CrossRef]
  11. Wong, M.; Parker, G. Reanalysis and correction of bed-load relation of Meyer-Peter and Müller using their own database. J. Hydraul. Eng. 2006, 132, 1159–1168. [Google Scholar] [CrossRef]
  12. Liang, D.; Cheng, L.; Li, F. Numerical modeling of flow and scour below a pipeline in currents: Part II. Scour simulation. Coastal Eng. 2005, 52, 43–62. [Google Scholar] [CrossRef]
  13. Baykal, C.Ü.; Sumer, B.M.; Fuhrman, D.R.; Jacobsen, N.G.; Fredsøe, J. Numerical simulation of scour and backfilling processes around a circular pile in waves. Coast. Eng. 2017, 122, 87–107. [Google Scholar] [CrossRef]
  14. Soulsby, R. Dynamics of Marine Sands: A Manual for Practical Applications; Thomas Telford: London, UK, 1997. [Google Scholar]
  15. Dick, J.E.; Sleath, J.F.A. Velocities and concentrations in oscillatory flow over beds of sediment. J. Fluid Mech. 1991, 233, 165–196. [Google Scholar] [CrossRef]
  16. Zala Flores, N.; Sleath, J.F. Mobile layer in oscillatory sheet flow. J. Geophys. Res. Oceans 1998, 103, 12783–12793. [Google Scholar] [CrossRef]
  17. Madsen, O.S. Stability of a sand bed under breaking waves. In Proceedings of the 14th International Conference on Coastal Engineering, ASCE, Copenhagen, Denmark, 24–28 June 1974; pp. 776–794. [Google Scholar] [CrossRef]
  18. Packwood, A.R.; Peregrine, D.H. The propagation of solitary waves and bores over a porous bed. Coast. Eng. 1980, 3, 221–242. [Google Scholar] [CrossRef]
  19. Sleath, J.F. Conditions for plug formation in oscillatory flow. Cont. Shelf. Res. 1999, 19, 1643–1664. [Google Scholar] [CrossRef]
  20. Foster, D.L.; Bowen, A.J.; Holman, R.A.; Natoo, P. Field evidence of pressure gradient induced incipient motion. J. Geophys. Res. Oceans 2006, 111, C05004. [Google Scholar] [CrossRef]
  21. Tong, L.L.; Liu, P.L.F. Transient wave-induced pore-water-pressure and soil responses in a shallow unsaturated poroelastic seabed. J. Fluid Mech. 2022, 938, A36. [Google Scholar] [CrossRef]
  22. Tong, L.L.; Zhang, J.L.; Zhao, J.L.; Zheng, J.H.; Guo, Y.K. Modelling study of wave damping over a sandy and a silty bed. Coastal Eng. 2020, 161, 103756. [Google Scholar] [CrossRef]
  23. Liu, P.L.F.; Park, Y.S.; Lara, J.L. Long-wave-induced flows in an unsaturated permeable seabed. J. Fluid Mech. 2007, 586, 323–345. [Google Scholar] [CrossRef]
  24. Anderson, D.; Cox, D.; Mieras, R.; Puleo, J.A.; Hsu, T.J. Observations of wave-induced pore pressure gradients and bed level response on a surf zone sandbar. J. Geophys. Res. Oceans 2017, 122, 5169–5193. [Google Scholar] [CrossRef]
  25. Berni, C.; Michallet, H.; Barthélemy, E. Effects of horizontal pressure gradients on bed destabilization under waves. J. Fluid Mech. 2017, 812, 721–751. [Google Scholar] [CrossRef]
  26. Islam, M.S.; Suzuki, T.; Thilakarathne, S. Physical modeling of sandbar dynamics to correlate wave-induced pore pressure gradient, sediment concentration, and bed-level erosion. Ocean Eng. 2024, 307, 118161. [Google Scholar] [CrossRef]
  27. Jeng, D.S.; Hsu, J.S.C. Wave-induced soil response in a nearly saturated sea-bed of finite thickness. Geotechnique 1996, 46, 427–440. [Google Scholar] [CrossRef]
  28. Zhang, Y.; Jeng, D.S.; Gao, F.P.; Zhang, J.S. An analytical solution for response of a porous seabed to combined wave and current loading. Ocean Eng. 2012, 57, 240–247. [Google Scholar] [CrossRef]
  29. Almar, R.; Hounkonnou, N.; Anthony, E.J.; Castelle, B.; Senechal, N.; Laibi, R.; Mensah-Senoo, T.; Degbe, G.; Quenum, M.; Dorel, M.; et al. The Grand Popo beach 2013 experiment, Benin, West Africa: From short timescale processes to their integrated impact over long-term coastal evolution. J. Coast. Res. 2014, 70, 651–656. [Google Scholar] [CrossRef]
  30. Grasso, F.; Michallet, H.; Barthélemy, E.; Certain, R. Physical modeling of intermediate cross-shore beach morphology: Transients and equilibrium states. J. Geophys. Res. Oceans 2009, 114, C09001. [Google Scholar] [CrossRef]
  31. Lyu, W.; Wang, X. Stokes–Darcy system, small-Darcy-number behaviour and related interfacial conditions. J. Fluid Mech. 2021, 922, A4. [Google Scholar] [CrossRef]
  32. Bear, J. Dynamics of Fluids in Porous Media; Dover Publications: Mineola, NY, USA, 1972. [Google Scholar]
  33. Mei, C.C. The Applied Dynamics of Ocean Surface Waves; World Scientific: Singapore, 1989. [Google Scholar]
  34. Li, C.F.; Gao, F.P. Characterization of spatio-temporal distributions of wave-induced pore pressure in a non-cohesive seabed: Amplitude-attenuation and phase-lag. Ocean Eng. 2022, 253, 111315. [Google Scholar] [CrossRef]
  35. Tong, L.L.; Zhang, J.S.; Chen, N.; Lin, X.F.; He, R.; Sun, L. Internal solitary wave-induced soil responses and its effects on seabed instability in the South China Sea. Ocean Eng. 2024, 310, 118697. [Google Scholar] [CrossRef]
Figure 1. Alongshore-averaged bathymetric cross-shore profile at Grand Popo Beach in Benin, Gulf of Guinea.
Jmse 12 01630 g001
Figure 2. Experimental setups: (a) wave flume and beach profile, and (b) schematic of experimental setups (The cyan lines indicate the profiles of the PPTAs).
Jmse 12 01630 g002
Figure 3. Photo of the pore pressure transducer array.
Jmse 12 01630 g003
Figure 4. Wave profiles along the wave propagation direction under different wave periods.
Jmse 12 01630 g004
Figure 5. Spatial variation of the amplitude of the first four harmonics along the wave propagation direction.
Jmse 12 01630 g005
Figure 6. Wave breaking over the sand beach (at x = 7.4 m).
Jmse 12 01630 g006
Figure 7. Spatial variation of the ratio of the wave height to the water depth under different wave conditions (ac).
Jmse 12 01630 g007
Figure 8. The time histories of the dimensionless horizontal and vertical pore pressure gradients at x = 8.9 m, 6.9 m, and 5.9 m under different incident wave heights.
Jmse 12 01630 g008
Figure 9. The time histories of the dimensionless horizontal and vertical pore pressure gradients at x = 8.9 m, 6.9 m, and 5.9 m under different wave periods.
Jmse 12 01630 g009
Figure 10. Distributions of the maximums of the horizontal pore pressure gradient and upward vertical pore pressure gradient (ad). The yellow lines indicate the critical values for causing liquefaction.
Jmse 12 01630 g010
Figure 11. Wave-induced sediment suspension and shear granular flow in the seabed (at x = 7.4 m).
Jmse 12 01630 g011
Table 1. Physical properties of the tested sandy soil.
ParameterSymbolValue
Mean grain sized500.2 mm
Specific weight of sand grainsγs2.59 × 104 N/m3
Porosityn0.38
Geometric standard deviation of particle sizeσ1.41
Submerged weight of the soilγ9.97 × 10³ N/m3
Table 2. Summary of the incident wave conditions.
Case
No.
Wave Height
H (cm)
Wave Period
T (s)
Nonlinearity
Ur
Wave Reynolds
Number, Re
Particle Reynolds
Number, Rep
FrDa
C141.61.982.57 × 10515.710.03241.25 × 10−4
C281.63.965.14 × 10531.420.06471.25 × 10−4
C343.210.302.93 × 1057.850.01626.23 × 10−5
C483.220.605.86 × 10515.710.03246.23 × 10−5
C5123.230.908.79 × 10523.560.04866.23 × 10−5
C644.420.232.99 × 1055.710.01184.53 × 10−5
C784.440.475.97 × 10511.420.02354.53 × 10−5
C8124.460.708.96 × 10517.140.03534.53 × 10−5
Disclaimer/Publisher’s Note: The statements, opinions and data contained in all publications are solely those of the individual author(s) and contributor(s) and not of MDPI and/or the editor(s). MDPI and/or the editor(s) disclaim responsibility for any injury to people or property resulting from any ideas, methods, instructions or products referred to in the content.

