
Pressure Fluctuation Characteristics of a Pump-Turbine in the Hump Area under Different Flow Conditions


 , , and
Abstract
1. Introduction
2. Research Object
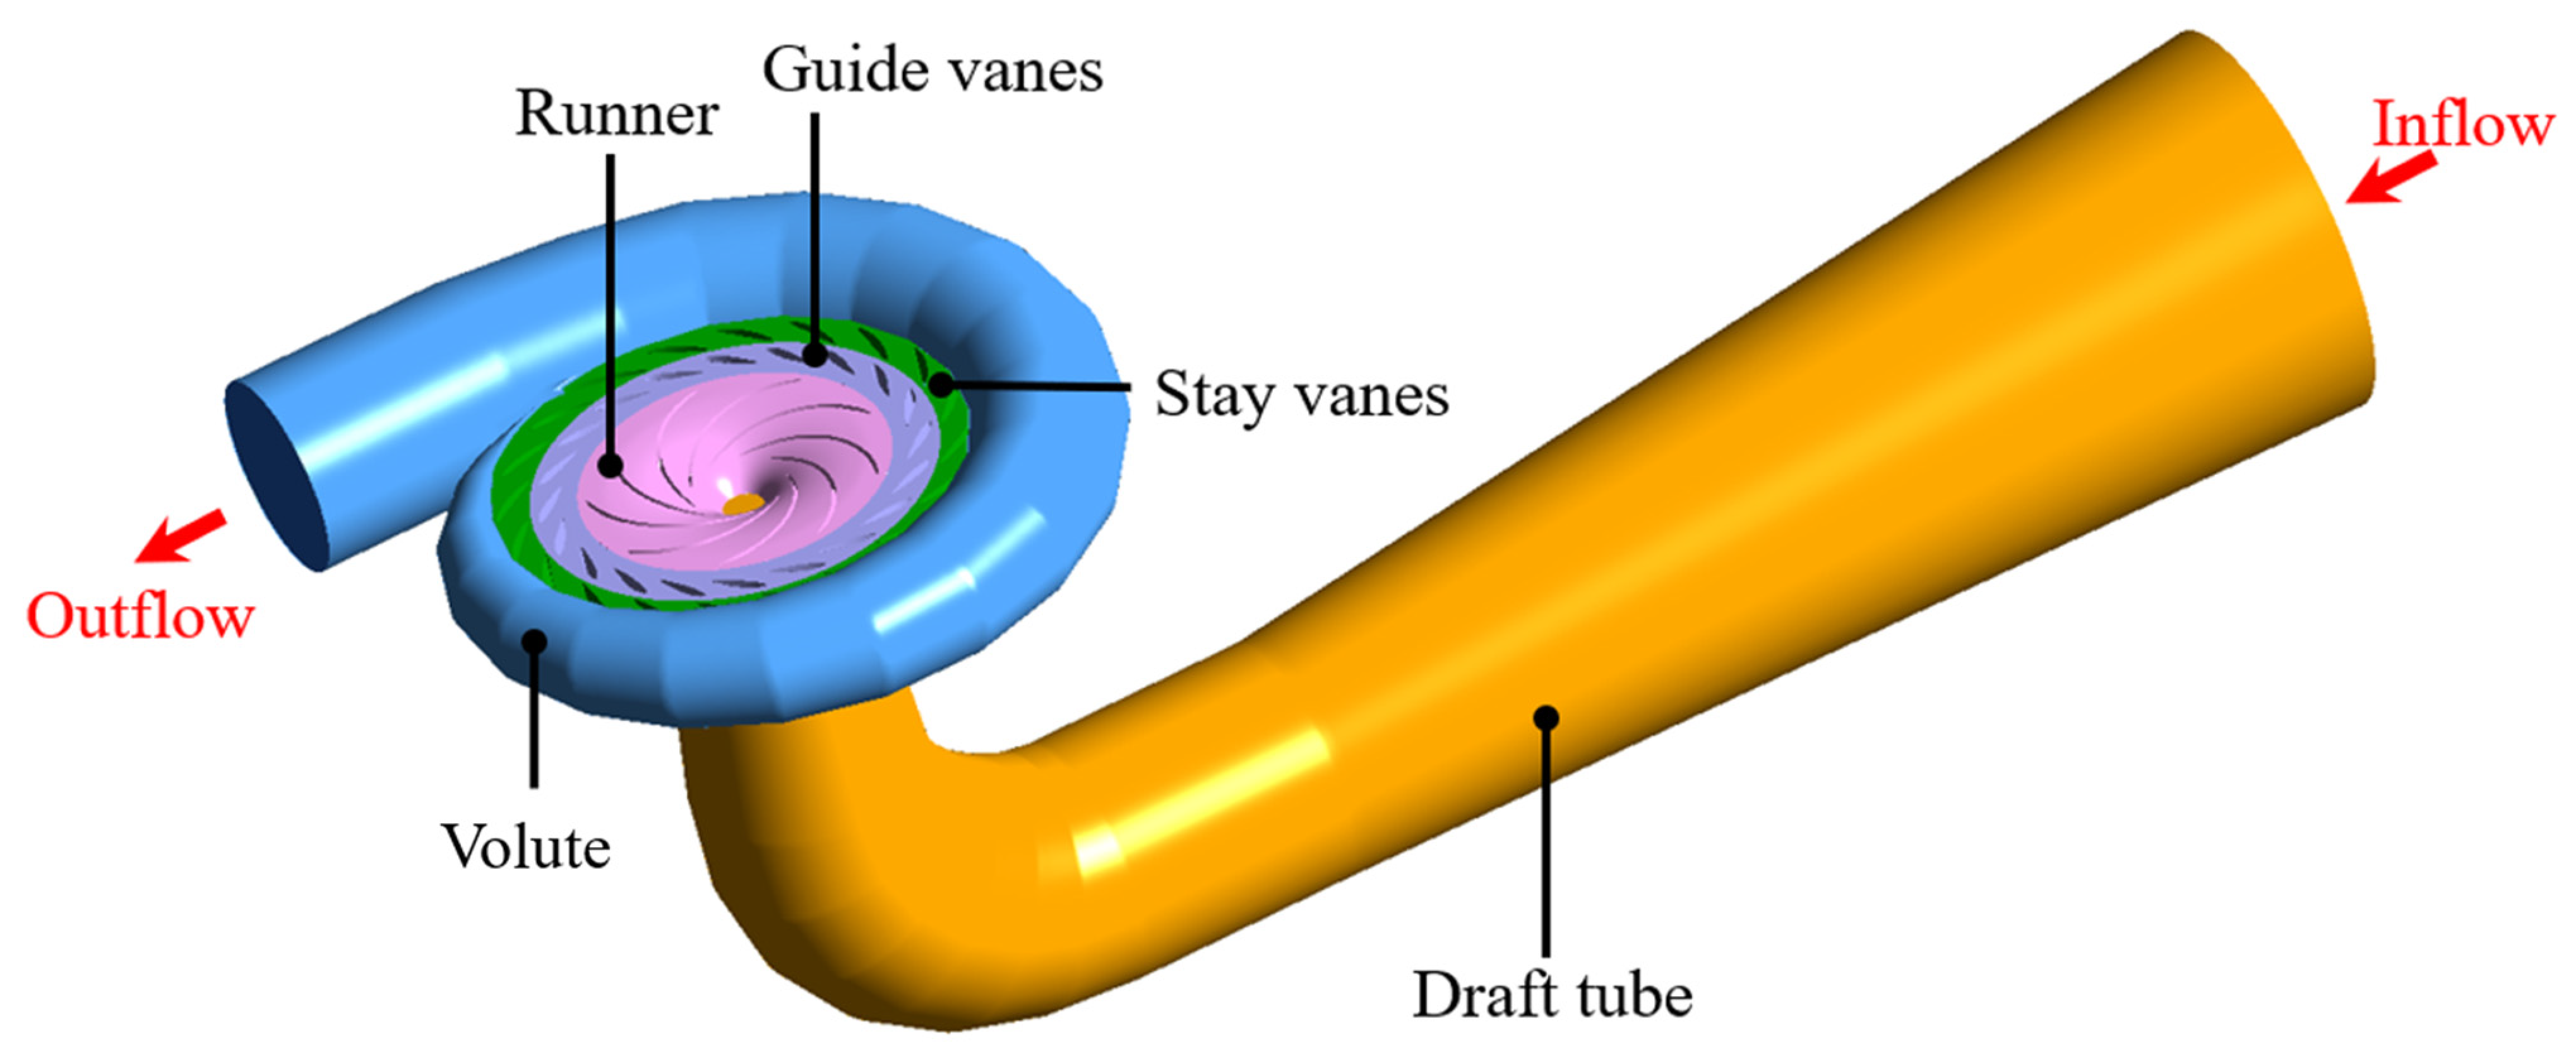
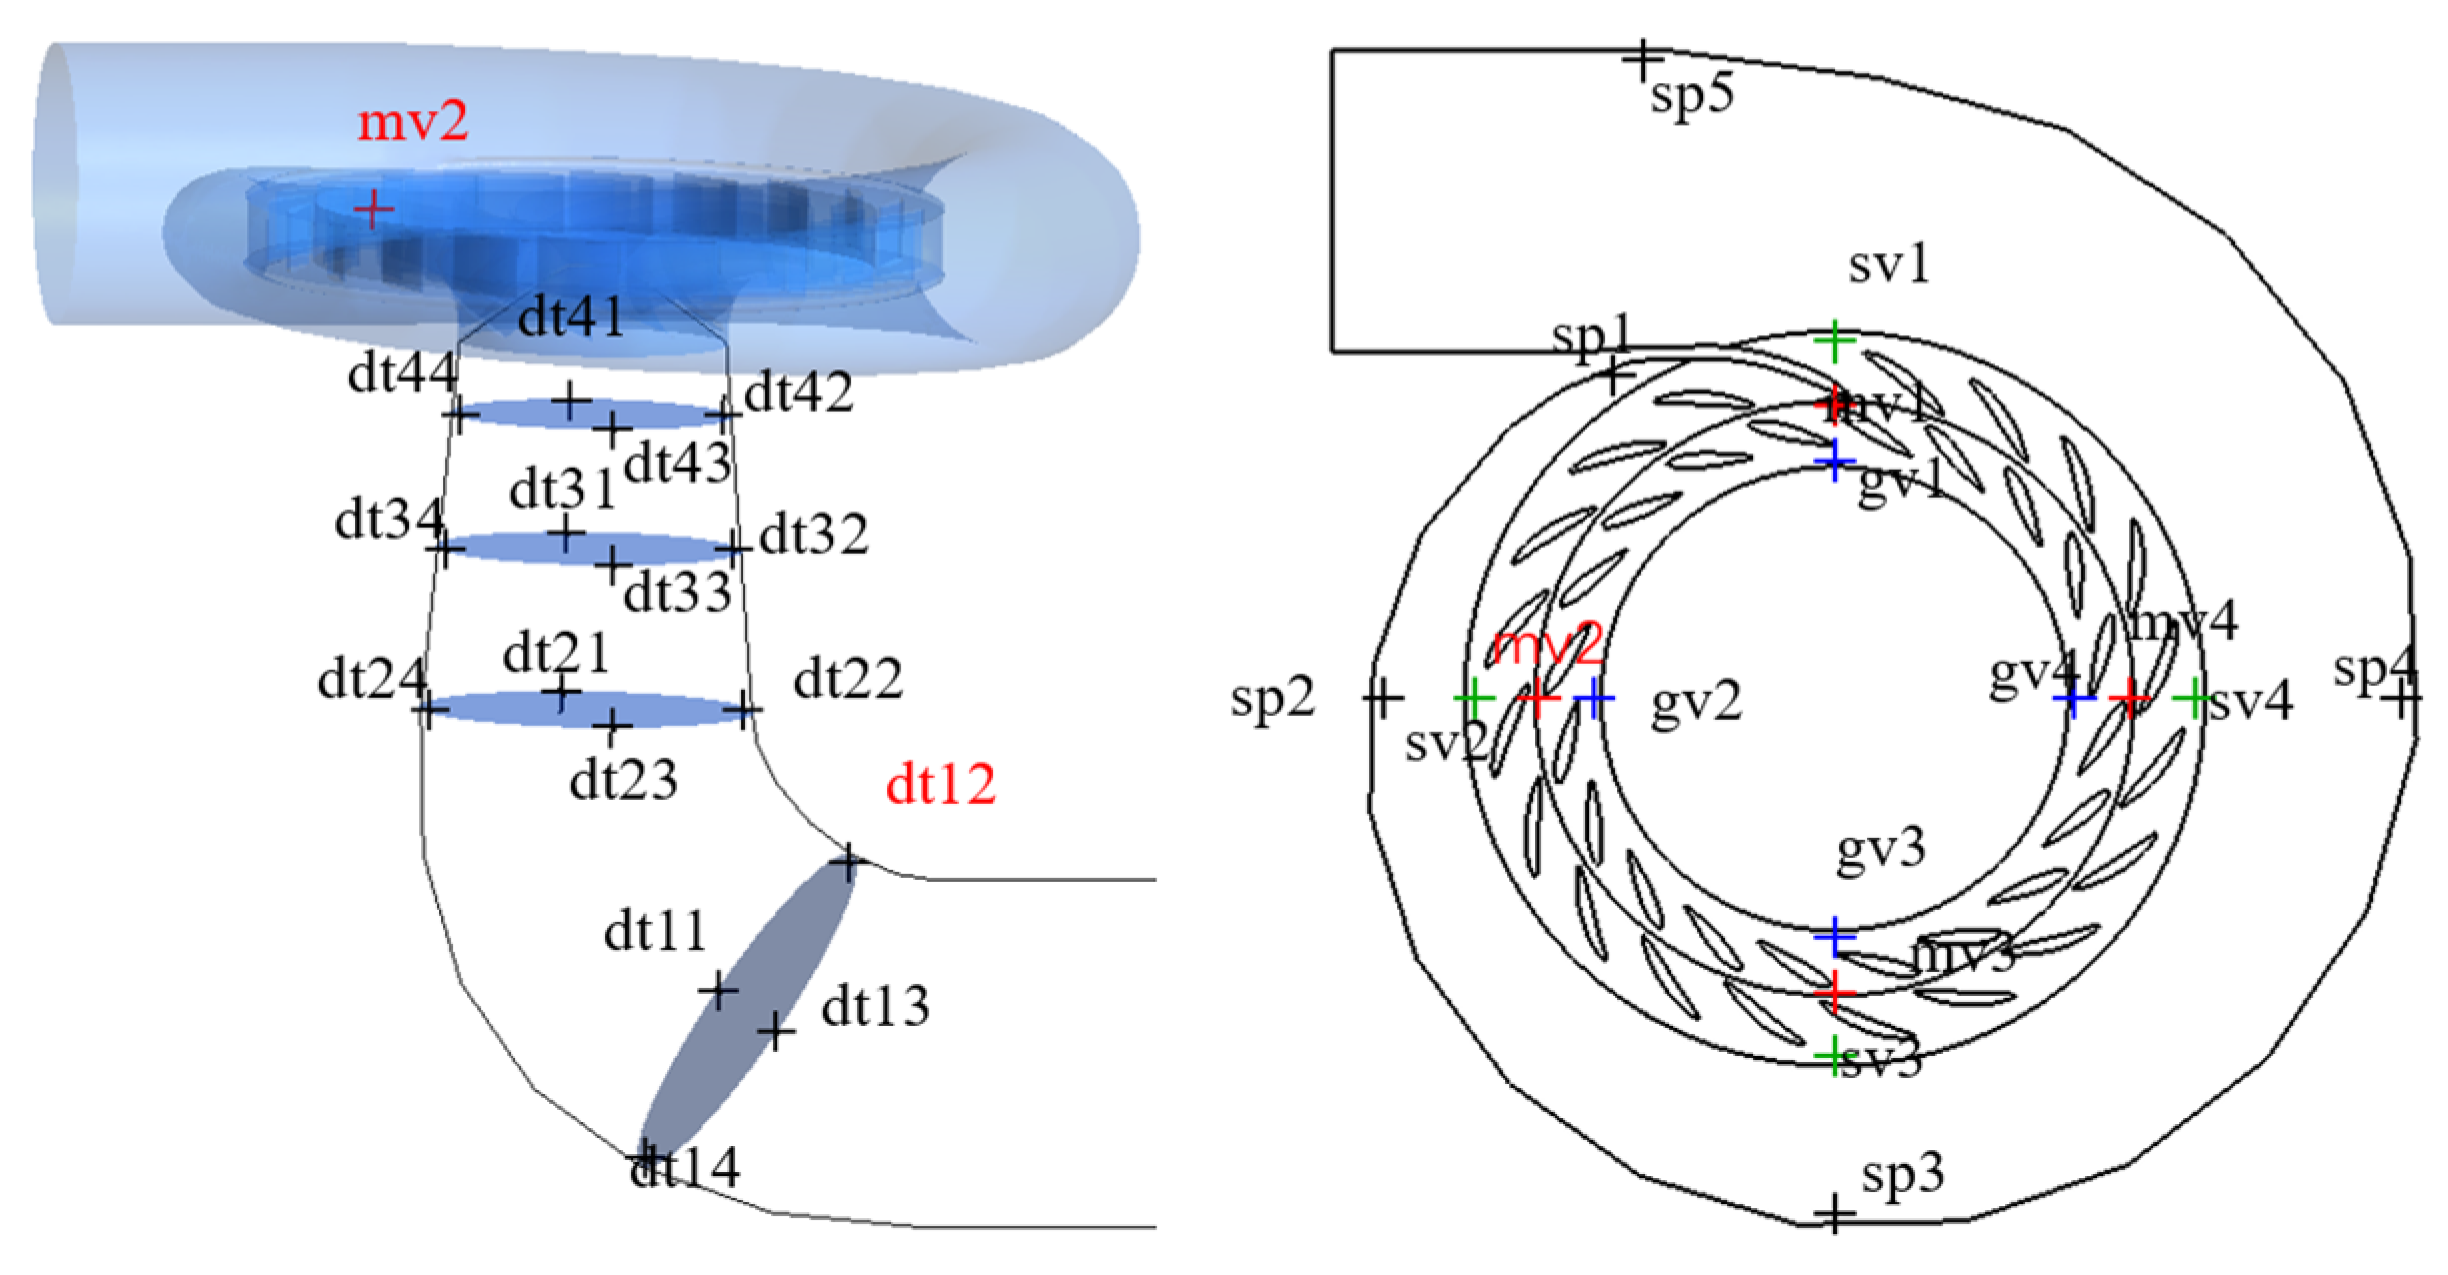
2.1. Physical Model
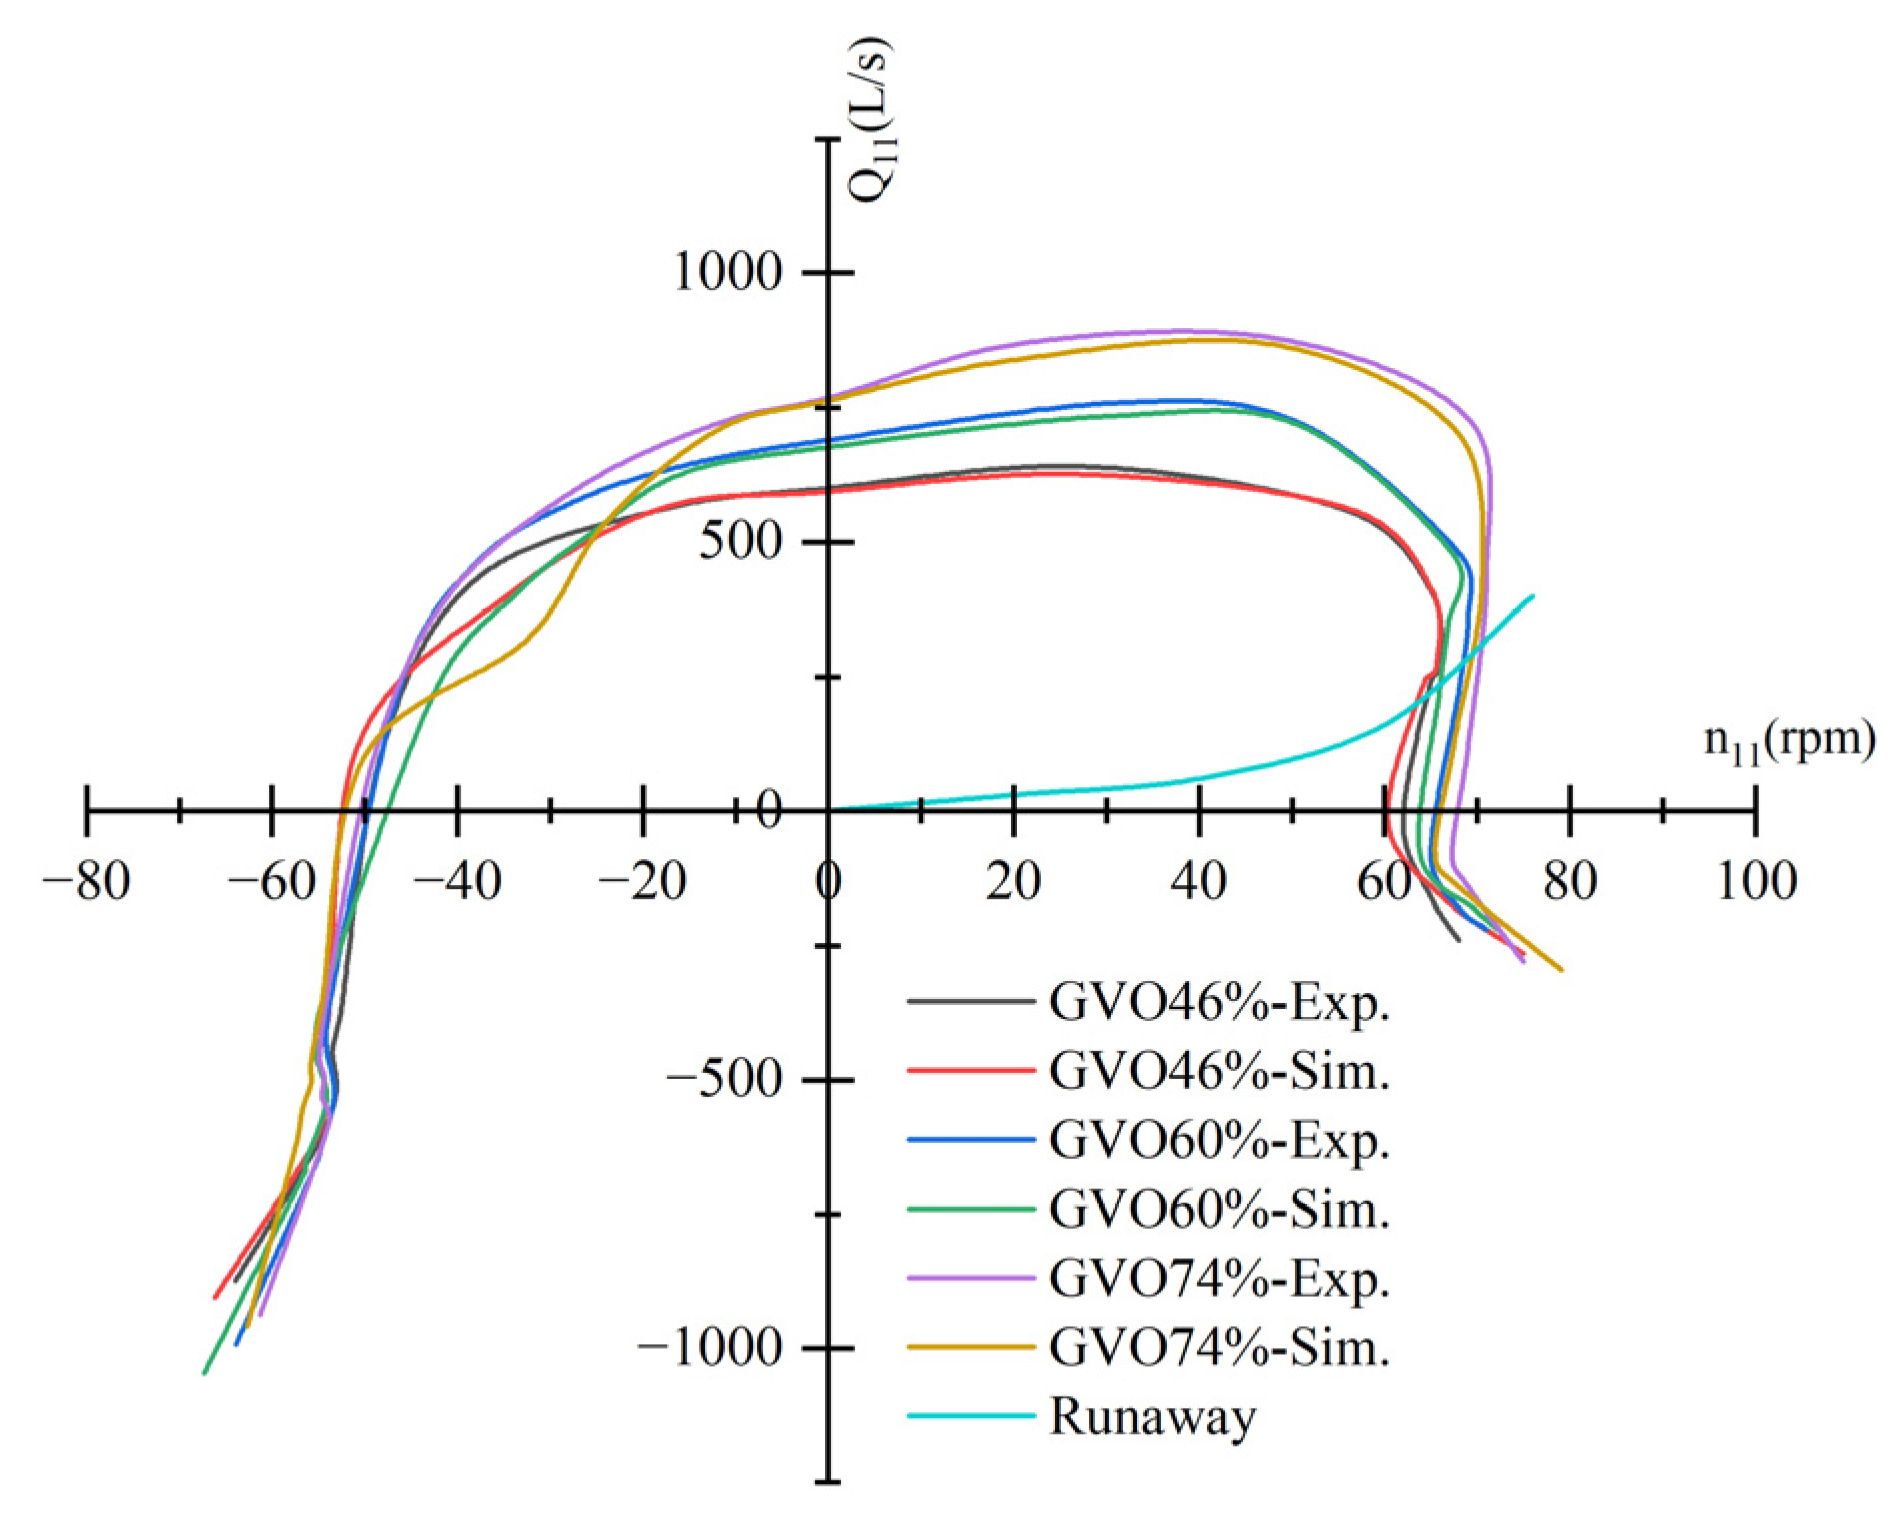
2.2. Selection of the Calculation Working Point
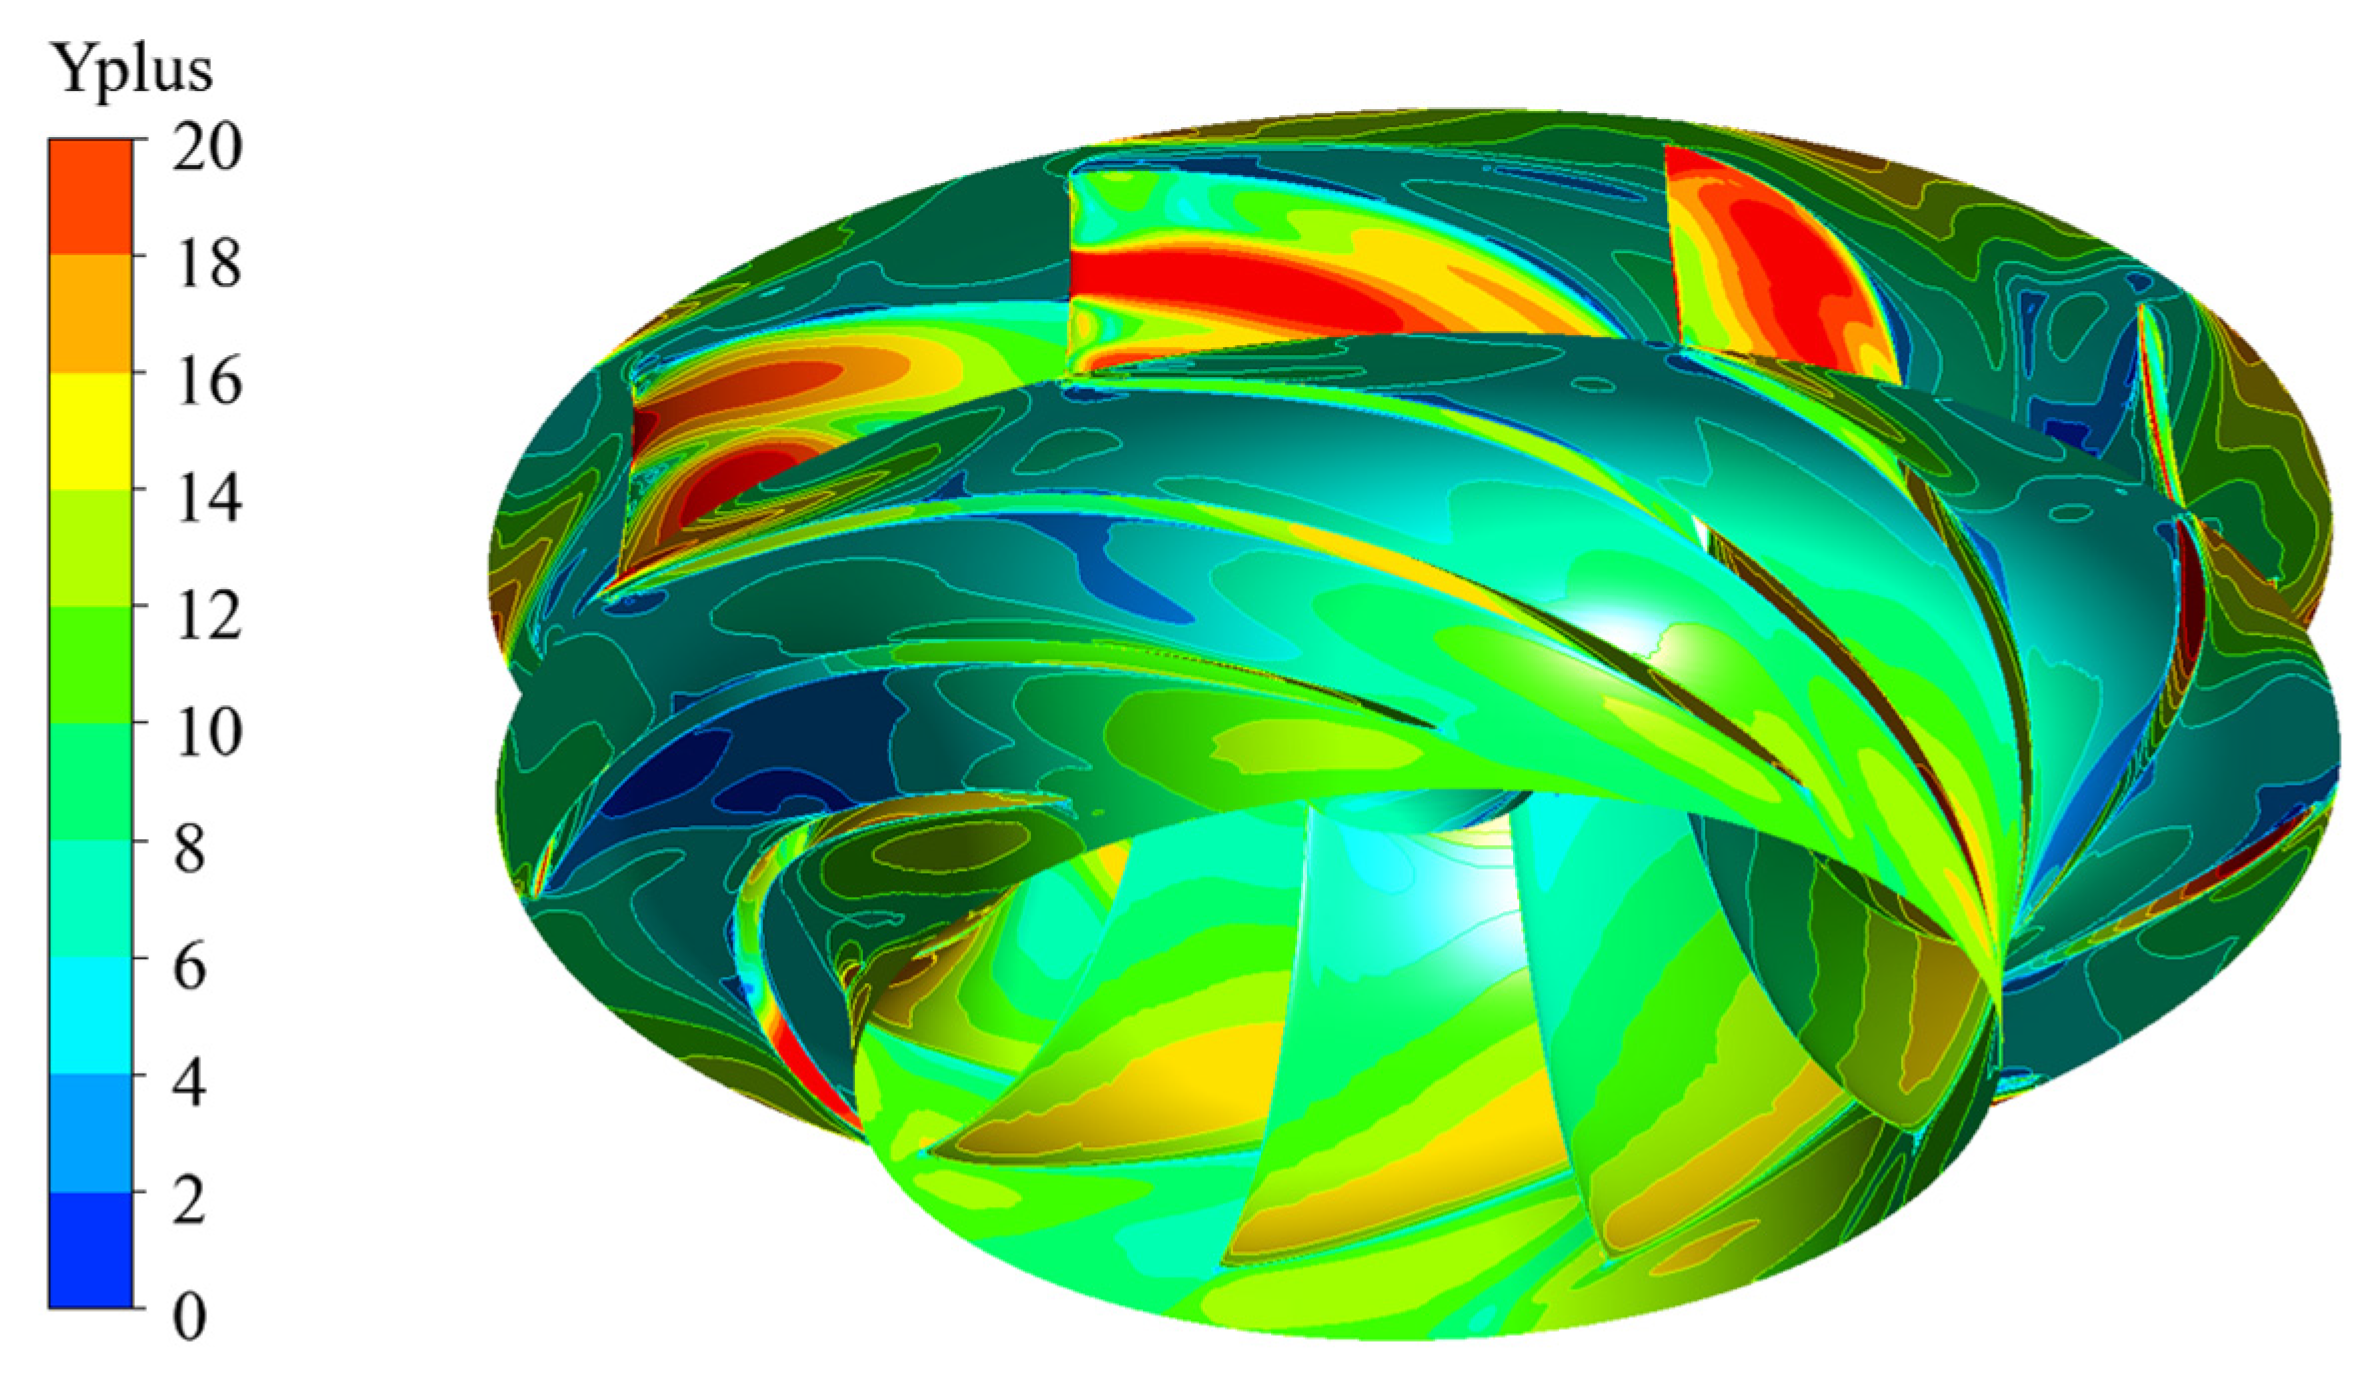
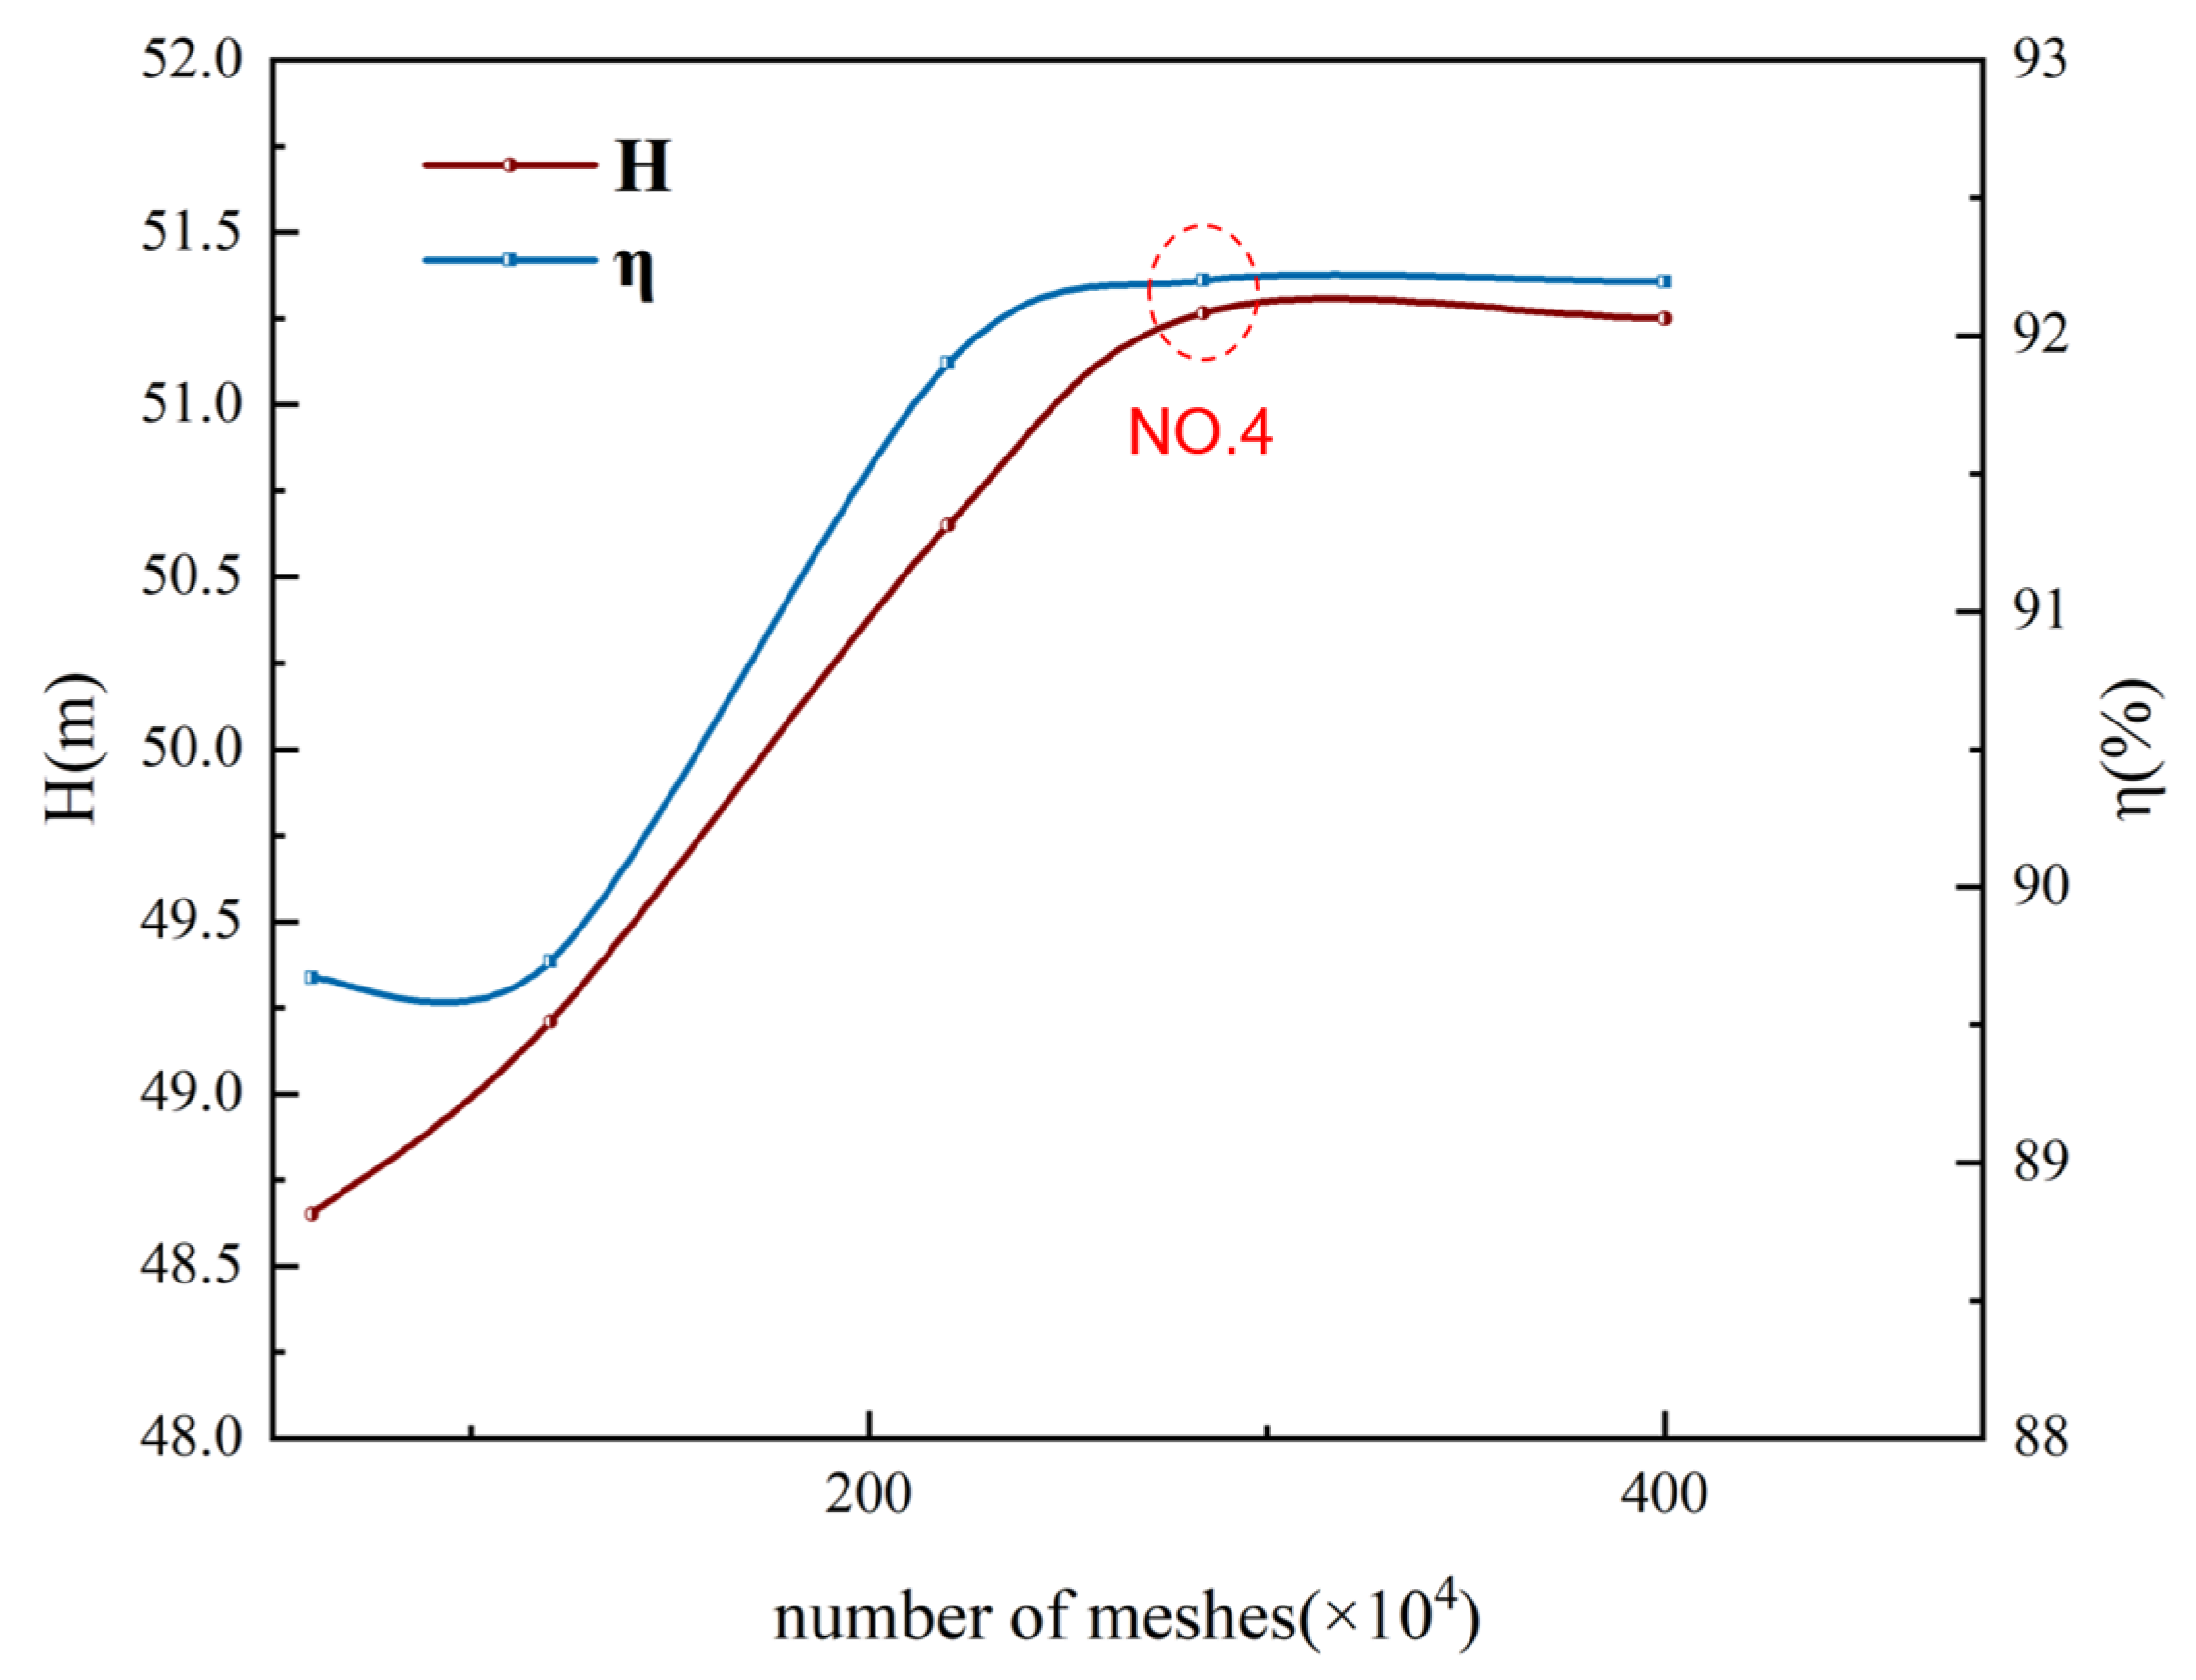
2.3. Grid Independence Verification
3. Numerical Calculation Settings
3.1. Turbulent Flow Model
3.2. Boundary Condition Setting
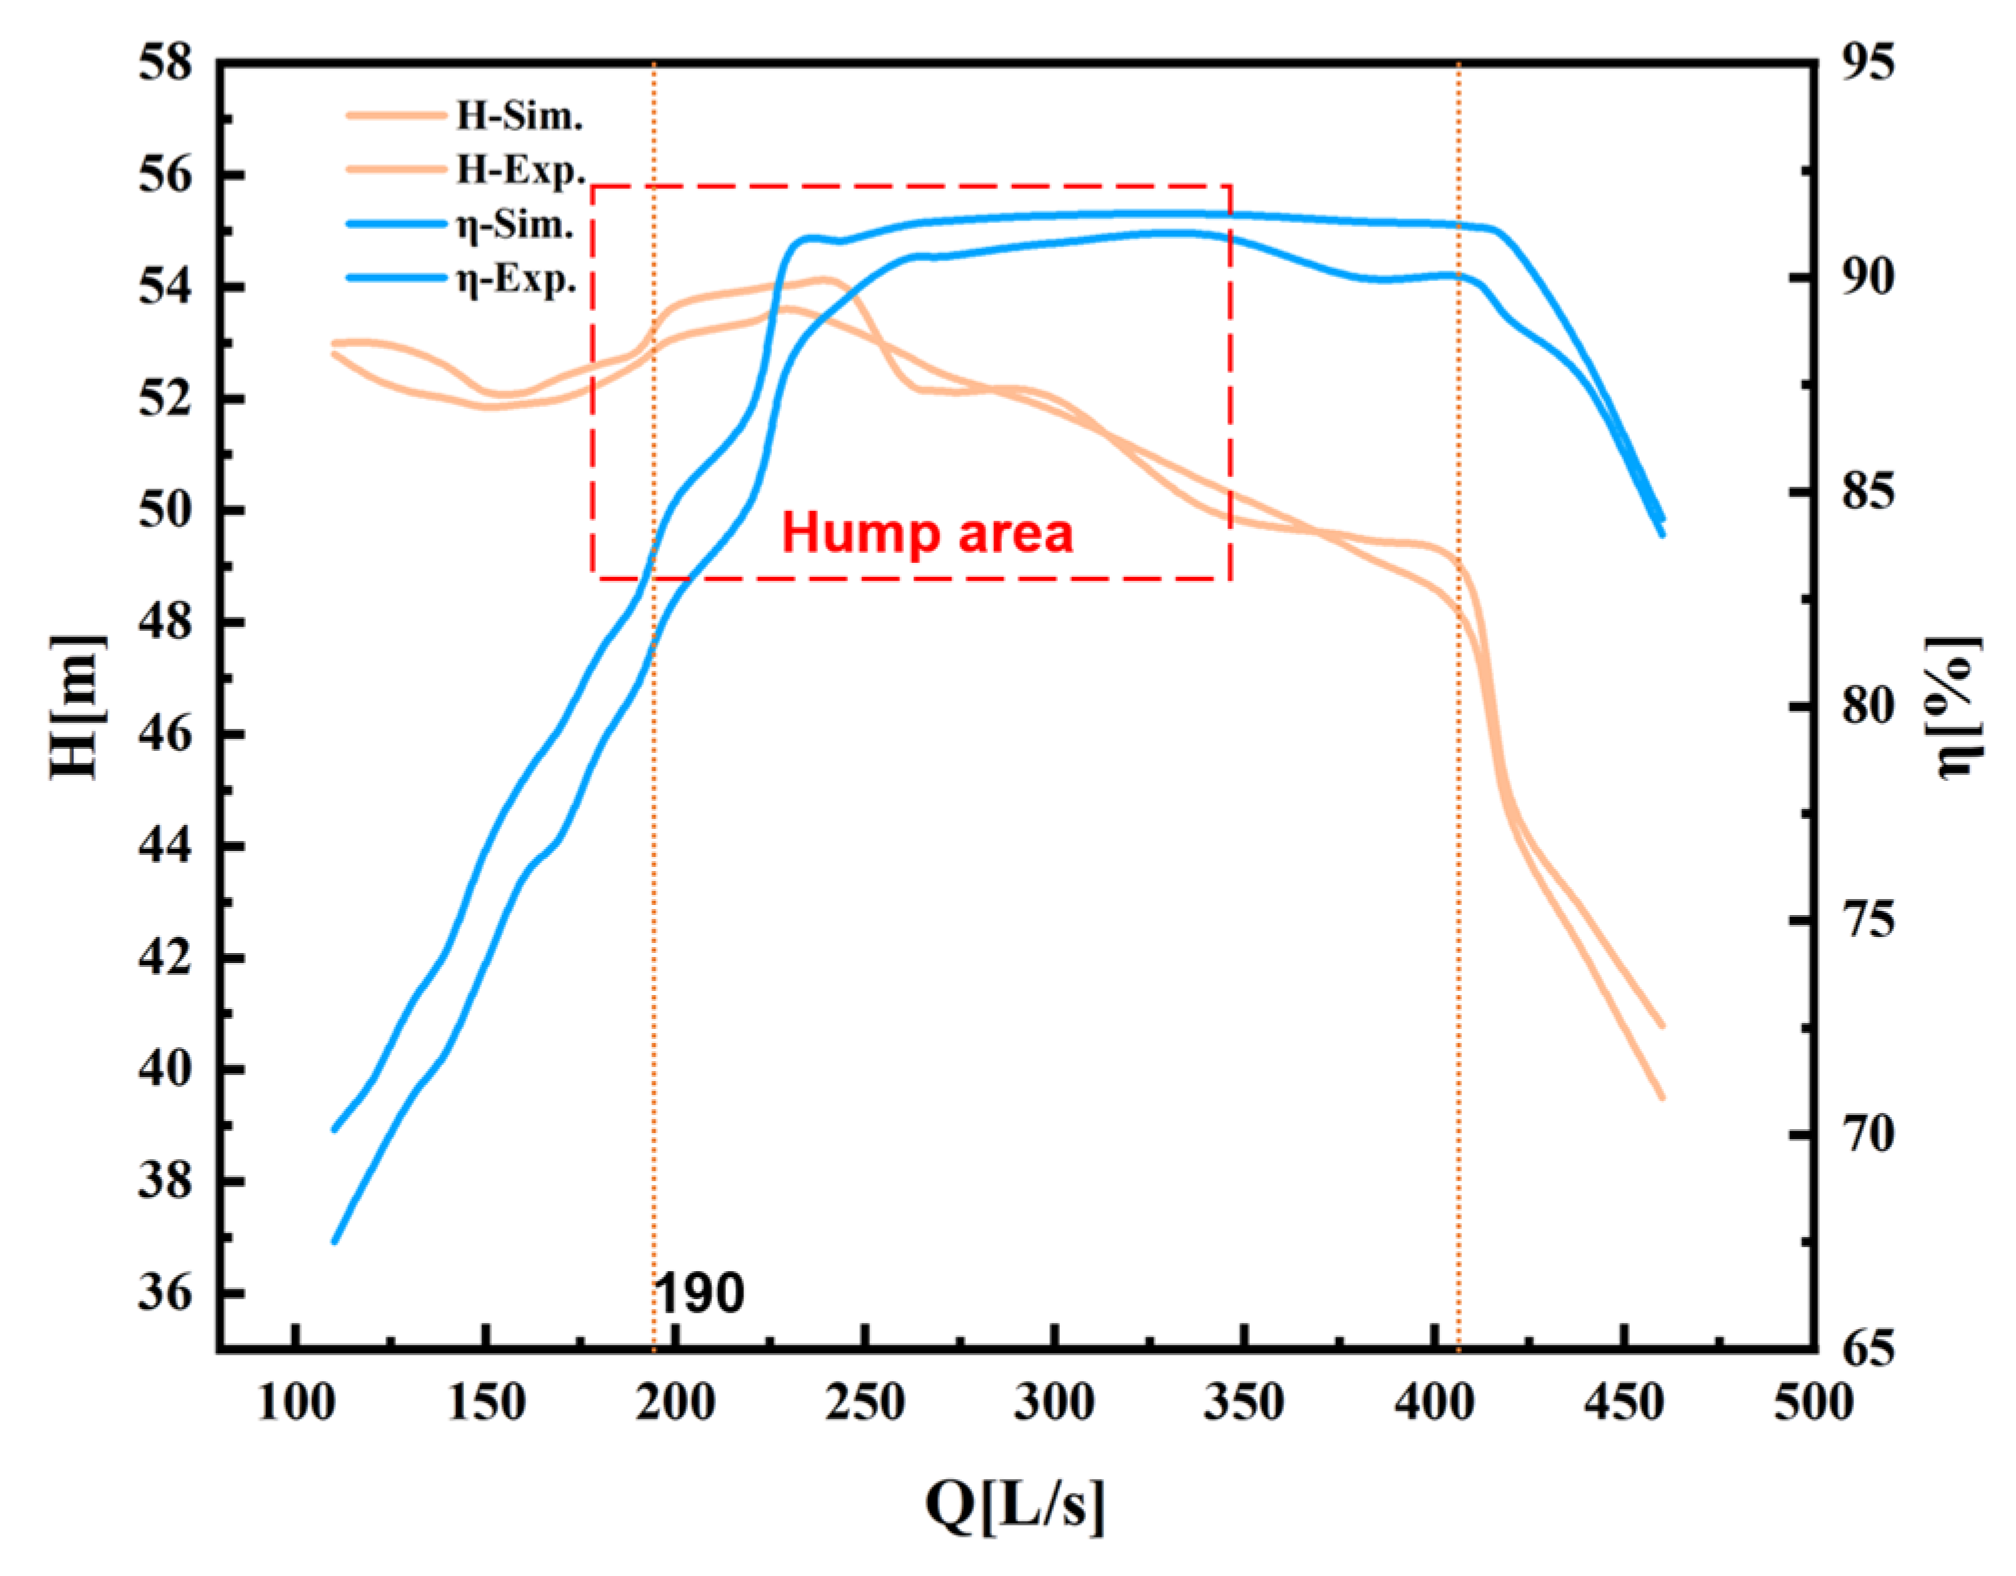
4. Test Verification
5. Analysis of the Results
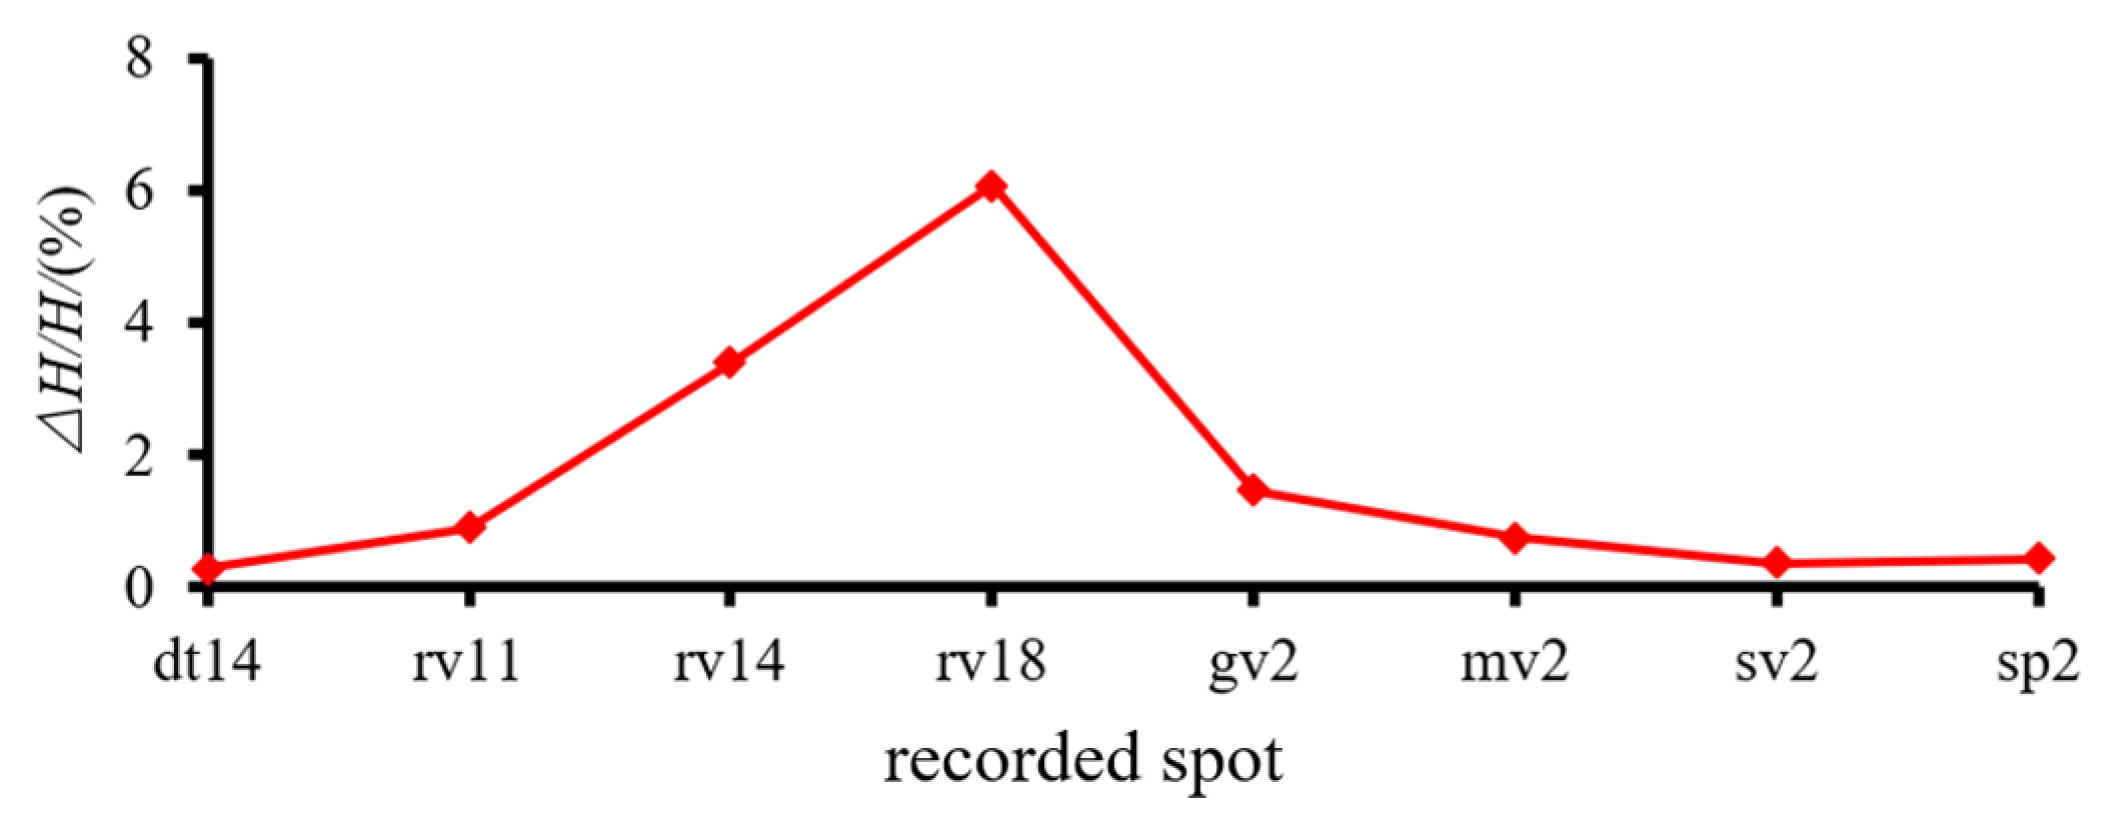
5.1. Hydraulic Performances of the Pump Hump Area
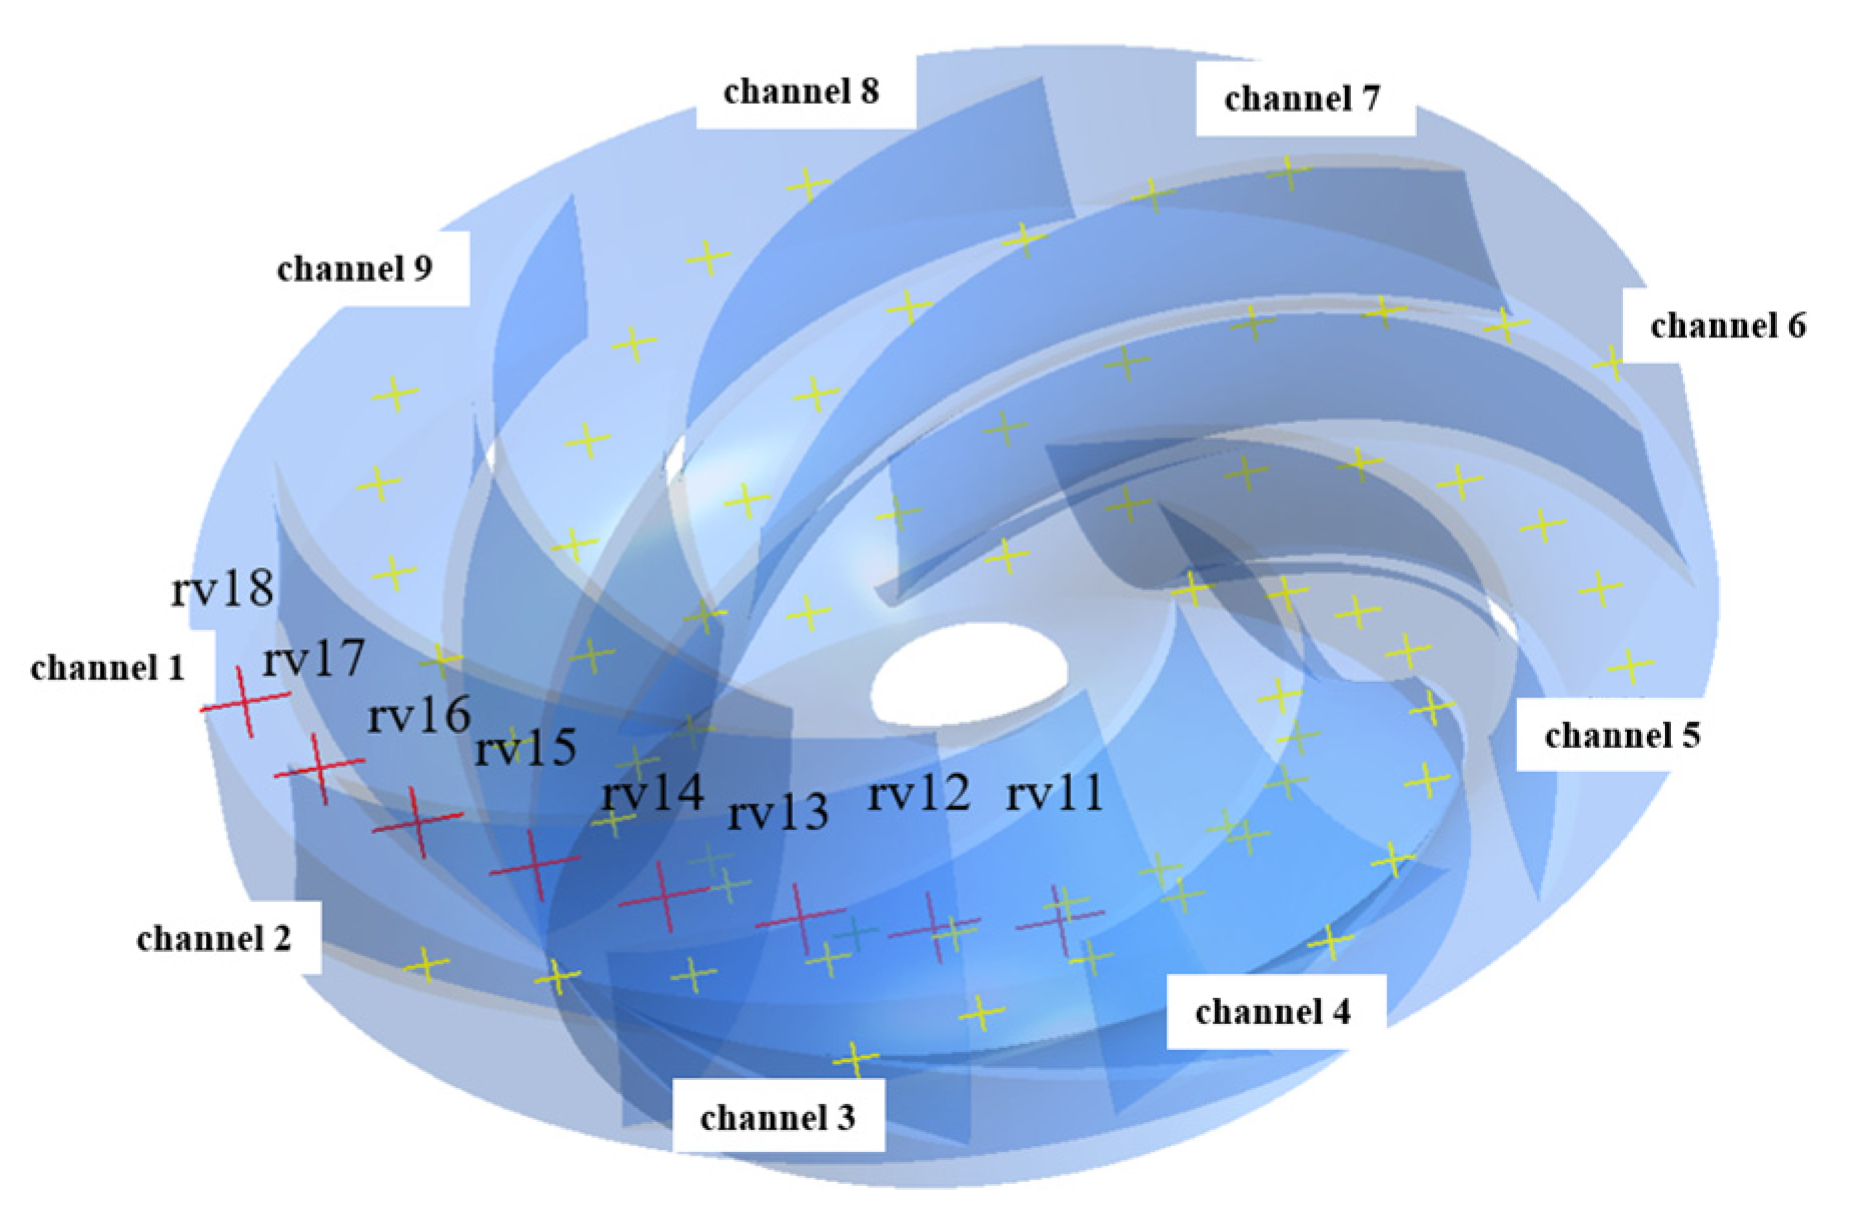
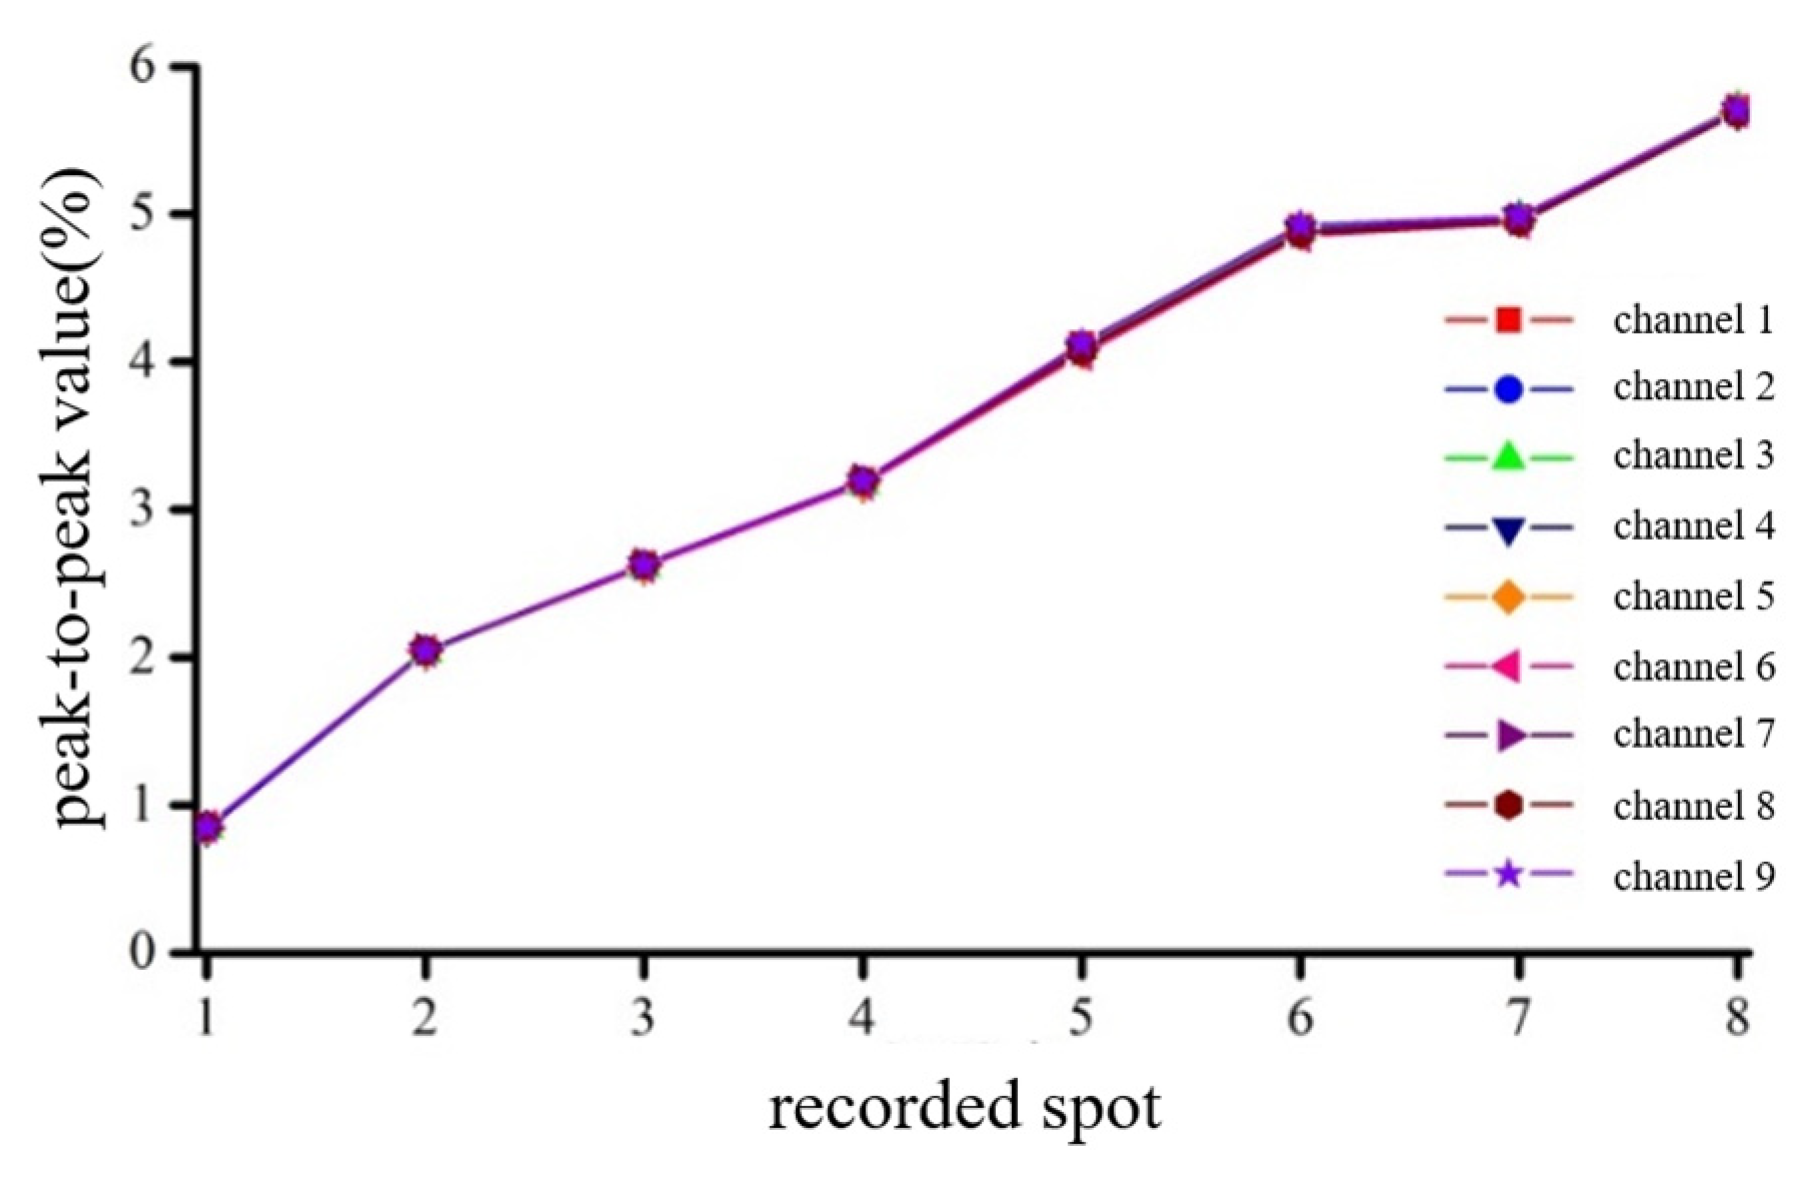
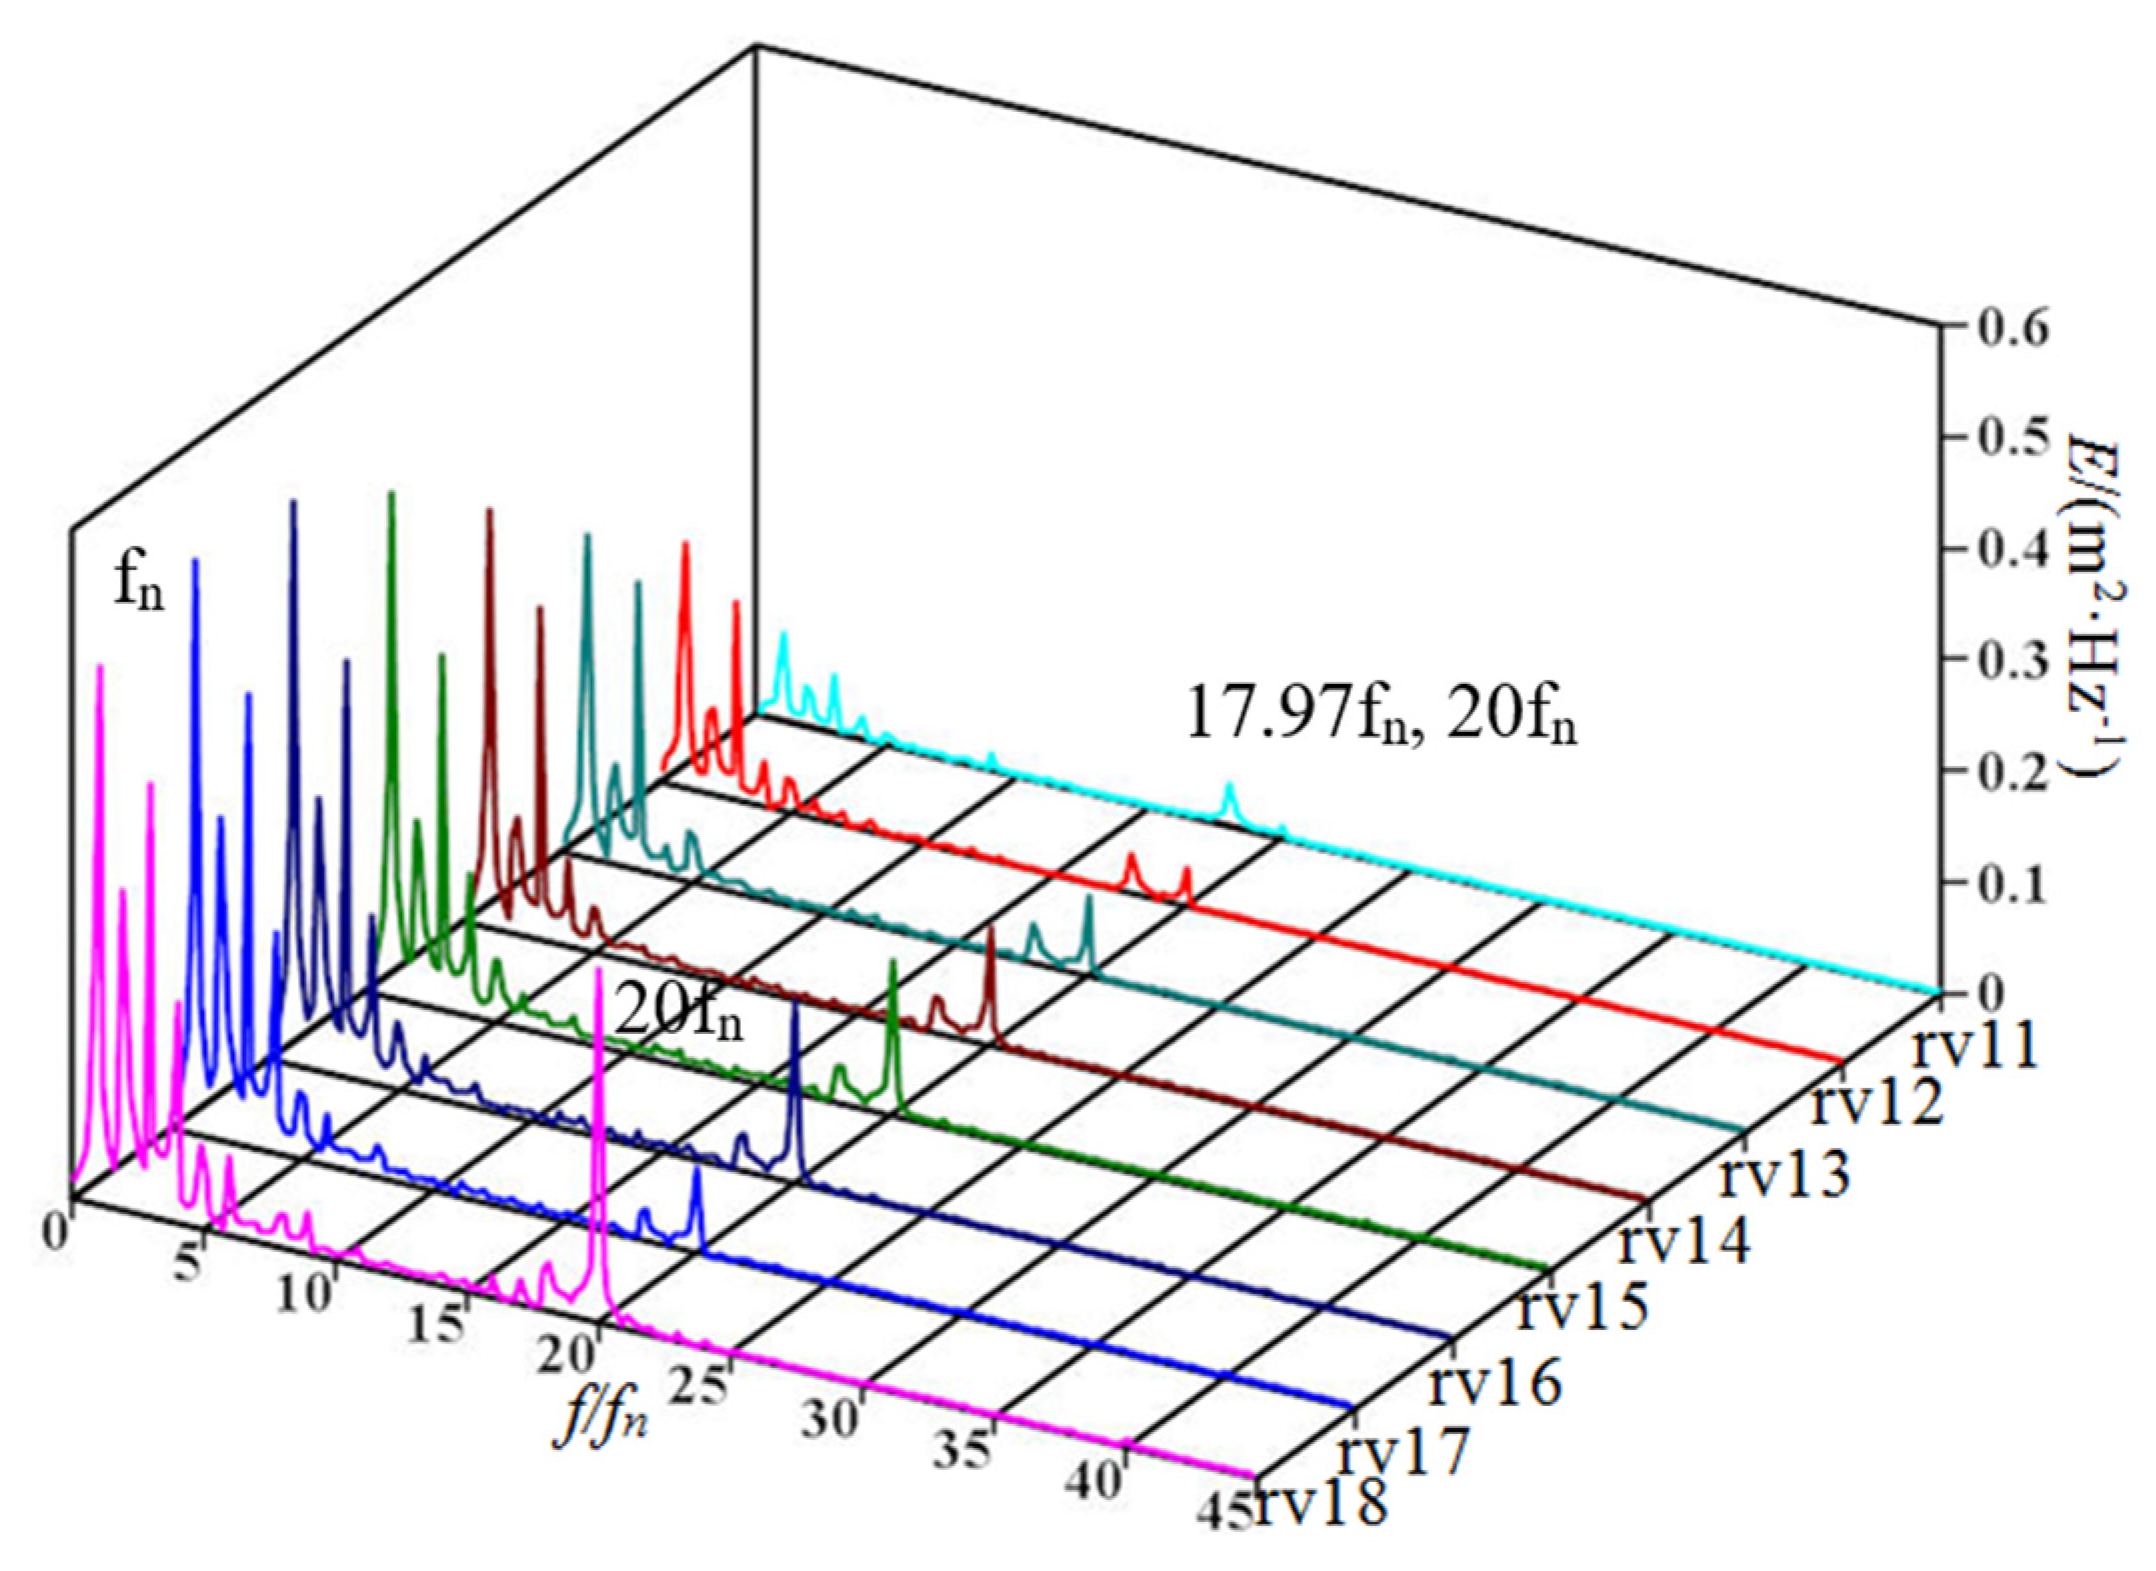
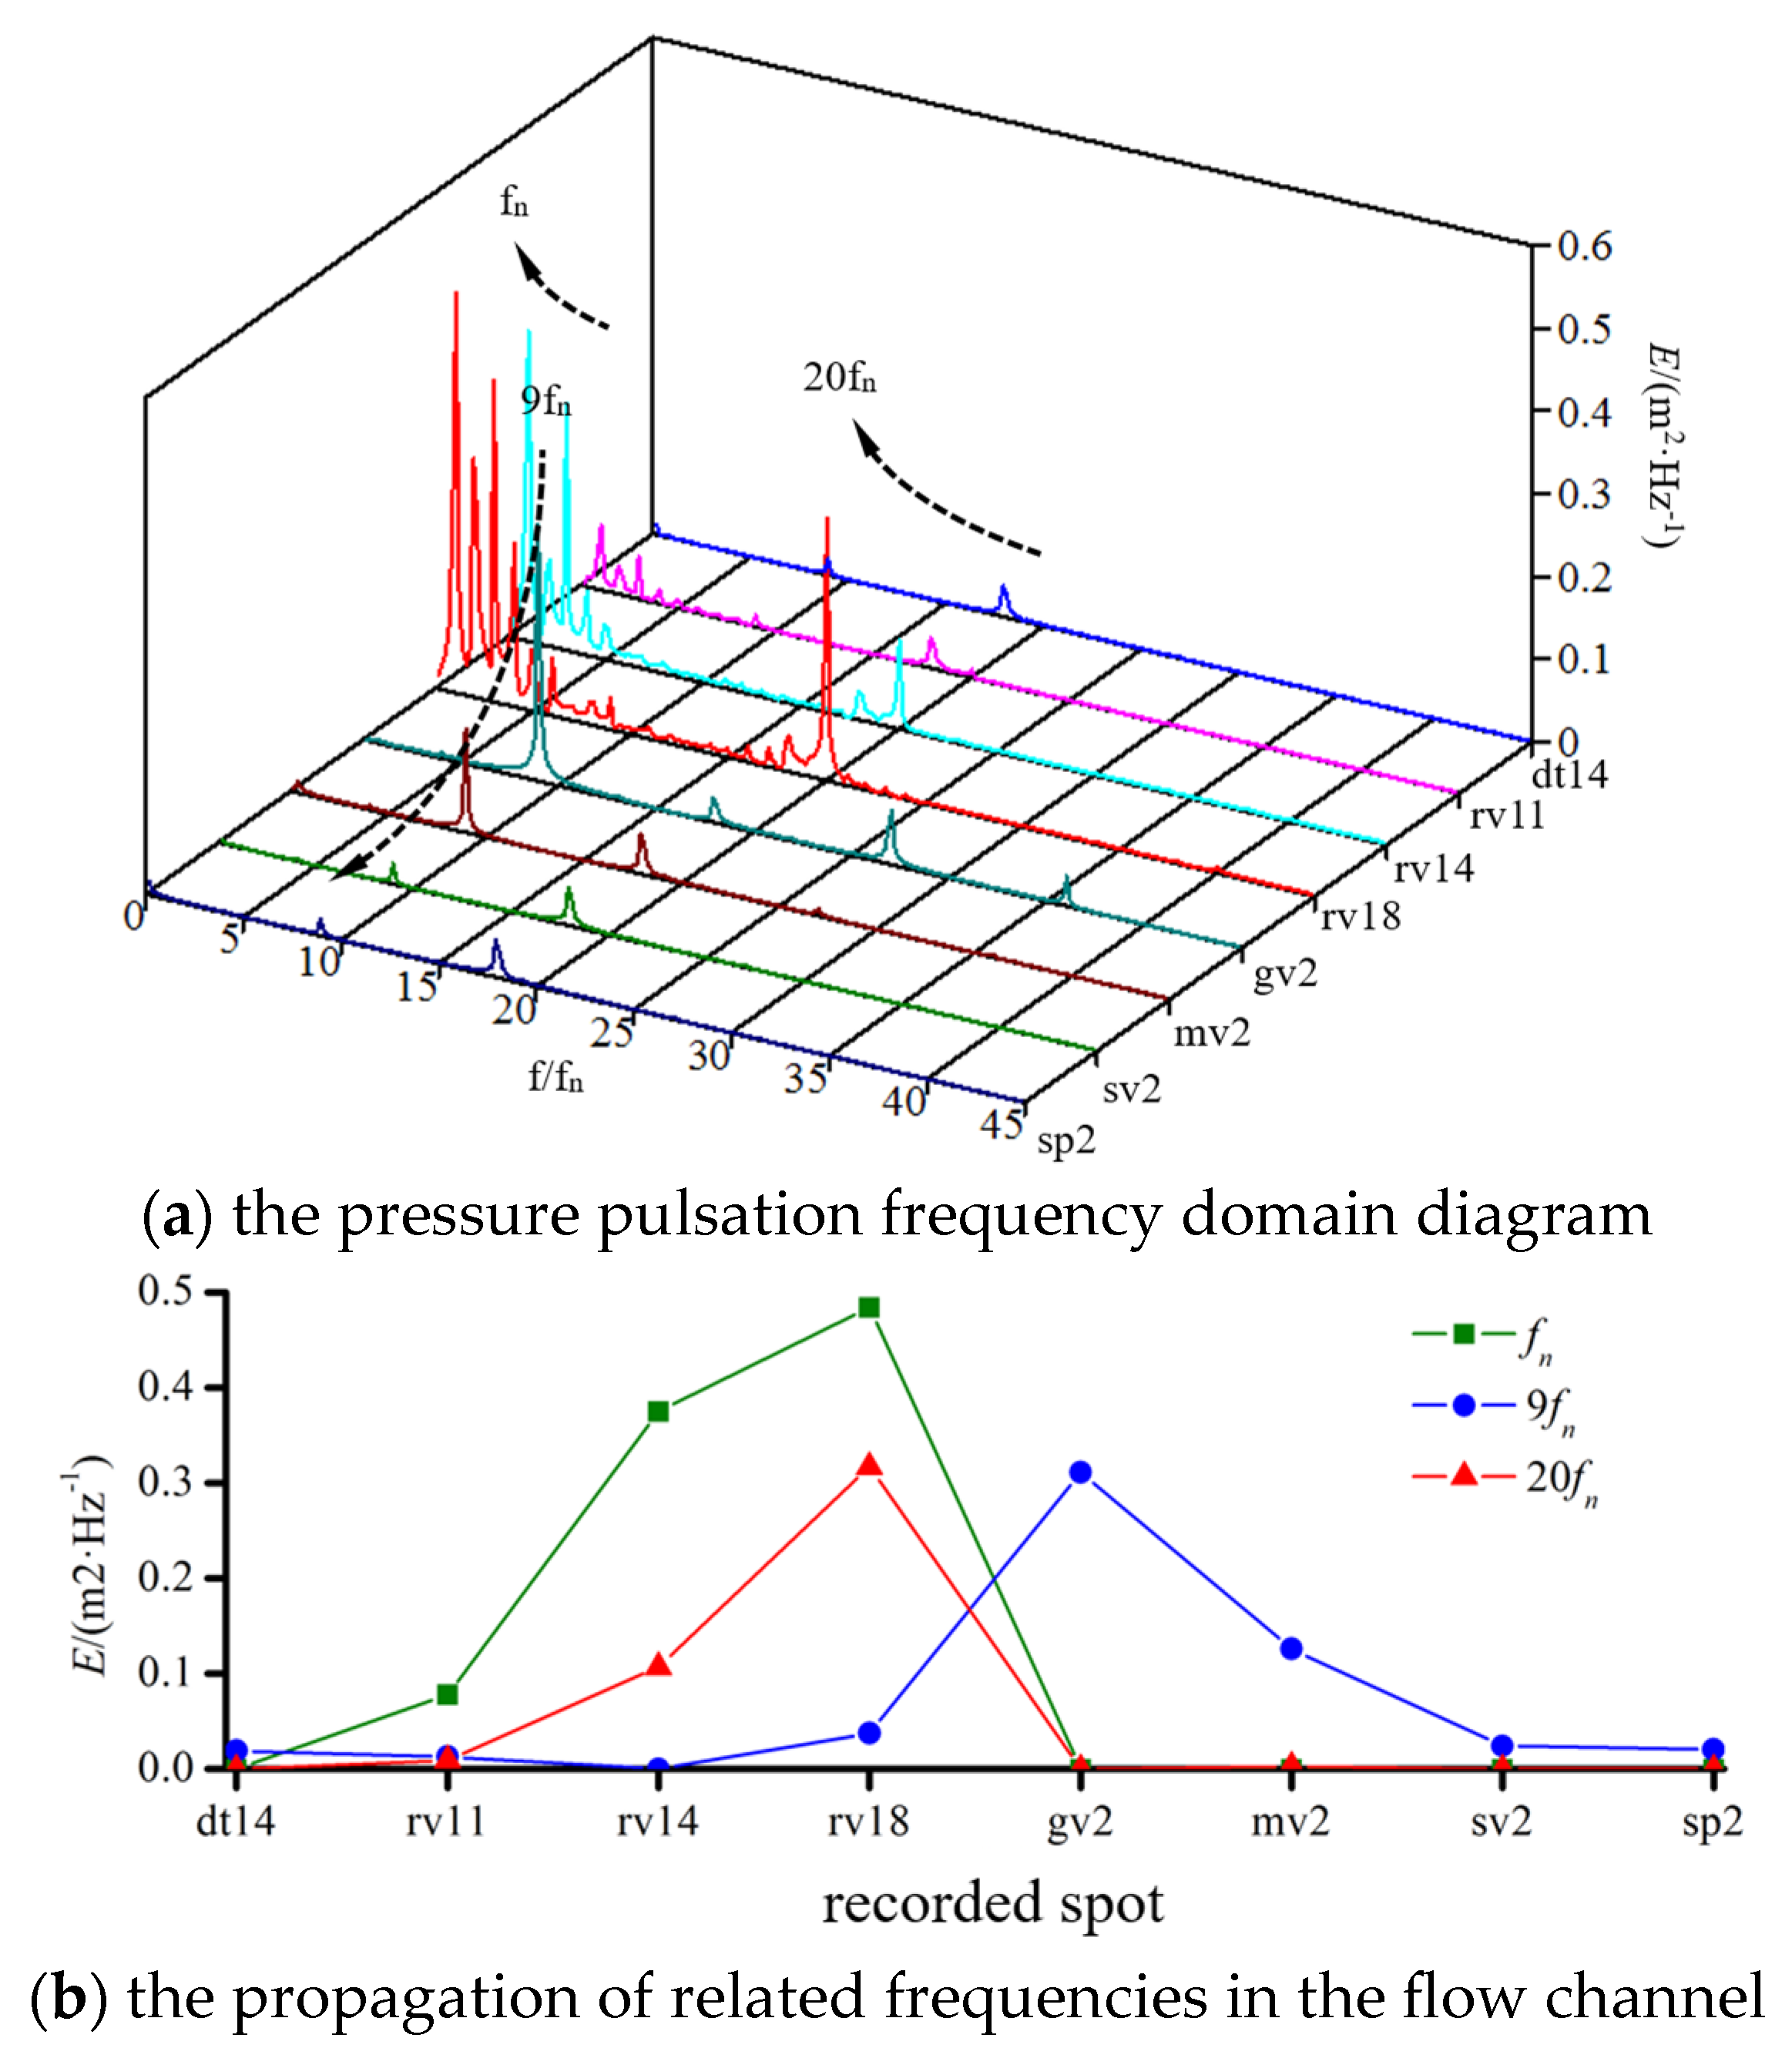
5.2. Pressure Pulsation Characteristics under Optimal Flow Conditions
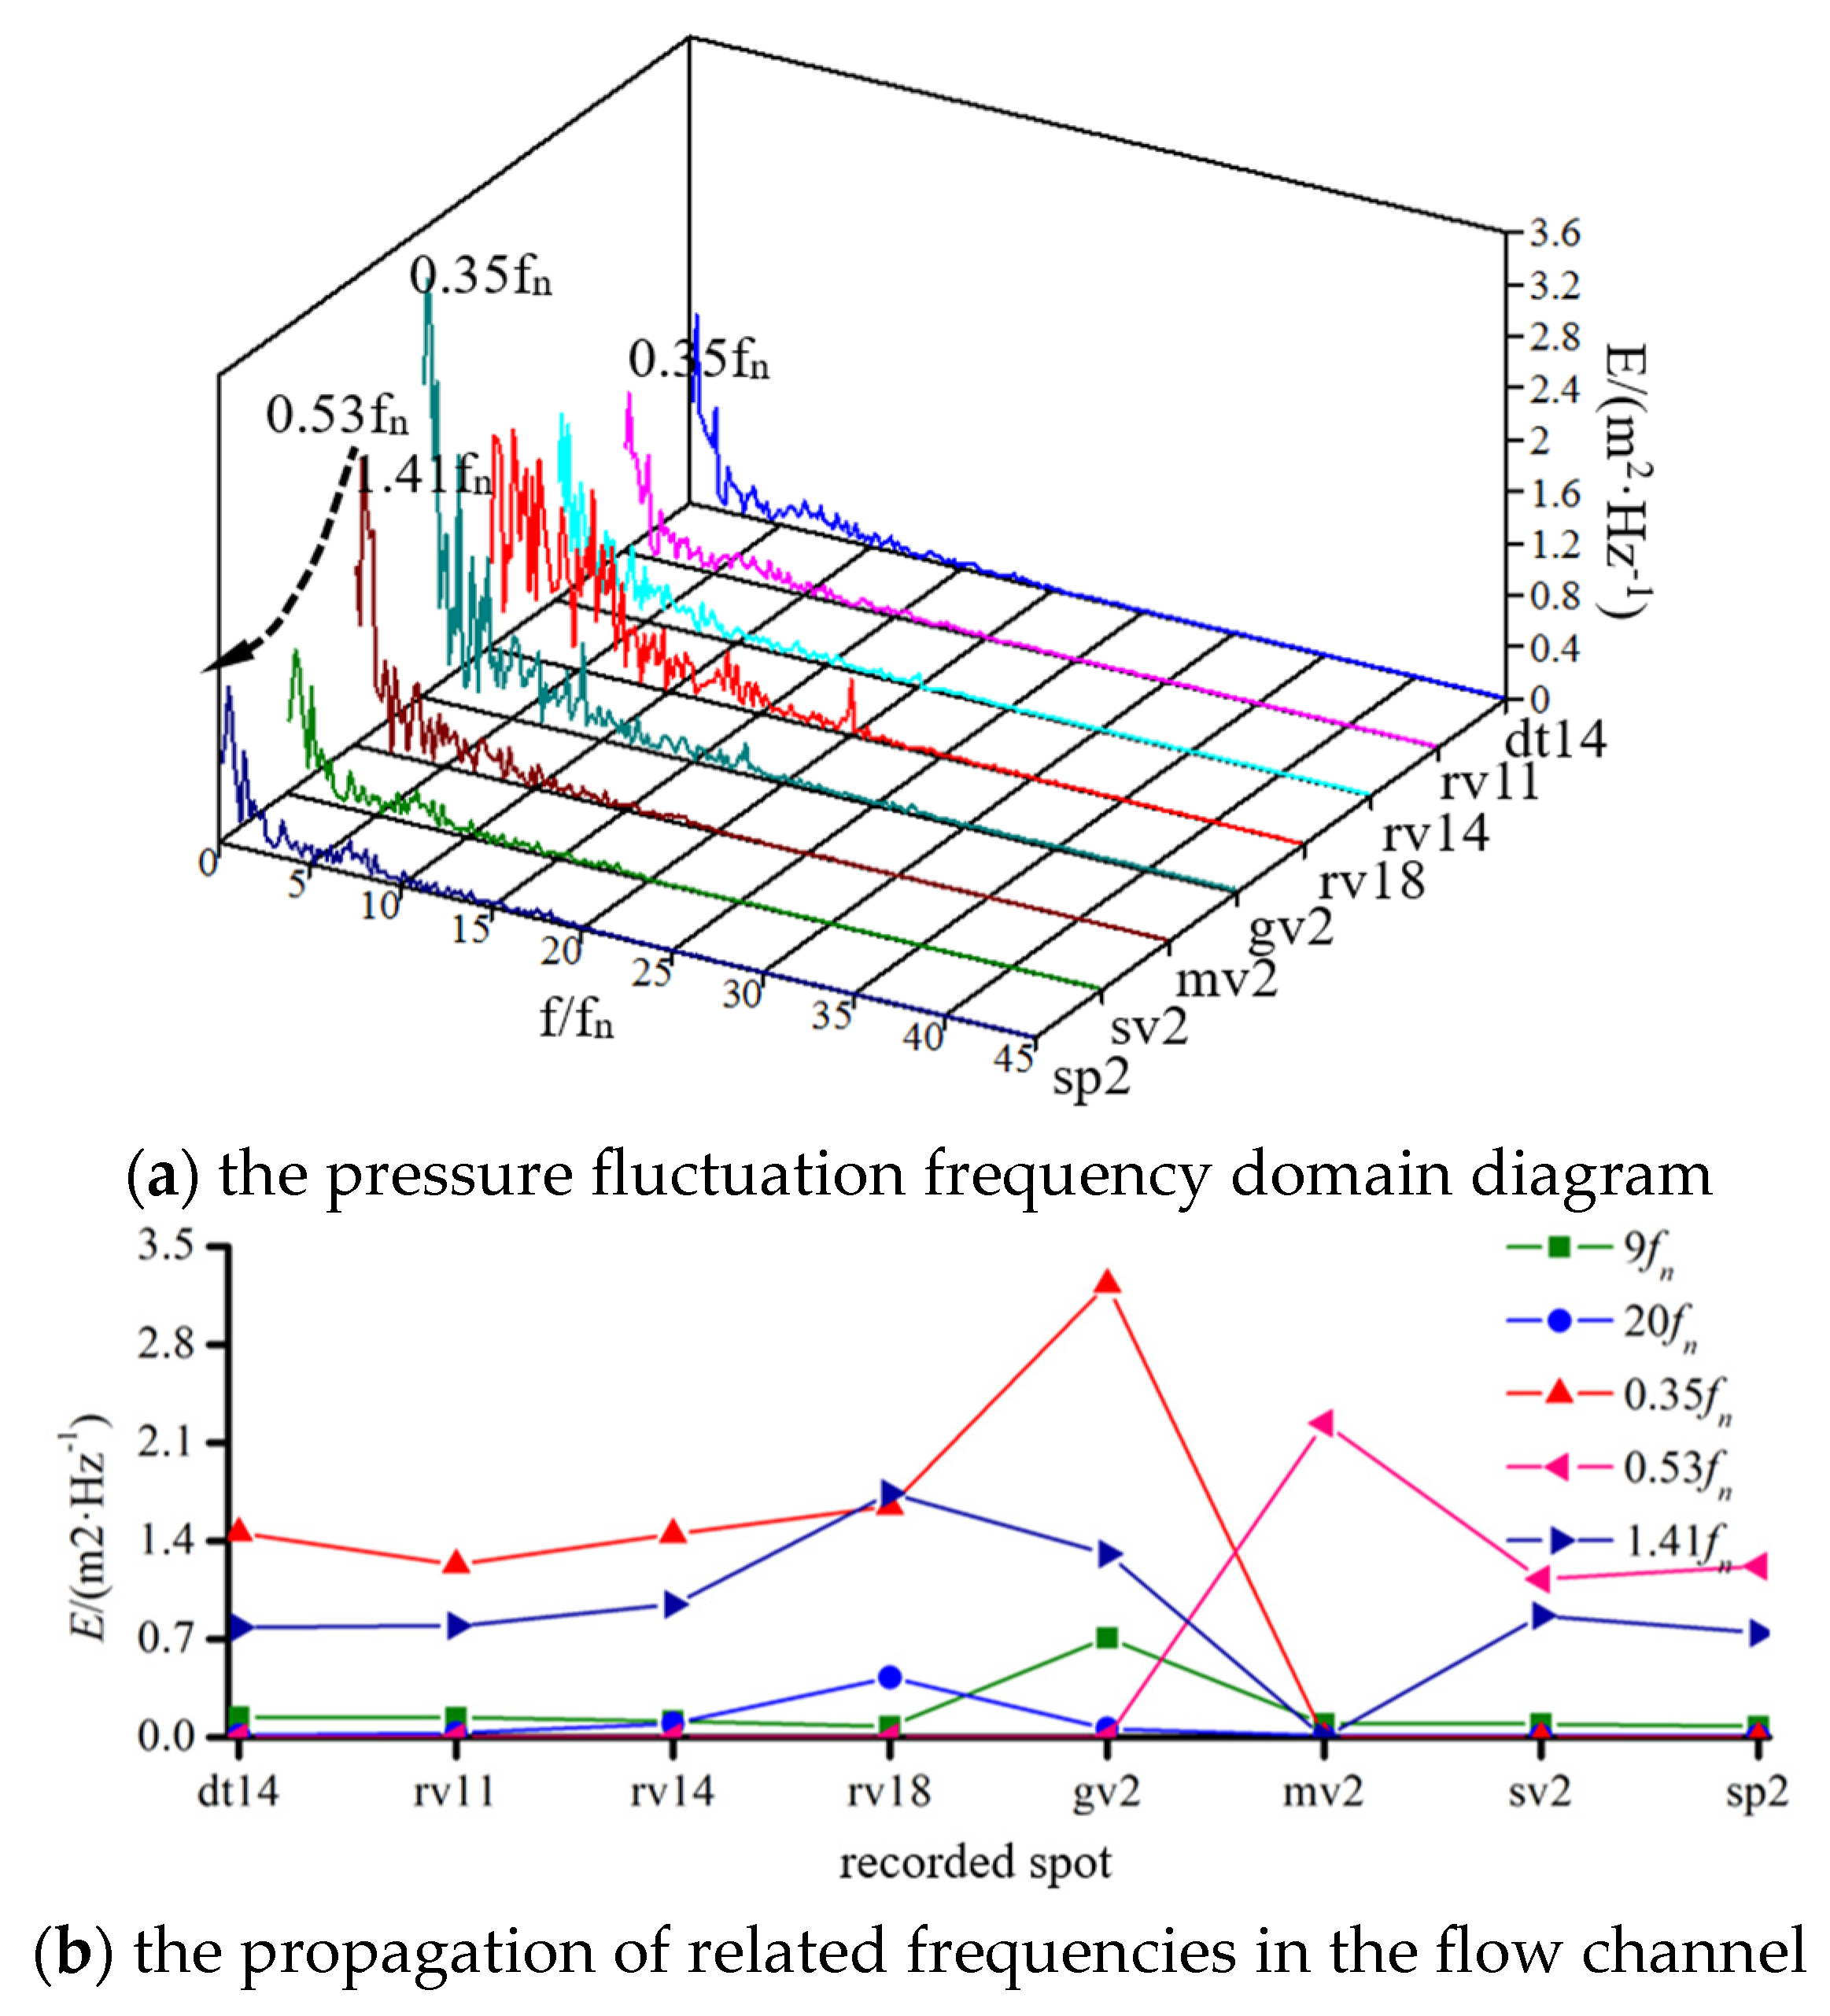
5.3. Pressure Pulsation Characteristics under Partial Load Conditions
6. Conclusions
Author Contributions
Funding
Data Availability Statement
Conflicts of Interest
References
- Binama, M.; Kan, K.; Chen, H.-X.; Zheng, Y.; Zhou, D.; Su, W.-T.; Muhirwa, A.; Ntayomba, J. Flow Instability Transferability Characteristics within a Reversible Pump Turbine (RPT) under Large Guide Vane Opening (GVO). Renew. Energy 2021, 179, 285–307. [Google Scholar] [CrossRef]
- Schill, W.-P.; Zerrahn, A. Long-Run Power Storage Requirements for High Shares of Renewables: Results and Sensitivities. Renew. Sustain. Energy Rev. 2018, 83, 156–171. [Google Scholar] [CrossRef]
- Schmidt, J.; Kemmetmüller, W.; Kugi, A. Modeling and Static Optimization of a Variable Speed Pumped Storage Power Plant. Renew. Energy 2017, 111, 38–51. [Google Scholar] [CrossRef]
- Tao, R.; Xiao, R.; Wang, F.; Liu, W. Cavitation Behavior Study in the Pump Mode of a Reversible Pump-Turbine. Renew. Energy 2018, 125, 655–667. [Google Scholar] [CrossRef]
- Shi, G.; Hao, Z.; Peng, X.; Wen, H.; Lv, W.; Fu, J. Analysis of Vortex Characteristics in the S-Shaped Region of a Reversible Pump-Turbine with Different Guide Vane Openings Based on Omega Vortex Identification Method. J. Energy Storage 2024, 84, 110921. [Google Scholar] [CrossRef]
- Nasir, J.; Javed, A.; Ali, M.; Ullah, K.; Kazmi, S.A.A. Capacity Optimization of Pumped Storage Hydropower and Its Impact on an Integrated Conventional Hydropower Plant Operation. Appl. Energy 2022, 323, 119561. [Google Scholar] [CrossRef]
- Sawle, Y.; Gupta, S.C.; Bohre, A.K. Review of Hybrid Renewable Energy Systems with Comparative Analysis of Off-Grid Hybrid System. Renew. Sustain. Energy Rev. 2018, 81, 2217–2235. [Google Scholar] [CrossRef]
- Tao, R.; Song, X.; Ye, C. Pumped Storage Technology, Reversible Pump Turbines and Their Importance in Power Grids. Water 2022, 14, 3569. [Google Scholar] [CrossRef]
- Zuo, Z.; Fan, H.; Liu, S.; Wu, Y. S-Shaped Characteristics on the Performance Curves of Pump-Turbines in Turbine Mode—A Review. Renew. Sustain. Energy Rev. 2016, 60, 836–851. [Google Scholar] [CrossRef]
- Olimstad, G.; Nielsen, T.; Børresen, B. Dependency on Runner Geometry for Reversible-Pump Turbine Characteristics in Turbine Mode of Operation. J. Fluids Eng. 2012, 134, 121102. [Google Scholar] [CrossRef]
- Cavazzini, G.; Houdeline, J.-B.; Pavesi, G.; Teller, O.; Ardizzon, G. Unstable Behaviour of Pump-Turbines and Its Effects on Power Regulation Capacity of Pumped-Hydro Energy Storage Plants. Renew. Sustain. Energy Rev. 2018, 94, 399–409. [Google Scholar] [CrossRef]
- Zhang, W.; Chen, Z.; Zhu, B.; Zhang, F. Pressure Fluctuation and Flow Instability in S-Shaped Region of a Reversible Pump-Turbine. Renew. Energy 2020, 154, 826–840. [Google Scholar] [CrossRef]
- Pang, S.; Zhu, B.; Shen, Y.; Chen, Z. S-Shaped Characteristics of Pump Turbine with Large Guide Vane Opening by Experimental and Numerical Analysis. AIP Adv. 2023, 13, 015201. [Google Scholar] [CrossRef]
- Hu, J.; Zhao, Z.; He, X.; Zeng, W.; Yang, J.; Yang, J. Design Techniques for Improving Energy Performance and S-Shaped Characteristics of a Pump-Turbine with Splitter Blades. Renew. Energy 2023, 212, 333–349. [Google Scholar] [CrossRef]
- Xu, L.; Kan, K.; Zheng, Y.; Liu, D.; Binama, M.; Xu, Z.; Yan, X.; Guo, M.; Chen, H. Rotating Stall Mechanism of Pump-Turbine in Hump Region: An Insight into Vortex Evolution. Energy 2024, 292, 130579. [Google Scholar] [CrossRef]
- Qin, Y.; Li, D.; Zhu, Y.; Wang, H.; Wei, X. Influence of Geometric Factors at Runner Outlet on the Hump Characteristics of a Pump-Turbine. Sustain. Energy Technol. Assess. 2022, 51, 101890. [Google Scholar] [CrossRef]
- Li, D.; Gong, R.; Wang, H.; Xiang, G.; Wei, X.; Qin, D. Entropy Production Analysis for Hump Characteristics of a Pump Turbine Model. Chin. J. Mech. Eng. 2016, 29, 803–812. [Google Scholar] [CrossRef]
- Yang, J.; Pavesi, G.; Yuan, S.; Cavazzini, G.; Ardizzon, G. Experimental Characterization of a Pump–Turbine in Pump Mode at Hump Instability Region. J. Fluids Eng. 2015, 137, 051109. [Google Scholar] [CrossRef]
- Deyou, L.; Hongjie, W.; Gaoming, X.; Ruzhi, G.; Xianzhu, W.; Zhansheng, L. Unsteady Simulation and Analysis for Hump Characteristics of a Pump Turbine Model. Renew. Energy 2015, 77, 32–42. [Google Scholar] [CrossRef]
- Jia, J.; Zhang, J.; Qu, Y.; Cai, H.; Chen, S. Study on Hump Characteristics of Pump Turbine with Different Guide Vane Exit Angles. IOP Conf. Ser. Earth Environ. Sci. 2019, 240, 072038. [Google Scholar] [CrossRef]
- Li, D.; Zhu, Y.; Lin, S.; Gong, R.; Wang, H.; Luo, X. Cavitation Effects on Pressure Fluctuation in Pump-Turbine Hump Region. J. Energy Storage 2022, 47, 103936. [Google Scholar] [CrossRef]
- Li, D.; Song, Y.; Lin, S.; Wang, H.; Qin, Y.; Wei, X. Effect Mechanism of Cavitation on the Hump Characteristic of a Pump-Turbine. Renew. Energy 2021, 167, 369–383. [Google Scholar] [CrossRef]
- Fu, X.; Li, D.; Wang, H.; Zhang, G.; Li, Z.; Wei, X. Influence of the Clearance Flow on the Load Rejection Process in a Pump-Turbine. Renew. Energy 2018, 127, 310–321. [Google Scholar] [CrossRef]
- Qin, Y.; Li, D.; Wang, H.; Liu, Z.; Wei, X.; Wang, X.; Yang, W. Comprehensive Hydraulic Performance Improvement in a Pump-Turbine: An Experimental Investigation. Energy 2023, 284, 128550. [Google Scholar] [CrossRef]
- Hu, D.; Cheng, Y.; Zhang, P.; Wang, X.; Ding, J.; Zhang, X. Distribution Features of Flow Patterns and Pressure Pulsations of Pump-Turbine in Five Operating Modes on the Four-Quadrant Plane. Front. Energy Res. 2022, 10, 880293. [Google Scholar] [CrossRef]
- Ma, Z.; Zhu, B. Pressure Fluctuations in Vaneless Space of Pump-Turbines with Large Blade Lean Runners in the S-Shaped Region. Renew. Energy 2020, 153, 1283–1295. [Google Scholar] [CrossRef]
- Guo, L.; Liu, J.; Wang, L.; Qin, D.; Wei, X. Pressure Fluctuation Propagation of a Pump Turbine at Pump Mode under Low Head Condition. Sci. China Technol. Sci. 2014, 57, 811–818. [Google Scholar] [CrossRef]
- Vagnoni, E.; Andolfatto, L.; Guillaume, R.; Leroy, P.; Avellan, F. Interaction of a Rotating Two-Phase Flow with the Pressure and Torque Stability of a Reversible Pump-Turbine Operating in Condenser Mode. Int. J. Multiph. Flow 2019, 111, 112–121. [Google Scholar] [CrossRef]
- Maruzewski, P.; Hayashi, H.; Munch, C.; Yamaishi, K.; Hashii, T.; Mombelli, H.P.; Sugow, Y.; Avellan, F. Turbulence Modeling for Francis Turbine Water Passages Simulation. IOP Conf. Ser. Earth Environ. Sci. 2010, 12, 012070. [Google Scholar] [CrossRef]
- Li, D.; Qin, Y.; Wang, J.; Zhu, Y.; Wang, H.; Wei, X. Optimization of Blade High-Pressure Edge to Reduce Pressure Fluctuations in Pump-Turbine Hump Region. Renew. Energy 2022, 181, 24–38. [Google Scholar] [CrossRef]
- Li, D.; Wang, H.; Chen, J.; Nielsen, T.; Qin, D.; Wei, X. Hysteresis Characteristic in the Hump Region of a Pump-Turbine Model. Energies 2016, 9, 620. [Google Scholar] [CrossRef]
- Yu, Z.-F.; Yan, Y.; Wang, W.-Q.; Liu, X.-S. Entropy Production Analysis for Vortex Rope of a Francis Turbine Using Hybrid RANS/LES Method. Int. Commun. Heat Mass Transf. 2021, 127, 10549. [Google Scholar] [CrossRef]
- Menter, F.R. Two-equation eddy-viscosity turbulence models for engineering applications. AIAA J. 1994, 32, 1598–1605. [Google Scholar] [CrossRef]
- Hao, Z.; Shi, G.; Peng, X.; Chai, H.; Lv, W.; Huang, Z. Study on the Influence of Vortex Spatial-Temporal Evolution on the Causes of Hump Region of Pump-Turbine and the Characteristics of Vortex Dynamics. J. Energy Storage 2024, 92, 112297. [Google Scholar] [CrossRef]


| Component | Symbol | Value |
|---|---|---|
| Runner inlet dia. (mm) | D1 | 470 |
| Runner outlet dia. (mm) | Dt | 300 |
| Rated rotational speed (rpm) | Nd | 1200 |
| Nominal head (m) | H | 30 |
| Runner blade number (-) | Z | 9 |
| Stay vane number (-) | Z1 | 20 |
| Guide vane number (-) | Z2 | 20 |
| Parameter | Aspect Ratio | Skewness |
|---|---|---|
| Volute | 3.5 | 0.16 |
| Stay vanes | 5.1 | 0.19 |
| Guide vanes | 4.6 | 0.03 |
| Runner | 4.4 | 0.05 |
| Draft tube | 3.7 | 0.08 |
Disclaimer/Publisher’s Note: The statements, opinions and data contained in all publications are solely those of the individual author(s) and contributor(s) and not of MDPI and/or the editor(s). MDPI and/or the editor(s) disclaim responsibility for any injury to people or property resulting from any ideas, methods, instructions or products referred to in the content. |
© 2024 by the authors. Licensee MDPI, Basel, Switzerland. This article is an open access article distributed under the terms and conditions of the Creative Commons Attribution (CC BY) license (https://creativecommons.org/licenses/by/4.0/).
Share and Cite
Zheng, K.; Chen, L.; Ren, S.; Xiao, W.; Xiao, Y.; Rai, A.K.; Shi, G.; Hao, Z. Pressure Fluctuation Characteristics of a Pump-Turbine in the Hump Area under Different Flow Conditions. J. Mar. Sci. Eng. 2024, 12, 1654. https://doi.org/10.3390/jmse12091654
Zheng K, Chen L, Ren S, Xiao W, Xiao Y, Rai AK, Shi G, Hao Z. Pressure Fluctuation Characteristics of a Pump-Turbine in the Hump Area under Different Flow Conditions. Journal of Marine Science and Engineering. 2024; 12(9):1654. https://doi.org/10.3390/jmse12091654
Chicago/Turabian StyleZheng, Kai, Liu Chen, Shaocheng Ren, Wei Xiao, Yexiang Xiao, Anant Kumar Rai, Guangtai Shi, and Zhengkai Hao. 2024. "Pressure Fluctuation Characteristics of a Pump-Turbine in the Hump Area under Different Flow Conditions" Journal of Marine Science and Engineering 12, no. 9: 1654. https://doi.org/10.3390/jmse12091654
APA StyleZheng, K., Chen, L., Ren, S., Xiao, W., Xiao, Y., Rai, A. K., Shi, G., & Hao, Z. (2024). Pressure Fluctuation Characteristics of a Pump-Turbine in the Hump Area under Different Flow Conditions. Journal of Marine Science and Engineering, 12(9), 1654. https://doi.org/10.3390/jmse12091654