Article

Coupled Motion Response Analysis for Dynamic Target Salvage under Wave Action

by
Gang Sun
1,2,3,
Shengtao Chen
1,2,3,*,
Hongkun Zhou
4 and
Fei Wan
4
1
College of Naval Architecture and Ocean Engineering, Dalian Maritime University, Dalian 116026, China
2
Liaoning Provincial Key Laboratory of Rescue and Salvage Engineering, Dalian Maritime University, Dalian 116026, China
3
International Joint Research Centre for Subsea Engineering Technology and Equipment, Dalian Maritime University, Dalian 116026, China
4
National Engineering Laboratory for Test and Experiment Technology of Marine Engineering Equipment, Kunming 650051, China
*
Author to whom correspondence should be addressed.
J. Mar. Sci. Eng. 2024, 12(9), 1688; https://doi.org/10.3390/jmse12091688
Submission received: 19 August 2024 / Revised: 18 September 2024 / Accepted: 18 September 2024 / Published: 23 September 2024
(This article belongs to the Special Issue Advances in Marine Engineering Hydrodynamics)

Abstract

:
The strategic recovery of buoys is a critical task in executing deep-sea research missions, as nations extend their exploration of marine territories. This study primarily investigates the dynamics of remotely operated vehicle (ROV)-assisted salvage operations for floating bodies during the recovery of dynamic maritime targets. It focuses on the hydrodynamic coefficients of dual floating bodies in this salvage process. The interaction dynamics of the twin floats are examined using parameters such as the kinematic response amplitude operator (RAO), added mass, damping coefficient, and mean drift force. During the “berthing stage”, when the double floats are at Fr = 0.15–0.18, their roll and yaw Response Amplitude Operators are diminished, resulting in smoother motion. Thus, the optimal berthing speed range for this stage is Fr = 0.15–0.18. During the “side-by-side phase”, the spacing between the ROV and FLOAT under wave action should be approximately 0.4 L to 0.5 L. The coupled motion of twin floating bodies under the influence of following waves can further enhance their stability. The ideal towing speed during the “towing phase” is Fr = 0.2. This research aims to analyze the mutual influence between two floating bodies under wave action. By simulating the coupled motion of dual dynamic targets, we more precisely assess the risks and challenges inherent in salvage operations, thus providing a scientific basis for the design and optimization of salvage strategies.

1. Introduction

Marine scientific research and salvage is not only a scientific and technological activity but also a platform for countries to demonstrate their marine scientific research capabilities and international collaboration [1]. China’s manned submersibles, including “Jiaolong”, “Deep Sea Warrior”, and “Struggle”, have made important advances in deep water exploration. At the same time, China actively encourages international cooperation in maritime scientific study. ROVs are essential pieces of maritime salvage equipment. In offshore operations, from the perspective of hydrodynamics, the engineering challenge of ROV salvage can be conceptualized as the interaction between two floating bodies [2]. In the course of marine scientific study, it is required to recover probes or discovered items from the water. This covers the problem of ROV rescue of floating bodies in the sea, which may be simplified to the problem of wave-floating body interaction coupling. For the multi-floating body issue, it is required to address both the coupling between waves and floating bodies, as well as the coupling between floating bodies owing to relative motion. As a result, many researchers have focused on the consequences of wave-multi-floating body coupling and double-floating body mutual motion law [3].

1.1. Theory of Hydrodynamic Interference of Multi-Floating Bodies

The study of multi-floating body hydrodynamic interference theory focuses primarily on the motion of water between the floating bodies and its impact on floating body force and motion. Scholars from both home and abroad have made significant advances in the study of ship motion on waves. After analyzing the hydrodynamically coupled motion of two advancing ships using the two-dimensional slicing method, the motion of multiple adjacent ships is simulated using three-dimensional numerical methods. The free surface Green’s function approach is particularly suited for analyzing the motion on waves issue of a floating body with zero speed, and several numerical solutions have been suggested [4]. Hong [5] conducted a thorough investigation of Green’s function with speed and proposed a stable discrete computing format of the boundary element approach, which was effectively used to calculate the rocking motion of ships with speed. When compared to three-dimensional time domain theory, the Rankine source technique is far more flexible and well suited to handling nonlinear issues. Jun [6] utilized the Rankine source approach to solve the hull surface velocity potential in the near-field and far-field and suggested a new methodology to cope with the hull’s wet surface variations. Today, the majority of researchers employ the Computational Fluid Dynamics (CFD) approach, which is based on complete nonlinear theory and has become one of the most accurate methods for modeling ship wave motion. Kianejad et al. [7] investigated the differences and correlations between model scale effects and the rocking motion and damping properties of a real ship using the CFD approach and discovered a strong link. Hong [8] conducted a systematic investigation of ship hydrodynamic performance using the CFD method, optimizing the ship design and other ways based on the research findings. When investigating the analytical solution for the two-floating-body coupling issue, previous researchers have relied heavily on the premise of potential flow theory. Yang et al. [9] used potential flow theory to develop a theoretical solution to the second-order resonance issue for swaying motion in a three-dimensional liquid tank. Saripilli et al. [10] investigated a hybrid algorithm based on the transient Green’s function of the external ship hydrodynamics solution of viscous flow and the multi-phase interface to capture the volume of fluid (VOF) technique, as well as the effect of swaying and ship motion on the assessment of internal pressure due to wakes. Yuan [11] investigated the coupled motion response using frequency domain potential flow theory and the mooring of FPSOs with varying liquid-carrying rates under the effect of regular and irregular waves using time domain potential flow theory. Xiao et al. [12] showed that the wall shear force has negligible impact on the numerical modeling of liquid chamber swaying using software calculations and that the slip wall may be used as the wall condition.

1.2. Numerical Simulation of Multi-Float Salvage System

With the advancement of computer computing power, numerical approaches have increasingly become the preferred way for studying double-floating bodies. Saghi et al. [13] studied the interaction of waves with floating liquid tanks using the Volume of Fluid (VOF) and Finite Difference Method (FDM). Yu et al. [14] investigated the effect of impermeable and permeable baffles on liquid chamber rocking reduction. Moradi et al. [15] conducted a systematic study on the impact of inlet parameters on gap resonance. Gao et al. [16] employed OpenFOAM to explore gap resonance between two fixed floating bodies induced by regular waves and focused wave groups. Additionally, Gao et al. [17] examined the influence of upstream float motion on gap resonance in a scenario where one float is fixed while the other floats freely. Wu et al. [18] investigated the phenomenon of tank swaying in various shapes using the VOF method, while Saghi et al. [19] used the boundary element method to evaluate the effect of a hydroelastic model proposed in the paper on tank excitation force and peak dynamic pressure. Zhao et al. [20] examined the nonlinear swaying issue of a square tank under external excitation, such as horizontal and rotational excitations, using the boundary element approach. Ning et al. [21] predicted the frequency and patterns of natural liquid shaking in a complicated liquid chamber using a float-type shaking reduction structure and a numerical model created using the boundary element approach. Yuan [12] investigated the coupled motion response using frequency domain potential flow theory and the mooring of an FPSO with varying liquid loading rates under the effect of regular and irregular waves using time domain potential flow theory. Xiao et al. [13] showed that the wall shear force has negligible impact on the numerical modeling of liquid chamber sway using CFD software calculations and that the sliding wall may be used as the wall condition. In the event of short side-by-side spacing, there will be complicated hydrodynamic interactions between the two floats, and an incorrect estimate of the interaction effects may result in unintended damage or mutual collision of the ships [22]. At a specific incident wave frequency, the free liquid surface within the spacing between floating bodies will resonate, leading to intense free surface motion, which profoundly affects the relative motion of the closely positioned floating bodies and the stress conditions on the mooring ropes [23]. Zhang [24] employed CFD to model an articulated multi-floating body unmanned platform system. Based on the calculation findings, the motion laws of floating bodies at all levels of the sea state were summarized, and three system-optimized articulation strategies were proposed. Koop et al. [25] studied the scaling and shading effects of flow load in a typical offshore ship alongside configuration using model testing and CFD computations. Jiang employed a Navier-Stokes (NS) equation solver in conjunction with a dynamic mooring model to estimate the hydrodynamic damping of buoys across three distinct mooring configurations [26].

1.3. Model Test of Multi-Floating Body Salvage System

Regarding model experiments, researchers conducted experimental analysis and study on the linked motion characteristics of a double floating body. The Webb Shipbuilding Research Institute in the United States, the Japan Shipbuilding Research Center, Det Norske Veritas, the China Shipbuilding Research Center, Shanghai Jiaotong, Dalian Maritime, and Harbin Engineering completed the double-float salvage model testing. Delorme et al. [27] conducted a model test to investigate the vertical oscillation dissipation behavior of rectangular water tanks and explore the law of floating body energy dissipation. Igbadumhe et al. [28] conducted roll attenuation tests on two prismatic fuel tank FPSO models with different loading rates. The results indicated that the third-order damping term is crucial for the stability of FPSOs. Sanapal et al. [29] conducted a vibration table experiment to investigate the fluid-structure coupling effect between oscillating fluids and internal structures. Liu Yulong et al. [30] conducted experimental research on the motion response of empty floating tanks and liquid-filled floating tanks under regular waves of different heights and frequencies, taking into account the fluid-structure coupling effects. They found that at a fixed frequency, the motion response of the floating tank exhibits certain nonlinear characteristics due to different incident wave heights. Kawahashi et al. [31] continued to conduct separate tests on FPSO models loaded with liquid and solid cargo to investigate the impact of tank shaking during liquid cargo loading. Finally, regarding the connection between the dual floating bodies, Song created an experimental fluid dynamics model of the dual floating bodies with hinge connections, using hinge connectors to connect the dual module floating bodies, and tested them in a towing pool under various wave conditions [32].
By examining theories, numerical simulations, and model tests of multi-float salvage systems both domestically and internationally, this paper lays a solid foundation for devising strategies to prevent float collisions. The floating body salvage system detailed in this study primarily consists of an ROV, a salvaged floating body named FLOAT, and a flexible connection cable. Under wave action, salvaged floating bodies are highly vulnerable to the effects of wind and waves. Due to its smaller size and mass, the FLOAT is more prone to interference and motion deviations caused by the ROV compared to the ROV itself. Consequently, any alteration in the motion state of the ROV, the FLOAT, and the flexible connecting cables will impact the overall motion response of the system. Building upon previous research, this study investigates the coupled motion response of ROVs and salvaged floating bodies under wave action during the berthing, side-by-side, and towing phases. Through dynamic simulation, this paper explores the motion of twin floating bodies in the three stages of salvage, unveiling their hydrodynamic performance under wave action and the interaction patterns in their coupled motion. The thorough analysis of coupled motion response in dynamic target salvage provides a crucial reference for designing salvage schemes in practical engineering.

2. Modelling and Numerical Simulation Methods

2.1. Floating Body Model

Using the two-float system as an example, it is assumed that the two floats are in a micro-amplitude simple harmonic oscillatory motion near their equilibrium position due to wave action. To characterize the motion of the floating body, three coordinate systems must be considered: a global coordinate system O X Y Z fixed to the earth, and two local coordinate systems O 1 X 1 Y 1 Z 1 and O 2 X 2 Y 2 Z 2 attached to the floating body, as seen in Figure 1. The global coordinate system’s origin is established on the undisturbed free sea surface, while the two local coordinate systems’ origins are positioned at the centers of gravity of the two floats, with the Z-axis vertically upwards. The distances from the origins of the local coordinate systems of the two floating bodies to the origin of the global coordinate system are equal. Figure 2 illustrates a schematic representation of the dynamic target salvage system.
The diving equipment employed in this article is a ROV. ROVs are often constructed modularly and outfitted with high-resolution color cameras and multi-degree-of-freedom robotic arms to undertake underwater engineering tasks [33]. To investigate the dual float motion response of the ROV during the salvage operation of floating objects, the conceptualization and design of underwater robots were conducted, as illustrated in Figure 1. Table 1 presents the key parameters of the underwater ROVs, while Table 2 presents the main parameters of the floating object being salvaged, FLOAT.

2.2. Theory

2.2.1. Governing Equation

The focus of this paper is on all incompressible viscous fluids, with the fundamental governing equations consisting of the continuity equation, the conservation of momentum, and the conservation of energy. The formula for the RANS (Reynolds-averaged Navier–Stokes) equation is as follows [34]:
u i x i = 0
ρ u i t + ρ u j u i x j = p x i + x j ( μ u i x j ρ u i u j ¯ )
where u i , u j are the components of velocity in the direction of the coordinate axis, ρ is the density of the fluid, p is the pressure, μ is the coefficient of dynamic viscosity of the fluid, and t is the time. Where u i , u j and p are time-averaged quantities, the “-” sign above the time-averaged physical quantity is omitted for simplicity.
In this article, the finite volume technique (FVM) is utilized to discretize the RANS equations for the numerical analysis of the double floating body, and the turbulence model selected is the SST k-ω model. To address the coupling between pressure and velocity, the semi-implicit method for pressure dependent equations (PIMPLE) algorithm is used. The separated flow model employs a separation approach for solving equations and utilizes a second-order upwind scheme for discretizing the convection term. The volume of fluid (VOF) method is used to precisely depict the evolution of the free surface in two-phase flow. The floating body’s motion is accounted for using a Dynamic Fluid Interaction (DFBI) module with overlapping grids.

2.2.2. Hydrodynamic Coefficient and Wave Force

Using the Bernoulli equation, along with the incident and diffraction potentials, wave forces acting on the ROV (A) and the FLOAT (B) can be separately computed. When calculating the interaction between two floating bodies, it is necessary to consider the hydrodynamic coefficients generated by coupling effects, such as added mass and damping coefficient [35]:
a i j A = R e ρ S O A   ϕ j ϕ i i d s
b i j A = 1 ω R e ρ S O A   ϕ j ϕ i i d s
When i = 1~6, j = 1~6, represent the additional mass and radiation damping created by the motion of the floating body A on itself, and when j = 7~12, mark the additional mass and radiation damping caused by the motion of the floating body B on the floating body A.
a i j B = R e ρ S O B   ϕ j ϕ i i d s
b i j B = 1 ω R e ρ S O B   ϕ j ϕ i i d s
When i = 1~6, j = 1~6, denote the additional mass and radiation damping produced by the motion of the floating body B on itself; when j = 7~12, denote the additional mass and radiation damping produced by the motion of the floating body A on the floating body B.
Where Re denotes the real part, ϕ j denotes the radiation potential generated when the floating body oscillates at unit velocity in the j -direction, ρ is the density of the liquid, S O A is the wet surface area of the floating body for Float A, and S O B is the wet surface area of the floating body for Float B. The damping coefficients for the floating body are as follows.
According to the boundary conditions satisfied by the velocity potential and Green’s function, the added mass has a symmetric relationship with the damping coefficient, as shown in the following equation.
a i j A = a j i B , b i j A = b j i B
This formula demonstrates that the motion of floating body B in direction j results in additional mass and radiation damping for floating body A in direction i. Conversely, the motion of floating body A in direction i also results in additional mass and radiation damping for floating body B in direction j.

2.2.3. Multi-Float Motion Response

Frequency domain equations of motion for a two-float salvage system:
ω 2 M ( i ) + α m n ( i i ) + m ω c m n ( i i ) + C ( i ) X ( i ) + ω 2 α m n ( i j ) + m ω c m n ( i j ) X ( j ) = F w ( i )
ω 2 M ( j ) + a m n ( j j ) + m ω c m n ( j j ) + C ( j ) X ( j ) + ω 2 a m n ( j i ) + m ω c m n ( j i ) X ( i ) = F w ( j )
where i and j stand for the ROV and the FLOAT, respectively, the terms labelled ii or jj are the same as those in the single-floating-body case, the term labelled ij represents the term generated by the influence of the ROV and FLOAT, the term labelled ji represents the term generated by the FLOAT under the influence of the ROV, and C is the static restoring force matrix of the floating body.
By solving Equations (8) and (9), the six-degrees-of-freedom kinematic Response Amplitude Operator (RAO) of the two floats can be obtained.

2.2.4. Wave Mean Wave Mean Drift Force Drift Force

The mid-field approach, which combines the benefits of the near-field and far-field methods, is applied in this study. For the regular wave issue, the average drift force in the horizontal direction may be simplified to the integration of the first-order velocity potential and the derivative of the velocity potential on the control surface [36], with the formulation being as follows:
  F 1 x = ρ ω 2 4 g Γ 0 φ φ * n 1 d l + ρ 4 S 0   φ n φ * x + φ * n φ x φ φ * n 1 d s
F 1 y = ρ ω 2 4 g Γ 0 φ φ * n 2 d l + ρ 4 Γ 0   φ n φ * y + φ * n φ y φ φ * n 2 d s
M 1 z = ρ ω 2 4 g Γ 0 φ φ * n 6 d l + ρ 4 S 0   φ n x φ * y y φ * x + φ * n x φ y y φ x φ φ * n 6 d s
where φ * represents the conjugate complex of φ and ω is the wave circle frequency.

3. Numerical Implementation and Validation

3.1. Numerical Simulation

In this section, the scale of the model used in numerical simulation matches that of the experiment at a 1:1 ratio. During the towing phase, a 1.2-m-long flexible cable is employed to replace the link between the ROV and the rescued floats. The ambient circumstances are adjusted at a wave height (H) of 0.023 m, a wavelength (L1) of 4.837 m, and a period of 1.76 s. Figure 3 depicts the computational domain and boundary conditions for the numerical model used in this work. The double floats are put on the water’s surface, so they are at the interface of the two fluid layers. In this article, the numerical model of the computational domain is 20 m long, 15 m broad, and 6.5 m high, with a water depth (d1) of 4 m and an upper section exposed to air (d2) of 2.5 m. The generally used approach for selecting the computational domain’s boundary conditions is to designate the front, upper, and lower borders as the velocity intake, the rear boundary as the pressure outlet, and the side boundaries as the symmetry planes. The ROV distance from the pool’s entrance is 1.5 La, the FLOAT distance from the pool outlet is 2.5 La, and the floating body distance from both sides of the pool is 1.5 La.
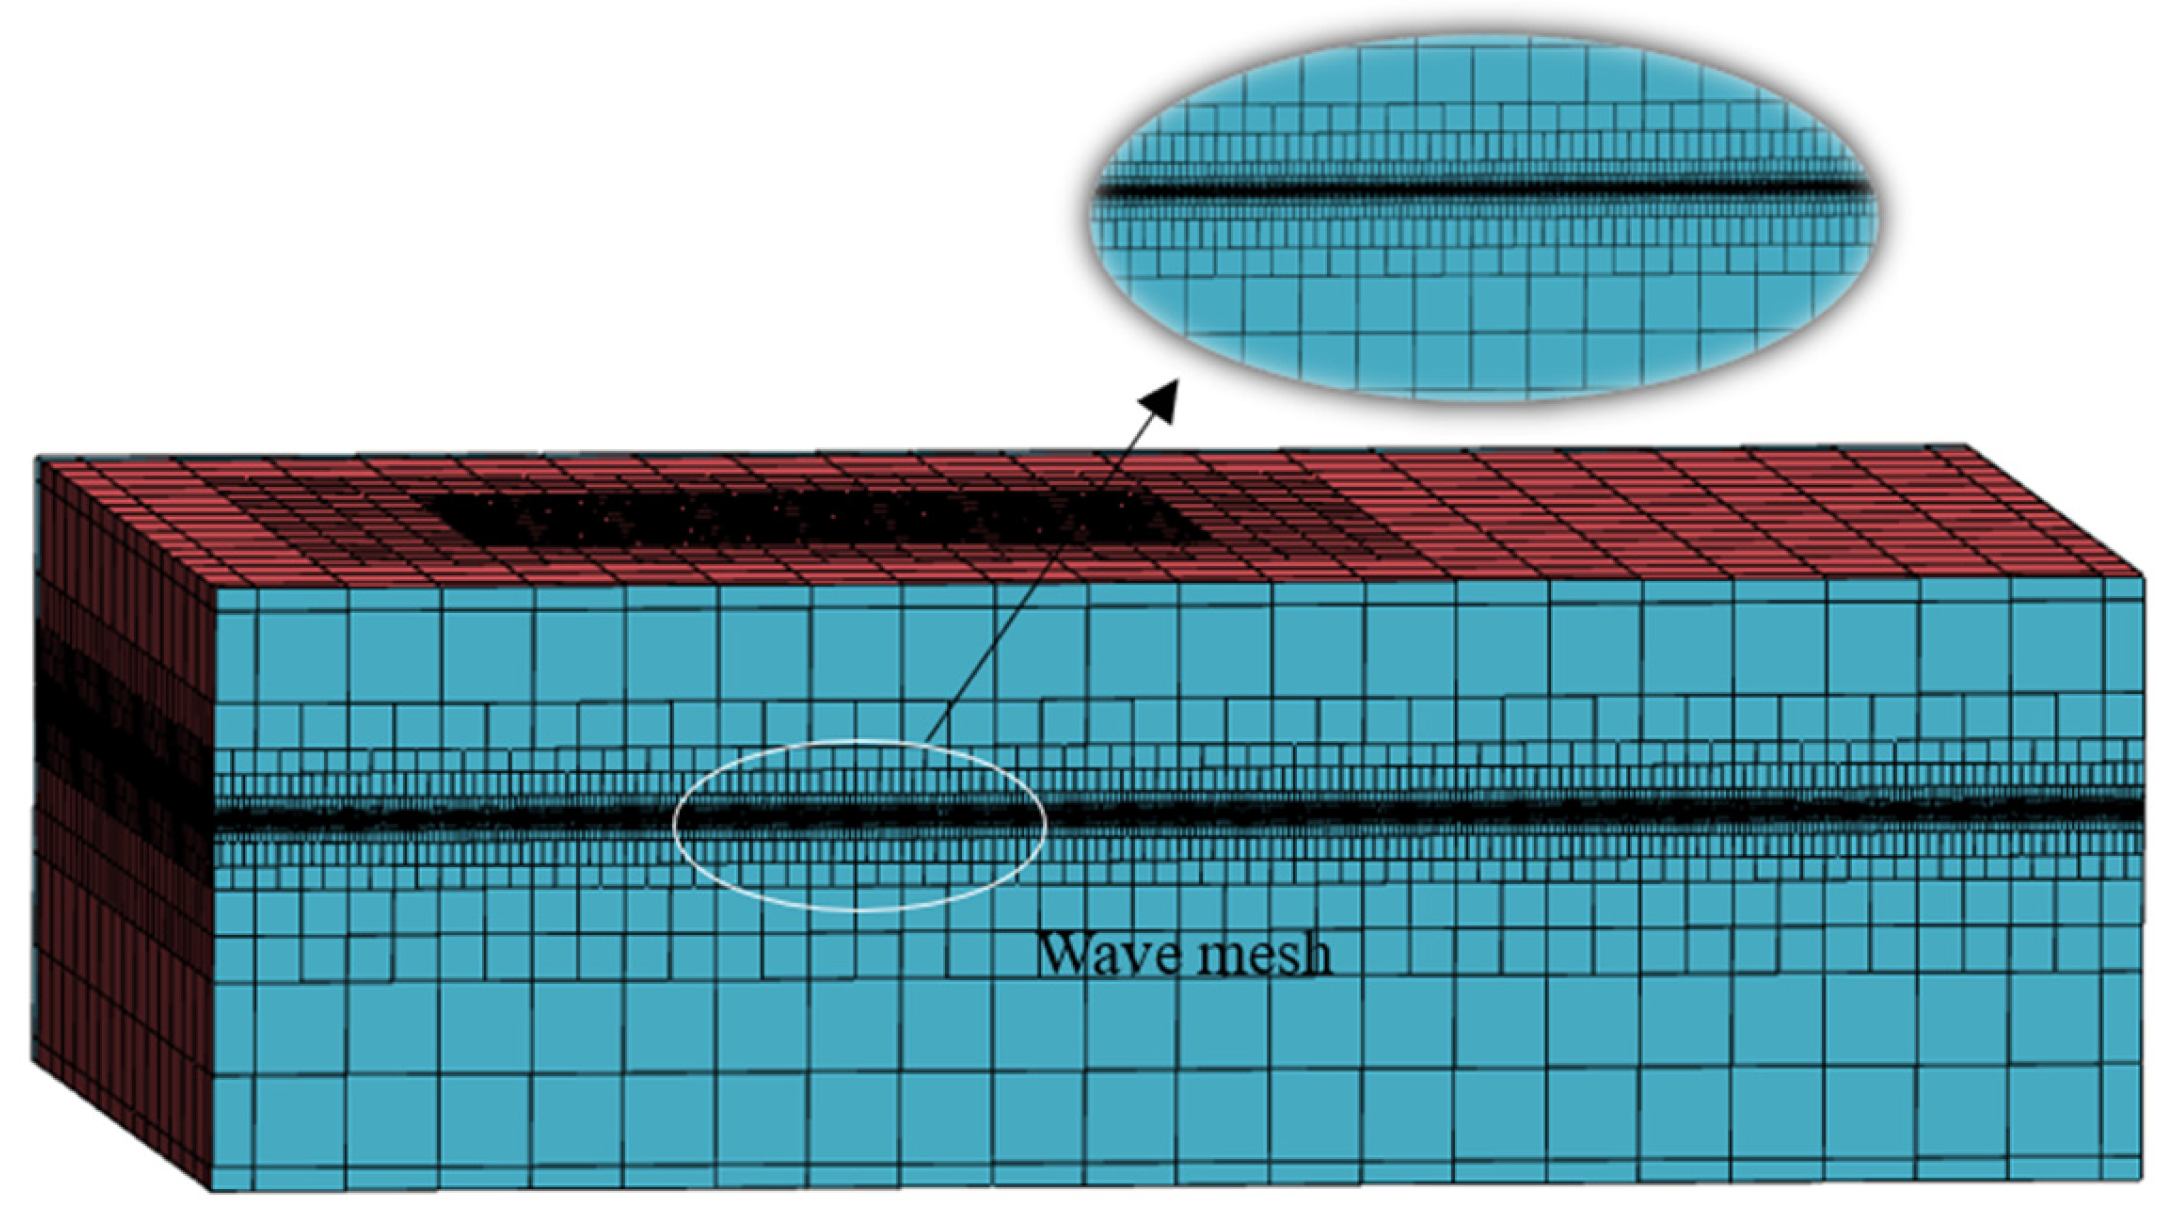
To simulate the model’s motion, the fluid region is divided into three parts: two free-floating body regions, a free surface region, and a navigation wavefront region. Figure 4 illustrates the grid layout within the computational domain and at the waterline. This section’s crucial sections are encrypted, and the encrypted regions are located on the free fluid surface and around the floating body. This research utilized a fully structured overlapping grid approach. This approach individually grids each moving object within the computational domain, allowing for various forms of overlap between the grids. Consequently, overlapping grids are especially well suited for investigating the parameterization issues of complex body motions. The motion response of the double floating body explored in this study includes motions with six degrees of freedom; hence, the overlapping grid approach is used for numerical simulation. Figure 5 shows a grid design of the floating body salvage system for the conventional P2 stage.
During the numerical simulation process, mesh and time-step independence must be validated to identify the optimal number of meshes and fluid time-step size. In the numerical computing realm, selecting a proper grid size is critical in the pre-processing step [37]. To ensure the convergence of the computational grid, it is refined using the fineness ratio specified in the International Tugboat Conference (ITTC)-approved regulations. The grid is refined with r G = 2 in all three directions, while the remaining parameters remain constant. Table 3 demonstrates the grid independence analysis, which includes rough, medium, and fine grid variants. In dynamic target salvage, the 6DOF of the double floating body during the alongside phase must be considered. Table 3 shows the maximum MA of the heave and yaw responses of the ROV and FLOAT in the number of the three grid types, rough, medium, and fine, with the wave direction of the P1 phase set to 0°. The comparison reveals a considerable variation in the computational output of rough and fine grids. Considering the heave responses of the ROV and FLOAT, the disparity in heave response for ROV between rough and medium grids is 0.58%, whereas for FLOAT, it is 1.15%. The differences in heave response values exhibited by the dual floating body in the medium grid and fine grid are also not the same, with an ROV of 0.13% and a FLOAT of 0.8%. The pronounced difference in responses between the ROV and FLOAT could stem from the varying spacings between their dual floating structures. If this disparity impacts the scheme design for offshore floating body recovery, it may result in a collision of the two floating bodies. The yaw motion response exhibited by the ROV in the rough and medium grids shows a difference of 1.58%, whereas FLOAT exhibits a difference of 1.94. Similarly, the yaw motion response of the ROV in the medium and fine grids demonstrates a difference of 0.46%, whereas FLOAT shows a difference of 0.69. Comparing the two, the difference between the medium and fine grids is minor and falls within acceptable ranges. Under comprehensive evaluation, the fine grid places more demands on computer resources, and given computational efficiency, the medium grid is acceptable for numerical simulation.
The convergence of the time step is more important than the mesh gap, and by only changing the length of the computational time step until it no longer has a significant effect on the computational results, the time step determines both the computational accuracy and the computational time to a large extent [38]. As shown in Figure 6, the ideal grid parameters listed above are used as the primary model for five time steps in the computational simulation: 0.02 s, 0.01 s, 0.005 s, 0.003 s, and 0.001 s. To guarantee that the control variables remain constant with the other parameters, the best time step is calculated by comparing the time history curves of the ROV pitch with a wave direction of 0° at the P1 phase with the settings. Figure 6 shows that wave profiles derived with longer time increments have bigger inaccuracies. For example, with a time step of 0.02, there is a significant difference between pitch and phase with smaller time steps, but wave profiles with time steps of 0.01 s and 0.005 have lower phase errors. The wave curve of time step 0.003 s is quite similar to the wave curve of time step 0.001 s; thus, we chose 0.005 s as the time step used in the final calculation.
The dynamic target salvage motion response under wave action is computed using a supercomputer with a total load of 1280 cores and a single node of 64 cores. In terms of time, each stage (P1–P3) has a numerical simulation duration of 20 s, with computation times varying depending on the simulation settings. Given the computation duration of various working circumstances in this article, the medium grid is chosen for numerical simulation, with a time step of 0.005 s.

3.2. Pool Testing and Validation

To effectively reflect the salvage system’s coupled dynamic response characteristics, ROV-FLOAT salvage experiments were carried out to collect double-float kinematic response data, which were compared to the results of the numerical simulation to validate the numerical simulation conclusions.

3.2.1. Experimental Equipment and Arrangement

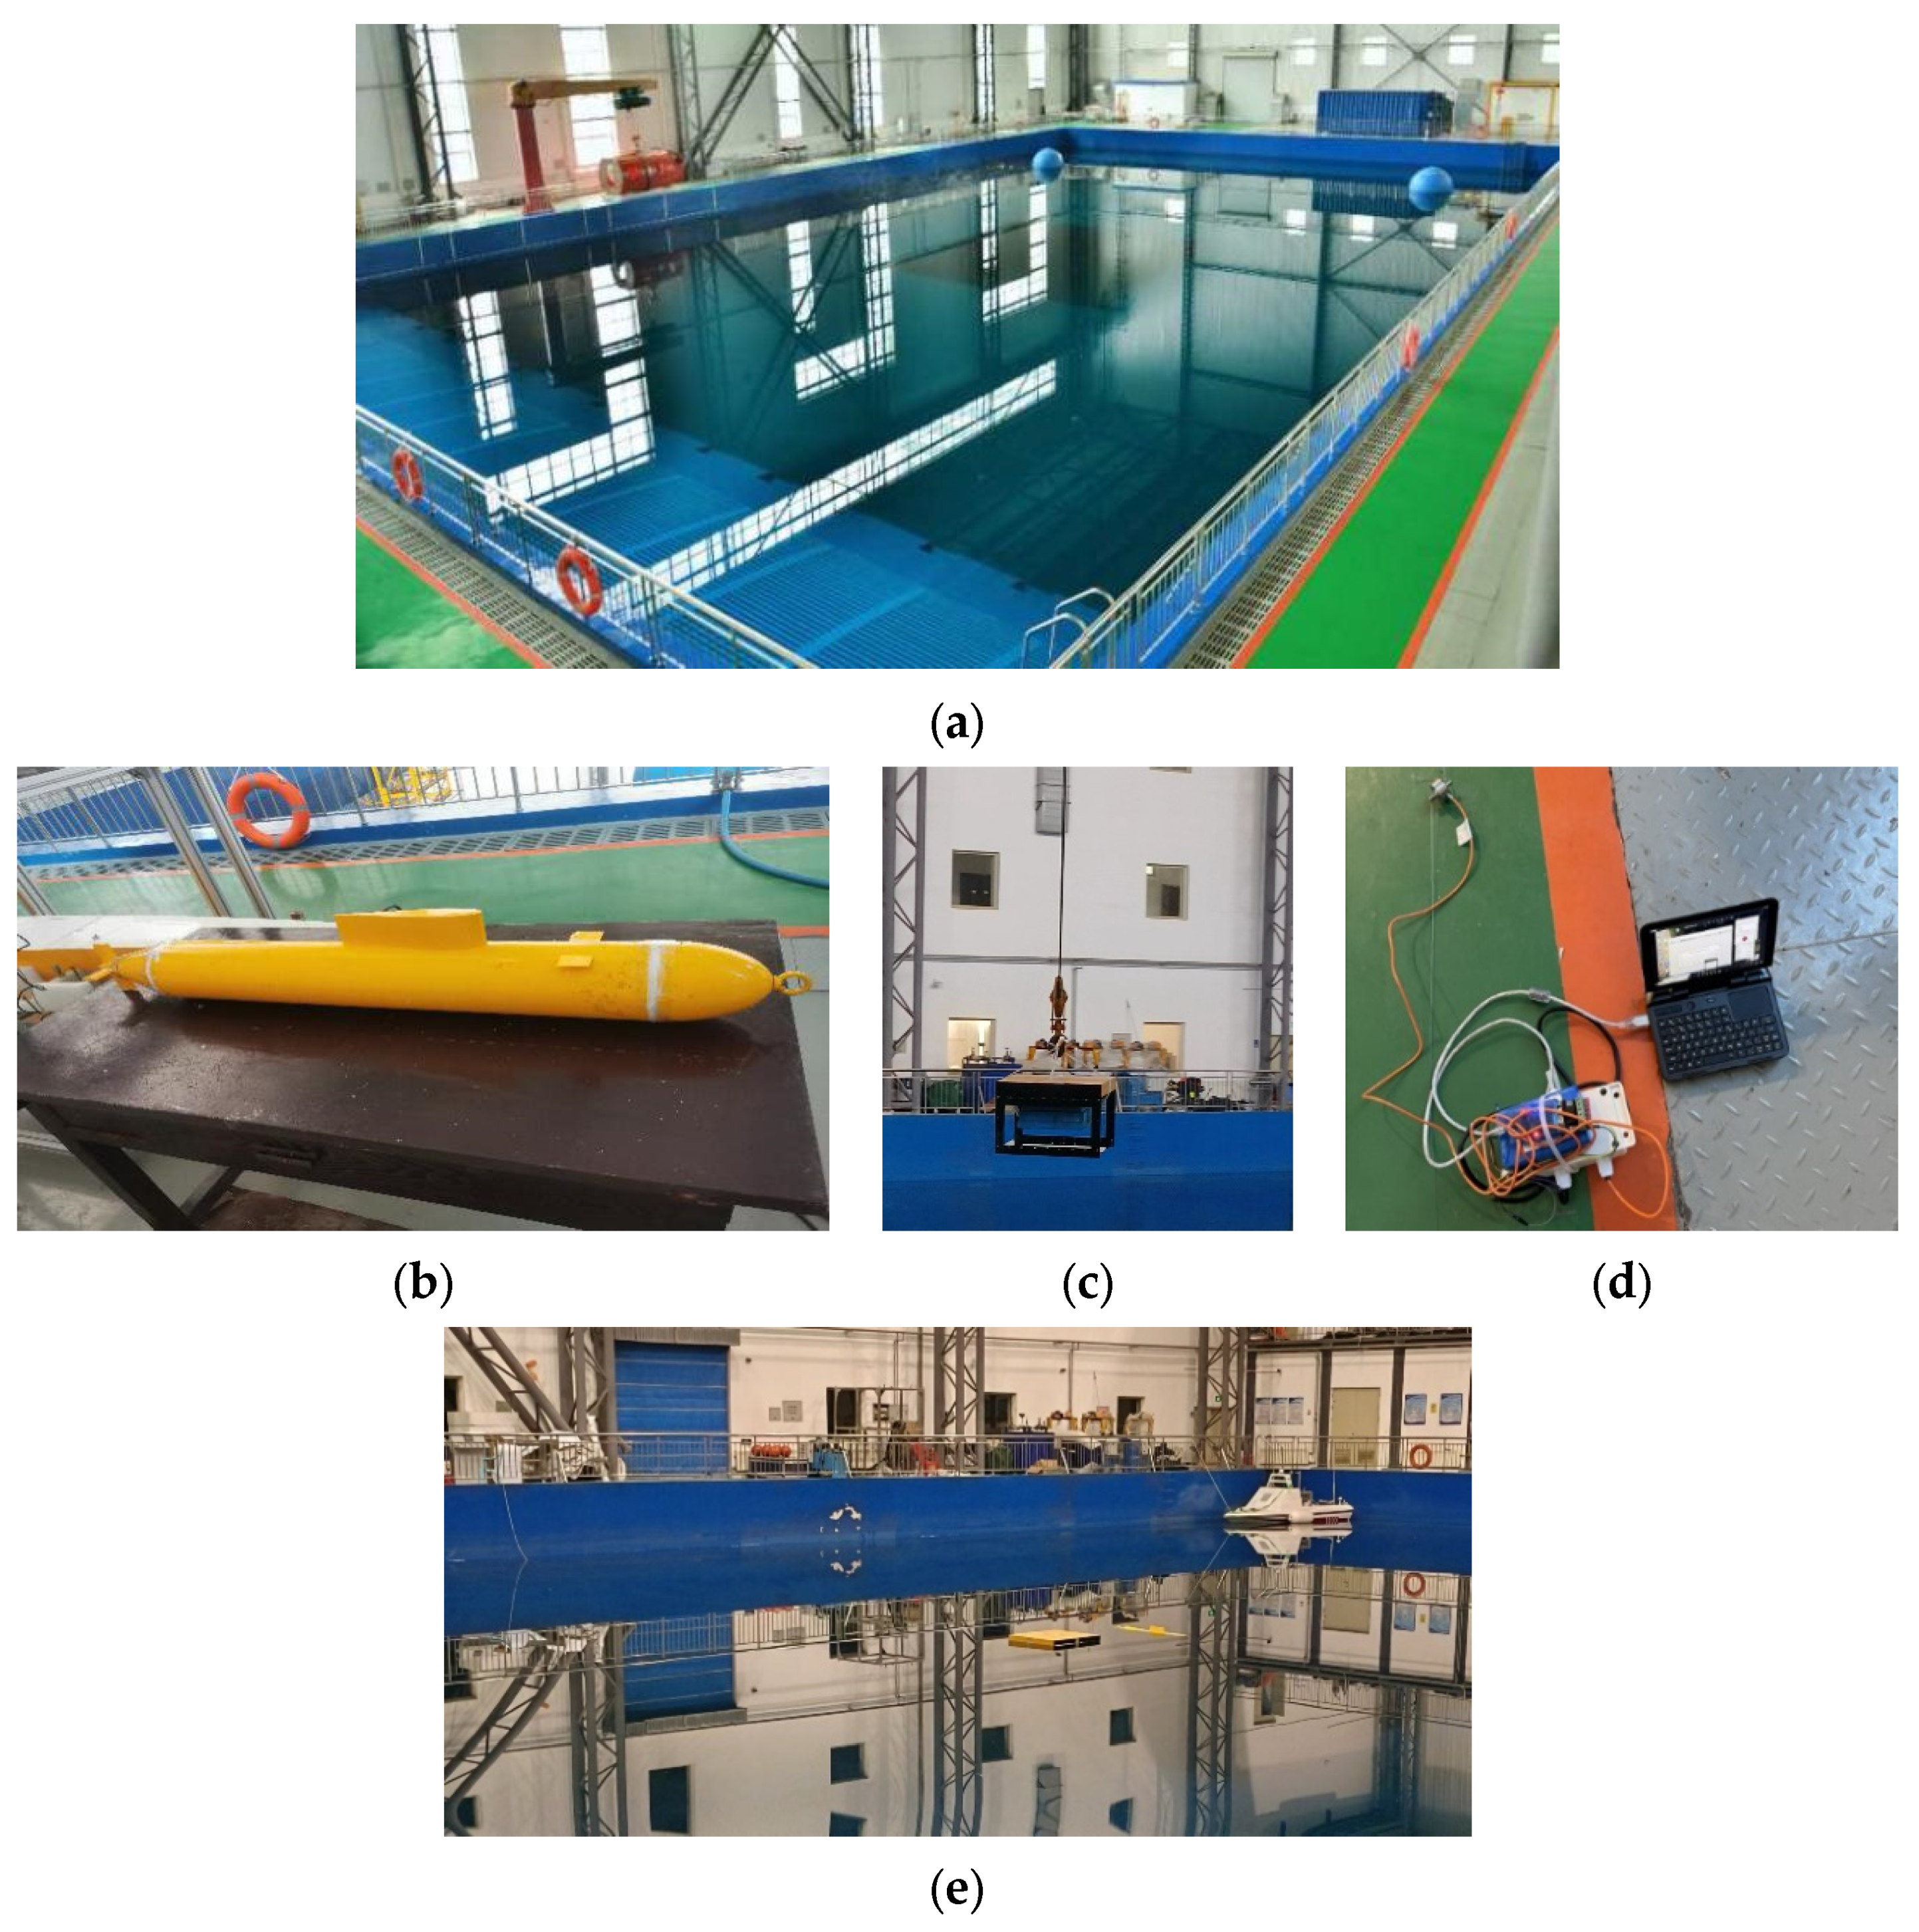
In this study, an iso-scale model of a dual floating body was constructed and placed in a wave-making pool to emulate its behavior in the ocean, providing a valuable method for the design of real-world salvaging techniques. The wave-making pool’s ability to manipulate simulated waves to achieve accurate amplitude and frequency made it an indispensable tool for dynamic target salvaging experiments. The Froude similarity theory was employed to model the floating body. The ROV measured 0.85 × 0.75 × 0.6 m with a draft depth of 0.4 m. The model’s floating body had a length of 1.2 m and a diameter of 0.145 m. The experiment was conducted in a wave pool that was 50 m long, 30 m wide, and 4 m deep. A 10-m deep well was built in the center to replicate deep water conditions, as illustrated in Figure 7. Figure 8 illustrates the experimental setup and equipment. To minimize testing errors, a single momentum source wave-generating mode was utilized. When the two wave-making demands were symmetrically arranged in one section of the pool, the elastic rope at the lower part of the wave-making ball pulled the ball vertically through the rotation of the eccentric wheel. The pulling rope, connected to the bottom of the wave-making momentum source structure, extended and contracted to replicate high sea conditions. Additionally, the two floats underwent load adjustments. Figure 8d depicts the instrumentation used to measure the attitude of the floats, which were installed within the ROV and FLOAT’s interior compartments. Finally, the kinematic response of the two floats was recorded using the attitude instrument. Figure 8e illustrates the dynamic target salvage layout, including the positioning of the dual floats within the wave pool.

3.2.2. Analysis of Experimental Results

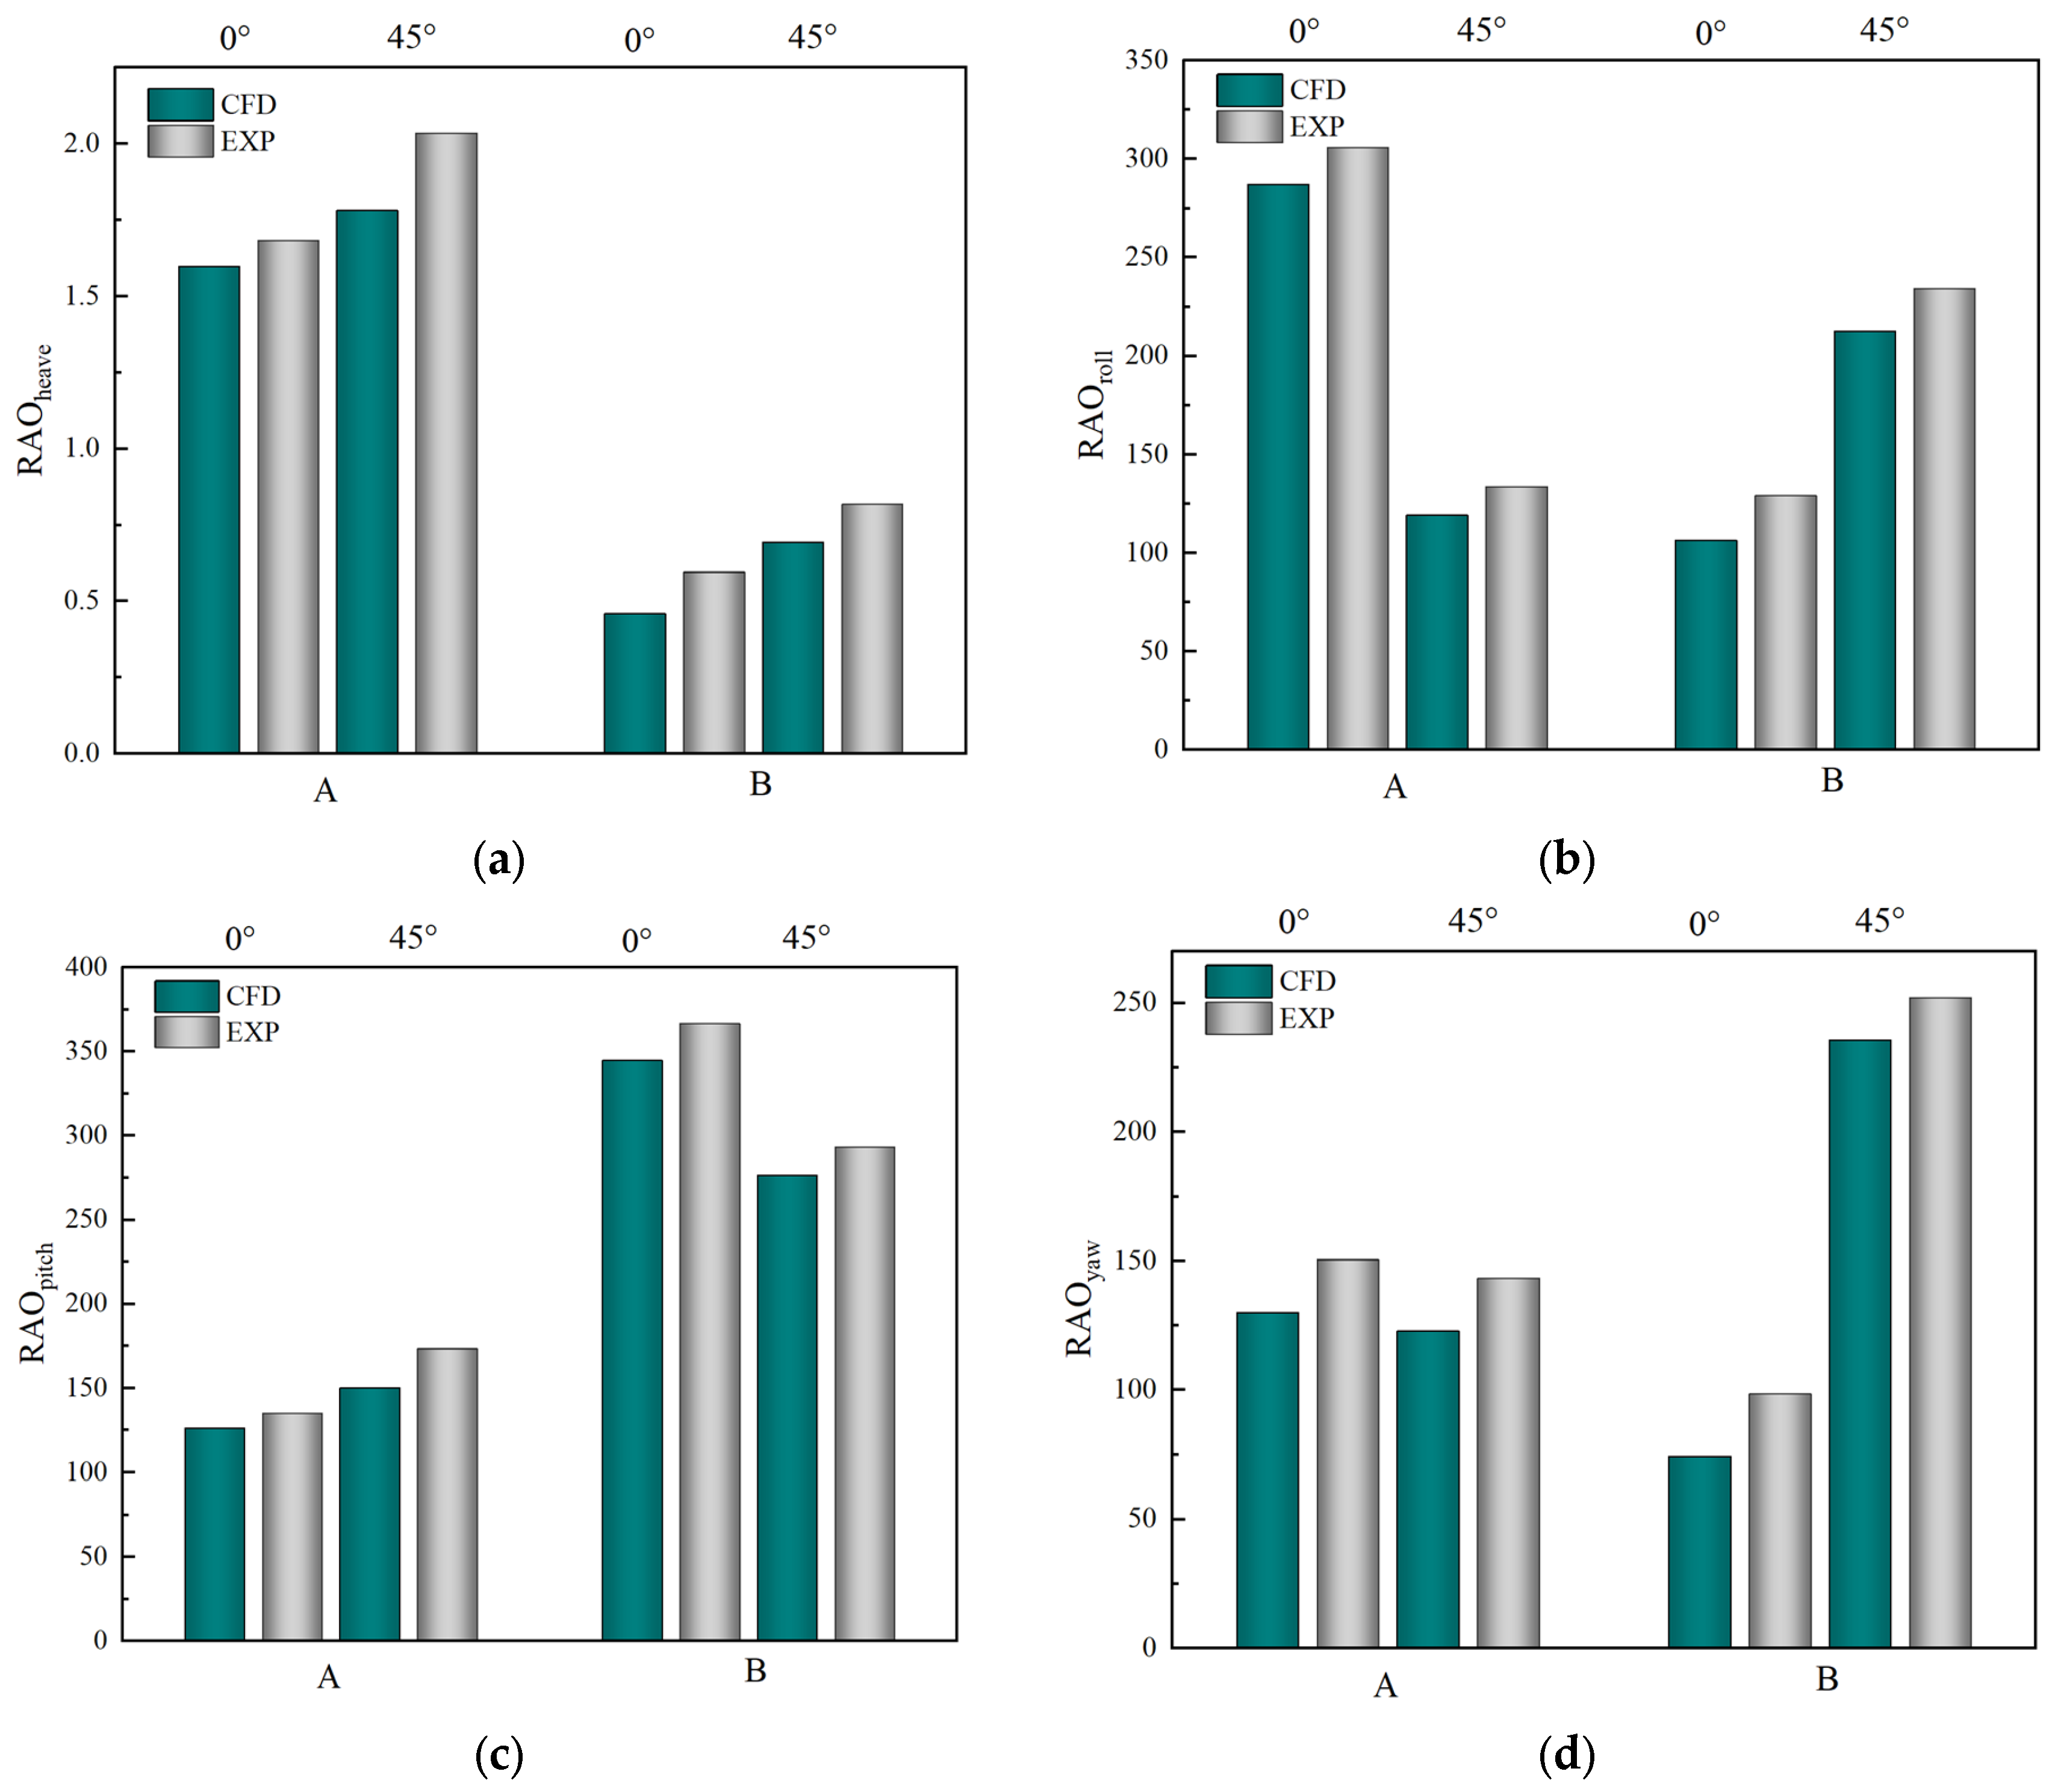
This article explores the motion response of a dual floating body in waves during the P2 stage, encompassing both following seas and stern quartering seas. Figure 9 presents a comparative analysis of the motion response amplitude operator (RAO) for a four-degrees-of-freedom experimental simulation, where A denotes the ROV and B signifies the rescued floating body, FLOAT. The RAO is defined as the amplitude MA divided by wave height H across the 6DOFs [39]. Figure 8 depicts the simulated and experimental kinematic response RAO for the double floating body’s heave and yaw, which increase with the wave direction angle. As illustrated in Figure 9b, the simulation and experimental results for the ROV reveal that the roll RAO exhibits a decreasing trend as the wave direction angle rises, likely due to the varying upper wave states generated at different wave direction angles.
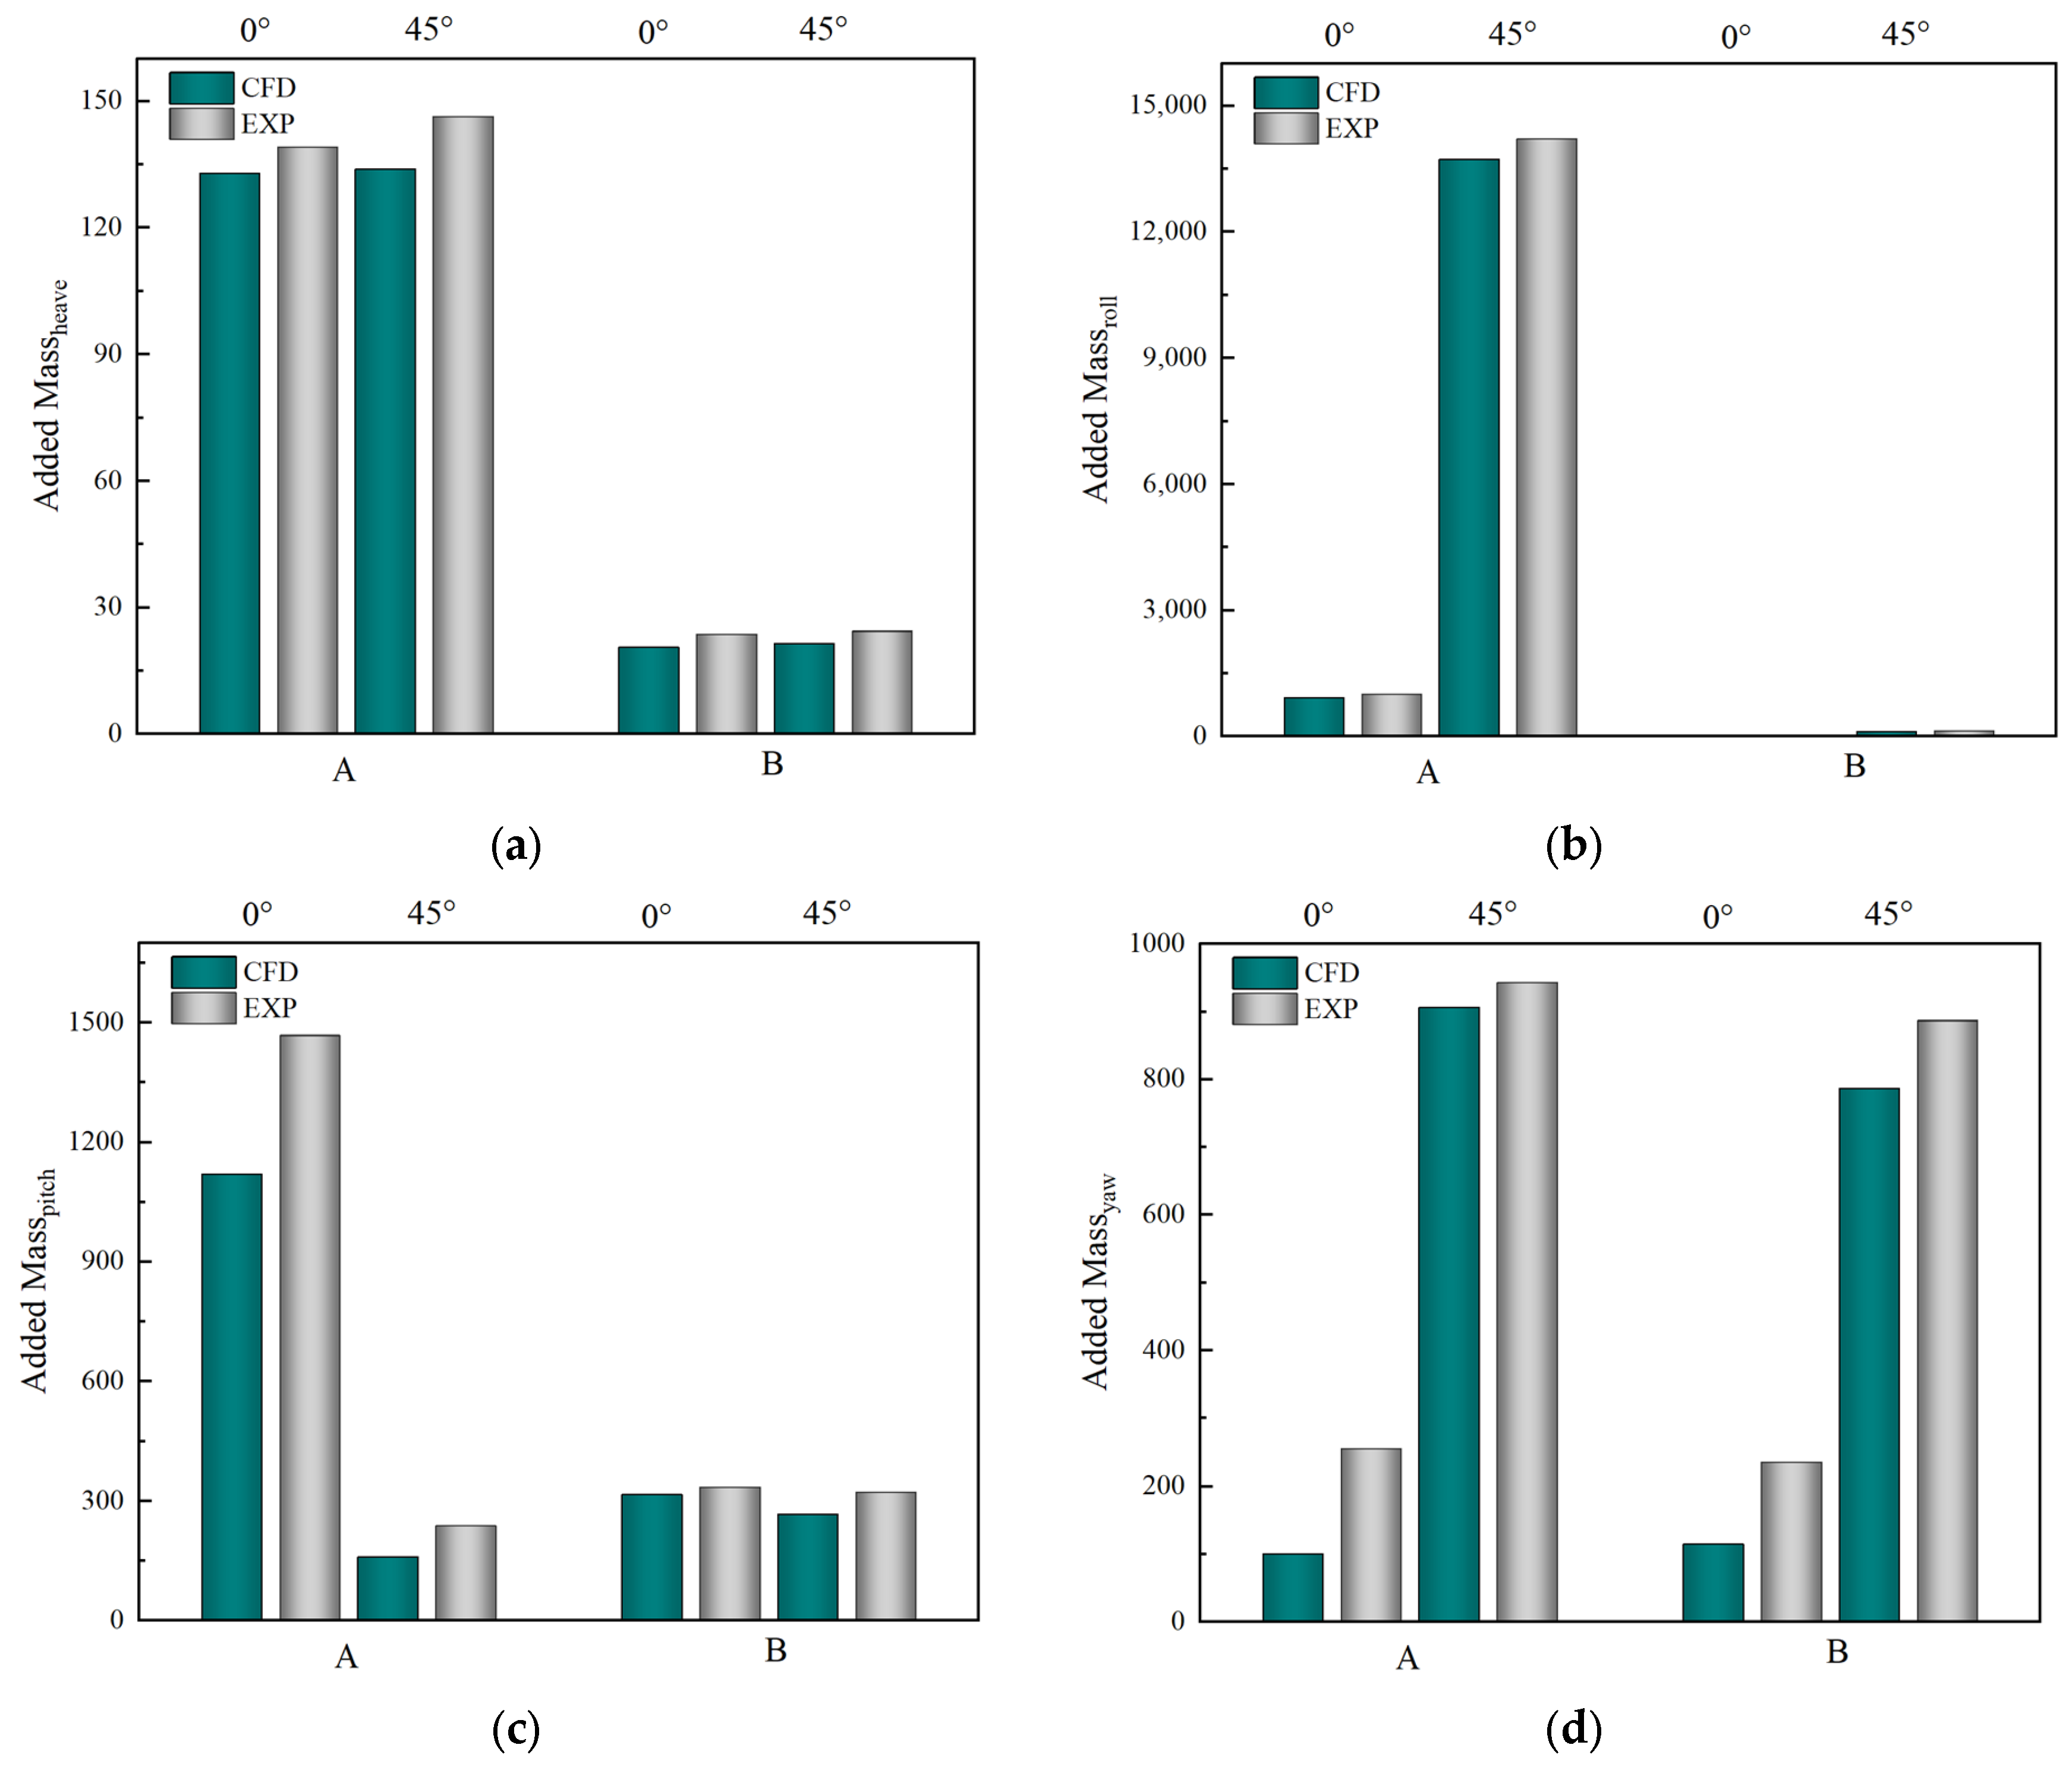
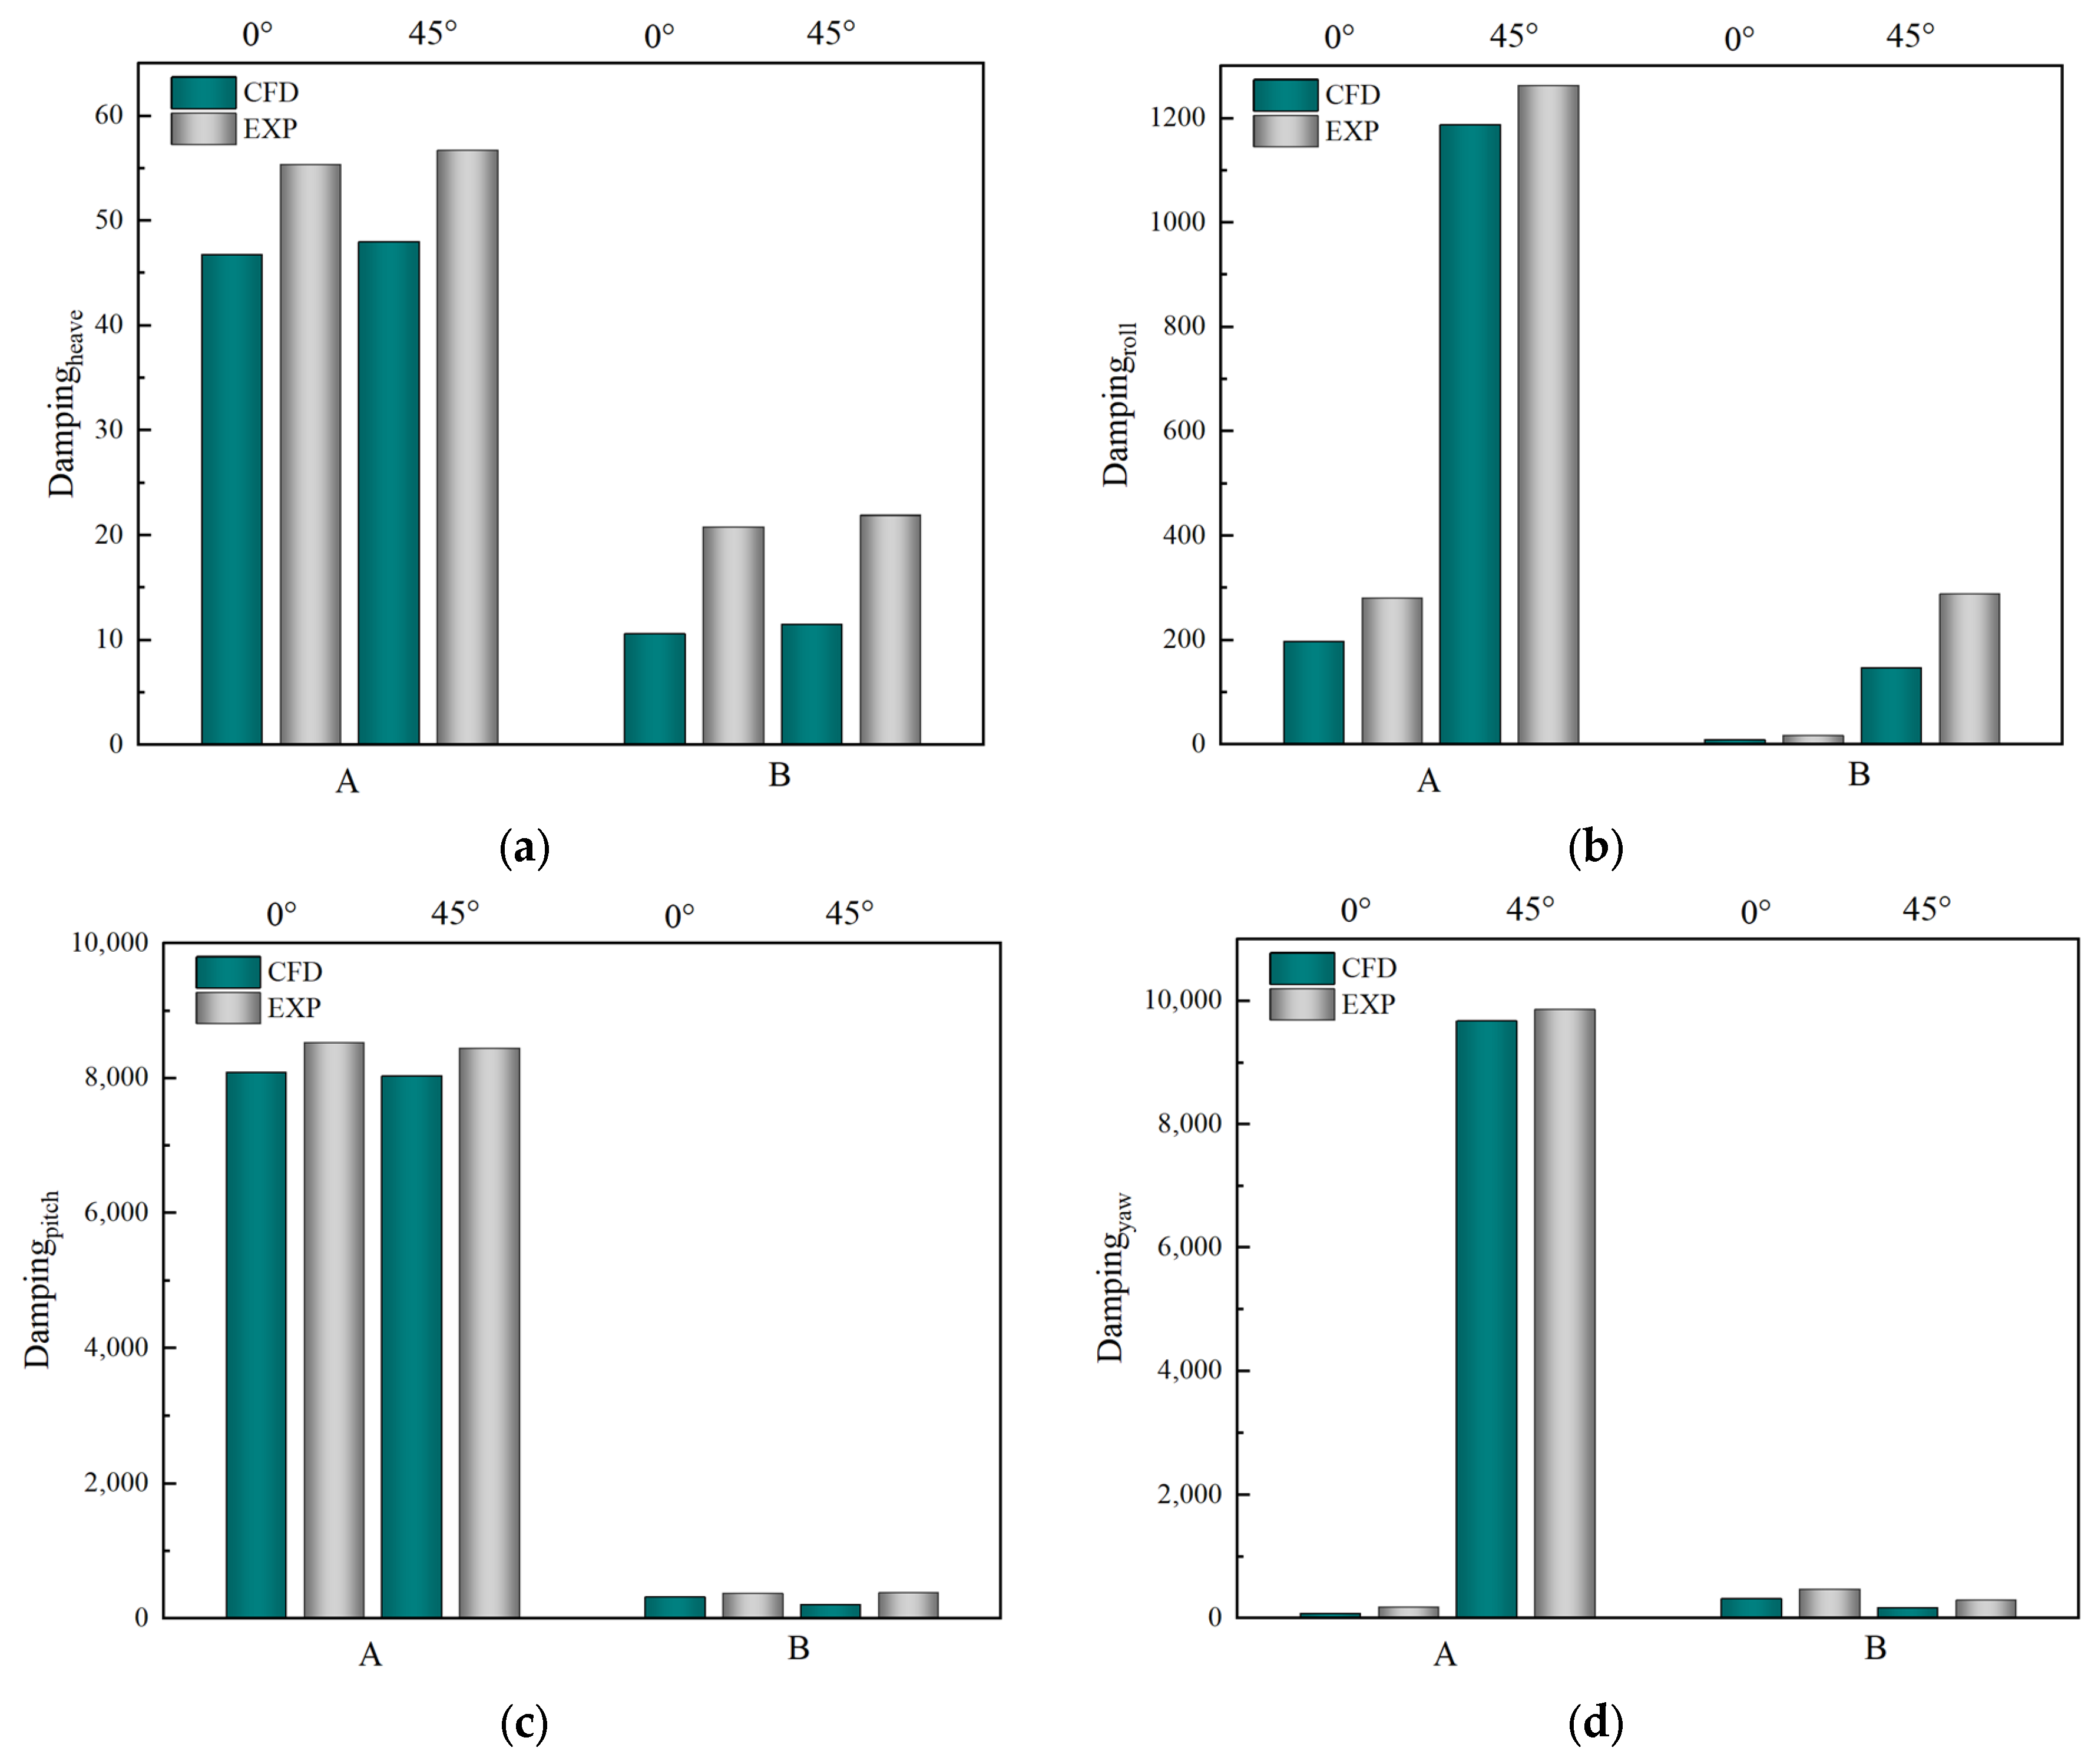
When a floating body with a certain mass moves, it generates kinetic energy in the surrounding flow field, which in turn exerts a reactive force on the body. This phenomenon illustrates the physical significance of the added mass of a floating body. The added mass reflects the impact of the fluid’s inertial motion in the surrounding flow field due to the body’s movement. Figure 10 presents a comparative study of the experimental four-degrees-of-freedom simulation incorporating added mass. Initial disturbances cause the floating body to oscillate, and subsequent energy dissipation leads to a gradual cessation of the oscillations. The larger the floating body’s damping coefficient, the more rapidly the motion decays. Figure 11 offers a comparative examination of the four-degrees-of-freedom experimental simulation with varying damping coefficients. Table 4 displays hydrodynamic coefficients of double floating bodies under wave action in various directions. It illustrates that the ROV’s four degrees of freedom under wave action exhibit greater additional mass and damping coefficients than the recovered floating body, FLOAT. Numerical simulations of the additional mass and damping coefficients for both ROV and FLOAT display similar trends with changes in wave angle, showing that both parameters increase as the wave angle rises. However, experimental values for the floating body’s four degrees of freedom are somewhat higher than the numerical simulations, likely due to variations in the spacing between the floats caused by wave motion.
In the process of salvaging floating bodies at sea, there are numerous inherent uncertainties within the floating bodies themselves. To verify the rationality of numerical simulation, multiple physical indicators must be comprehensively considered. This study has selected the maximum absolute value (MA) and root mean square (RMS) as evaluation factors. These parameters serve as crucial elements for assessing the salvage process. Specifically, RMS is more suitable for describing fluctuations near zero in data. By comprehensively considering these factors, we can evaluate both numerical simulations and experiments, thereby enhancing the authenticity of the numerical simulations. The formulas for the aforementioned evaluation factors are as follows:
M A = m a x A B S m a x S i , A B S m i n S i , s : 1 n
R M S = i = 1 n   S i 2 n
where S represents the sample.
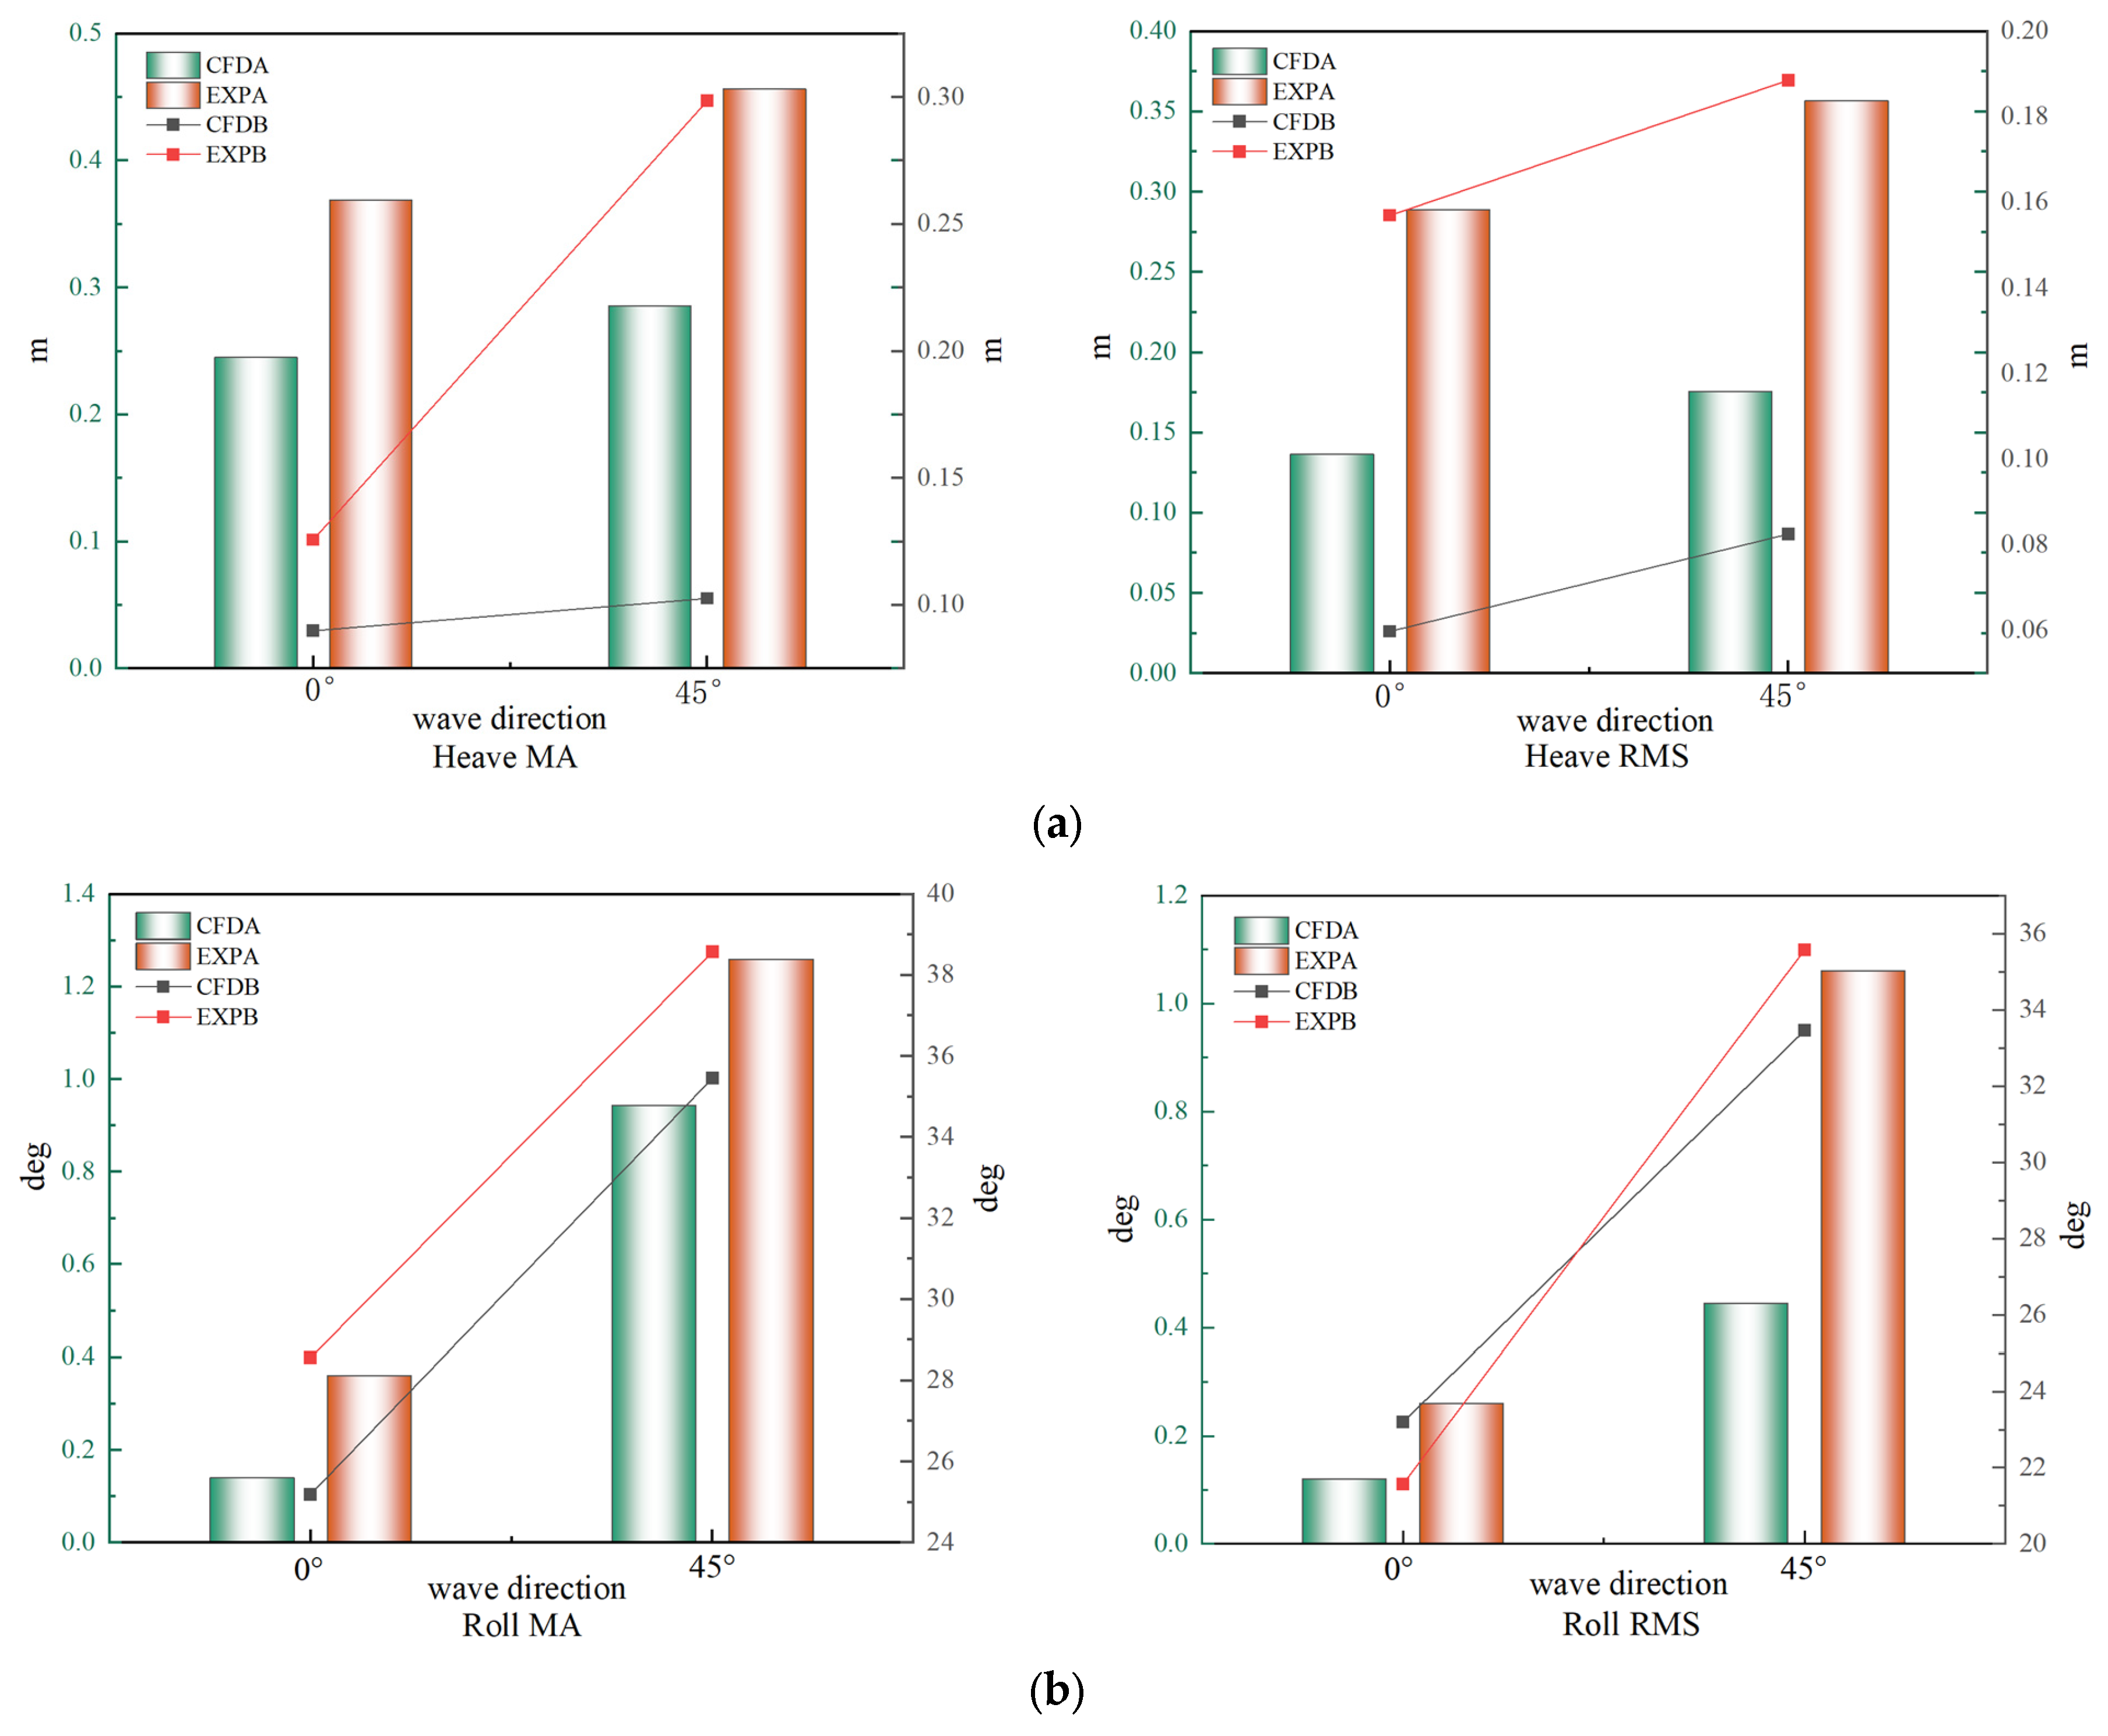
Figure 12 summarizes the comparison results of the four degrees of freedom (MA and RMS) for a double floating body under CFD and experimental conditions, subjected to wave action in different directions. Here, A represents the ROV and B represents the FLOAT. As observed in the figure, the numerical simulation results of the double floating body exhibit a consistent trend with the experimental data, indicating good agreement. Overall, the numerical simulation values align closely with experimental findings, reflecting the kinematic characteristics of the floating body and affirming the accuracy of the numerical calculations.

4. Results and Discussion

4.1. Numerical Simulation of Single-Float and Double-Float Coupling

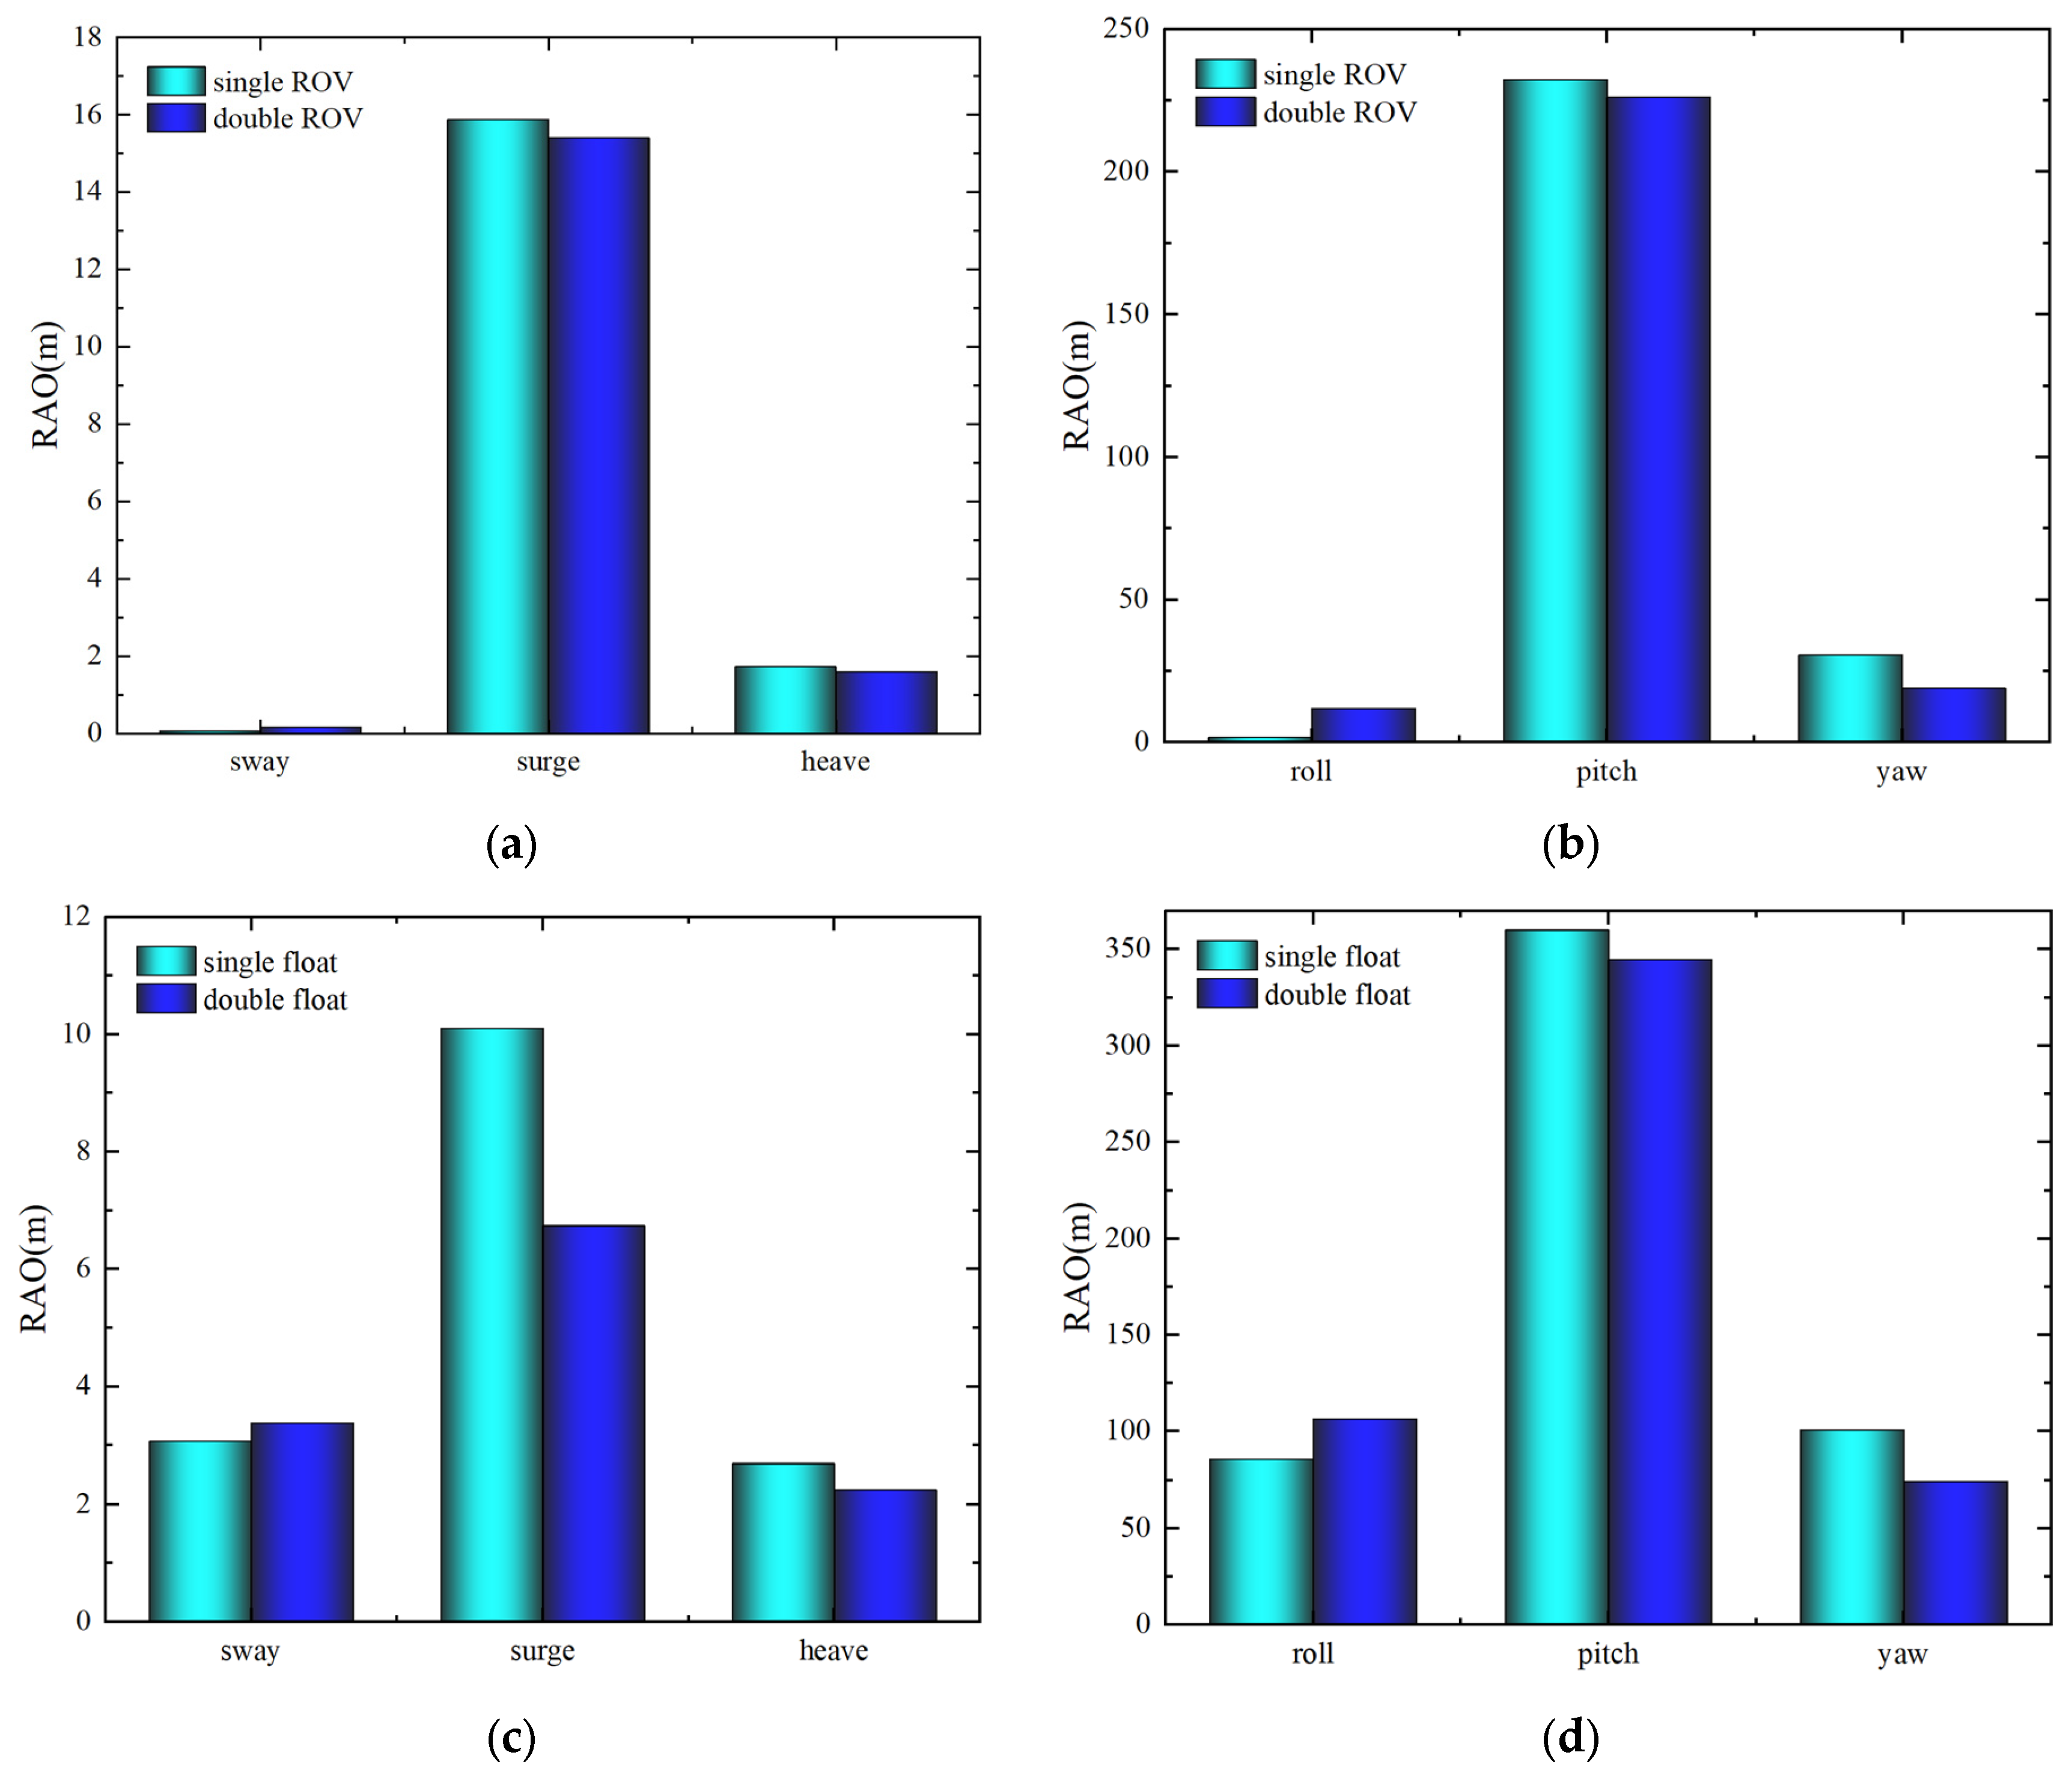
Figure 13 contrasts the six-degrees-of-freedom motion amplitude operator (RAO) results for a single floating body ROV and FLOAT with those of a dual floating body during the P2 stage under the influence of following waves. In addition, compared to the ROV and FLOAT under the dual-floating-body coupling effect, the RAO motion response of the single-floating-body ROV and FLOAT in the sway and roll directions is smaller, and the relative motion amplitude is also smaller. This indicates that a single floating body experiences less wave impact in the sway and roll directions under the action of following waves. Conversely, in the surge, heave, pitch, and yaw directions, the single-floating ROV and FLOAT exhibit greater RAO motion responses. This is likely due to the absence of protection provided by the ROV to the FLOAT under wave action and the lack of coupling effects between the two floating bodies in the single-floating-body configuration.

4.2. Characteristics of Double Floating Body Berthing Motion

How will the twin floats move if berthing happens at different speeds, and how will the ROV move throughout the ROV berthing procedure? In this work, the upstream ROV receives a lateral force during the simulation, which causes the ROV to accelerate in response to the external force. The propeller propelling the ROV is then replicated using this velocity. In actuality, though, many assessments are necessary to determine the force needed to propel the ROV and the relationship between force and velocity. The discovered relationship between the ROV motion velocity and RAO is displayed in Figure 13. The ship’s speed is indicated by the Froude number Fr, which is defined by the following equation:
F r = v g L a
where v is the speed at which the ROV is berthing and La is the characteristic length of the ROV.
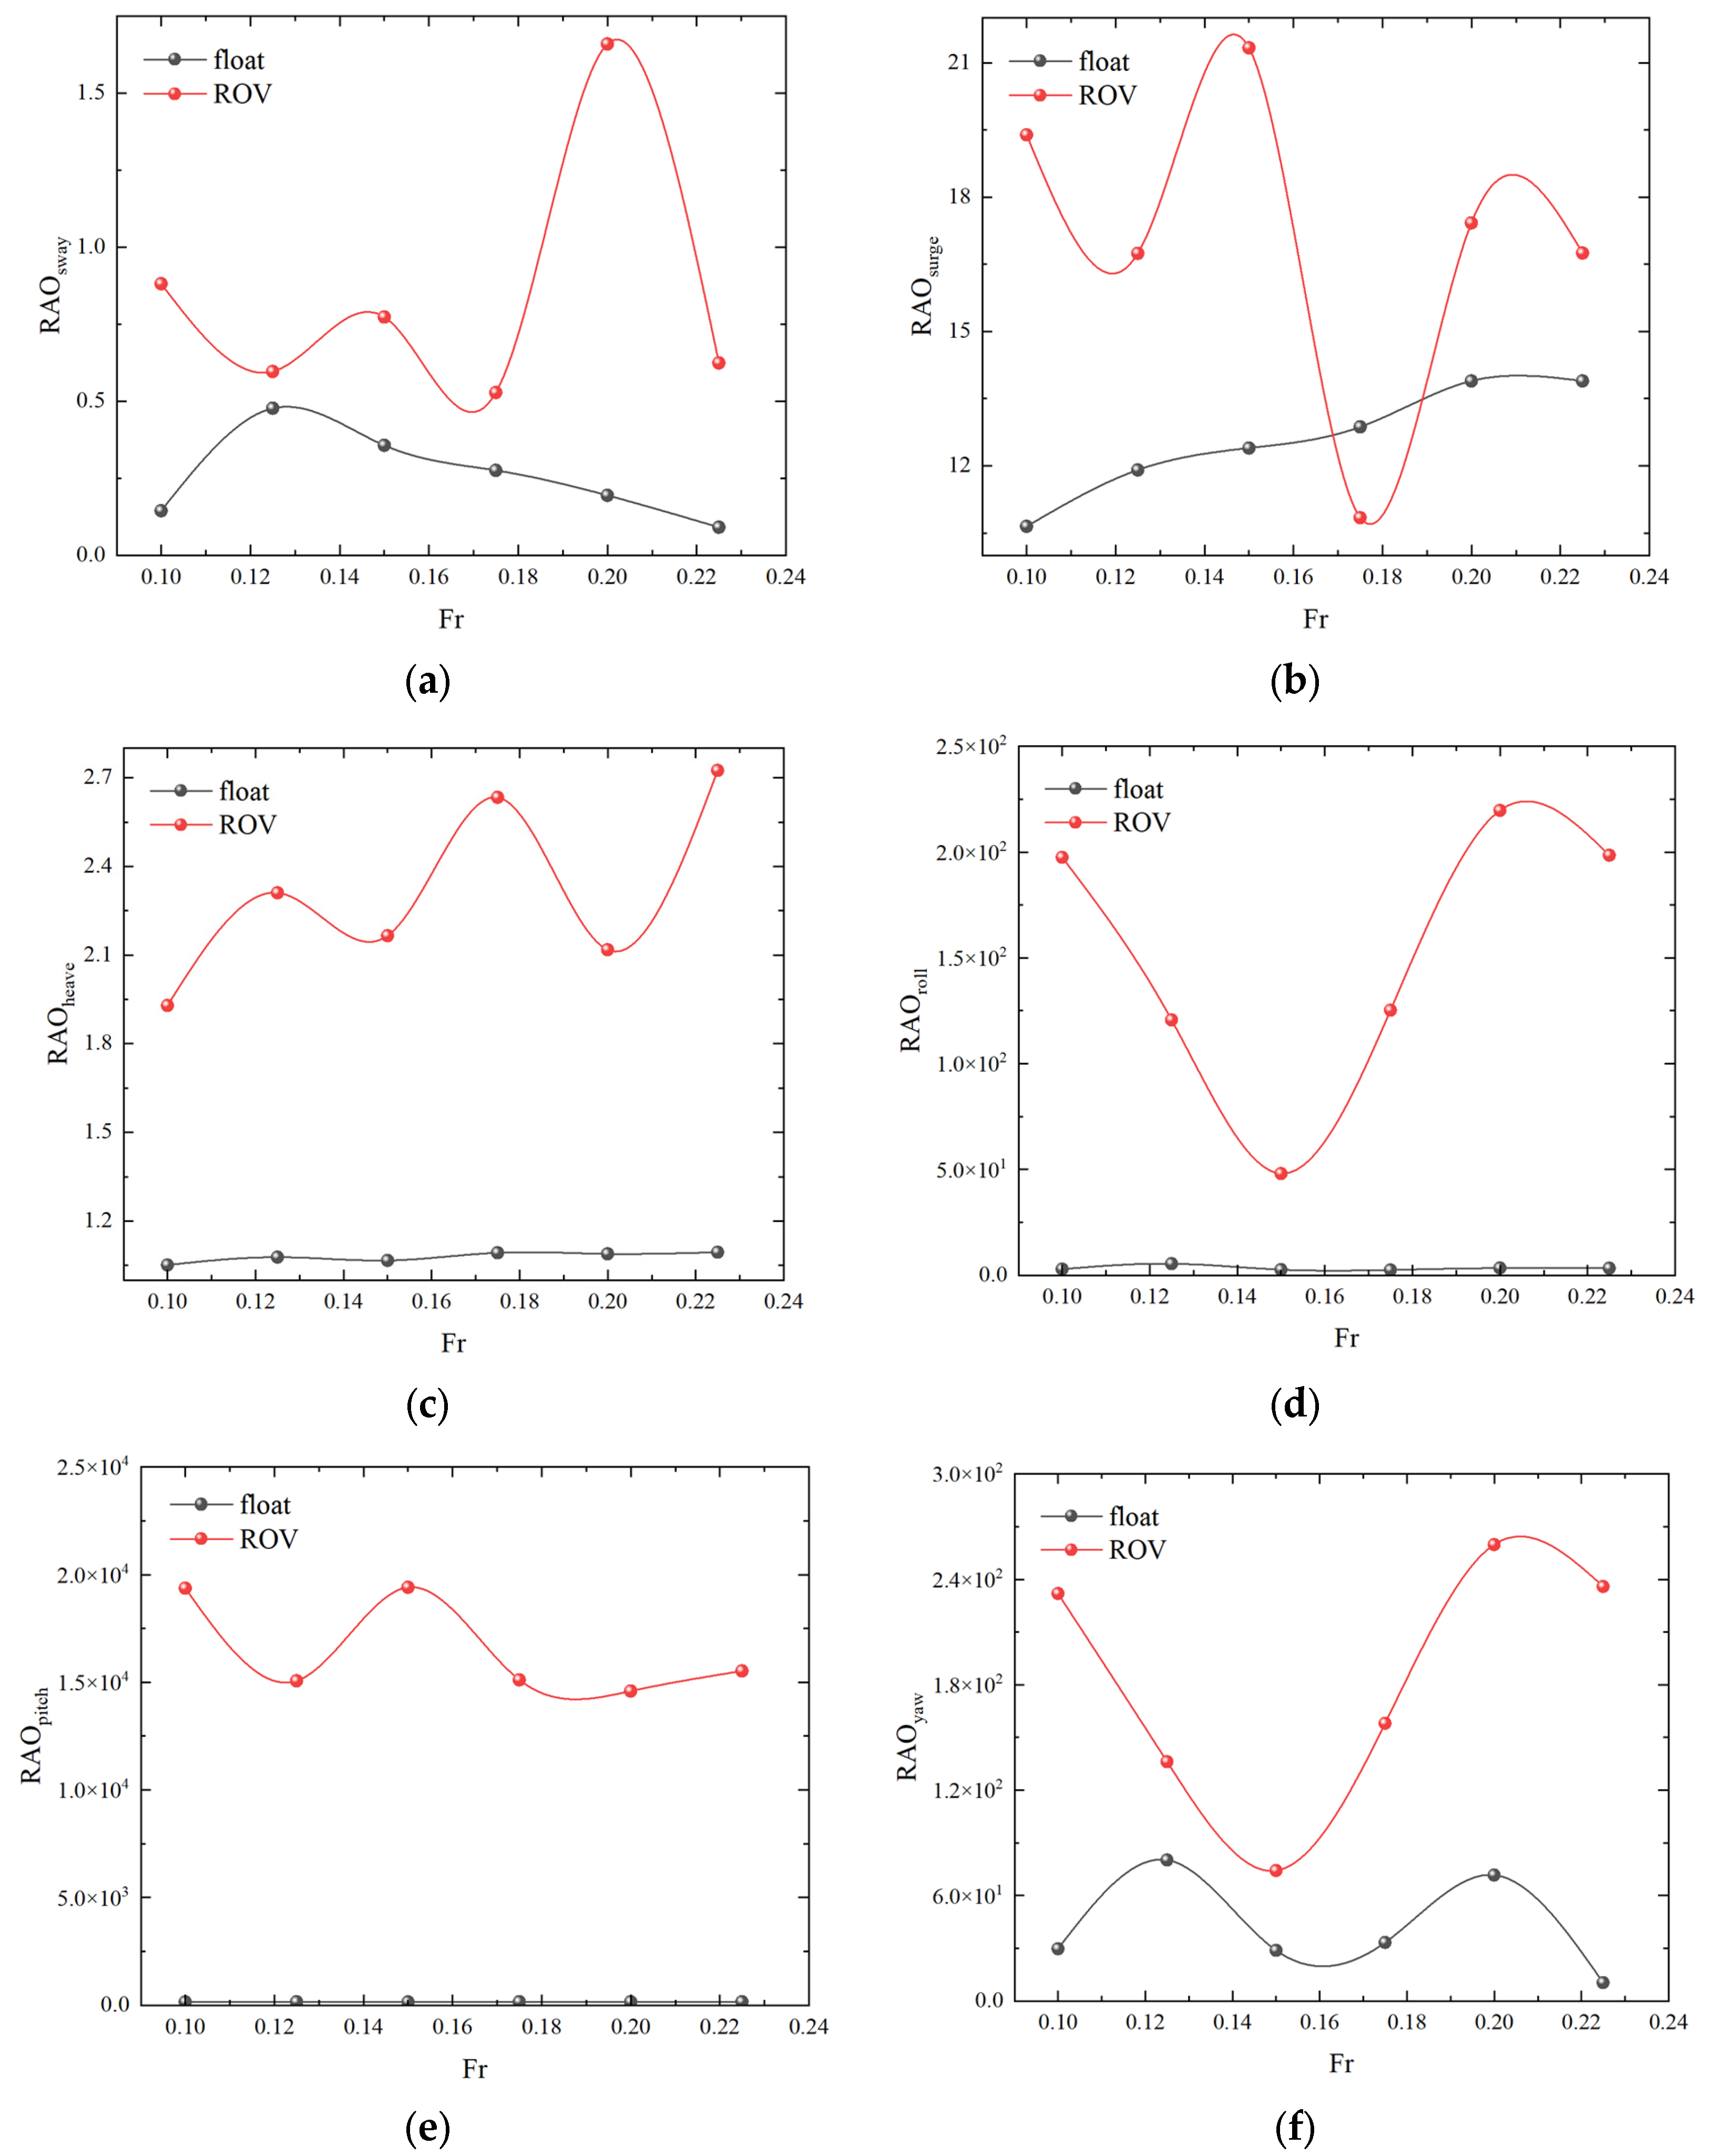
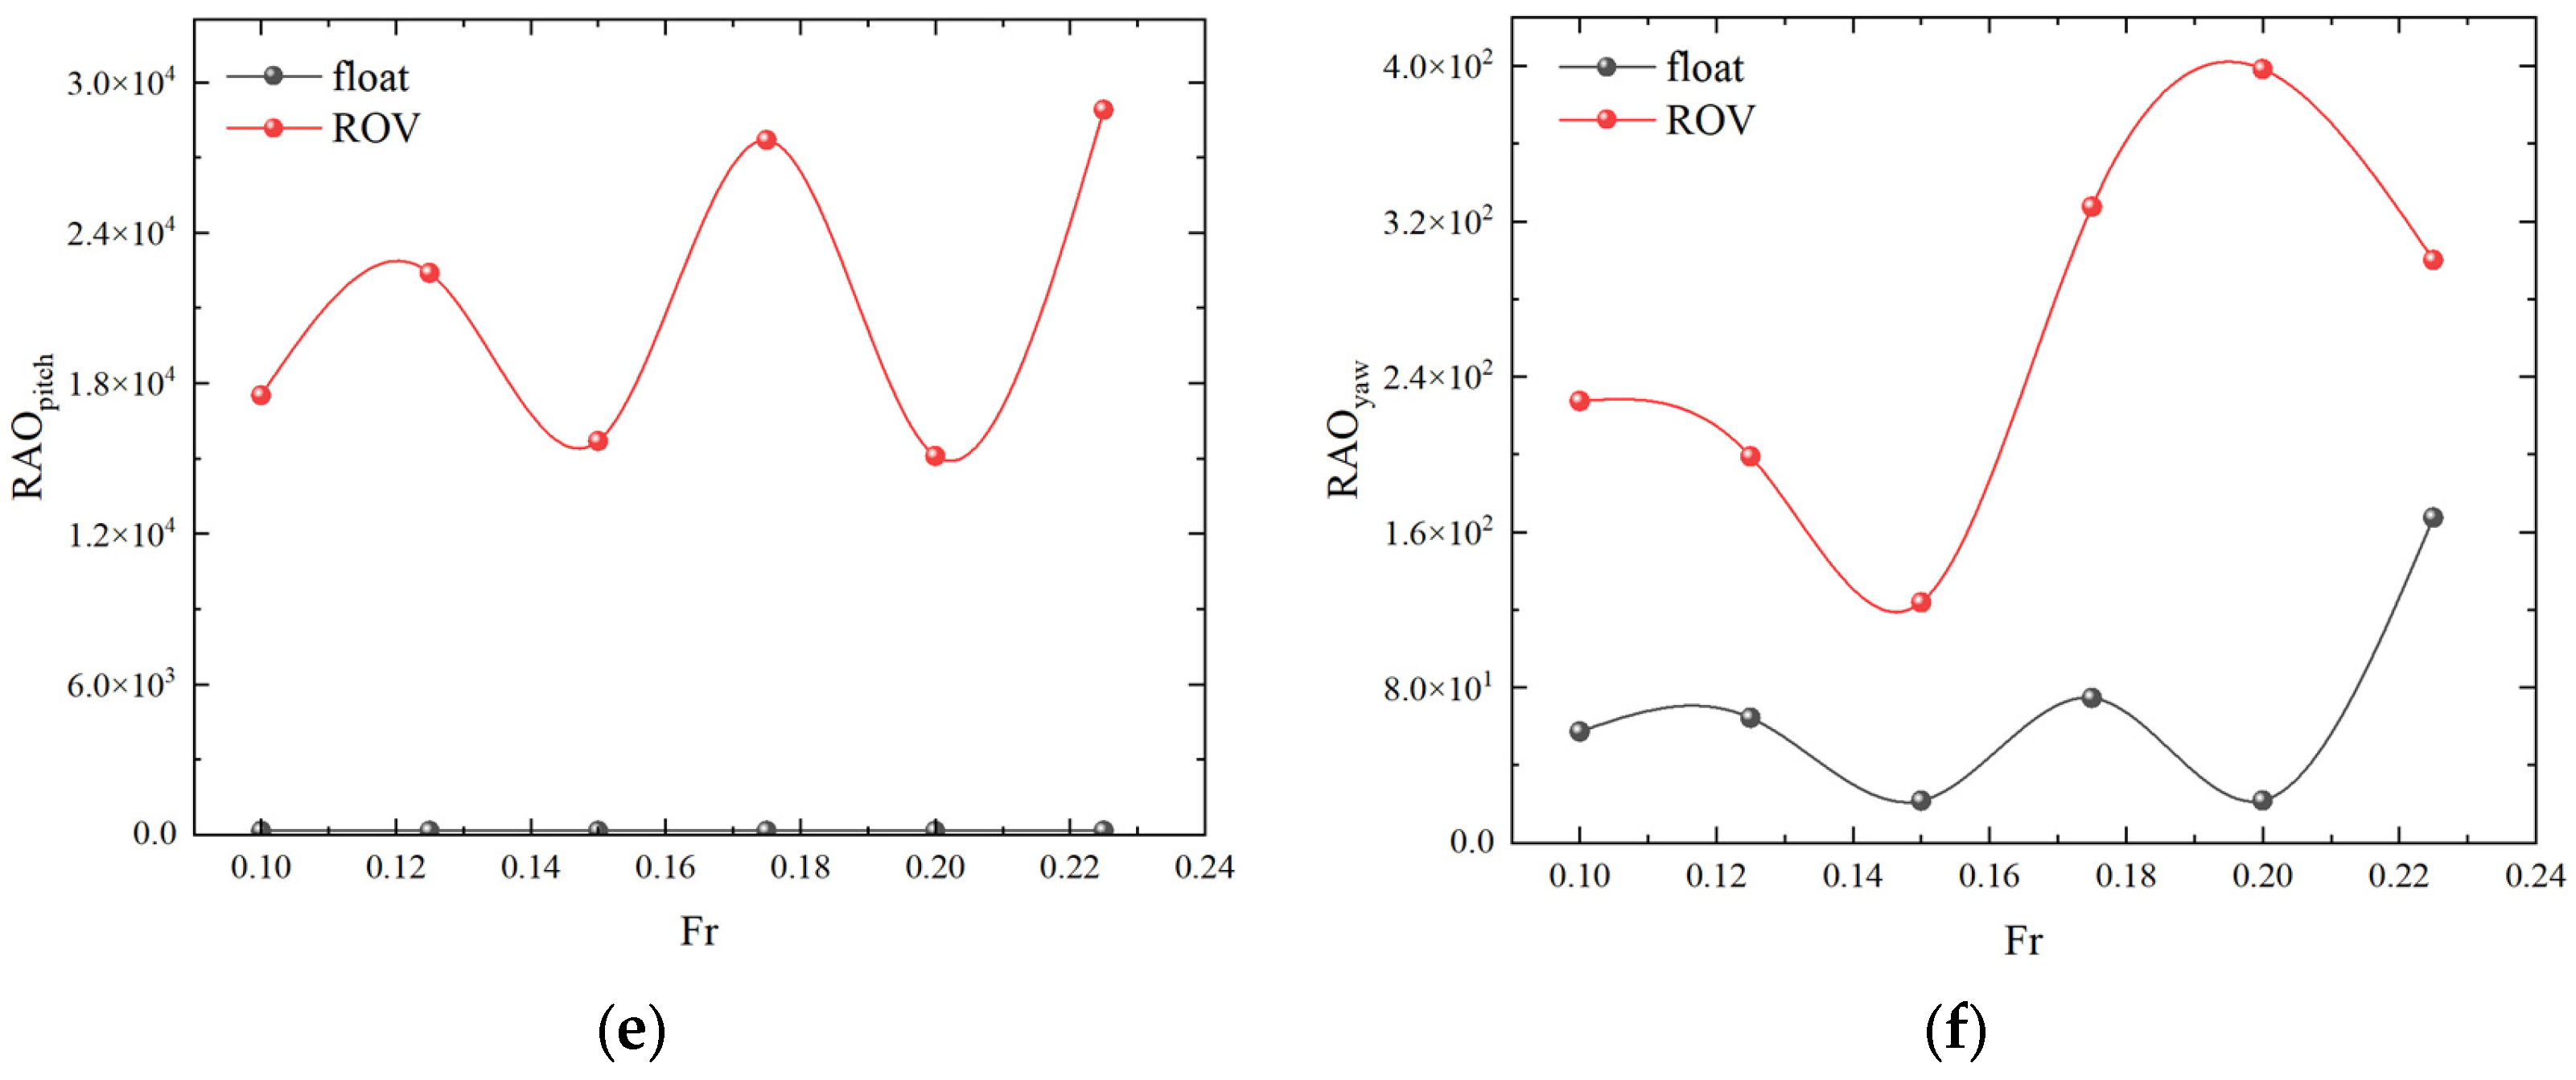
Because of the ROV’s shading impact on the rescued FLOAT, the motion response RAO of the FLOAT varies less with berthing speed, as shown in Figure 14c regarding heave, (d) roll, and (e) pitch movements. The pitch RAO motion response values of the ROV and the FLOAT differ significantly, as seen in Figure 14e. The two floats respond similarly in terms of sway, surge, and yaw. Figure 14d roll and (f) yaw show that double floats have reduced roll and yaw RAO and smoother movements at Fr = 0.15–0.18.
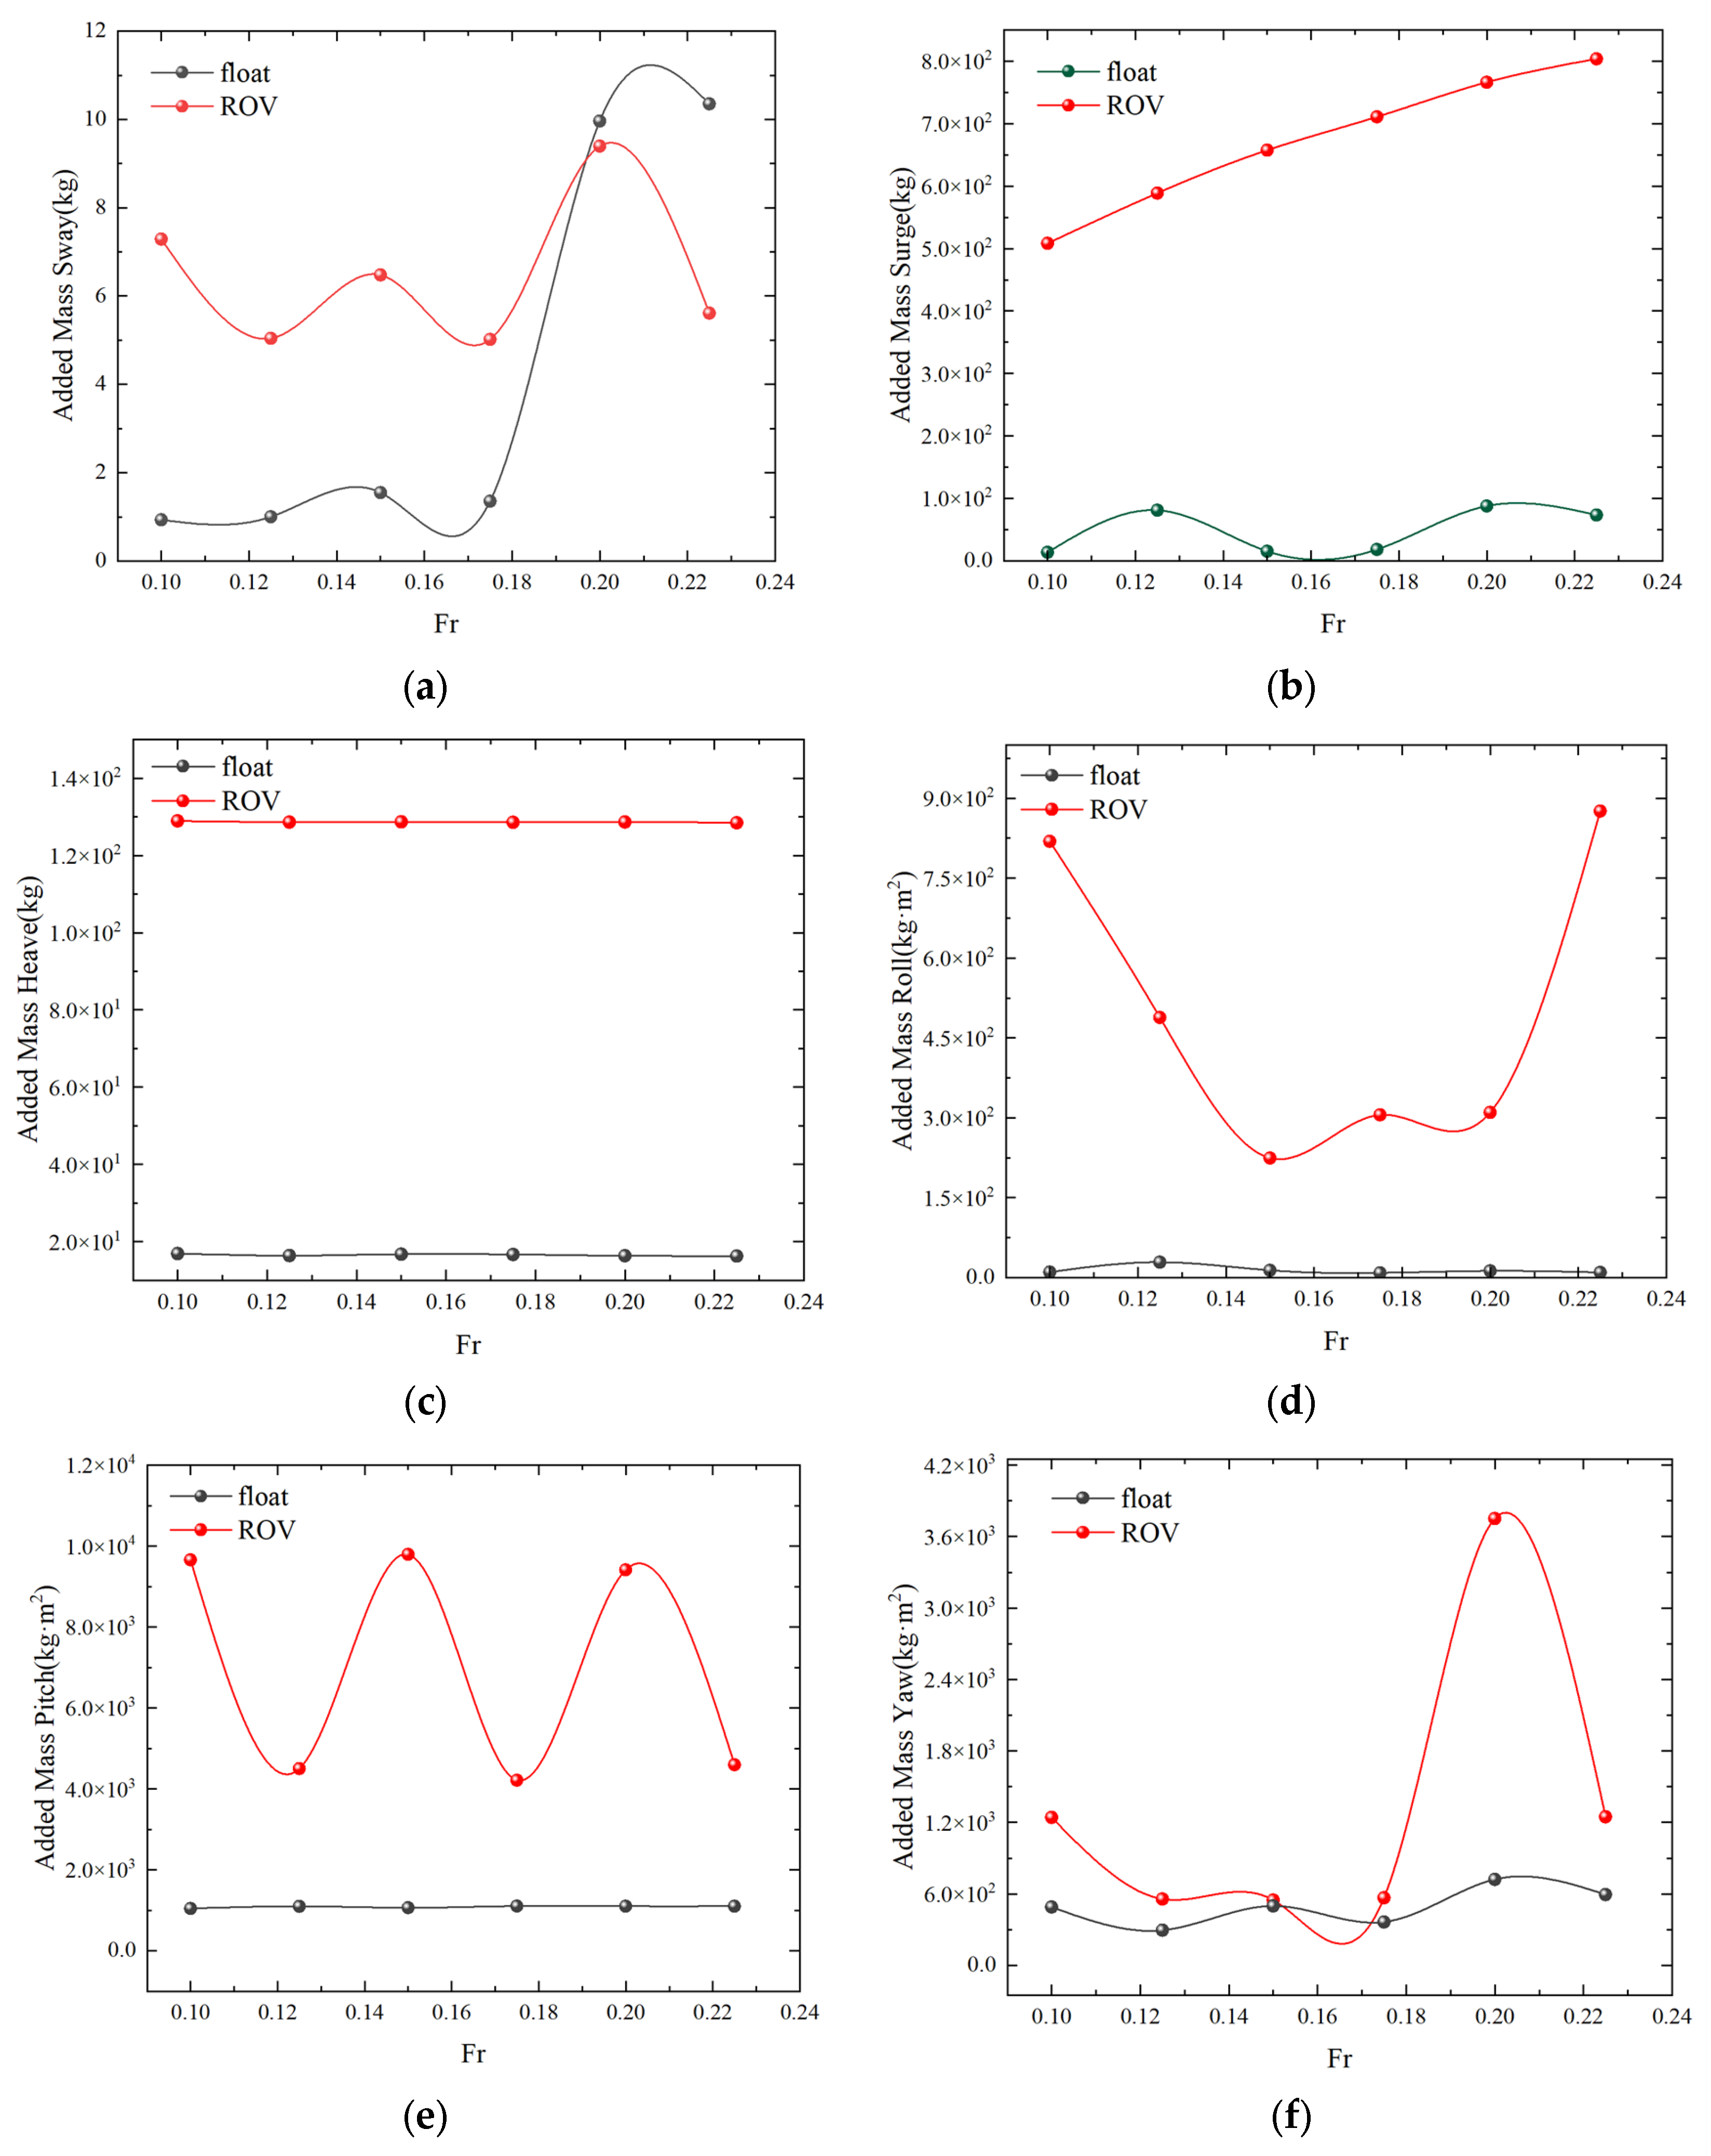
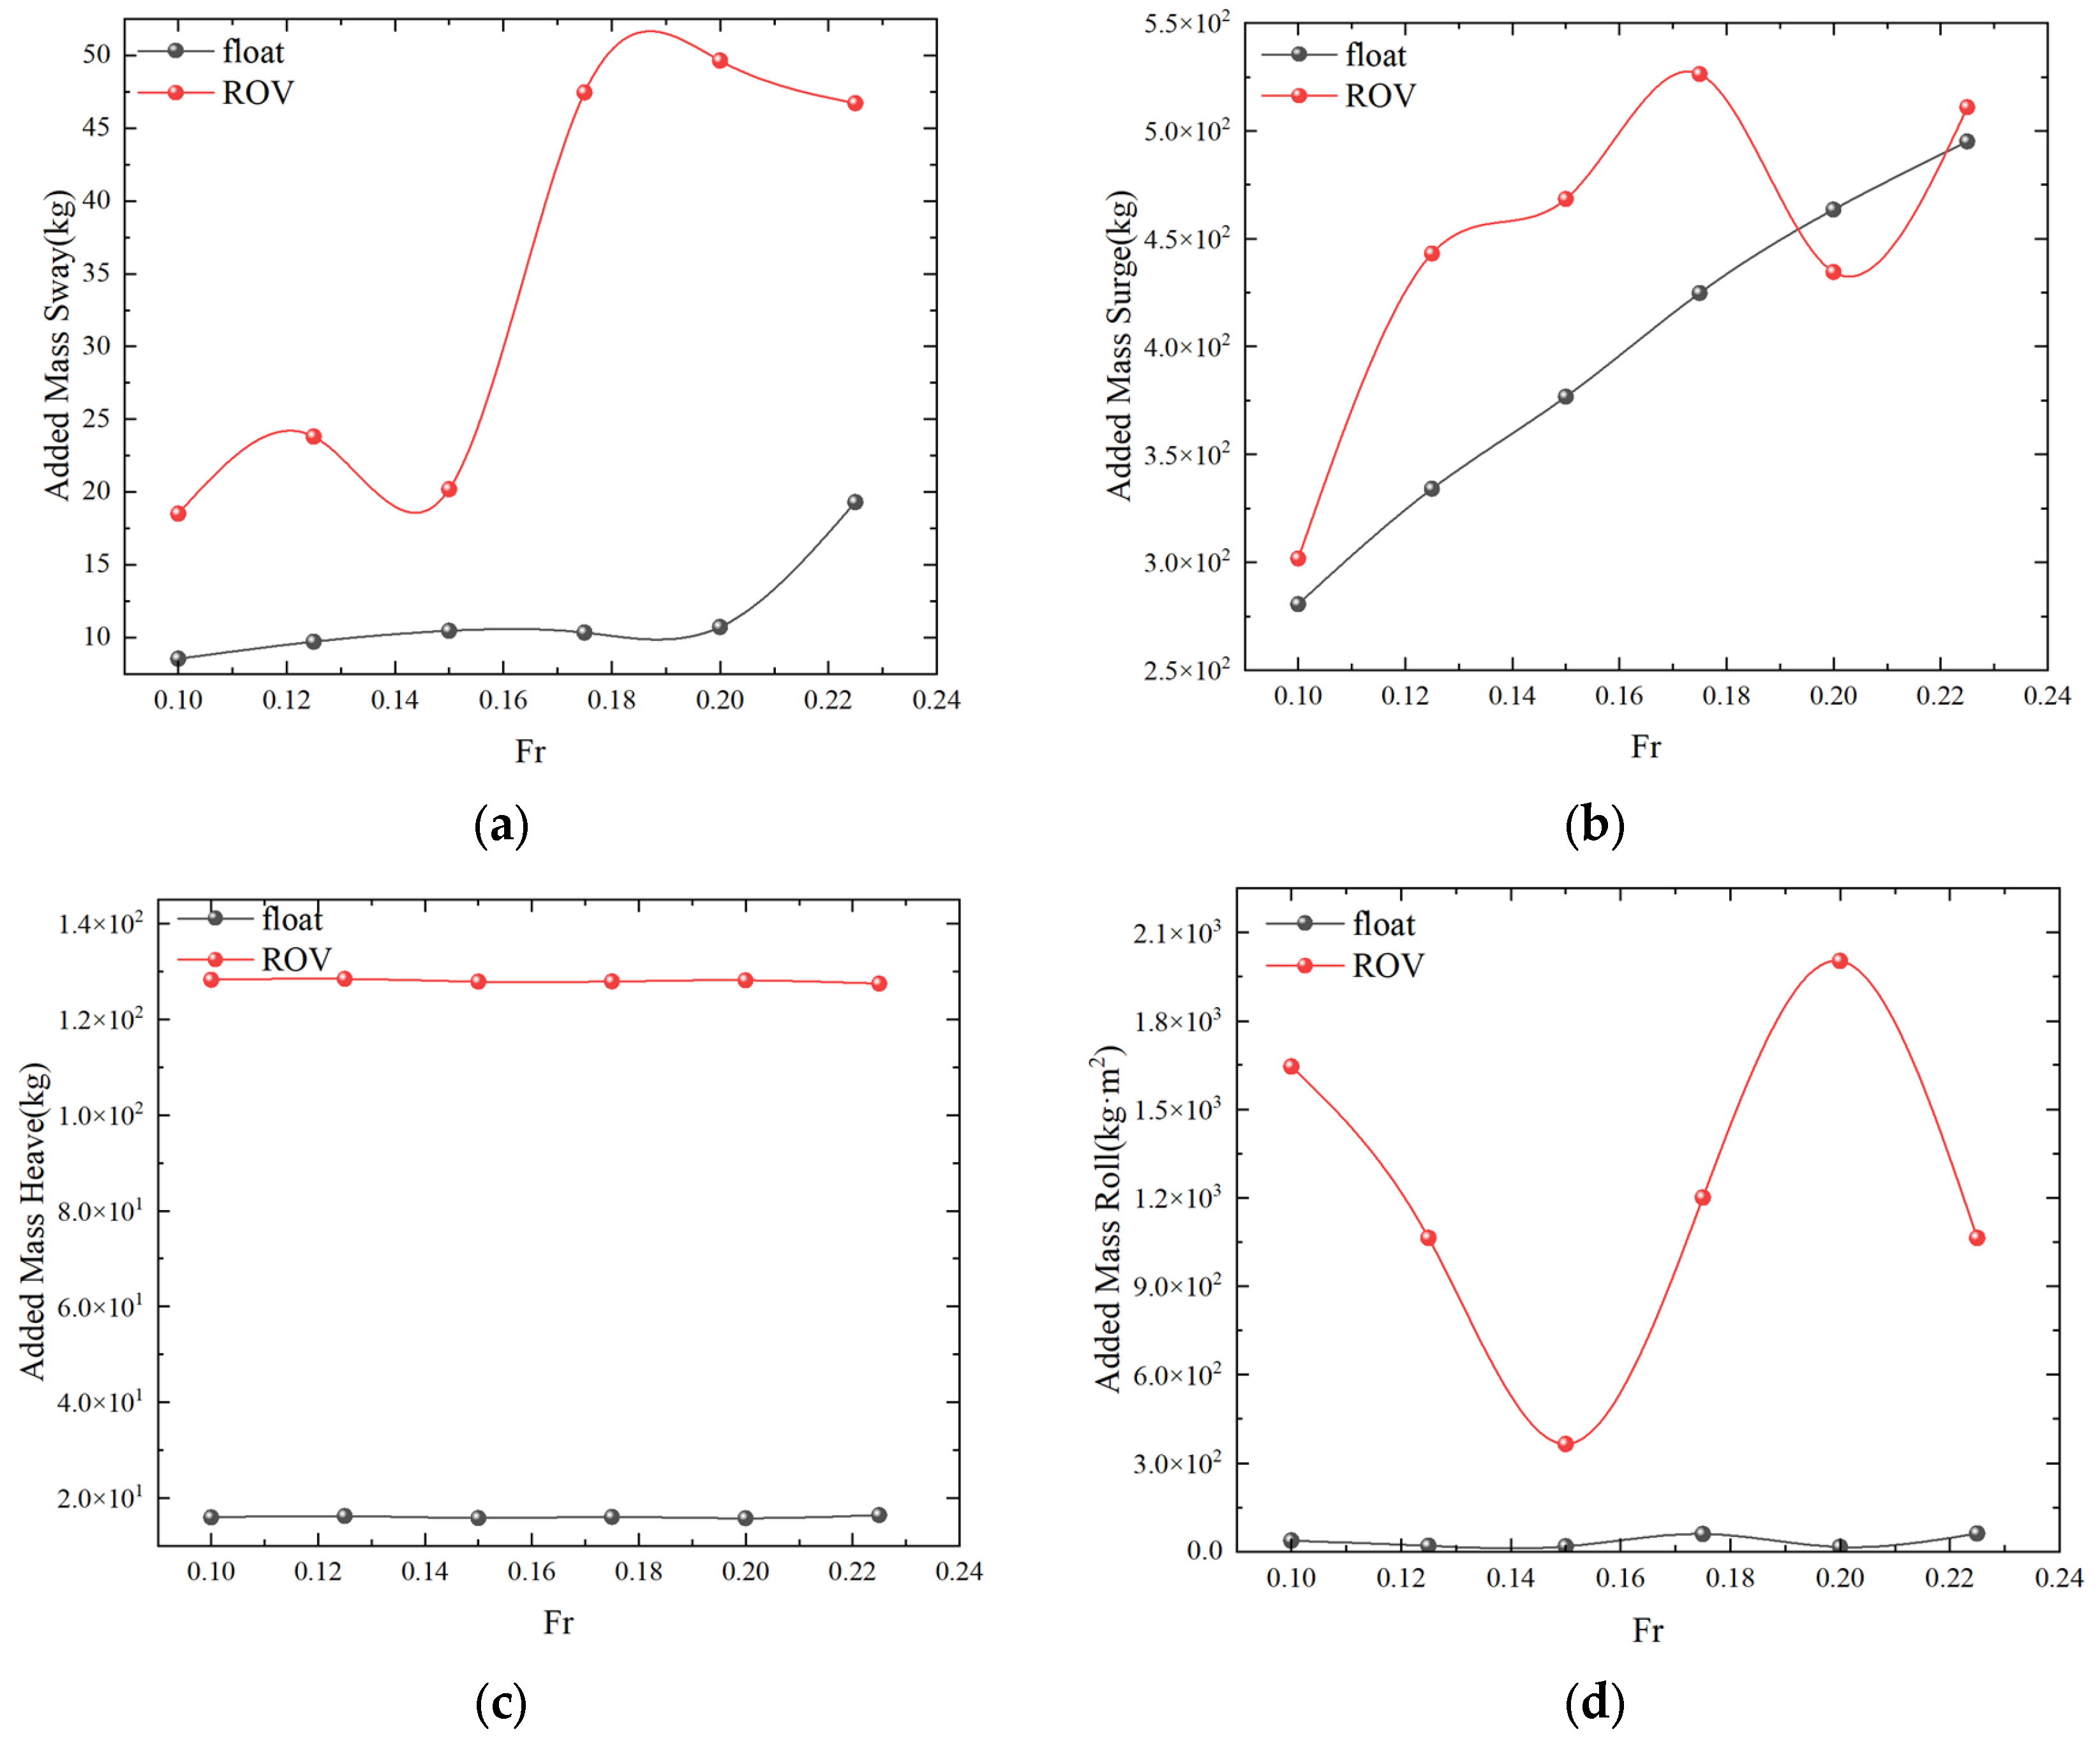
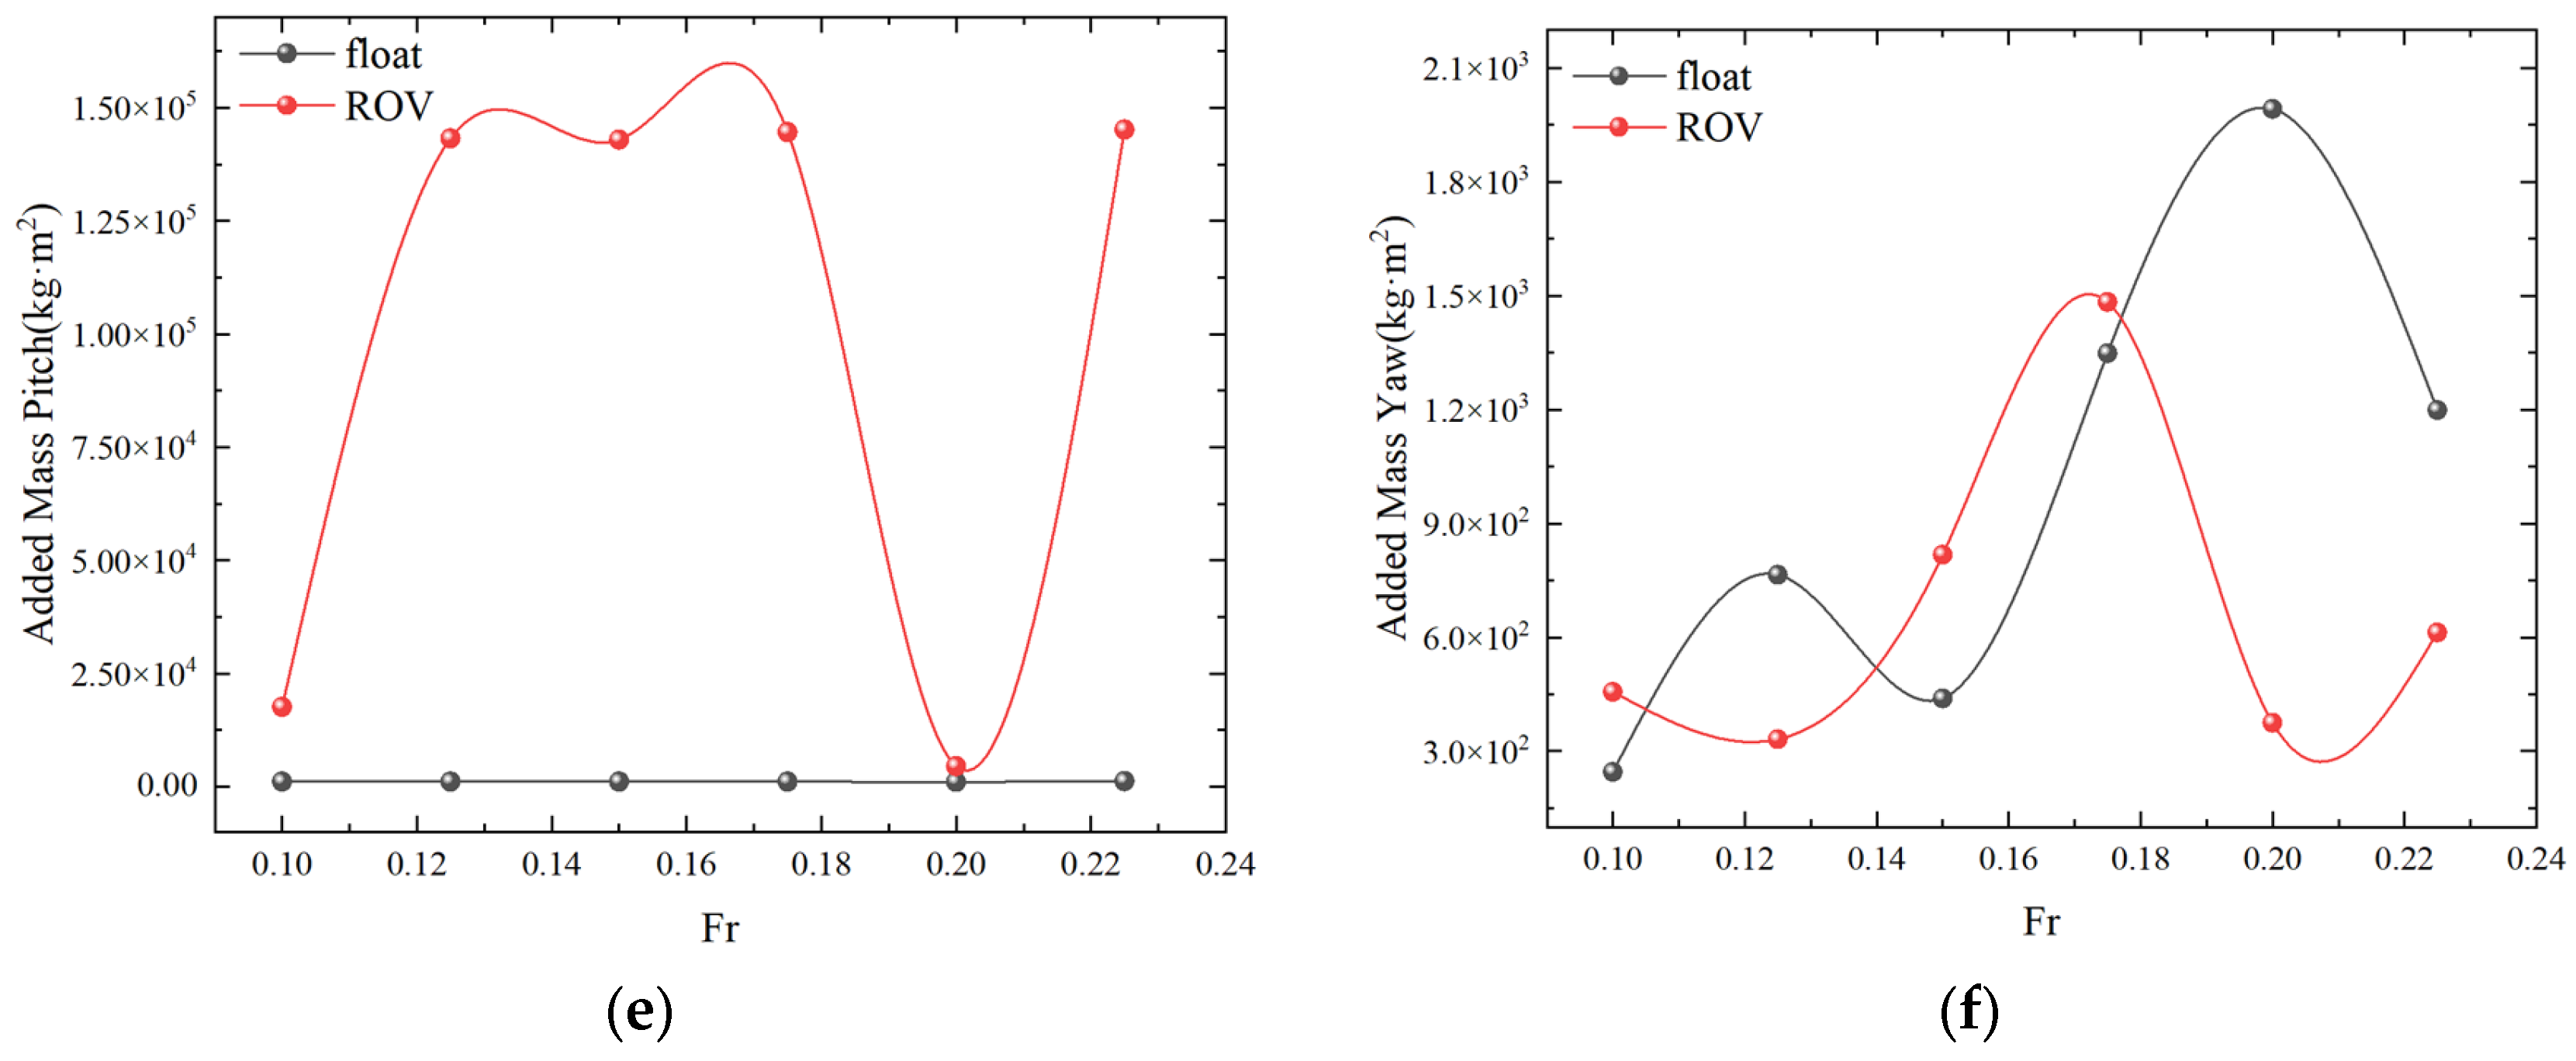
Figure 15 illustrates the added mass of the ROV as it approaches FLOAT at varying berthing speeds. Furthermore, the additional mass is normalized in Figure 15 [40]. The added mass of a double floating body results from the inertial motion of the fluid in the surrounding flow field, induced by the floating body’s motion. The figure reveals that the trend in the added mass of the two floating bodies’ six degrees of freedom varies with the berthing speed, in contrast to their six-degrees-of-freedom motion response. This is because the six-degrees-of-freedom kinematic response of the two floats, as well as the wave force and berthing speed, are related to the ship type, whereas the added mass of the ROV and FLOAT is only related to the shape of the floating body and the berthing speed, so the added mass of the floats is more affected by the hydrodynamic interaction between the two ships. The graphic shows that the ROV has a bigger supplementary mass than the FLOAT, which is owing to the ROV’s larger primary size and mass. The added mass of the two floats results in a significant increase in the sway and the yaw response of the FLOAT at Fr = 0.2. The surge response of the ROV progressively rises with berthing speed, and the reaction of the two floats is most intense in the pitch response stage, which might be attributed to the stronger coupling between the two floats as berthing speed increases. The figure shows that the 6DOFs of the double floats have a lower and more stable motion response RAO at Fr = 0.15–0.18 berthing speed.
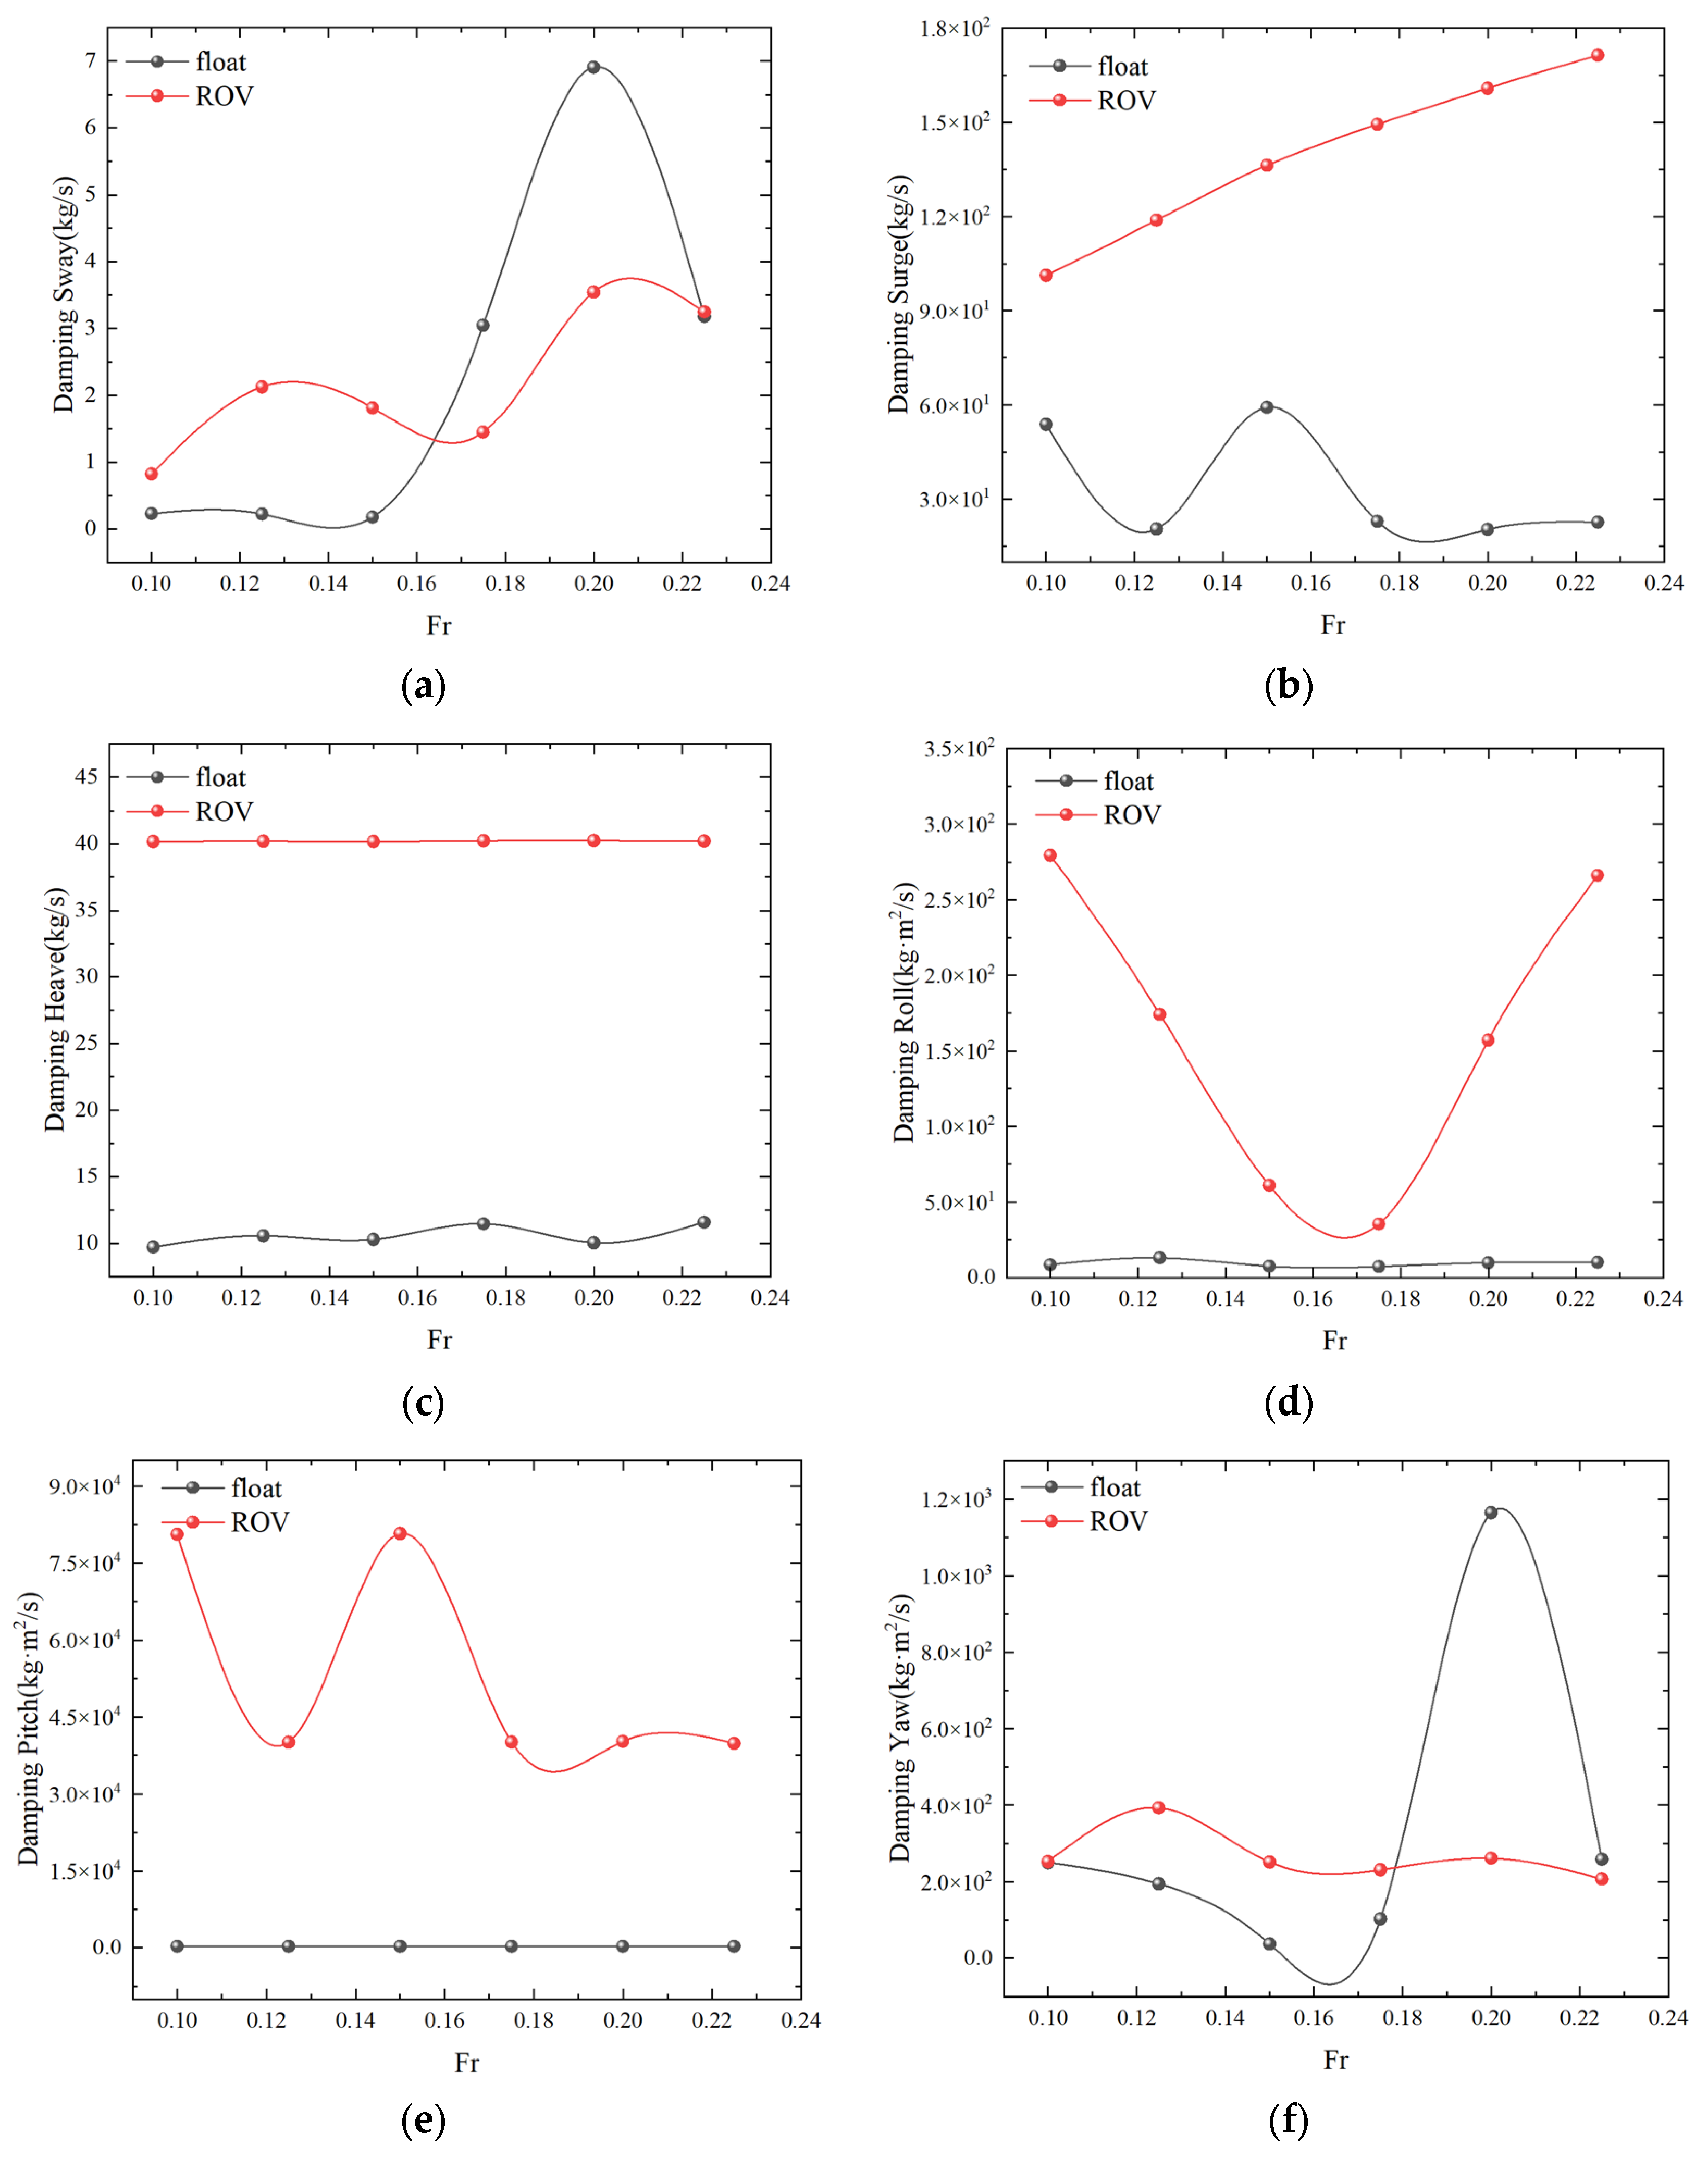
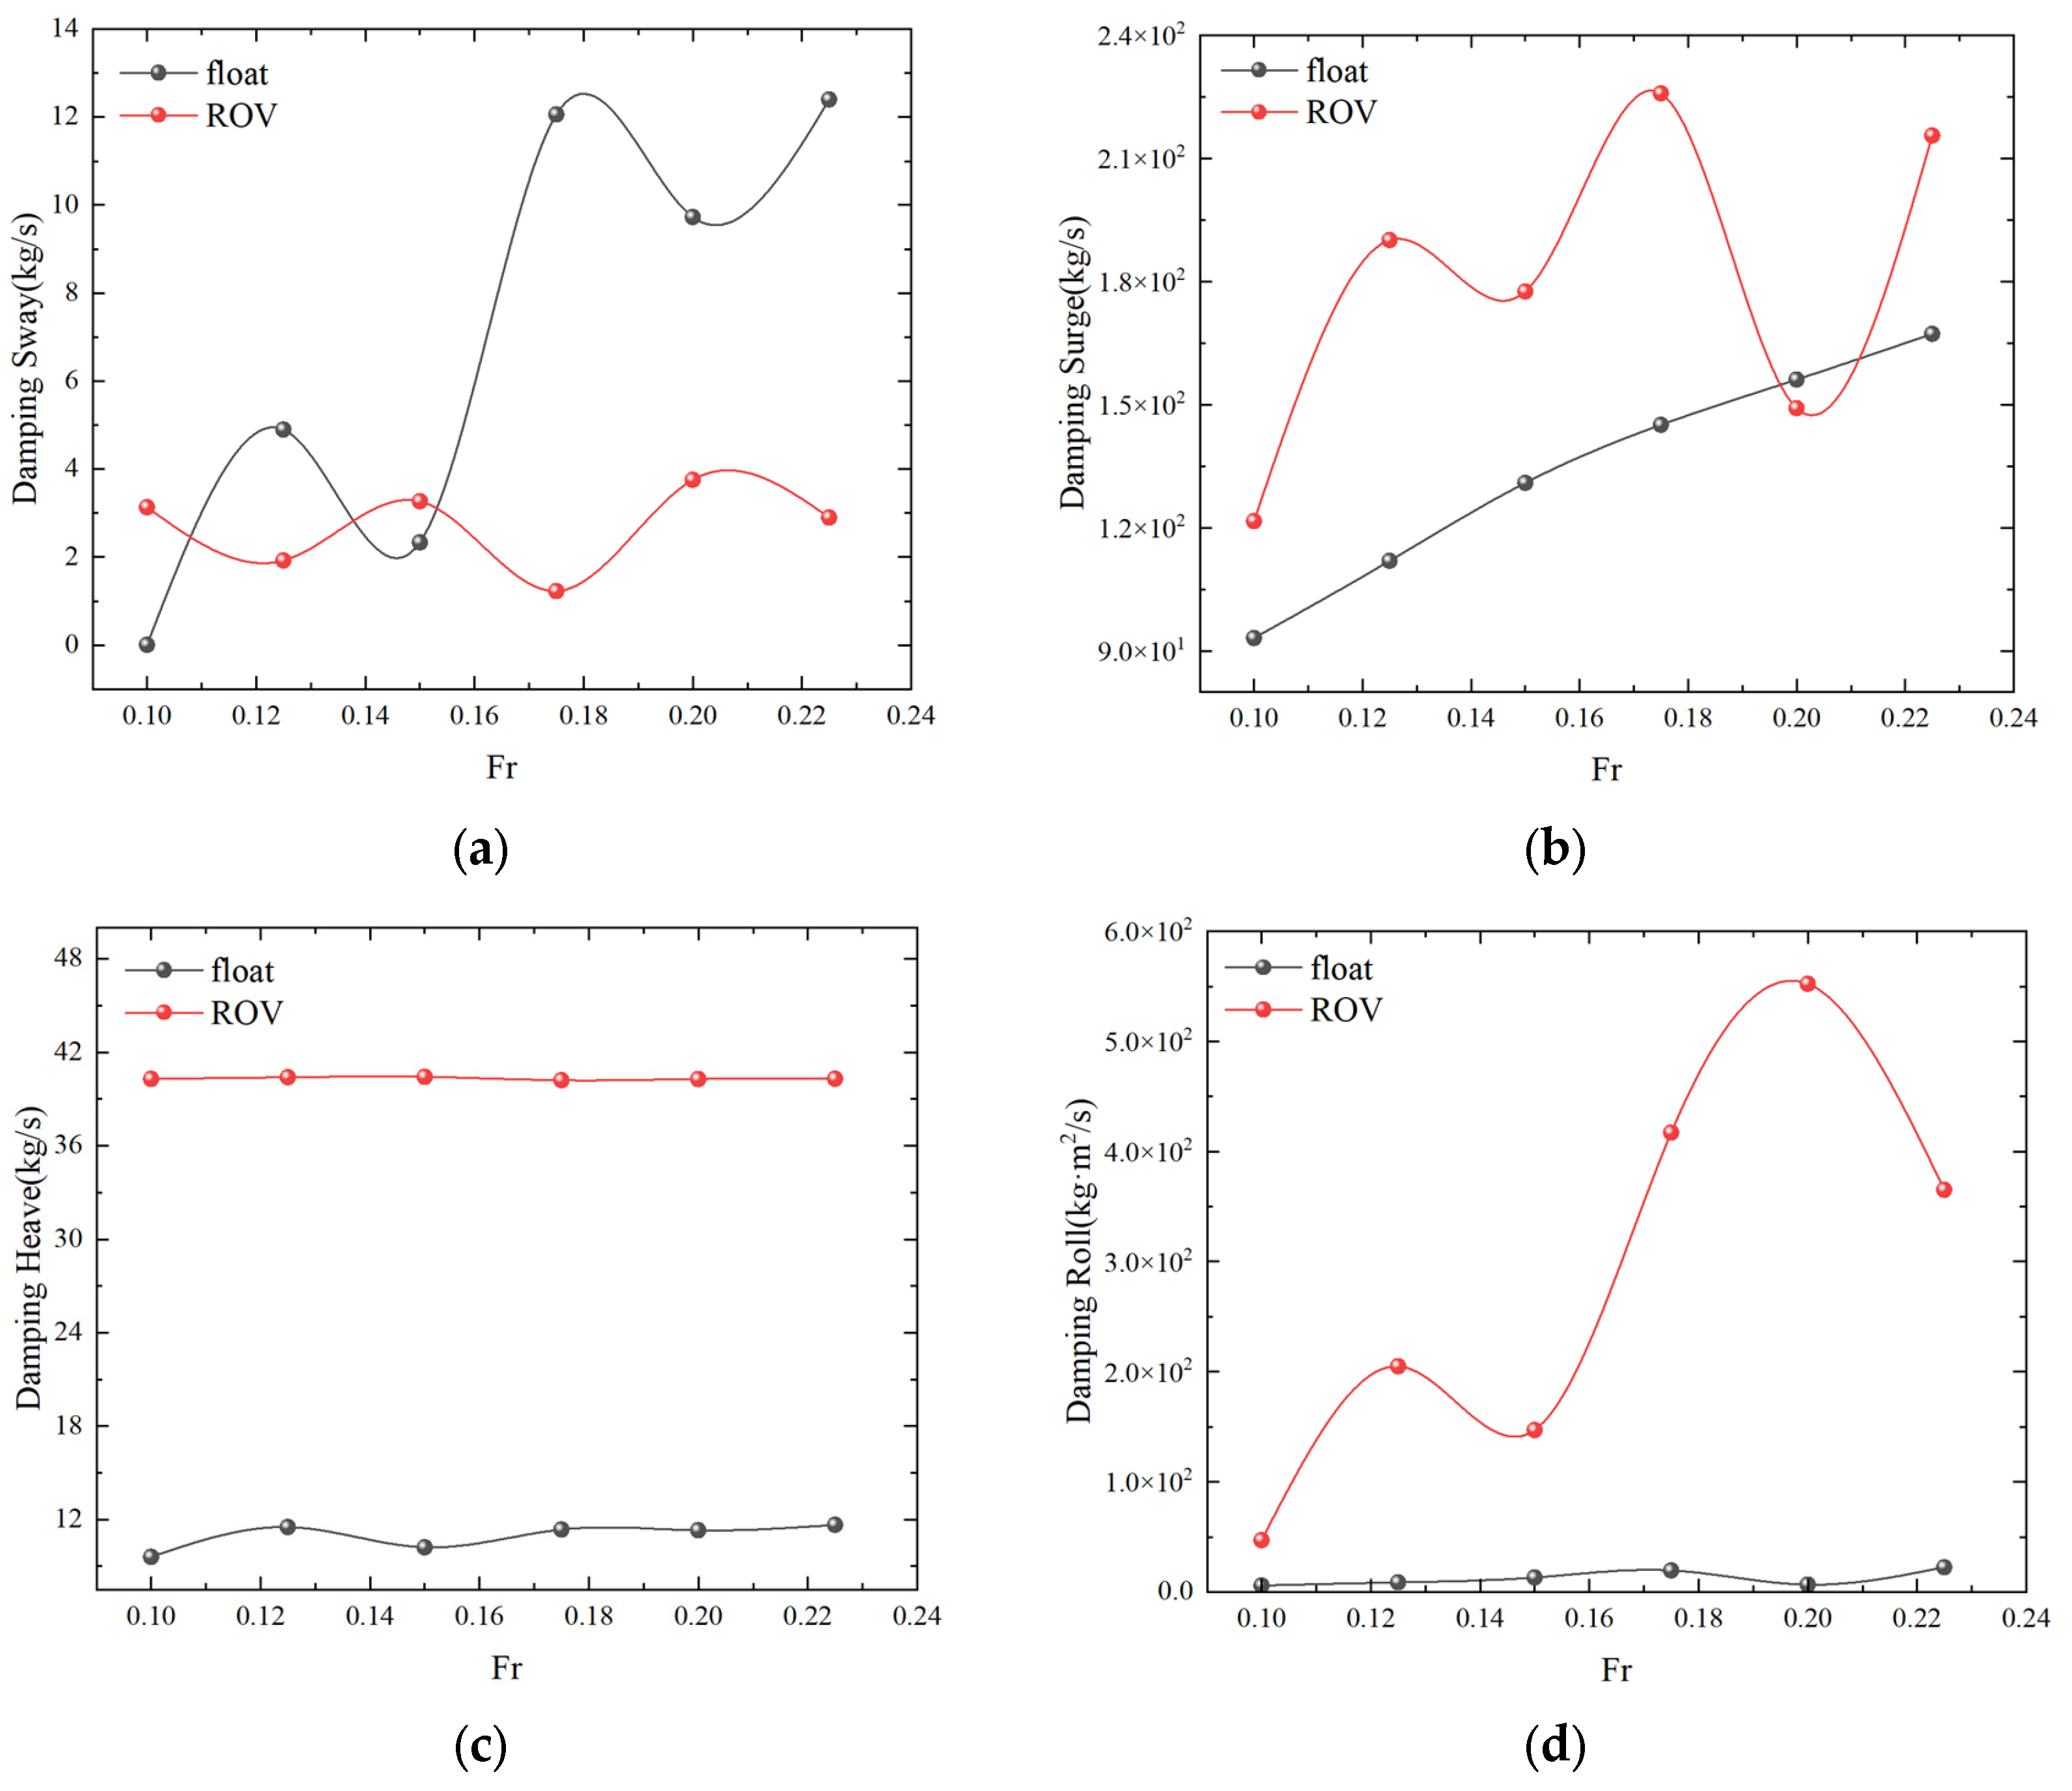
As seen in Figure 16, similar to the results for the added mass of the two floats, the ROV has a higher added mass than the FLOAT due to its bigger primary scale and mass. The fluctuation of the damping coefficient differs somewhat from that of the increased mass. The ROV’s sway reaction increases significantly at Fr = 0.18, but its roll response is minimal at Fr = 0.168. Furthermore, similar to the results for increased mass, the figure shows that the 6DOFs kinematic response RAO of the twin floats is smaller and more stable for Fr = 0.15–0.18 berthing speeds.
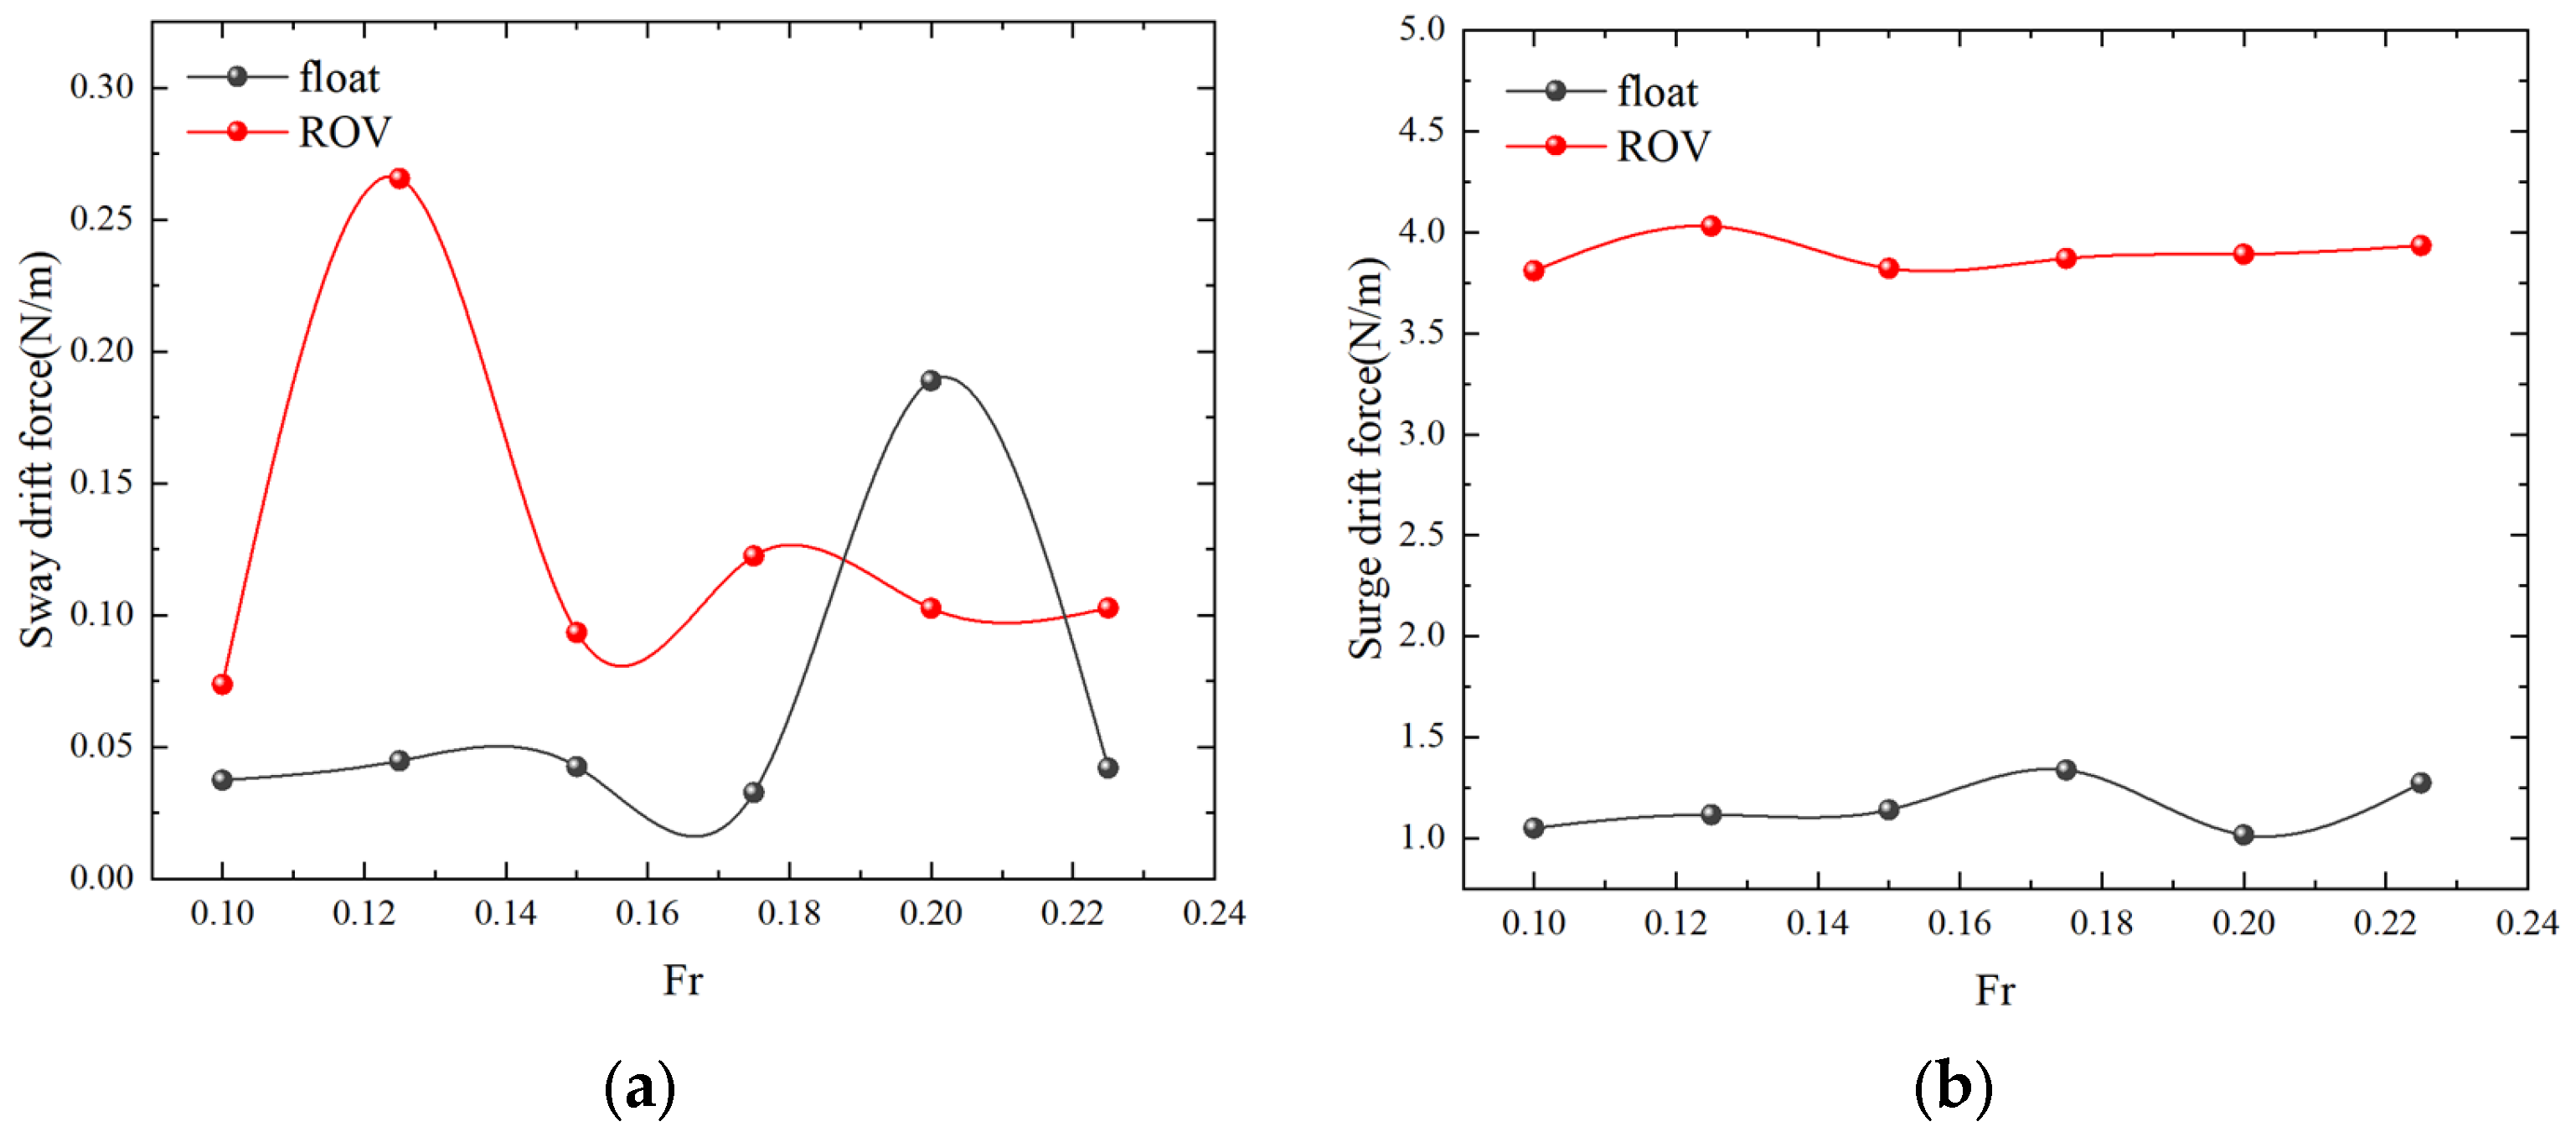
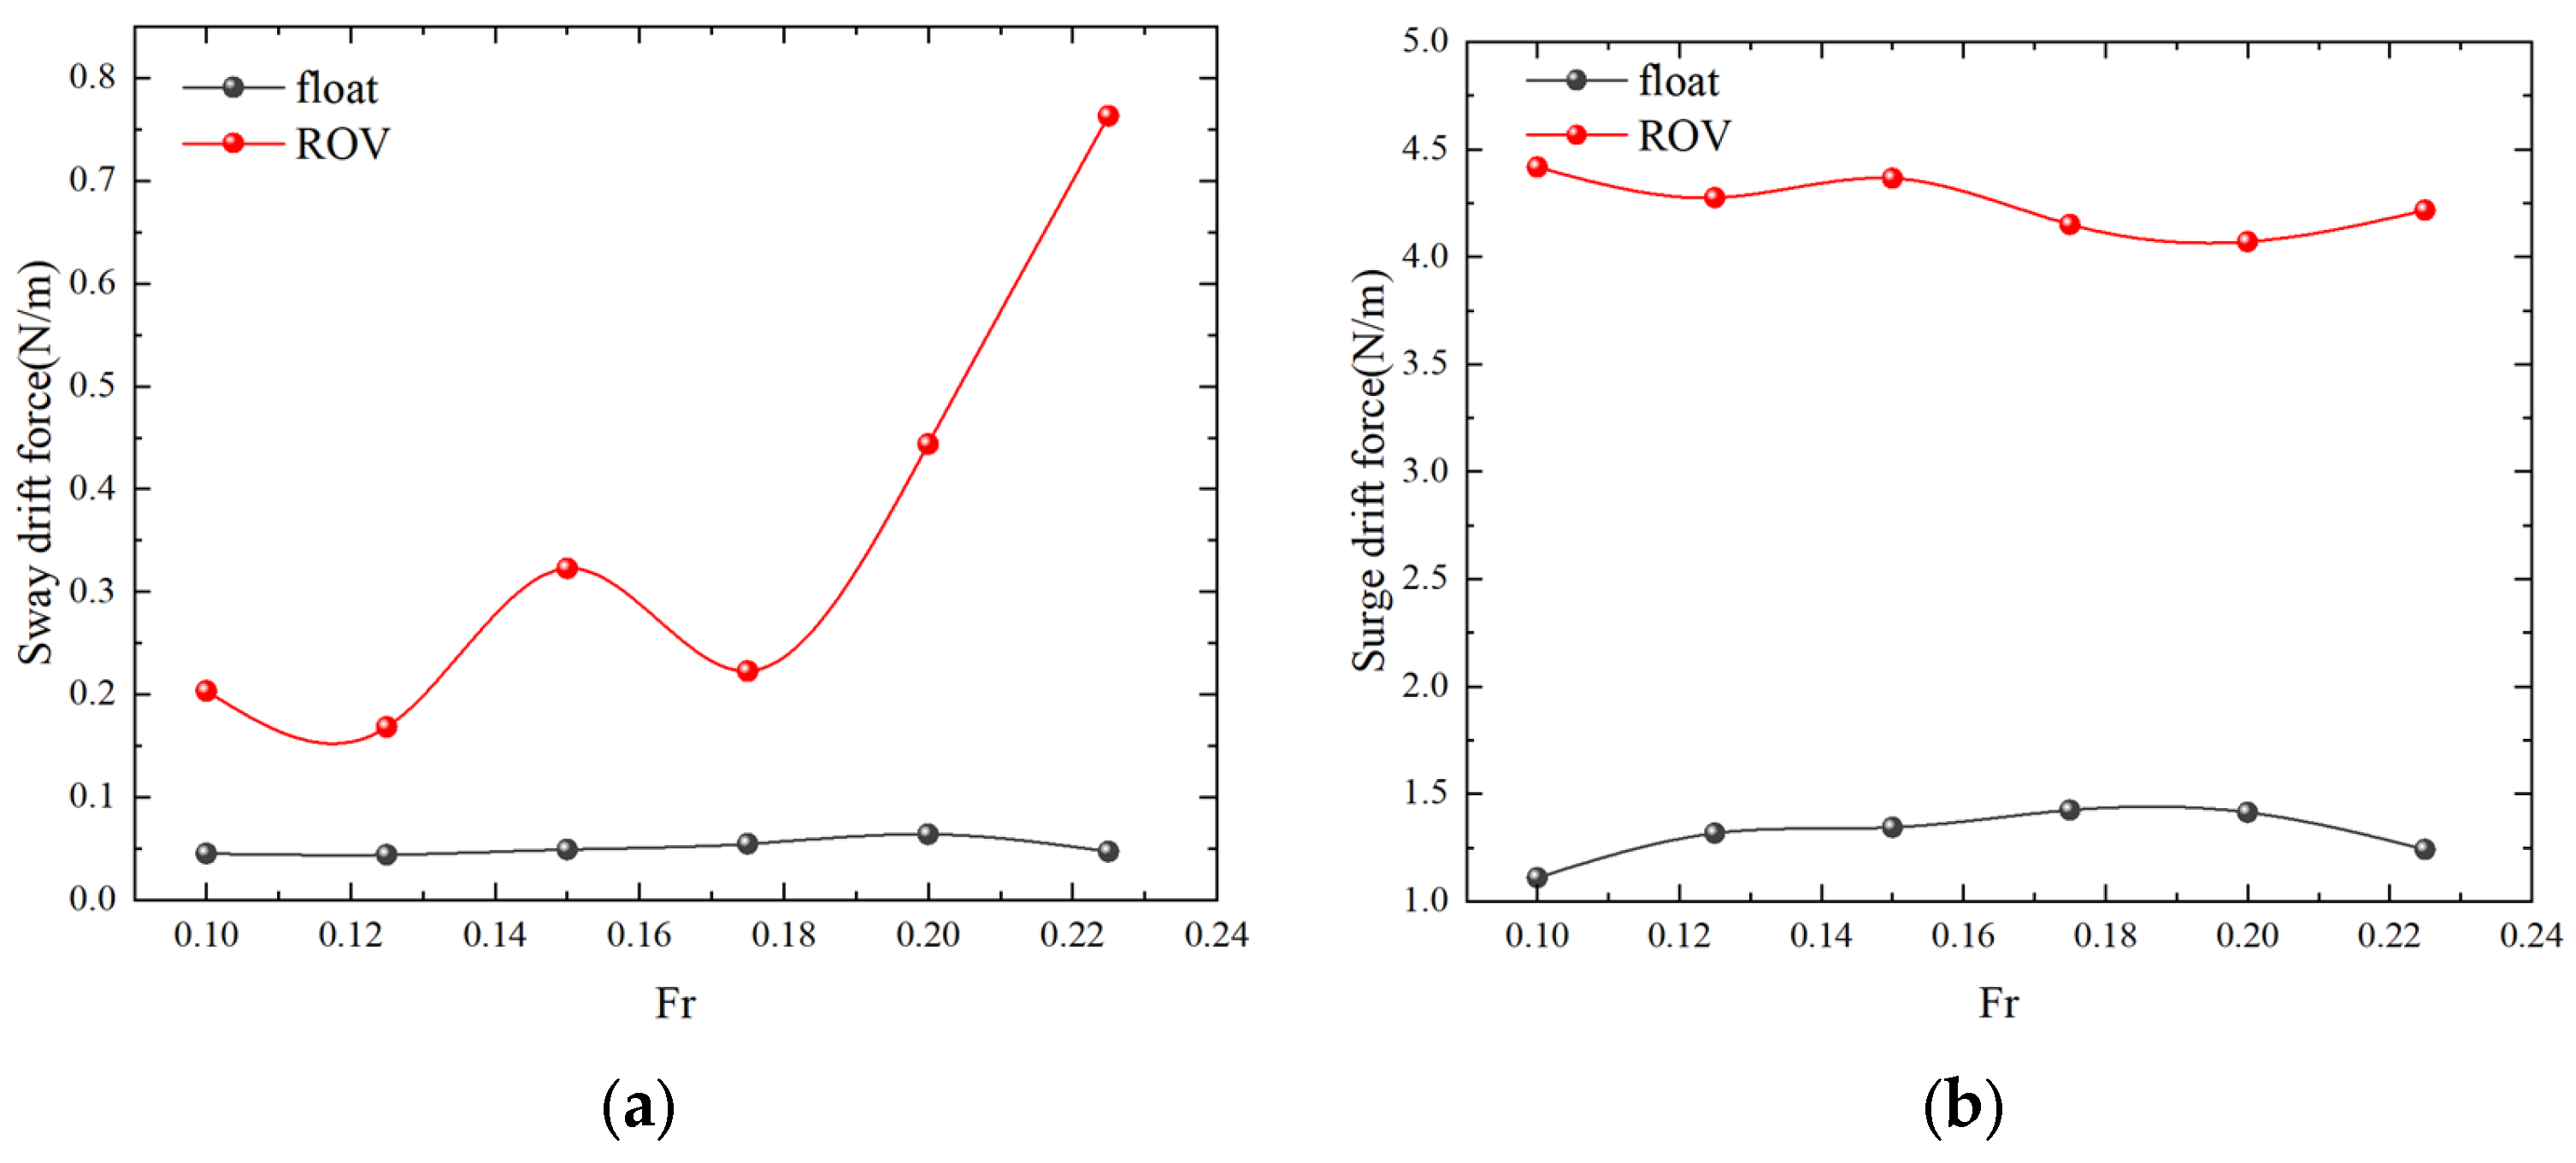
During salvage operations, the berthing motion has a significant impact on both the motion response of the two floats and the safety of the salvage operations. As a result, in this part, the mean drift forces applied to the berthing speeds of the two floats, including sway and surge motions, are analyzed. Figure 17 depicts the resulting curves of the horizontal mean drift force of the two floats under the influence of the first wave at varying berthing speeds. The curves in the figure show that the sway mean drift force of the twin floats reaches a relatively ideal state at Fr = 0.15, and the sway RAO response of the ROV is the greatest at Fr = 0.125, which could be due to the ROV’s large self-weight relative to the FLOAT at low sailing speeds. This results in significant float movement in the ROV, thereby affecting the sway motion response of the float. The surge mean drift force of the double floats follows a rather smooth pattern with increasing berthing speed, and berthing speed has minimal influence on the surge mean drift force of the double floats. The recommended berthing speed interval is Fr = 0.15–0.18.
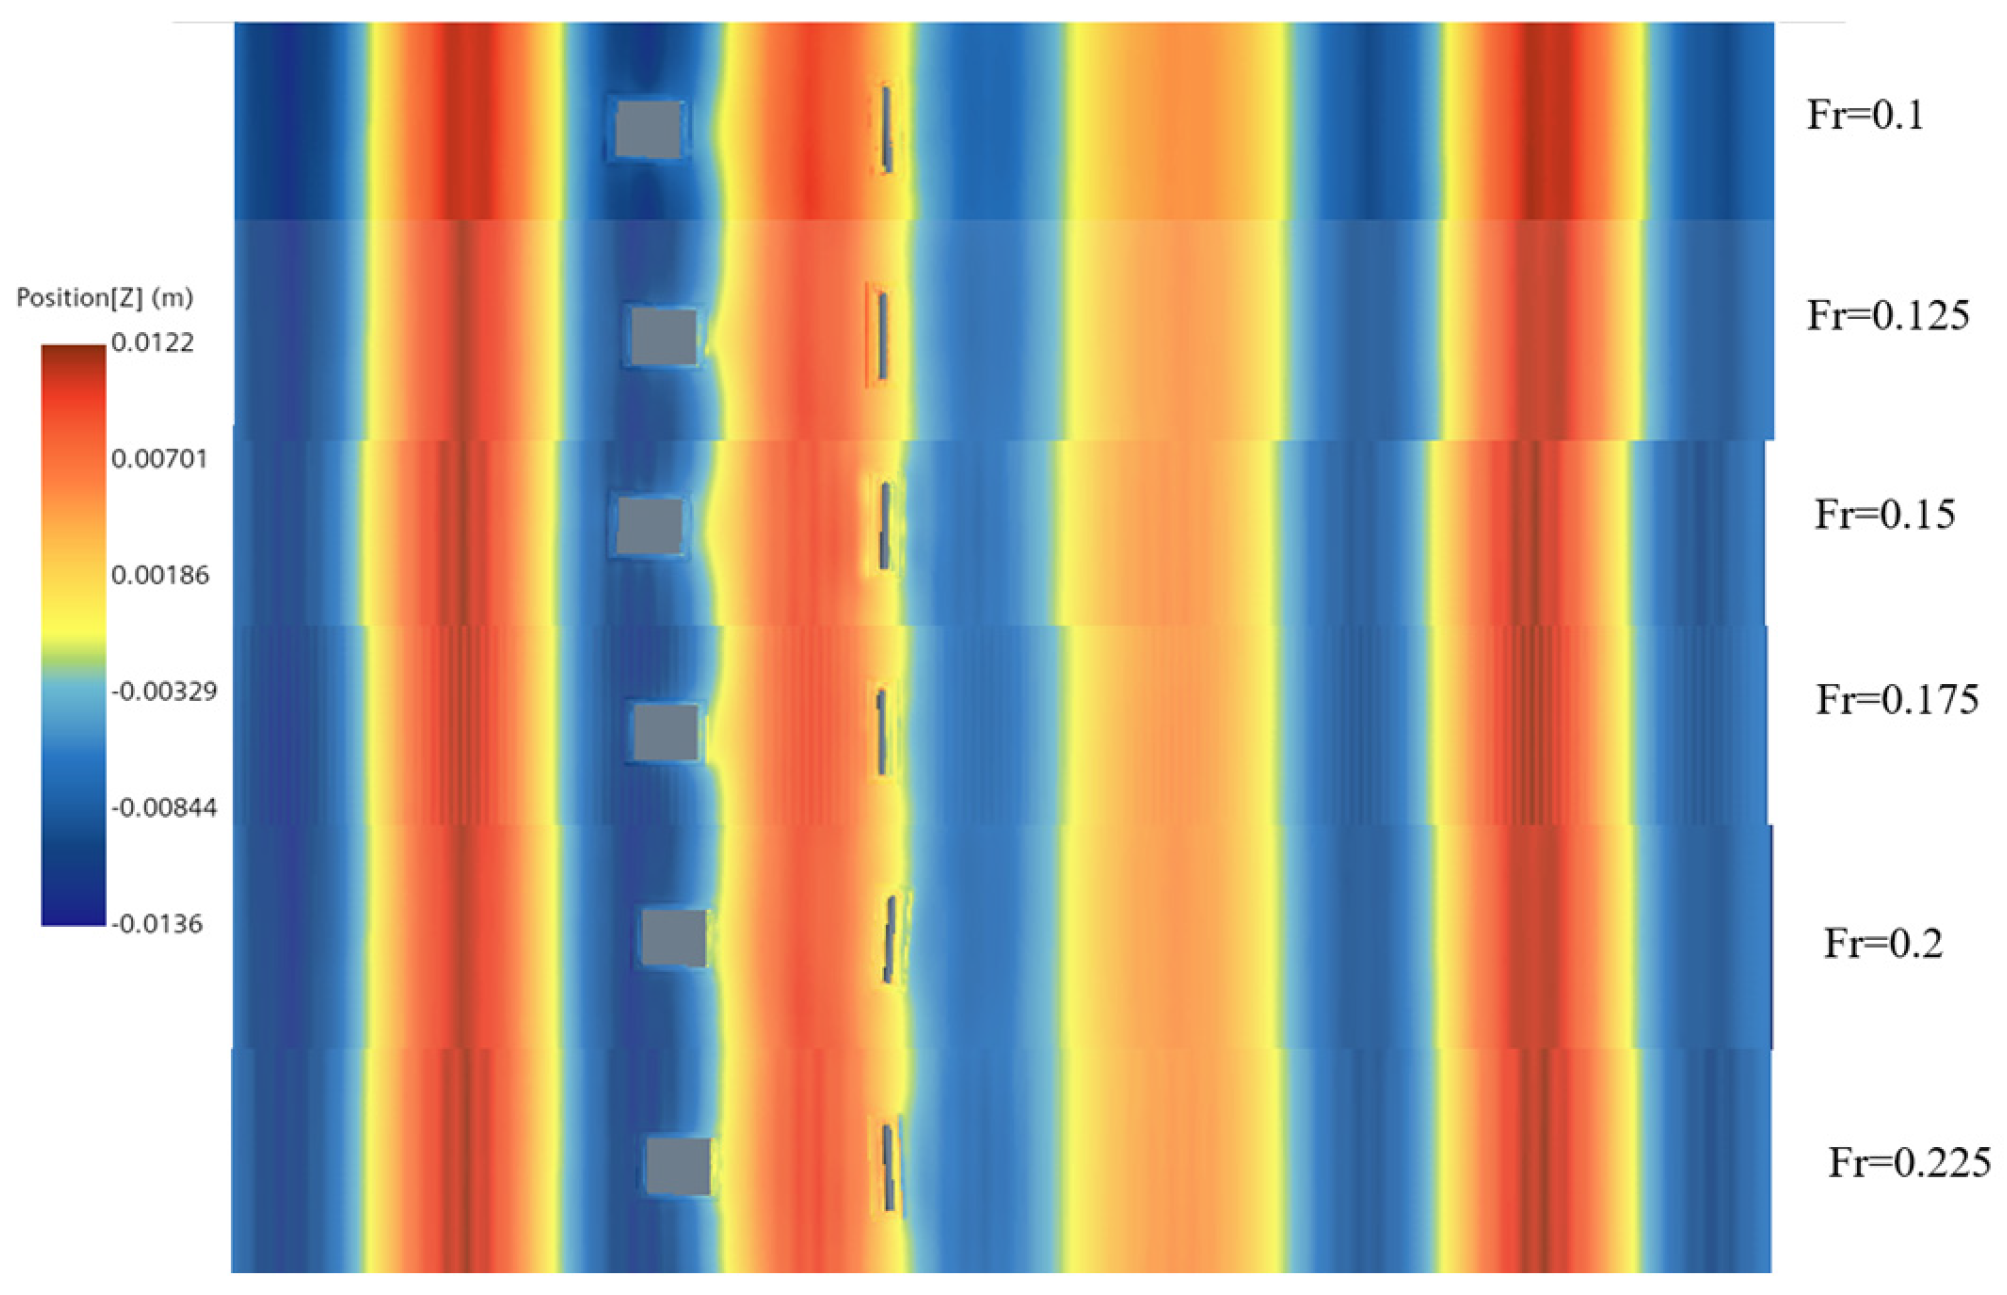
This section delves into the wave situations of a dual floating body subjected to waves and currents. Figure 18 illustrates the comparative wave cloud maps of the two floating bodies at different berthing speeds at a certain moment. In the early phase of the simulation, with no waves propagating through, the wake response of the two vessels is minimal and nearly identical, with fluid diffraction at both ends remaining inconspicuous. At this point, the wave surface elevation is primarily driven by fluid motion beneath the floating body. As waves reach the front of the ROV, the leading edge encounters wave forces, prompting the entire floating body to respond with six degrees of freedom, which in turn affects the water surface at the ROV’s rear and generates a significant wake. As the ROV nears FLOAT, the influence of waves on the ROV becomes increasingly pronounced. Wave cloud map analysis reveals that the maximum wave peak between the floating bodies at Fr = 0.15 and Fr = 0.175 is 1.8 times that of the incident wave, while at Fr = 0.225, the peak wave height is 2.6 times the incident wave, and at Fr = 0.1, it is 1.3 times the incident wave.

4.3. Characteristics of Double Floating Body Side-by-Side Motion

4.3.1. Effect of Spacing between Double Floats on Salvage Systems

The respective placements of the ROVs must be considered when salvaging the floats. In this section, the motion of the double floats is simulated at various spacings, and the results are displayed in Figure 19, where L is L1/2.
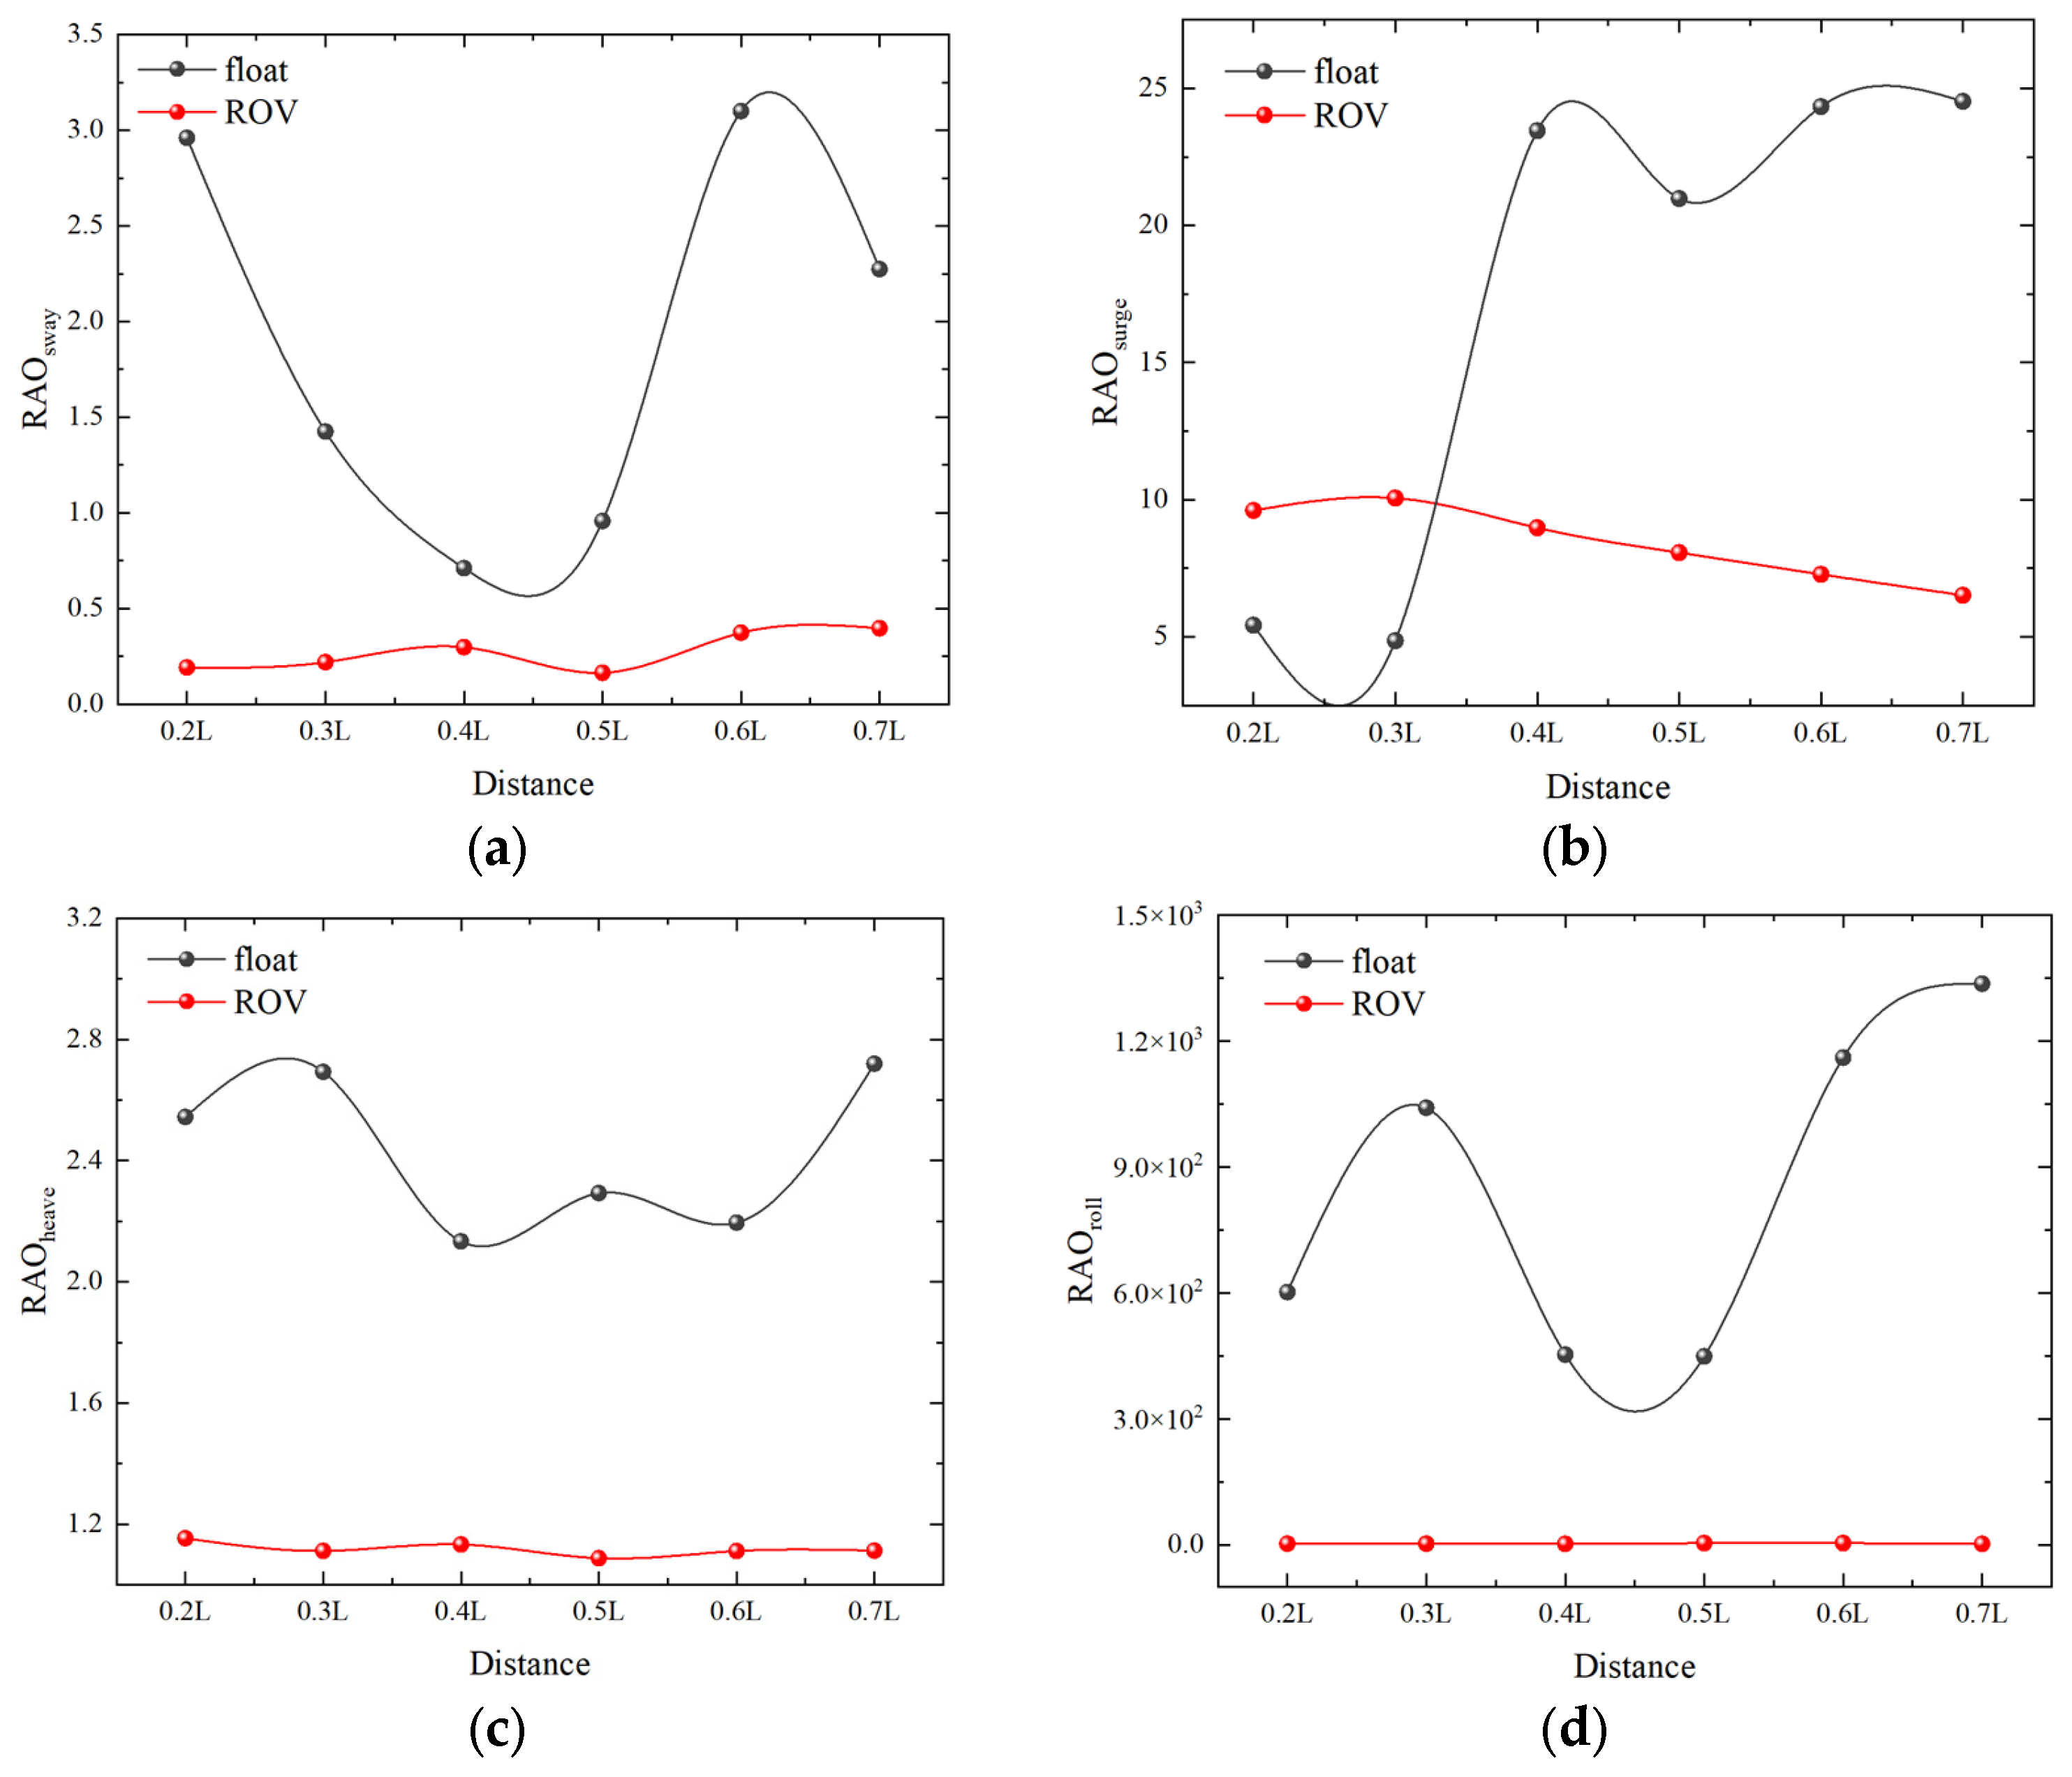
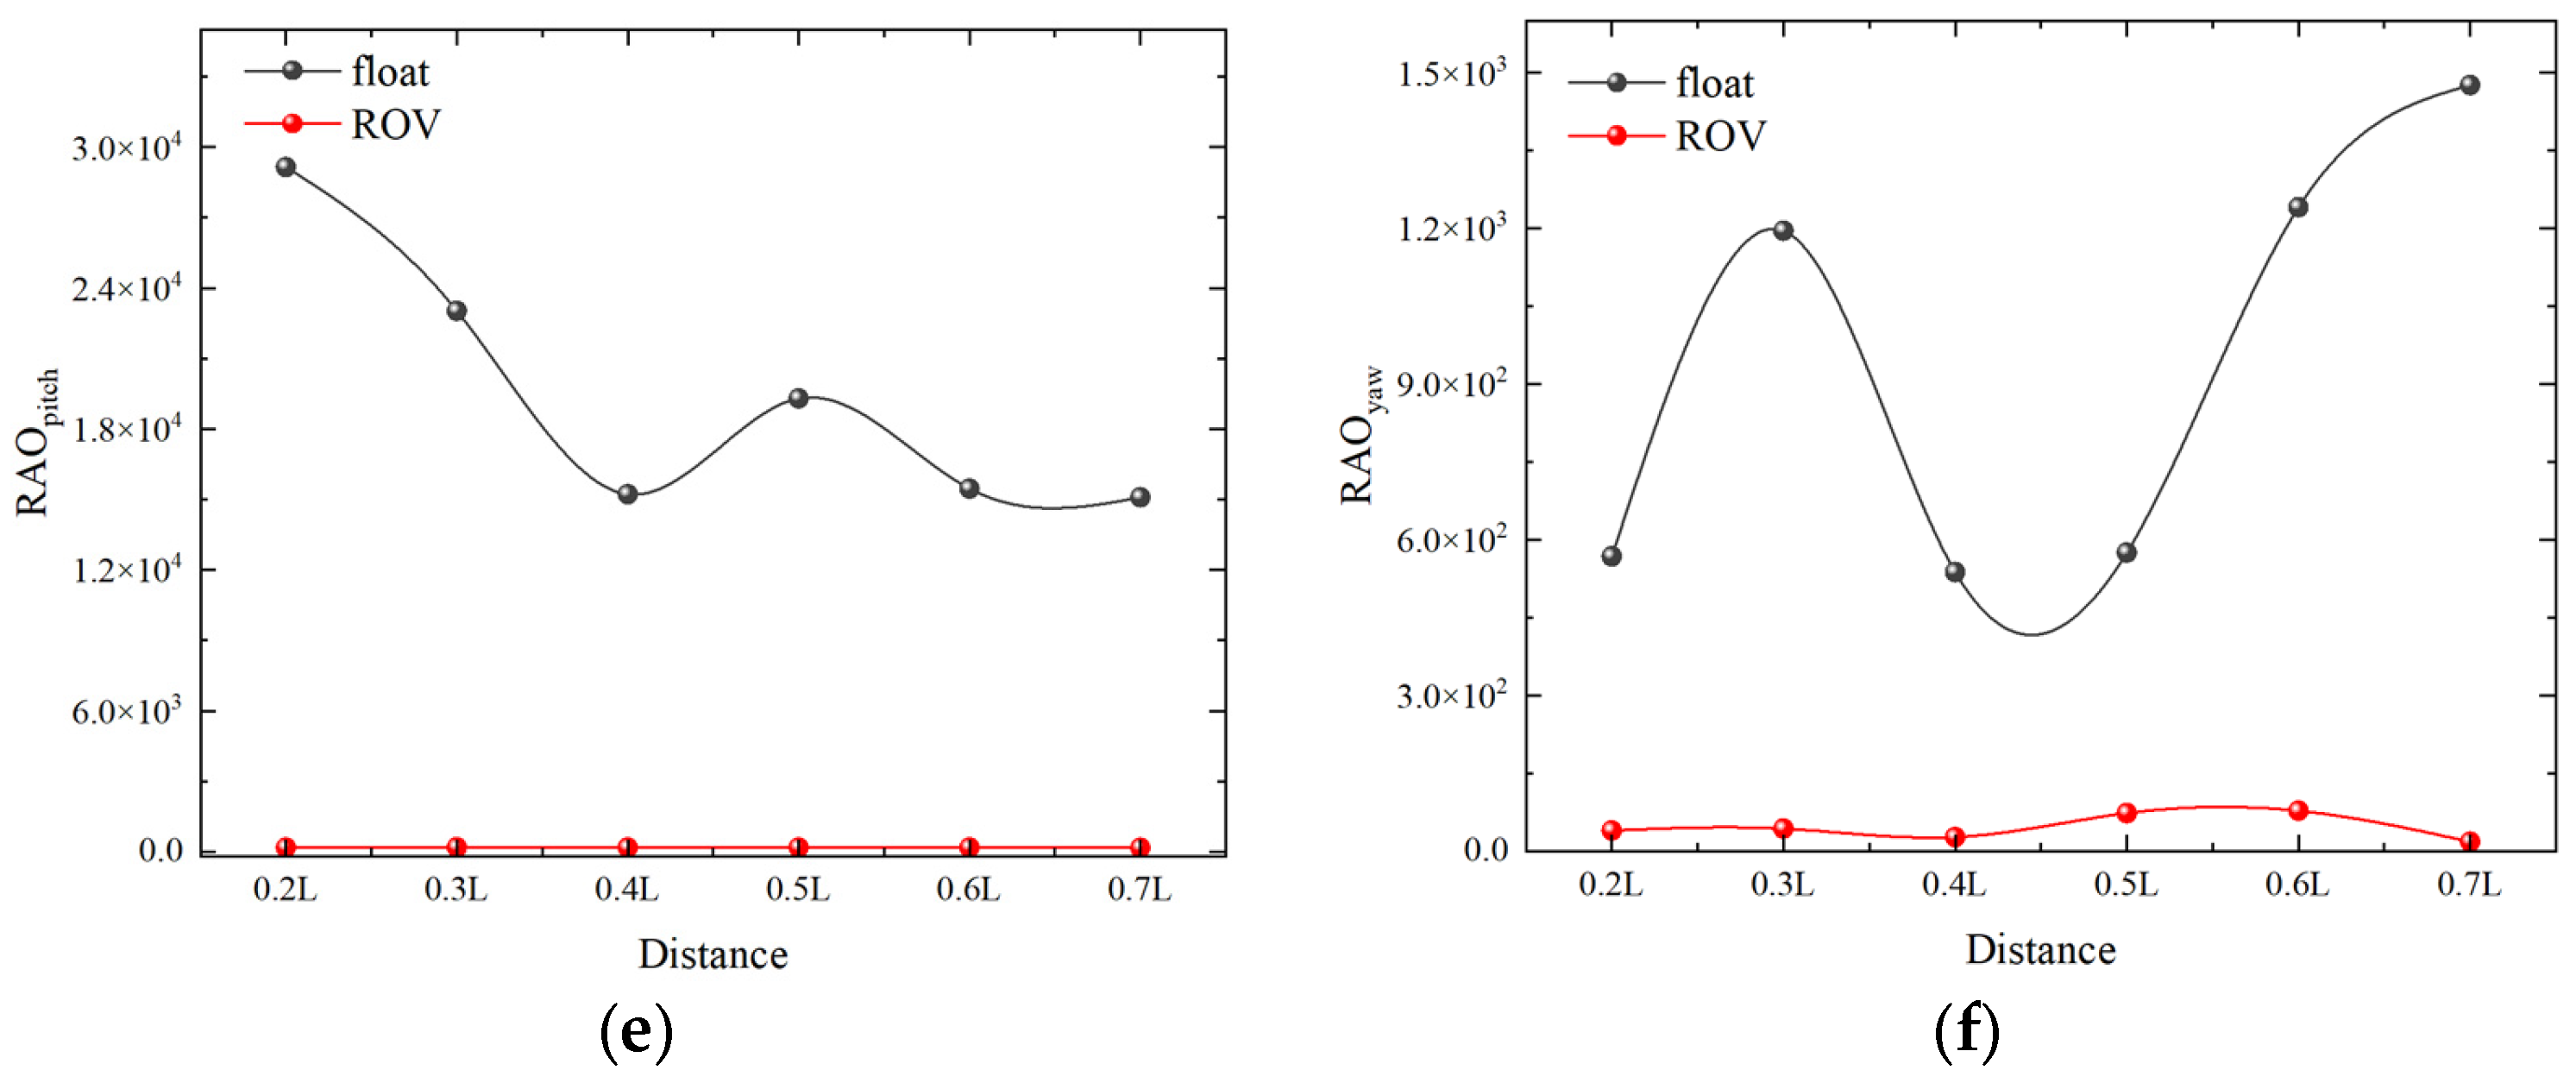
When the float spacing is very tiny, as demonstrated in Figure 19a, sway and (b) surge RAO, the computational results are either too big or too small owing to the resonance of the interstitial water body at 0.25 L spacing. When the float spacing is high, Figure 19b surge, Figure 19c heave, Figure 19d roll, and Figure 19f yaw RAO responses all peak at 0.7 L. When the spacing is 0.45 L, the RAO responses for sway, roll, and yaw are at their minimum.
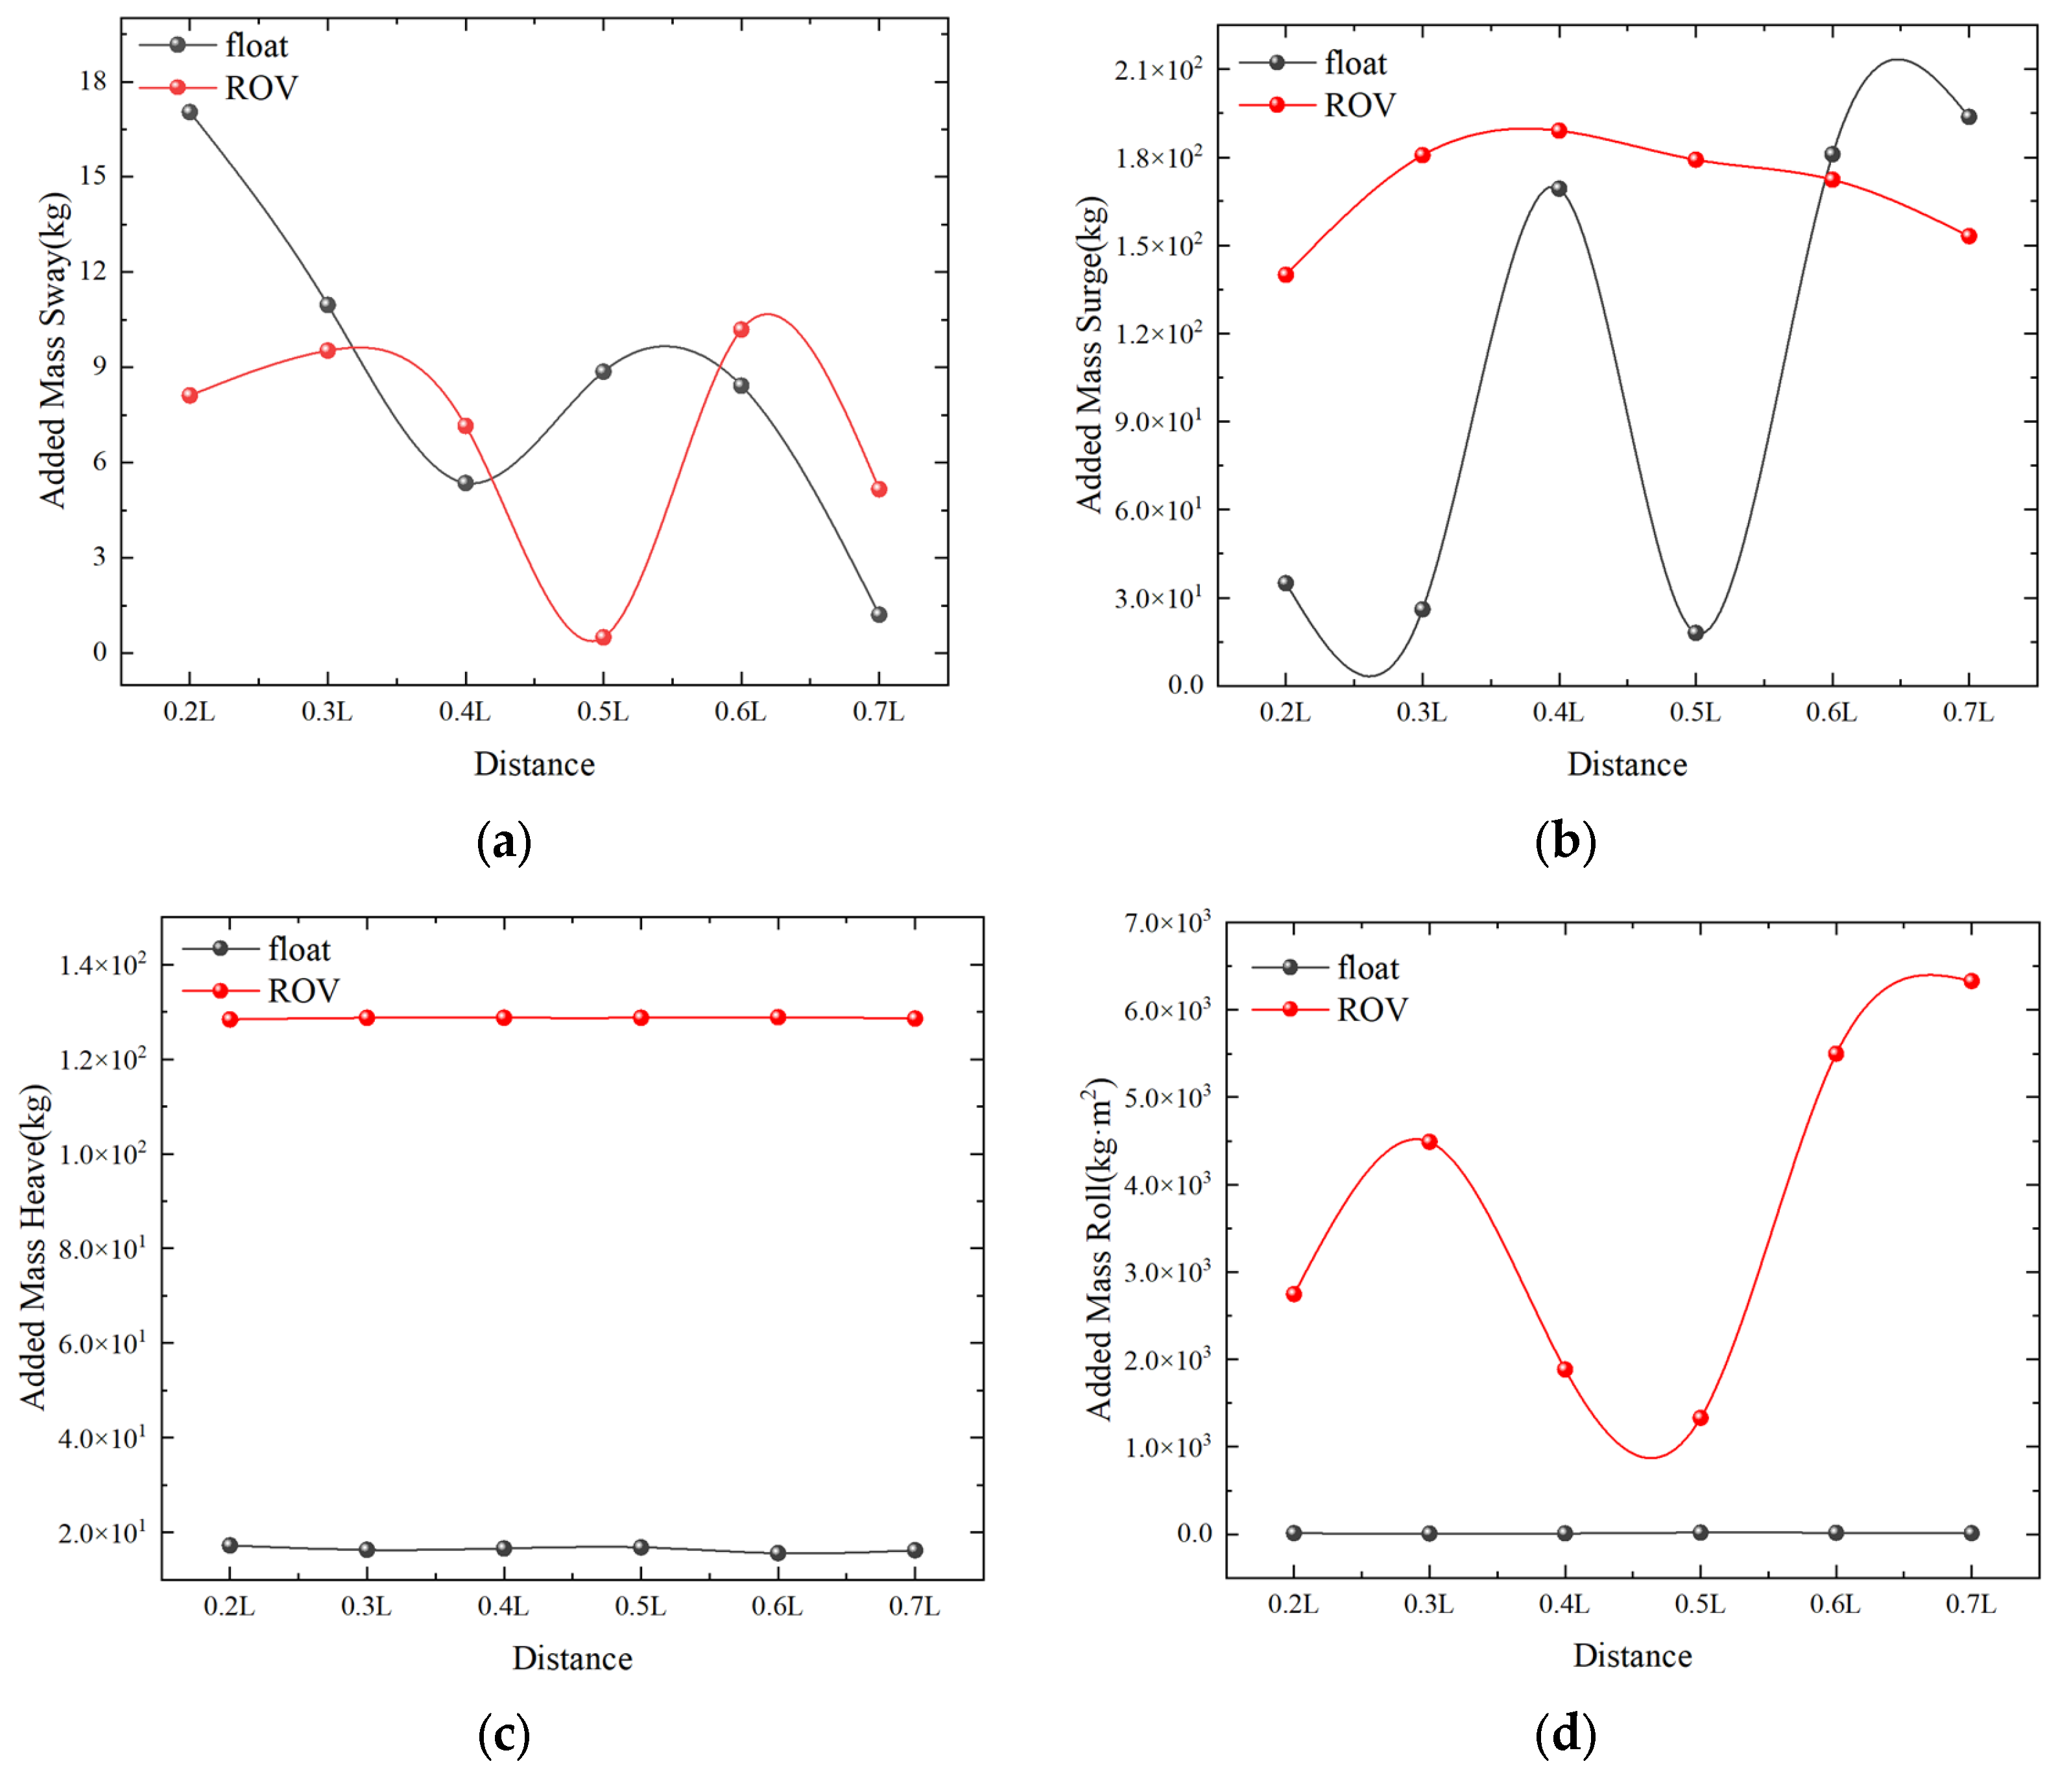
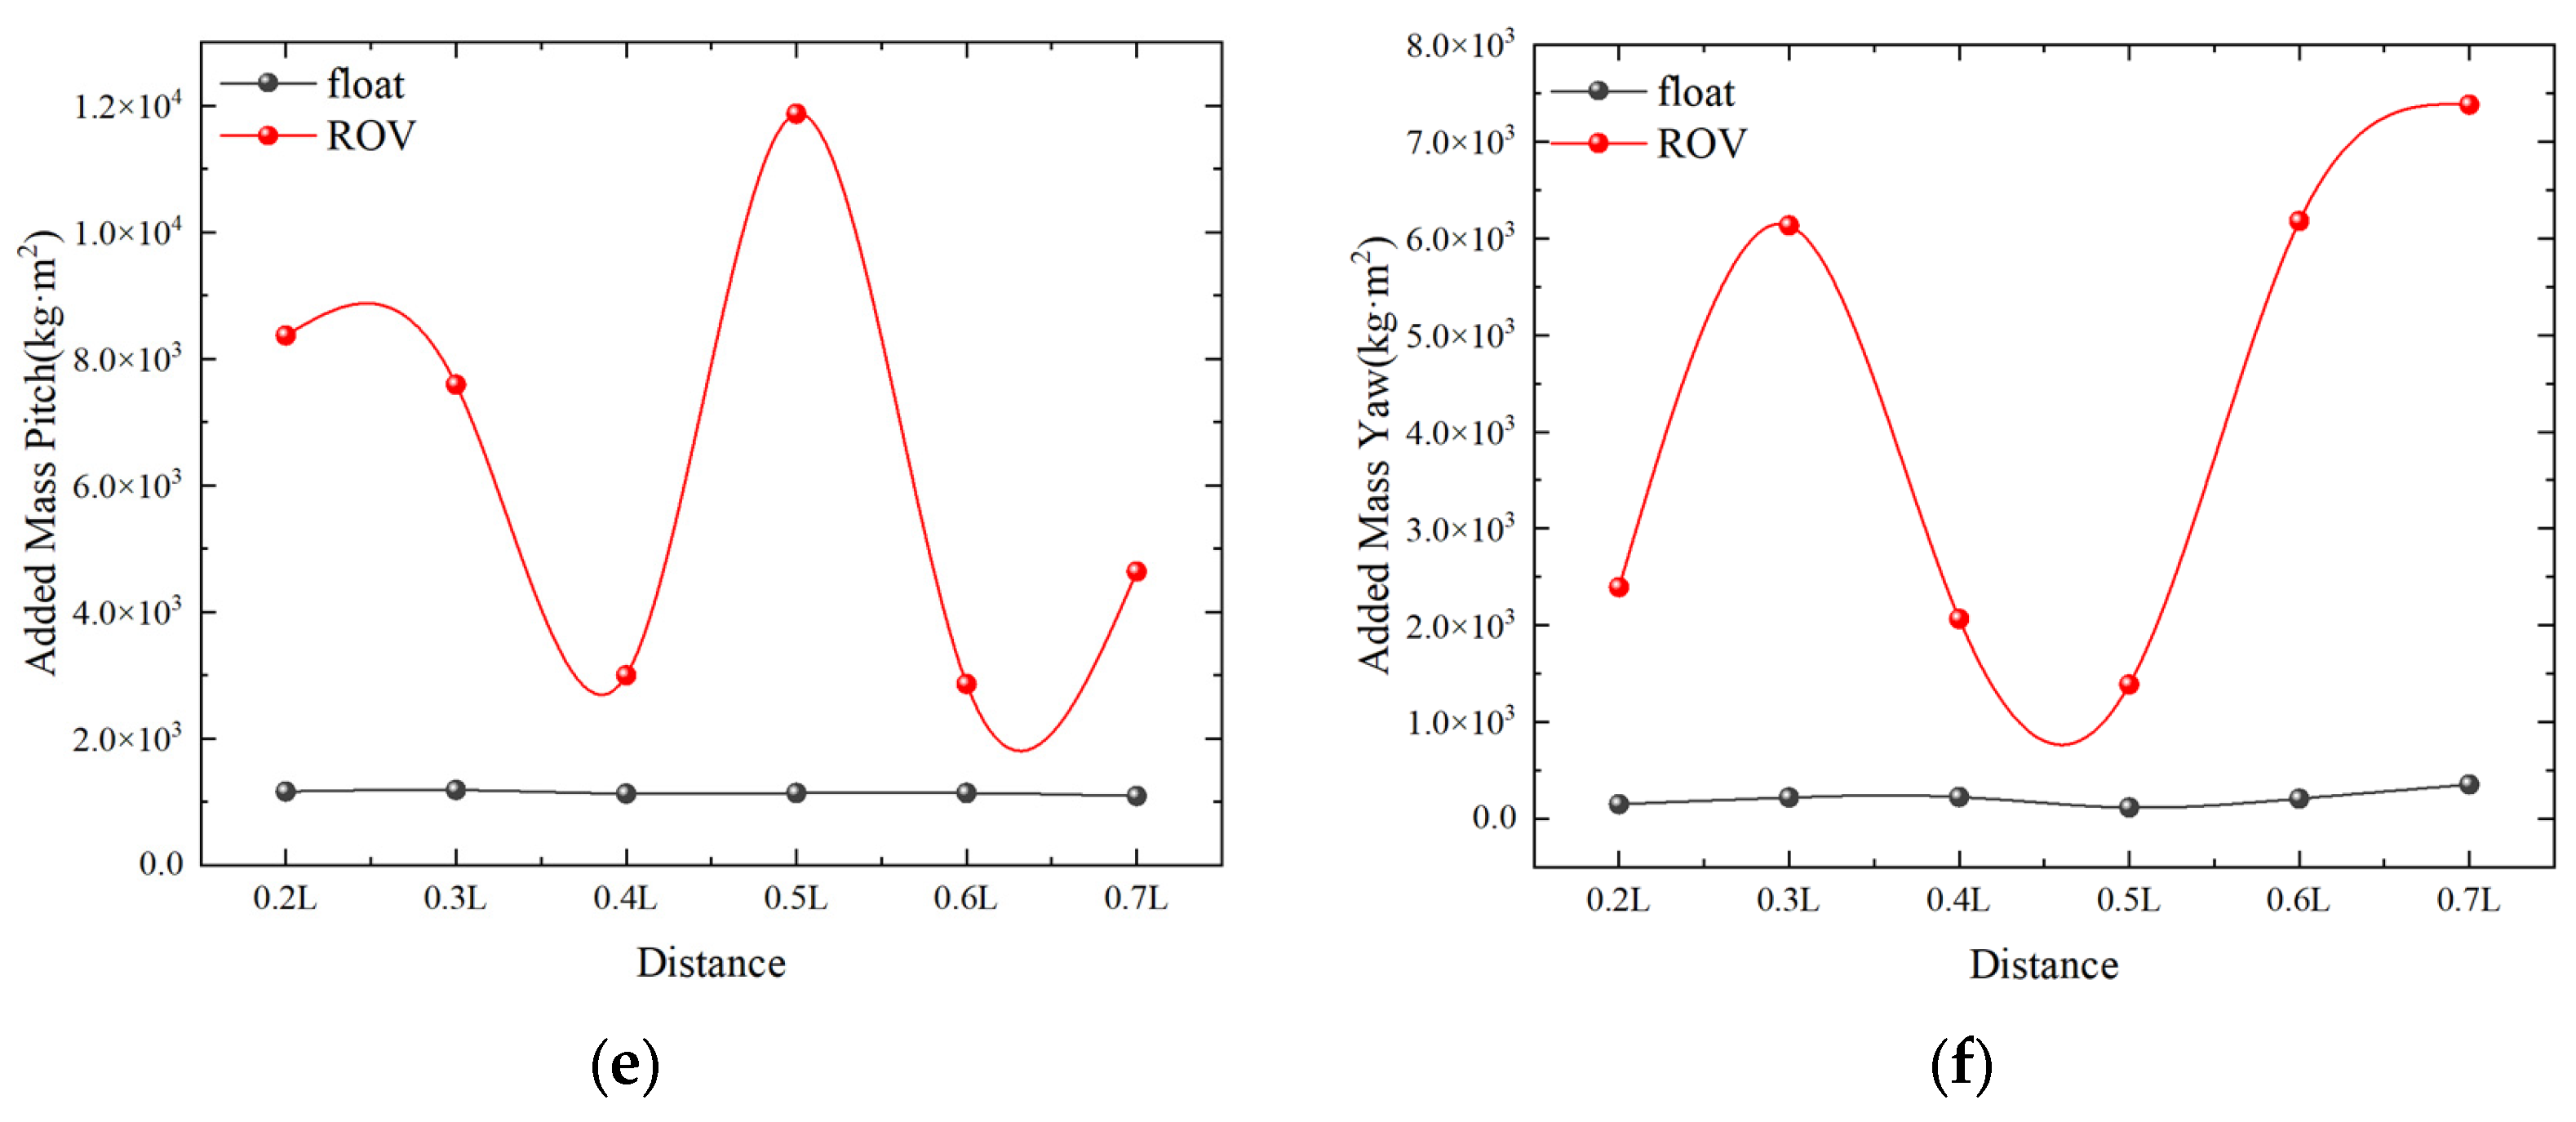
As shown in Figure 20, the added mass of the ROV is more than that of the FLOAT in the directions of heave, roll, pitch, and yaw, and the motion trend of the double floats in the heave direction with the change in float spacing is essentially linear. ROV and FLOAT’s increased mass responses in sway, surge, roll, pitch, and yaw achieve a minimum value of 0.4 L–0.5 L.
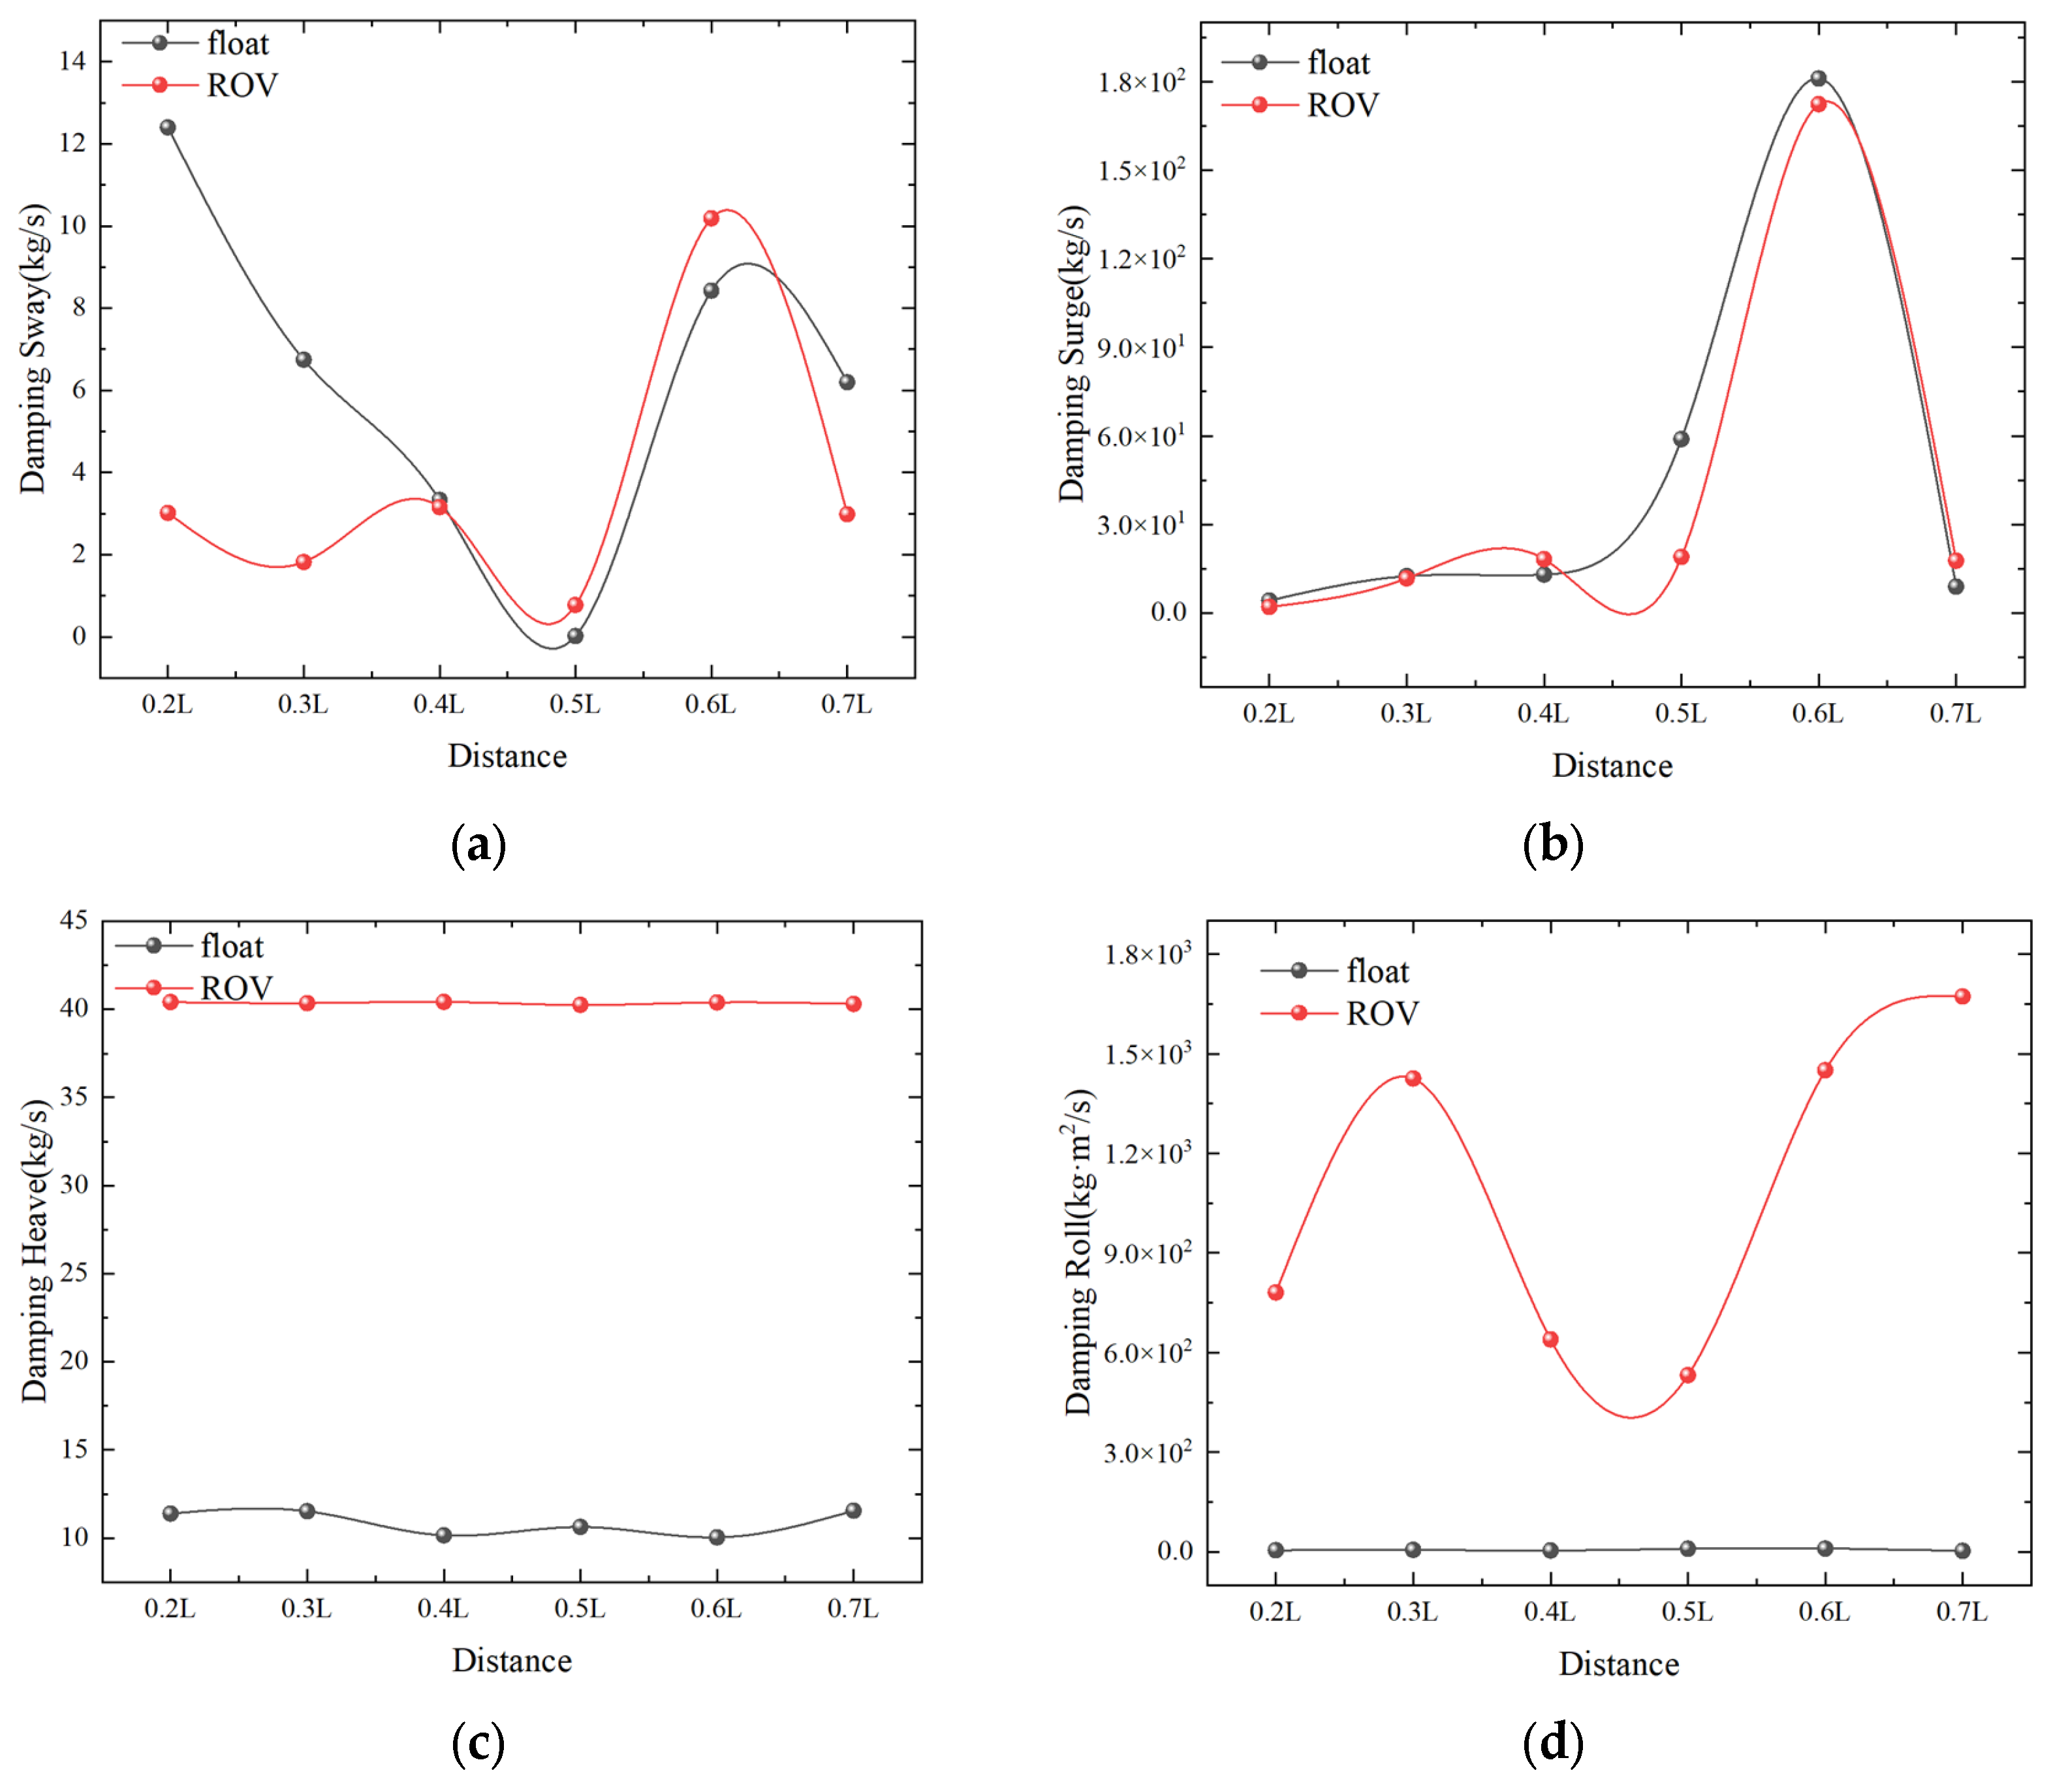
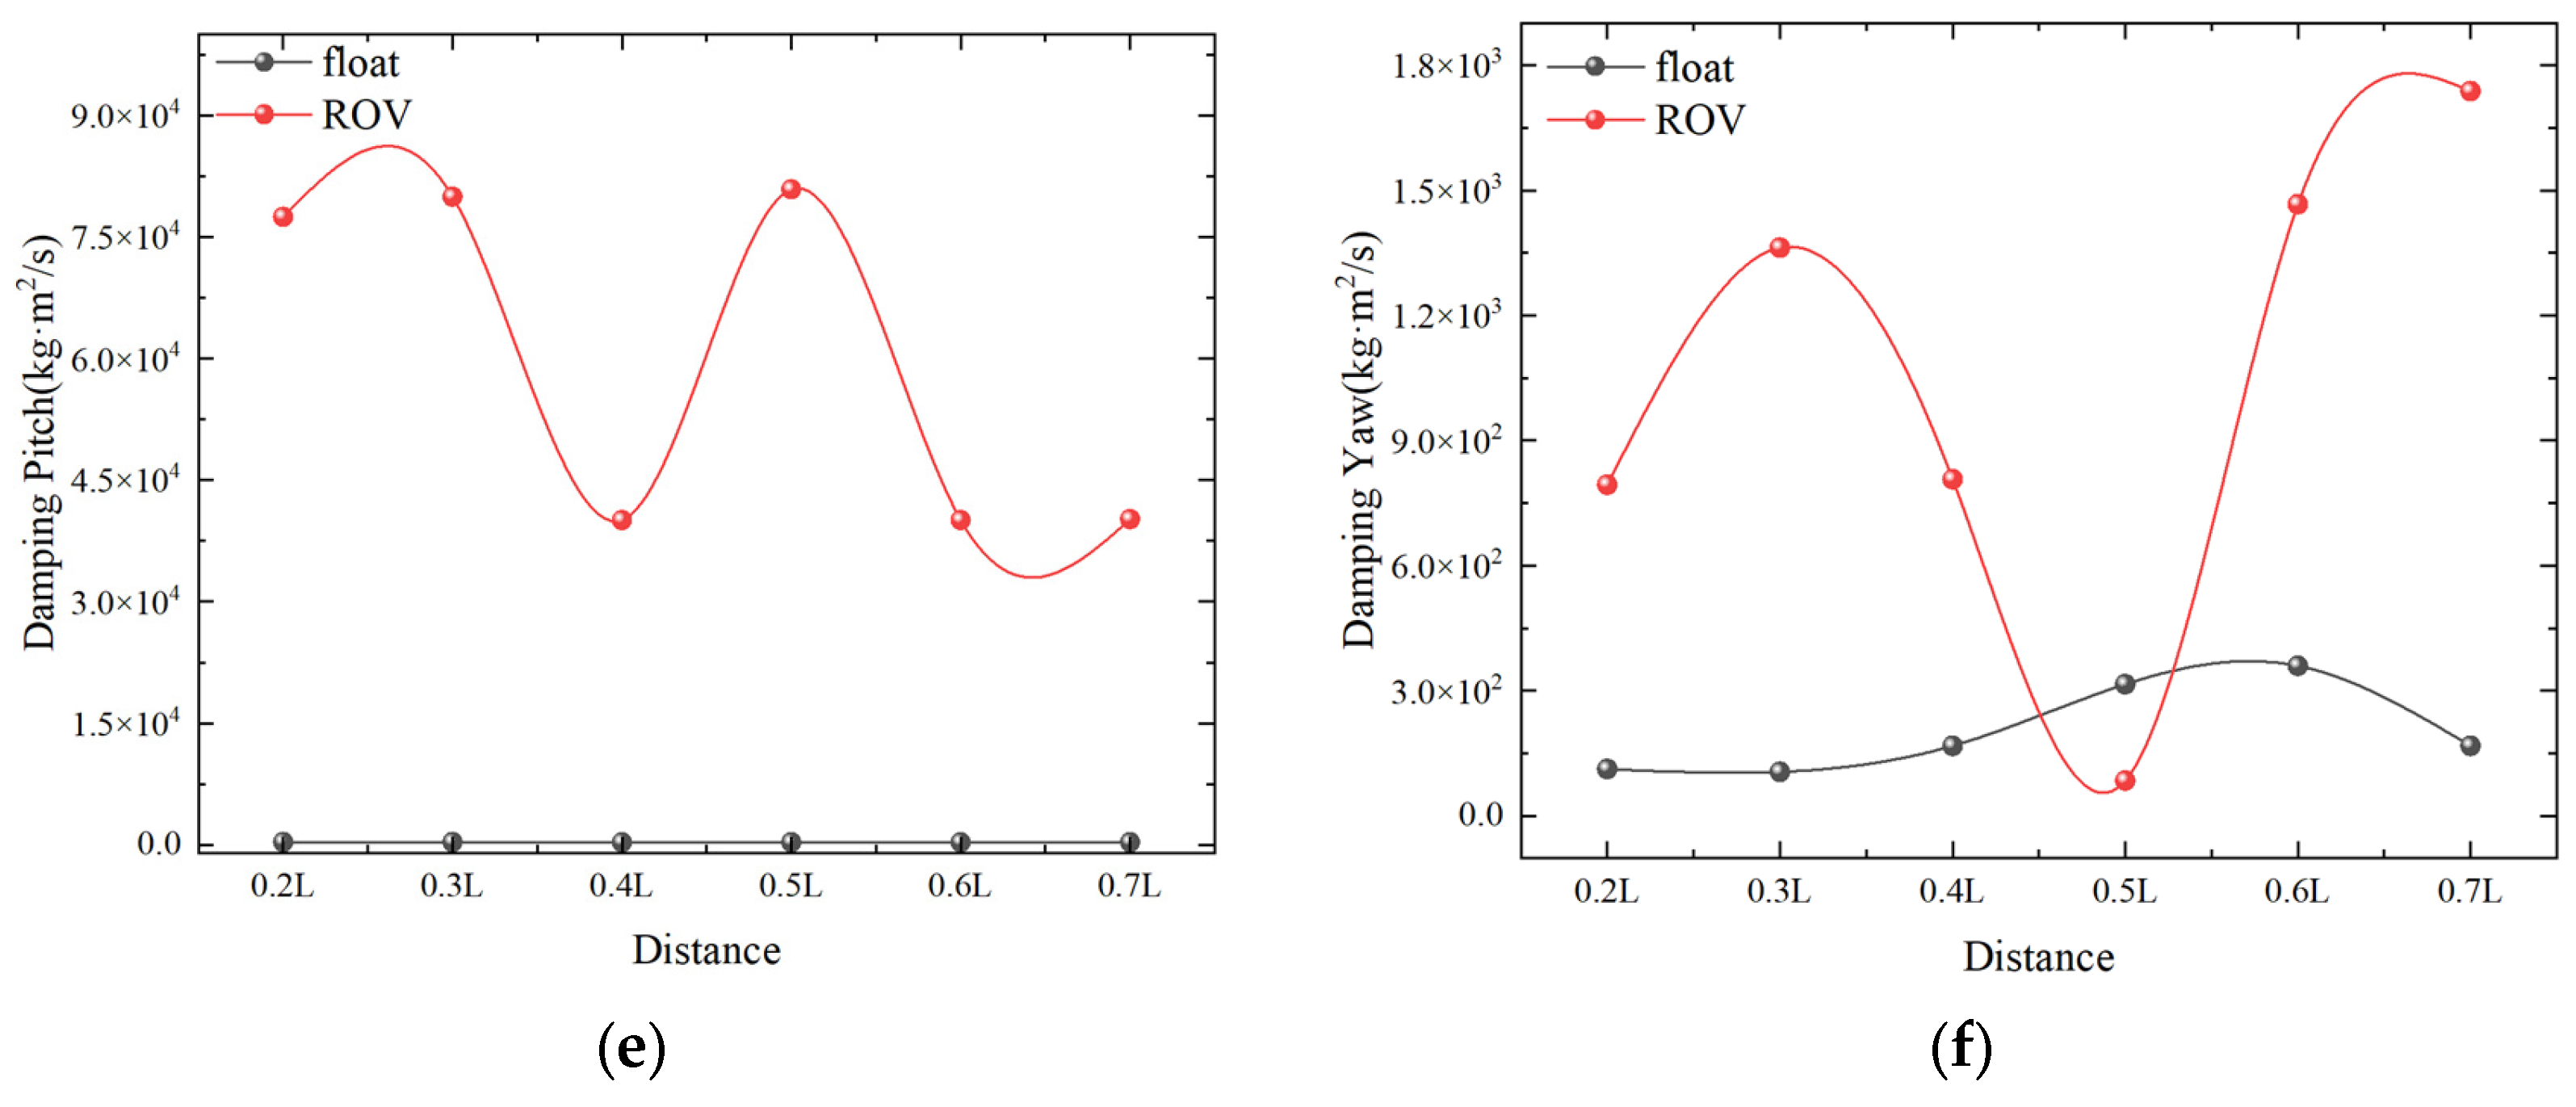
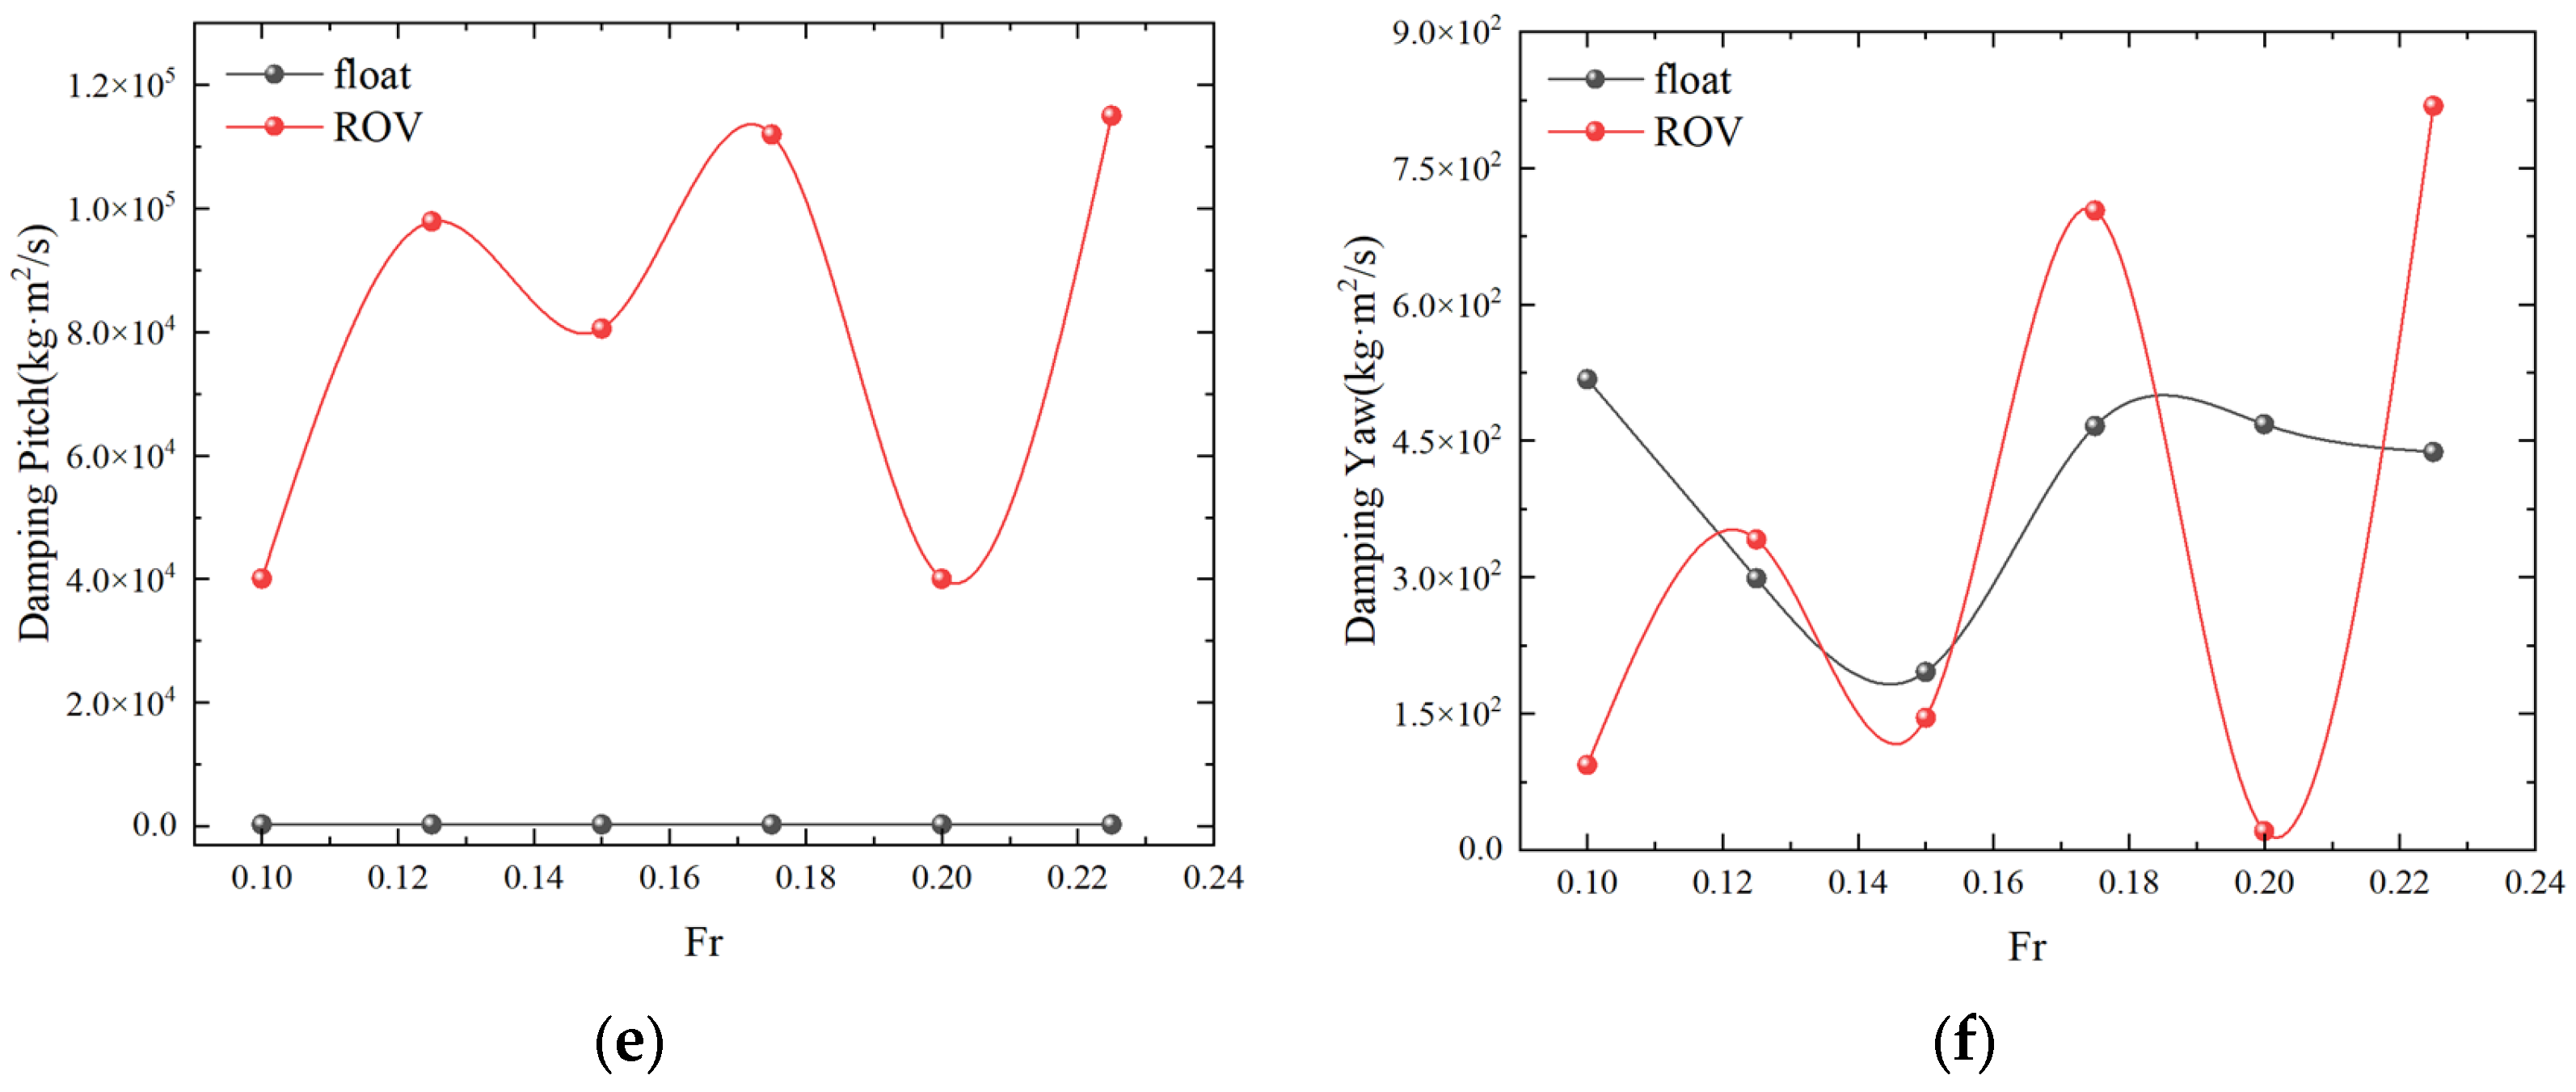
Figure 21 shows that the damping coefficients of the double floats on the sway and surge responses follow nearly identical trends as the spacing between the floats increases, with a tiny divergence. The double floating body’s damping coefficient in the sway direction attains its minimum at 0.478 L; similarly, the ROVs in the surge direction reach their nadir at 0.467 L, and the ROVs in the yaw direction find their minimum at 0.487 L. In conclusion, the optimal spacing for twin floats under downwash action is 0.4 L–0.5 L.
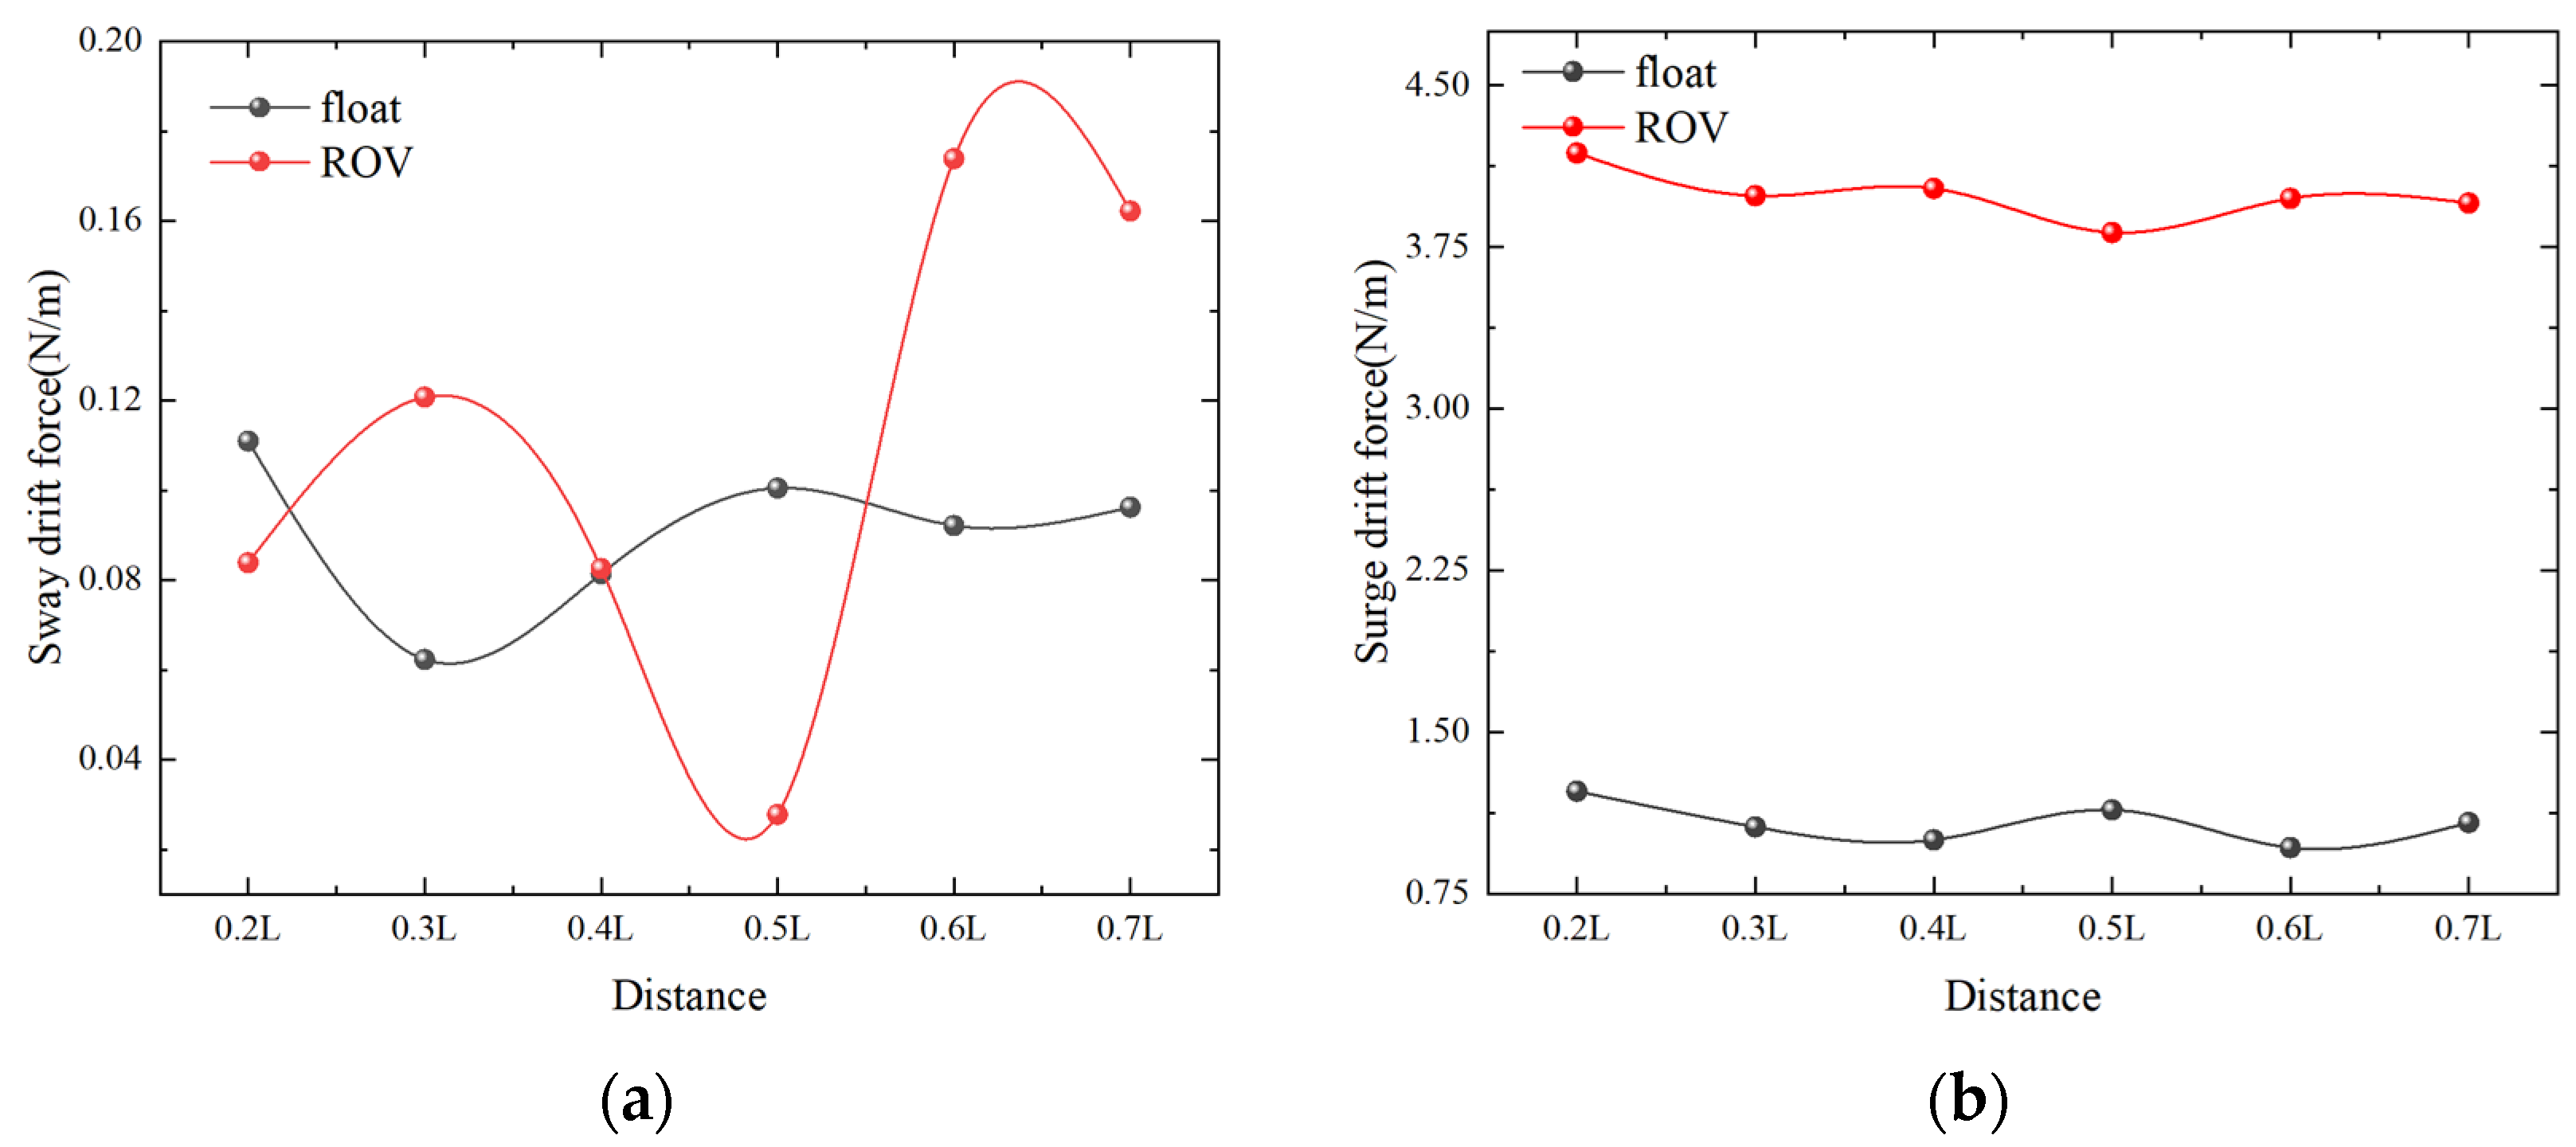
Figure 22a shows that the sway drift force of the FLOAT is the smallest when the spacing is 0.48 L. The surging force of the double floating bodies exhibits a relatively stable trend as the berthing speed increases, and the spacing between them has a minimal impact on this force.
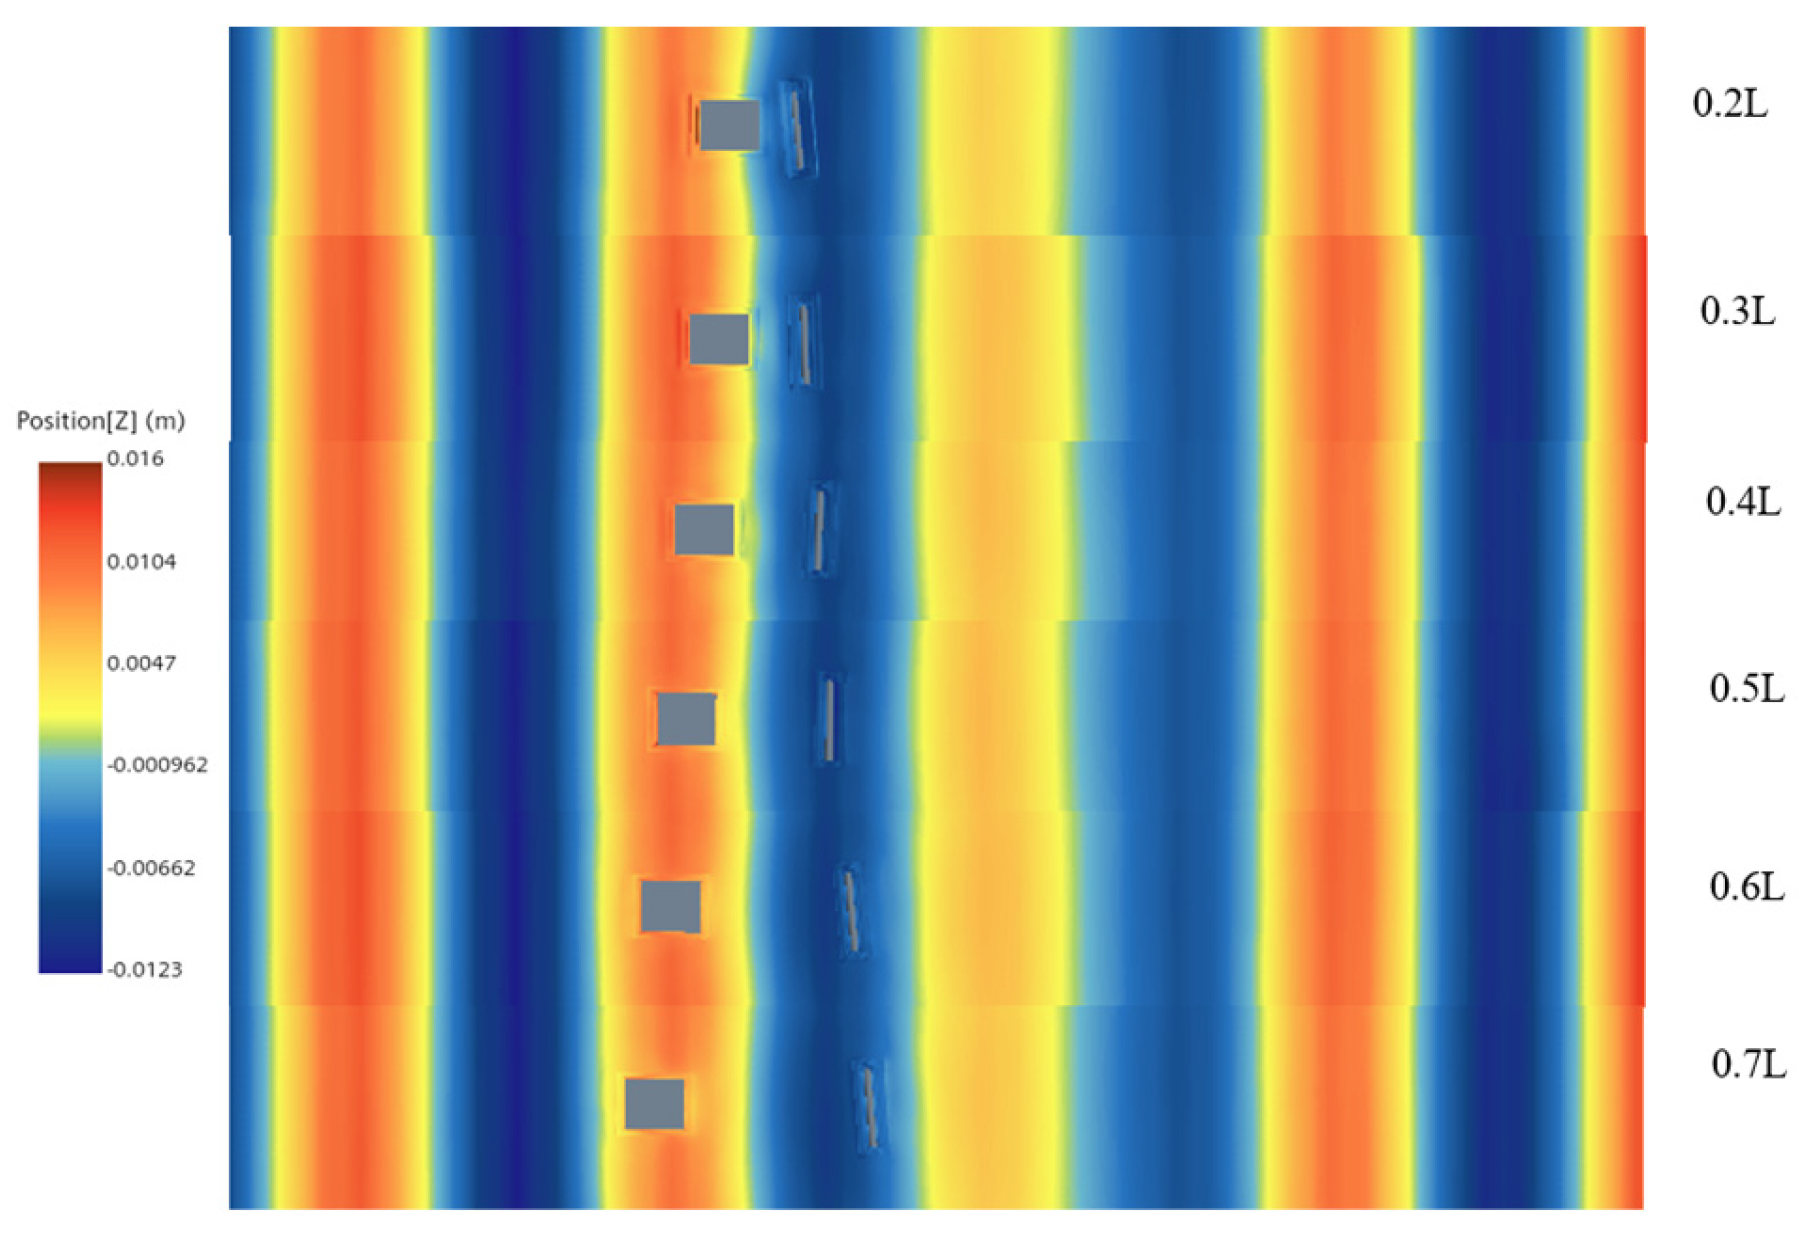
Figure 23 illustrates the comparative wave cloud diagram of two floating bodies at different distances at a certain moment. Wave resonance occurs as the peak and trough positions within the gap between the floating entities alternate. The incident wave diffracts from both ends before penetrating the spacing. The primary interaction within the flow field between the floating bodies is worked by the superposition of diffracted and reflected waves generated upon the wave’s encounter with the floating bodies. A pronounced wave elevation emerges on the ROV’s right side due to the superposition of incident and reflected wave crests. Between 0.4 L and 0.5 L, the wave height within the spacing increases markedly, reaching a peak of 1.6 times the amplitude of the incident wave. At 0.2 L, the maximum wave height surges to 3.7 times that of the incident wave.

4.3.2. Effect of Wave Direction on Salvage Systems

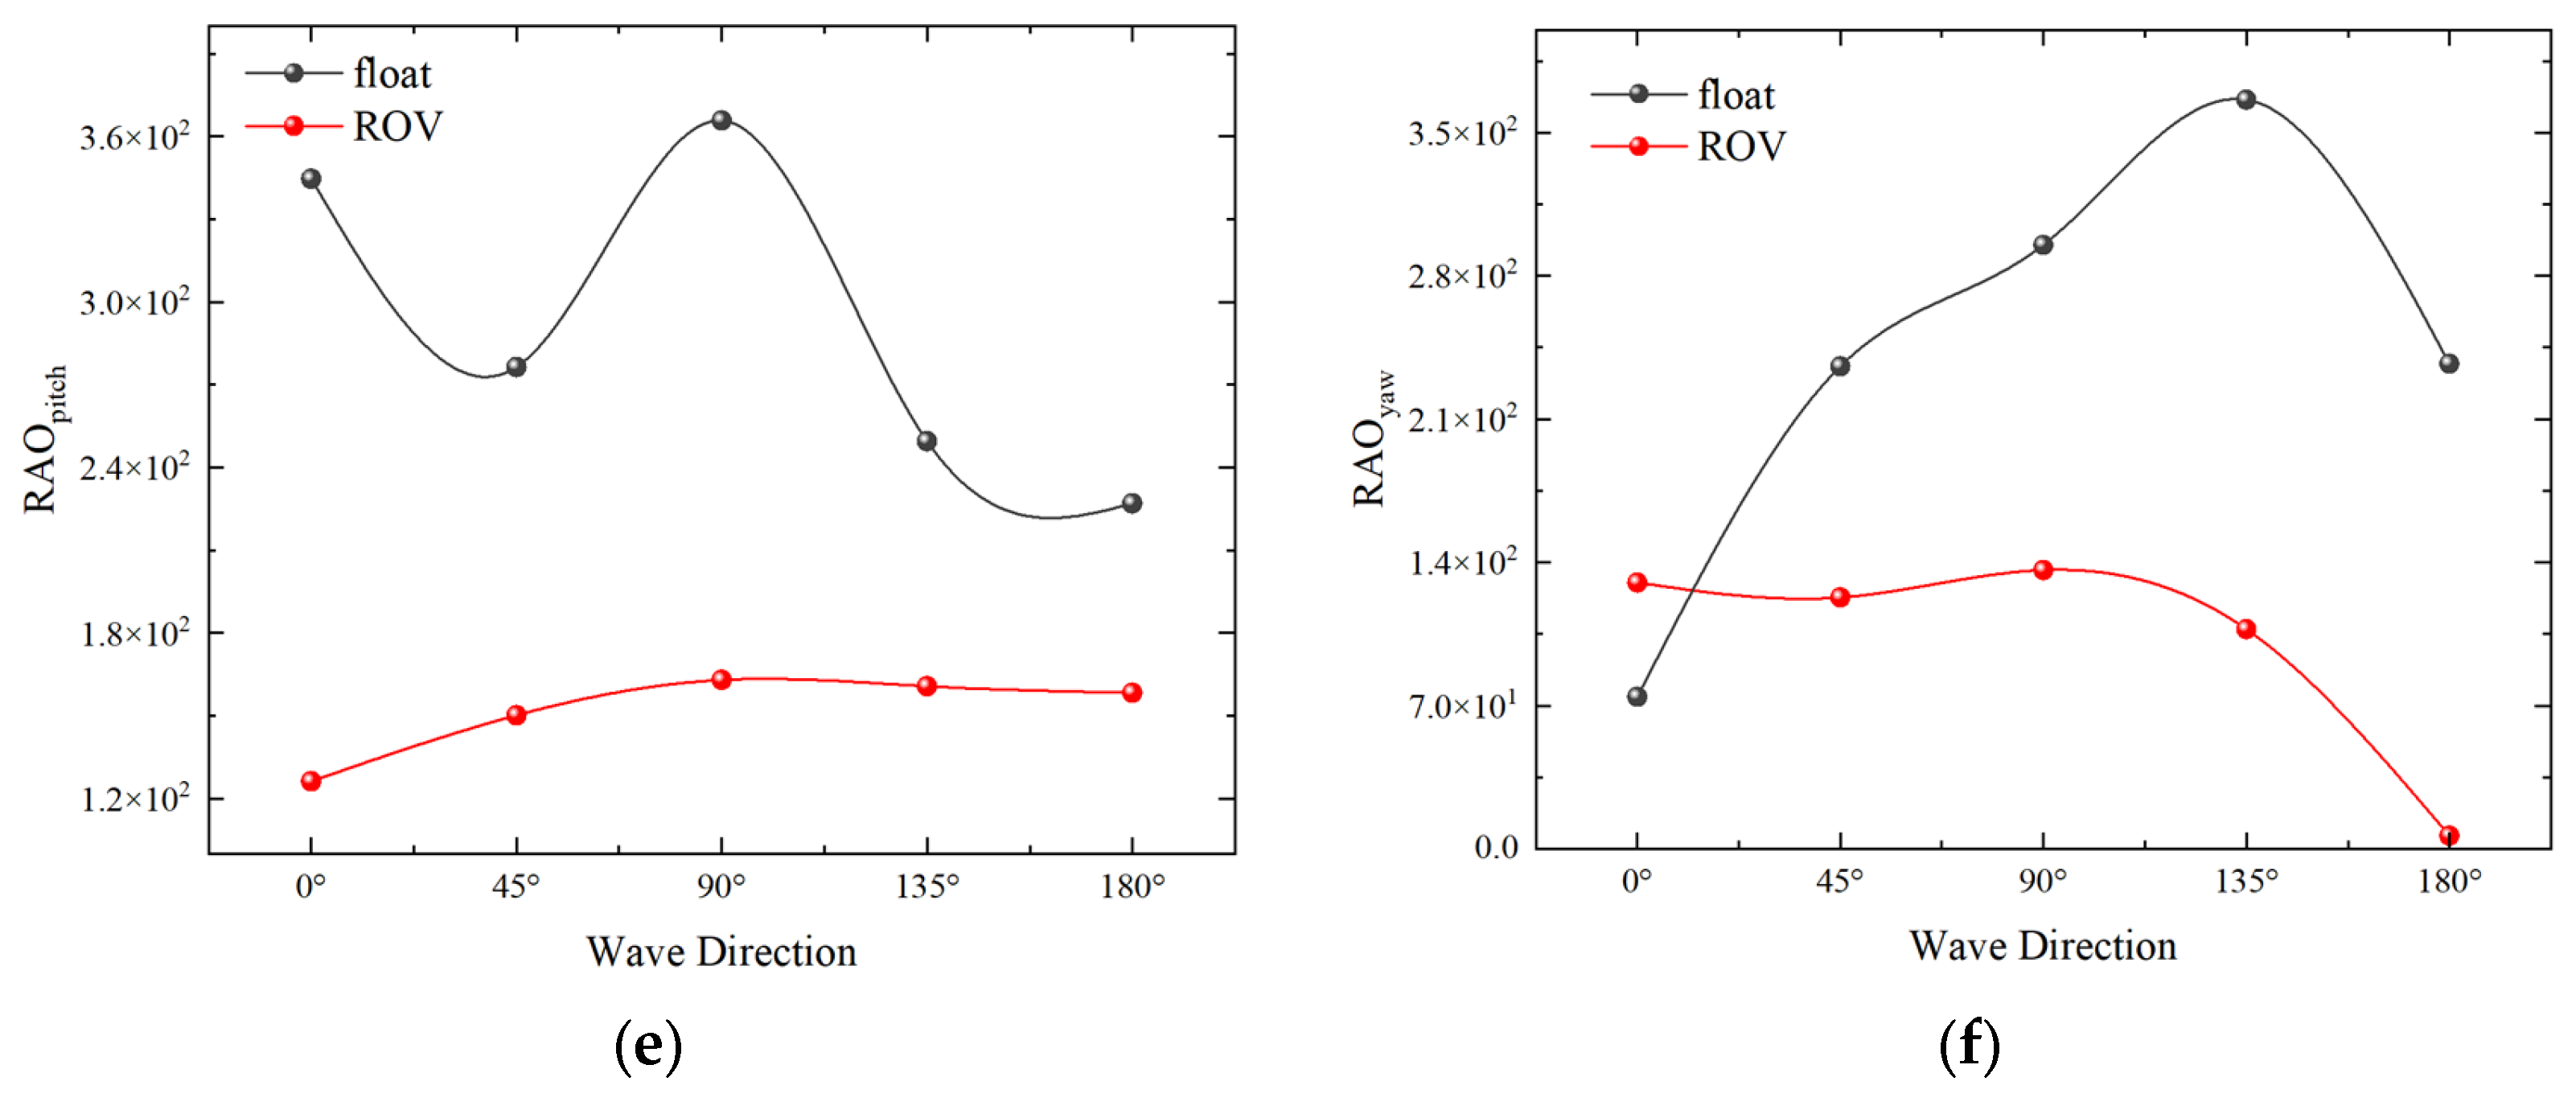
Figure 24 depicts the influence of wave direction on the motion of the double floats under 0°, 45°, 90°, 135°, and 180° wave conditions. Figure 24a sway RAO response shows that the double floats have a peak at 90° and a minimum at 180°. This might be attributed to the huge mass differential between the twin floats and the more pronounced pitch variation of the rescued floats when the fluid travels over the surface, as illustrated in the yaw RAO response in Figure 24f. Additionally, Figure 24b surge, (c) heave, and (e) pitch RAO responses show that the kinematic response RAOs of the double floats all peaked at wave direction 90°.
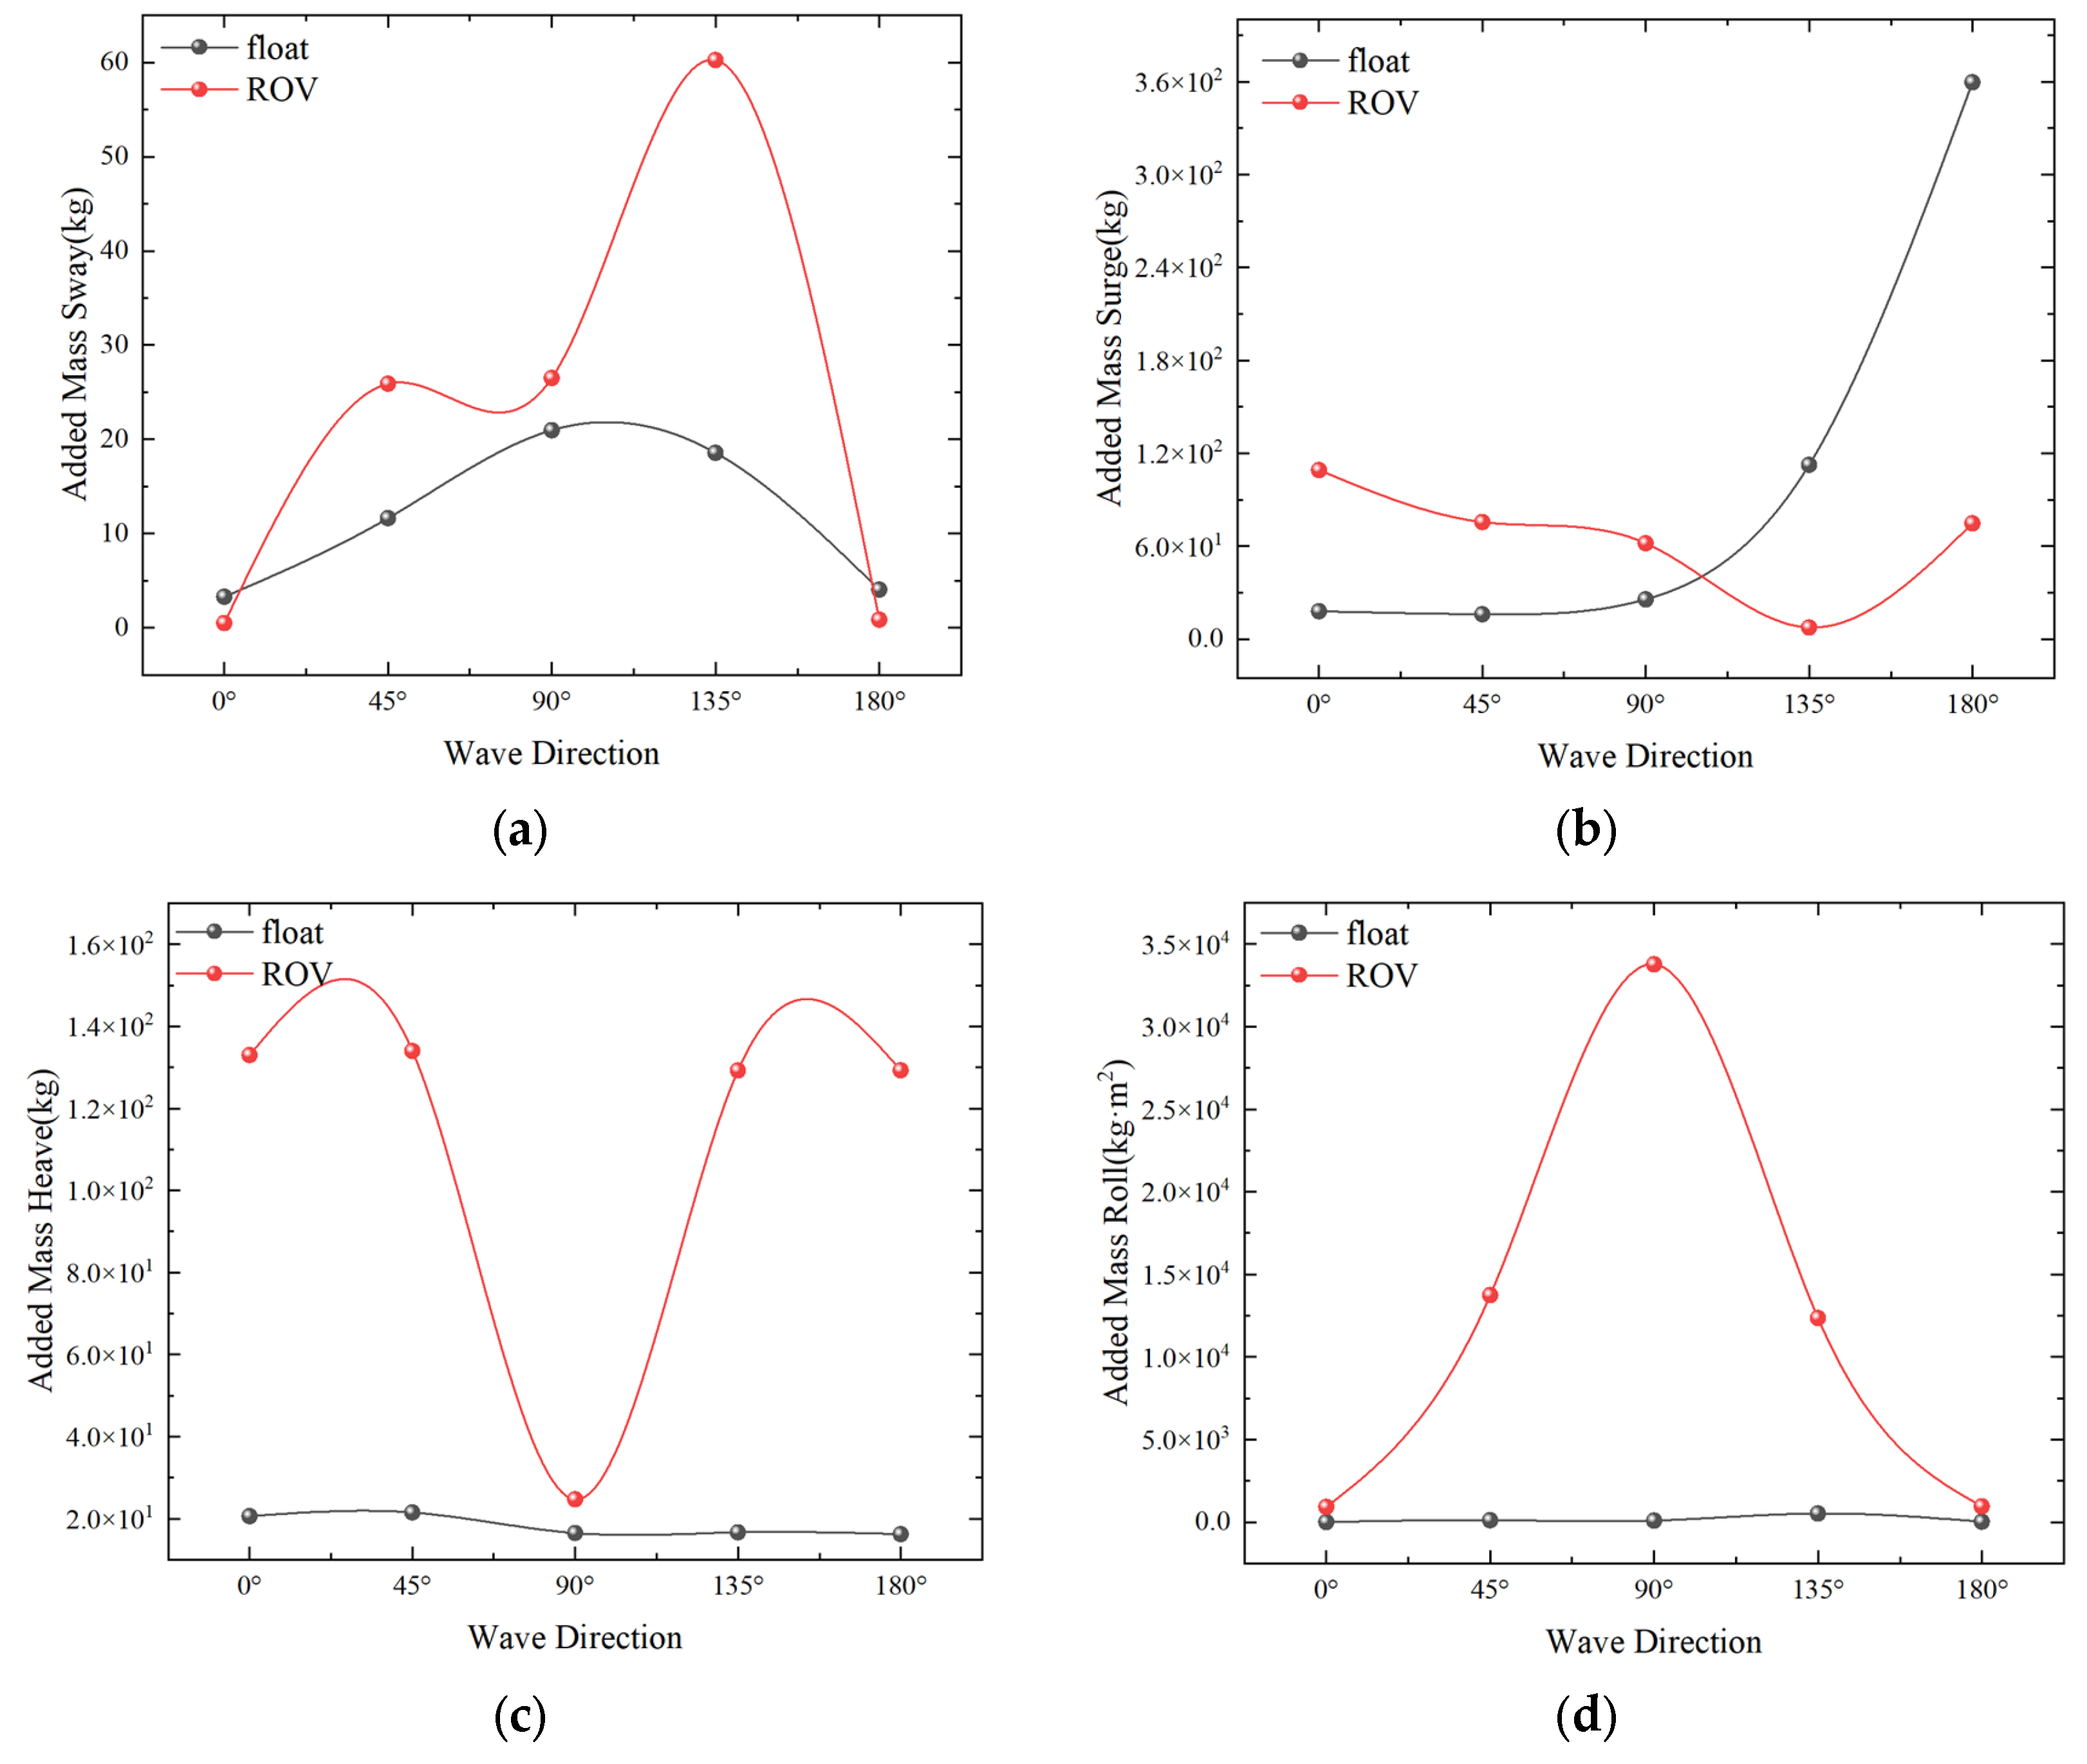
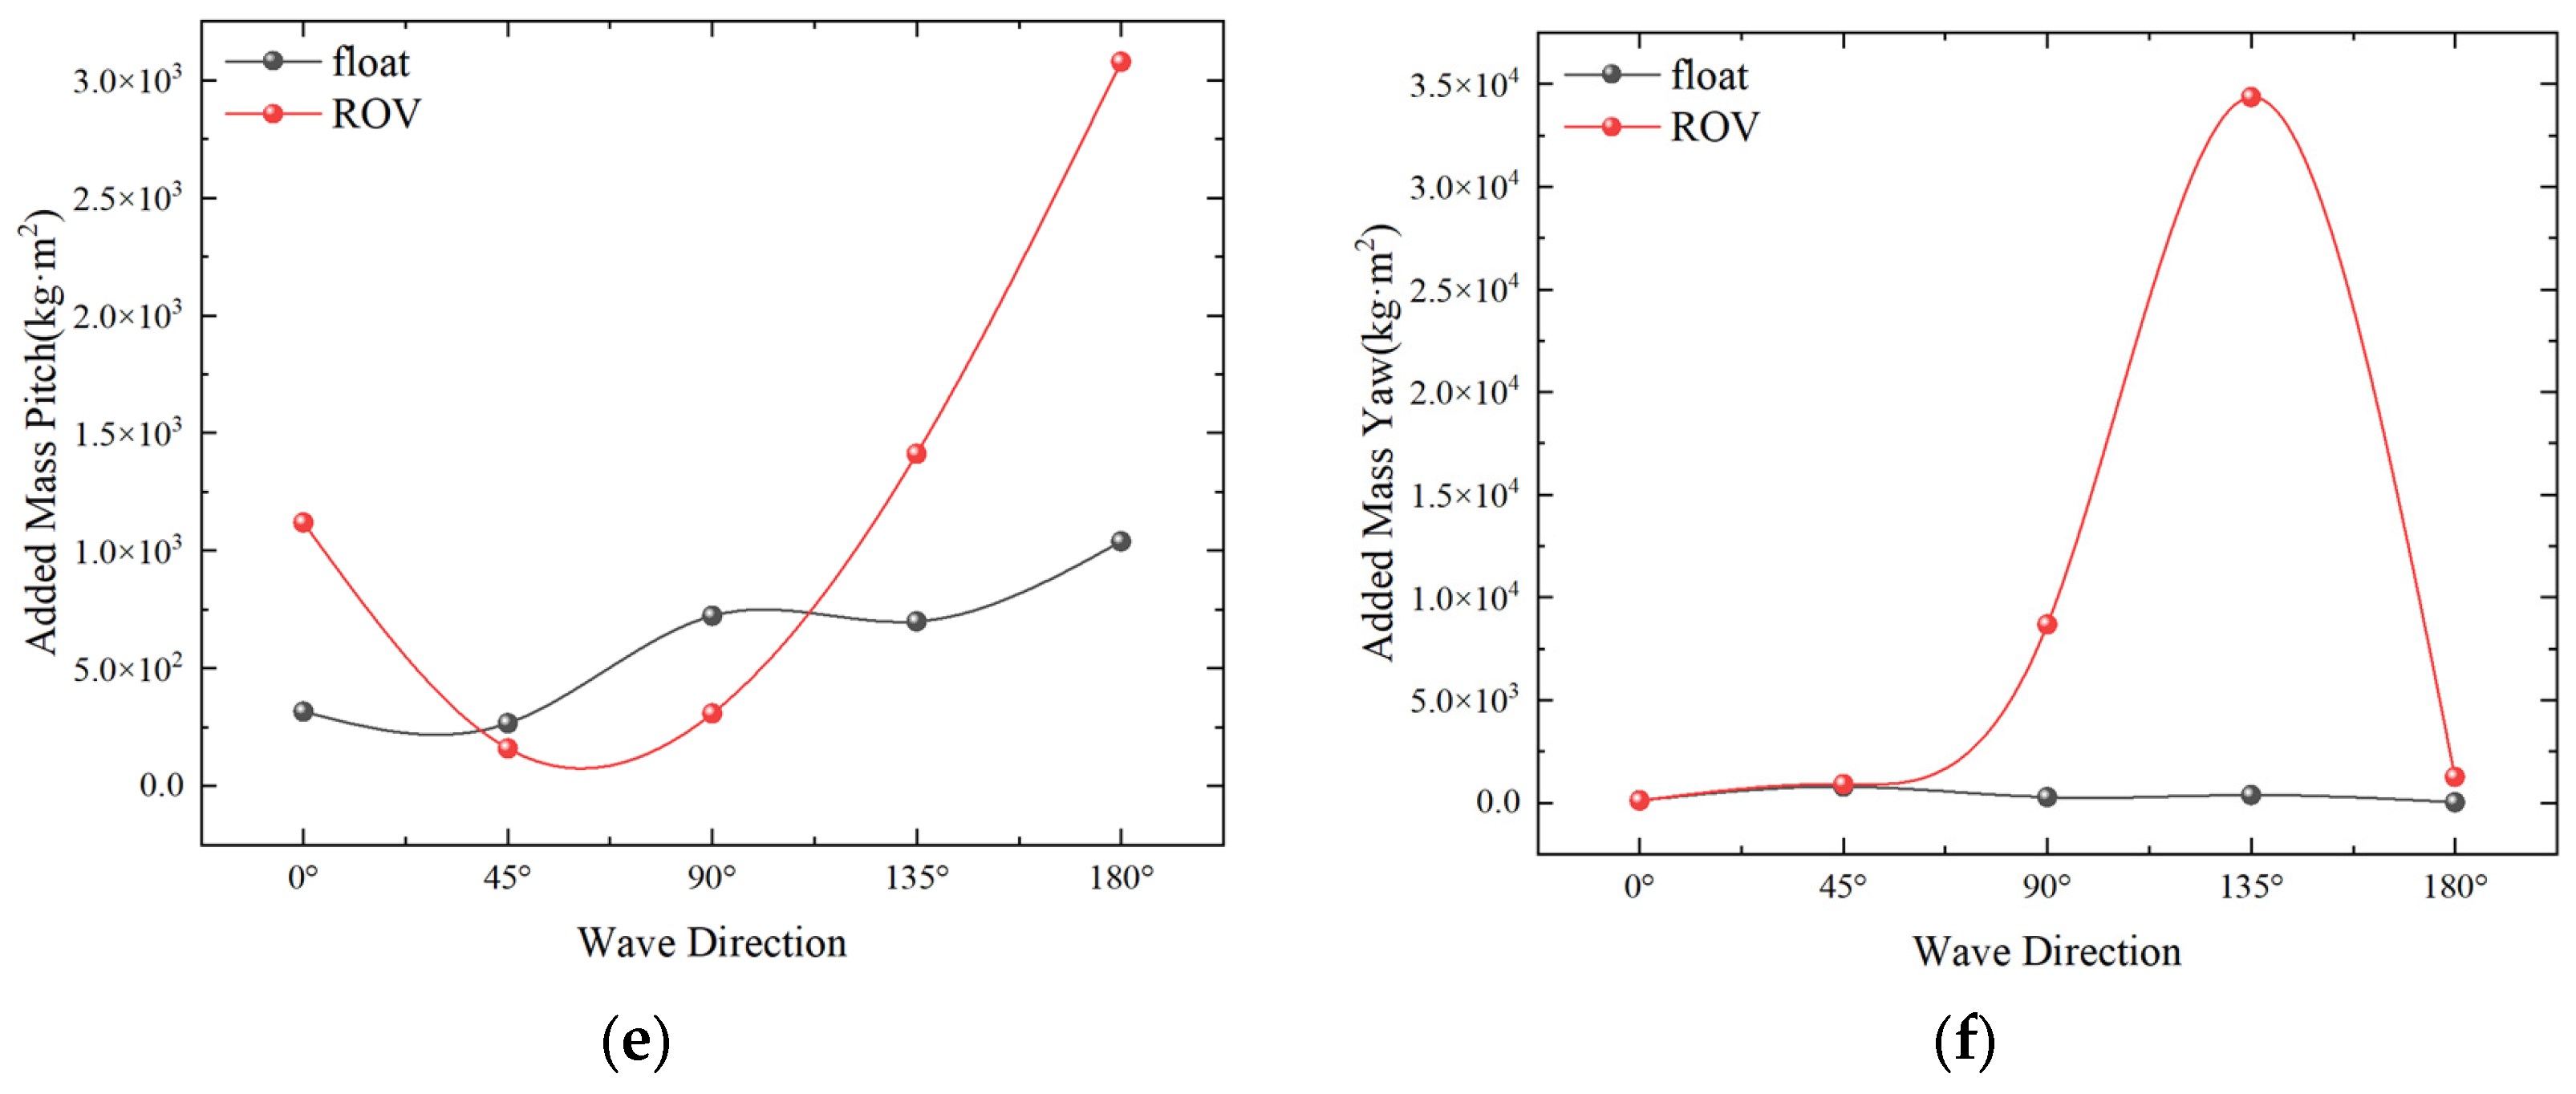
In Figure 25a, the ROV’s sway added mass is greater at 45° and 135° than at 0° and 180°, and, in Figure 25c, the ROV’s added mass appears to be minimized at 90° downwash, most likely due to the fluid motion in the narrow slit between the twin floats. In Figure 25d, the increased mass of the twin floats peaks at 90 degrees down the pitch.
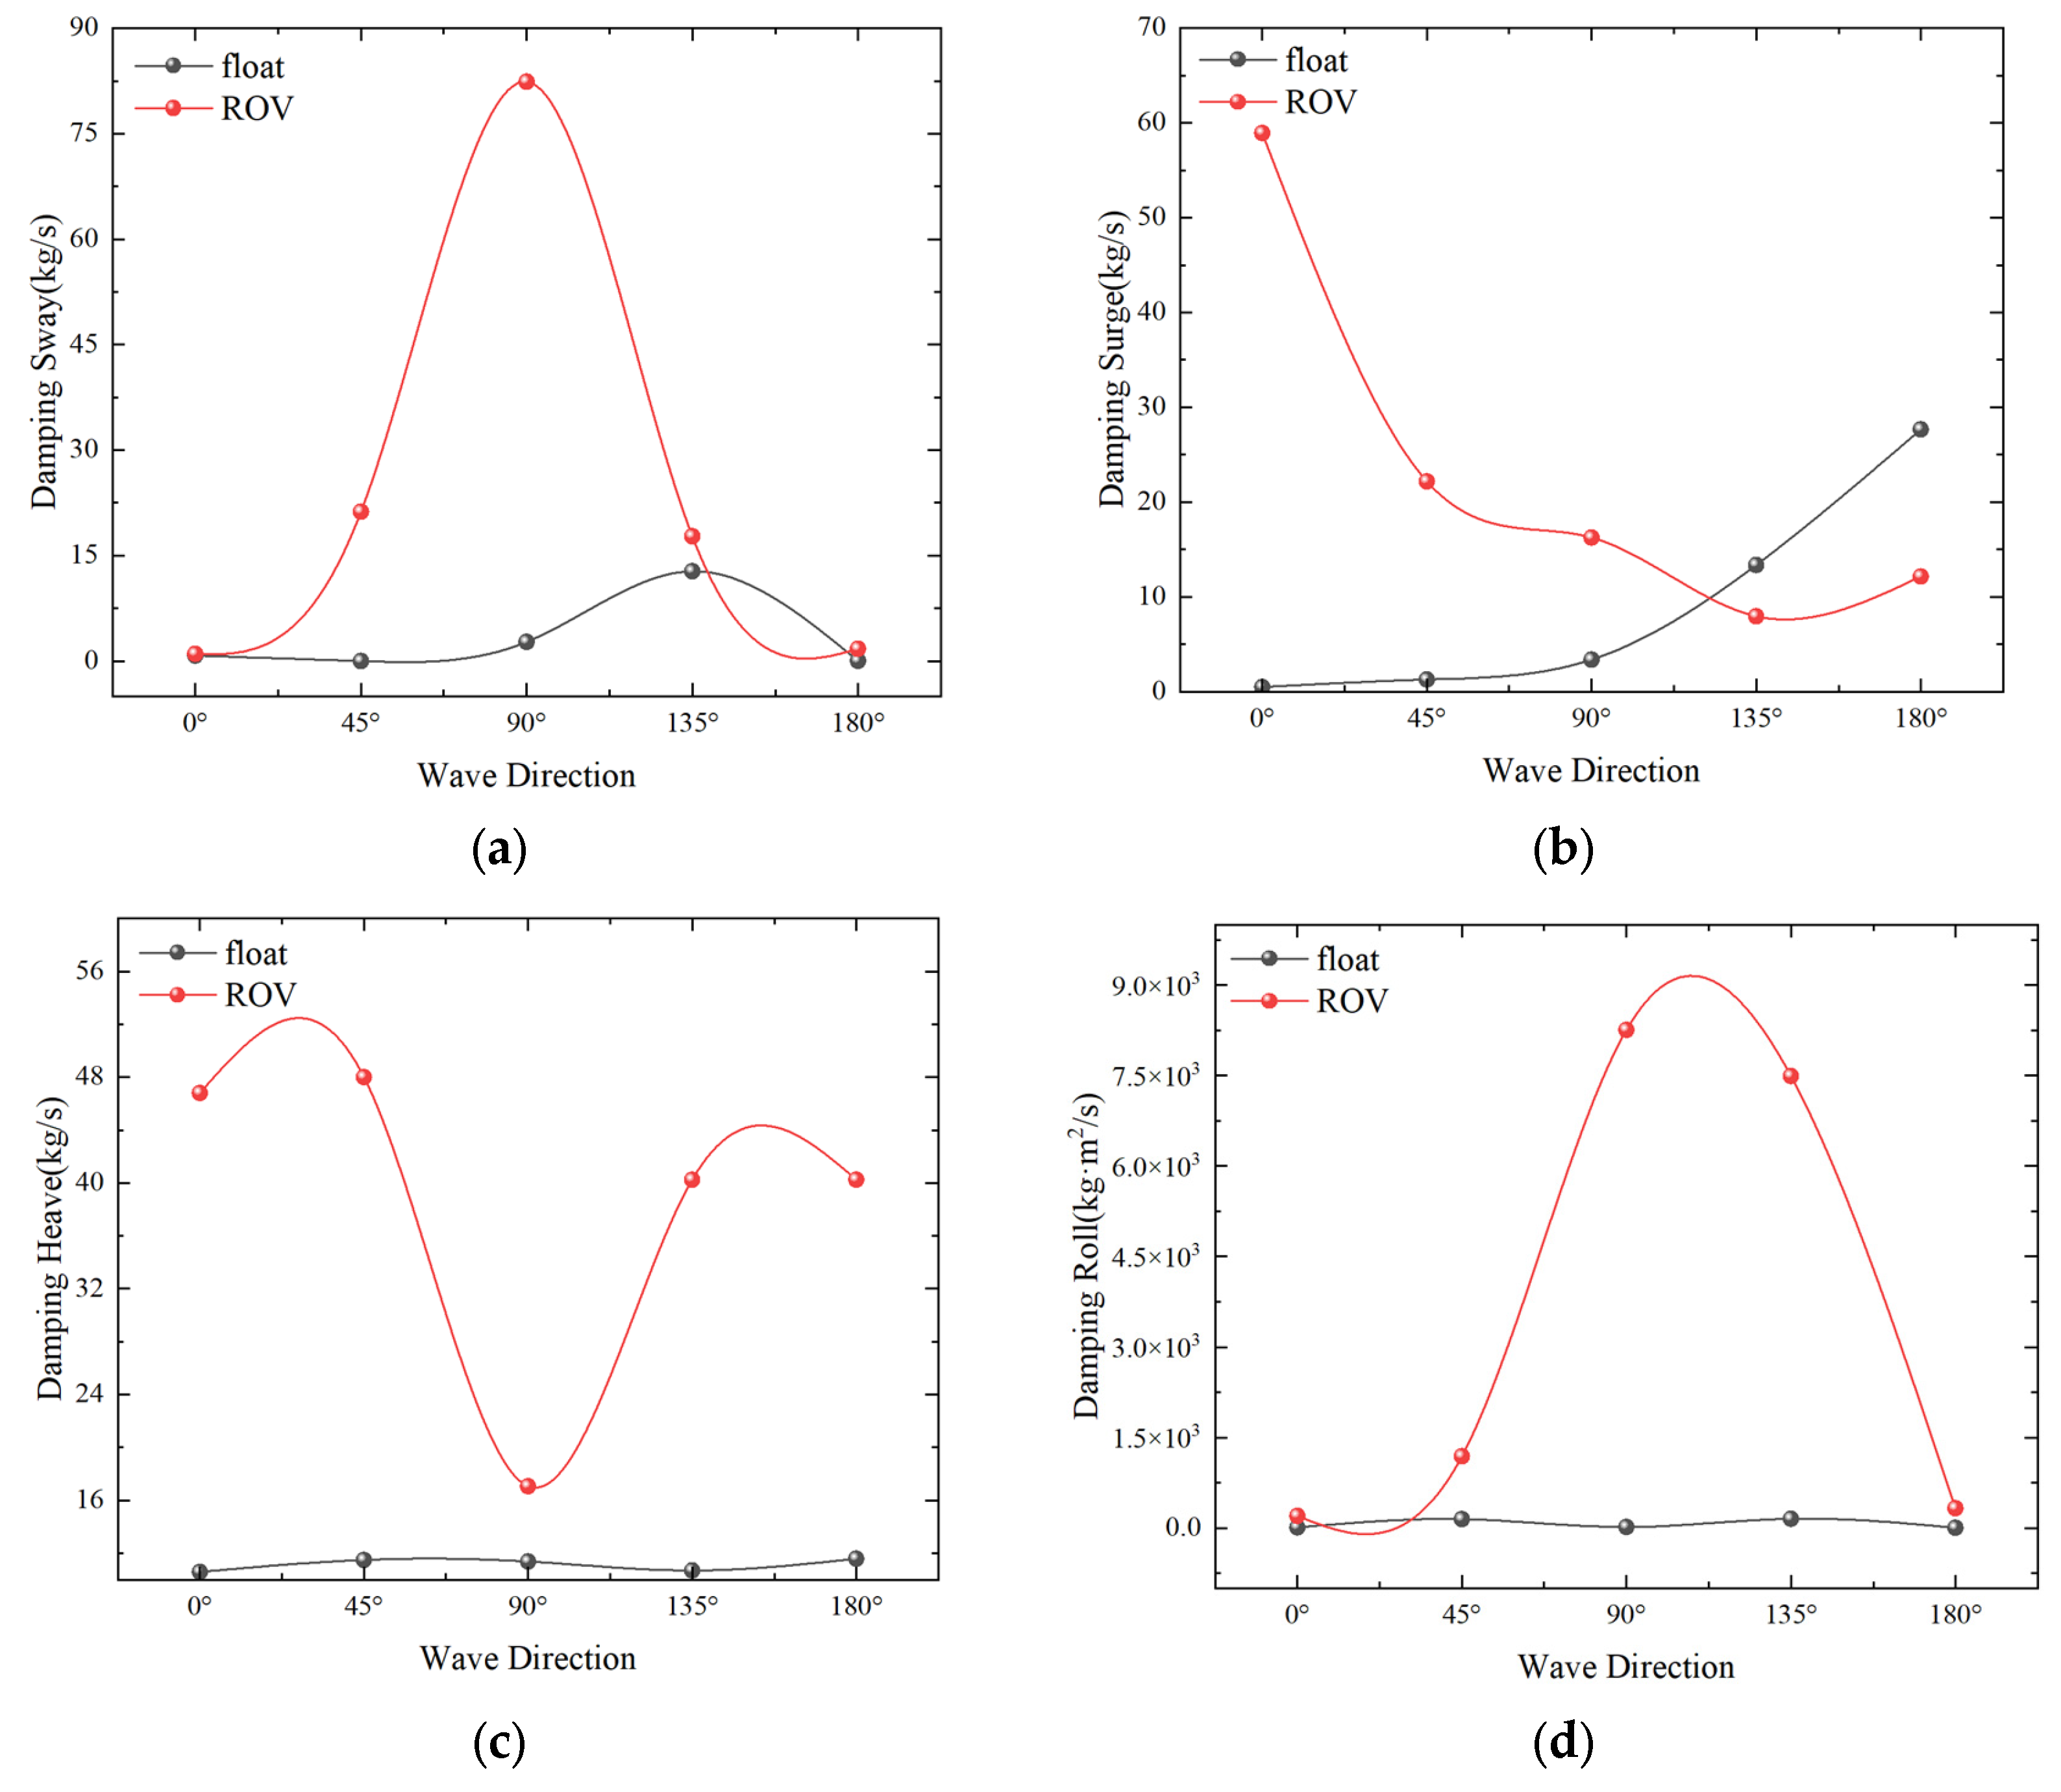
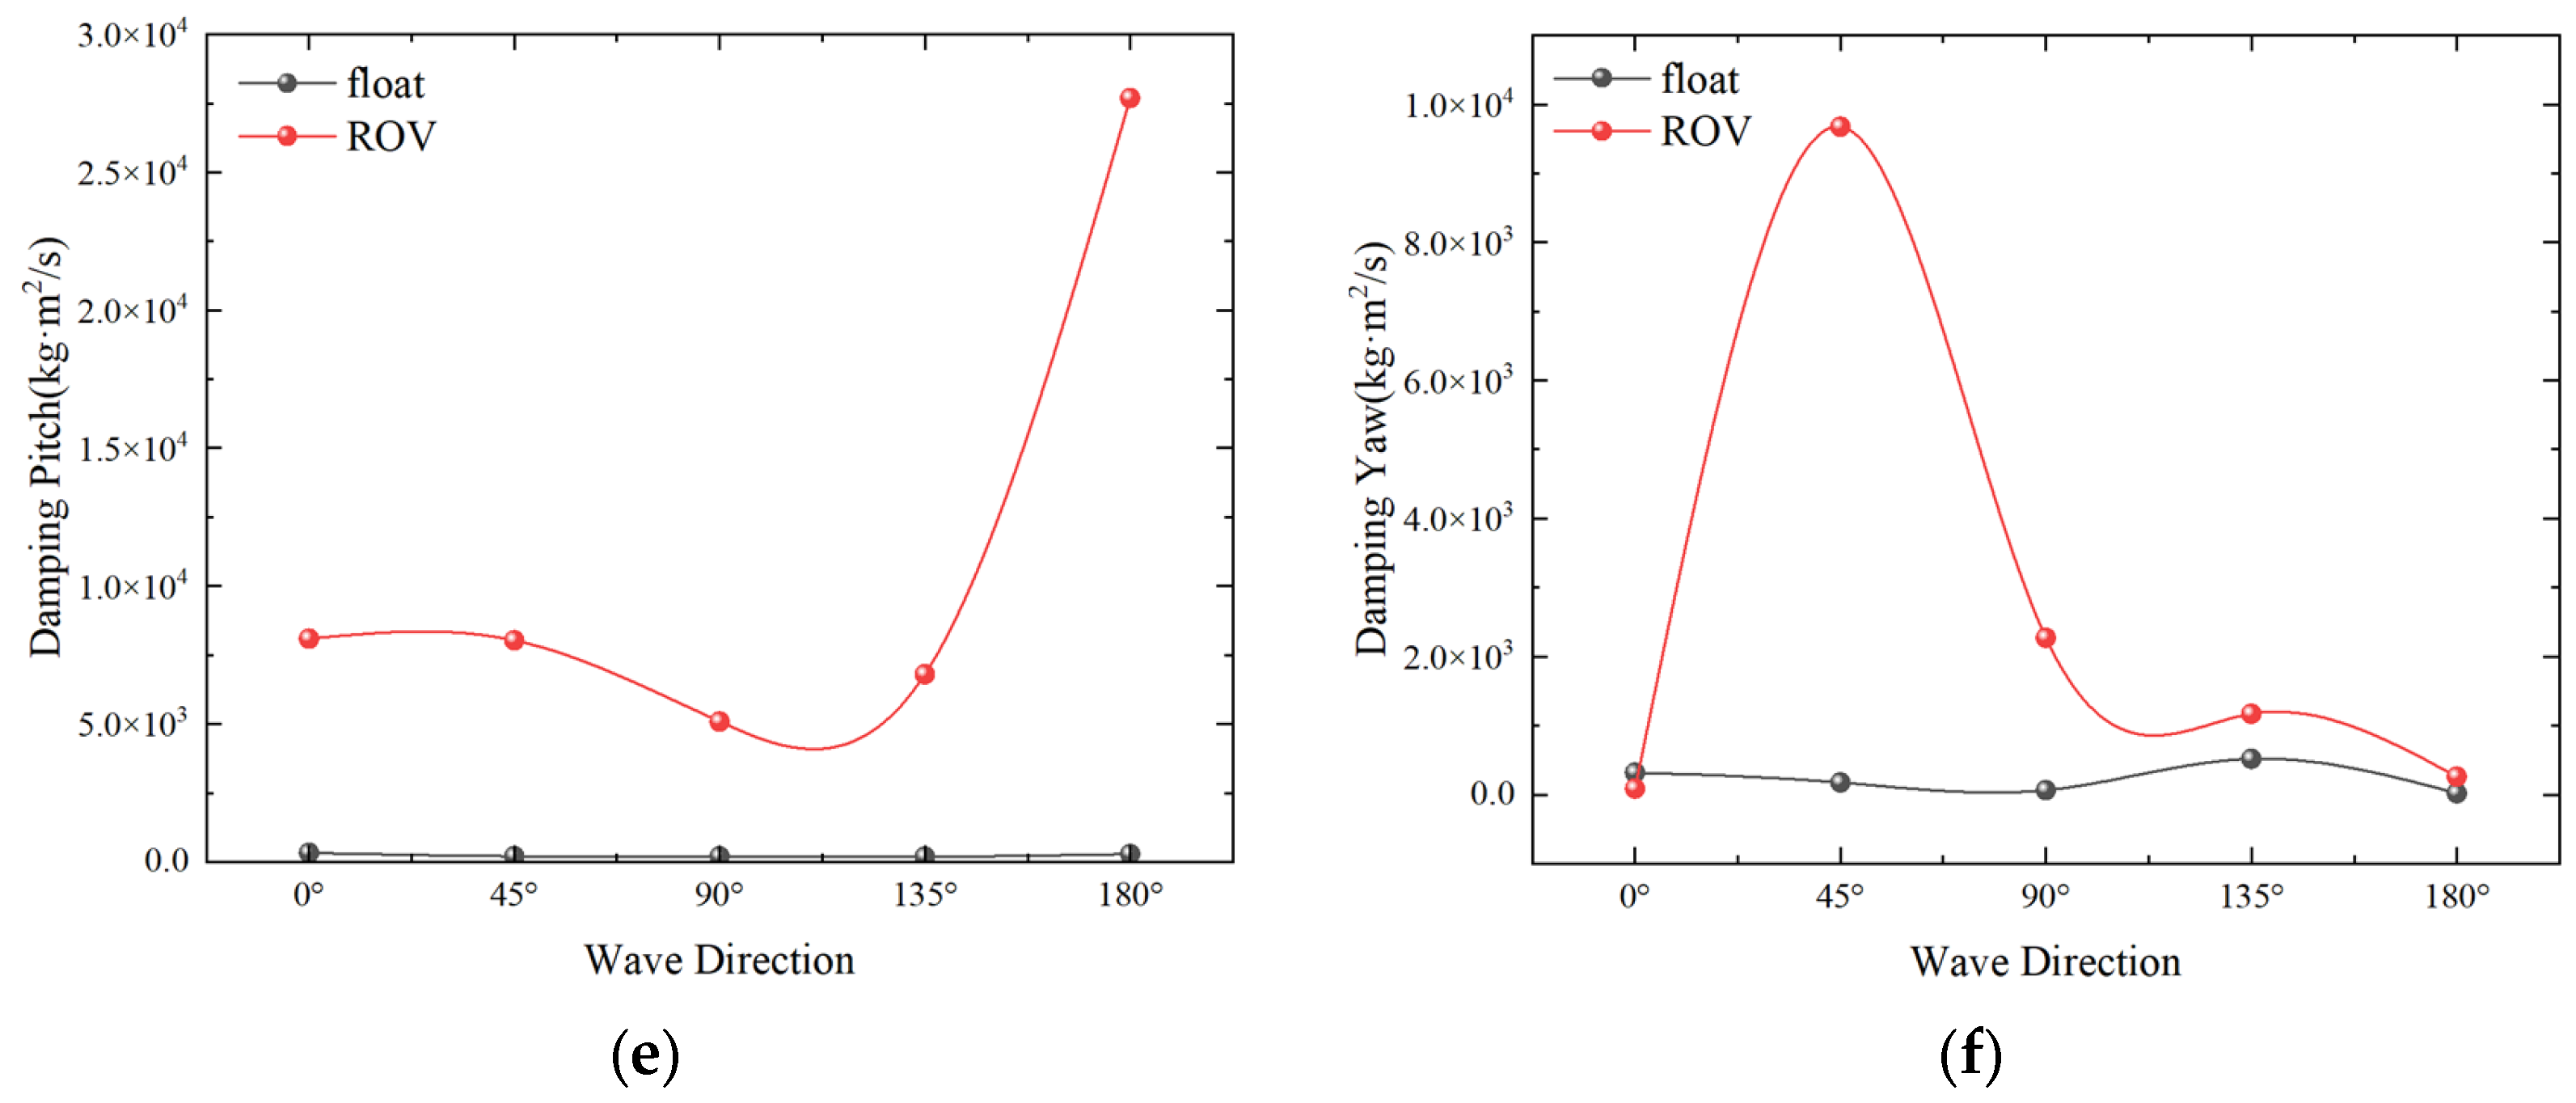
Figure 26 shows that the motion trend of the damping coefficients of the double float 6DOFs does not match that of the added mass in the sway, surge, roll, and yaw directions. The damping coefficient of the RAO reaches its apex at 90° wave direction, the ROV exhibits a decreasing trend in the surge direction as the wave angle increases, and the FLOAT shows an ascending trend. The ROV’s damping coefficient peaks at 105° roll and 45° yaw.
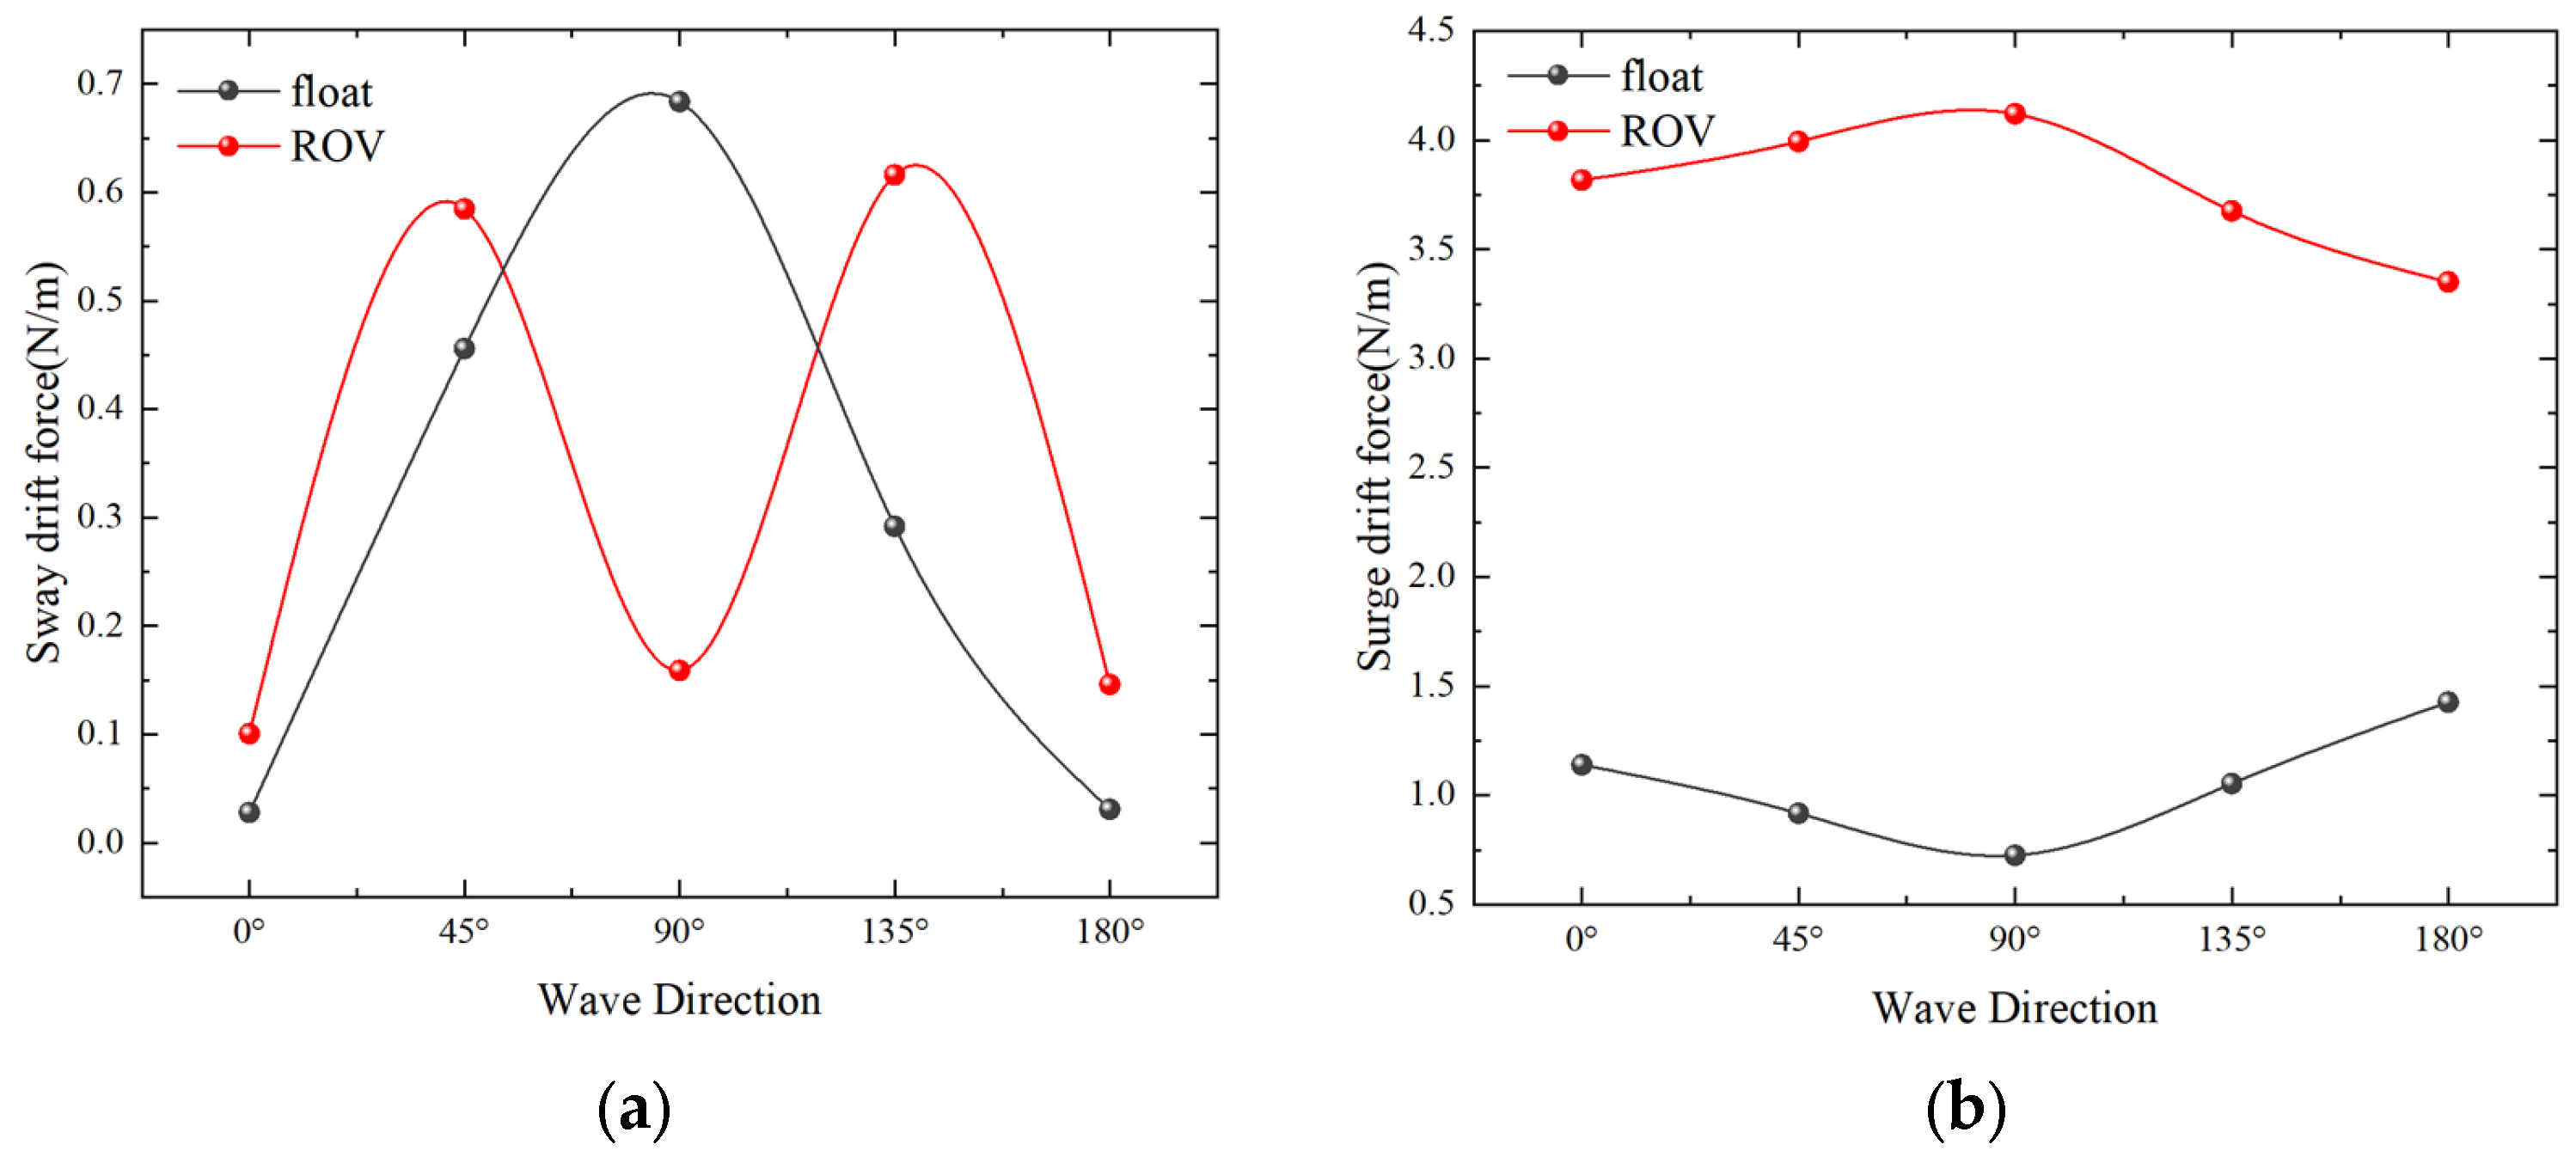
Figure 27 depicts the average drift force of the double floater during sway and surge in different wave directions. Figure 27a shows that the ROV in the sway drift force is smaller in the 90° condition, most likely due to the shape of the ROV, which is wider than 0° and 180°, longer than the 90°, and has a higher flow rate. Consequently, it is preferable to choose the 0° and 180° wave directions in the “alongside” phase.
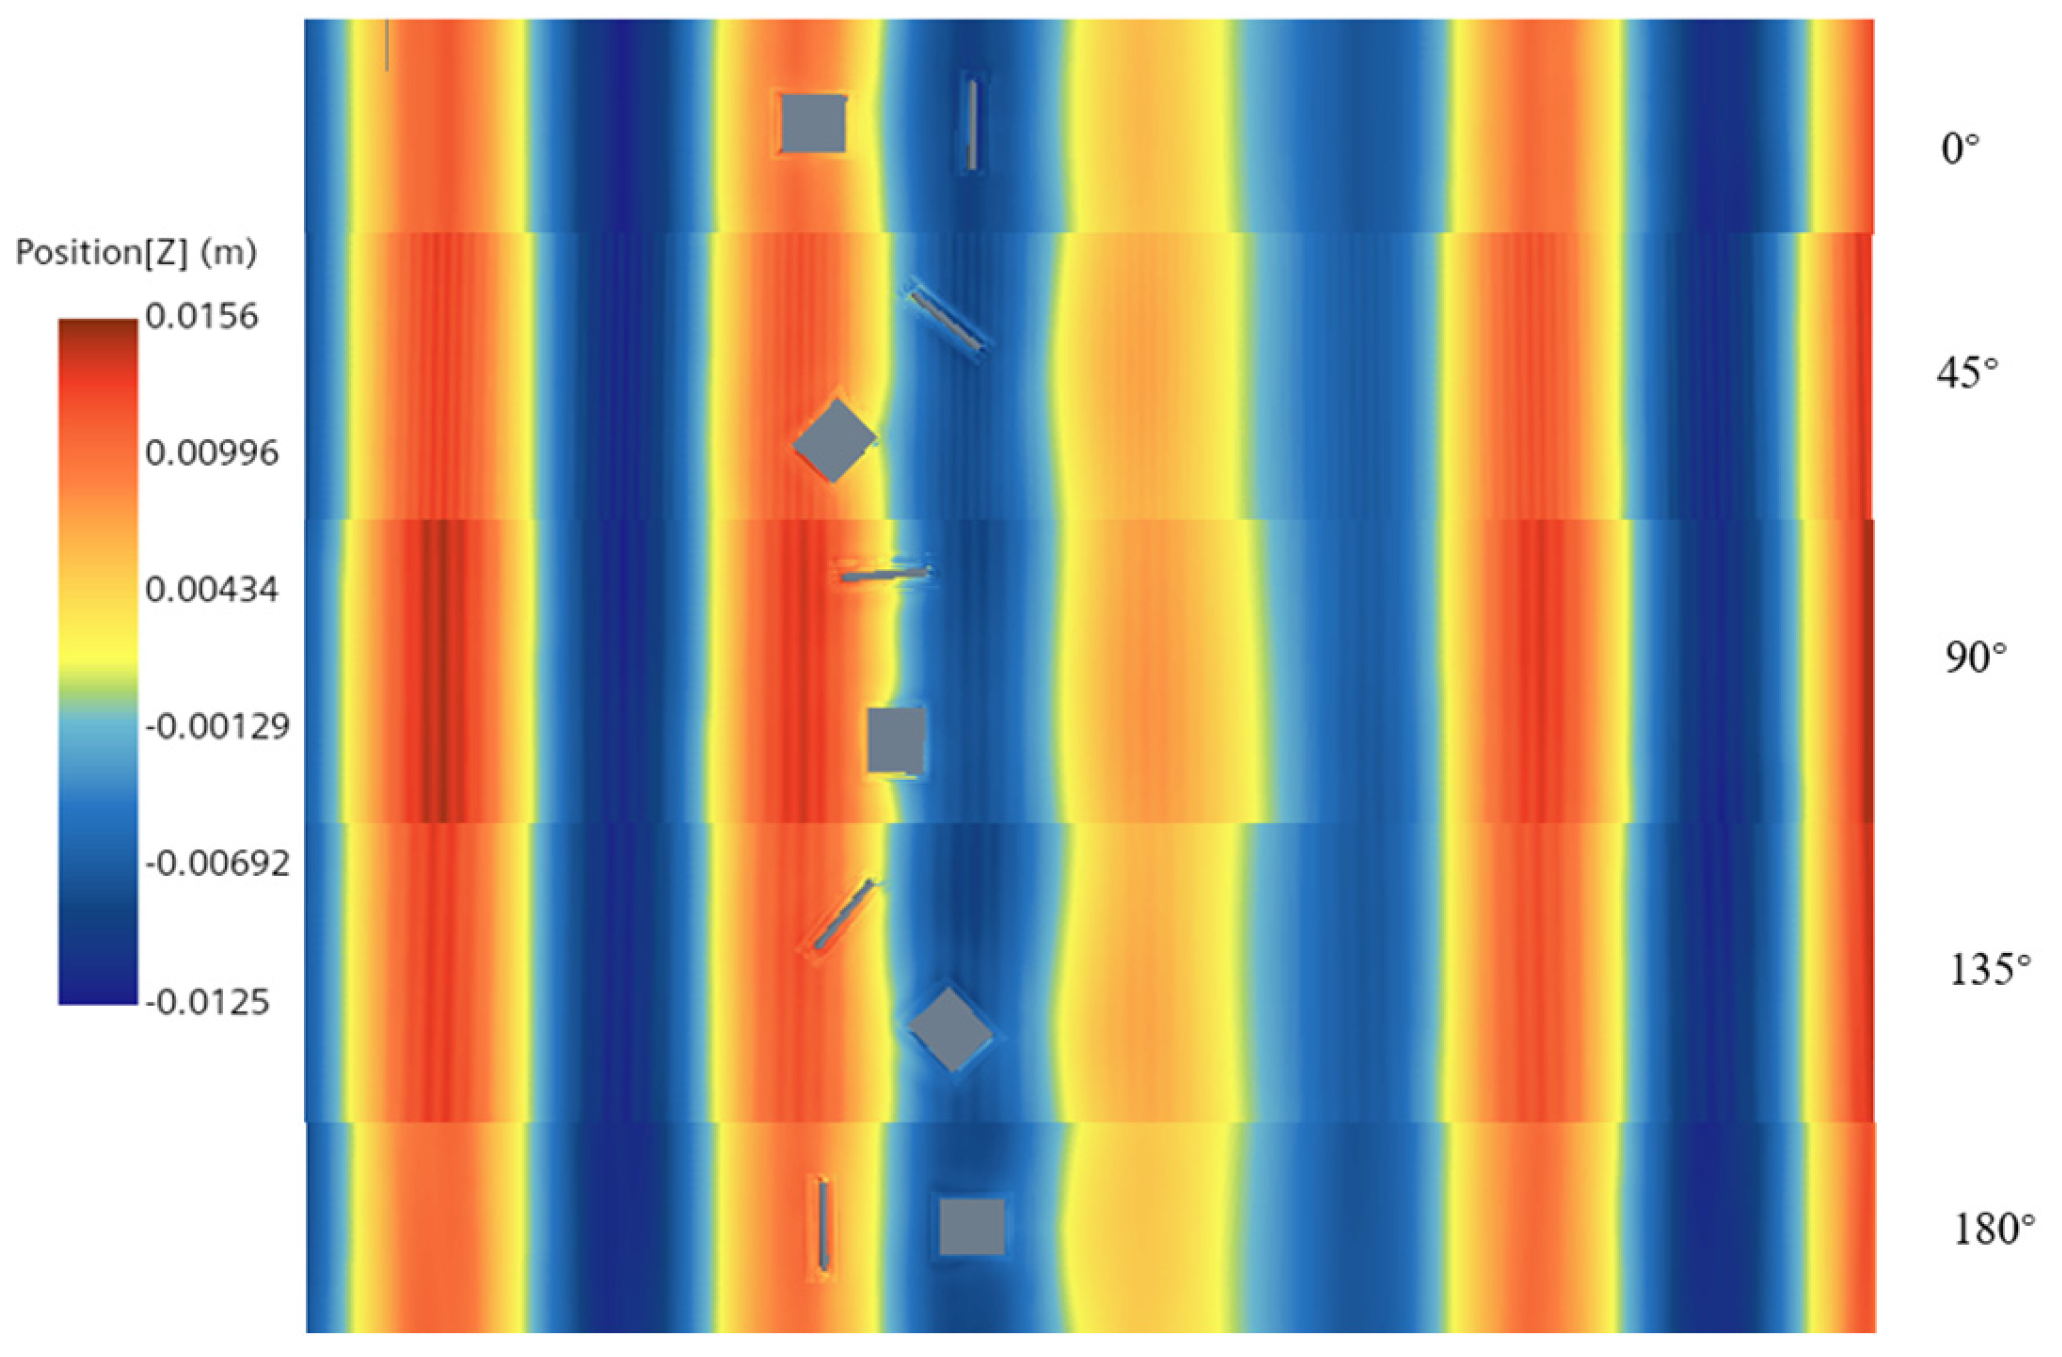
Figure 28 illustrates the wave cloud maps of a double floating body for various wave directions. The flow field diagram reveals that at 0°, there is a phenomenon of wave surface elevation at the bow and stern of the two floating bodies, reaching a maximum of 1.1 times the incident wave height, primarily due to the superposition of incident and reflected waves. At this stage, the incident wave diffracts from the ROV’s bow into the intervening space. At 45° and 145°, the amplitude of the wave surface elevation increases to approximately 4.1 times that of the incoming wave.

4.4. Characteristics of Double Floating Body Towing Motion

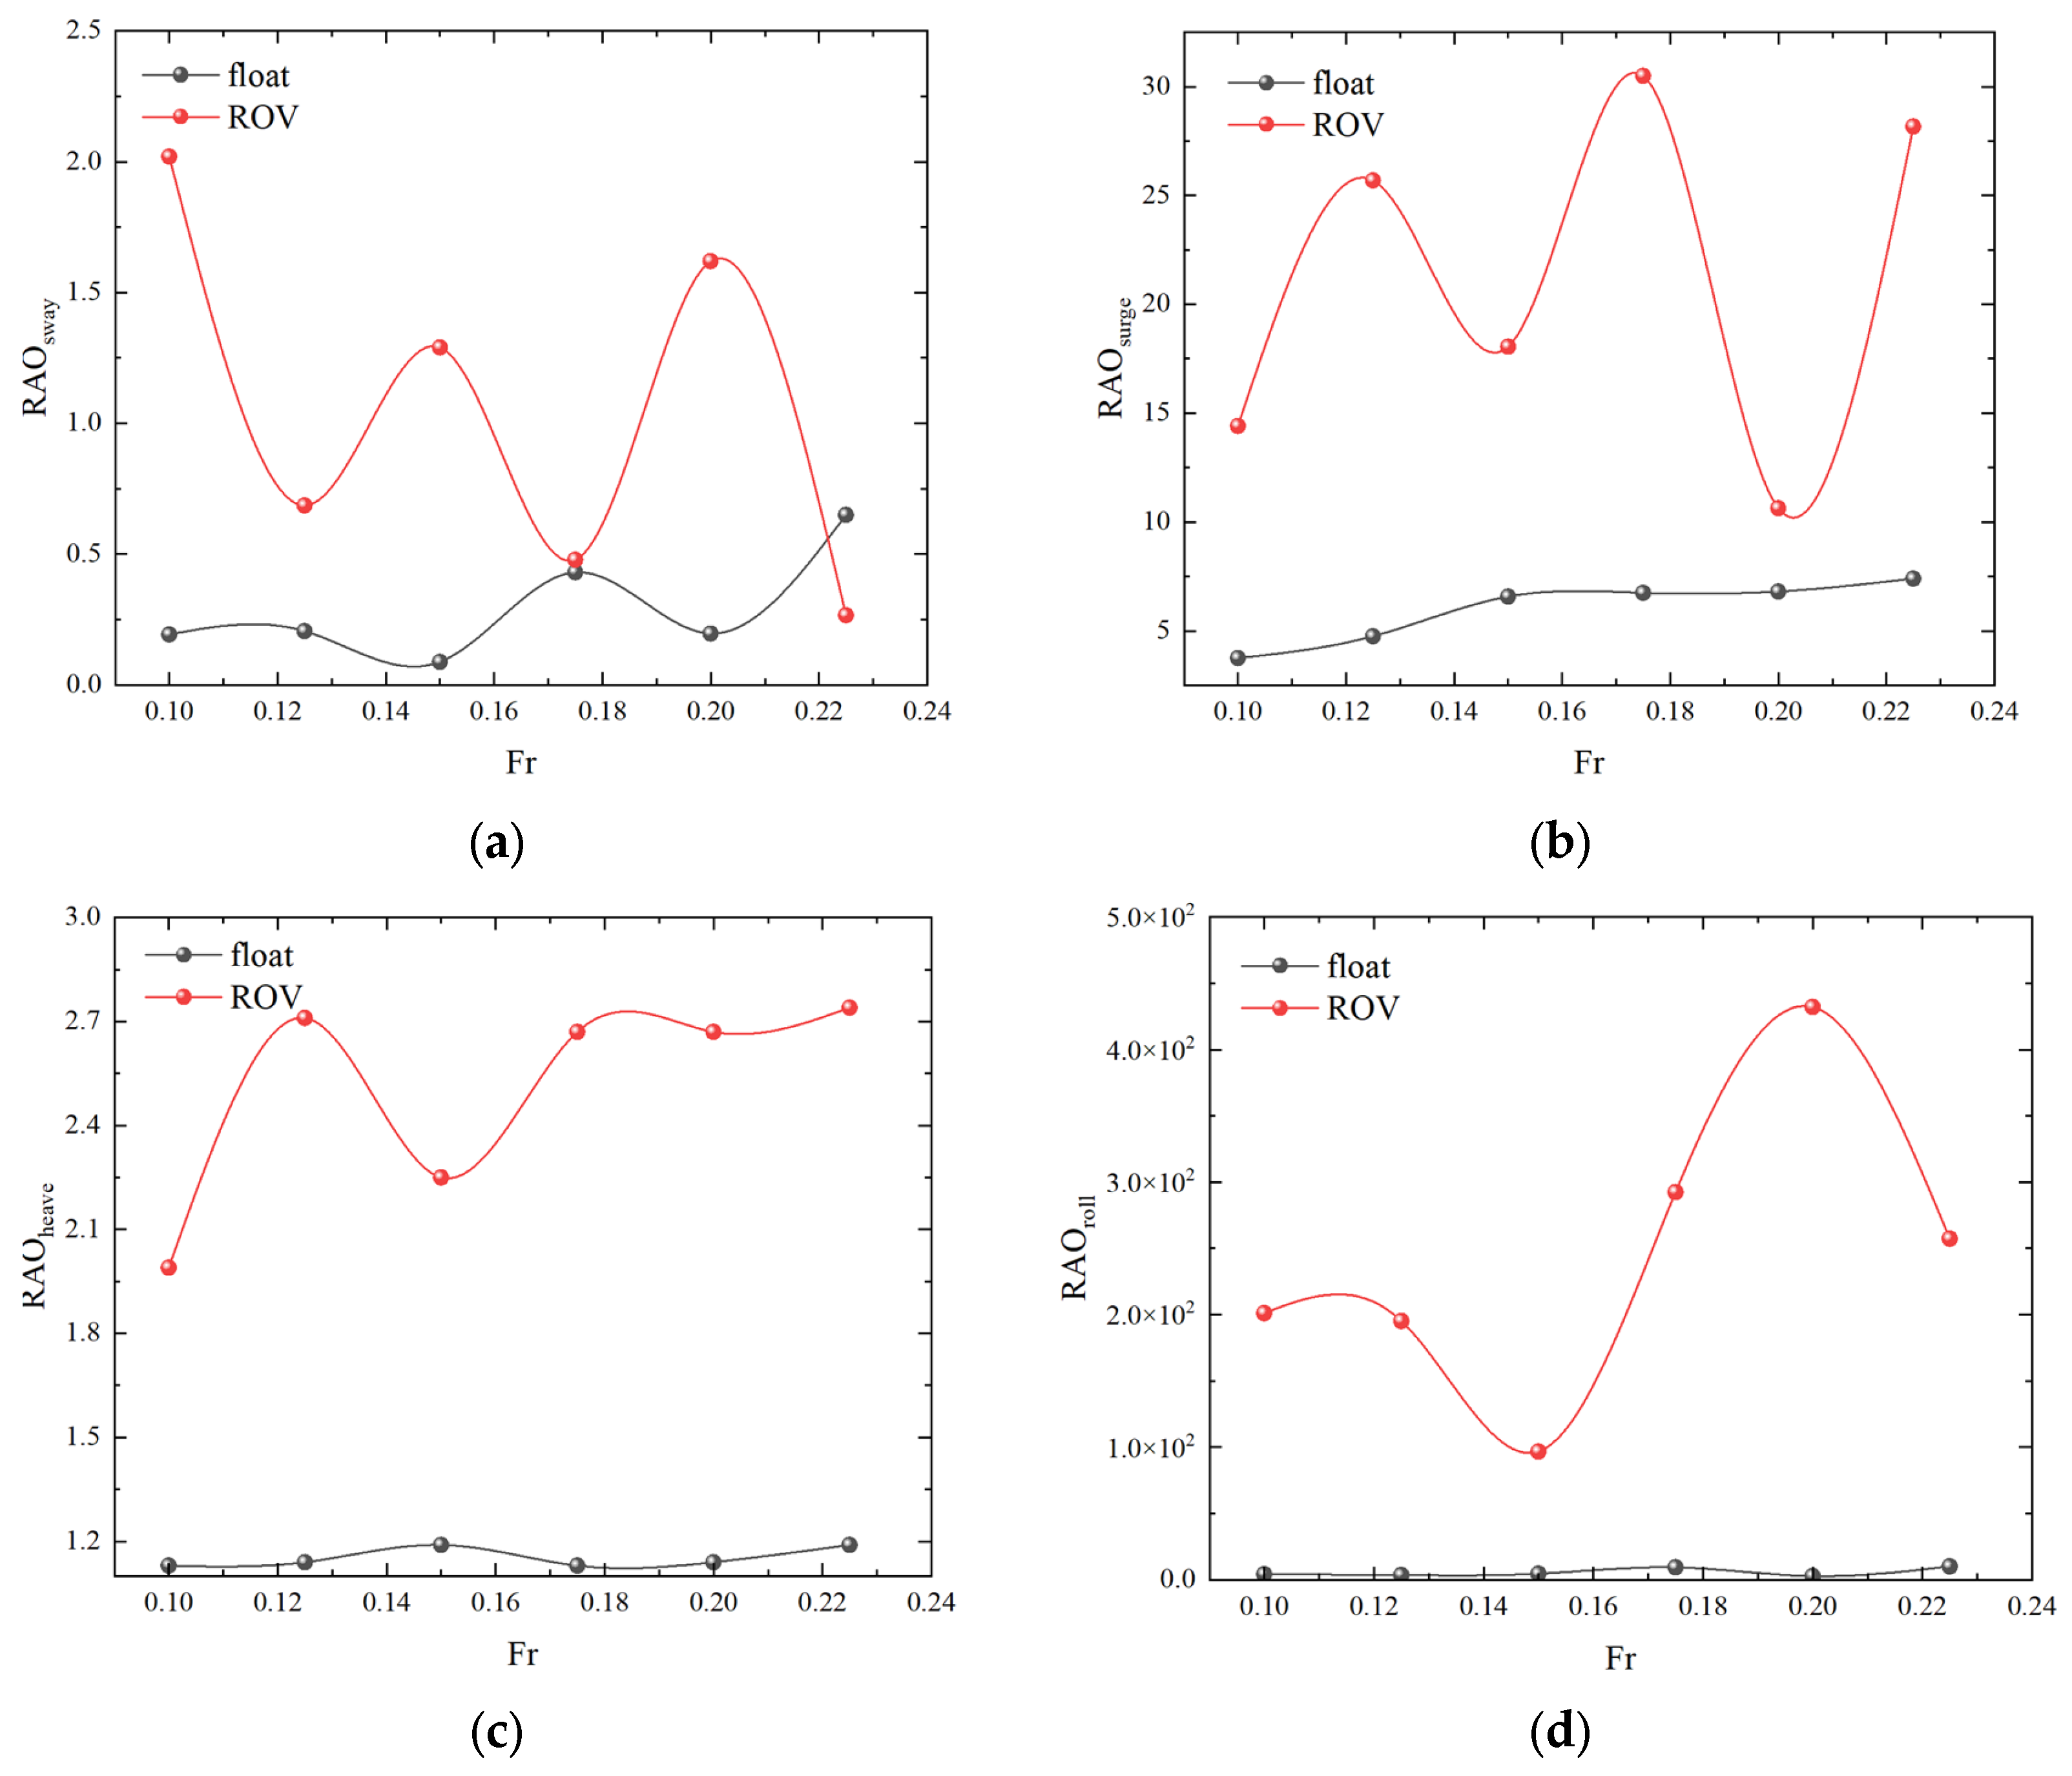
During the “towing phase”, the ROV replaces the ROV’s connector with a flexible connecting cable while towing the FLOAT. The ROV is towed by dragging the rescued FLOAT at a certain pace under wave conditions. Figure 29 depicts the variation curve of the six-degree-of-freedom RAO of the towing system with sailing speed, as determined by simulation calculations. At Fr = 0.1, the sway response of the two ships reaches its maximum. This could be attributed to the substantial influence of the cables’ own weight at low speeds, leading to pronounced heave movements in the floating body.
During the towing operation, the ROV has a masking effect on the recovered FLOAT, and the most visible masking impact is the pitch curve, as shown in Figure 30. The average pitch value between the ROV and the FLOAT is significantly different. In the heave direction, the relationship between the additional mass of the twin floats and the towing speed is nearly constant and unaltered. The roll-added mass of the double floats achieves its minimal value at Fr = 0.15, whereas the pitch-added mass reaches its minimum at Fr = 0.2.
According to Figure 31, at the towing speed Fr = 0.225, this could be due to the fact that the self-weight of the cable has a significant influence on the towing system at high speeds, which can lead to more serious float rocking of the double floats, which in turn affects the pitch and yaw of the floats, resulting in more serious yaw. The damping coefficients of ROV in Figure 31b surge, (e) pitch, and (f) yaw responses are minimal at Fr = 0.2, whereas the surge damping coefficients of the FLOAT rise with towing speed.
According to Figure 32a, the ROV’s sway drift force shows an overall roughly upward trend with increasing towing speed, and its average drift force at Fr = 0.225 is four times that of Fr = 0.1, while Figure 32b shows that the average drift force of the ROV’s surge reaches its minimum value at Fr = 0.2. Consequently, the towing speed that should be chosen at the P3 stage is Fr = 0.2.
Figure 33 presents the wave cloud map of the ROV during towing at various speeds. The map reveals that the double floating body oscillates vertically due to the combined effects of waves and water flow, while the free surface directly above the ROV and FLOAT fluctuates in response to the floating body’s movement. Similar to the P1 berthing phase, the position of the peak wave height shifts with the propagation of the wave crest. At Fr = 0.2, as the incident wave advances, a wavefront rise forms near the ROV’s profile, reaching 2.1 times the height of the incident wave. At Fr = 0.225, a peak emerges within the spacing, with an amplitude 3.5 times that of the incident wave.

5. Conclusions

This article delves into the method of employing ROVs to recover floating artifacts in marine scientific research, systematically exploring the three phases: the ROV berthing towards the recovered float, attaching flexible cables at the proper locations, and pulling the salvaged float at a predetermined towing speed. The coupled dynamic response of the salvage system is investigated using the computational fluid dynamics (CFD) approach, with an emphasis on examining the motion response, added mass, damping coefficient, and average drift force hydrodynamic coefficient response of the two floating bodies. The following conclusions have been drawn:
  • Numerical simulation of single-float and double-float coupling.
A single floater is less impacted by wave movement in the sway direction and exhibits smoother rolling. The motion response of a single floating body ROV in surge, heave, pitch, and yaw RAO is greater than that of an ROV with double floating body coupling.
2.
Characteristics of Double Floating Body Berthing Motion.
Throughout the salvage operation, it is critical to analyze the berthing motion of the ROV to the recovered FLOAT at various berthing speeds. During the berthing process, the RAO of the heave, roll, and pitch motion responses of FLOAT vary less with the berthing speed. The two floats have comparatively smaller roll and yaw RAO and smoother motion at Fr = 0.15~0.18. The ROV has a greater added mass than the FLOAT, and at Fr = 0.2, the FLOAT’s sway and yaw reaction is more stable than the ROV’s. Notably, FLOAT’s sway and yaw responses appear to rise considerably at Fr = 0.2. ROV’s sway reaction appears to dramatically rise at Fr = 0.18, while ROV’s roll response appears to be at its lowest at Fr = 0.168. The average drift force of the double floater’s sway achieves a generally perfect condition at Fr = 0.15, while the ROV’s sway RAO reaction is at its peak at Fr = 0.125. At Fr = 0.15 and Fr = 0.175, the peak wave height at the floating body gap reaches up to 1.8 times the incident wave’s height. Conversely, at Fr = 0.225, the peak wave height increases to 2.6 times that of the incident wave, and at Fr = 0.1, it reaches 1.3 times the incident wave’s height. Based on the foregoing parameters, the optimal berthing speed interval for the P1 stage is Fr = 0.15~0.18.
3.
Characteristics of Double Floating Body Side-by-side Motion.
When investigating double floating bodies in the P2 stage, the calculation results may be too big or too tiny owing to the resonance of the gap water body at a distance of 0.25 L. The lowest reaction of the two floating bodies to sway, roll, and yaw RAO occurs at a separation of 0.45 L. ROV and FLOAT exhibit minimal added mass response in sway, surge, roll, pitch, and yaw directions at 0.4 L~0.5 L. The damping coefficient of the two floating bodies in the sway direction is at its lowest with a separation of 0.478 L. The damping coefficient in the direction of ROV surge achieves its lowest at 0.467 L, whereas the damping coefficient in the direction of ROV yaw reaches its lowest at 0.487 L. When the spacing is 0.48 L, FLOAT’s sway drift force is the smallest, and the average surge drift force of the two floating bodies typically follows a pretty smooth pattern as berthing speed increases. The separation between the two floating bodies does not influence their combined surge average drift force. At L = 0.4 L and 0.5 L, the maximum wave height is 1.6 times the amplitude of the incident wave, and at L = 0.2 L, the maximum wave height is 3.7 times the amplitude of the incident wave. Therefore, the ideal spacing between double floats in the P2 stage during wave action is 0.4 L to 0.5 L.
Subsequently, this article investigated the effects of different wave conditions on the motion of double floating bodies. The RAOs for the double floats’ surge, heave, and pitch movements peaked at 90°. The increased mass of the ROV at 45° and 135° was more than that at 0° and 180°, while the additional mass of the ROV at 90° was the smallest, which might be attributed to the influence of fluid motion between the thin slits of the double floats in the 90° wave direction. The damping coefficient of the ROV peaks at the 90° wave direction, declines with increasing wave angle in the surge direction, and FLOAT starts to rise. The ROV’s damping coefficient peaks at 105° roll and 45° yaw, while the ROV’s sway drift force appears to be negligible at 90°. The ROV sway drift force appears to be smaller at 90°, which has a higher flow rate, than at 0° and 180°, where the fluid passes through the width of the float, and 90°, where the fluid passes through the length of the float. At 0°, the wave surface elevation is observed at the bow and stern of the two floating bodies, reaching a maximum of 1.1 times the incident wave’s amplitude. At 45° and 145°, the wave surface elevation approximately equals 4.1 times the amplitude of the incident wave. In conclusion, it is preferable to choose 0° for the wave direction in the P2 stage, which improves the stability of the double floater under wave action.
4.
Characteristics of Double Floating Body Towing Motion.
After attaching the flexible connection cable, the ROV and rescued floating body FLOAT are hauled to the FLOAT at a predetermined towing speed. It is possible to deduce that at a speed of Fr = 0.1, the sway reaction of the two vessels is maximal, which might be related to the fact that the self-weight of the cables has a considerable impact on the towing system at low speeds, resulting in more severe float lifting and sinking movements. The roll-added mass of the double floating body reaches its minimum at Fr = 0.15, and for pitch at Fr = 0.2. At Fr = 0.225, this might be because at high speeds, the self-weight of the cable has a significant impact on the towing system, affecting the pitch and yaw of the floating body. The ROV’s surge, pitch, and yaw damping coefficients appear to be lowest at Fr = 0.2. The ROV’s sway drift force increases almost proportionally with towing speed, and its average drift force at Fr = 0.225 is four times that of Fr = 0.1, while the ROV’s surge average drift force reaches a low at Fr = 0.2. At Fr = 0.2, the greatest wave height is 2.1 times that of the incident wave; at Fr = 0.225, a peak wave emerged inside the spacing with amplitude 3.5 times that of the incident wave. Taken together, the towing speed that should be chosen at the P3 stage is Fr = 0.2.
Marine float salvage is a unique method of operation. The next study will focus on offshore floating salvage in rough sea circumstances to better understand the underlying physical principles and enhance salvage plan design. Rational salvaging tactics will be developed to improve flexibility in different sea conditions.

Author Contributions

Conceptualization: G.S., H.Z. and S.C.; methodology: S.C., G.S. and H.Z.; software: S.C., H.Z. and G.S.; validation: G.S., S.C. and F.W.; formal analysis: G.S. and S.C.; resources: S.C., F.W. and G.S.; data curation: G.S. and S.C.; writing—original draft preparation: G.S., S.C. and H.Z.; writing—review and editing: G.S., S.C., H.Z. and F.W. All authors have read and agreed to the published version of the manuscript.

Funding

(1) The Opening Research Fund of the National Engineering Laboratory for Test and Experiment Technology of Marine Engineering Equipment, grant number 750NEL-2023-01; (2) The Fundamental Research Funds for the Central Universities: 3132023513.

Institutional Review Board Statement

Not applicable.

Informed Consent Statement

Not applicable.

Data Availability Statement

The data presented in this study are available on request from the corresponding author. The data are not publicly available due to scientific requirements.

Conflicts of Interest

The authors declare no conflict of interest. The funders played no role in the design of the study; in the collection, analyses, or interpretation of the data; in the writing of the manuscript; or in the decision to publish the results.

References

  1. Chen, Y.S. Research on Deep-Sea Wreckage Salvage System and Its Key Technology. Doctoral Dissertation, Harbin Engineering University, Harbin, China, 2019. [Google Scholar]
  2. Xiao, W.; Wanh, Y.; Liu, W.; Cheng, X.; Wang, D.; Zhang, L. Numerical Investigation of the Frequency-domain Coupled Hydrodynamics for Two Ships Advancing at Close Proximity in Waves. In Proceedings of the OCEANS 2018 MTS/IEEE Charleston, Charleston, SC, USA, 22–25 October 2018; IEEE: Piscataway, NJ, USA, 2018; pp. 1–6. [Google Scholar]
  3. Luo, X.C. Numerical Simulation and Experimental Study on the Problem of Coupled Action of FLNG Ship Motion and Liquid Tank Sloshing. Master’s Thesis, Dalian University of Technology, Dalian, China, 2019. [Google Scholar]
  4. Xie, C.; Choi, Y.; Rongère, F.; Clément, A.H.; Delhommeau, G.; Babarit, A. Comparison of existing methods for the calculation of the infinite water depth free-surface Green function for the wave–structure interaction problem. Appl. Ocean Res. 2018, 81, 150–163. [Google Scholar] [CrossRef]
  5. Hong, L. Moving Pulsation Source Green’s Function Method and the Study of Resistance Increase of Sailing Ships in Waves. Doctoral Dissertation, Shanghai Jiao Tong University, Shanghai, China, 2017. [Google Scholar]
  6. Yang, J. Research on Three-Dimensional Time-Domain Nonlinear Wave Load Calculation Method. Doctoral Dissertation, China Shipbuilding Research Institute, Beijing, China, 2016. [Google Scholar]
  7. Kianejad, S.S.; Enshaei, H.; Duffy, J.; Ansarifard, N.; Ranmuthugala, D. Ship roll damping coefficient prediction using CFD. J. Ship Res. 2019, 63, 108–122. [Google Scholar] [CrossRef]
  8. Hong, Z.C. Hydrodynamic Performance Prediction and Optimisation of Ships Based on CFD Method. Doctoral Dissertation, Dalian University of Technology, Dalian, China, 2018. [Google Scholar]
  9. Yang, S.Y.; Zhang, H.S.; Wu, P.F. Theoretical solution and characterisation of second-order resonance for three-dimensional swaying motion of liquid tanks. Ocean Eng. 2015, 33, 71–79. [Google Scholar]
  10. Saripilli, J.R.; Sen, D. Sloshing-Coupled Ship Motion Algorithm for Estimation of Slosh-Induced Pressures: Keynote Contribution for the International Workshop on Wave Loads and Motions of Ships and Offshore Structures, Harbin, China, 5–7 November, 2017. J. Mar. Sci. Appl. 2018, 17, 312–329. [Google Scholar] [CrossRef]
  11. Yuan, C.P. Analysis of the Coupled Motion Response of Liquid Tank Sloshing and Ship under Irregular Wave Action. Master’s Thesis, Jiangsu University of Science and Technology, Zhenjiang, China, 2021. [Google Scholar]
  12. Xiao, K.L.; Chen, Z.G. Numerical simulation of time-domain coupled motions of multi-liquid tank wakes and aquaculture vessels. China Ship Res. 2020, 15, 136–144. [Google Scholar]
  13. Saghi, H. A parametric study on wave–floating storage tank interaction using coupled VOF-FDM method. J. Mar. Sci. Technol. 2019, 24, 454–465. [Google Scholar] [CrossRef]
  14. Yu, L.; Xue, M.A.; Zhu, A. Numerical investigation of sloshing in rectangular tank with permeable baffle. J. Mar. Sci. Eng. 2020, 8, 671. [Google Scholar] [CrossRef]
  15. Moradi, N.; Zhou, T.; Cheng, L. Effect of inlet configuration on wave resonance in the narrow gap of two fixed bodies in close proximity. Ocean Eng. 2015, 103, 88–102. [Google Scholar] [CrossRef]
  16. Gao, J.L.; Zang, J.; Chen, L.F.; Chen, Q.; Ding, H.Y.; Liu, Y.Y. On hydrodynamic characteristics of gap resonance between two fixed bodies in close proximity. Ocean Eng. 2019, 173, 28–44. [Google Scholar] [CrossRef]
  17. Gao, J.L.; He, Z.W.; Huang, X.H.; Liu, Q.; Zang, J.; Wang, G. Effects of free heave motion on wave resonance inside a narrow gap between two boxes under wave actions. Ocean Eng. 2021, 224, 108753. [Google Scholar] [CrossRef]
  18. Wu, Y.W.; Zhou, J.; Li, H.; Bi, Z. Numerical simulation of liquid tank sloshing with different shapes based on VOF method. Ship Sci. Technol. 2022, 44, 84–89. [Google Scholar]
  19. Saghi, R.; Hirdaris, S.; Saghi, H. The influence of flexible fluid structure interactions on sway induced tank sloshing dynamics. Eng. Anal. Bound. Elem. 2021, 131, 206–217. [Google Scholar] [CrossRef]
  20. Zhao, D.; Hu, Z.; Chen, G.; Lim, S.; Wang, S. Nonlinear sloshing in rectangular tanks under forced excitation. Int. J. Nav. Archit. Ocean Eng. 2018, 10, 545–565. [Google Scholar] [CrossRef]
  21. Ning, D.Z.; Su, P.; Zhang, S.W.; Li, X. Hydrodynamic characteristics of float-type sway-reducing structures in three-dimensional liquid tanks. J. Harbin Eng. Univ. 2019, 40, 154–161. [Google Scholar]
  22. Liu, Y.; Falzarano, J. A wall damping method to estimate the gap resonance in side-by-side offloading problems. Ocean Eng. 2019, 173, 510–518. [Google Scholar] [CrossRef]
  23. Zhao, W.; Milne, I.A.; Efthymiou, M.; Wolgamot, H.A.; Draper, S.; Taylor, P.; Taylor, R.E. Current practice and research directions in hydrodynamics for FLNG-side-by-side offloading. Ocean Eng. 2018, 158, 99–110. [Google Scholar] [CrossRef]
  24. Zhang, Z.K. Numerical Simulation of Multi-Floating Complex Structures under Wave Response. Master’s Thesis, Nanjing University of Science and Technology, Nanjing, China, 2018. [Google Scholar]
  25. Koop, A. Using CFD to determine scale effects on current loads of offshore vessels in side-by-side configuration. Ocean Eng. 2020, 195, 106707. [Google Scholar] [CrossRef]
  26. Jiang, C.; el Moctar, O.; Schellin, T.E. Mooring-Configurations Induced Decay Motions of a Buoy. J. Mar. Sci. Eng. 2021, 9, 350. [Google Scholar] [CrossRef]
  27. Saltari, F.; Pizzoli, M.; Coppotelli, G.; Gambioli, F.; Cooper, J.E.; Mastroddi, F. Experimental characterisation of sloshing tank dissipative behaviour in vertical harmonic excitation. J. Fluids Struct. 2022, 109, 103478. [Google Scholar] [CrossRef]
  28. Igbadumhe, J.-F.; Sallam, O.; Fürth, M.; Feng, R. Experimental Determination of Non-Linear Roll Damping of an FPSO Pure Roll Coupled with Liquid Sloshing in Two-Row Tanks. J. Mar. Sci. Eng. 2020, 8, 582. [Google Scholar] [CrossRef]
  29. Sanapala, V.S.; Sajish, S.D.; Velusamy, K.; Ravisankar, A.; Patnaik, B.S.V. An experimental investigation on the dynamics of liquid sloshing in a rectangular tank and its interaction with an internal vertical pole. J. Sound. Vib. 2019, 449, 43–63. [Google Scholar] [CrossRef]
  30. Liu, Y.L.; Teng, B. Variable amplitude coupling test of floatation tank motion and liquid tank sway. Ship Eng. 2022, 44, 71–74. [Google Scholar]
  31. Kawahashi, T.; Arai, M.; Wang, X. A study on the coupling effect between sloshing and motion of FLNG with partially filled tanks. J. Mar. Sci. Technol. 2019, 24, 917–929. [Google Scholar] [CrossRef]
  32. Song, X.; Liu, W.; Wu, H. Investigation on Load Characteristics of Hinged Connector for a Large Floating Structure Model under Wave Actions. J. Mar. Sci. Eng. 2023, 11, 786. [Google Scholar] [CrossRef]
  33. Song, N. Hydrodynamic Simulation Analysis and Experimental Research of Underwater Robot. Master’s Thesis, Dalian University of Technology, Dalian, China, 2020. [Google Scholar]
  34. Hao, J.; Ding, D.; Li, J.; Huang, J. The Wave Amplification Mechanism of Resonant Caisson. J. Mar. Sci. Eng. 2024, 12, 1038. [Google Scholar] [CrossRef]
  35. Zhou, W.; Cheng, Y.; Lin, Z. Numerical simulation of long-wave wave dissipation in near-water flat-plate array breakwaters. Ocean Eng. 2023, 268, 113377. [Google Scholar] [CrossRef]
  36. Malenica, Š.; Orozco, J.; Chen, X. In Some aspects of multibody interactions in seakeeping. In Proceedings of the ISOPE International Ocean and Polar Engineering Conference, Seoul, Republic of Korea, 19–24 June 2005; ISOPE: Nanjing, China, 2005; p. ISOPE-I-05-250. [Google Scholar]
  37. Zhu, J.; Frerich, T.; Herrmann, A.S. CFD modeling and validation of heat transfer inside an autoclave based on a mesh independency study. J. Compos. Mater. 2021, 55, 2469–2487. [Google Scholar] [CrossRef]
  38. Chen, F. Hydrodynamic Characterisation of Small-Scale Broken Ice Coupled with Floating Platform in Wave Field. Master’s Thesis, Jiangsu University of Science and Technology, Zhenjiang, China, 2023. [Google Scholar]
  39. Xin, S.; Wang, Y.; Wang, L.; Zhu, X.; Chen, S.; Zhou, D. Dynamic analysis of the mooring system of a salvage barge: A coupled time-domain method considering seabed resistance during the off-bottom stage. Ocean Eng. 2023, 275, 114078. [Google Scholar] [CrossRef]
  40. Wang, G.Y.; Zhang, Q.; Zhao, Y.L. Analysis of velocity distribution of coastal currents under irregular waves. Ocean Eng. 2021, 39, 11–20. [Google Scholar]
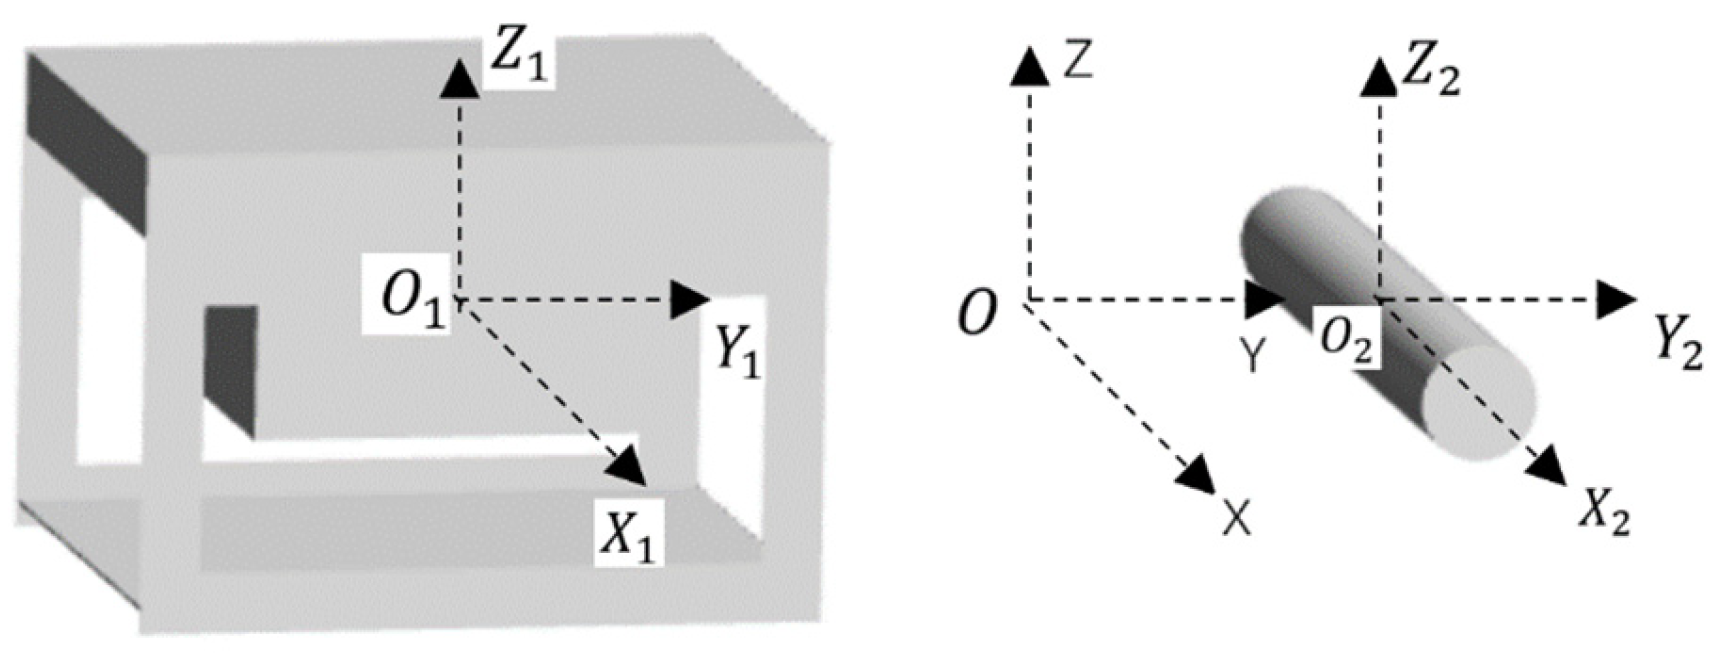
Figure 1. Multi-float coordinate system.
Jmse 12 01688 g001
Figure 2. Schematic diagram of the dynamic target salvage system (brown represents water, blue represents air): (a) overall view; (b) top view. Process 1 (P1) represents the berthing phase of floating body salvage, in which the ROV berths to the FLOAT; Process 2 (P2) represents the concurrent berthing phase of floating body salvage, in which the ROV and the FLOAT are free drifting in the sea; and Process 3 (P3) represents the salvage phase of floating body salvage, in which the ROV tows the FLOAT using a flexible cable.
Jmse 12 01688 g002
Figure 3. Computational domain and boundary conditions (below the blue interface is water, top is air).
Jmse 12 01688 g003
Figure 4. Schematic of the computational domain and the grid at the waterline (red part is the boundary interface, blue represents the symmetrical plane).
Jmse 12 01688 g004
Figure 5. Schematic diagram of the grid of the floating body salvage system (blue represents the border interface, brown represents the cross-section).
Jmse 12 01688 g005
Figure 6. Time step convergence verification curve.
Jmse 12 01688 g006
Figure 7. Floating body salvage test flow chart.
Jmse 12 01688 g007
Figure 8. Experimental equipment and layout: (a) wave pool; (b) FLOAT; (c) ROV; (d) attitude instrument; (e) dynamic target salvage site.
Jmse 12 01688 g008
Figure 9. RAOs of 4DOFs: (a) Heave; (b) Roll; (c) Pitch; (d) Yaw.
Jmse 12 01688 g009
Figure 10. Added Mass of 4DOFs: (a) Heave; (b) Roll; (c) Pitch; (d) Yaw.
Jmse 12 01688 g010
Figure 11. Damping of 4DOFs: (a) Heave; (b) Roll; (c) Pitch; (d) Yaw.
Jmse 12 01688 g011
Figure 12. Summary diagrams of two assessment elements (MA, RMS) of 4DOFs in different wave directions: (a) heave response; (b) roll response; (c) pitch response; (d) yaw response.
Jmse 12 01688 g012aJmse 12 01688 g012b
Figure 13. Comparison of Motion Responses for Single and Double Floating Bodies: (a) RAOs of ROV with single-float and double-float in terms of sway, surge, and heave; (b) RAOs of ROV with single-float and double-float in terms of roll, pitch, and yaw; (c) RAOs of FLOAT with single-float and double-float in terms of sway; (c) RAOs of roll, pitch, and yaw for FLOAT under single-float and double-float; (d) RAOs of roll, pitch, and yaw for FLOAT under single-float and double-float.
Jmse 12 01688 g013
Figure 14. RAOs of 6DOFs at different berthing speeds: (a) Sway; (b) Surge; (c) Heave; (d) Roll; (e) Pitch; (f) Yaw.
Jmse 12 01688 g014
Figure 15. Added Mass of 6DOFs at different berthing speeds: (a) Sway; (b) Surge; (c) Heave; (d) Roll; (e) Pitch; (f) Yaw.
Jmse 12 01688 g015
Figure 16. Damping of 6DOFs at different berthing speeds: (a) Sway; (b) Surge; (c) Heave; (d) Roll; (e) Pitch; (f) Yaw.
Jmse 12 01688 g016
Figure 17. Mean drift force of twin floats at different berthing speeds: (a) sway drift force; (b) surge drift force.
Jmse 12 01688 g017
Figure 18. Cloud map of double floating body waves at different berthing speeds.
Jmse 12 01688 g018
Figure 19. RAOs of 6DOFs at different distances: (a) Sway; (b) Surge; (c) Heave; (d) Roll; (e) Pitch; (f) Yaw.
Jmse 12 01688 g019aJmse 12 01688 g019b
Figure 20. Added Mass of 6DOFs at different distances: (a) Sway; (b) Surge; (c) Heave; (d) Roll; (e) Pitch; (f) Yaw.
Jmse 12 01688 g020aJmse 12 01688 g020b
Figure 21. Damping of 6DOFs at different distances: (a) Sway; (b) Surge; (c) Heave; (d) Roll; (e) Pitch; (f) Yaw.
Jmse 12 01688 g021aJmse 12 01688 g021b
Figure 22. Mean drift force of double floats with different distances: (a) sway drift force; (b) surge drift force.
Jmse 12 01688 g022
Figure 23. Cloud map of double floating body waves at different distances.
Jmse 12 01688 g023
Figure 24. RAOs of 6DOFs at different wave directions: (a) Sway; (b) Surge; (c) Heave; (d) Roll; (e) Pitch; (f) Yaw.
Jmse 12 01688 g024aJmse 12 01688 g024b
Figure 25. Added Mass of 6DOFs at different wave directions: (a) Sway; (b) Surge; (c) Heave; (d) Roll; (e) Pitch; (f) Yaw.
Jmse 12 01688 g025aJmse 12 01688 g025b
Figure 26. Damping of 6DOFs at different wave directions: (a) Sway; (b) Surge; (c) Heave; (d) Roll; (e) Pitch; (f) Yaw.
Jmse 12 01688 g026aJmse 12 01688 g026b
Figure 27. Mean drift force of double floats in different wave directions: (a) sway drift force; (b) surge drift force.
Jmse 12 01688 g027
Figure 28. Cloud map of double floating body waves with different downward waves.
Jmse 12 01688 g028
Figure 29. RAOs of 6DOFs at different towing speeds: (a) Sway; (b) Surge; (c) Heave; (d) Roll; (e) Pitch; (f) Yaw.
Jmse 12 01688 g029aJmse 12 01688 g029b
Figure 30. Added Mass of 6DOFs at different towing speeds: (a) Sway; (b) Surge; (c) Heave; (d) Roll; (e) Pitch; (f) Yaw.
Jmse 12 01688 g030aJmse 12 01688 g030b
Figure 31. Damping of 6DOFs at different towing speeds: (a) Sway; (b) Surge; (c) Heave; (d) Roll; (e) Pitch; (f) Yaw.
Jmse 12 01688 g031aJmse 12 01688 g031b
Figure 32. Mean drift force of twin floats at different towing speeds: (a) sway drift force; (b) surge drift force.
Jmse 12 01688 g032
Figure 33. Cloud map of double floating body waves at different speeds.
Jmse 12 01688 g033
Table 1. ROV model attributes.
DesignationUnitNumerical Model
Molded lengthLa (m)0.86
Molded breadthDa (m)0.75
Type highHa (m)0.60
Draftha (m)0.40
WeightMa (kg)94.91
Center of gravityCGa (m)x = 0, y = 0, z = 0.168
Moment of inertiaIa (kg/m2)x = 7.527, y = 8.366, z = 10.436
Table 2. FLOAT model attributes.
DesignationUnitNumerical Model
Molded lengthLb (m)1.2
DiameterDb (m)0.145
Drafthb (m)0.1
WeightMb (kg)16.85
Center of gravityCGb (m)x = 0, y = 0, z = 0.02
Moment of inertiaIb (kg/m2)x = 2.42, y = 2.41, z = 0.07
Table 3. Grid independence analysis.
GroupingNumber of GridsROV
Heave (m)
FLOAT
Heave (m)
ROV
Yaw (deg)
FLOAT
Yaw (deg)
Rough3,714,6460.23860.10431.19742.1831
Medium4,851,7520.24000.10551.21632.2255
Fine6,173,7720.24030.10631.22192.2409
Table 4. Hydrodynamic coefficients of double floating bodies under wave action in various directions.
Working Conditions4DOFsRAOAdded MassDamping
CFDEXPCFDEXPCFDEXP
ABABABABABAB
Heave1.600.461.680.60133.0020.60139.2023.6046.8010.6055.3820.78
Roll286.92106.46305.98129.06916.616.211009.2216.26197.219.66281.0417.02
Pitch126.27344.68135.04366.671120.00316.491468.17335.608090.00323.108530.40372.48
Yaw130.0374.27150.5298.44100.92114.69255.45236.0885.25316.06173.20469.02
45°Heave1.780.702.040.82134.0021.50146.4024.4048.0011.5056.7221.90
Roll119.14212.37133.77234.3413732.86118.0214213.03133.131188.26146.961263.29288.30
Pitch150.16276.36173.36293.36159.90267.47237.78322.548034.19204.578444.43380.92
Yaw122.78235.71143.23252.06906.45787.14942.99886.759674.52173.879862.07291.25
Disclaimer/Publisher’s Note: The statements, opinions and data contained in all publications are solely those of the individual author(s) and contributor(s) and not of MDPI and/or the editor(s). MDPI and/or the editor(s) disclaim responsibility for any injury to people or property resulting from any ideas, methods, instructions or products referred to in the content.