Abstract
Side-scan sonar (SSS) is a critical tool in marine geophysical exploration, enabling the detection of seabed structures and geological phenomena. However, the manual interpretation of SSS images is time-consuming and relies heavily on expertise, limiting its efficiency and scalability. This study addresses these challenges by employing deep learning techniques for the automatic recognition of SSS images and introducing Marine-PULSE, a specialized dataset focusing on underwater engineering structures. The dataset refines previous classifications by distinguishing four categories of objects: pipeline or cable, underwater residual mound, seabed surface, and engineering platform. A convolutional neural network (CNN) model based on GoogleNet architecture, combined with transfer learning, was applied to assess classification accuracy and the impact of data expansion. The results demonstrate a test accuracy exceeding 92%, with data expansion improving small-sample model performance by over 7%. Notably, mutual influence effects were observed between categories, with similar features enhancing classification accuracy and distinct features causing inhibitory effects. These findings highlight the importance of balanced datasets and effective data expansion strategies in overcoming data scarcity. This work establishes a robust framework for SSS image recognition, advancing applications in marine geophysical exploration and underwater object detection.
1. Introduction
Side-scan sonar (SSS) is crucial for detecting underwater engineering structures and seabed topography, aiding the construction and maintenance of subsea pipelines and cables and investigations of residual mounds [1]. Seafloor information is gathered by SSS using emitted and reflected sound waves, with data being presented as images. However, interpreting these images requires empirical experiences [2], and variations in sonar imaging conditions, including signal noise, seafloor texture complexity, and object occlusion, further complicate manual analysis. Moreover, large volumes of image data are generated during the SSS exploration, making traditional interpretation methods labor-intensive and inefficient. While deep learning techniques have shown promise in sonar image recognition, existing datasets primarily focus on generalized underwater targets, lacking sufficient labeled data for engineering-specific structures. Therefore, developing automated recognition methods that can accurately classify different types of underwater engineering structures remains a key challenge in practical applications.
Early attempts at SSS image recognition primarily relied on handcrafted feature engineering combined with traditional classifiers such as support vector machines and random forests [3,4]. These methods, while pioneering, were limited by their dependency on manual feature extraction and lacked scalability for complex datasets.
In recent years, the rapid development of artificial intelligence methods has led to successful applications in image recognition across multiple disciplines, including medicine [5,6,7,8], remote sensing [9], and geographic information systems [10]. Recent advancements have further expanded the scope of SSS analysis, such as the S3Simulator dataset proposed by Yang et al. [11], which provides a standardized benchmarking framework for underwater image analysis. Meanwhile, many studies have also begun to explore the AI-based recognition of underwater objects [12,13,14,15,16]—for example, the SeabedObjects-KLSG side-scan sonar dataset [14] provided data for SSS image recognition research, including five image classes for object recognition (plane, ship, victim, etc.). The methods of supervised and semi-supervised learning models [16], coupled with domain-adaptive techniques for unsupervised shipwreck detection [17], and, later, CNN (Convolutional neural network) models became popular for their ability to extract valuable information from the SSS images [12,13,18]. Notably, SS-YOLO introduced a lightweight deep learning architecture tailored for real-time SSS target detection, addressing computational efficiency challenges [19]. After scholars have used various CNN models for SSS image recognition, Du et al. [20] have also conducted research on the performance and comparison of different CNN models on the same side-scan sonar dataset. Various deep learning models, such as ECNet [21], YOLO [22], and L-Unet [23], have been used in SSS image recognition. However, existing SSS datasets concentrate mainly on generalized underwater objects, such as the aircraft, ship, and victim [14,24,25], without specifically targeting underwater engineering structures. Recent efforts, such as zero- and few-shot SSS image generation methods [26], have begun to address data scarcity issues in specialized domains.
In our previous work [27], we introduced the Marine-PULSE dataset, which was primarily focused on recognizing submarine pipelines within the dataset, grouping the other three classes (underwater residual mound, seabed surface, and engineering platform) into a single category. Here, we expand upon this work by refining the Marine-PULSE dataset and conducting a more detailed recognition task by distinguishing all four categories of underwater engineering structures. Subsequently, we conducted two sets of experiments to verify the accuracy of CNN in the recognition of SSS images of underwater engineering structures and to explore the impact of data expansion methods on model accuracy. The study first introduces the dataset and methodology, including the model structure and data processing strategies, followed by a presentation of the experimental results and performance evaluation. Finally, the findings are discussed in the context of existing approaches, and potential future research directions are outlined.
2. Materials and Methods
2.1. Side-Scan Sonar Dataset
Using various side-scan sonar instruments, including EdgeTech4200FS (EdgeTech, West Wareham, MA, USA), Benthos SIS-1624 (Teledyne Benthos, North Falmouth, MA, USA), Klein-3000 (Klein Associates, Inc., Salem, NH, USA), we constructed a submarine engineering structures dataset of side-scan sonar images. To enrich the dataset and add controls, we incorporated seabed surface images. The dataset, termed Marine-PULSE, was first introduced in our previous work [27], where it focused on the recognition of submarine pipelines (POC) while grouping the other three categories (underwater residual mound, seabed surface, and engineering platform) into a single class. In this study, we expanded upon the Marine-PULSE dataset by separating all four categories for individual recognition, providing a more granular approach to underwater engineering structure classification. The dataset comprises 323 pipeline or cable (POC), 134 underwater residual mound (URM), 88 seabed surface (SS), and 82 engineering platform legs (EP) images. PULSE signifies both the dataset’s image types and the ocean’s effective information detectable by side-scan sonar. All images were processed using PostSurvey (Version 4.0.7), a free data processing program by KNUDSEN Co., Ltd. (Perth, ON, Canada), with raw target object images captured without post-processing.
Figure 1 displays Marine-PULSE dataset samples, revealing morphological diversity among each object type imaged by side-scan sonar. The factors causing morphological diversity in SSS images include not only different detected objects but also factors such as the angle and distance of the side-scan sonar, the type of instrument, parameter settings, and sea conditions. Submarine pipelines or cables exhibit distinct linear features, as their diameter is difficult to discern accurately from SSS images. Underwater residual mounds were formed by erosion when the sediment strength exceeded the surrounding area. The seabed surface appears as a flat seafloor with slight banding due to vessel motion-induced distance changes. The engineering platform owns multiple piles, with acoustic signals impeded by the piles, causing a distinct absence of linear signals in band form.
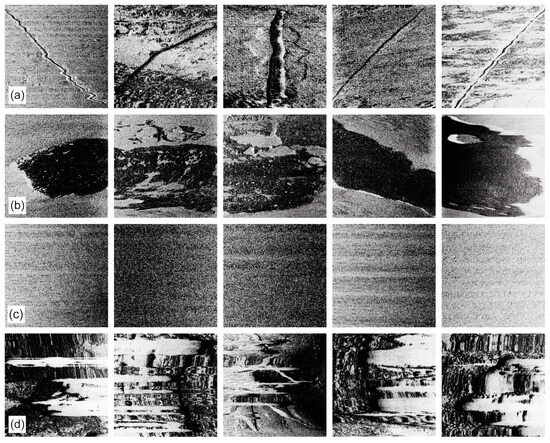
Figure 1.
Samples from the Marine-PULSE dataset [27]. Samples in particular rows are (a) pipeline or cable (POC), (b) underwater residual mound (URM), (c) seabed surface (SS), and (d) engineering platform legs (EP).
2.2. GoogleNet
GoogleNet, designed by Christian Szegedy et al. [28], is a well-known CNN model introducing the Inception architecture, which significantly improves both accuracy and computational efficiency. The Inception structure processes data through four parallel paths with different convolutional kernels (1 × 1, 3 × 3, 5 × 5, and 3 × 3 max pooling), extracting features at multiple scales while reducing computational complexity (Figure 2). The parallel structure enables the model to capture both fine-grained and broader contextual information from input data simultaneously, thus allowing for a richer feature representation. By combining multiple paths of convolutional kernels with various sizes, the model adapts better to varying input features and scales.
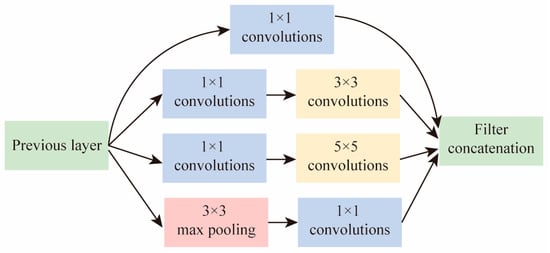
Figure 2.
Structure of Inception architecture [20].
One of the key innovations of GoogleNet is its use of 1 × 1 convolutions, which serve two primary functions: reducing dimensionality to lower the computational cost and enabling deeper layers with fewer parameters. This allows GoogleNet to achieve better accuracy with fewer parameters compared to earlier CNN models such as AlexNet. Specifically, while GoogleNet has 22 layers, it uses only 5 million parameters, which is a dramatic reduction compared to AlexNet’s 60 million parameters, making it much more computationally efficient. This advantage makes GoogleNet an ideal choice for large-scale image recognition tasks, such as those involving side-scan sonar images, where high-dimensional data are common.
The Inception architecture in GoogleNet is designed to mitigate the computational challenges of deeper networks by optimizing the architecture to process data in parallel and adapt to the different types of features within the images. As a result, it reduces overfitting and provides a robust framework for tackling various image recognition tasks, particularly when there is a need to extract multi-scale features from complex data such as underwater sonar images.
2.3. Transfer Learning
Transfer learning, introduced by Google Inc. [29], leverages prior learning from different domains to facilitate adaptation in new domains or tasks. In transfer learning, a model that has been trained on one dataset (e.g., ImageNet) is fine-tuned on a new problem domain. This approach allows the model to leverage prior learned features from a large, general-purpose dataset and adapt them to more specific tasks. The main benefit of transfer learning is that it reduces the need for extensive training data in the target domain, which is particularly beneficial when working with limited datasets, such as side-scan sonar images in marine engineering. By transferring knowledge from a pre-trained model, the model can start with better initial weights and converge faster, leading to improved performance and minimizing the need for substantial computational resources.
In the case of this study, we use a GoogleNet model pre-trained on the ImageNet dataset as our base model. ImageNet, which contains millions of labeled images from a wide range of categories, provides a rich set of general image features. These features are often applicable to tasks involving object detection, classification, and recognition, making ImageNet a valuable starting point for fine-tuning in specific domains, such as marine geophysics. We adjust the model’s structure based on the input and output dataset characteristics to ensure that the model can effectively classify side-scan sonar images of underwater engineering structures.
2.4. Experimental Procedure
We started by using a Google model pre-trained on the ImageNet dataset as our base, adjusting the model structure based on input and output dataset characteristics. Figure 3 shows the experimental workflow. We divided the data into train and test datasets with different ratios, creating datasets A and B. We performed six data expansions on dataset B’s train dataset, producing datasets B1 to B7. Both experiments followed the same modeling, training, and testing steps. Experiment A assessed the CNN model’s accuracy for side-scan sonar image identification, while experiment B evaluated the impact of data expansion methods on recognition accuracy. The experimental procedures encompassed data division, data expansion, data augmentation, CNN model construction, and accuracy evaluation. In this study, data expansion refers to increasing the number of original images before image training, while data augmentation during model training involves randomly varying the images while keeping the total number constant.
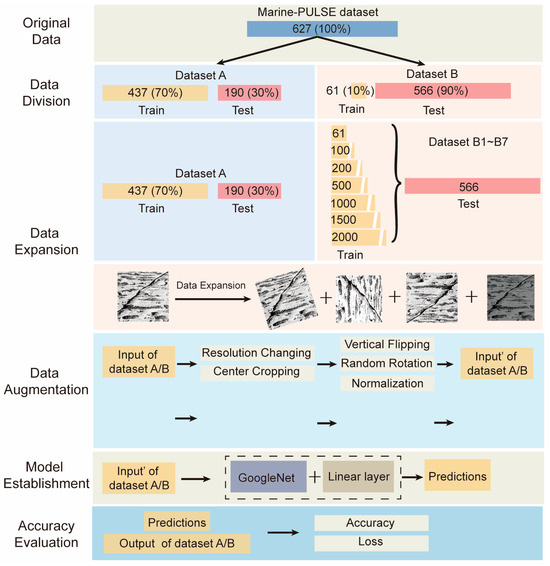
Figure 3.
Overview of experimental steps, including data division, data expansion, data augmentation, model establishment, and accuracy evaluation.
The Marine-PULSE dataset images were divided into two sets for experiments A and B. In experiment A, the dataset was split 70% (437 images) for training and 30% (190 images) for testing. For experiment B, aiming for a small train and large test sample size, the dataset was divided 10% (66 images) for training and 90% (571 images) for testing.
Data expansion increases train data by manipulating original data, such as image rotation, flipping, and resizing. For dataset B, we used random rotation (−45° to 45°), vertical and horizontal flipping, and contrast changes (0.5 to 1.5). This yielded training datasets with 66, 100, 200, 500, 1000, 1500, and 2000 images. The test dataset of dataset B was common for datasets B1 to B7.
Image augmentation first changes the image resolution to 256 × 256 and then uses center cropping to reduce it to 224 × 224. Subsequently, vertical flipping with a probability of 50% and random rotation within −50°~50° were set, and the image data were normalized. The above image enhancement operations can preserve sufficient information while satisfying the model’s training data resolution requirements. Moreover, the random flipping and rotation of the images can introduce variability in the training data for each epoch, increasing the richness of the dataset and reducing overfitting.
We adopted the GoogleNet model framework as the basis and added a fully connected layer at the end of the model to connect the original 1000-class output to the new network layer, resulting in a 4-class output corresponding to the four categories in the Marine-PULSE dataset. Furthermore, all initial parameters within the model were set to the model parameters obtained by GoogleNet trained on the ImageNet dataset.
2.5. Accuracy Evaluation and Experimental Environment
In this study, accuracy was chosen as the evaluation metric for model performance because all four object classes are positive values to predict, with no negative values. Accuracy reflects the likelihood of correctly predicting all classes of interest.
All the code for the calculation was implemented using Python (Version 3.10.10), specifically within the deep learning modeling package PyTorch (Version 2.0.0). The calculating device is a workstation with a CPU of Intel i5 9400f, 32G of RAM, and a graphics card of Nvidia RTX 3080.
3. Results and Discussion
3.1. Accuracy of CNN Model
For experiment A, our aim was to investigate the accuracy of the CNN model for the automatic recognition of side-scan sonar images. As observed in Figure 4a, the prediction accuracy of the train and test datasets increases rapidly with increasing epochs, while Figure 4b shows the corresponding loss decreasing steadily. The accuracy of the train is generally higher than that of the test dataset, and after 70 epochs, the accuracy tends to stabilize. The results show that the highest accuracy of the train dataset can reach 100%, and that of the test dataset can exceed 92%.
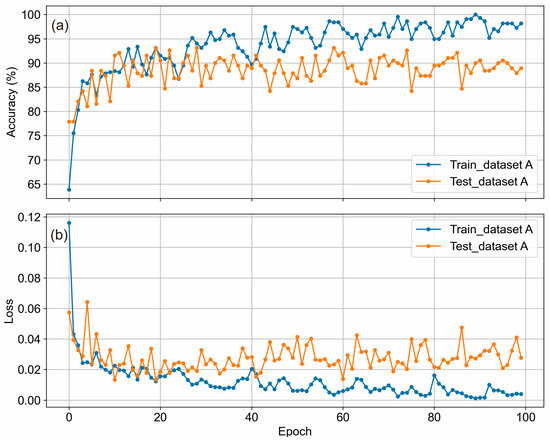
Figure 4.
Accuracy of the CNN model for the automatic recognition of side-scan sonar images. Figure (a,b) show the change in the train and test datasets’ accuracy and loss with increasing epochs, respectively.
The model achieved very high accuracy results in the train, with a prediction accuracy of 100% for all four object categories, as seen in Figure 5a. In the test dataset (Figure 5b), the model achieved an accuracy of 93.81% for pipelines or cables, 75.61% for underwater residual mounds, 93.6% for seabed surfaces, and 88% for engineering platform legs. Generally, the accuracy of model predictions is related to the number of training samples and the learning difficulty. When the learning difficulty is the same, the more training samples there are, the more features the model learns, and the higher the prediction accuracy. Conversely, when the number of training samples is the same, the greater the learning difficulty, the lower the prediction accuracy. The distribution of data volumes in train dataset A is POC (226), URM (93), SS (61), and EP (57). However, the final prediction accuracy does not rank according to the number of samples. This indicates that the learning difficulty of the four categories of objects in the dataset is significantly different.
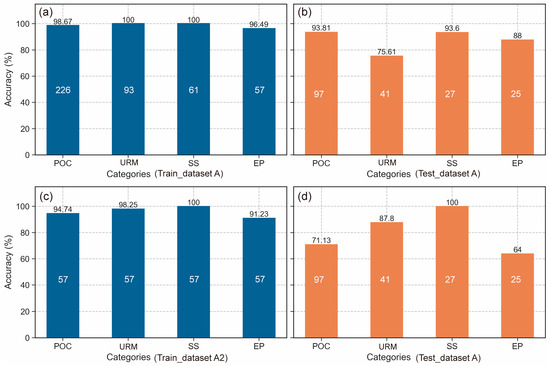
Figure 5.
Prediction accuracy of different side-scan sonar image categories. Figure (a,b) present the prediction accuracies of the four categories of SSS images trained with train dataset A. Figure (c,d) present the prediction accuracies of the four categories of SSS images trained with train dataset A2. The white font is the number of SSS pictures of a certain type.
To explore the learning difficulty of different underwater objects, we analyzed the results presented in Figure 5c,d, which depict the accuracy for models trained on dataset A2 with uniform sample sizes. As observed in Figure 5c,d, the accuracy ranking of both the train and test datasets is SS > URM > POC > EP. This suggests that the learning difficulty within the dataset should be ranked from hardest to easiest as EP > POC > URM > SS. Comparing the accuracy predictions of the test datasets in Figure 5c,d, we can see that the accuracy of POC has decreased significantly. This is likely due to the reduction in the number of training samples from 226 to 57, which in turn reduces the features that can be learned and subsequently lowers the accuracy. The accuracy of URM and SS has increased, indicating that a reduction in the number of one type of object can help the model learn more features from different object categories, whereas having a large discrepancy in the number of one type of object can affect the model’s prediction accuracy for other categories.
Additionally, the accuracy of EP has decreased, suggesting that the amount of POC contributes to the prediction accuracy of EP. This might be because the image features of POC and EP share similarities, thus resulting in a promoting effect between different categories. On the other hand, SS and URM have different image features from POC, which can lead to a weakening effect.
3.2. Affection of Data Expansion
In Experiment B, we expanded the original train dataset of 61 images for six times, resulting in seven datasets for training and prediction. We compared the prediction accuracy of seven models trained on the seven datasets using the same test dataset. As observed in Figure 6, the initial accuracy of models B1 to B3 is still below 60%, and it increased rapidly with the increase in training epochs, gradually stabilizing, while the initial accuracy of models B4 to B7 exceeded 70%, with B7 even approaching 90%. The accuracy of model B1 was lower than that of other models throughout the process. On the other hand, the accuracy of models B3 to B7 alternated on different epochs, showing some differences, but not significant ones. These results indicated that data expansion has an impact on the model’s prediction accuracy, and when the data are expanded to a large quantity, the initial accuracy of the model is higher than before the expansion. However, the expanded data quantity is not directly proportional to the accuracy, and when the quantity reaches a certain degree, the accuracy tends to stabilize.
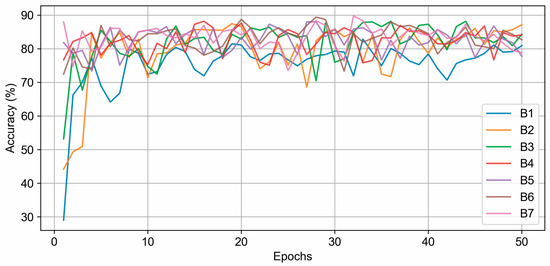
Figure 6.
The accuracy of seven different models on the test set varies with the number of epochs.
To further compare the prediction accuracy of different models, we analyzed the prediction accuracy of the last 40 epochs of the 50-epoch training using different models, aiming to reduce the influence of the initial unstable period of the models. Figure 7 provides a detailed statistical comparison of the models, showing the distribution of accuracy values across datasets B1 to B7. The box plots highlight the improvement in accuracy as the dataset size increases, with B7 achieving the highest average, median, and maximum accuracies. The maximum accuracy trend (indicated by the line plot) shows significant improvement from B1 to B2, a steady rise from B3 to B5, and a plateau at B6 and B7. These results demonstrate that while data expansion methods improve model performance, the benefits diminish as the dataset size increases beyond a certain threshold.
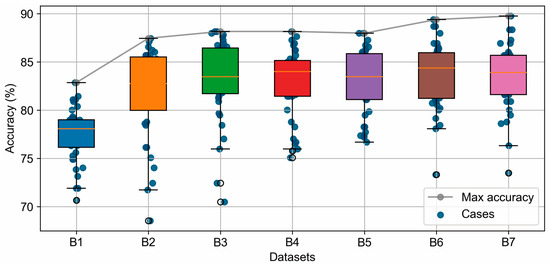
Figure 7.
Statistical results of the prediction accuracy of the seven different models on the last 40 epochs.
The results demonstrate that our approach achieves the high-precision classification of underwater engineering structures in side-scan sonar images, leveraging supervised deep learning and data expansion techniques to enhance model performance under limited data conditions. Existing studies on SSS image recognition can be broadly categorized into traditional machine learning, deep learning-based object detection, and data augmentation techniques. Traditional machine learning approaches, such as support vector machines (SVM) and random forests (RF), rely on handcrafted features but often struggle with generalization across varying sonar imaging conditions [3]. In contrast, deep learning-based methods, including CNNs [20], YOLO-based detectors [11], and segmentation models like ECNet [21], have demonstrated superior performance in sonar image classification, but most of these studies have focused on generalized underwater target detection rather than the fine-grained classification of engineering structures. While GAN-based approaches have been used for sonar image synthesis to address data scarcity [19], their applicability remains constrained by the quality of generated data. Similarly, recent advancements in domain adaptation and unsupervised learning have attempted to mitigate data scarcity issues [26], but they typically suffer from lower classification accuracy due to the lack of labeled data. Unlike these methods, our study integrates a supervised deep learning framework with data expansion, ensuring higher accuracy in complex seabed environments without introducing synthetic data biases. Furthermore, the Marine-PULSE dataset enhances model generalization by providing a fine-grained categorization of four distinct underwater engineering structures, which has not been addressed in previous works.
Although the data augmentation method is widely used in the process of CNN modeling to perform random transformations on the data during training, the number of training images used in each training iteration remains constant. By using data expansion, we increase the absolute amount of original data, ensuring that the model learns more data features at once during the training process and recognizes potential information in the original images. The experimental results confirm that data expansion is particularly effective in small-sample scenarios, providing significant improvements in initial accuracy and model stability during training.
4. Future Perspectives
Difficulties in data acquisition and limited data volume remain the main limiting factors for the application of deep learning in marine geology. Therefore, in the case of limited data, the key is to maximize the effectiveness of the model. By strategically combining various techniques—such as advanced data augmentation, multi-modal data integration, collaborative data-sharing, domain adaptation, and model interpretability—researchers can more effectively address these challenges and strengthen deep learning applications in marine geology.
Building on our findings, the use of more advanced data augmentation methods—especially synthetic data generation via generative adversarial networks (GANs)—may tackle data scarcity while improving model robustness. Unsupervised or self-supervised learning approaches can further alleviate the demand for large annotated datasets by extracting meaningful features from unlabeled SSS imagery. In addition, integrating multi-modal datasets, such as combining SSS data with bathymetric and geological survey data, could provide complementary information and thereby boost prediction accuracy.
Moreover, collaborative data-sharing platforms and open-source initiatives can help expand accessible training samples, encourage broader benchmarking, and foster the development of standardized protocols for evaluation. Coupling these strategies with domain adaptation can render models more transferable and robust when applied to different marine environments or sensor configurations. In parallel, increasing the amount of data through augmentation prior to model training has consistently demonstrated improvements in prediction accuracy, particularly when tailored to specific research questions and informed by data quality and quantity.
With regard to category distribution, we observed that image categories featuring similar characteristics could enhance each other’s prediction accuracy, whereas data with distinct image features might exert an inhibitory influence. A more quantitative examination of the interplay between dataset composition (e.g., class balance and feature diversity) and model architecture could yield practical guidelines for assembling effective training sets. The further exploration of transfer learning and fine-tuning, using domain-specific datasets, could also enhance generalizability where the data volume is limited.
Finally, model interpretability and explainability should remain a priority. This ensures transparency and scientific validity in prediction outputs, which is particularly important in high-stakes domains such as marine geological surveys. By enhancing explainability, researchers and end-users can more easily verify model outputs and develop greater trust in automated solutions, ultimately facilitating the deeper integration of deep learning into marine geology workflows.
5. Conclusions
In this study, we used a SSS dataset named Marine-PULSE for deep learning training and conducted research on the accuracy of deep learning in the automatic recognition of SSS images and whether data expansion improves the accuracy of the model. The main conclusions are as follows:
- (1)
- Deep learning methods can accurately recognize SSS images of underwater engineering structures, with a train dataset accuracy of up to 100% and a test dataset accuracy of over 92%;
- (2)
- The difficulty of recognizing different categories of underwater objects varies, and the model’s prediction accuracy is lower for objects with higher recognition difficulty. The recognition difficulty order in this dataset is EP > POC > URM > SS, and it is necessary to consciously provide more data with higher recognition difficulty during dataset construction;
- (3)
- The phenomenon of mutual influence exists between different categories of data. When the amount of POC data is significantly larger than that of the other three types of objects, it has an inhibitory effect on the predictions for URM and SS, which have different image features, and a promoting effect on the predictions for EP, which has similar image features. Based on the image features of the objects to be predicted, a rational selection of data types and quantities within the dataset plays a crucial role in the model’s prediction performance.
- (4)
- Data expansion methods can effectively improve the accuracy of small-sample deep learning model predictions (over 7% in Experiment B), but as the amount of data increases, the improvement in accuracy gradually tends to stabilize. Therefore, future dataset construction should carefully consider the balance between data volume, feature diversity, and training objectives, ensuring the effective utilization of resources.
Author Contributions
Conceptualization, X.D. and D.W.; methodology, X.D.; software, X.D.; validation, Y.S. (Yongfu Sun) and D.W.; formal analysis, L.D.; investigation, X.D.; resources, X.D. and Y.S. (Yupeng Song); data curation, X.D., L.D. and C.T.; writing—original draft preparation, X.D.; writing—review and editing, X.D. and D.W.; visualization, X.D.; supervision, D.W.; project administration, D.W.; funding acquisition, X.D. All authors have read and agreed to the published version of the manuscript.
Funding
This research was funded by the Foundation item: The National Natural Science Foundation of China under contract No. 42102326; the Basic Scientific Fund for National Public Research Institutes of China under contract No. 2022Q05; and The Shandong Provincial Natural Science Foundation, China under contract No. ZR2020QD073.
Institutional Review Board Statement
Not applicable.
Informed Consent Statement
Not applicable.
Data Availability Statement
The dataset (the Marine-PULSE dataset, 11 May 2023) used in this study is available and can be accessed from https://doi.org/10.5281/zenodo.7922705.
Conflicts of Interest
The authors declare no conflicts of interest.
References
- Johnson, H.P. The Geological Interpretation of Side-Scan Sonar. Rev. Geophys. 1990, 28, 357–380. [Google Scholar] [CrossRef]
- Yu, Y.; Zhao, J.; Gong, Q.; Huang, C.; Zheng, G.; Ma, J. Real-Time Underwater Maritime Object Detection in Side-Scan Sonar Images Based on Transformer-YOLOv5. Remote Sens. 2021, 13, 3555. [Google Scholar] [CrossRef]
- Song, Y.; He, B.; Liu, P.; Yan, T. Side Scan Sonar Image Segmentation and Synthesis Based on Extreme Learning Machine. Appl. Acoust. 2019, 146, 56–65. [Google Scholar] [CrossRef]
- Sivachandra, K.; Kumudham, R. A Review: Object Detection and Classification Using Side Scan Sonar Images via Deep Learning Techniques. In Modern Approaches in Machine Learning and Cognitive Science: A Walkthrough; Gunjan, V.K., Zurada, J.M., Singh, N., Eds.; Springer International Publishing: Cham, Switzerland, 2024; Volume 4, pp. 229–249. ISBN 978-3-031-43009-1. [Google Scholar]
- Swarnkar, S.K.; Guru, A.; Chhabra, G.S.; Tamrakar, P.K.; Janghel, B.; Sinha, U. Deep Learning Techniques for Medical Image Segmentation & Classification. Int. J. Health Sci. 2022, 6, 408–421. [Google Scholar]
- Reshi, A.A.; Rustam, F.; Mehmood, A.; Alhossan, A.; Alrabiah, Z.; Ahmad, A.; Alsuwailem, H.; Choi, G.S. An Efficient CNN Model for COVID-19 Disease Detection Based on X-Ray Image Classification. Complexity 2021, 2021, 6621607. [Google Scholar] [CrossRef]
- Tang, H.; Liu, X.; Sun, S.; Yan, X.; Xie, X. Recurrent Mask Refinement for Few-Shot Medical Image Segmentation. In Proceedings of the 2021 IEEE/CVF International Conference on Computer Vision (ICCV), Montreal, QC, Canada, 11–17 October 2021; IEEE: Montreal, QC, Canada, 2021; pp. 3898–3908. [Google Scholar]
- Sitaula, C.; Hossain, M.B. Attention-Based VGG-16 Model for COVID-19 Chest X-Ray Image Classification. Appl. Intell. 2021, 51, 2850–2863. [Google Scholar] [CrossRef] [PubMed]
- Bazi, Y.; Bashmal, L.; Rahhal, M.M.A.; Dayil, R.A.; Ajlan, N.A. Vision Transformers for Remote Sensing Image Classification. Remote Sens. 2021, 13, 516. [Google Scholar] [CrossRef]
- Guo, W.; Yang, W.; Zhang, H.; Hua, G. Geospatial Object Detection in High Resolution Satellite Images Based on Multi-Scale Convolutional Neural Network. Remote Sens. 2018, 10, 131. [Google Scholar] [CrossRef]
- Yang, N.; Li, G.; Wang, S.; Wei, Z.; Ren, H.; Zhang, X.; Pei, Y. SS-YOLO: A Lightweight Deep Learning Model Focused on Side-Scan Sonar Target Detection. J. Mar. Sci. Eng. 2025, 13, 66. [Google Scholar] [CrossRef]
- Chandrashekar, G.; Raaza, A.; Rajendran, V.; Ravikumar, D. Side Scan Sonar Image Augmentation for Sediment Classification Using Deep Learning Based Transfer Learning Approach. Mater. Today Proc. 2023, 80, 3263–3273. [Google Scholar] [CrossRef]
- Ge, Q.; Ruan, F.; Qiao, B.; Zhang, Q.; Zuo, X.; Dang, L. Side-Scan Sonar Image Classification Based on Style Transfer and Pre-Trained Convolutional Neural Networks. Electronics 2021, 10, 1823. [Google Scholar] [CrossRef]
- Huo, G.; Wu, Z.; Li, J. Underwater Object Classification in Sidescan Sonar Images Using Deep Transfer Learning and Semisynthetic Training Data. IEEE Access 2020, 8, 47407–47418. [Google Scholar] [CrossRef]
- Jin, L.; Liang, H.; Yang, C. Accurate Underwater ATR in Forward-Looking Sonar Imagery Using Deep Convolutional Neural Networks. IEEE Access 2019, 7, 125522–125531. [Google Scholar] [CrossRef]
- Ochal, M.; Vazquez, J.; Petillot, Y.; Wang, S. A Comparison of Few-Shot Learning Methods for Underwater Optical and Sonar Image Classification. In Proceedings of the Global Oceans 2020: Singapore—U.S. Gulf Coast, Biloxi, MI, USA, 5–30 October 2020; pp. 1–10. [Google Scholar]
- Kamal Basha, S.; Nambiar, A. S3Simulator: A Benchmarking Side Scan Sonar Simulator Dataset for Underwater Image Analysis. In Proceedings of the Pattern Recognition, Nashville, TN, USA, 11–15 June 2025; Antonacopoulos, A., Chaudhuri, S., Chellappa, R., Liu, C.-L., Bhattacharya, S., Pal, U., Eds.; Springer Nature Switzerland: Cham, Switzerland, 2025; pp. 219–235. [Google Scholar]
- Sung, M.; Kim, J.; Lee, M.; Kim, B.; Kim, T.; Kim, J.; Yu, S.-C. Realistic Sonar Image Simulation Using Deep Learning for Underwater Object Detection. Int. J. Control Autom. Syst. 2020, 18, 523–534. [Google Scholar] [CrossRef]
- Li, L.; Li, Y.; Wang, H.; Yue, C.; Gao, P.; Wang, Y.; Feng, X. Side-Scan Sonar Image Generation Under Zero and Few Samples for Underwater Target Detection. Remote Sens. 2024, 16, 4134. [Google Scholar] [CrossRef]
- Du, X.; Sun, Y.; Song, Y.; Sun, H.; Yang, L. A Comparative Study of Different CNN Models and Transfer Learning Effect for Underwater Object Classification in Side-Scan Sonar Images. Remote Sens. 2023, 15, 593. [Google Scholar] [CrossRef]
- Wu, M.; Wang, Q.; Rigall, E.; Li, K.; Zhu, W.; He, B.; Yan, T. ECNet: Efficient Convolutional Networks for Side Scan Sonar Image Segmentation. Sensors 2019, 19, 2009. [Google Scholar] [CrossRef] [PubMed]
- Kong, W.; Hong, J.; Jia, M.; Yao, J.; Cong, W.; Hu, H.; Zhang, H. YOLOv3-DPFIN: A Dual-Path Feature Fusion Neural Network for Robust Real-Time Sonar Target Detection. IEEE Sens. J. 2020, 20, 3745–3756. [Google Scholar] [CrossRef]
- Dong, Z.; An, S.; Zhang, J.; Yu, J.; Li, J.; Xu, D. L-Unet: A Landslide Extraction Model Using Multi-Scale Feature Fusion and Attention Mechanism. Remote Sens. 2022, 14, 2552. [Google Scholar] [CrossRef]
- Zhu, B.; Wang, X.; Chu, Z.; Yang, Y.; Shi, J. Active Learning for Recognition of Shipwreck Target in Side-Scan Sonar Image. Remote Sens. 2019, 11, 243. [Google Scholar] [CrossRef]
- Yulin, T.; Jin, S.; Bian, G.; Zhang, Y. Shipwreck Target Recognition in Side-Scan Sonar Images by Improved YOLOv3 Model Based on Transfer Learning. IEEE Access 2020, 8, 173450–173460. [Google Scholar] [CrossRef]
- Wei, C.; Bai, Y.; Liu, C.; Zhu, Y.; Wang, C.; Li, X. Unsupervised Underwater Shipwreck Detection in Side-Scan Sonar Images Based on Domain-Adaptive Techniques. Sci. Rep. 2024, 14, 12687. [Google Scholar] [CrossRef] [PubMed]
- Du, X.; Sun, Y.; Song, Y.; Dong, L.; Zhao, X. Revealing the Potential of Deep Learning for Detecting Submarine Pipelines in Side-Scan Sonar Images: An Investigation of Pre-Training Datasets. Remote Sens. 2023, 15, 4873. [Google Scholar] [CrossRef]
- Szegedy, C.; Liu, W.; Jia, Y.; Sermanet, P.; Reed, S.; Anguelov, D.; Erhan, D.; Vanhoucke, V.; Rabinovich, A. Going Deeper with Convolutions. In Proceedings of the 2015 IEEE Conference on Computer Vision and Pattern Recognition (CVPR), Boston, MA, USA, 7–12 June 2015; IEEE: Boston, MA, USA, 2015; pp. 1–9. [Google Scholar]
- Bousmalis, K.; Trigeorgis, G.; Silberman, N.; Krishnan, D.; Erhan, D. Domain Separation Networks. In Proceedings of the Advances in Neural Information Processing Systems, Barcelona, Spain, 5–10 December 2016; Curran Associates, Inc.: New York, NY, USA, 2016; Volume 29. [Google Scholar]
Disclaimer/Publisher’s Note: The statements, opinions and data contained in all publications are solely those of the individual author(s) and contributor(s) and not of MDPI and/or the editor(s). MDPI and/or the editor(s) disclaim responsibility for any injury to people or property resulting from any ideas, methods, instructions or products referred to in the content. |
© 2025 by the authors. Licensee MDPI, Basel, Switzerland. This article is an open access article distributed under the terms and conditions of the Creative Commons Attribution (CC BY) license (https://creativecommons.org/licenses/by/4.0/).