Article

Analysis of the Main Influencing Factors of Marine Environment on the Nuclear Pressure Vessel of Floating Nuclear Power Plants

1
College of Shipbuilding Engineering, Harbin Engineering University, Harbin 150001, China
2
Yantai Research Institute, Harbin Engineering University, Yantai 264000, China
3
College of Power and Energy Engineering, Harbin Engineering University, Harbin 150001, China
*
Author to whom correspondence should be addressed.
J. Mar. Sci. Eng. 2025, 13(4), 795; https://doi.org/10.3390/jmse13040795
Submission received: 14 March 2025 / Revised: 11 April 2025 / Accepted: 14 April 2025 / Published: 16 April 2025
(This article belongs to the Special Issue Wave Loads on Offshore Structure)

Abstract

:
Nuclear energy inherently possesses both immense utility and significant risks. To ensure global safety, designers of floating nuclear power plants (FNPPs) must thoroughly consider the influence of the marine environment on the reactor pressure vessel (RPV). Wave loads act on the hull of an FNPP, causing structural deformation, which is subsequently transferred to the RPV. Additionally, wave-induced forces generate six degrees of freedom (6-DOF) motion in the hull, resulting in inertial loads. Consequently, the RPV is subjected to both deformation loads transmitted from the hull and inertial loads associated with the 6-DOF motion. To accurately account for the effects of the marine environment while minimizing the computational cost of RPV fatigue analysis, it is essential to identify the primary influencing factors. This study determined that the predominant factors affecting RPV fatigue in an FNPP were the hull’s pitch, roll, and yaw motions. In mechanical analyses of the RPV, including ultimate strength and fatigue assessments, only rotational inertial loads need to be considered, while the influence of translational inertial loads and hull deformation can be neglected.

1. Introduction

With the continuous optimization of the global energy structure and the ongoing promotion of green and low-carbon development strategies, traditional fossil fuels, along with renewable energy sources such as wind, wave, and solar power, are increasingly exhibiting limitations in meeting the growing energy demand. As a clean, efficient, and highly flexible offshore power generation technology, the floating nuclear power plant (FNPP) has garnered widespread attention from governments worldwide. Compared with conventional power generation methods, FNPPs offer advantages such as environmental friendliness, cost-effectiveness, and reduced susceptibility to weather conditions, making them particularly suitable for remote offshore areas, offshore resource development, and polar scientific research. The realization of FNPPs relies on the integration of mobile small-scale nuclear reactor technology with ship and offshore engineering to construct mobile floating marine platforms equipped with nuclear reactors and power generation systems.
The concept of FNPPs was first proposed by the United States, which subsequently converted the Liberty Ship Charles H. Cugle into the world’s first FNPP, the Sturgis, to supply power to military bases in the Panama Canal region [1]. Russia has since made significant advancements in this field, with its first floating nuclear power plant, the Akademik Lomonosov, completing reactor installation in 2013 and commencing commercial operations in May 2020. This facility provides energy for the Far East and Siberian regions while also supporting electricity demands for Arctic gas extraction. The power plant is equipped with two KLT-40S reactors, each with a rated electrical output of 35 MW [2]. Russia continues to develop nuclear reactors for icebreakers and FNPPs, including the RITM-200M, ABVD, SVBR, and VBER series, covering power ranges from 8 MW to 300 MW [3].
Apart from Russia, countries such as France, South Korea, and the United States have proposed their own FNPP concepts but have yet to implement them on a large scale. Since 2005, China has actively pursued FNPP development, accelerating research on small floating nuclear power plants. The China National Nuclear Corporation (CNNC) has developed two FNPP models, ACP100S and ACP25S, which can be deployed in single- or dual-reactor configurations to achieve power outputs ranging from 25 MW to 250 MW. Meanwhile, the China General Nuclear Power Corporation (CGN) has independently developed the ACPR50S floating nuclear power plant, featuring a thermal power output of 200 MW and an electrical power output of approximately 60 MW, currently under experimental reactor construction [3]. Additionally, the China Shipbuilding Industry Corporation’s 719 Research Institute has proposed the HHP25 offshore nuclear power platform, with a thermal power output of 100 MW and an electrical power output of 25 MW, which has completed preliminary design [4].
As a typical marine and offshore engineering structure, FNPPs operate in highly stochastic oceanic environments and must withstand complex cyclic loads, including wind, wave, and current forces. These loads subject the structure to millions of stress cycles, leading to significant fatigue damage. Extensive research indicates that fatigue failure is one of the primary failure modes of marine and offshore structures [5,6]. Reports from the International Maritime Organization (IMO) have highlighted that certain maritime engineering failures may be initiated by cracks in side-shell structures [7].
In FNPPs, the reactor pressure vessel (RPV) and associated pressure-bearing components (e.g., pressure pipelines) are critical components of the nuclear island [8,9]. The RPV encloses the radioactive core, internal structures, and heat transfer medium, operating under high temperature, high pressure, fluid erosion, and neutron irradiation for prolonged periods [10,11]. Moreover, dynamic variations in temperature and pressure induce cyclic stresses that exacerbate fatigue damage. The RPV and pressure pipelines in FNPPs are enclosed within a steel containment vessel and are structurally supported by both lower and upper supports connected to the hull. In the marine environment, these pressure-bearing components must withstand not only high temperature, high pressure, fluid erosion, and neutron irradiation but also the combined effects of wave, wind, and current loads. Compared with single-load conditions, coupled loads induce greater hot spot stress ranges, significantly reducing the RPV’s fatigue life. Due to differences in the frequency and amplitude of random loads, along with potential high correlation between them, assessing fatigue damage becomes increasingly complex.
Fatigue analysis methods for ship structures and RPVs belong to two distinct engineering disciplines [12,13,14], presenting significant methodological differences and making fatigue analysis of FNPP pressure-bearing components particularly challenging. To address this issue, Ma proposed a method that converts structural stress spectra induced by wave loads into stress-time histories, which are then superimposed with thermal-pressure stress histories, thereby reducing finite element computation costs and enhancing the efficiency of multi-load coupling analysis [15]. Yuan employed the equivalent design wave method, converting long-term sea states into equivalent regular wave conditions while simultaneously applying both regular wave loads and thermal-pressure loads to analyze structural fatigue behavior, further considering different initial phase combinations [16]. Shen comprehensively accounted for the interactions among multiple loads and proposed a damage combination formula for thermal-pressure conditions and wave conditions, simplifying FNPP fatigue analysis procedures [17].
In RPV structural ultimate strength assessments, the influence of the marine environment on stress distribution must also be considered. Ship structural strength is typically evaluated using either rule-based analysis or direct strength analysis, where wave load design values can be obtained through regulatory calculations [12,18] or the equivalent design wave method [19]. Additionally, wave loads acting on the hull can be identified through structural response monitoring data, and structural health monitoring technologies can be employed to detect environmental loads in real time, thereby enhancing the operational safety of FNPP structures.
Based on this background, this study investigates the structural response of RPVs in marine environments, analyzing the impact of various dynamic loads on RPV fatigue and structural strength. The primary objectives of this research include the following:
  • Utilizing spectral analysis methods to examine the influence of marine environmental loads (such as hull deformation and six-degree-of-freedom inertial forces) on RPV fatigue damage and identifying the dominant damage factors.
  • Applying the equivalent design wave method to analyze the stress distribution of RPVs under extreme sea conditions and identifying key stress factors.
  • Proposing optimization strategies for FNPP operation to mitigate RPV fatigue damage and enhance structural safety based on the analytical results.

2. Marine Environment and Structural Model

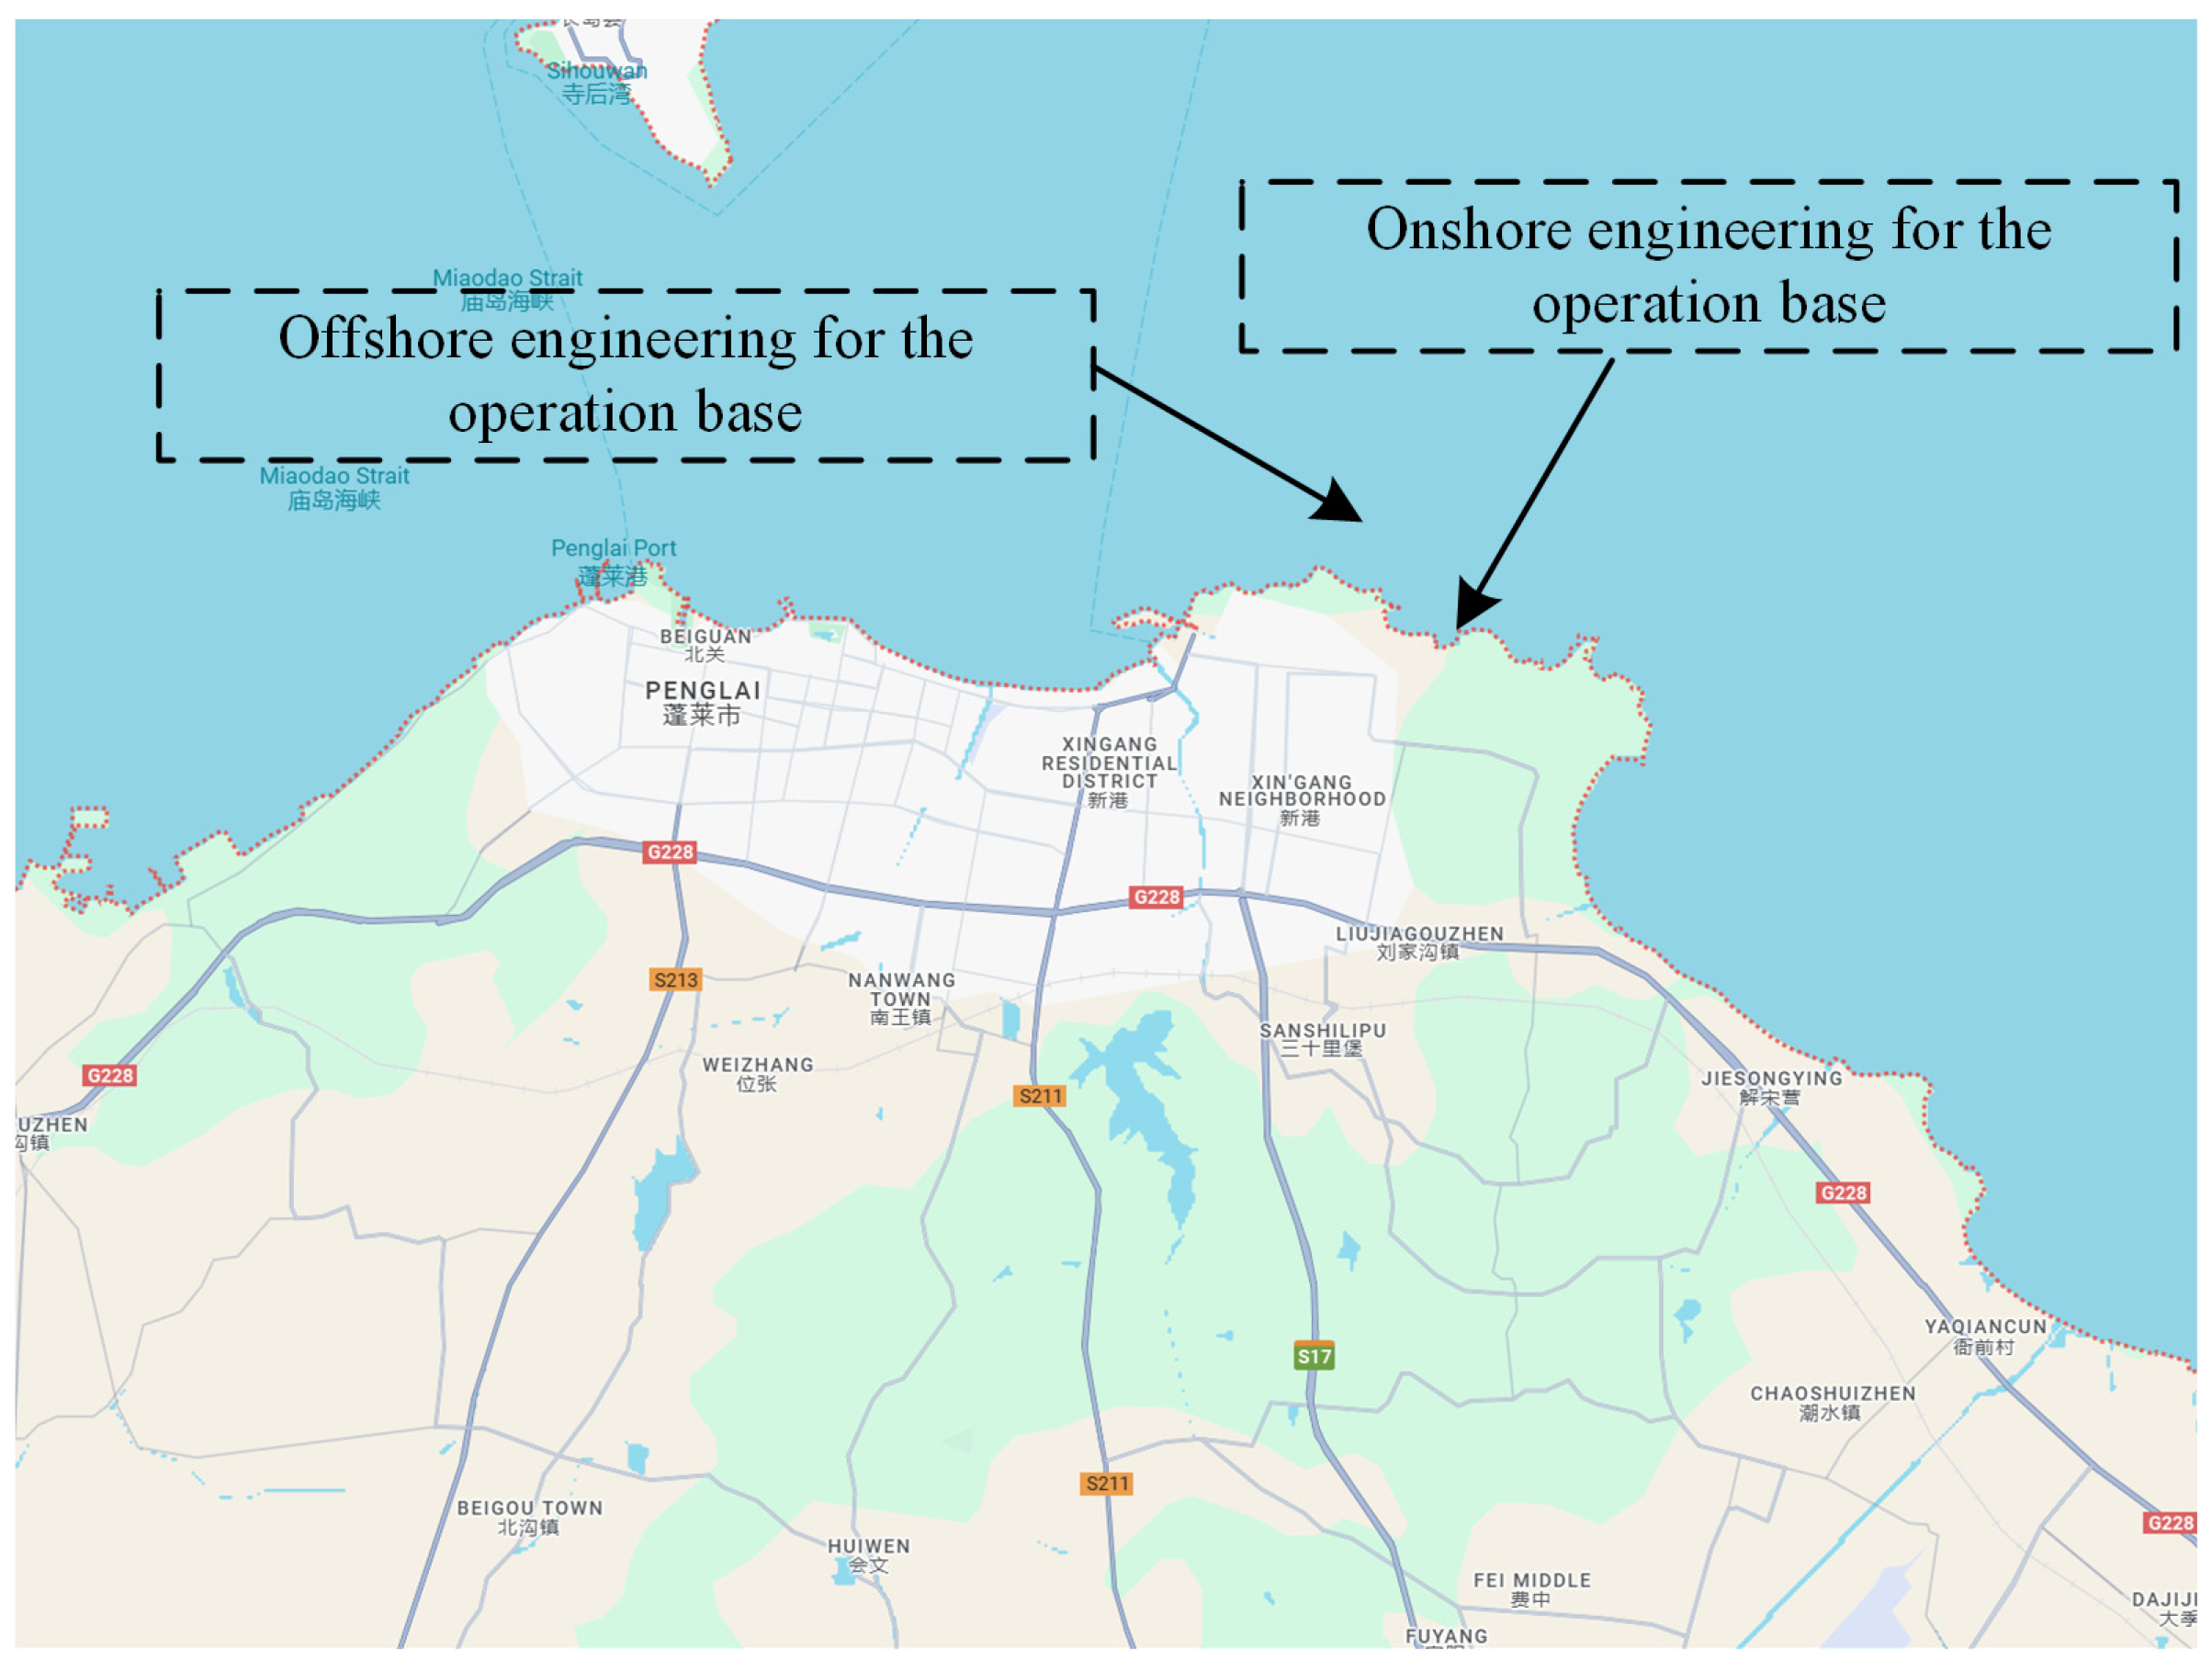
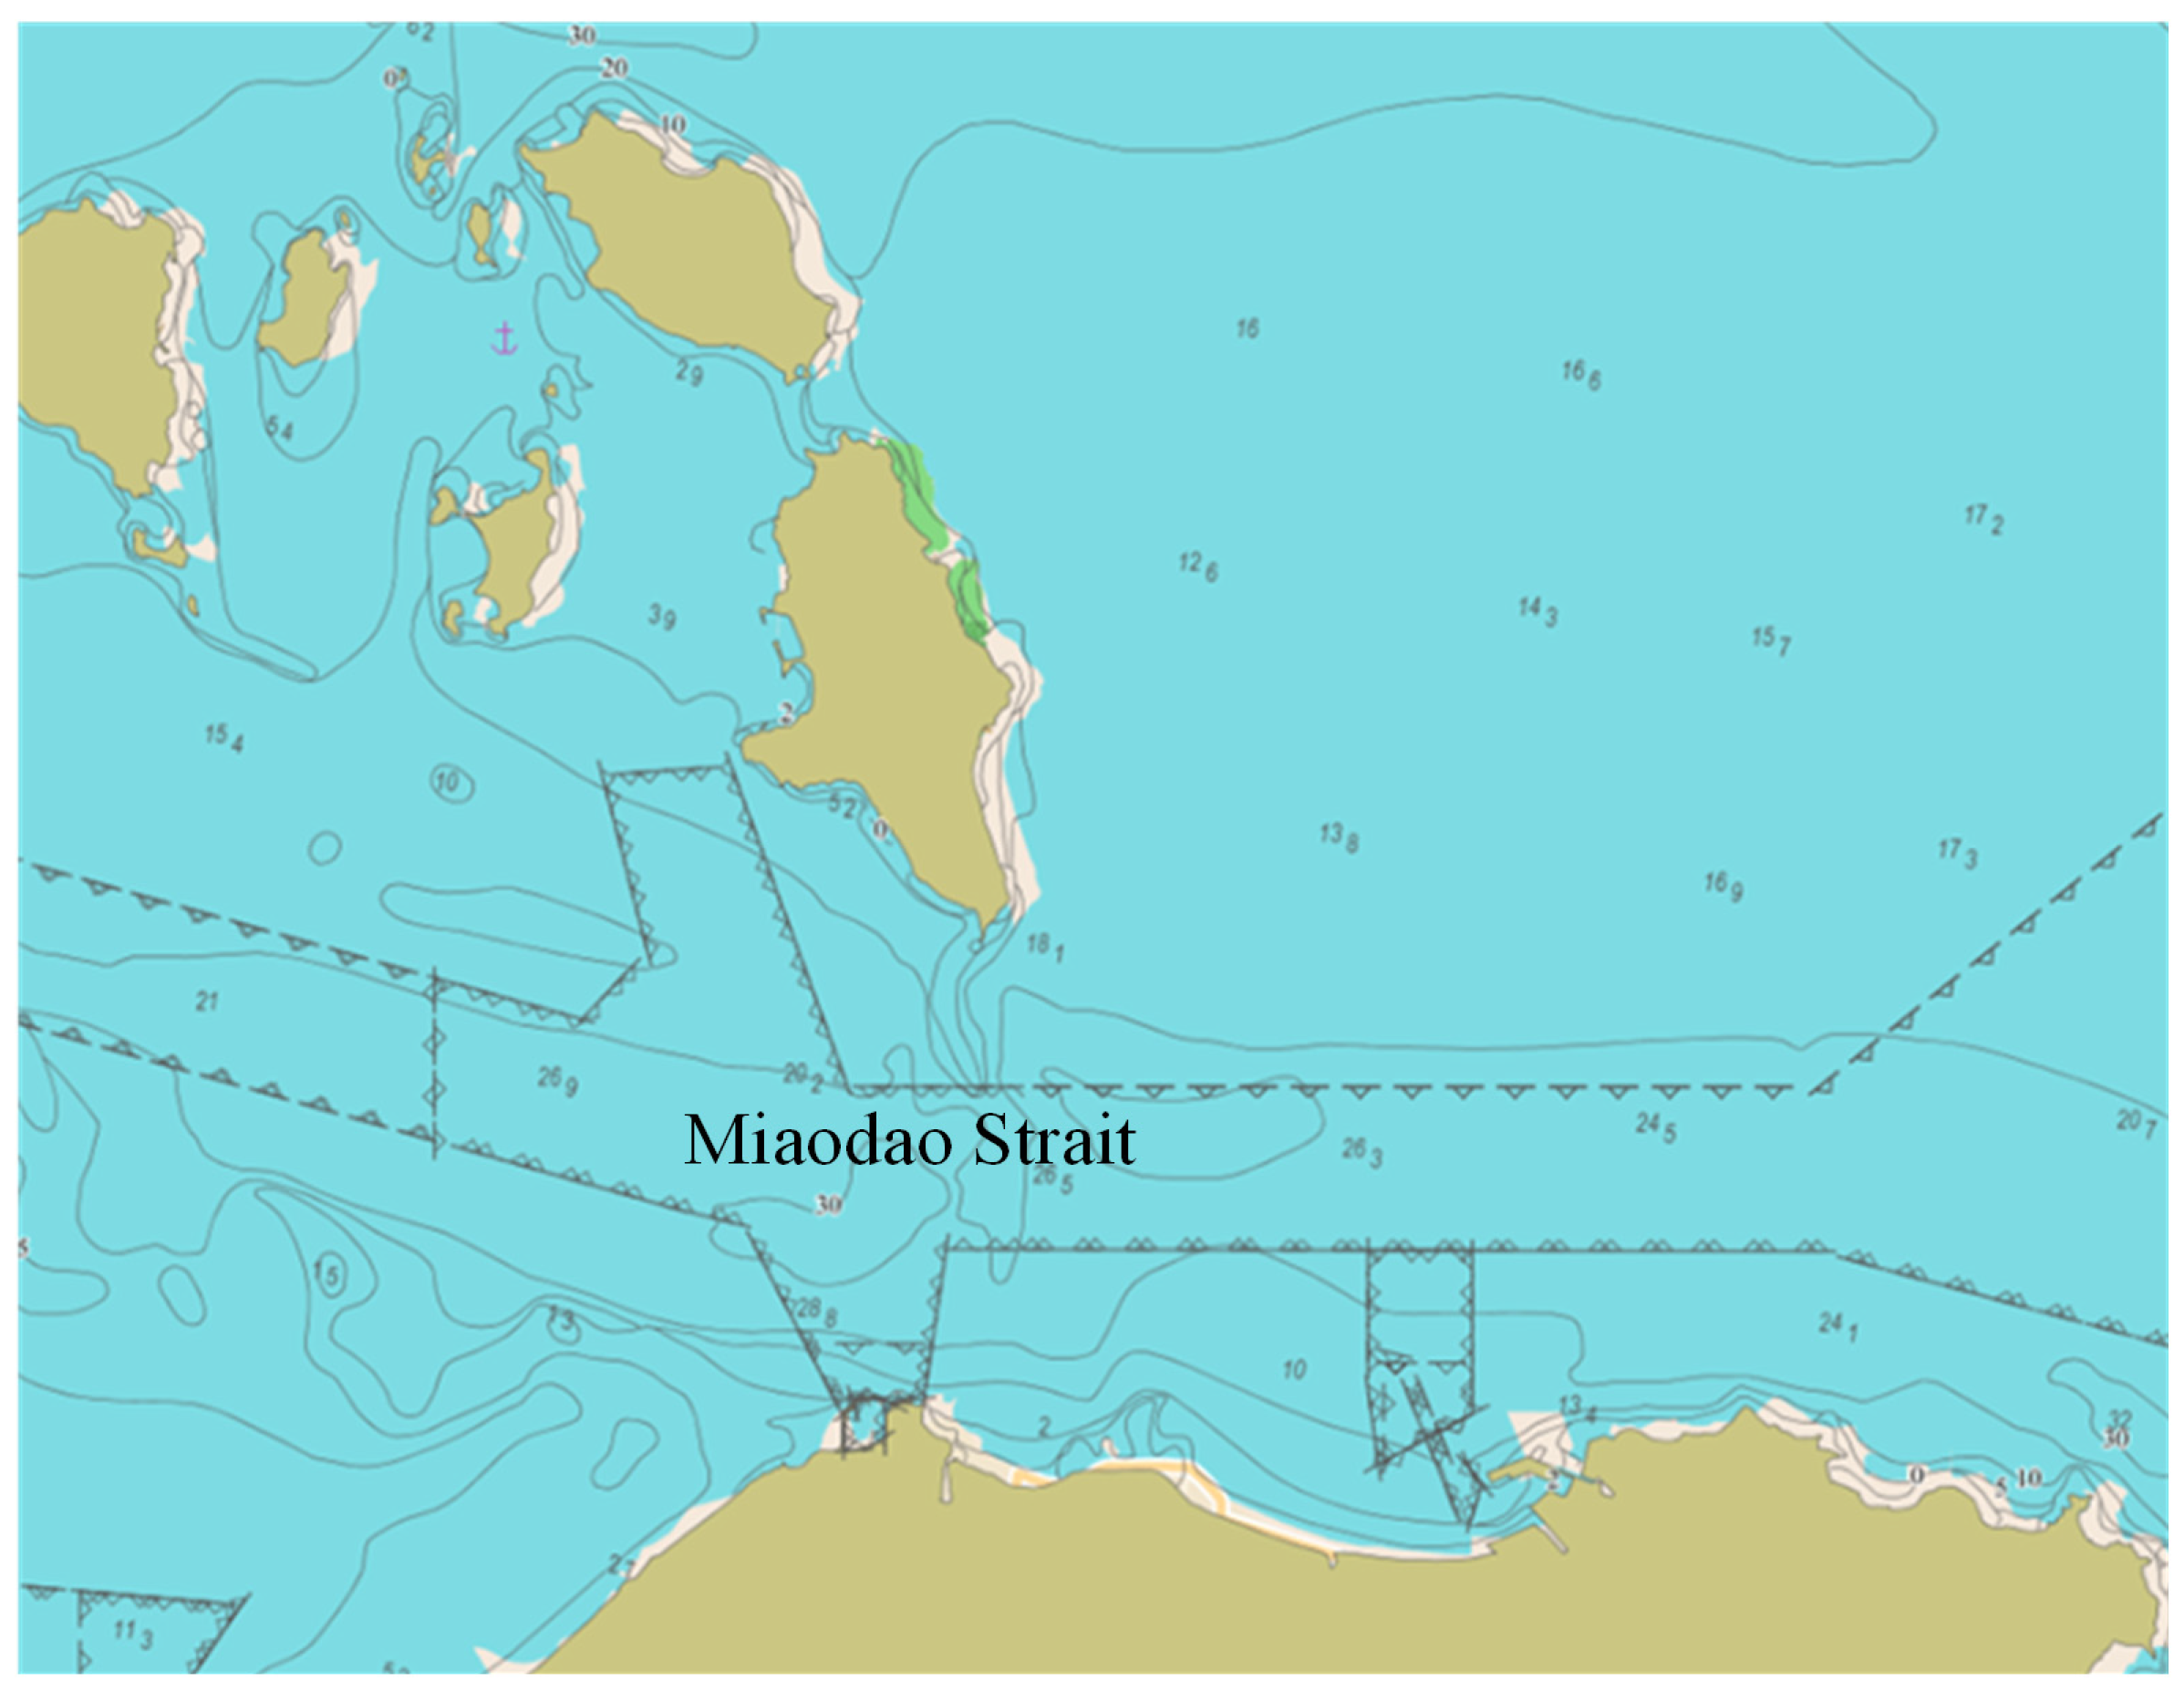
2.1. Operational Waters and Sea State Parameters

The FNPP examined in this study is planned to operate near Bayzikou Village, Xingang Subdistrict, Penglai City, Shandong Province. The offshore facility is located approximately 3.35 km from the onshore facility, bordering the Bohai Sea to the north. The specific location is shown in Figure 1 and Figure 2.
The operational site is situated in the Miaodao Strait, a shallow nearshore channel predominantly influenced by waves and tidal currents. The geomorphological units of the Miaodao Strait include submarine erosion trenches, a central uplift, and southern and northern shallow zones, with seabed sediments consisting of rock fragments, gravel, sand, silt, and soft mud in sequence. The regional topography is illustrated in Figure 3.
To characterize the wave conditions within the FNPP’s operational area, this study adopted wave scatter diagrams from the Yellow and Bohai Seas [15]. Using extreme value analysis methods [20], the wave parameters near the operational site were statistically analyzed, yielding the extreme maximum wave height (Hmax), significant wave height (Hs), mean zero-crossing period (Tz), and mean up-crossing period (Ts) for return periods of 1, 10, 50, 100, and 500 years, as summarized in Table 1.

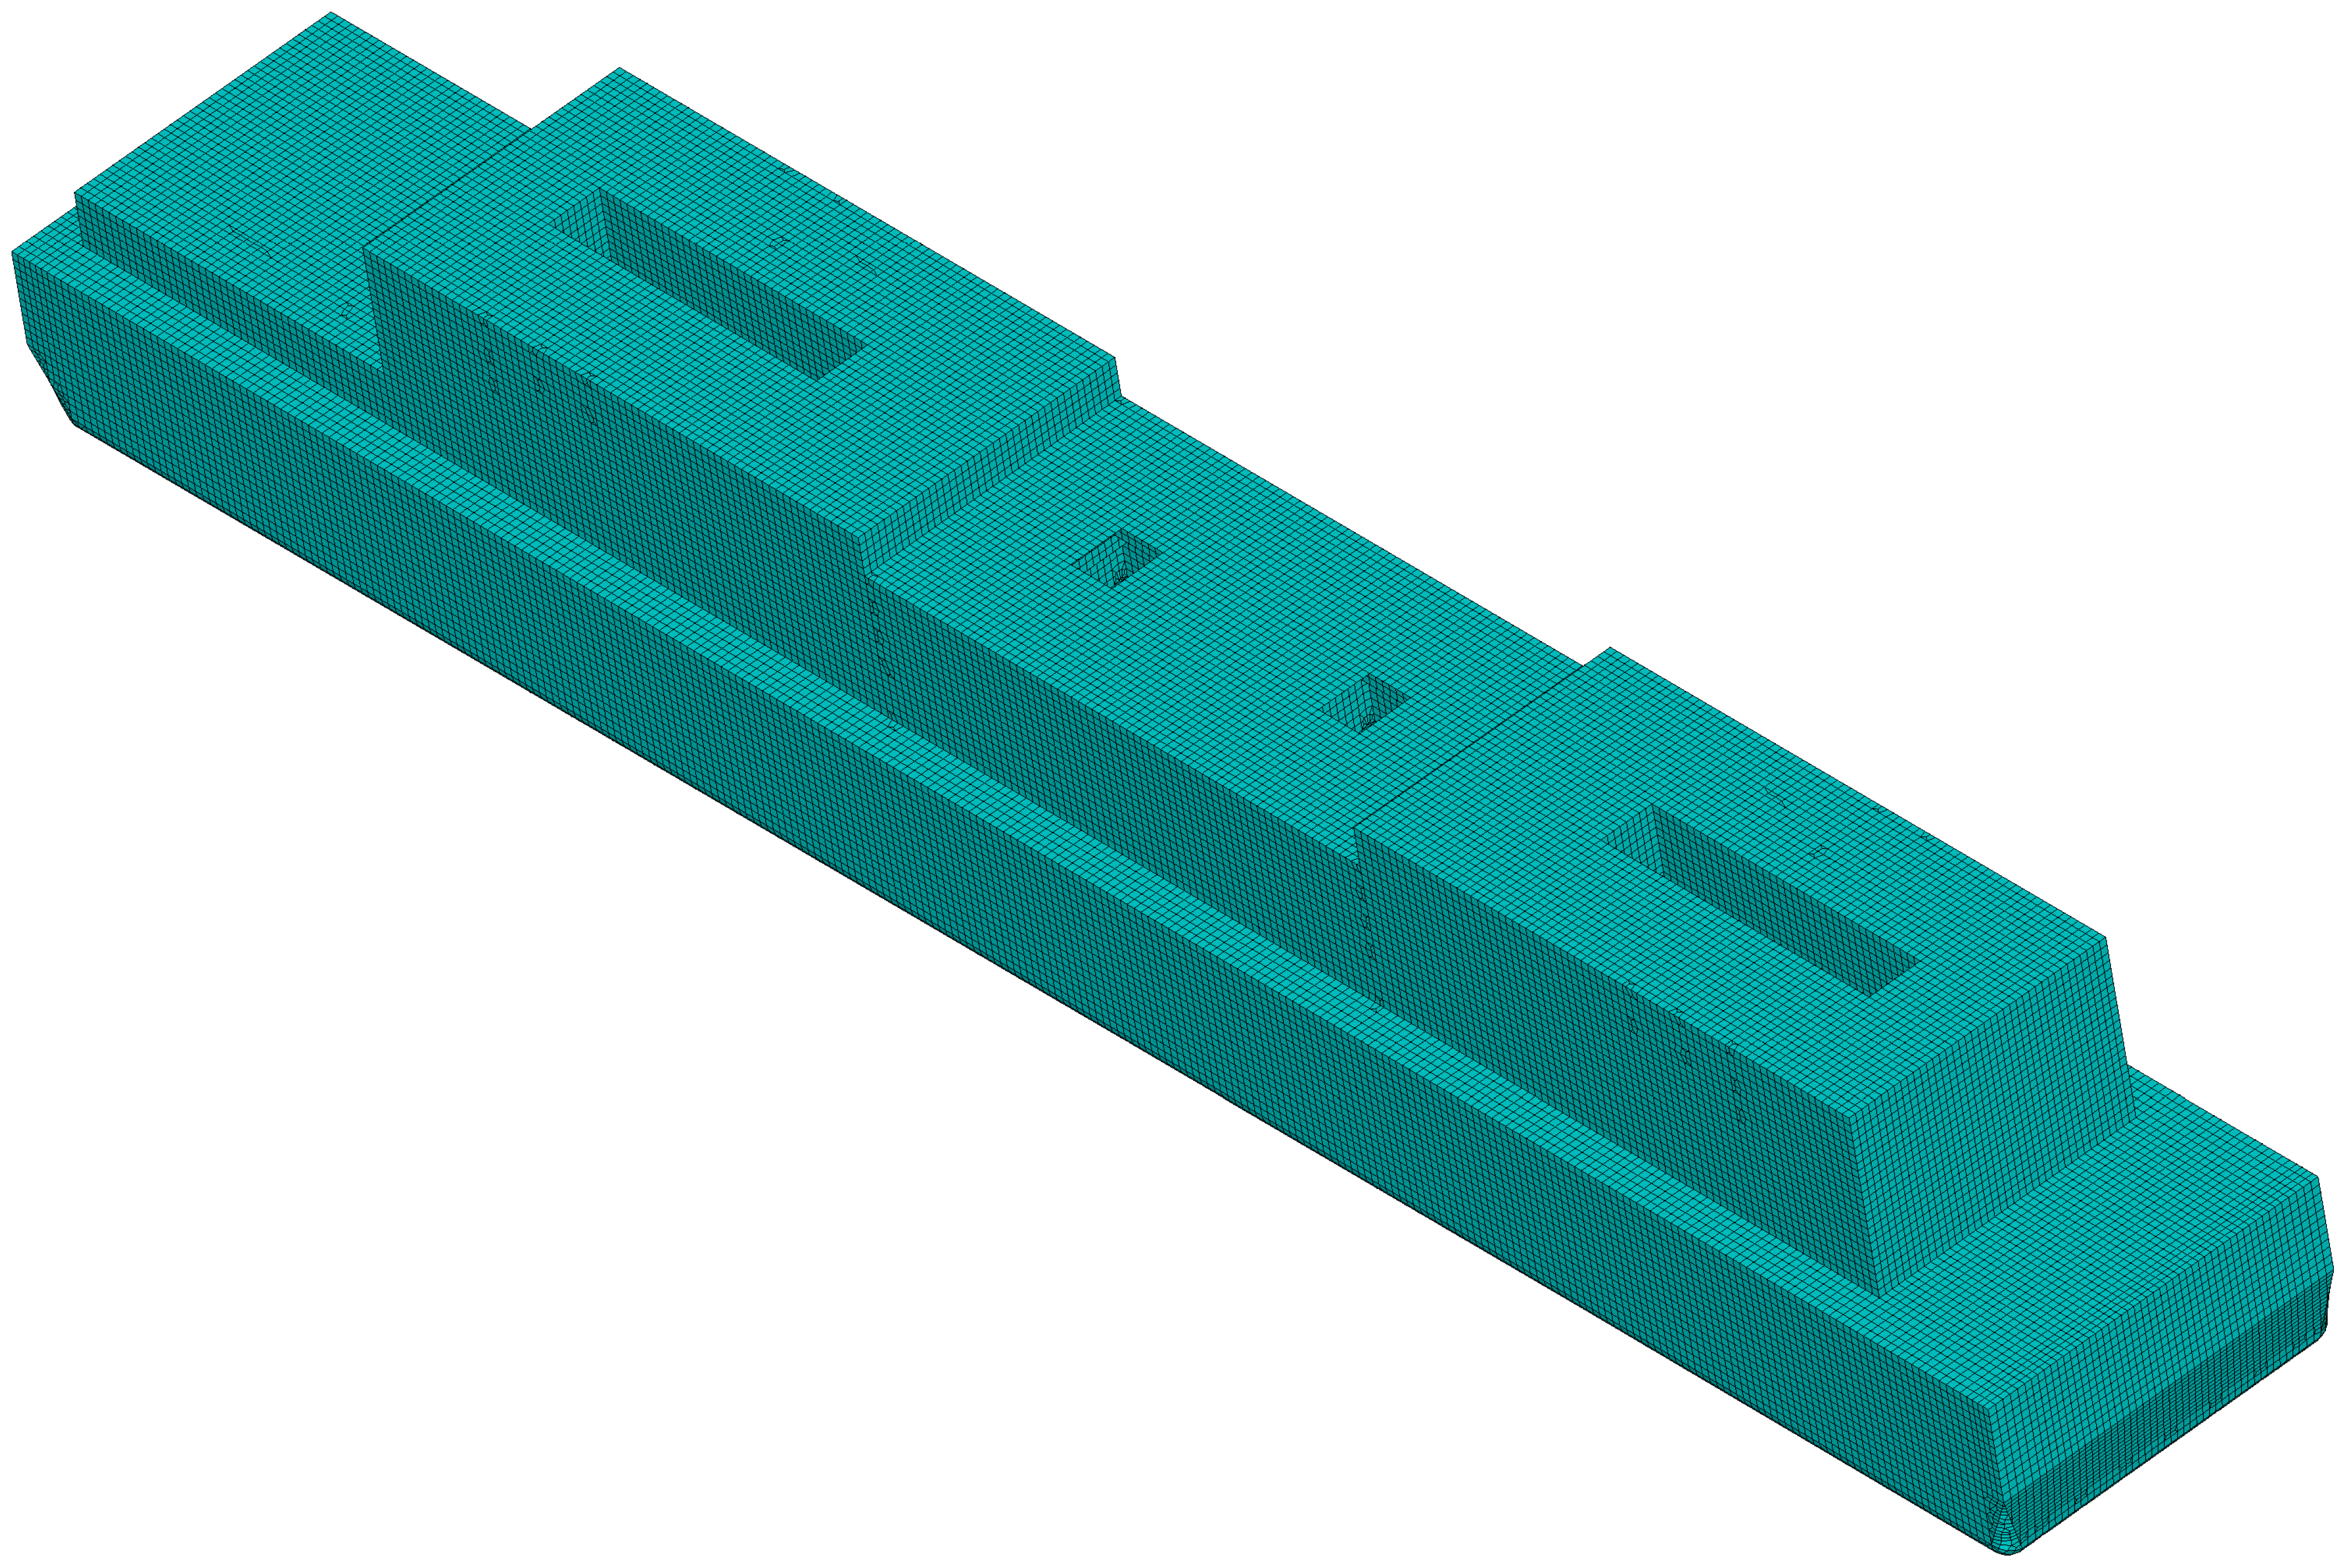
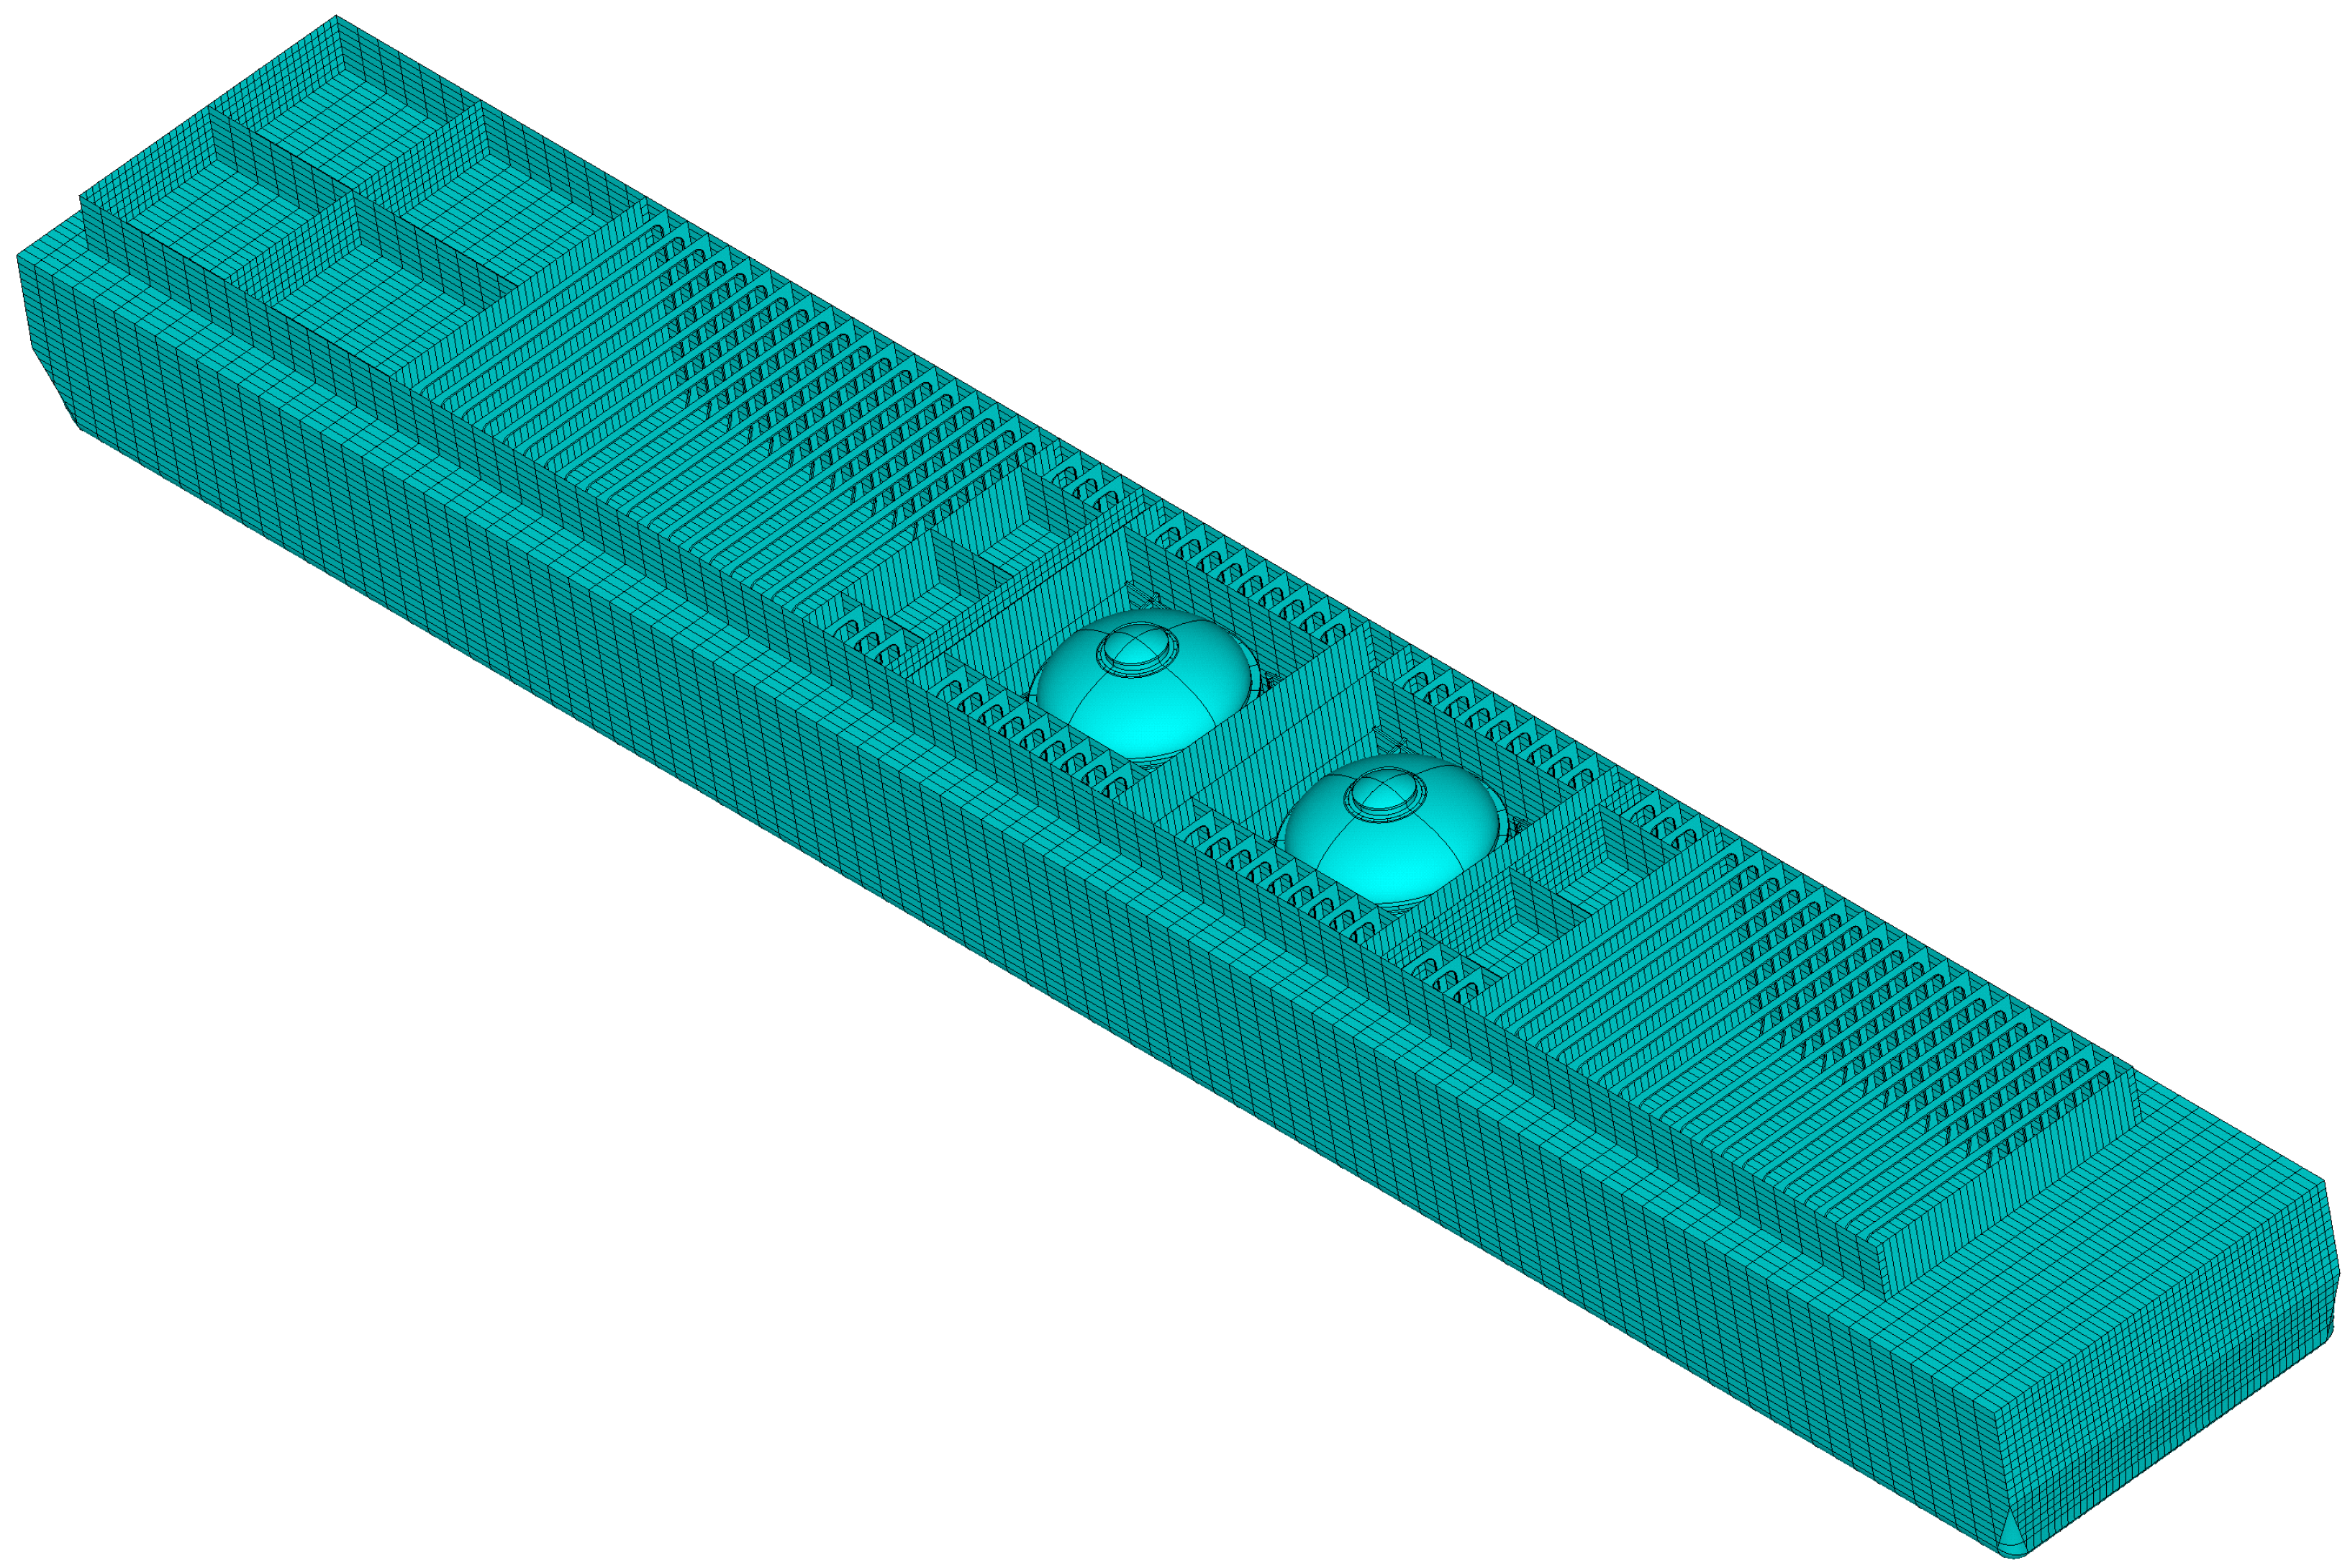
2.2. Structural Model

The FNPP has a length of 230 m, a beam of 36 m, and a depth of 16.9 m. The FNPP consists of several primary structural components, including the hull, containment vessel, and reactor pressure vessel (RPV). The hull comprises inner and outer shell plating, strong framing, longitudinal girders, and stiffeners. A finite element model was established in ANSYS version 2022, where the primary structures were modeled using shell elements, while the secondary structures were modeled using beam and link elements. Specifically, shell elements were used for high-web frames, corrugated bulkheads, and T-stiffened panels; beam elements were used for structural stiffeners subjected to lateral loads, and link elements were used for non-load-bearing stiffeners. During mesh generation, quadrilateral elements were prioritized over triangular elements in high-stress regions (e.g., near openings, bracket connections, and sharp corners) to enhance the computational accuracy. The aspect ratio of the elements was controlled to be ≤3, and in high-stress areas, it was adjusted to be close to 1. Additionally, grid attributes were defined based on the actual arrangement of hull members (e.g., ribs, longitudinal girders, and stiffeners), ensuring that the mesh alignment, spacing, and geometry accurately reflected the structural layout characteristics. The finite element model of the hull consisted of 1,123,194 elements, as illustrated in Figure 4.
The RPV is located inside the FNPP’s containment vessel, serving as a sealed enclosure for the nuclear reactor, designed to withstand operational pressure and thermal loads. The positions of the containment vessel and RPV are shown in Figure 5 and Figure 6.
The RPV’s geometric specifications are as follows: height, 10.66 m; outer diameter, 4.42 m; material, 16MnD5 steel; and total weight (including internal components), 568 tons. The RPV finite element model was developed using solid elements, ensuring an accurate representation of stress distribution and deformation under operational conditions. To improve the stress calculation precision, the thickness direction was meshed with at least six layers of elements. The RPV finite element model consisted of 214,265 elements, as shown in Figure 7.
A binding constraint was applied between the bottom of the limiting groove and the surface of the bearing platform. Additionally, coupling degrees of freedom were set between the RPV supports and the limiting groove, ensuring that the RPV supports were circumferentially fixed while allowing free radial sliding, as illustrated in Figure 8.
For analyzing the RPV response under wave loads, a global model was employed, where both ends of the hull were simply supported [15]. For evaluating the RPV response under inertial forces, a local model was used, with the bottom of the limiting groove being fixed [15].
The hydrodynamic model of the FNPP was constructed in AQWA. The computational model had a length of 230 m, a beam of 36 m, and a depth of 16.9 m, which were consistent with the finite element structure. Only the outer hull of the floater was modeled. The total mass of the FNPP was 83,000 tons, with the center of gravity located at (0.328 m, 0.003 m, −0.38 m). The calculated natural periods were as follows: roll, approximately 10.96 s; heave, approximately 9.87 s; and pitch, approximately 8.71 s. The FNPP was moored to the sea surface using 16 anchor chains, as shown in Figure 9.
The hydrodynamic analysis was conducted using AQWA. The wave directions were set from 0° to 180° with an interval of 30°. The frequency range was set from 0.001 Hz to 0.4 Hz, with 50 evenly spaced frequency points. The calculated RAO (response amplitude operator) results for different wave directions are presented in Figure 10.

3. Structural Damage Analysis Induced by Various Inputs

In the marine environment, wave-induced loads significantly affect the fatigue of the hull structure as they are alternating loads. In contrast, current-induced loads are typically horizontal forces acting on the hull surface over extended periods, exerting a limited impact on fatigue. Additionally, the effect of current-induced loads on the stress in the RPV structure of FNPP is relatively small. As a result, the RPV is primarily subjected to the following dynamic loads: hull deformation ( D S ) due to wave-induced dynamic pressure and inertial forces generated by the six-degree-of-freedom (6-DOF) motion of the hull. These inertial forces include the following: surge inertial force ( F X ), sway inertial force ( F Y ), heave inertial force ( F Z ), pitch inertial force ( F R Y ), roll inertial force ( F R X ), and yaw inertial force ( F R Z ). These dynamic loads cause the RPV structure to experience cyclic stresses, leading to fatigue damage. Therefore, it is essential to systematically analyze the structural damage induced by these dynamic loads, particularly by assessing the effects of wave-induced pressure and hull motion on RPV fatigue damage individually. By comparing the fatigue damage caused by different factors, the dominant influencing factors can be identified.

3.1. Spectral Analysis Method

In ship and offshore engineering, long-term ocean wave conditions are typically represented by multiple short-term sea states, each characterized by specific wave parameters and occurrence frequencies. Each short-term sea state is considered a stationary Gaussian random process, and the resulting cyclic stress process in the structure is also regarded as an accumulation of multiple short-term sea states.
For a single short-term sea state, the cyclic stress process is generally assumed to be a zero-mean stationary Gaussian random process, with its stress range distribution (i.e., short-term distribution) expressed by a probability density function. According to random process theory, the peak stress in a short-term distribution follows a Rayleigh distribution, given by
f X ( x ) = x σ X 2 exp x 2 2 σ X 2
where x represents the peak stress value, and σ is the standard deviation of the cyclic stress process.
To obtain the stress transfer function, unit-amplitude wave-induced hydrodynamic pressures or inertial forces at different frequencies are applied to the structural model. The corresponding stress amplitudes at specific nodal points are extracted, allowing for the derivation of the stress transfer function. The power spectral density function G ( f ) of the cyclic stress process is obtained using spectral analysis methods:
G ( f ) = | H ( f ) | 2 S ( f )
where H ( f ) is the stress transfer function, and S ( f ) is the wave spectrum.
The 0th and 2nd moments of the power spectral density function are defined as
m j = 0 f j G ( f ) d f       ( j = 0 , 2 )
The standard deviation σ X of the stress response is then
σ X = m 0
To determine the number of stress cycles within a given period, the zero-crossing rate n 0 must be calculated, which represents the average number of times the stress process crosses its zero mean with a positive slope per unit time:
n 0 = m 2 m 0
Under the narrow-band assumption, each zero-crossing corresponds to a stress peak, establishing a relationship between stress range S and stress peaks X :
S = 2 X
Thus, the probability density function for stress range is
f S ( S ) = S 4 σ X 2 exp - S 2 8 σ X 2
Given an exposure time T i for the i th short-term sea state, with an average zero-crossing rate n 0 i , the cumulative fatigue damage D i is
D i = T i n 0 i 0 f S ( S ) N ( S ) d S
where N ( S ) is the S–N curve for the material.
The RPV material in this study was low-alloy structural steel (16MnD5), and the S–N curve was based on the RCC code [14], as illustrated in Figure 11. S a represents half of the alternating stress intensity range, and N represents the corresponding allowable cycles.
For long-term fatigue analysis, the total accumulated fatigue damage is obtained by summing all short-term sea state damages:
D t o t a l = i = 1 M D i
where M represents the number of short-term sea states in the long-term fatigue analysis.

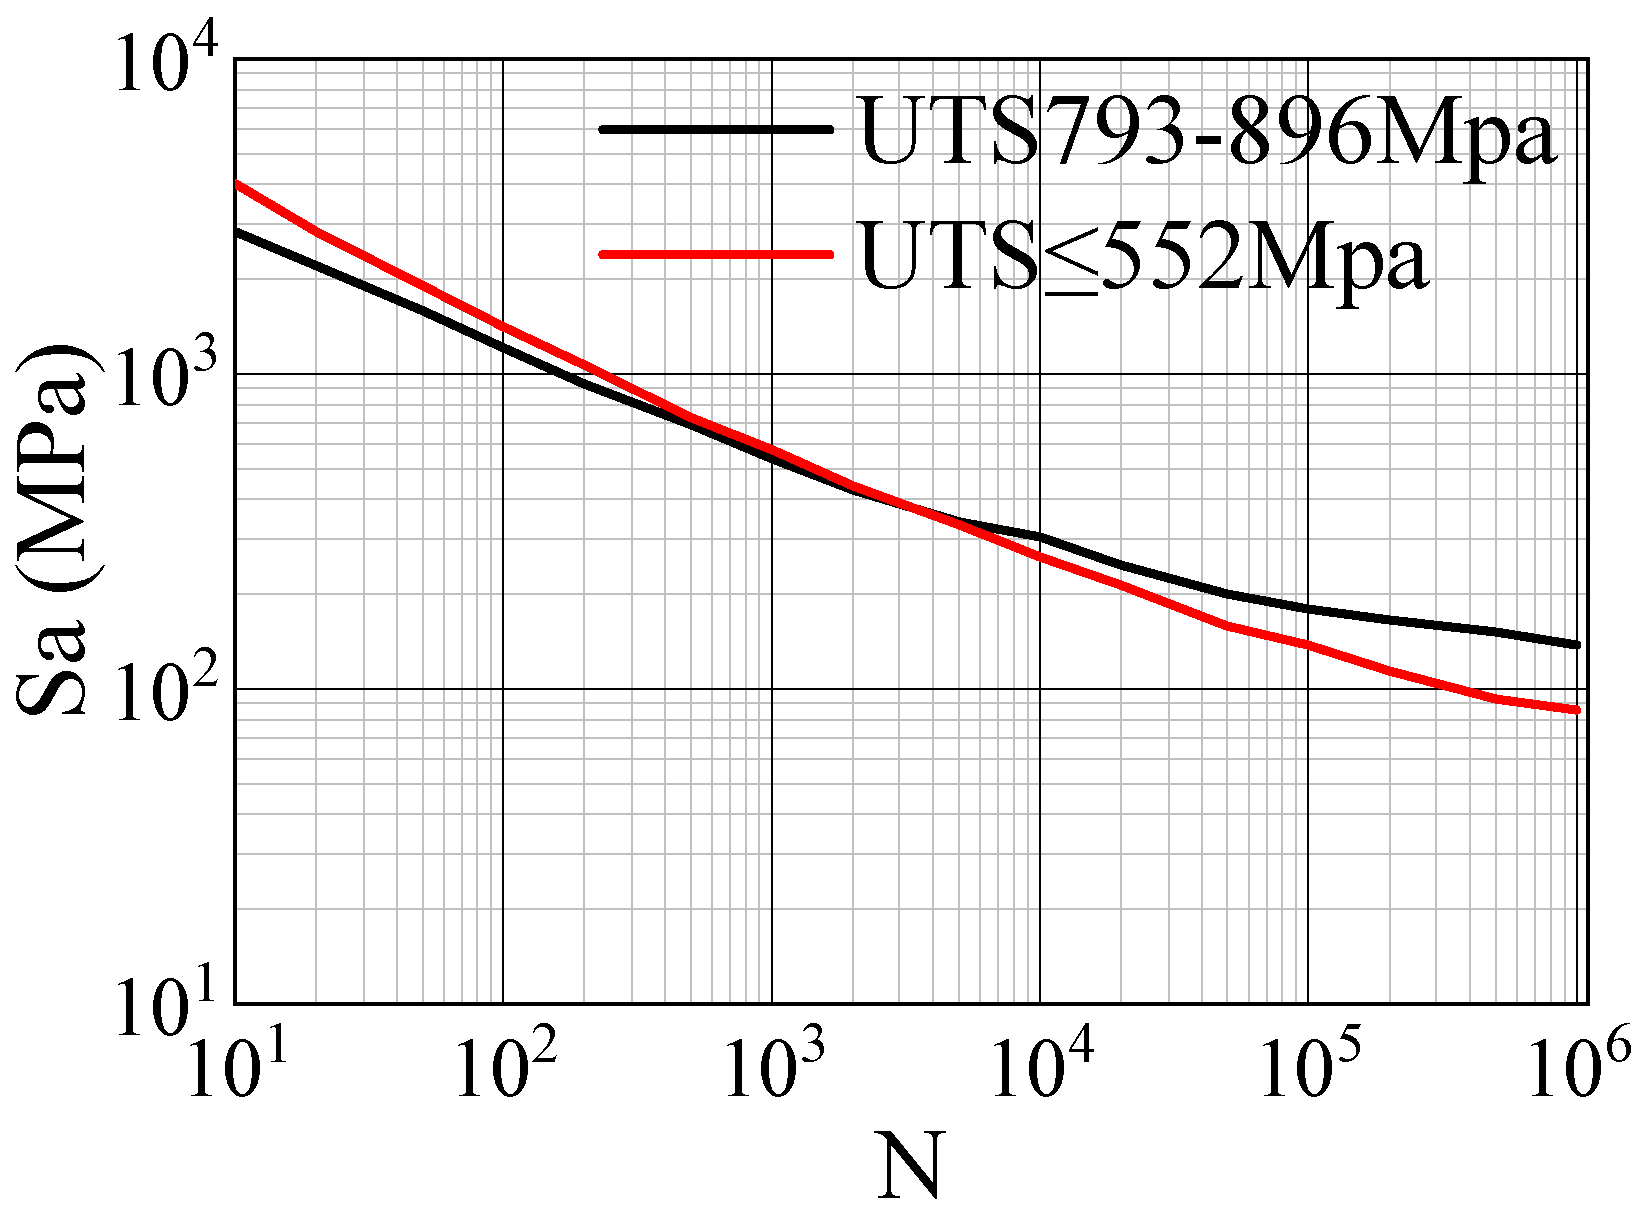
3.2. Structural Damage Evaluation

To analyze the effects of different dynamic loads on RPV fatigue damage, the spectral analysis method was used to calculate the fatigue damage induced by each factor individually. Two typical fatigue load conditions were selected based on the wave scatter diagram of the FNPP’s operational waters [15]:
Condition 1: significant wave height, 4 m; peak spectral period, 8 s; wave directions, 0° to 180°, in 30° increments; and exposure time per direction, 3 h.
Condition 2: significant wave height, 6 m; peak spectral period, 10 s; wave directions, 0° to 180°, in 30° increments; and exposure time per direction, 3 h.
The inner side of the RPV’s closure head cap and nozzle are locations prone to fatigue [15]. Therefore, fatigue evaluation points were selected on the inner surface of the RPV structure, as shown in Figure 12.
For condition 1, the fatigue damage results across different wave directions (0–180°) are presented in Figure 13.
The results indicated the following: Roll-induced inertial forces F R X had the most significant impact on RPV fatigue damage. Pitch-induced inertial forces F R Y had the second-largest impact. The effects of other factors on RPV fatigue damage were relatively minor. Roll-induced fatigue damage was maximized in beam seas (wave direction, 90°) and minimized in head seas (wave direction, 0°). Pitch-induced fatigue damage was maximized in head seas (0°) and minimized in beam seas (90°). Yaw-induced fatigue damage peaked in oblique wave conditions. Hull deformation-induced fatigue damage peaked in beam wave conditions.
For condition 2, the fatigue damage results are shown in Figure 14.
A comparison between Figure 13 and Figure 14 shows the following: Roll motion F R X remained the dominant factor affecting RPV fatigue. Pitch motion F R Y continued to be the second-largest contributor. Wave direction significantly influenced the fatigue damage distribution, with roll-induced damage peaking in beam seas and pitch-induced damage peaking in head seas.
Since the RPV was a large, mass-concentrated onboard structure with constrained movement, hull deformation had minimal impact on the fatigue damage, while roll and pitch inertial forces dominated the fatigue damage. Therefore, when analyzing RPV fatigue under marine conditions, only roll and pitch inertial forces needed to be considered.

4. Structural Strength Analysis Under Various Inputs

The structural strength analysis of ship structures under marine environmental loads is typically conducted using direct calculation methods, where wave loads are determined using the design wave method. Based on the design sea state, the corresponding design wave parameters were identified, and the resulting wave dynamic pressure and inertial forces were applied to the finite element model of the FNPP to compute the stress distribution and evaluate the structural strength. By comparing the stress distribution under different loading conditions, the dominant factors affecting the RPV structure could be identified.

4.1. Design Wave Method

The 100-year return period extreme sea state was selected as the design sea condition for strength assessment. The corresponding significant wave height and peak spectral period were determined from Table 1, while seven representative wave directions were chosen: 0° (head seas), 30°, 60°, 90° (beam seas), 120°, 150°, and 180° (following seas). The primary controlling load parameter was set as the vertical bending moment at midship, and its transfer function was calculated under different wave directions.
The response spectrum of the vertical bending moment under the design sea state was obtained using Equation (2). Under the narrow-band assumption, the short-term distribution of the response amplitude followed a Rayleigh distribution, and the exceedance probability of a given response threshold is given by
P ( X ¯ > x ¯ ) = exp x ¯ 2 2 σ X 2
where P ( X ¯ > x ¯ ) is the probability that the response amplitude exceeded the threshold, and x ¯ is the target exceedance threshold.
A probability level of 10 8 was selected for determining the 100-year extreme vertical bending moment at midship. The resulting predicted values for different wave directions are listed in Table 2.
The design wave height is then computed as
H = 2 R R A O c
where H is the design wave height, R is the predicted extreme vertical bending moment, and R A O c is the maximum response under unit wave amplitude.
Using the transfer function, the wave period and phase corresponding to the maximum response under unit wave amplitude were determined, defining the design wave parameters for the 100-year return period sea state, as summarized in Table 3.

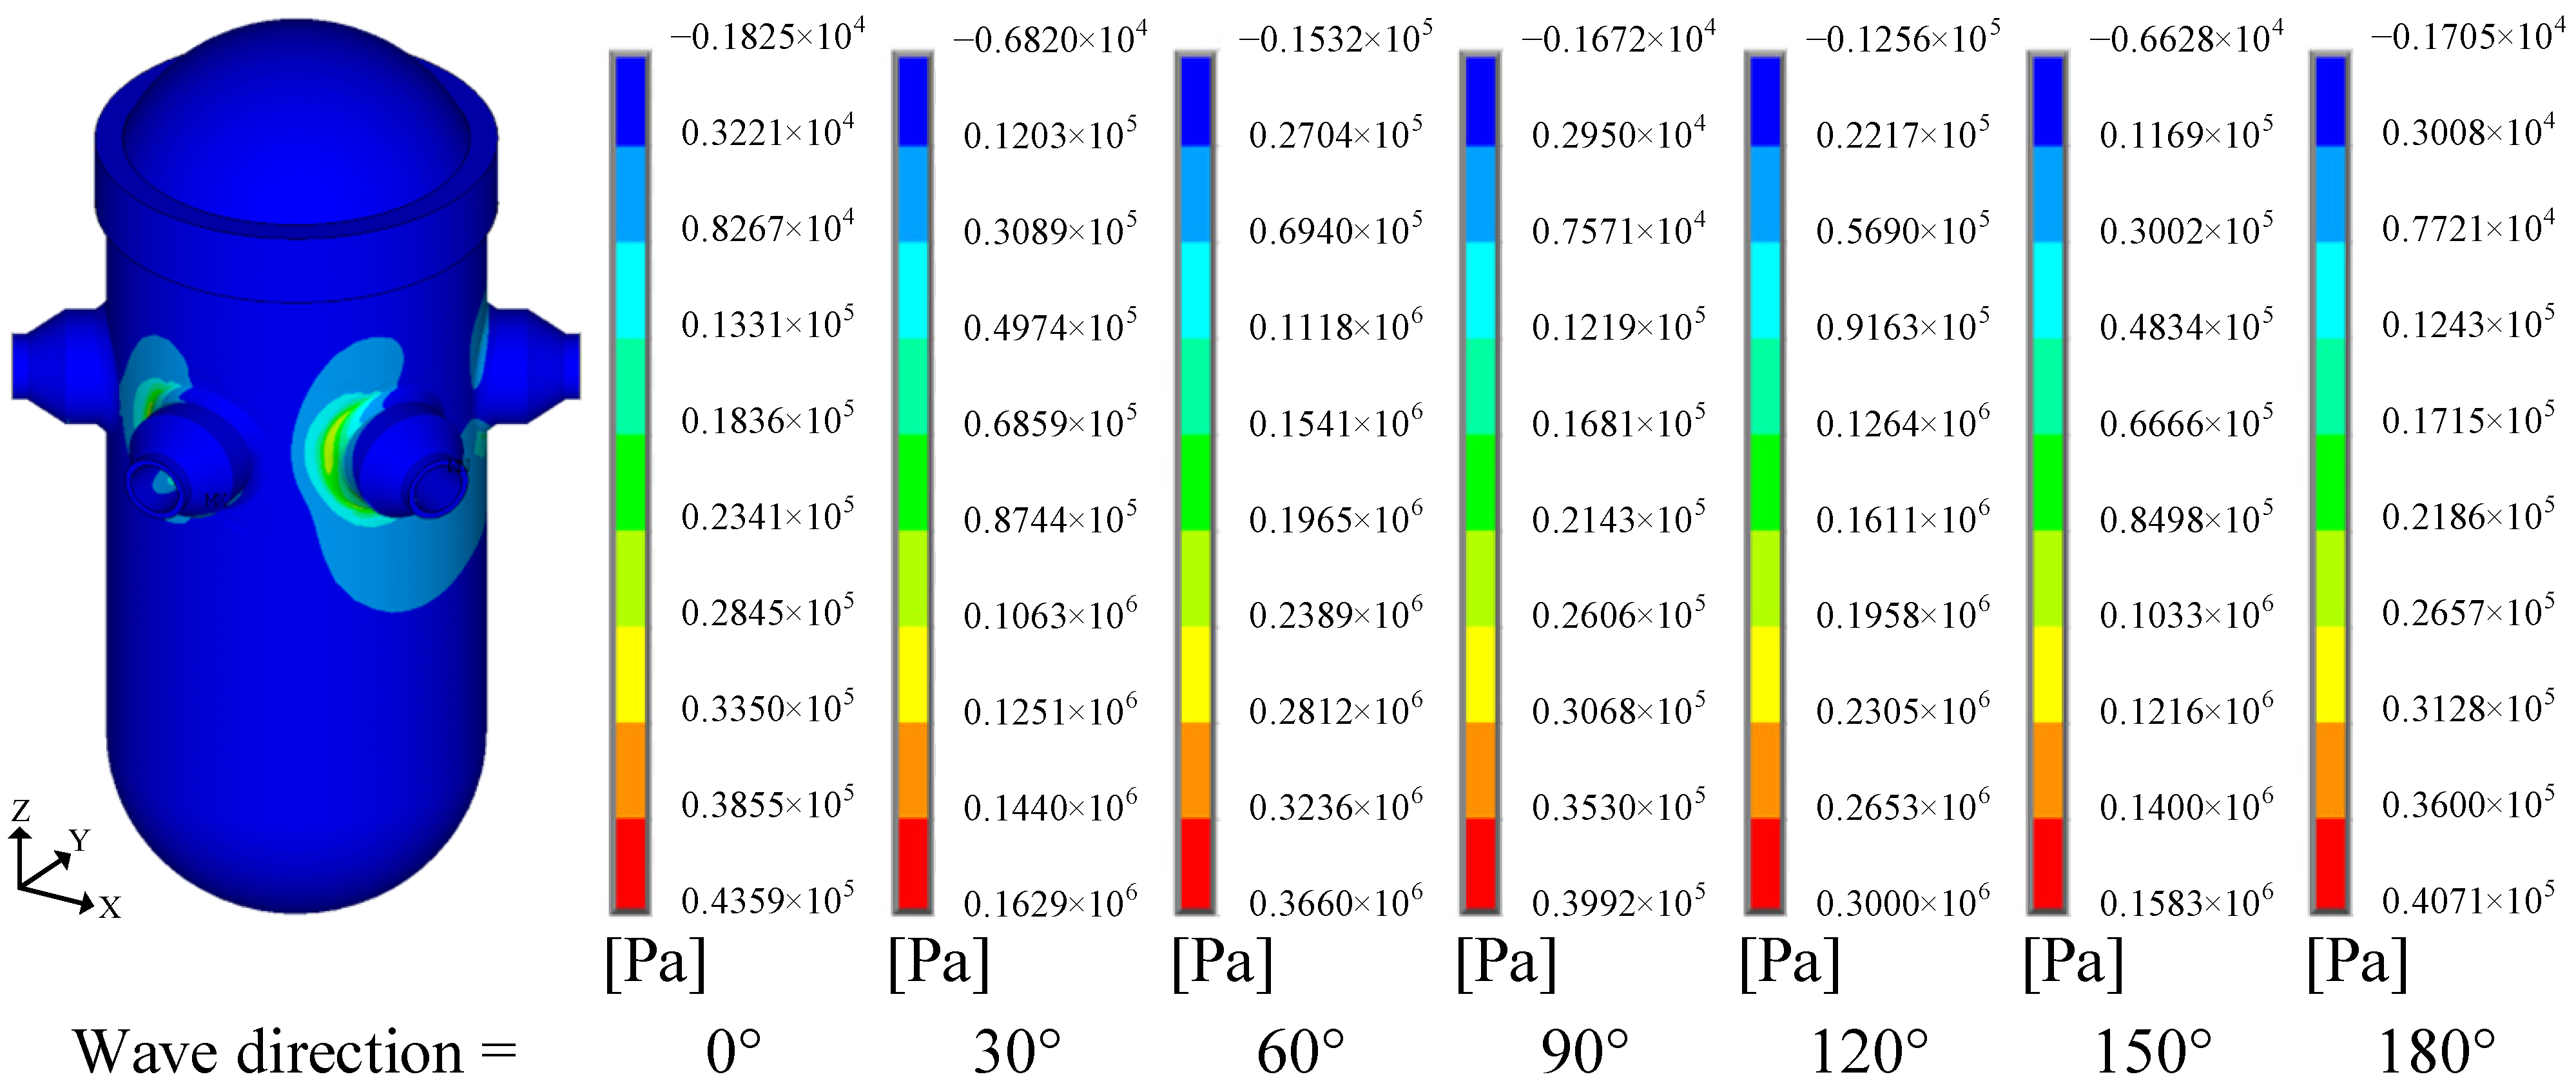
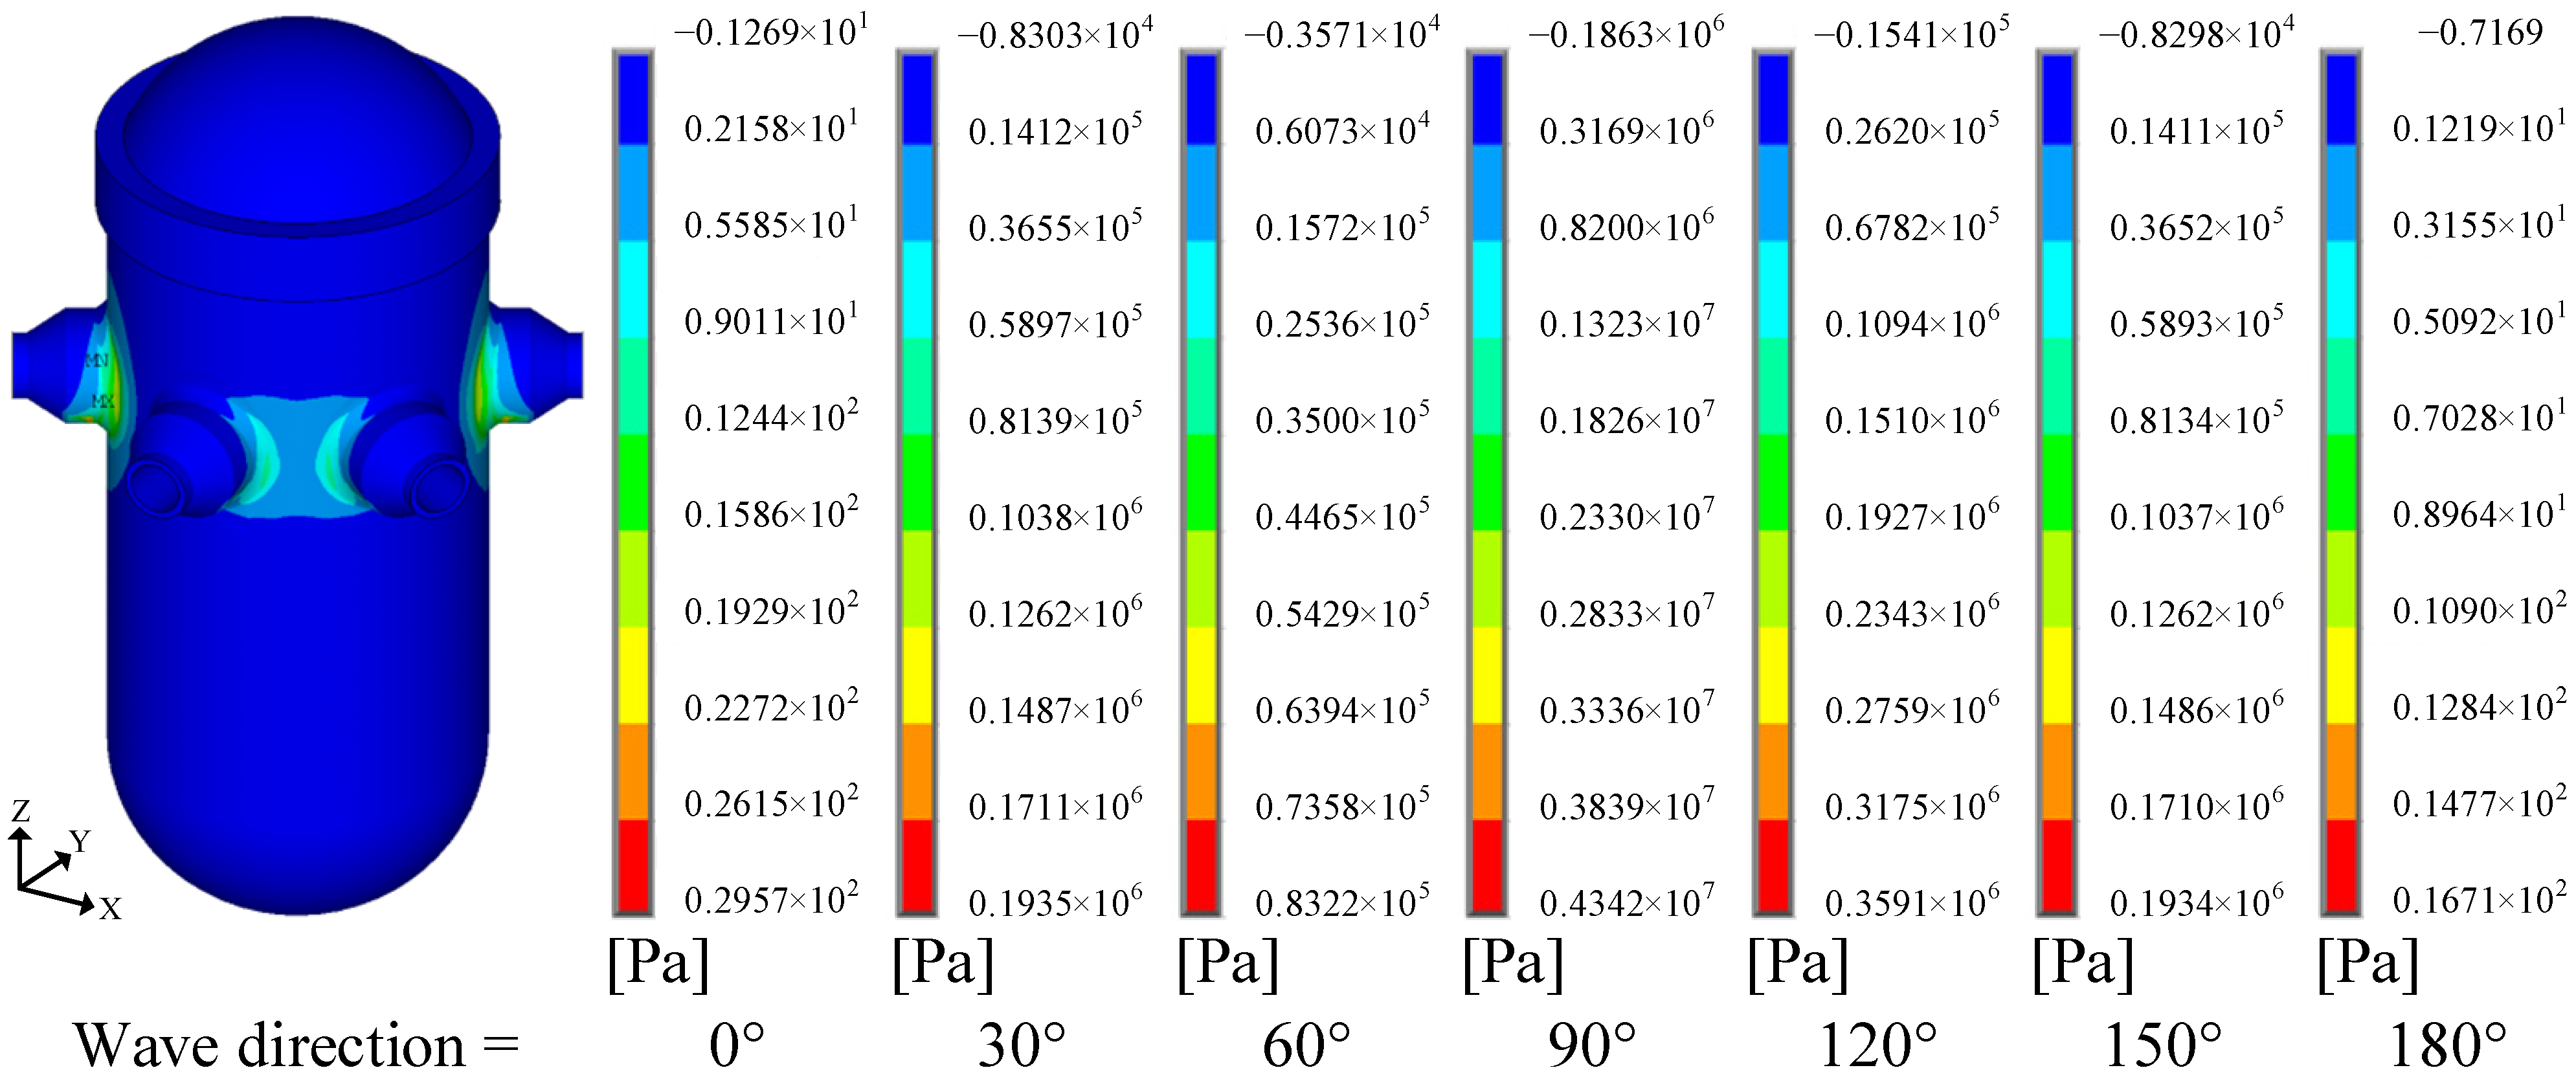
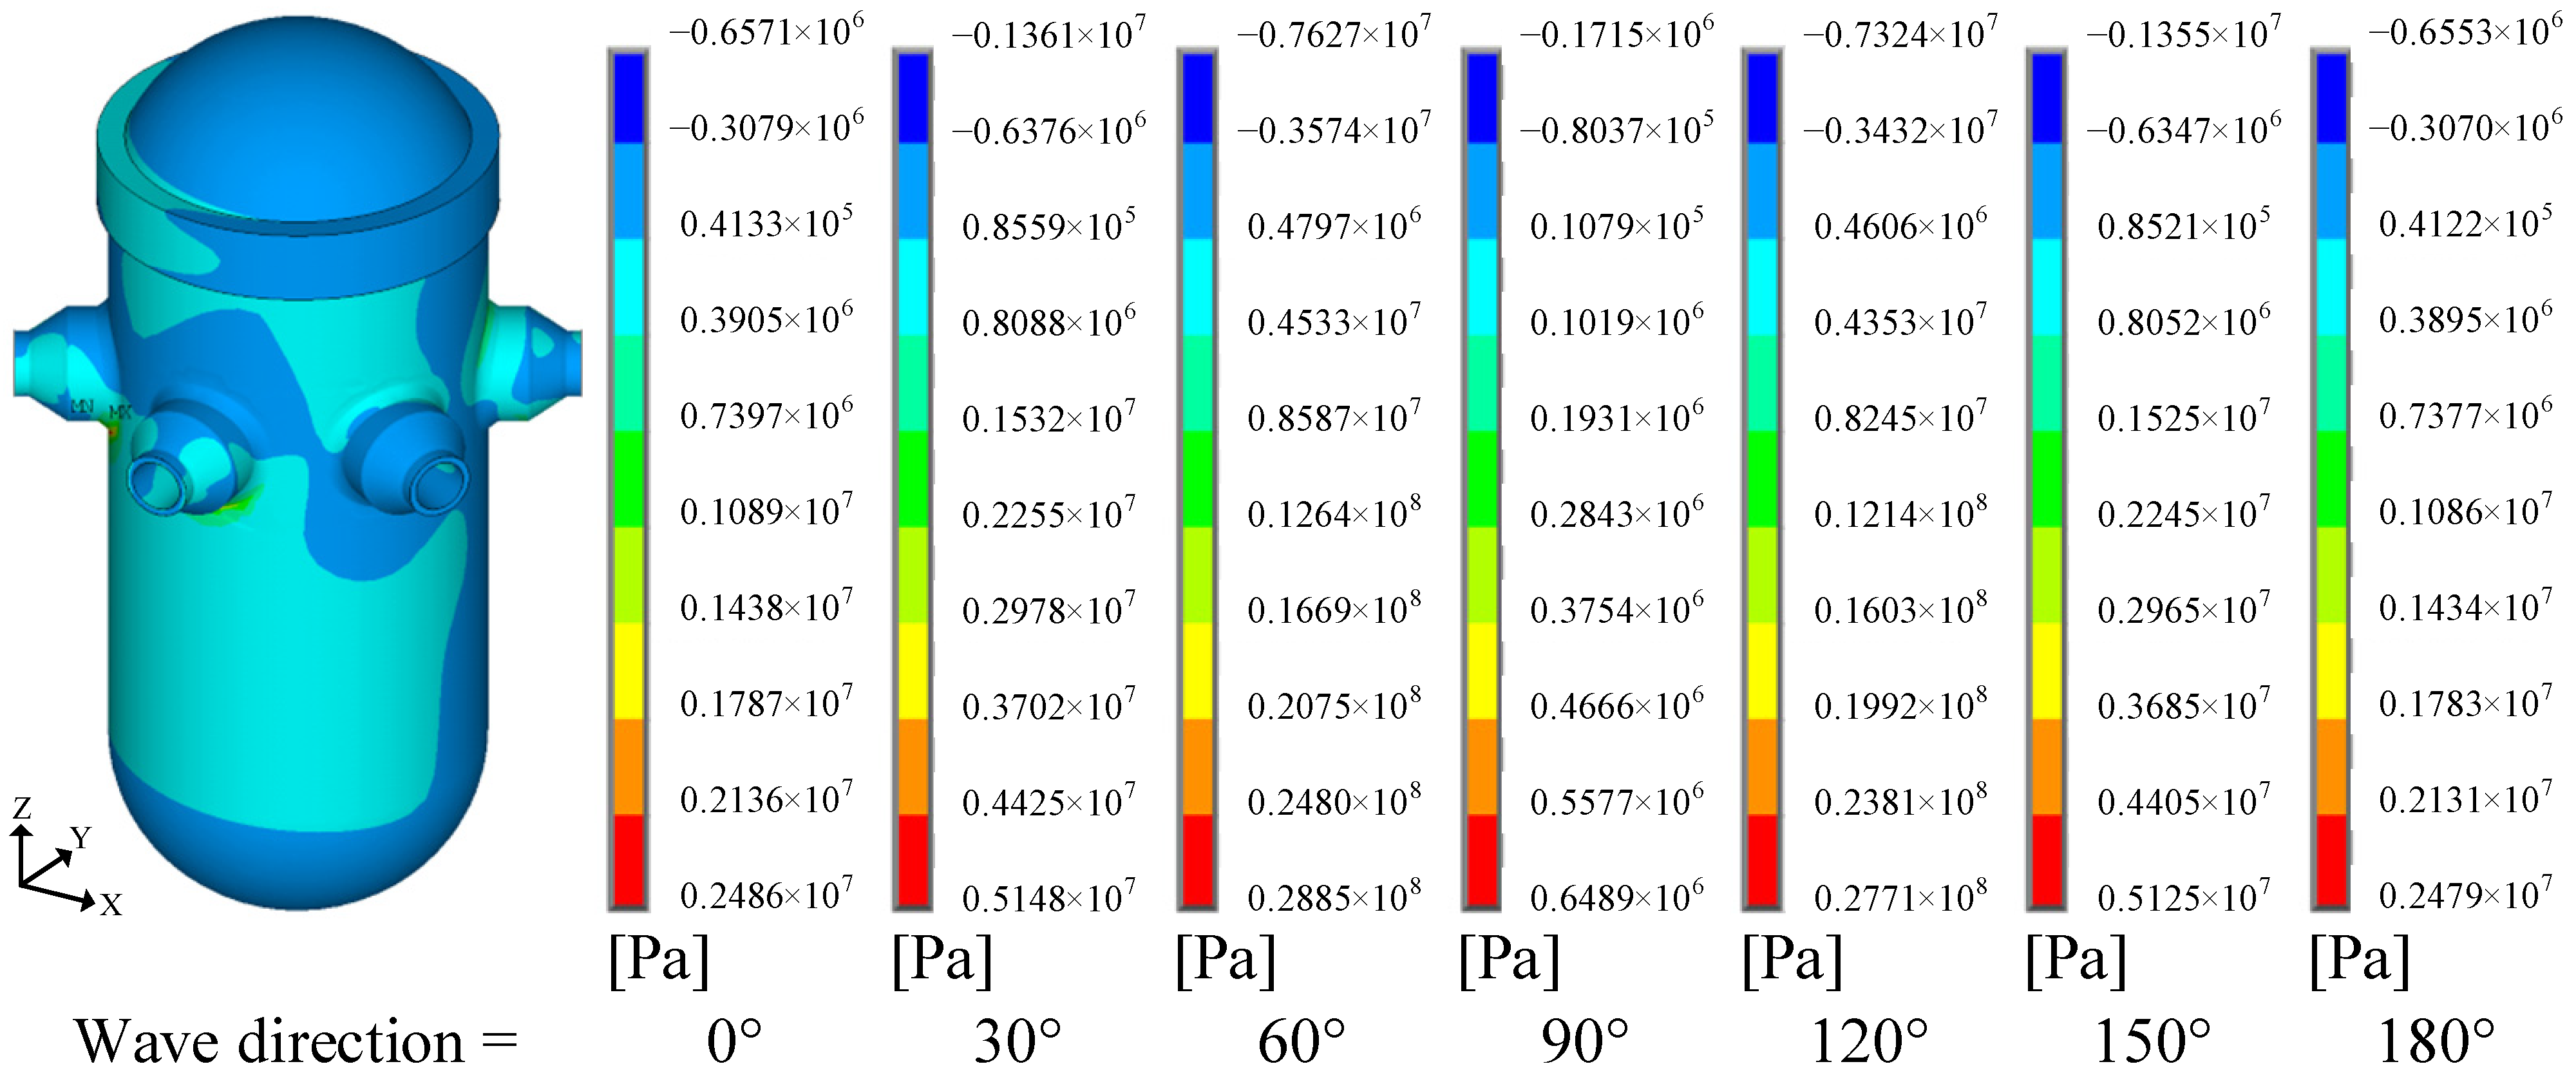
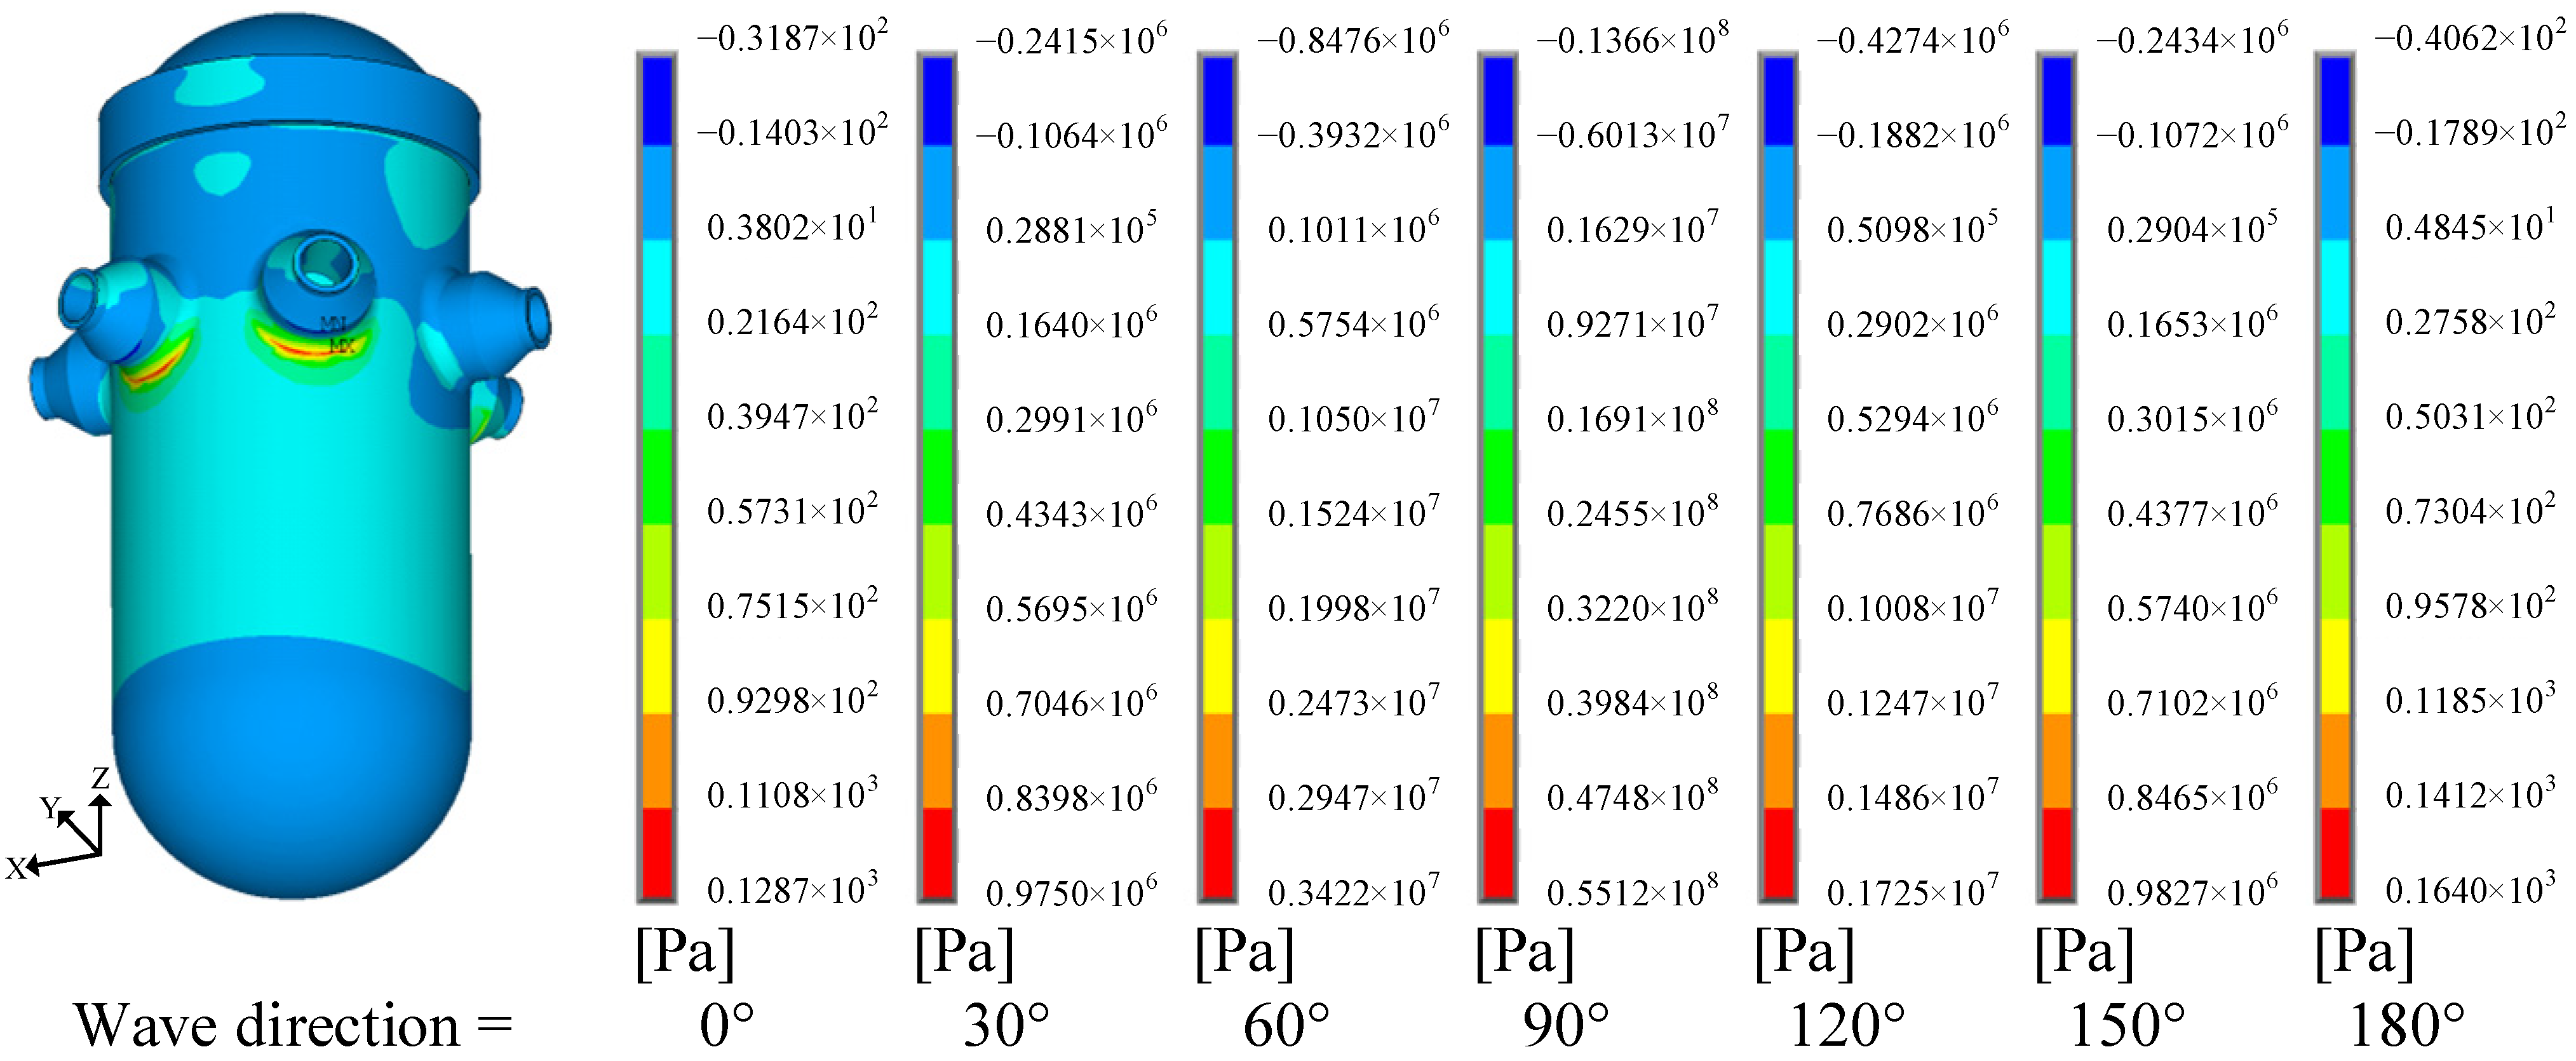
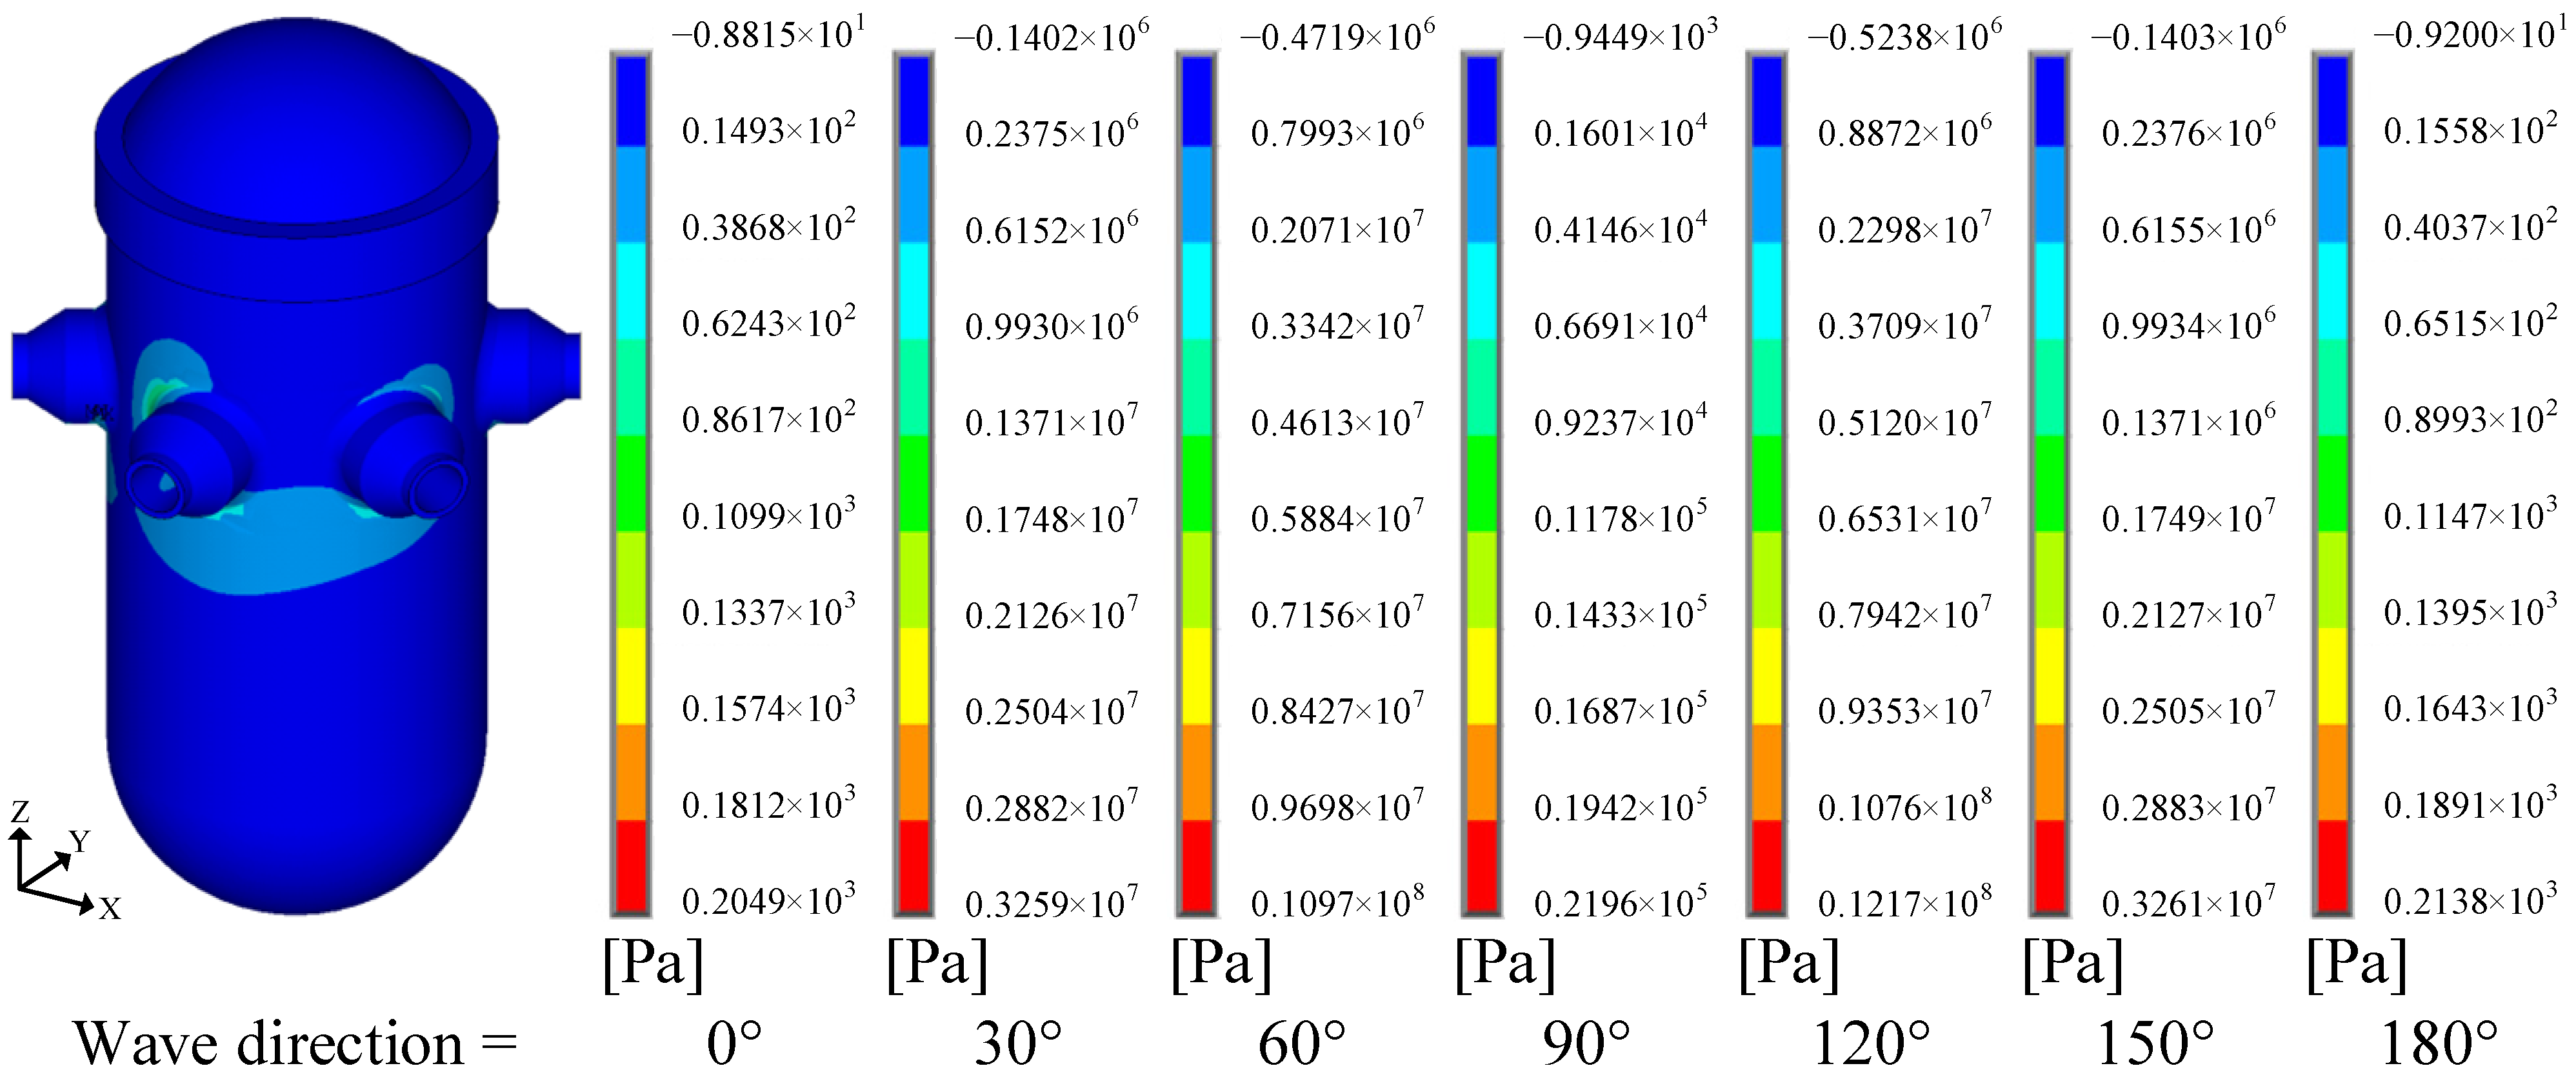
4.2. Structural Stress Distribution

To analyze the stress distribution in the RPV under different load conditions, the design wave method was applied to compute the first principal stress distribution in the 100-year return period sea state. The wave-induced dynamic pressure and 6-DOF motion inertial forces were applied separately to assess their contributions to RPV stress, as shown in Figure 15, Figure 16, Figure 17, Figure 18, Figure 19, Figure 20 and Figure 21.
Figure 15, Figure 16, Figure 17, Figure 18, Figure 19, Figure 20 and Figure 21 indicate the following: Wave dynamic pressure resulted in varying stress distributions depending on the wave direction. Inertial forces from the 6-DOF motion produced similar stress distributions across different wave directions in the ship-fixed coordinate system, with only magnitude variations. The maximum RPV stress occurred at the nozzle connection. Rotational inertial forces ( F R X , F R Y , and F R Z ) induced higher stress levels than wave pressure and translational inertial forces. Roll motion under beam seas (90°) led to the highest stress levels.
As rotational inertial forces dominated RPV stress, structural strength assessments could be simplified by considering only these forces while neglecting wave-induced deformation and translational inertial forces. Furthermore, the maximum stress remained well below the material’s yield strength (340 MPa) [14], suggesting that thermal-pressure loads had a greater impact on RPV strength. Therefore, in ultimate strength assessments, appropriate load cases should be selected based on the combined effects of thermal-pressure and inertial loads.

5. Conclusions

This study systematically analyzed the structural response of the RPV in an FNPP under marine environmental conditions. A detailed hull structure model, RPV structure model, and hydrodynamic model were constructed. Using spectral analysis and the design wave method, the fatigue damage and stress distribution of the RPV under various dynamic loads were assessed. The study focused on the impacts of hull deformation and 6-DOF inertial forces on the RPV. The results indicated that rotational inertial forces were the dominant factors affecting both fatigue damage and structural strength, whereas other dynamic loads had relatively minor effects. The main conclusions were as follows:
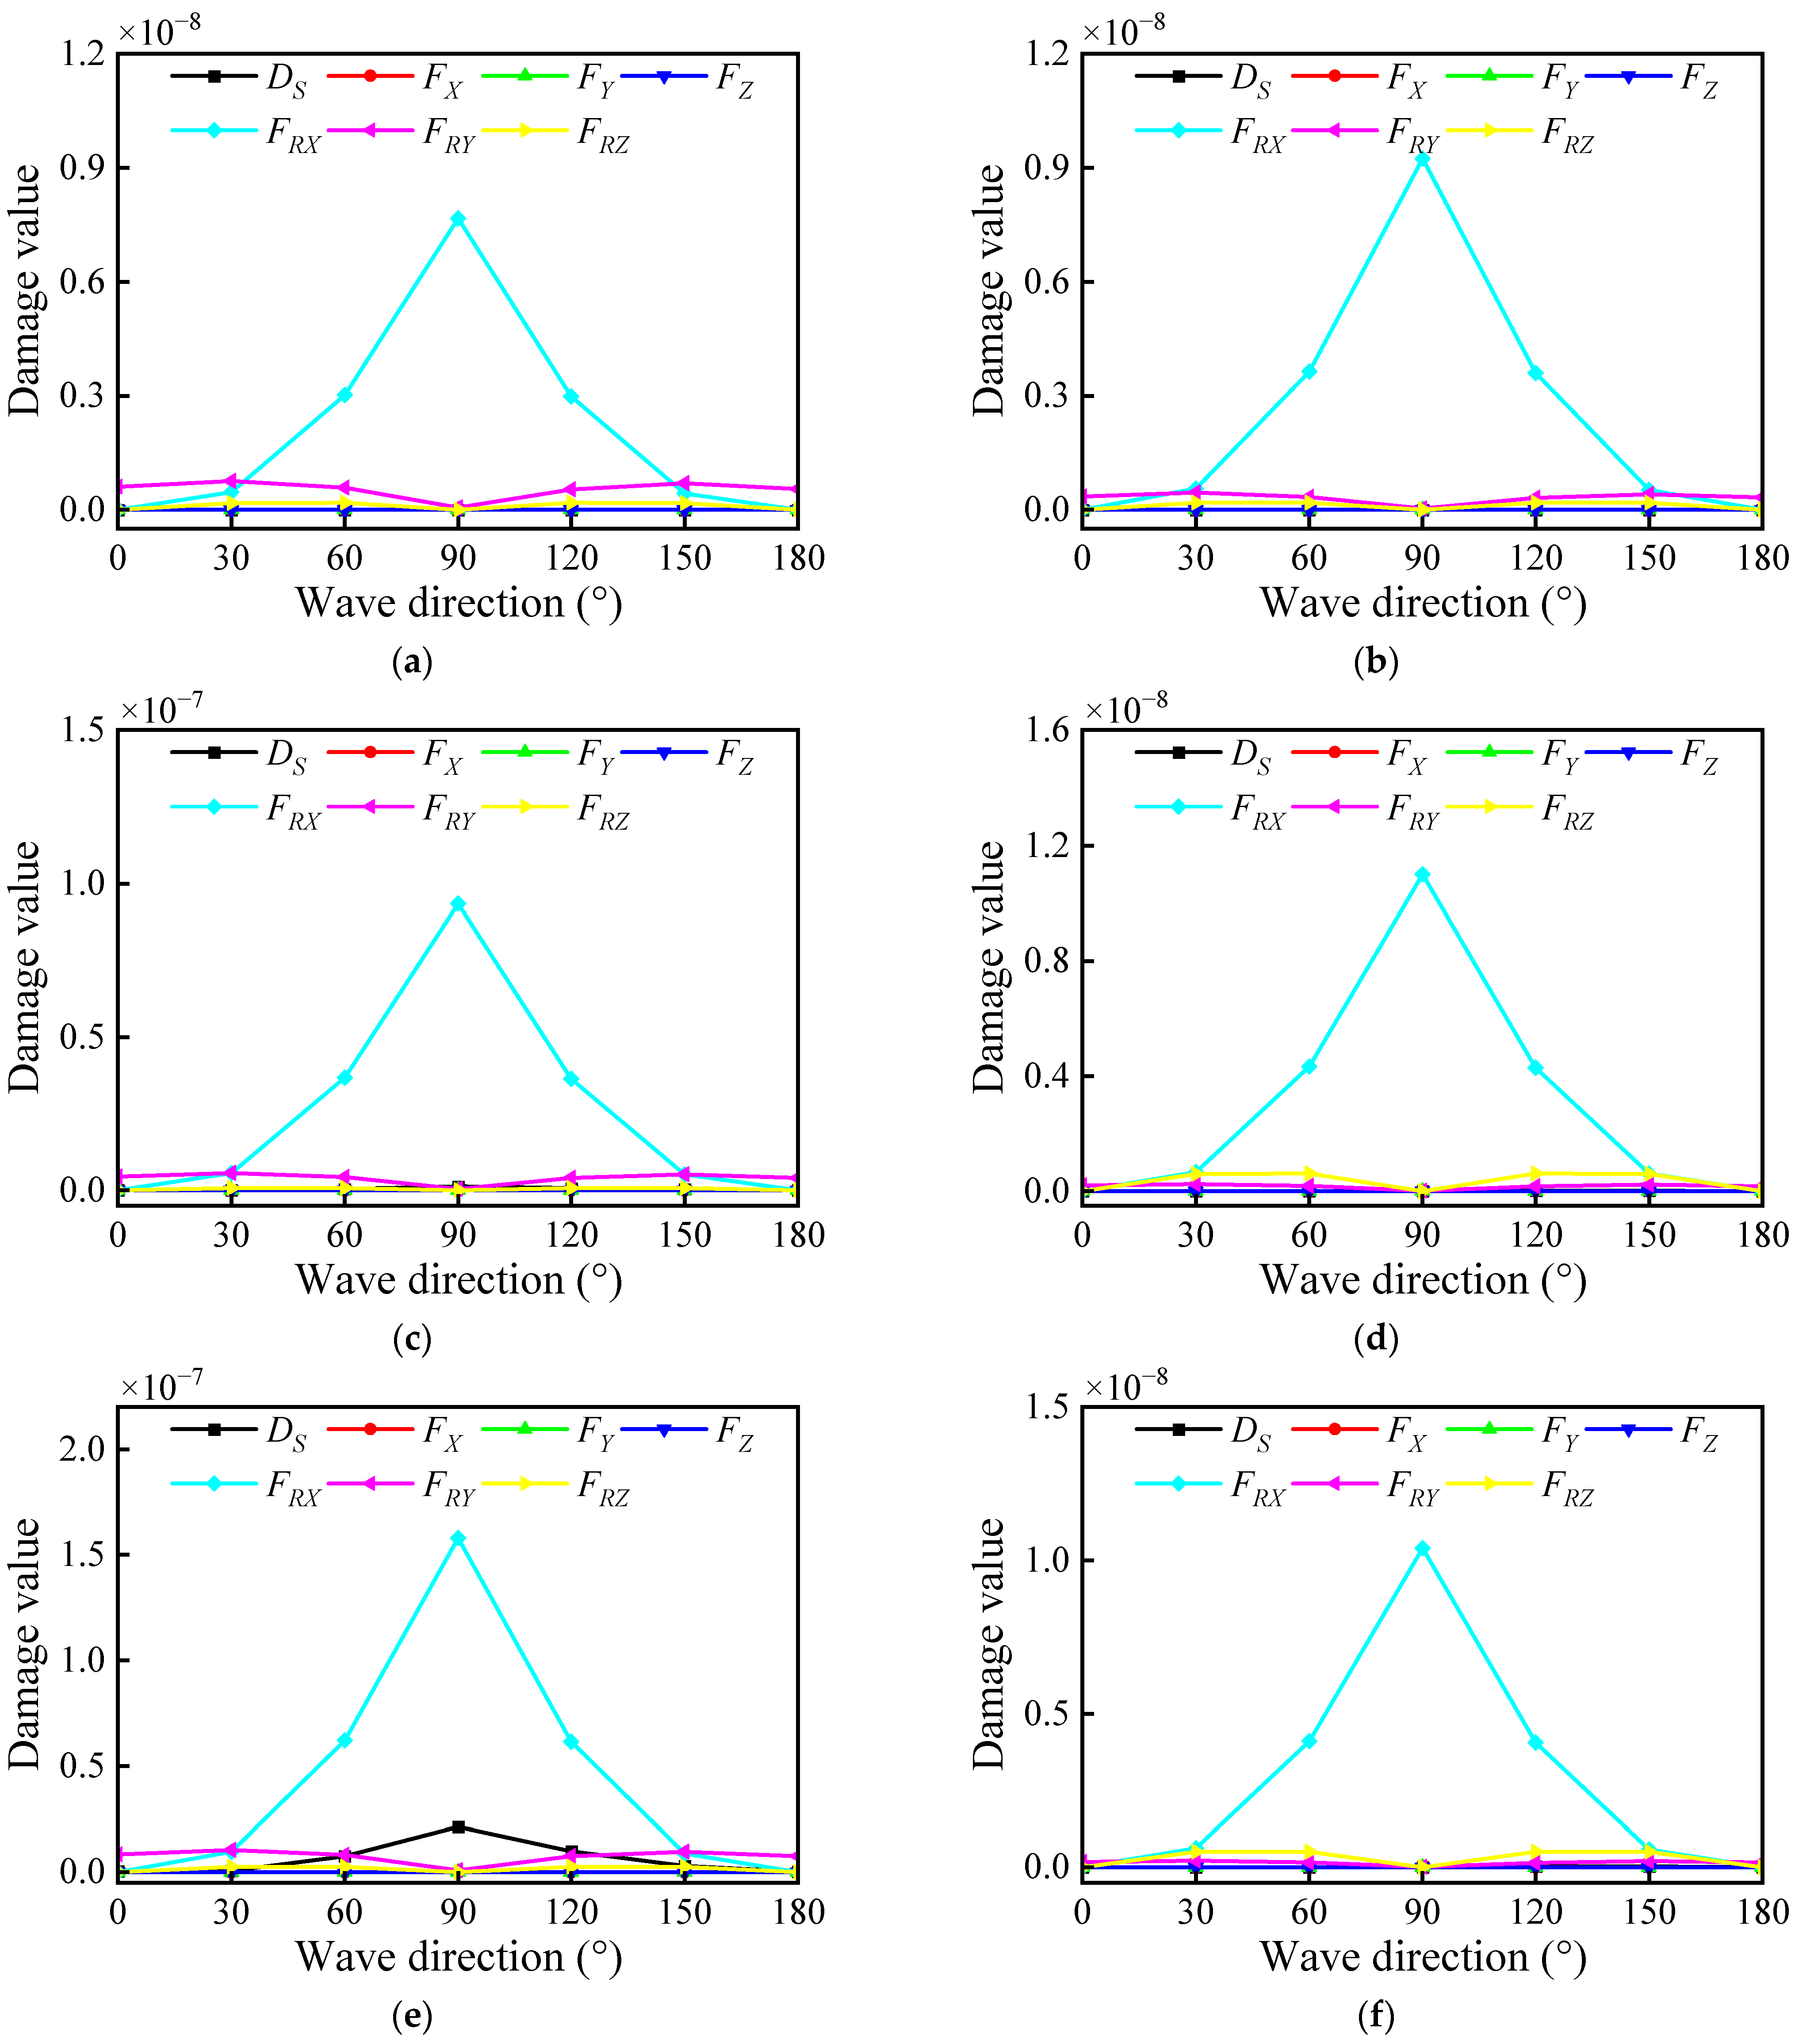
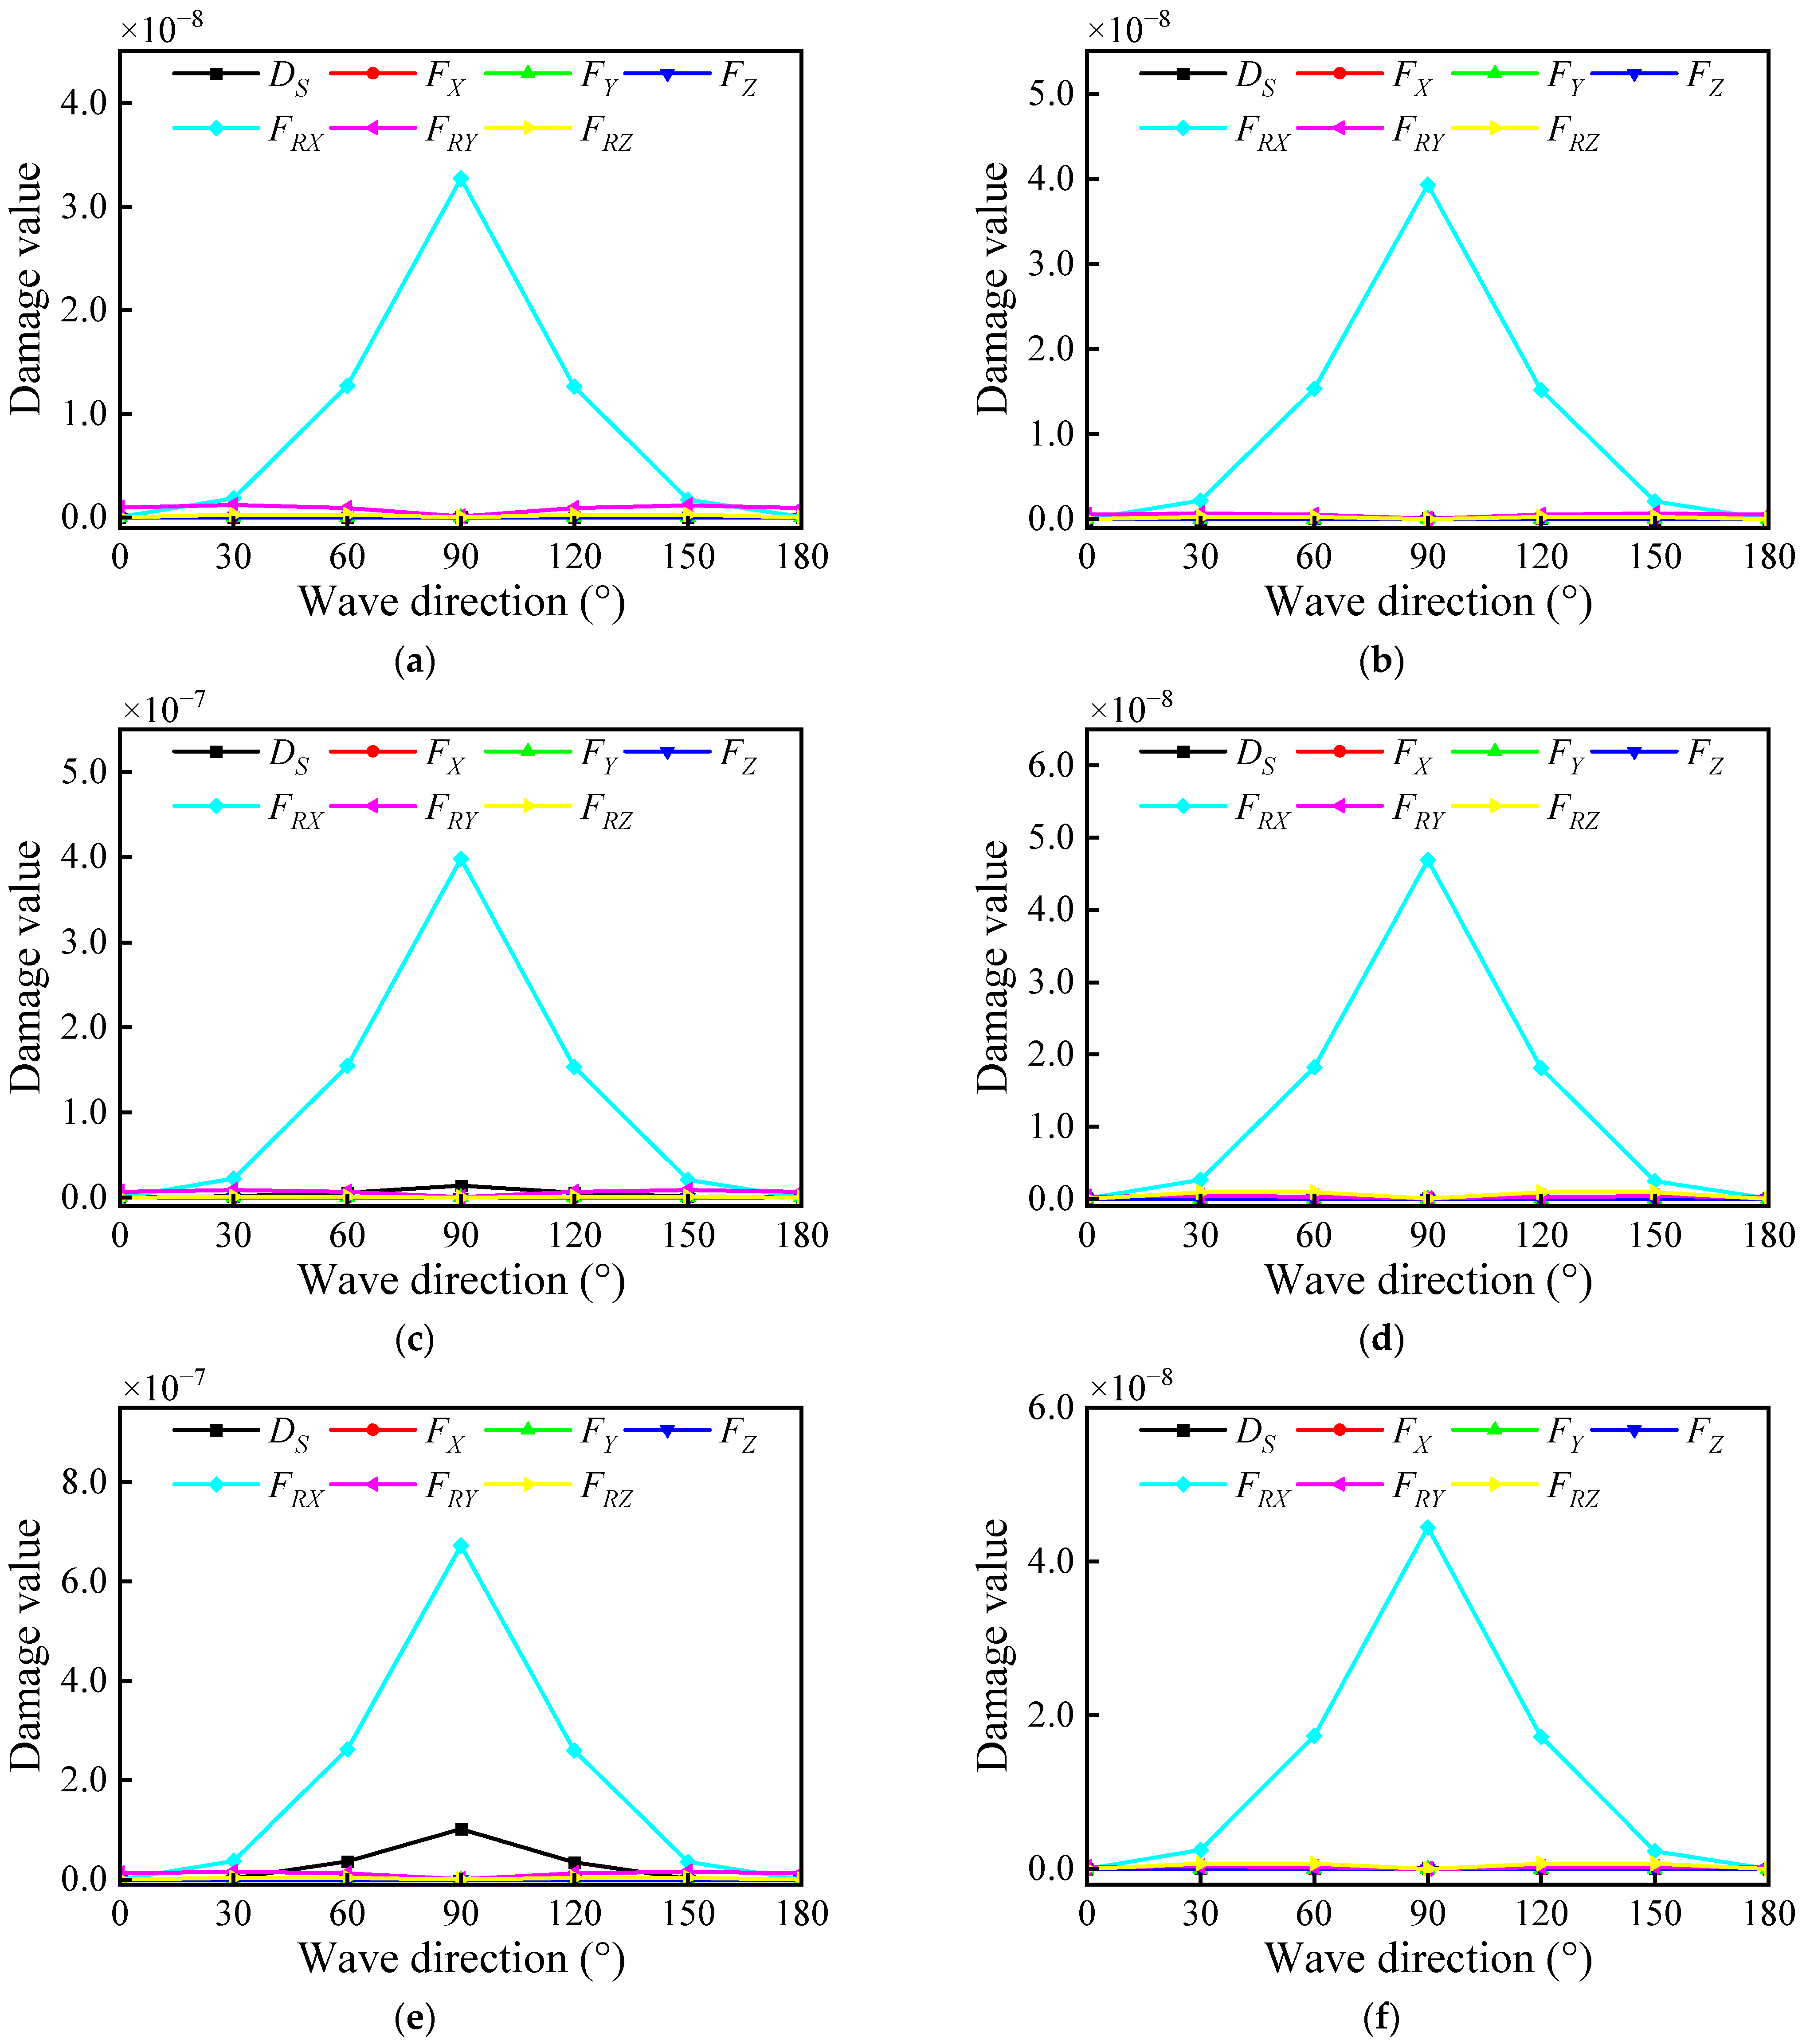
  • Among the dynamic loads induced by the marine environment, roll inertial force had the most significant impact on RPV fatigue damage, followed by pitch inertial force, while the effects of translational inertial forces and hull deformation were relatively minor.
  • The contribution of different dynamic loads to RPV fatigue damage varied significantly with wave direction. In beam seas, roll inertial force caused the highest fatigue damage. In head seas, pitch inertial force caused the highest fatigue damage.
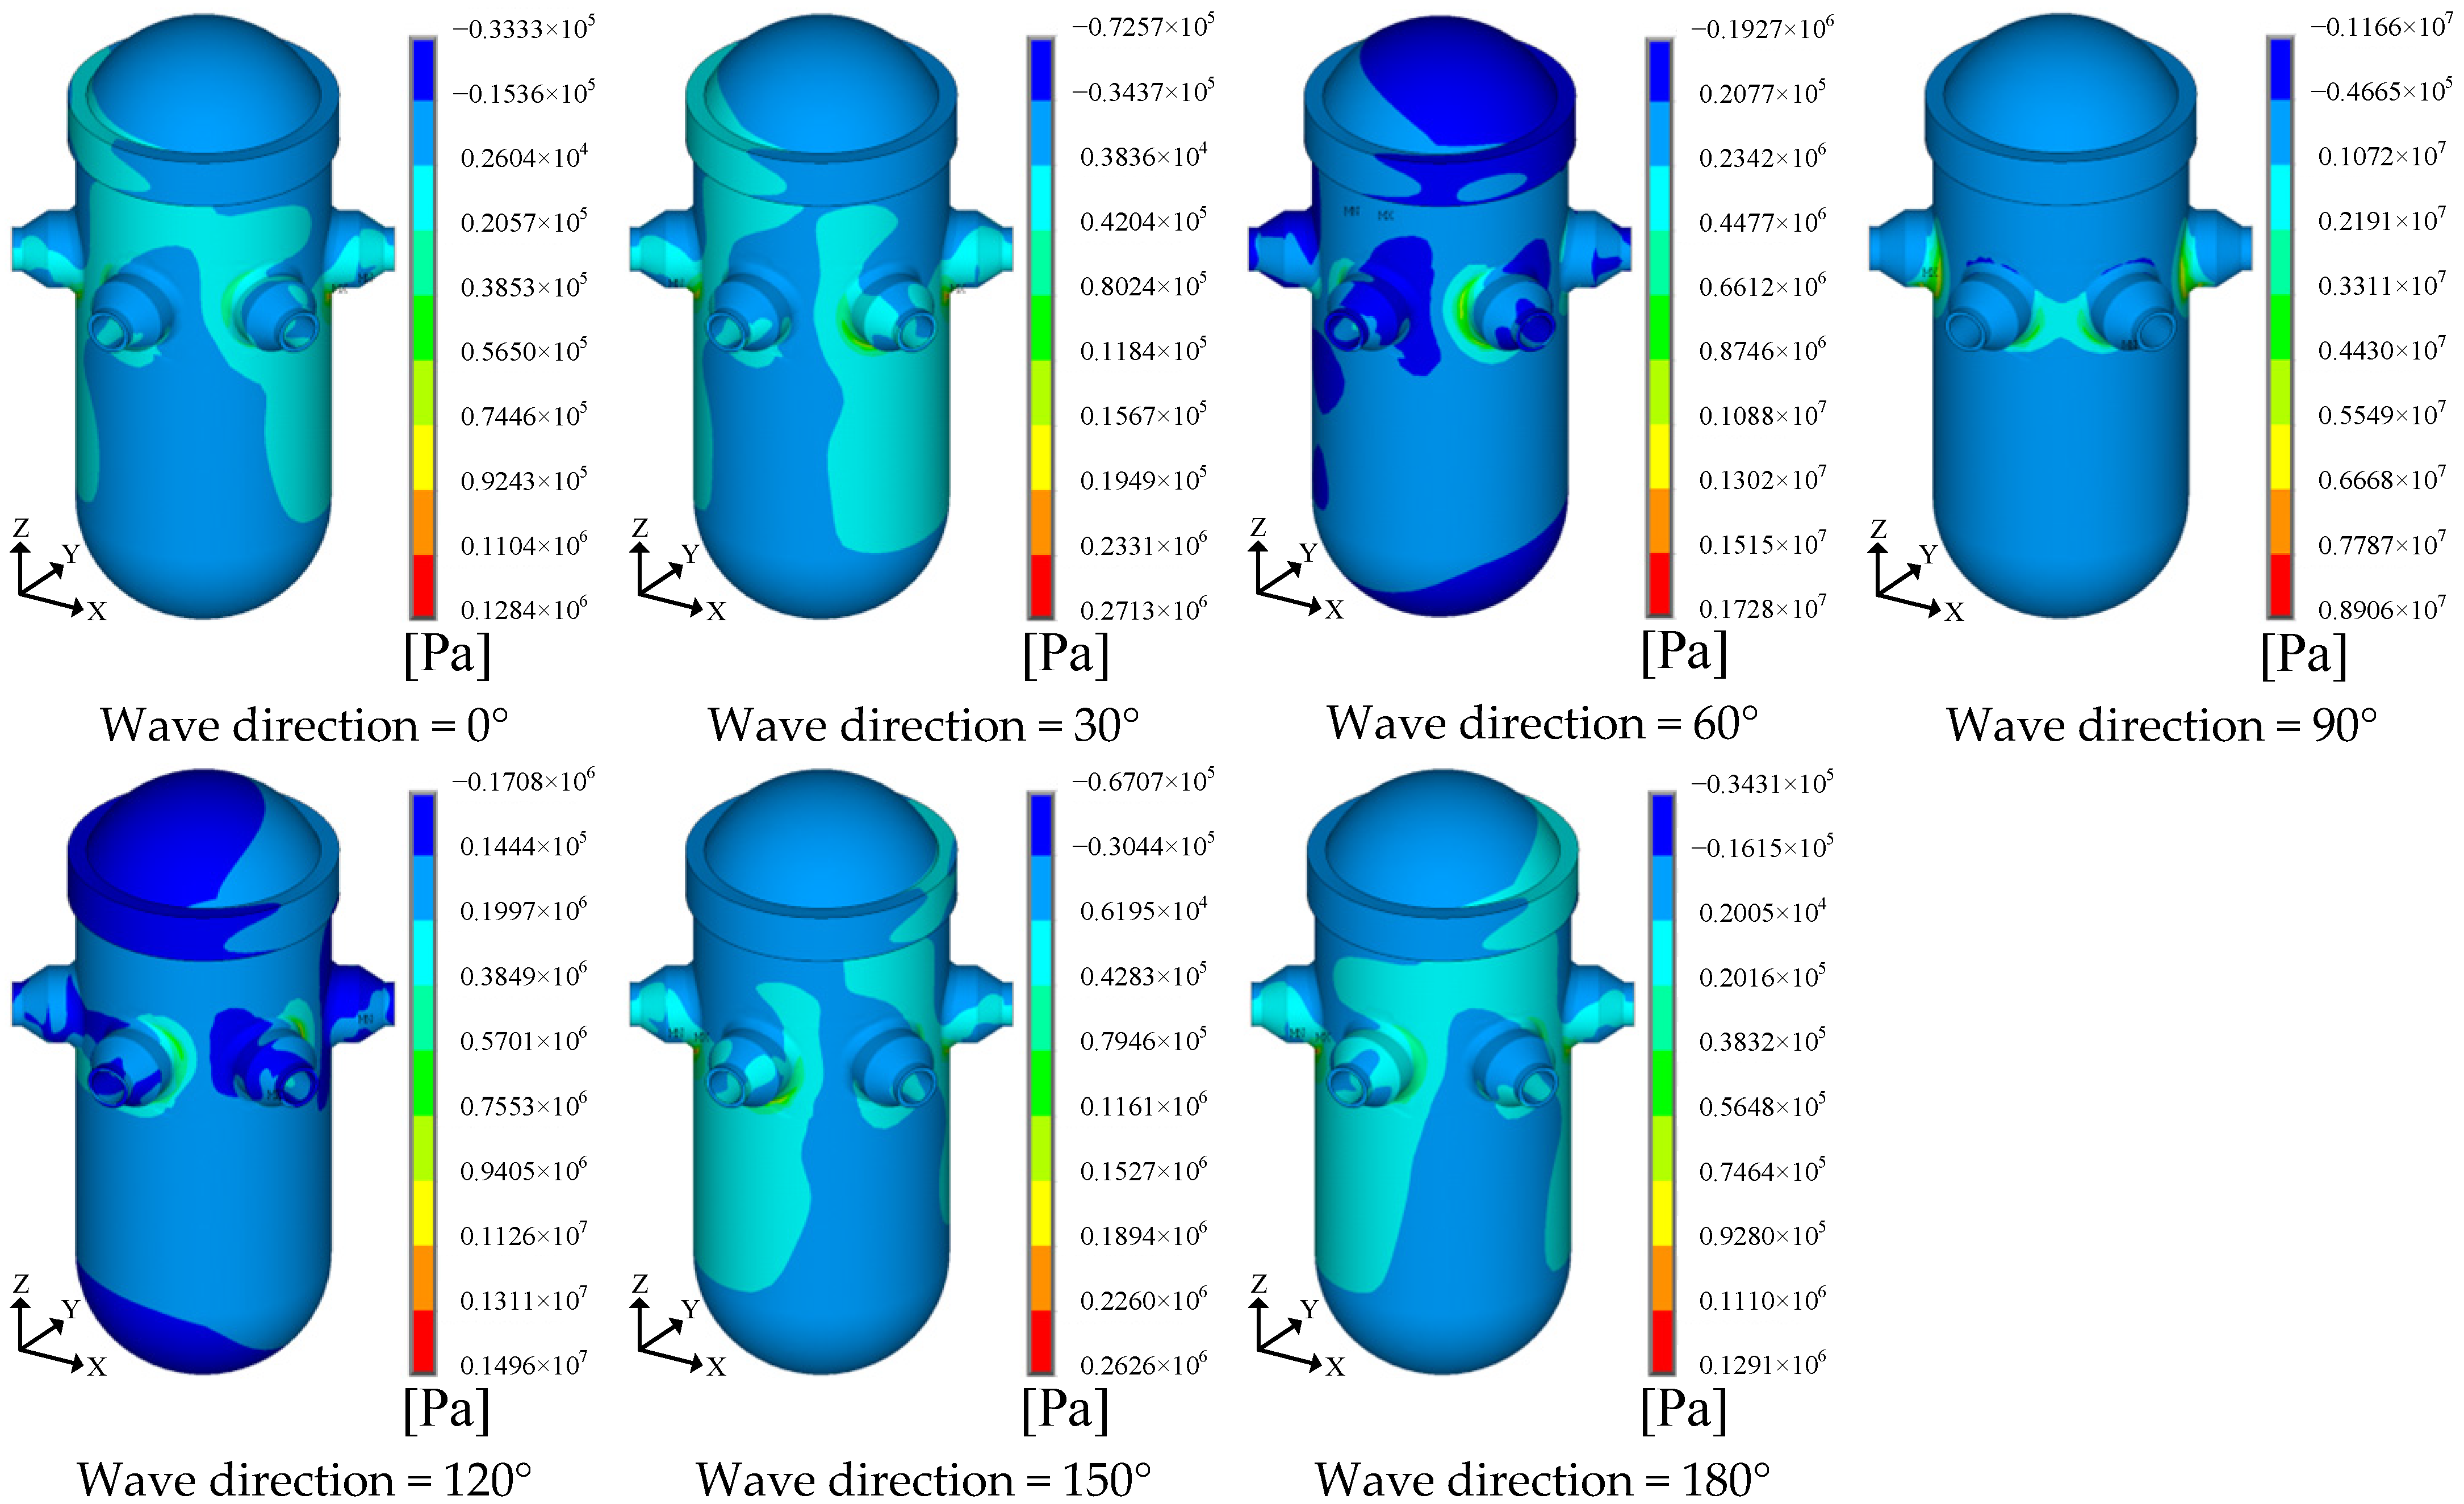
  • Under the 100-year return period extreme sea state, stress analysis based on the design wave method showed the following: The maximum stress occurred at the nozzle connection of the RPV. Rotational inertial forces induced significantly higher stresses than wave pressure and translational inertial forces, making them the dominant contributors to RPV structural strength.
  • Unlike land-based nuclear power plants, the RPV in an FNPP must account for additional dynamic loads from the marine environment in strength and fatigue analyses. In addition to conventional thermal-pressure loads, hull deformation and inertial forces must be considered. Due to the large geometric scale of FNPPs, full-scale ship models must be used for hull deformation calculations, leading to high computational costs in RPV strength and fatigue analysis. To reduce computational expense, simplified models should be adopted, considering only the primary influencing factors.
  • This study focused exclusively on the effects of the marine environment on the RPV structure, without considering thermal-pressure loads. Therefore, under a 100-year return period sea state, the calculated RPV stress was far below the yield strength of the material. Under typical sea conditions, the calculated fatigue damage of the RPV was also minimal, indicating an almost infinite fatigue life. This suggested that with the current structural design, the RPV did not face strength or fatigue failure issues when considering only marine environmental effects. In actual structural assessments, thermal-pressure loads must be incorporated, along with long-term operational conditions, for a more comprehensive evaluation.

Author Contributions

F.M., conceptualization, methodology, software, formal analysis, writing- original draft, validation, data curation, and visualization; M.Z., funding acquisition, project administration, investigation, and writing—review and editing; X.Q., supervision and resources. All authors have read and agreed to the published version of the manuscript.

Funding

This work was sponsored and supported by the Leading Innovation Project of China National Nuclear Corporation (KY90200220002).

Data Availability Statement

The original contributions presented in this study are included in the article material. Further inquiries can be directed to the corresponding author.

Conflicts of Interest

The authors declare no conflicts of interest.

References

  1. Mcginty, F.C. Nuclear Power Plants and Maintainability. Hum. Factors 1965, 7, 355–361. [Google Scholar] [CrossRef] [PubMed]
  2. Vujić, J.; Bergmann, R.M.; Škoda, R.; Miletić, M. Small Modular Reactors: Simpler, Safer, Cheaper? Energy 2012, 45, 288–295. [Google Scholar] [CrossRef]
  3. Zhao, S.; Song, Y. A Development Overview of National and International Floating Nuclear Power Plant. Prog. Rep. China Nucl. Sci. Technol. 2017, 5, 93–98. [Google Scholar]
  4. Li, Q.; Song, D.; Zeng, W.; CHEN, Z.; Liu, J.; Wang, D.; Xiao, R. Overall Design and Verification of ACP100S Floating Nuclear Power Plant. Nucl. Power Eng. 2020, 41, 189–192. [Google Scholar]
  5. Collins, J.A. Failure of Materials in Mechanical Design: Analysis, Prediction, Prevention; John Wiley: Hoboken, NJ, USA, 1993. [Google Scholar]
  6. Li, Z.; Mao, W.; Ringsberg, J.W.; Johnson, E.; Storhaug, G. A Comparative Study of Fatigue Assessments of Container Ship Structures Using Various Direct Calculation Approaches. Ocean. Eng. 2014, 82, 65–74. [Google Scholar] [CrossRef]
  7. Garbatov, Y.; Ås, S.K.; Den Besten, H.; Haselbach, P.; Kahl, A.; Karr, D.; Kim, M.H.; Liu, J.; Lourenço de Souza, M.I.; Mao, W. Committee III. 2: Fatigue and Fracture. In Proceedings of the International Ship and Offshore Structures Congress, Vancouver, BC, Canada, 11–15 September 2022; p. D011S001R007. [Google Scholar]
  8. Mukhtar, A.; Khattak, M.A.; Rafique, A.F.; Zareen, N. Reactor Pressure Vessel (RPV) Design and Fabrication: A Literature Review. J. Adv. Res. Appl. Mech. 2016, 22, 1–12. [Google Scholar]
  9. Tachibana, Y.; Nakagawa, S.; Iyoku, T. Reactor Pressure Vessel Design of the High Temperature Engineering Test Reactor. Nucl. Eng. Des. 2004, 233, 103–112. [Google Scholar] [CrossRef]
  10. Törrönen, K.; Cullen, W.H. Effect of Light-Water Reactor Environments on Fatigue Crack Growth Rate in Reactor Pressure Vessel Steels; ASTM International: West Conshohocken, PA, USA, 1982. [Google Scholar] [CrossRef]
  11. Seifert, H.P.; Ritter, S. Stress Corrosion Cracking of Low-Alloy Reactor Pressure Vessel Steels under Boiling Water Reactor Conditions. J. Nucl. Mater. 2008, 372, 114–131. [Google Scholar] [CrossRef]
  12. DNV-CG-0129; Fatigue Assessment of Ship Structures. DNV AS: Høvik, Norway, 2021.
  13. ASME. Code Boiler and Pressure Vessel Code; ASME: New York, NY, USA, 2001. [Google Scholar]
  14. RCC-MR. Design and Manufacturing Rules for Fast Reactors. In AFCEN (June 1985), in Sell to AFNOR; AFNOR: Paris, France, 1985. [Google Scholar]
  15. Ma, F.; Li, H.; Zhang, M.; Qu, X. A Quasi Time-Domain Method for Fatigue Analysis of Reactor Pressure Vessels in Floating Nuclear Power Plants in Marine Environments. J. Mar. Sci. Eng. 2024, 12, 2085. [Google Scholar] [CrossRef]
  16. Yuan, J.; Ma, F.; Zhang, M.; Shen, K.; Tang, J. The Time-Domain Design Stress Method for Fatigue Analysis of the Reactor Pressure Vessel in Floating Nuclear Power Plants. J. Mar. Sci. Eng. 2025, 13, 235. [Google Scholar] [CrossRef]
  17. Shen, K.; Ma, F.; Yuan, J.; Zhang, M. A Damage Combination Method for Fatigue Analysis of Pressure Equipment in Floating Nuclear Power Plants. J. Mar. Sci. Eng. 2025, 13, 236. [Google Scholar] [CrossRef]
  18. Veritas, D.N. Hull Structural Design Ships with Length 100 Metres and Above. In DNV Rules for Classification of Ships; DNV: Byrum, Norway, 2009. [Google Scholar]
  19. Phelps, B.P. Determination of Wave Loads for Ship Structural Analysis; Aeronautical and Maritime Research Laboratory: Melbourne, Australia, 1997. [Google Scholar]
  20. You, Z. Unified Approach for Estimation of Return Ocean Wave Height. Oceanol. Limnol. Sin. 2022, 53, 1015–1025. [Google Scholar]
Figure 1. FNPP operational site location.
Jmse 13 00795 g001
Figure 2. Offshore and onshore facility locations.
Jmse 13 00795 g002
Figure 3. Topographic features of the operational region.
Jmse 13 00795 g003
Figure 4. Finite element model of the FNPP hull.
Jmse 13 00795 g004
Figure 5. Internal structure of the FNPP hull.
Jmse 13 00795 g005
Figure 6. Internal structure of the containment vessel.
Jmse 13 00795 g006
Figure 7. Finite element model of the RPV.
Jmse 13 00795 g007
Figure 8. Connection between the RPV and the FNPP.
Jmse 13 00795 g008
Figure 9. Hydrodynamic analysis model.
Jmse 13 00795 g009
Figure 10. Motion RAO. (a) Surge. (b) Sway. (c) Heave. (d) Roll. (e) Pitch. (f) Yaw.
Jmse 13 00795 g010
Figure 11. S–N curve for the RPV material.
Jmse 13 00795 g011
Figure 12. Locations of fatigue evaluation points.
Jmse 13 00795 g012
Figure 13. Fatigue damage at different evaluation points under condition 1. (a) Check point 1. (b) Check point 2. (c) Check point 3. (d) Check point 4. (e) Check point 5. (f) Check point 6.
Jmse 13 00795 g013
Figure 14. Fatigue damage at different evaluation points under condition 2. (a) Check point 1. (b) Check point 2. (c) Check point 3. (d) Check point 4. (e) Check point 5. (f) Check point 6.
Jmse 13 00795 g014
Figure 15. Stress distribution due to wave dynamic pressure.
Jmse 13 00795 g015
Figure 16. Stress distribution due to surge inertial force.
Jmse 13 00795 g016
Figure 17. Stress distribution due to sway inertial force.
Jmse 13 00795 g017
Figure 18. Stress distribution due to heave inertial force.
Jmse 13 00795 g018
Figure 19. Stress distribution due to pitch inertial force.
Jmse 13 00795 g019
Figure 20. Stress distribution due to roll inertial force.
Jmse 13 00795 g020
Figure 21. Stress distribution due to yaw inertial force.
Jmse 13 00795 g021
Table 1. Extreme wave heights and related parameters for different return periods.
Return PeriodHs (m)Hmax (m)Tz (s)Ts (s)
1 year3.76.46.47.3
10 years4.37.56.97.9
50 years4.68.07.38.3
100 years4.88.47.48.4
500 years5.29.07.88.9
Table 2. Predicted vertical bending moments at midship for different wave directions.
Wave Direction (°) Predicted   Vertical   Bending   Moment   ( 10 8 ·N·m) Max   Response   Under   Unit   Wave   Amplitude   ( 10 8 ·N)
012.896.19
3018.965.42
6026.744.32
903.170.56
12025.504.13
15018.985.43
18013.066.21
Table 3. Design wave parameters for 100-year return period.
Wave Direction (°)Wave Height (m)Period (s)Phase (°)
04.216.3172.9
307.015.0168.8
6012.49.0128.7
9011.29.0−74.7
12012.49.5135.2
1507.015.0170.7
1804.216.3174.6
Disclaimer/Publisher’s Note: The statements, opinions and data contained in all publications are solely those of the individual author(s) and contributor(s) and not of MDPI and/or the editor(s). MDPI and/or the editor(s) disclaim responsibility for any injury to people or property resulting from any ideas, methods, instructions or products referred to in the content.

