Abstract
Submerged vegetation plays a crucial role in influencing flow hydrodynamics, generating turbulence, and shaping velocity distributions in aquatic environments. This study investigates the hydrodynamic effects of submerged rigid vegetation, specifically focusing on the local flow and turbulence alterations resulting from the removal of a single stem from an otherwise uniform vegetation array under controlled laboratory conditions. Experiments were conducted in a flume using Acoustic Doppler Velocimetry (ADV) to measure 3D (three-dimensional) flow characteristics, turbulence intensities, Reynolds shear stress (RSS), and quadrant analysis. In the fully vegetated scenario, vegetation significantly modified flow conditions, creating inflexion points and distinct peaks in velocity profiles, turbulence intensity, and RSS—particularly near two-thirds of the vegetation height—due to wake vortices and flow separation. The removal of a single stem introduced a localised gap, which redistributed turbulent energy, increased RSS and near-bed turbulent interactions, and disrupted the organised vortex structures downstream. While sweep and ejection events near the gap reached magnitudes similar to those in the fully vegetated setup, they lacked the characteristic coherent peaks linked to vortex generation. Overall, turbulence intensities and RSS were reduced, indicating a smoother flow regime and weaker energy redistribution mechanisms. These findings critically impact river restoration, flood management, and habitat conservation. By understanding how vegetation gaps alter flow hydrodynamics, engineers and ecologists can optimise vegetation placement in waterways to enhance flow efficiency, sediment transport, and aquatic ecosystem stability. This study bridges fundamental fluid mechanics with real-world applications in environmental hydraulics.
1. Introduction
Vegetation provides critical benefits such as habitat provision, nutrient cycling, and erosion control in natural streams [1,2,3]. Understanding the intricate interplay between vegetation and flow hydrodynamics is fundamental for effective ecosystem management and conservation efforts [4], as well as for engineering applications such as river restoration, flood control, and water quality management. The interaction between submerged vegetation and hydrodynamic flow is influenced by channel morphology, vegetation density, and the stiffness characteristics of vegetative elements [5,6]. Previous studies have extensively explored the interaction between aquatic vegetation and hydrodynamic flow, focusing on the effects of vegetation on flow resistance and turbulence structures. Experimental investigations often use artificial vegetation models, such as cylindrical rods or flexible blades, arranged in various configurations, including staggered, aligned, or random patterns [7,8,9,10,11,12]. These studies crucially reveal that vegetation modifies flow structures, generating turbulence and specific wake pattern downstream. Furthermore, the spatial arrangement of vegetation significantly influences the intensity and distribution of turbulence, with compact configurations creating stronger localised turbulence and open spaces allowing for more extensive wake development [13,14]. Vegetation density and spacing significantly influence flow properties in open channels, particularly turbulence intensity, velocity distribution, and Reynolds shear stress (RSS). Studies have shown that denser vegetation patches tend to reduce velocities within the vegetated zones while increasing turbulence intensity and Reynolds shear stress near the patch edges, whereas more open patches allow for greater flow uniformity and reduced turbulence [5,15]. Compact vegetation patches tend to reduce velocities within the vegetated zone while increasing turbulence intensity near the edges and downstream [7,15,16]. Conversely, open spaces within vegetation patches can disrupt the uniformity of flow, leading to complex turbulence structures that vary spatially. Such configurations result in changes to the velocity profiles, shear stress, and the overall flow hydrodynamics [17]. Despite extensive research on vegetated flows, many studies focus primarily on uniform or fully vegetated setups.
Pioneering work by Nepf established fundamental frameworks for drag and turbulence scaling in dense vegetation canopies [6], while Ghisalberti and Nepf characterised the characteristic Kelvin-Helmholtz type vortices at canopy interfaces [18]. Subsequent investigations by Dupuis [15] systematically quantified the combined effects of bed friction and cylinder drag in emergent vegetation scenarios [6], and Panigrahi and Khatua developed predictive models for velocity distribution in rigid vegetated channels [8]. However, these studies predominantly examined continuous, homogeneous vegetation patches. Some authors recently have attention turned to heterogeneous arrangements, as demonstrated by Anjum and Tanaka, who analysed hydrodynamic discontinuities in sparse vegetation patches [19]. The current understanding of partial vegetation configurations remains comparatively limited, particularly regarding the localised effects of single-element removal on three-dimensional flow restructuring. Previous studies have not sufficiently addressed how isolated vegetation gaps influence turbulence patterns. Huai investigated the velocity distribution in an open channel with submerged rigid vegetation using two different discharges [20]. Measurements were performed between two adjacent vegetation rows and at another point along the vegetation row. The results from their study evidenced that the velocity in the adjacent location is higher than that within the vegetation row, attributed to the increased strong eddies experienced by the latter. Further, their study showed an increase in velocity in the region below the vegetation, while a reduction in velocity was observed at the region above the vegetation. This resulted from the vortices and horseshoe reduction [20]. Liu modelled a submerged canopy patch made up of stiff cylinder components and subjected them to an open channel flow with a fully developed turbulent flow. They concluded that sediment deposition and vegetation evolution are significantly influenced by the flow over submerged canopy regions of finite size [21]. In the investigation of the drag properties of rigid submerged vegetation patches, Liu discovered that the presence of the free end of a submerged cylinder array increases wake entrainment as vegetation density rises [21]. John investigated flow turbulence presented by different vegetation spacing sizes within a submerged vegetation patch. Observations revealed that over 10% of eddy size is generated within the vegetated zone of compact vegetations as compared with fewer vegetations. Significant turbulence structure variation is also observed at the points in the non-vegetated row. The findings from burst-cycle analysis show that the sweep and outward interaction events are dominant, where they further increase away from the bed. The effect of vegetation on the turbulent burst cycle is most obvious up to approximately two-thirds of vegetation height, where this phenomenon is also observed for most other turbulent structures [5].
Limited attention has been directed toward understanding the specific impacts of partial vegetation configurations, in which individual elements are removed from the array. Such scenarios are essential to investigate flow structures evolvement, turbulence generation, and hydrodynamic patterns alteration in response to varying spatial configurations [8,22]. This study aims to address the above-mentioned gaps by investigating the 3D flow characteristics influenced by submerged rigid vegetations under controlled experimental environment. In particular, it examines the hydrodynamic impacts of removing a single vegetation element from a fully vegetated array. Using ADV, this research evaluates velocity profiles, turbulence intensity, Reynolds shear stress, and quadrant analysis under different configurations. By studying turbulence cavity formation, i.e., characteristics of turbulence created in the void left by removed vegetation and associated flow pattern, the findings serve the purpose to advance knowledge in hydraulic flow management and ecological conservation. Understanding these dynamics can help improve the design of channels to optimise flow efficiency and control sediment transport, ensuring better performance in water management systems. Furthermore, the results provide valuable insights into partial vegetation configuration impact to aquatic habitats, such as by affecting nutrient distribution and maintaining the stability of ecosystems. These contributions are essential for balancing engineering needs with environmental sustainability. Incorporating Oke’s [23] classification of flow regimes based on obstacle separation can enhance the understanding of how vegetation influences flow dynamics. Oke identifies three primary flow regimes—isolated roughness, wake interference, and skimming flow—each characterised by distinct interactions between airflow and urban structures. In the context of our study, the presence of vegetation stems introduces complexities that may align with or deviate from these regimes, thereby affecting flow patterns and turbulence characteristics. By examining the findings through the lens of Oke’s framework, we can better contextualise the impact of vegetation on flow behaviour and contribute to the broader discourse on urban climate design.
2. Materials and Methods
2.1. Experimental Setup
Laboratory experiments were conducted in the hydraulic laboratory at the University of Bradford, utilising a dynamic flume-based setting to represent hydrodynamic conditions. The experiments were performed in a rectangular flume by Armfield Ltd., Ringwood, UK with dimensions of 12 m in length, 0.45 m in width, and 0.5 m in depth. The flume, which featured a smooth bed and a fixed slope of 0.0033, is depicted in Figure 1. The flume operated under steady open channel flow, with water recirculated via a filtering tank system to maintain consistent flow. Adjustable-speed pumps regulated the discharge, while upstream and downstream gates controlled the water depth. The flume’s glass walls ensured clear visibility, while the stainless-steel base provided a smooth and durable surface that minimised boundary-layer turbulence and offered smooth roughness and friction resistance for consistent smooth-bed experimental observations. The incident velocity (U0 = 0.077 m3/s) was established under uniform flow conditions prior to vegetation installation. To mitigate acoustic interference from vegetation stems, the nearest measurement point was positioned 10 cm radially from individual stems. Proximity to stems (<5 cm) resulted in signal-to-noise ratio (SNR) degradation due to the utilised Acoustic Doppler Velocimeter (ADV) signal reflection, as documented in similar vegetated flow studies [6]. The ADV was manufactured by Nortek Ltd., Rud, Norway.
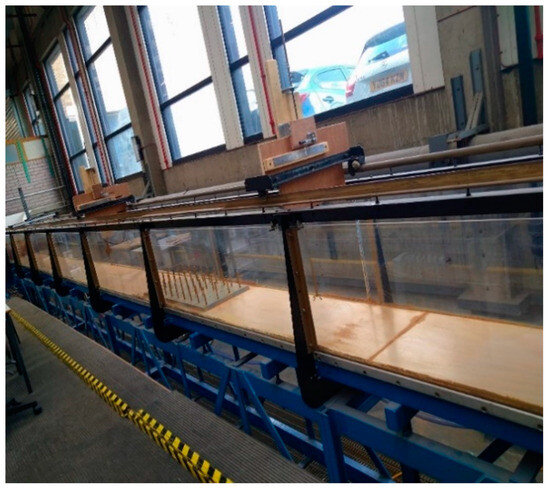
Figure 1.
The rectangular flume in the hydraulic lab.
2.2. Vegetation Configuration
A vegetation plate was securely affixed to the flume bed. The plate measured 0.4 m in width and 1 m in length, with a thickness of 2 cm, and contained 40 rigid stems arranged in a grid with a centre-to-centre spacing of 10 cm. Each stem had a diameter (D) of 1 cm and a vertical length (L) of 10 cm, extending upward from the plate to simulate submerged vegetation. This results in a diameter-to-length ratio (D/L) of 0.1, as illustrated in Figure 2 and flow condition in Appendix A and Figure A1 and Figure A2. This clarification distinguishes the vertical stem length from the horizontal spacing between stems. This configuration was designed to represent the flow resistance and turbulence characteristics of natural aquatic plants in a simplified and controlled manner. The 2 cm thickness of the plate was selected to ensure structural stability and uniform stem anchoring. However, we acknowledge that this elevation may introduce a minor step at the leading edge, potentially causing a localised recirculation zone. This effect was minimised by ensuring a smooth transition between the flume bed and the plate edges. Additionally, velocity measurements in the upstream and inter-vegetation regions did not show significant anomalies attributable to plate-induced separation, indicating that its influence on the bulk velocity field was negligible. While natural aquatic plants exhibit a wide range of shapes, sizes, and flexibilities, the chosen diameter and length are within the range of values reported for various submerged plant species. For example, the stems of common aquatic plants like Elodea, Myriophyllum, and Potamogeton can have diameters ranging from a few millimetres to over a centimetre, and lengths ranging from a few centimetres to over a metre [23,24,25].
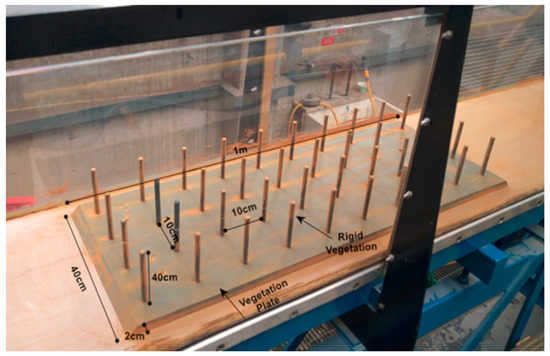
Figure 2.
Vegetation patch with 40 rigid vegetation stems.
The selected D/L ratio of 0.1 is also representative of the typical slenderness of many aquatic plant stems. This ratio is important because it influences the drag coefficient and the flow patterns around the vegetation elements [26]. A slender stem with a low D/L ratio, like the one used in this study, tends to generate less drag and create more streamlined flow patterns compared to a thicker stem with a higher D/L ratio [27]. Furthermore, the rigid nature of the cylinders used in this study simplifies the experimental setup and analysis while still capturing the essential flow resistance characteristics of submerged vegetation. While natural plants exhibit varying degrees of flexibility, their overall impact on flow dynamics is often dominated by their stem drag, which is well-represented by rigid cylinders. To minimise the potential influence of wall effects on the flow dynamics within the vegetated region, the vegetation plate was constructed with a width slightly narrower than that of the flume (0.40 m vs. 0.45 m). This design choice aimed to reduce the interference of boundary layer effects associated with the flume walls on the flow patterns within the vegetated zone. To assess the extent of any residual wall effects, flow velocities were measured at points near the flume walls. The analysis of these measurements revealed no discernible influence of the walls on the flow behaviour in the vegetated region. This observation suggests that the slightly narrower width of the vegetation plate effectively mitigated wall effects, allowing for a more focused investigation of the flow-vegetation interactions. The density of the vegetation patch was characterised by the solid volume fraction which represents the proportion of the total volume of the patch that is occupied by the solid stems. It is calculated as the ratio of the combined volume of the stems to the total volume of the patch, including both the stems and the void spaces, calculated as follows:
where is the number of cylinders per unit area of the bed, and d is the diameter of each cylinder. The volume fraction for this experiment signifies that the cylinders occupy 0.78% of the total bed area, which corresponds to realistic field conditions reported for aquatic shrubs and meadows, which have been widely used as a representation of generic aquatic vegetation [4].
2.3. Flow Conditions and Vegetation Spacing
To investigate the effects of flow and vegetation spacing on turbulence and velocity distributions, experimental test was conducted, as detailed in Table 1. This test evaluates its impact on velocity profiles, turbulence intensity, and development of stem-scale vortices. The vegetation patch remained constant across the tests, with uniform spacing between stems to ensure comparability.

Table 1.
Flow condition.
These conditions were selected to mimic realistic scenarios of submerged vegetation in open-channel flow. The flow hydrodynamics was studied under shallow submergence conditions (), where significant turbulence interaction occurs, as noted in previous studies. Here, represents the total water depth, while denotes the height of the vegetation, and can provide a measure to the degree of submergence.
2.4. Acoustic Doppler Velocimetry (ADV)
To capture detailed hydrodynamic data, advanced techniques such as Acoustic Doppler Velocimetry (ADV), Laser Doppler Anemometry (LDA), and Particle Image Velocimetry (PIV) have been widely utilised [6,28]. Among these, ADV is particularly suited for measuring 3D flow characteristics with high temporal resolution, capable of sampling frequencies up to 200 Hz compared to the 25 Hz typically achieved by LDA and PIV [22]. This makes ADV ideal for capturing fine-scale turbulence details and analysing complex flow patterns, such as those influenced by vegetation spacing. For this research endeavour, the Vectrino ADV system from Nortek Ltd., which incorporates both side-look and down-look probes, were utilised. The side-look probe’s operational range was confined to a 5 cm transverse area, a factor that limited data acquisition at specific points. In contrast, the down-look probe was designed to effectively capture measurements up to 5 cm beneath the water’s surface, thus enabling data collection at the points that a side-look probe cannot calculate, yet it could not measure within the water column’s upper 5 cm. The strategic combination of the side-look and down-look probes in the Vectrino ADV system allowed for an exhaustive and detailed data collection of hydrodynamics flow. For most of the points side-look probe was used for the measurements as it allows the calculation for most of the points starting from the flume bed till 17 cm. Yet for some point using it was not possible due to the presence of vegetation stem (points D and F), for these points down-look probe was used.
The ADV probe was positioned using a precise mounting system that allowed for accurate control of its location within the flume. Measurements were taken at various points within the flow field, as illustrated in Figure 3. The measurement started at 0.5 cm from the bed and was repeated at 1 cm intervals until reaching the water surface. The side-look probe’s operational range was confined to a 5 cm transverse area, a factor that limited data acquisition at specific points. The Nortek Vectrino 3D ADV was set to record instantaneous hydrodynamic flow velocities at a high sampling rate of 100 Hz. This sampling frequency ensured the capture of fine-scale turbulent fluctuations and provided a rich dataset for analysis. To ensure high-fidelity data, the ADV signal quality was continuously monitored. A signal-to-noise ratio (SNR) of no less than 20 and a signal correlation within the range of 60–80% were maintained throughout the experiments. Each sampling session lasted 5 min, efficiently capturing 35,000 velocity data points while maintaining an SNR above the threshold of 70%. This duration was found to be sufficiently large to achieve statistically stationary time-averaged velocity and turbulence parameters. Each test was repeated multiple times to ensure the reliability and reproducibility of the measurements. The consistent results across these repetitions confirmed the robustness of our findings. To further enhance the quality of the data, ADV checks were systematically performed. Additionally, in scenarios where the signal-to-noise ratio (SNR) was low, extra readings were systematically added. This approach helped to improve the clarity of the data, ensuring that the measurements accurately represented the true flow dynamics without interference from background noise. By implementing these rigorous validation techniques, to ensured that experimental results were both accurate and reliable.
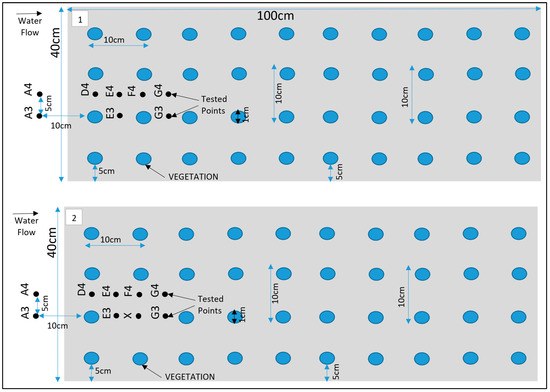
Figure 3.
Schematic for Test (1), fully vegetated; Test (2), with one vegetation stem removed.
2.5. Analysis of Flow Hydrodynamics
The flow hydrodynamics were characterised using the shear velocity, calculated from the zero-pressure gradient approach
where is the hydraulic radius, is the bed slope, is the gravitational acceleration. The 3D flow velocities measured by the ADV were represented using their components along the axial transverse , and lateral directions. Fluctuating velocities along these respective directions are denoted as , , and .
These components can be expressed as follows:
where represents the instantaneous velocity at a specific point in the fluid, represents the mean velocity, and represents the fluctuating velocity [29]. Similarly, the relationships for and velocity components can be described using their respective mean and fluctuating components. Turbulence intensity () quantifies the magnitude of velocity fluctuations relative to the mean velocity and is an essential parameter for understanding turbulent flow dynamics [30]. The turbulence intensities along different directions are calculated as follows:
where represent the root mean square (RMS) values of velocity fluctuations along the respective axes. Similarly, the relationships for and components can be described using their respective mean square RMS components. Reynolds shear stress () is a critical parameter for analysing the transfer of momentum due to turbulence along the streamwise and vertical directions. It quantifies the interaction between axial () and radial () velocity fluctuations and is expressed as follows:
where represents the shear stress, is the fluid density, and is the time-averaged product of the fluctuating velocities in the axial and radial directions [30]. Two experimental scenarios were considered in this study to investigate the hydrodynamic effects of submerged rigid vegetation. The first scenario, referred to as Test 1, served as the benchmark, featuring a fully vegetated patch with 40 stems arranged in a uniform grid as shown in Figure 3. The second scenario, Test 2, explored the impact of removing one vegetation stem from the patch. The decision to investigate the removal of a single stem was made to simplify the analysis and isolate the effects of localised vegetation irregularities on flow behaviour. This case represents a common scenario in natural aquatic systems, where vegetation is not always uniform due to plant growth, physical disturbances, or mortality. Focusing on a single stem removal allows for a clearer understanding of the hydrodynamic changes caused by such disturbances without the added complexity of multiple gaps or large-scale changes in vegetation structure. Moreover, it is representative of disturbances that may occur naturally, where gaps in vegetation are typically isolated rather than widespread.
The investigation of turbulent structures contributing to momentum transport involves the application of quadrant analysis. This analytical technique, extensively discussed by [22], is employed in this study to explore the contribution of turbulent events, velocity fluctuation and Reynolds stress. Quadrant analysis allows for the decomposition of the Reynolds stress into four distinct flow types in the plane, designated as , and , based on the signs of the axial velocity fluctuation () and the radial velocity fluctuation ().
These quadrants represent different flow phenomena at a given point:
- (Outward Interactions): (u′ > 0, w′ > 0)—Upward movement of high-speed fluid.
- (Ejection Events): (u′ < 0, w′ > 0)—Upward movement of low-speed fluid.
- (Inward Interactions): (u′ < 0, w′ < 0)—Downward movement of low-speed fluid.
- (Sweep Events): (u′ > 0, w′ < 0)—Downward movement of high-speed fluid.
Ref. [22] showed the dominance of (ejection) and (sweep) events in regions of high turbulence, such as near obstacles, where turbulent mixing is most pronounced. In this study, quadrant analysis revealed similar patterns, with ejection and sweep events dominating near the vegetation stems and in the stem wakes.
3. Results
During the experimental analysis of Test 1, the velocity exhibited two distinct characteristics, offering a detailed narrative on the complex interactions between turbulent flow and vegetation. These patterns differentiated points directly obstructed by vegetation lines, such as and . from those positioned between adjacent vegetation lines, including , and as illustrated in Figure 3. Together, these observations provided a nuanced understanding of how vegetation impacts flow dynamics within a channel. In Test 2, a single vegetation stem was removed at the location of point X, as depicted in Figure 3, to study its effect on flow behaviour.
3.1. Mean Velocity
3.1.1. Axial Mean Velocity
In this section, the results of the experiments on the hydrodynamic effects of submerged rigid vegetation are presented. Figure 4, Figure 5 and Figure 6 show the mean velocity profiles, turbulent intensity, and Reynolds shear stress for both fully vegetated and partially vegetated conditions. The data collected at key points (A3, A4, D4, E4, F4, G4, E3, and G3), shown in Figure 3, are used to examine the effects of removing a single vegetation stem on the flow characteristics. The introduction of rigid vegetation within the flume significantly altered flow hydrodynamics, as depicted in Figure 4a. At E3 and G3, which are located after the first and second vegetation pitch in the vegetation line, the axial velocity displayed distinct obstructive features. At E3, the axial mean velocity near the bed increased by 6.5% relative to A3 due to the influence of horseshoe vortices forming around the vegetation stems. This effect intensified higher in the vegetation zone, peaking at a 15% rise compared to the undisturbed flow at A3. However, a slight velocity dip at approximately two-thirds of the vegetation height reflected energy dissipation from stem-scale turbulence. Above the vegetation, the velocity stabilised, with only a marginal 1% reduction compared to A3. While E3 demonstrated some initial signs of inflexion point development, this behaviour was not fully evident at this location. Instead, the inflexion point was fully developed and clearly observed at G3, where velocity exhibited a distinct decrease near the bed before reaching an inflexion point at approximately 80% of the vegetation height. Beyond this point, the velocity steadily increased until it nearly matched the pre-vegetation flow velocity near the water surface. This recovery shows the interplay between energy dissipation and redirection caused by wake vortices. Between vegetation lines, such as D4, E4, F4, and G4, distinct velocity patterns emerged due to wake vortex influences. At D4 and F4, the velocity near the bed increased drastically, showing a 50% rise relative to A4. This effect diminished with height, tapering to a 35% increase at two-thirds of the vegetation height and stabilising at 33% in the upper flow region. Conversely, at E4 and G4, flow characteristics closely mirrored those at E3 and G3, respectively, with subtle differences. For instance, E4 experienced only a minor reduction in velocity within the under-vegetation region, as it was less impacted by direct stem interactions. Meanwhile, G4 exhibited a notable inflexion point behaviour similar to G3, where velocity decreased near the bed, reached an inflexion point at approximately 80% of the vegetation height, and subsequently increased to approach pre-vegetation velocity values near the water surface. However, no distinct inflexion point behaviour was observed at points D4, E4, and F4, indicating a more uniform flow pattern in these regions.

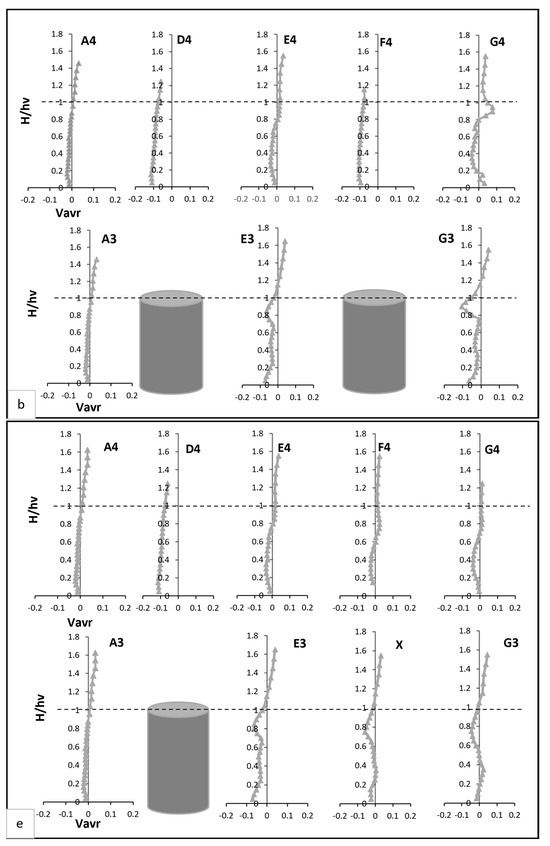
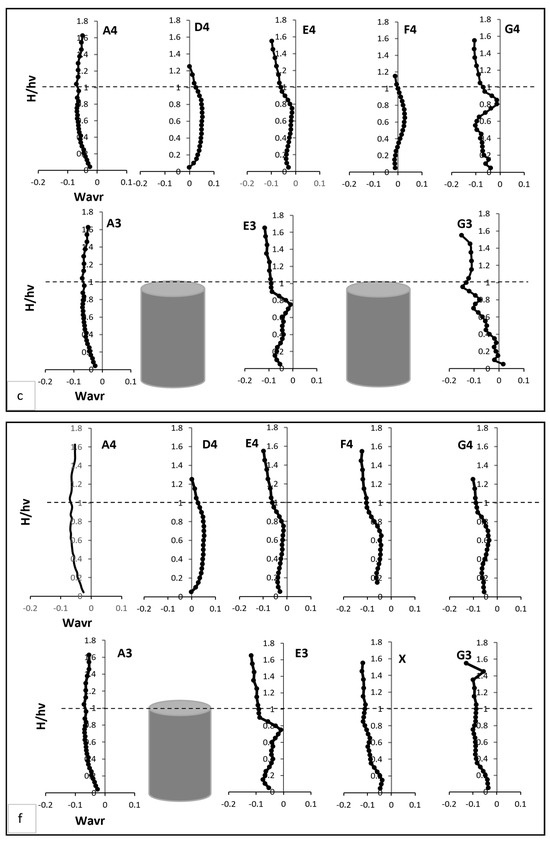
Figure 4.
(a,c,e) present the mean axial, transverse, and radial velocities, respectively, for Test 1 (fully vegetated). (b,d,f) demonstrate the mean axial, transverse, and radial velocities for Test 2 (with one vegetation stem removed). The points shown in the figure (A3, A4, D4, E4, F4, G4, E3, and G3) are referenced in Figure 3.

Figure 5.
Turbulent intensity Test (a), fully vegetated, and Test (b) with one vegetation stem removed; the points shown in the figure (A3, A4, D4, E4, F4, G4, E3, and G3) are referenced in Figure 3.
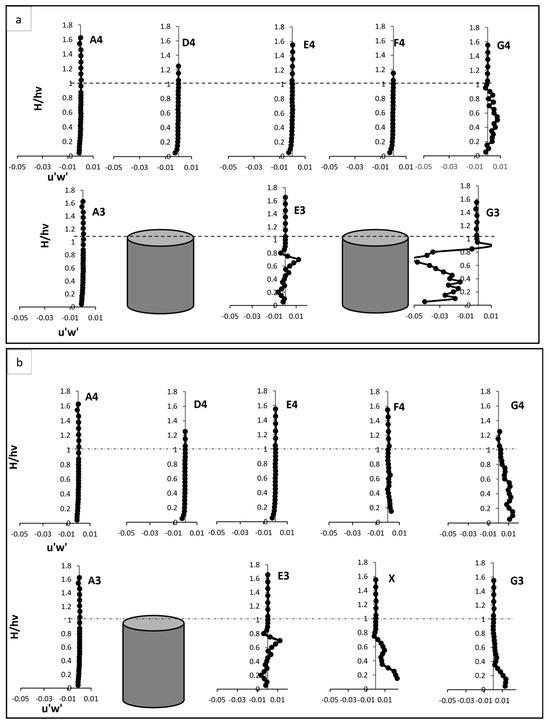
Figure 6.
Reynold shear stress, Test (a) fully vegetated, and Test (b) with one vegetation stem removed. The points shown in the figure (A3, A4, D4, E4, F4, G4, E3, and G3) are referenced in Figure 3.
3.1.2. Transverse Mean Velocity
Pre-vegetation points, such as A3 and A4, exhibited distinct negative velocity profiles near the bed, as shown in Figure 4b. These profiles stemmed from boundary layer effects, where the no-slip condition at the solid boundary created velocity gradients perpendicular to the main flow. This resulted in localised vortices, producing negative transverse velocities. As noted by [30] transitions from negative to positive velocities at mid-water height indicate eddy formation in the transverse plane, with eddy rotation transitioning from clockwise to anticlockwise directions. Within the vegetated zone, transverse velocity profiles at and G3 revealed distinct behaviours, as illustrated in Figure 4b. At E3, transverse velocity started significantly lower—nearly four times less—than at A3 but steadily increased, eventually doubling A3’s value near the end of the vegetation zone. The profile displayed fluctuations, including a steep rise followed by a sharp drop at two-thirds of the vegetation height, where velocity reached nearly 15 times the value at A3. By contrast, G3’s profile was smoother, aligning more closely with A3 above the vegetation. Between vegetation lines, D4 and F4 displayed consistently negative transverse velocities near the bed, approximately five times greater than at A4. These velocities gradually increased with height, peaking at three times A4 at two-thirds of the vegetation height. At E4 and G4, transverse velocities closely matched A4 near the bed but deviated significantly in the mid-vegetation zone, where velocities were twice those of A4. At two-thirds of the vegetation height, G4 recorded velocities six times greater than A4, illustrating enhanced lateral momentum transfer.
3.1.3. Radial Mean Velocity
Radial velocity profiles revealed additional insights into flow interactions with vegetation, as shown in Figure 4c. Pre-vegetation points predominantly exhibited negative radial velocities; indicative of downward-directed water movement driven by boundary layer effects. At E3, radial velocity began 18% lower than at A3, reflecting enhanced downward deflection caused by vegetation drag. This velocity peaked at two-thirds of the vegetation height, reaching twice the value at A3, corresponding to vortex shedding and localised upward flows. Above the vegetation, E3’s velocity returned to a predominantly negative trajectory, registering values nearly double those at A3. At G3, radial velocity followed a distinct pattern, starting positive and progressively declining through the vegetation zone. Subtle increases occurred at two-thirds of the vegetation height and near the water surface, illustrating spatial dependencies in flow-vegetation interactions. Between vegetation clusters, D4 and F4 exhibited strong upward trends in radial velocity in the mid-vegetation zone, with D4 showing the highest vertical momentum transfer. Conversely, E4 and G4 recorded more subdued radial velocities, reflecting reduced vertical disturbances in these regions.
3.1.4. Impact of Vegetation Removal
The removal of a single vegetation stem introduced a void at point X, significantly altering velocity profiles at X and surrounding points (E3, G3, D4, E4, F4, and G4), referring to Figure 4d. While no significant changes were observed at point E3 following the vegetation pitch removal, the void at point X and the behaviour at point G3 exhibited noticeable differences. At point X, the axial velocity increased slightly near the bed compared to E3 in Test 1. This reflected localised acceleration of flow through the unobstructed void. Higher in the water column, this effect diminished, with velocity stabilising near the top of the vegetation zone. At G3, the axial velocity demonstrated a tendency to recover, increasing to match the value at E3 without an inflexion point, as observed in Test 1. Initially, velocity decreased near the bed before increasing progressively until it matched the pre-vegetation value at the top of the vegetation height, stabilising thereafter towards the water surface. This behaviour is attributed to the disruption of uniform flow caused by the void. However, this reduction was confined to the under-vegetation region, with velocities above the vegetation recovering to Test 1 levels. At D4 and F4, axial velocity near the bed increased by 15–20%, reflecting redirected flow into the inter-vegetation regions. Above the vegetation, velocity stabilised in the outer flow region. At E4 and G4, changes were minimal, with slight reductions near the bed stabilising above the vegetation.
Transverse velocity at point X decreased near bed but increased in the mid-vegetation zone due to redistribution of flow toward the sidewalls. Above the vegetation, it aligned with velocities at E4, reflecting minimal disturbance in the outer flow region. At E3 and G3, reduced transverse velocity fluctuations indicated a more uniform lateral flow compared to Test 1 Figure 4e. D4 and F4 maintained negative transverse velocities near bed but exhibited an upward trend in the mid-vegetation zone. At E4 and G4, transverse velocity moderately increased in the mid-vegetation zone, demonstrating the redistributed lateral flow from the void. Radial velocity at point X was strongly negative near the bed due to deflected flow from adjacent stems. At two-thirds of the vegetation height, this is attributed to the elimination of strong upstream turbulence sources, improved energy distribution, stabilisation of shear layers, reduced vertical momentum exchange, and the natural restoration of uniform flow as shown in Figure 4f. At D4 and F4, a stronger upward radial velocity trend was observed in the mid-vegetation zone, indicating enhanced vertical mixing. Conversely, E4 and G4 exhibited more subdued radial velocities, disclosing reduced vertical disturbances compared to Test 1.
3.2. Turbulent Intensity
The removal of one vegetation stem significantly influenced the turbulent intensity profiles across the measured points, altering the flow dynamics in both the immediate vicinity of the void and the surrounding regions. These changes are evaluated through and turbulent intensities refer to Figure 5a,b. In the fully vegetated scenario, exhibited peaks near the vegetation base and at two-thirds of the vegetation height, corresponding to primary and secondary vortices. Primary vortices form near the vegetation base are caused by the shear layer that develops at the boundary between the slower-moving flow within the vegetation and the faster-moving flow in the open channel. These vortices are large and highly energetic, driving significant momentum exchange and turbulence generation near bed [6]. On the hand, secondary vortices develop higher in the water column, around two-thirds of the vegetation height, as a result of wake interactions between adjacent vegetation stems. These vortices are weaker and less energetic than the primary vortices but are critical for redistributing turbulence and influencing mid-column flow dynamics. The turbulent intensity peaks correspond to these vortices because the regions of high align with the zones where these vortices dominate the flow. At and G3, the peaks were especially prominent, with G3 reaching its highest intensity, 15 times of A3 at two-thirds of the vegetation height. This indicates strong interactions between the primary and secondary vortices. The interaction between these vortices is superposed, where the turbulence generated by the primary vortices influences the secondary vortices, amplifying the overall turbulence and increasing energy dissipation [6]. Above the vegetation, diminished sharply as the flow stabilised, with reduced turbulence due to the absence of significant flow obstructions. When the vegetation stem was removed, the streamwise intensity at point X increased markedly near the bed due to flow acceleration in the unobstructed space. However, the absence of vegetation disrupted the development of secondary vortices, leading to diminished peaks at two-thirds of the vegetation height. At and G3, decreased in the under-vegetation region compared to the fully vegetated case, resulting in reduced turbulence. Above the vegetation, the recovery zone exhibited quicker stabilisation, indicative of smoother flow dynamics as the superposed interaction of vortices diminished.
The removal of the vegetation stem also affected the lateral turbulent intensity which demonstrated lateral flow interactions. In the fully vegetated scenario, E3 and displayed increased near the vegetation base due to flow diversion around stems, which gradually diminishing above the vegetations as energy shifted predominantly into the streamwise flow. D4 and F4 showed elevated near bed, attributed to wake interactions with a steady decline as height increased. Following vegetation removal, at point X was reduced near bed compared to the fully vegetated case, reflecting the absence of lateral deflection caused by the missing stem. At E3 and G3, lateral disturbances were reduced, resulting in smoother transitions of compared to the fully vegetated scenario. However, at D4 and F4, a slight increase in near bed was observed due to redirected flow into the inter-vegetation spaces created by the void.
Vertical turbulent intensity also demonstrated significant changes. In the fully vegetated case, E3 and G3 exhibited two distinct peaks in , one near the vegetation base and another at two-thirds of the vegetation height. The first peak near the vegetation base is indicative of primary disturbances, which result from shear layers forming at the interface between the slower-moving flow within the vegetation and the faster-moving flow outside it. These shear layers generate vortices that drive turbulence close to the bed. The second peak at two-thirds of the vegetation height is associated with secondary interactions caused by wake effects from upstream stems. These secondary interactions occur as turbulent eddies generated by the vegetation elements propagate within the vegetated zone and interact with the local flow, amplifying turbulence in the mid-vegetation zone. At G3 which is influenced by intensified wake vortices from adjacent stems, the vertical turbulence reached its highest levels. Above the vegetation, stabilised to levels comparable to A3, as the flow transitioned into a less turbulent regime with fewer obstructions to disrupt vertical energy transfer. With the vegetation stem removed, the vertical turbulence at all points showed decreased across all heights, reflecting reduced vortex shedding and upward flow disturbances. Meanwhile, at and , vertical turbulent intensity increased in the mid-vegetation zone, suggesting enhanced upward momentum transfer caused by wake interactions. Further, at E4 and G4, was generally reduced, consistent with the diminished vertical disturbances resulting from the vegetation gap. The removal of the vegetation stem redistributed turbulent energy across the field flow. At point X, the removal intensified streamwise turbulence near bed but reduced lateral and vertical turbulence due to the absence of direct interactions by a stem.
3.3. Reynold Shear Stress
In the fully vegetated scenario, RSS exhibited distinct behaviour, particularly upstream and within the vegetated patch as shown in Figure 6a,b. At points upstream of the vegetation, such as A3 and A4, RSS near bed displayed negative values. This behaviour was attributed to downward motion and reverse flow effects, which are caused by boundary layer interactions. Downward motion occurs when the mainstream flow interacts with obstacles, such as vegetation stems, leading to deflection of the flow toward the bed. This deflection increases near the boundary layer due to pressure gradients created by upstream obstructions. In contrast, reverse flow effects arise when eddies and vortices are generated by boundary shear, causing localised flow to move backward or recirculate near bed. These reverse flows often accompany high turbulence levels and are characteristic of obstructed flow regimes. As the flow rose vertically, RSS transitioned to positive values, indicating the development of shear layers as faster-moving mainstream flow interacted with slower-moving flow zones obstructed by vegetation stems. Within the vegetated zone, i.e., at E3 and G3, RSS increased sharply, reaching a peak near two-thirds of the vegetation height. This peak reflected the intensification of turbulence caused by wake vortices and flow separation around the stems. In particular, E3 exhibited a pronounced rise in RSS, illustrating strong interactions between vortices generated by vegetation stems. Above the vegetation, RSS values diminished gradually, aligning with the pre-vegetation levels observed at A3. These decreases demonstrated the reduced influence of vegetation at higher elevations, where the flow became more uniform.
Points located between vegetation lines, such as D4, E4, F4, and G4, showed a moderate increase in RSS compared to A3 and A4. These increases were linked to the effect of wake interactions and lateral flow redistribution within the vegetated zone. Wake interactions refer to the turbulence generated by flow separation and recirculation as water flows around vegetation stems. This turbulence propagated within the vegetated zone and laterally, indirectly influencing the flow at points located between vegetation lines by increasing shear stress and energy dissipation. Lateral flow redistribution occurs as the presence of vegetation clusters alters the natural flow path, forcing water to move into adjacent open spaces. This redistribution amplifies shear layers in these regions and indirectly elevates RSS, even in areas not directly obstructed by vegetation stems. Peaks in RSS at these points were also observed at two-thirds of the vegetation height, corresponding to secondary turbulence effects, which are generated as wake vortices with the surrounding flow structures and propagate energy through the water column.
The removal of one vegetation stem at point X introduced a void in the vegetative array, altering the RSS distribution across the flow field. At point X, RSS near the bed was notably higher compared to E3 in the fully vegetated case. This reduction result of combined effects of reduced resistance, flow acceleration, and energy redirection caused by the void. In the mid-vegetation zone, RSS values were significantly reduced, suggesting a weaker turbulence generation in the void. Above the vegetation, RSS stabilised more rapidly, showcased the smoother recovery of the flow in the absence of vegetative obstructions. The removal had also cascaded effects on nearby points, such G3. At that point, RSS near bed and within the mid-vegetation zone was positive and higher than in the fully vegetated scenario. These caused the flow acceleration, energy redistribution, intensified vortex dynamics, and altered boundary and shear layer interactions. The peak RSS values observed at two-thirds of the vegetation height in the fully vegetated scenario were notably reduced at G3, reflecting a decrease in vortex intensity due to the absence of the stem. Above the vegetation, RSS returned to pre-vegetation levels, indicating a smoother transition to uniform flow. The inter-vegetation points, such as D4, E4, F4, and G4, displayed unique responses to the removal of the vegetation stem. At D4 and F4, RSS near the bed increased slightly compared to the fully vegetated case. This increase highlighted the redirection of flow into the inter-vegetation region caused by the void. However, at mid-vegetation heights, RSS peaks were lower than in the fully vegetated case, reflecting weaker secondary turbulence. Here, secondary turbulence refers to turbulence generated by the wake vortices and interactions between flow structures originating from upstream vegetation stems and the surrounding flow. At mid-vegetation heights, the absence of the vegetation stem disrupted the formation of these wake vortices, leading to diminished secondary turbulence and lower RSS peaks. Conversely, point G4 exhibited a notable increase in RSS compared to the fully vegetated scenario, illustrating intensified flow dynamics in this region, likely due to the cascading effects of the void, where redirected flow and amplified wake effects contributed to higher turbulence levels.
3.4. Quadrant Analysis
The quadrant analysis for the fully vegetated flow highlights the intricate dynamics of turbulent interactions in the presence of rigid vegetation stems. Each quadrant event—sweep, ejection, inward interaction, and outward interaction—exhibited distinct behaviour across the vertical profile, underscoring the complex interplay between the vegetation and the surrounding flow field. This study uses fluctuated velocity and RSS in quadrant analyses to explore turbulent contributions statistically. Figure 7 and Figure 8 present the quadrant analysis of fluctuated velocity and Reynolds shear stress, respectively, for both fully vegetated and partially vegetated conditions. The results for Test 1 (fully vegetated) are shown for both vegetation lines (A3, E3, G3) and between vegetation lines (A4, D4, E4, F4, G4), while the results for Test 2 (with one vegetation stem removed) are shown for vegetation lines (A3, E3, X, G3) and between vegetation lines (A4, D4, E4, F4, G4). The data points in these figures are referenced in Figure 3.
Figure 7.
Quadrant analysis (Fluctuated velocity). (a) vegetation line (A3, E3, and G3) for fully vegetated; (b) between vegetation line (A4, D4, E4, F4, and G4) for fully vegetation test; (c) vegetation line (A3, E3, X, and G3) for Test (2) with one vegetation stem removed and (d) between vegetation line (A4, D4, E4, F4, and G4) for Test (2) with one vegetation stem removed. The points shown in the figure (A3, A4, D4, E4, F4, G4, E3, and G3) are referenced in Figure 3.
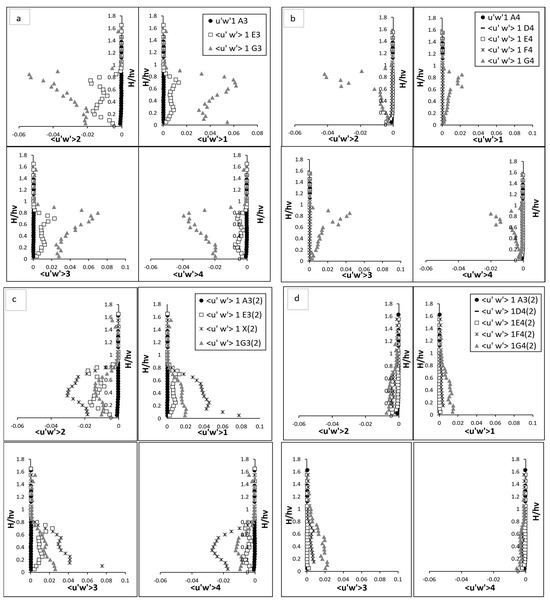
Figure 8.
Quadrant analysis (Reynold shear stress), (a) vegetation line (A3, E3, and G3) for fully vegetated (b) between vegetation line (A4, D4, E4, F4, and G4) for fully vegetation test; and (c) vegetation line (A3, E3, X, and G3) for Test (2) with one vegetation stem removed and (d) between vegetation line (A4, D4, E4, F4, and G4) for Test (2) with one vegetation stem removed. The points shown in the figure (A3, A4, D4, E4, F4, G4, E3, and G3) are referenced in Figure 3.
3.4.1. Fluctuated Velocity
In the upstream region devoid of vegetation, the near bed turbulence was dominated by sweep events as illustrated in Figure 7. These events, characterised by the downward movement of high-momentum fluid from the upper layers into the boundary layer near the bed, became particularly significant due to the interaction of water flow with the boundary layer. The boundary layer, where velocity gradients are highest, enhances the transport of energy and momentum toward the bed during sweep events, intensifying near-bed turbulence and increasing energy dissipation. As the flow moved upward from the bed toward the water surface, both sweep events and outward interaction events increased slightly. Outward interaction events, in contrast to sweeps, represent the upward movement of high-momentum fluid away from the boundary layer into the outer flow. This redistribution of turbulence energy reflects the dynamic interplay between downward and upward motions, which governs the vertical mixing and overall flow structure in the absence of vegetation obstructions. On the hand, the ejection and inward interaction events—representing the upward and downward movements of low-momentum fluid, respectively—showed a declining trend as demonstrated in Figure 7a,b. These observations reflect a relatively balanced flow structure as the influence of boundary-layer effect diminished with elevation. Upon entering the vegetated region, the flow structure transformed significantly. At E3 and G3, the presence of vegetation introduced substantial complexity to the turbulence profiles. For example, sweep events at E3 revealed a distinct sigma-shaped pattern, reflecting the intensified turbulence induced by the vegetation. At near bed region, the magnitude of sweep events surged, peaking twice as observed at the upstream point A3. This surge was driven by the interaction between the flow and the vegetative stems, which created localised vortices. Interestingly, the sweep intensity exhibited a secondary peak at approximately two-thirds of the vegetation height, caused by the merging of wake vortices generated by the vegetation. Above the vegetation zone, the influence of sweep events diminished as the flow stabilised, aligning closely with pre-vegetation conditions.
In contrast, ejection events at E3 exhibited an inverse yet equally dynamic pattern which is the rapid and fluctuating nature of turbulence. These events, which represent the upward transport of low-momentum fluid, initially declined near bed, then reaching a trough before gradually increasing in the mid-vegetation zone. A pronounced rise was observed at two-thirds of the vegetation height, where the interaction between the flow and wake vortices was most intense. Beyond this peak, ejection events stabilised above the vegetation, aligning closely with baseline conditions at A3. The inward and outward interaction events followed similar trends, mirroring the energy redistribution caused by the vegetation. Near to bed, inward interactions were intensified by the downward flow redirected by the stems. These events gradually weakened as the ascended flow, where causing it to stabilise above the vegetation zone. Conversely, outward interactions showed a marked increase in the mid-vegetation zone, driven by the redirection of energy upwards due to flow separation around the stems. Above the canopy, these interactions decreased sharply, reflecting a return to their equilibrium stage. At point G3, located after E3, the influence of vegetation-induced turbulence was even more significant. Sweep and outward interactions reached their maximum intensity at approximately two-thirds of the vegetation height, where their magnitudes were significantly higher than those at A3. This peak reflected the combined effects of vortex shedding and flow separation induced by the vegetation. Beyond this height, the intensity of these events declined as the flow transitioned into the upper layers, gradually returning to baseline conditions. Similarly, ejection and inward interaction at G3 displayed a similar pattern, with their intensity reaching a pronounced low at the same height where sweep and outward interaction peaked. This trough is signified by reduced velocity and high turbulence near the vegetative canopy. As the flow moved away from the vegetation, these interactions recovered, aligning with pre-vegetation values in the upper layers.
At point X in part 2 of Figure 7c,d, sweep events intensified close to the bed, as the lack of obstruction allowed high-momentum fluid to interact directly with the boundary when the stem was removed. This resulted in a sharp peak in sweep intensity near bed, but the absence of the vegetative structure meant there was no secondary peak, i.e., at two-thirds of the vegetation height. Without the stem to generate wake vortices, the turbulence complexity, i.e., as observed in fully vegetated E3, was notably diminished. On the other hand, ejection events at point X exhibited a slightly increased intensity near bed compared to E3 in the fully vegetated case. This increase can be attributed to the enhanced upward transport of low-momentum fluid caused by the flow acceleration through the void. The absence of an obstruction allowed for a more pronounced upward motion in the near bed region, leading to a localised rise in ejection intensity. As the flow ascended towards two-thirds of the vegetation height, the ejection intensity remained high but began to exhibit a gradual decline compared to the fully vegetated case. This behaviour reflects the redistribution of turbulent energy as the flow interacted with neighbouring stems. The redirection of flow around the adjacent vegetation created a less confined environment for upward motion, weakening the intensity of ejection events compared to the initial near bed region. During one stem removed test, the ejection intensity diminished beyond two-thirds of the vegetation height, aligning with the behaviour observed in the fully vegetated scenario. By the time the flow reached the free surface region, ejection events stabilised and recovered to the same values observed in E3 and other upstream points. This convergence at the free surface illustrates the resilience of the flow and its ability to recover to baseline conditions. At G3, the removal of the upstream stem disrupted the energy available for vortex generation. Sweep events still exhibited a primary peak near the bed, but the magnitude of this peak was significantly reduced compared to the fully vegetated scenario. Outward interactions mirrored this trend, with a lower peak intensity at two-thirds of the vegetation height, reflecting diminished wake interactions and less energy redistribution. Ejection and inward interactions at G3 also displayed subdued patterns, with the characteristic trough observed in inward interactions at two-thirds of the vegetation height becoming less pronounced. This indicated the weakening of turbulence-induced interactions typically generated by the missing stem. Further at G4, the flow began to recover towards the patterns observed in the fully vegetated case. Sweep and outward interactions exhibited delayed peaks, occurring slightly higher in the water column. This shift indicated a slower redistribution of turbulent energy downstream from the void. Ejection events at G4 similarly showed delayed recovery, reflecting the persistence of the void’s influence further along the flow.
3.4.2. Reynold Shear Stress
The RSS analysis can reveal the absence impact of a stem to the flow coherency, influencing turbulence generation and energy redistribution throughout the vegetated region. In the upstream regions, at A3 and A4, the flow dynamics remained largely consistent between the fully vegetated and less vegetated cases. Here, turbulence was primarily governed by boundary layer interactions, with sweep and ejection events dominating near bed region. As the depth increased from the boundary, inward and outward interactions played a more significant role. This upper flow behaviour indicates that the removal of a vegetation stem has minimal influence on the hydrodynamics before the vegetated zone is encountered shown in Figure 8a,b. At point X, where the vegetation stem was removed, the absence of obstruction led to a significant increase in all four Reynolds shear stress (RSS) quadrants compared to the fully vegetated scenario at E3. Sweep events, representative to the downward movement of high-momentum fluid, and ejection events, indicative of the upward movement of low-momentum fluid, exhibited substantial increases. Their magnitudes at point X reached levels comparable to G3 in the fully vegetated scenario but lacked the pronounced peak typically observed at two-thirds of the vegetation height. This behaviour reflected the direct influence of the void on RSS, which facilitated a more uniform redistribution of turbulent energy throughout the vertical profile. The absence of stem reduced resistance and vortex interactions, leading to a less constrained flow but with still amplified turbulence. The increases in inward and outward interactions at point X were also evident. Outward interactions, characterised by the outward movement of high-momentum fluid, and inward interactions, indicative of downward movement of low-momentum fluid, both intensified significantly near bed and within the vegetation zone. These interactions reached magnitudes comparable to G3 in the fully vegetated scenario, suggesting that the void acted as a focal point for the redistribution of turbulent energy. However, the lack of a peak at two-thirds of the vegetation height, as observed at G3 in the fully vegetated case, highlights the absence of strong vortex shedding and secondary turbulence generation typically induced by vegetation. At G3, the impact of the removed stem was more significant Figure 8c,d. All four RSS quadrants decreased compared to the fully vegetated scenario, with sweep and ejection events showing reduced magnitudes across the vertical profile. The dual peaks observed in the fully vegetated case at two-thirds of the vegetation height became less pronounced, with the turbulence profile becoming smoother and more aligned with E3. This reduction in RSS intensity suggests that the removal of the stem disrupted the vortex interactions and energy transfer processes that enhanced flow turbulence at G3. The absence of a strong upstream source of turbulence (previously provided by the removed stem) resulted in a less energetic flow at G3.
Between vegetation lines, at points such as D4 and E4, the effects of the vegetation gap were minimal, with almost no discernible changes observed between the fully vegetated and removal scenarios. This consistency indicates that these points were relatively shielded from the influence of the void at point X, with the flow structure remaining largely unaffected. The turbulence interactions at D4 and E4 showed similar magnitudes and trends for both scenarios, reflecting the minimal disturbance in these regions. At F4 and G4, however, the impact of the vegetation gap became more apparent, particularly at G4. Sweep and ejection interactions near bed were reduced compared to the fully vegetated case, with magnitudes approximately half of those observed prior to the stem removal. Notably, the significant peak at two-thirds of the vegetation height, a hallmark of turbulence amplification in the fully vegetated scenario, was absent at G4 in the removal scenario. This absence reflects the diminished coherence of vortex shedding and secondary turbulence generation due to the missing stem. Instead, the turbulence profile at G4 became smoother and less energetic, suggesting that the removal of the stem disrupted the turbulence amplification typically observed in the wake region downstream. Above the vegetation, at F4 and G4, the flow dynamics stabilised and aligned more closely with those observed in the fully vegetated case. This recovery indicates that the effects of the vegetation gap were confined primarily to the lower and mid-vegetation regions, with the upper layers demonstrating resilience to structural changes.
4. Discussion
This part focuses on the impact of a partial vegetation scenario, specifically the removal of a single element and the resulting turbulence cavity formation, which constitutes a key novelty of this work. While extensive literature exists on flow through vegetation [31,32], the detailed analysis of this configuration and its impact on 3D flow profile and quadrant analysis offers a unique contribution to the field, with practical implications for various environmental and engineering applications. The turbulence cavity observed in Test 2 aligns with the vortex dynamics reported by John and Poggi [5,33]. Specifically, the disruption of secondary vortices at two-thirds the vegetation height in Figure 9 mirrors John [5]’s findings, where von Kármán vortices dominate near the bed in dense vegetation but weaken when stems are removed. Poggi [33] similarly noted that sparse canopies exhibit expanded wake zones, explaining the accelerated near-bed flow at point X and the diminished turbulence peaks in our study. This synergy underscores the universality of vegetation-driven flow reorganisation. The results from Test 1 (fully vegetated) confirm previously reported observations [34,35] regarding the significant influence of submerged vegetation on open channel flow. The characteristic velocity profiles, with distinct peaks and dips, reflect the complex interaction between flow obstruction, vortex generation (both primary near the bed and secondary at approximately two-thirds of the vegetation height), and energy dissipation due to stem-scale turbulence. The observed patterns in transverse and radial velocities further illustrate the complex 3D flow structures induced by the vegetation, revealing the importance of considering all three velocity components for a comprehensive understanding of the flow field. The magnitudes and locations of peak turbulent intensities align with the regions of strongest vortex activity, reinforcing the link between coherent structures and turbulence generation. The RSS profiles in Test 1 show the strong shear stresses generated by the interaction of the main flow with the slower-moving water within the vegetation, with peak values coinciding with the areas of high turbulence intensity and vortex activity.
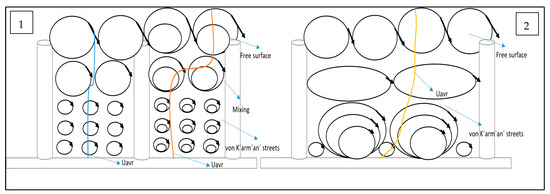
Figure 9.
Conceptual model for (1) fully vegetated and (2) with one stem removed.
The primary focus and novelty of this study lies in the analysis of Test 2, where a single vegetation stem was removed. This seemingly small alteration had a profound impact on the local hydrodynamics. The increase in axial velocity near the bed at point X (the void) is a direct consequence of the reduced flow obstruction. However, the absence of the expected secondary peak in turbulence intensity at two-thirds of the vegetation height reveals the disruption of coherent vortex structures due to the missing stem. This suggests that the secondary vortices are highly sensitive to the regularity of the vegetation array and that even a single gap can significantly alter their formation and evolution. The tendency for axial velocity to recover to upstream values above the vegetation at G3 suggests a gradual return to more uniform flow conditions. The changes observed in the transverse and radial velocities at points surrounding the void (E3, G3, D4, F4, E4, and G4) clearly demonstrate the complex redistribution of flow and the disruption of established flow patterns due to the missing stem. The increase in near-bed axial velocity at D4 and F4 points to the redirection of flow into the inter-vegetation spaces created by the void. The reduction in transverse velocity fluctuations at E3 and G3 indicates a more uniform lateral flow compared to the fully vegetated case.
The analysis of turbulent intensity in Test 2 further underscores the impact of the void. The intensification of streamwise turbulence near the bed at point X, coupled with the diminished peaks at two-thirds of the vegetation height, highlights the disruption of secondary vortex generation. The reduction in turbulent intensity in the under-vegetation region points (E3 and G3) suggests a decrease in overall turbulence levels due to the absence of stem. The changes in lateral and vertical turbulent intensities further illustrate the complex 3D redistribution of turbulent energy caused by the void. The RSS analysis in Test 2 reveals the profound influence of the removed stem on the flow coherency, influencing turbulence generation and energy redistribution. The increased RSS near the bed at point X reflects the reduced resistance and flow acceleration caused by the void. The reduction in RSS at two-thirds of the vegetation height suggests a weakening of turbulence generation in the void. The changes in RSS at points (G3, D4, E4, F4, and G4) further highlight the complex effects of the void on shear stress and turbulence transport. The absence of the significant peak in RSS at two-thirds of the vegetation height at G4 in Test 2 reflects the disruption of coherent vortex shedding and secondary turbulence generation due to the missing stem. The quadrant analysis offers a deeper understanding of the turbulent interactions. The dominance of sweep events near the bed in the upstream region, and the increase in outward interaction events with height in Test 1 align with established understanding of open channel flow. The sigma-shaped pattern of sweep events at E3, and the inverse pattern of ejection events, present the influence of the vegetation on turbulence production. The intensified sweep and outward interactions at G3 reflect the combined effects of vortex shedding and flow separation. The changes observed in quadrant analysis in Test 2, specifically the intensification of sweep events near the bed at point X, and the reduction in sweep and outward interactions at G3 show the influence of the void on the transport of high-momentum fluid, and the reduction in energy available for vortex generation due to the missing stem. The changes in RSS quadrants at point X, and the reduction in all quadrants at G3 in Test 2 further reinforce the observations about turbulence production and transport.
The findings of this study have significant practical implications for various environmental and engineering applications: River restoration projects often involve the reintroduction of vegetation to enhance habitat diversity and improve water quality. This study’s findings on the impact of vegetation gaps on flow structure and turbulence can inform the design and placement of vegetation patches to optimise restoration outcomes. For example, strategically introducing gaps within vegetation patches can promote specific flow patterns that benefit certain fish species or enhance the dispersal of nutrients and sediments. Understanding the influence of vegetation on flow resistance and turbulence is crucial for designing effective flood control measures and mitigating erosion. This study’s findings can help engineers design vegetation schemes that reduce flow velocities and dissipate energy during flood events, minimising erosion and protecting infrastructure. This study has some limitations. The use of rigid vegetation, while simplifying the experimental setup, may not fully represent the complex interactions present with flexible vegetation. The specific configuration of the vegetation array and the single flow condition tested limit the generalisability of the findings. Further research with varying vegetation densities, arrangements, and flow conditions would provide a more complete picture. The study focused on the removal of a single stem; investigating the effects of multiple stem removals or different gap sizes would be a valuable extension. Future research could explore the effects of varying gap sizes and locations within the vegetation patch. Investigating the impact of flexible vegetation and different flow regimes (e.g., varying submergence ratios) would also be valuable. Numerical modelling could complement experimental work, allowing for a more detailed analysis of the complex flow structures and turbulence dynamics. Finally, investigating the ecological implications of partial vegetation configurations, such as their impact on sediment transport, nutrient mixing, and habitat suitability for aquatic organisms, would be a valuable contribution to ecosystem management. The comparative summary of velocity profile, turbulent intensity, Reynolds shear stress and quadrant events between fully vegetated (Test 1) and partially vegetated (Test 2) configurations are presented in Table 2.
Table 2.
Comparative analysis of velocity profile, turbulent intensity, Reynolds shear stress (RSS) and quadrant events between fully vegetated (Test 1) and partially vegetated (Test 2) configurations.
5. Conclusions
This study provides a comprehensive analysis of the hydrodynamic effects of submerged rigid vegetation and the impact of removing a single vegetation stem from a uniform array. The results reveal that fully vegetated regions exhibit pronounced turbulence, with distinct peaks in velocity profiles, turbulence intensity, and Reynolds shear stress at two-thirds of the vegetation height due to wake vortices and flow separation around stems. These findings underscore the critical role of vegetation in generating and sustaining turbulence within aquatic systems.
The removal of a single vegetation stem introduced significant changes to the flow structure. At the void, Reynolds shear stress and turbulent intensity increased near the bed, reflecting the acceleration of flow through the unobstructed space, with axial velocity increasing by 8% near the bed and turbulence intensity rising by 25%. However, the absence of vegetation led to diminished vortex generation and turbulence coherence, particularly at mid-vegetation heights. For instance, turbulence intensity decreased by 40% at mid-vegetation height (G3) and Reynolds shear stress dropped by 40% at the same location, resulting in smoother flow dynamics and reduced energy redistribution. Inter-vegetation regions displayed minimal changes, while far-field points exhibited attenuated turbulence profiles, highlighting the cascading effects of the vegetation gap. Above the vegetation, the flow demonstrated remarkable recovery, aligning with pre-vegetation conditions and illustrating the resilience of the system to structural irregularities. These findings offer valuable insights for several practical applications in environmental and engineering contexts. For river restoration schemes, understanding how strategic vegetation spacing influences flow patterns enables better habitat design while maintaining desired hydraulic characteristics. In flood risk management, the observed turbulence modifications provide guidance for optimising vegetation configurations in floodplains and engineered channels. The study particularly demonstrates how relatively minor adjustments to vegetation density can substantially affect flow hydrodynamics, providing practical knowledge for reconciling ecological and engineering requirements in watercourse management. Furthermore, the quantitative results establish a foundation for more accurate modelling of partially vegetated flows in both natural and artificial waterways.
Author Contributions
Conceptualization, J.H.P.; Methodology, H.M. and J.H.P.; Investigation, H.M. and J.H.P.; Data curation, H.M., P.R.H., B.K., E.H.H.A.-Q. and M.A.M.R.; Writing—original draft, H.M.; Writing—review & editing, J.H.P., P.R.H., B.K., E.H.H.A.-Q. and M.A.M.R.; Supervision, J.H.P.; Project administration, J.H.P.; Funding acquisition, J.H.P. All authors have read and agreed to the published version of the manuscript.
Funding
This research has been funded by the Council for At-Risk Academics (CARA) funding (funding number: TC00038387-W/R 20015509).
Data Availability Statement
The raw data of this study will be provided by the corresponding author on reasonable request. This is due to the study is ongoing, and the authors will need to keep a record to whom the data has been shared with.
Acknowledgments
Authors: Jaan H. Pu and Heba Mals, extend their profound gratitude to the Council for At-Risk Academics (CARA) funding organisation for their invaluable support to this research (reference: TC00038387-W/R 20015509). The funding has been provided by CARA to fund Heba Mals’ PhD study supervised by Jaan H. Pu (project supervisor).
Conflicts of Interest
The authors declare no conflict of interest.
Appendix A
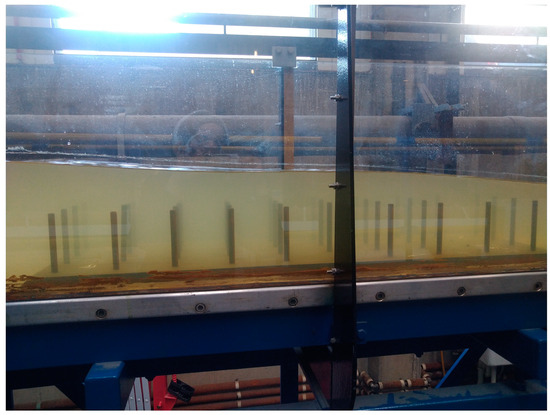
Figure A1.
Experimental flume setup showing submerged rigid vegetation array.
Figure A1.
Experimental flume setup showing submerged rigid vegetation array.

The image captures the side view of the laboratory flume with uniformly distributed rigid vegetation stemssubmerged. The configuration replicates a fully vegetated flow condition, used to analyse the hydrodynamic impact of vegetation presence on flow structure and turbulence characteristics.
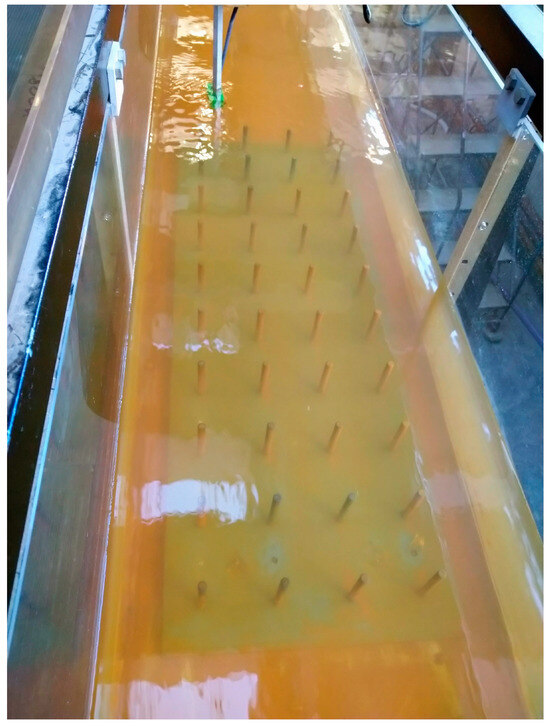
Figure A2.
Top view of the flume setup showing vegetation array.
Figure A2.
Top view of the flume setup showing vegetation array.

This image presents a top-down view of the experimental flume during testing. The uniform arrangement of rigid vegetation stems is visible. The setup is used to investigate the hydrodynamic response, turbulence alterations, and flow redistribution caused by a localised discontinuity in vegetation. The ADV probe is shown in position for velocity.
References
- Jeppesen, E.; Søndergaard, M.; Søndergaard, M.; Christoffersen, K. The Structuring Role of Submerged Macrophytes in Lakes; Springer Science & Business Media: Berlin/Heidelberg, Germany, 2012. [Google Scholar]
- Sheng, Y.P.; Lapetina, A.; Ma, G. The reduction of storm surge by vegetation canopies: Three-dimensional simulations. Geophys. Res. Lett. 2012, 39, L20601. [Google Scholar] [CrossRef]
- Albayrak, I.; Nikora, V.; Miler, O.; O’Hare, M. Flow–plant interactions at leaf, stem and shoot scales: Drag, turbulence, and bio- mechanics. Aquat. Sci. 2014, 76, 269–294. [Google Scholar] [CrossRef]
- Pu, J.H.; Hussain, A.; Guo, Y.; Vardakastanis, N.; Hanmaiahgari, P.; Lam, D. Submerged flexible vegetation impact on open channel flow velocity distribution: An analytical modelling study on drag and friction. Water Sci. Eng. 2019, 12, 121–128. [Google Scholar] [CrossRef]
- John, C.; Pu, J.H.; Guo, Y.; Hanmaiahgari, P.R.; Pandey, M. Flow turbulence presented by different vegetation spacing sizes within a submerged vegetation patch. J. Hydrodyn. 2023, 35, 1131–1145. [Google Scholar] [CrossRef]
- Nepf, H.M. Flow over and through biota. In Treatise on Estuarine and Coastal Science; Elsevier Inc.: San Diego, CA, USA, 2012. [Google Scholar]
- Cheng, N.S.; Nguyen, H.T. Length scale for estimating drag induced by emergent cylindrical rods in open channel flows. AIP Conf. Proc. 2011, 1376, 411–413. [Google Scholar]
- Panigrahi, K.; Khatua, K.K. Prediction of velocity distribution in straight channels with rigid vegetation. Aquat. Procedia 2015, 4, 819–825. [Google Scholar] [CrossRef]
- Maji, S.; Hanmaiahgari, P.; Balachandar, R.; Pu, J.H.; Ricardo, A.M.; Ferreira, R.M.L. A review on hydrodynamics of free surface flows in emergent vegetated channels. Water 2020, 12, 1218. [Google Scholar] [CrossRef]
- Sharil, S.; Mohtar, W.H.M.W.; Razali, S.F.M. Characteristics of flow through rigid, emergent and sparse vegetation. Jurnal Teknologi 2016, 78. [Google Scholar] [CrossRef]
- Chatelain, M.; Proust, S. Open-channel flows through emergent rigid vegetation: Effects of bed roughness and shallowness on the flow structure and surface waves. Phys. Fluids 2021, 33, 106602. [Google Scholar] [CrossRef]
- Pu, J.H. Propeller-induced jet impact on vegetated flow field: Complex coupled effect towards velocity profile. Appl. Sci. 2023, 13, 9000. [Google Scholar] [CrossRef]
- Pu, J.H. Environmental Hydraulics, Turbulence and Sediment Transport. Fluids 2022, 7, 48. [Google Scholar] [CrossRef]
- John, C.; Pu, J.H.; Guo, Y.; Keating, M.; Al-Qadami, E.H.H.; Razi, A.; Hanmaiahgari, P.R. 3D Numerical Modelling and Laboratory Study of Flow Field Induced by A Group of Submerged Vegetations. Ocean. Eng. 2024, 312, 119038. [Google Scholar] [CrossRef]
- Dupuis, V.; Proust, S.; Berni, C.; Paquier, A. Combined effects of bed friction and emergent cylinder drag in open channel flow. Environ. Fluid Mech. 2016, 16, 1173–1193. [Google Scholar] [CrossRef]
- Luhar, M.; Rominger, J.T.; Nepf, H.M. Interaction between flow, transport and vegetation spatial structure. Environ. Fluid Mech. 2008, 8, 423. [Google Scholar] [CrossRef]
- Pu, J.H.; Pandey, M.; Li, J.; Satyanaga, A.; Kundu, S.; Hanmaiahgari, P.R. The Urban Fluvial and Hydro-Environment System. Front. Environ. Sci. 2022, 10, 1075282. [Google Scholar] [CrossRef]
- Ghisalberti, M.; Nepf, H.M. The structure of the shear layer in flows over rigid and flexible canopies. Environ. Fluid Mech. 2006, 6, 277–301. [Google Scholar] [CrossRef]
- Anjum, N.; Tanaka, N. Study on the flow structure around discontinued vertically layered vegetation in an open channel. J. Hydrodyn. 2020, 32, 454–467. [Google Scholar] [CrossRef]
- Huai, W.; Zeng, Y.H.; Xu, Z.G.; Yang, Z.H. Velocity distribution in an open channel with submerged rigid vegetation. J. Hydraul. Res. 2009, 32, 487–492. [Google Scholar]
- Liu, Y.-T.; Han, D.; Ye, Y.; Liu, Y.; Yuan, Y.; He, Z. Impacts of Rigid Vegetation on Gravity Currents Propagating in a Stratified Environment. J. Hydraul. Eng. 2023, 149, 04023051. [Google Scholar]
- Ikani, N.; Pu, J.H.; Taha, T.; Hanmaiahgarib, P.; Penna, N. Bursting phenomenon created by bridge piers group in open channel flow. Environ. Fluid Mech. 2023, 23, 125–140. [Google Scholar] [CrossRef]
- Oke, T.R. Street design and urban canopy layer climate. Energy Build. 1988, 11, 103–113. [Google Scholar] [CrossRef]
- Bouma, T.J.; De Vries, M.B.; Low, E.; Peralta, G.; Tánczos, I.C.; Van de Koppel, J.; Herman, P.M.J. Trade-offs related to ecosystem engineering: A case study on stiffness of emerging macrophytes. Ecology 2005, 86, 2187–2199. [Google Scholar] [CrossRef]
- Nepf, H.M. Flow and Transport in Regions with Aquatic Vegetation. Annu. Rev. Fluid Mech. 2012, 44, 123–142. [Google Scholar] [CrossRef]
- Tanino, Y. Flow and mass transport in vegetated surface waters. In Fluid Mechanics of Environmental Interfaces; CRC Press: Boca Raton, FL, USA, 2012; pp. 369–394. [Google Scholar]
- Lassabatere, L.; Pu, J.H.; Bonakdari, H.; Joannis, C.; Larrarte, F. Velocity distribution in open channel flows: Analytical approach for the outer region. J. Hydraul. Eng. 2013, 139, 37–43. [Google Scholar] [CrossRef]
- Vijayasree, B.; Eldho, T.; Mazumder, B. Turbulence statistics of flow causing scour around circular and oblong piers. J. Hydraul. Res. 2020, 58, 673–686. [Google Scholar] [CrossRef]
- Zhao, T.; Nepf, H. Turbulence and bedload transport in submerged vegetation canopies. Water Resour. Res. 2024, 60, e2024WR037694. [Google Scholar] [CrossRef]
- Chen, M.; Lou, S.; Liu, S.; Ma, G.; Liu, H.; Zhong, G.; Zhang, H. Velocity and turbulence affected by submerged rigid vegetation under waves, currents and combined wave–current flows. Coast. Eng. 2020, 159, 103727. [Google Scholar] [CrossRef]
- Poggi, D.; Porporato, A.; Ridolfi, L.; Albertson, J.D.; Katul, G.G. The effect of vegetation density on canopy sub-layer turbulence. Bound.-Layer Meteorol. 2004, 111, 565–587. [Google Scholar] [CrossRef]
- Wang, J.; He, G.; Dey, S.; Fang, H. Influence of submerged flexible vegetation on turbulence in an open-channel flow. J. Fluid Mech. 2022, 947, A31. [Google Scholar] [CrossRef]
- Zhao, F.; Huai, W. Hydrodynamics of discontinuous rigid submerged vegetation patches in open-channel flow. J. Hydro-Environ. Res. 2016, 12, 148–160. [Google Scholar] [CrossRef]
- Nepf, H.M. Hydrodynamics of vegetated channels. J. Hydraul. Res. 2012, 50, 262–279. [Google Scholar] [CrossRef]
- Ghisalberti, M.; Nepf, H. Shallow Flows Over a Permeable Medium: The Hydrodynamics of Submerged Aquatic Canopies. Transp. Porous Media 2009, 78, 385–402. [Google Scholar] [CrossRef]
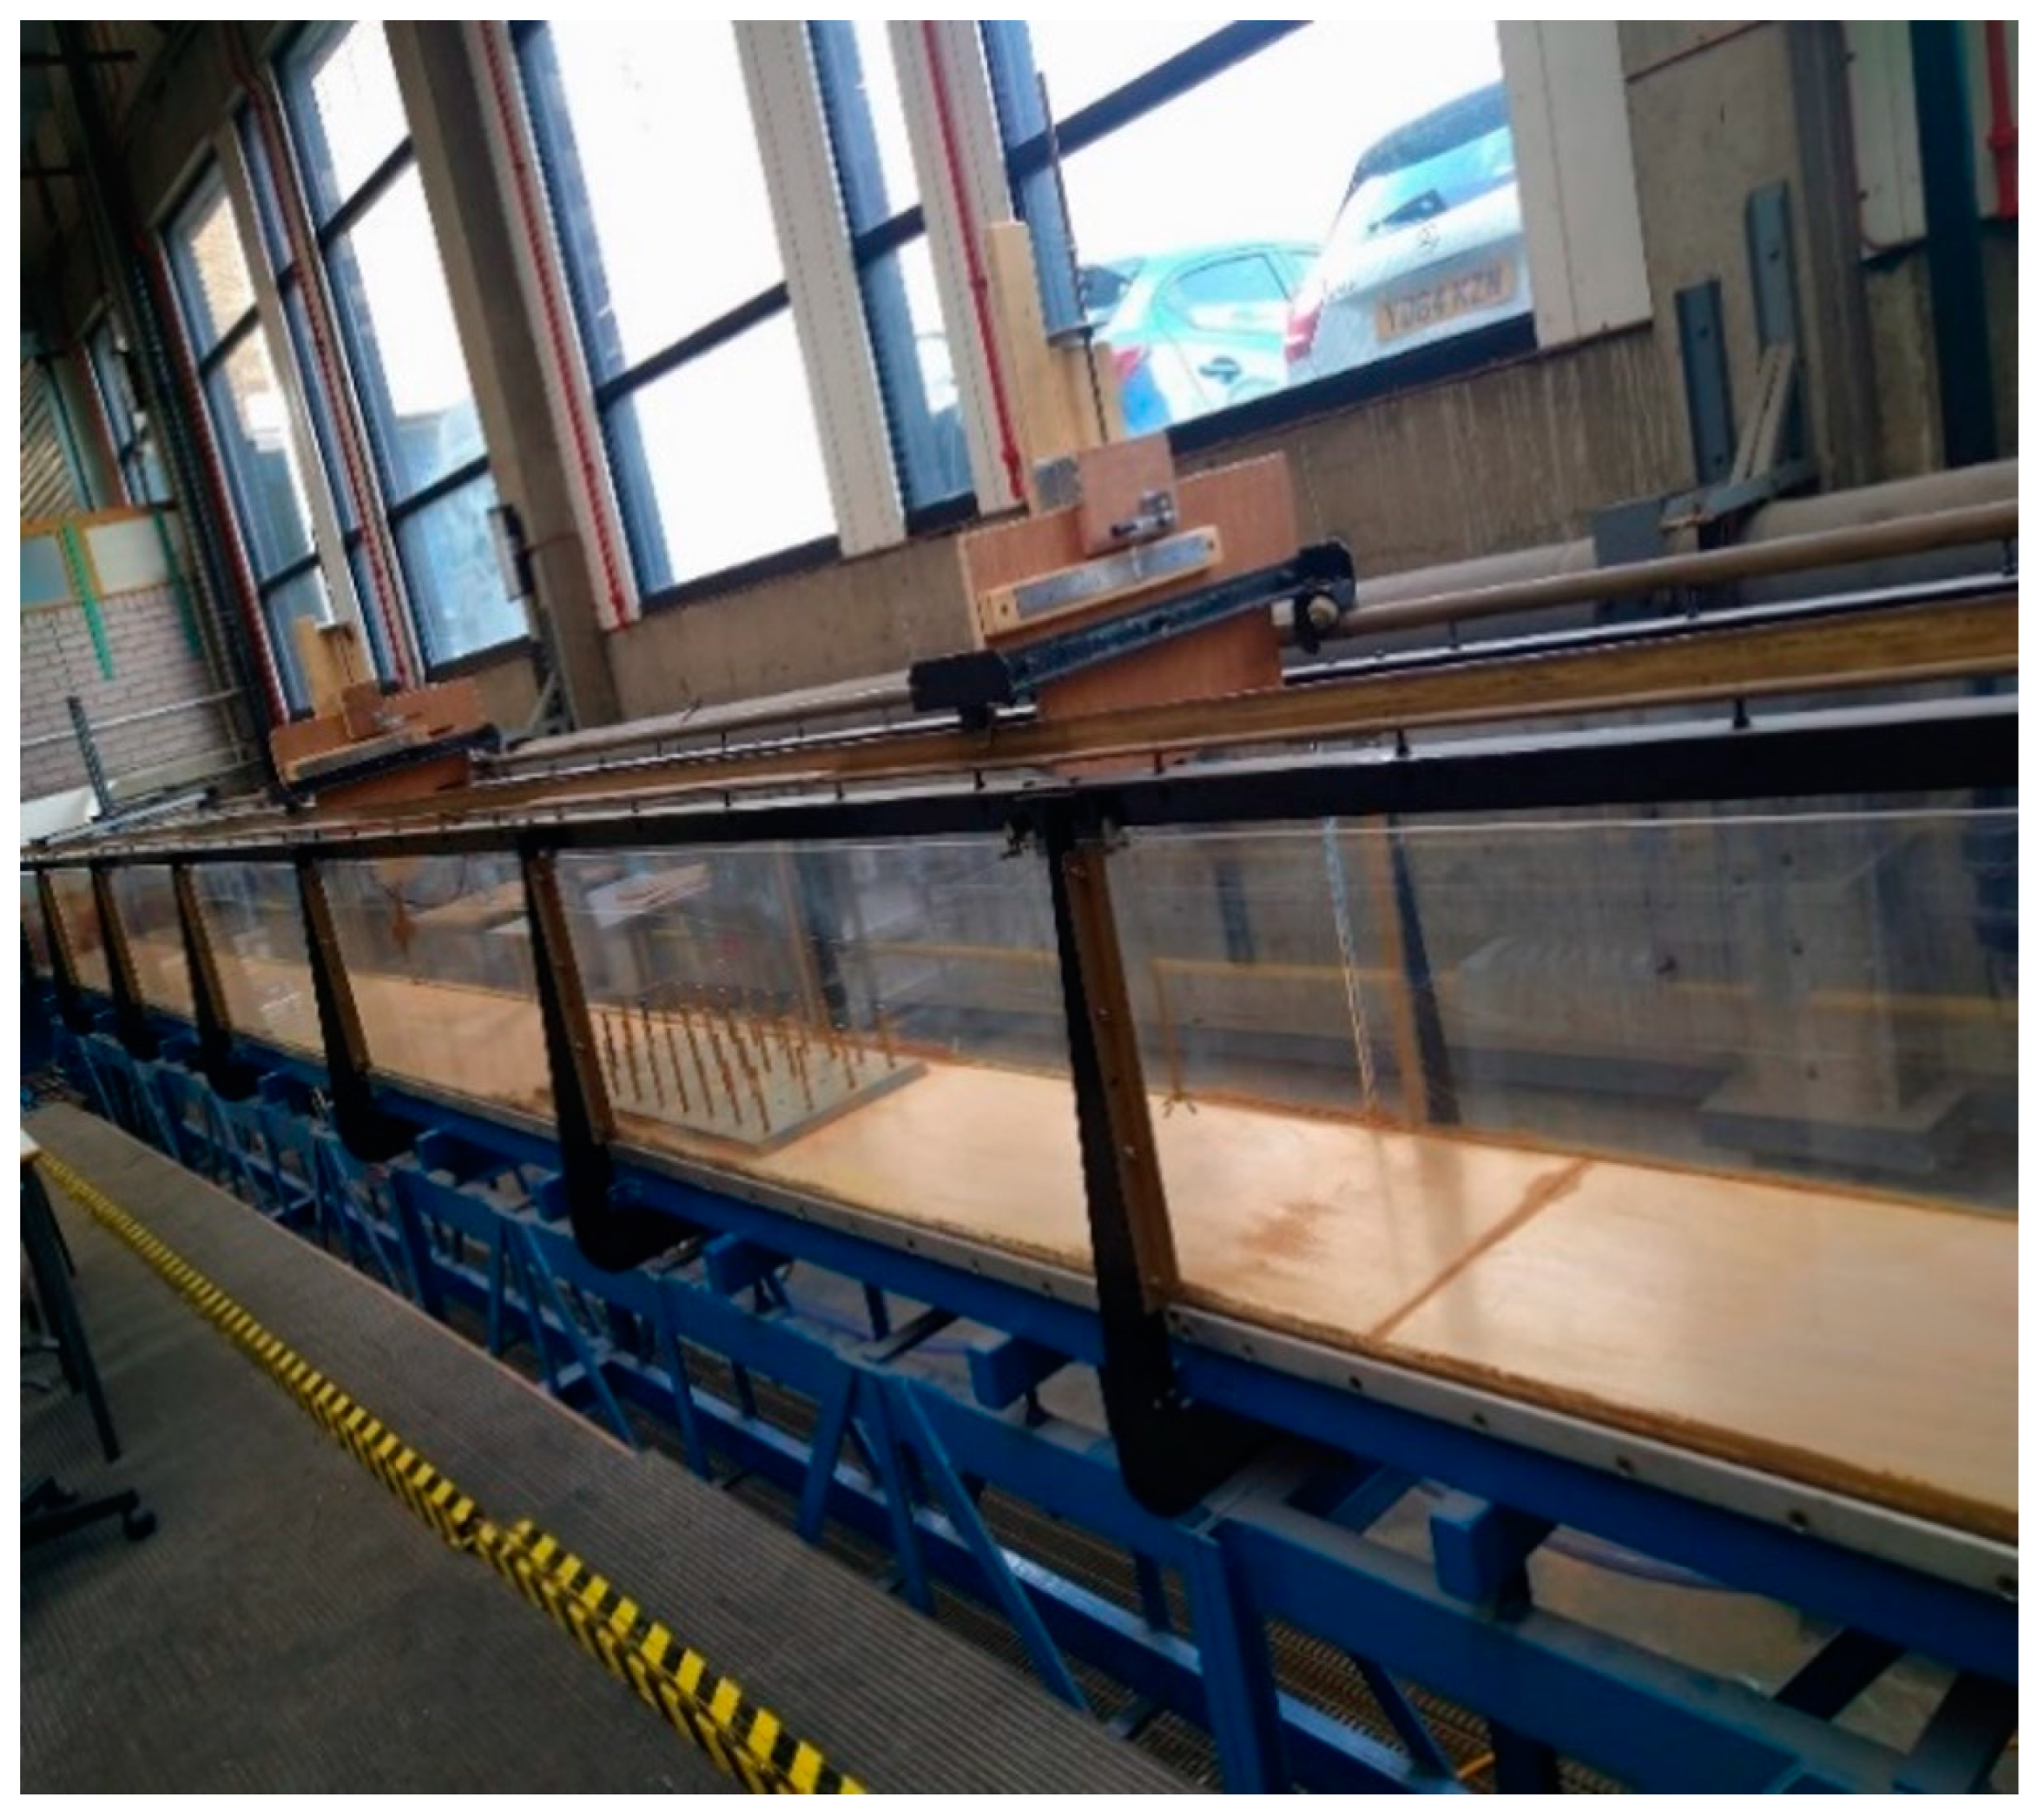

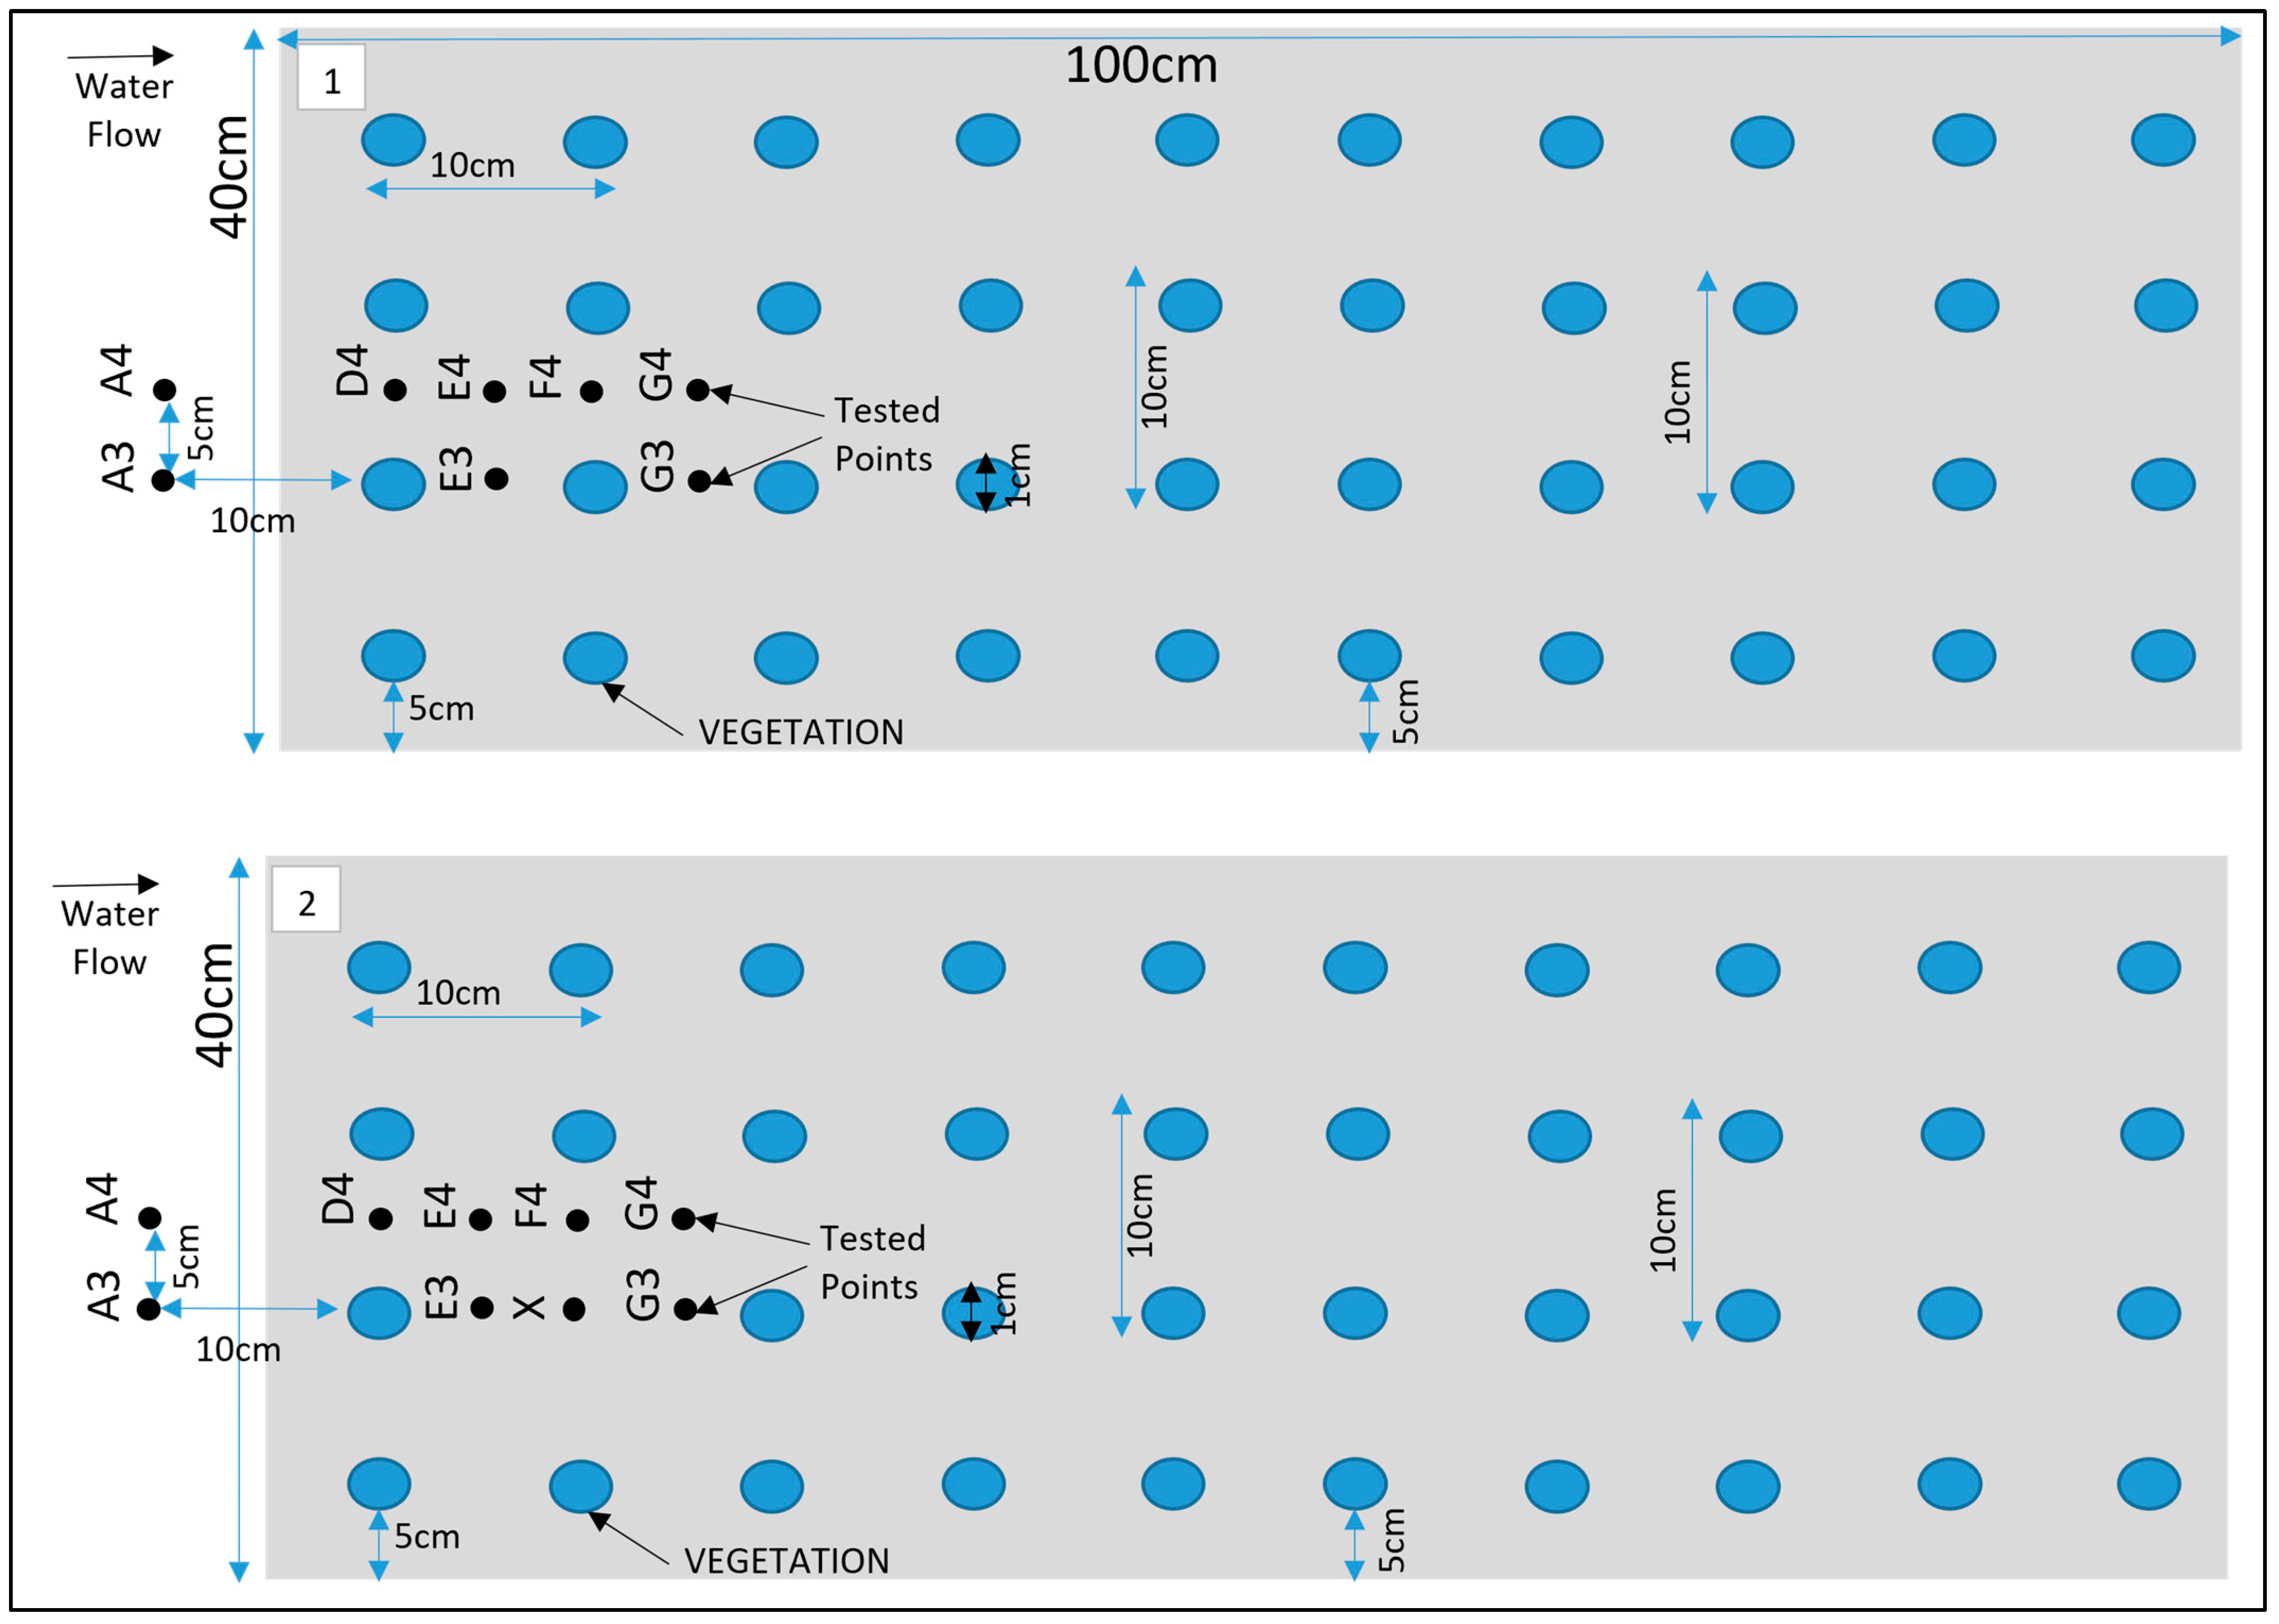
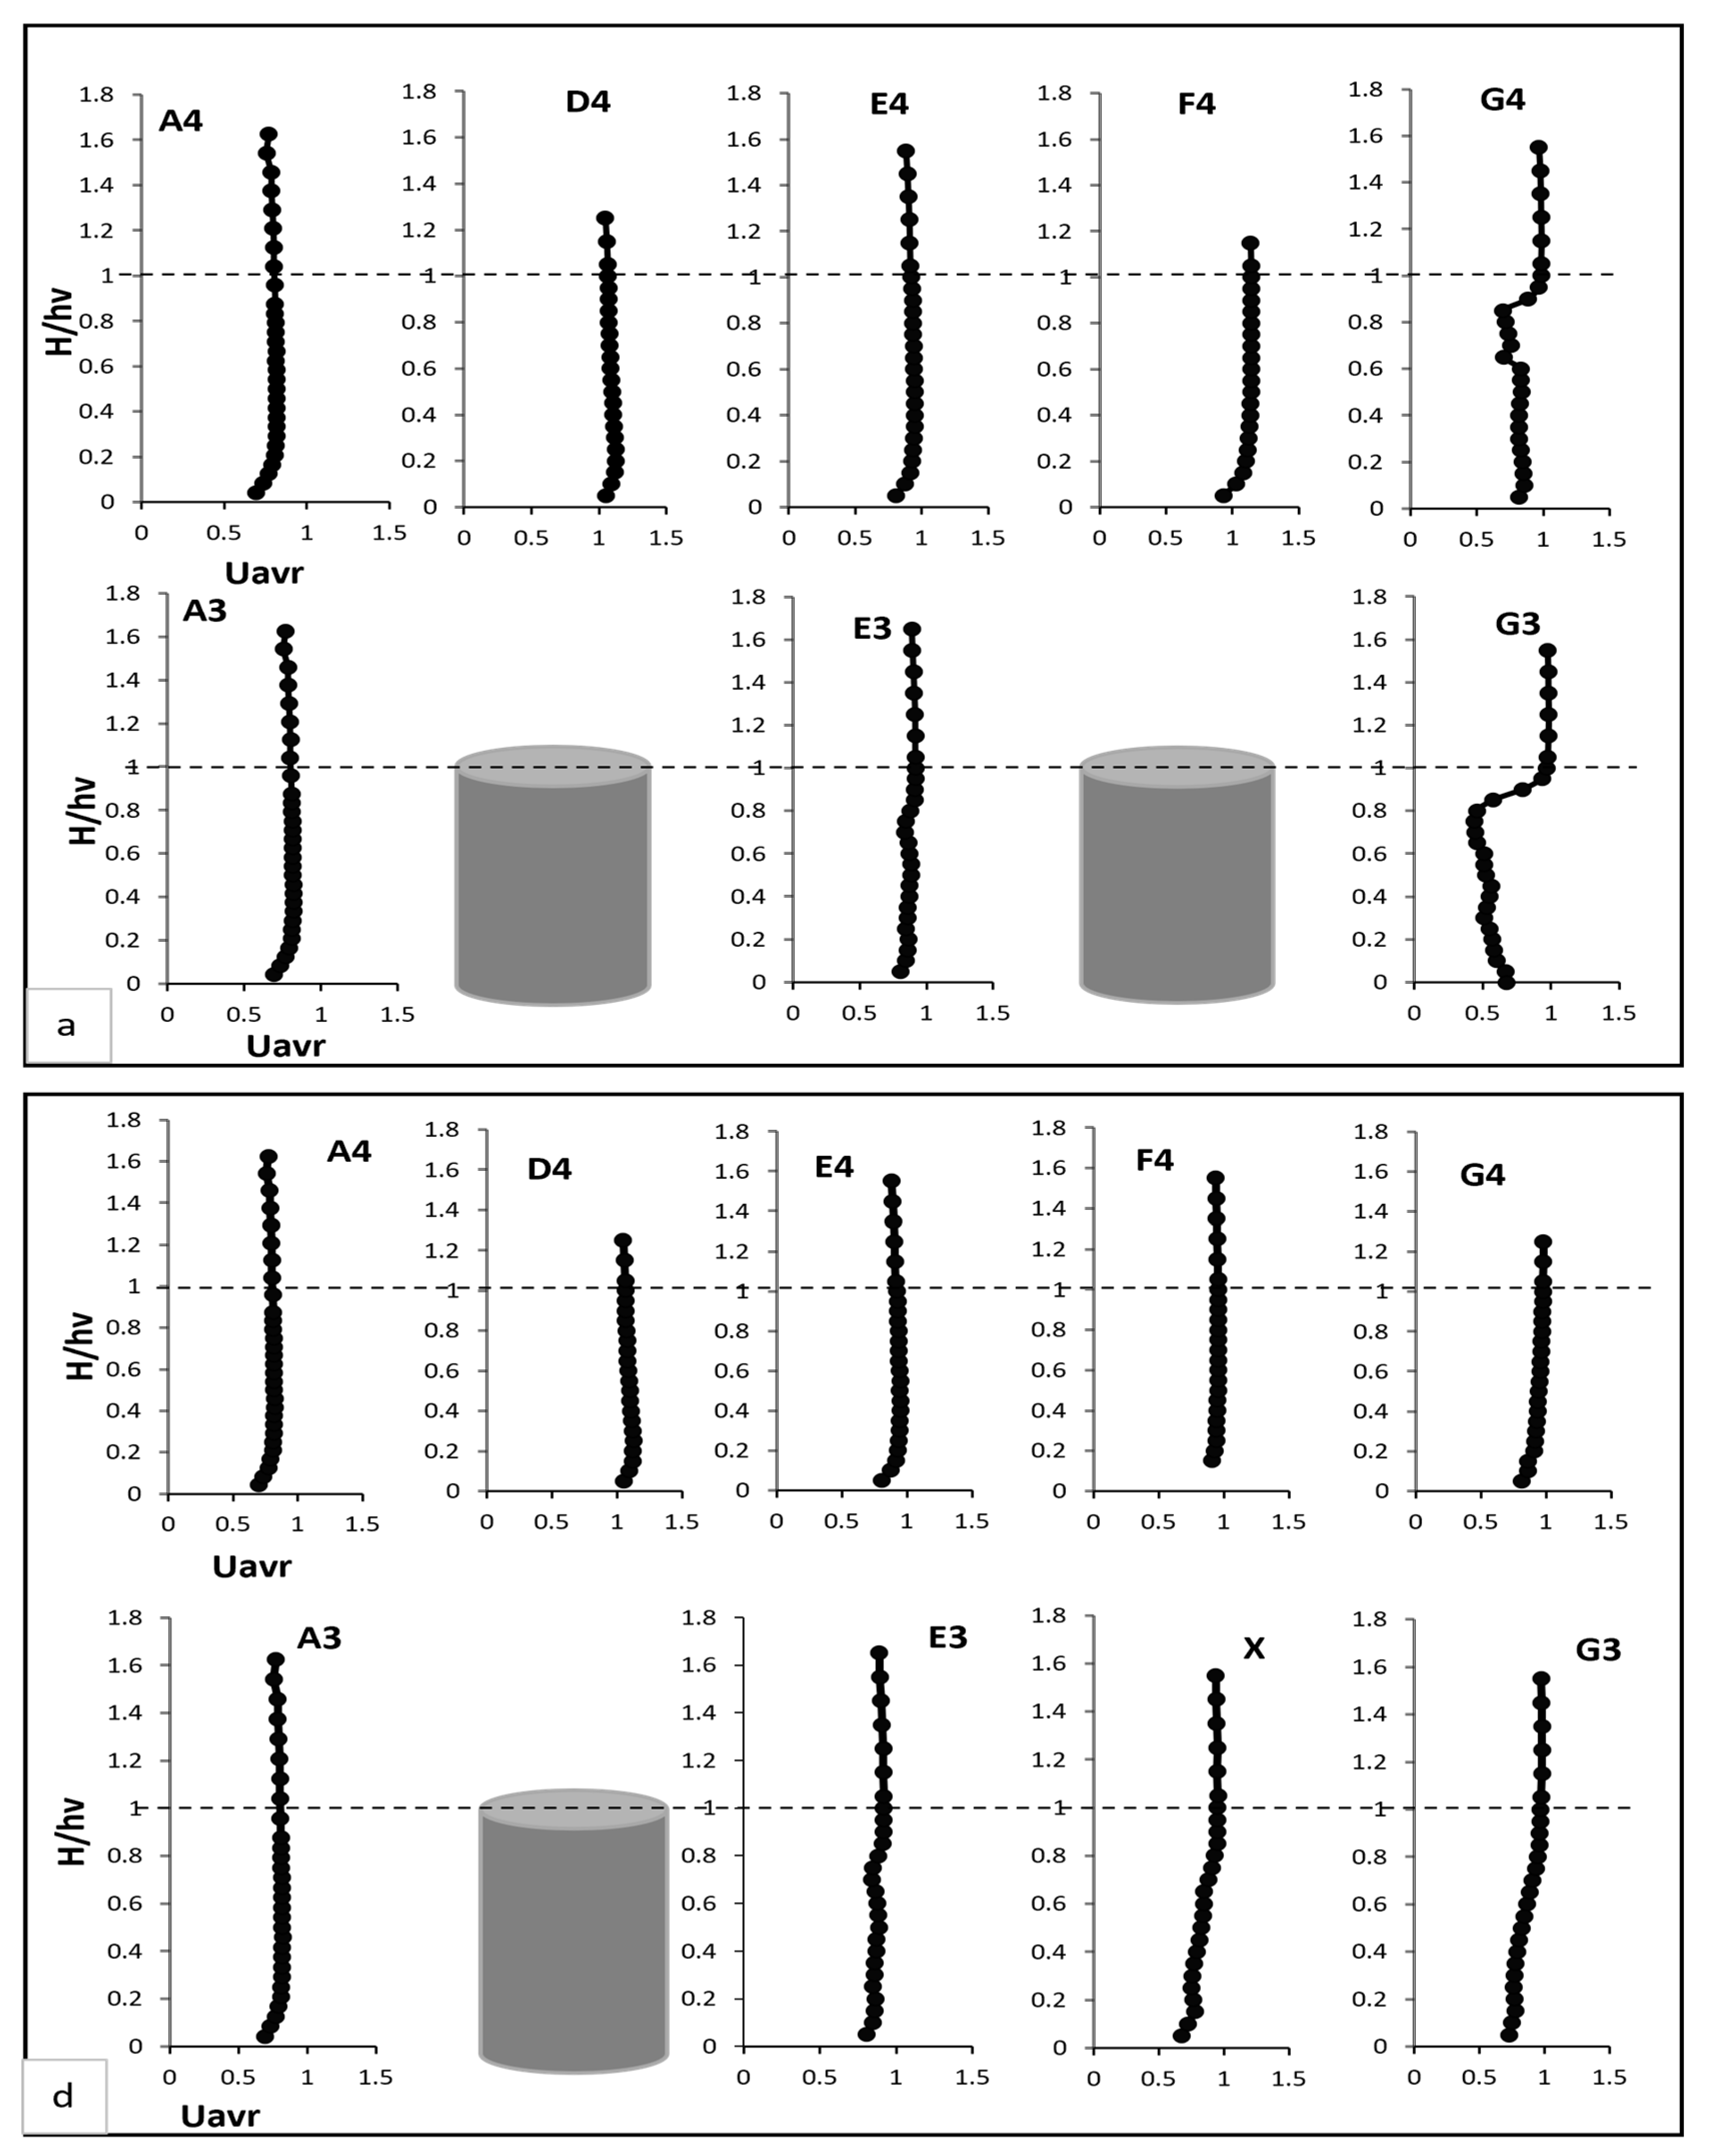


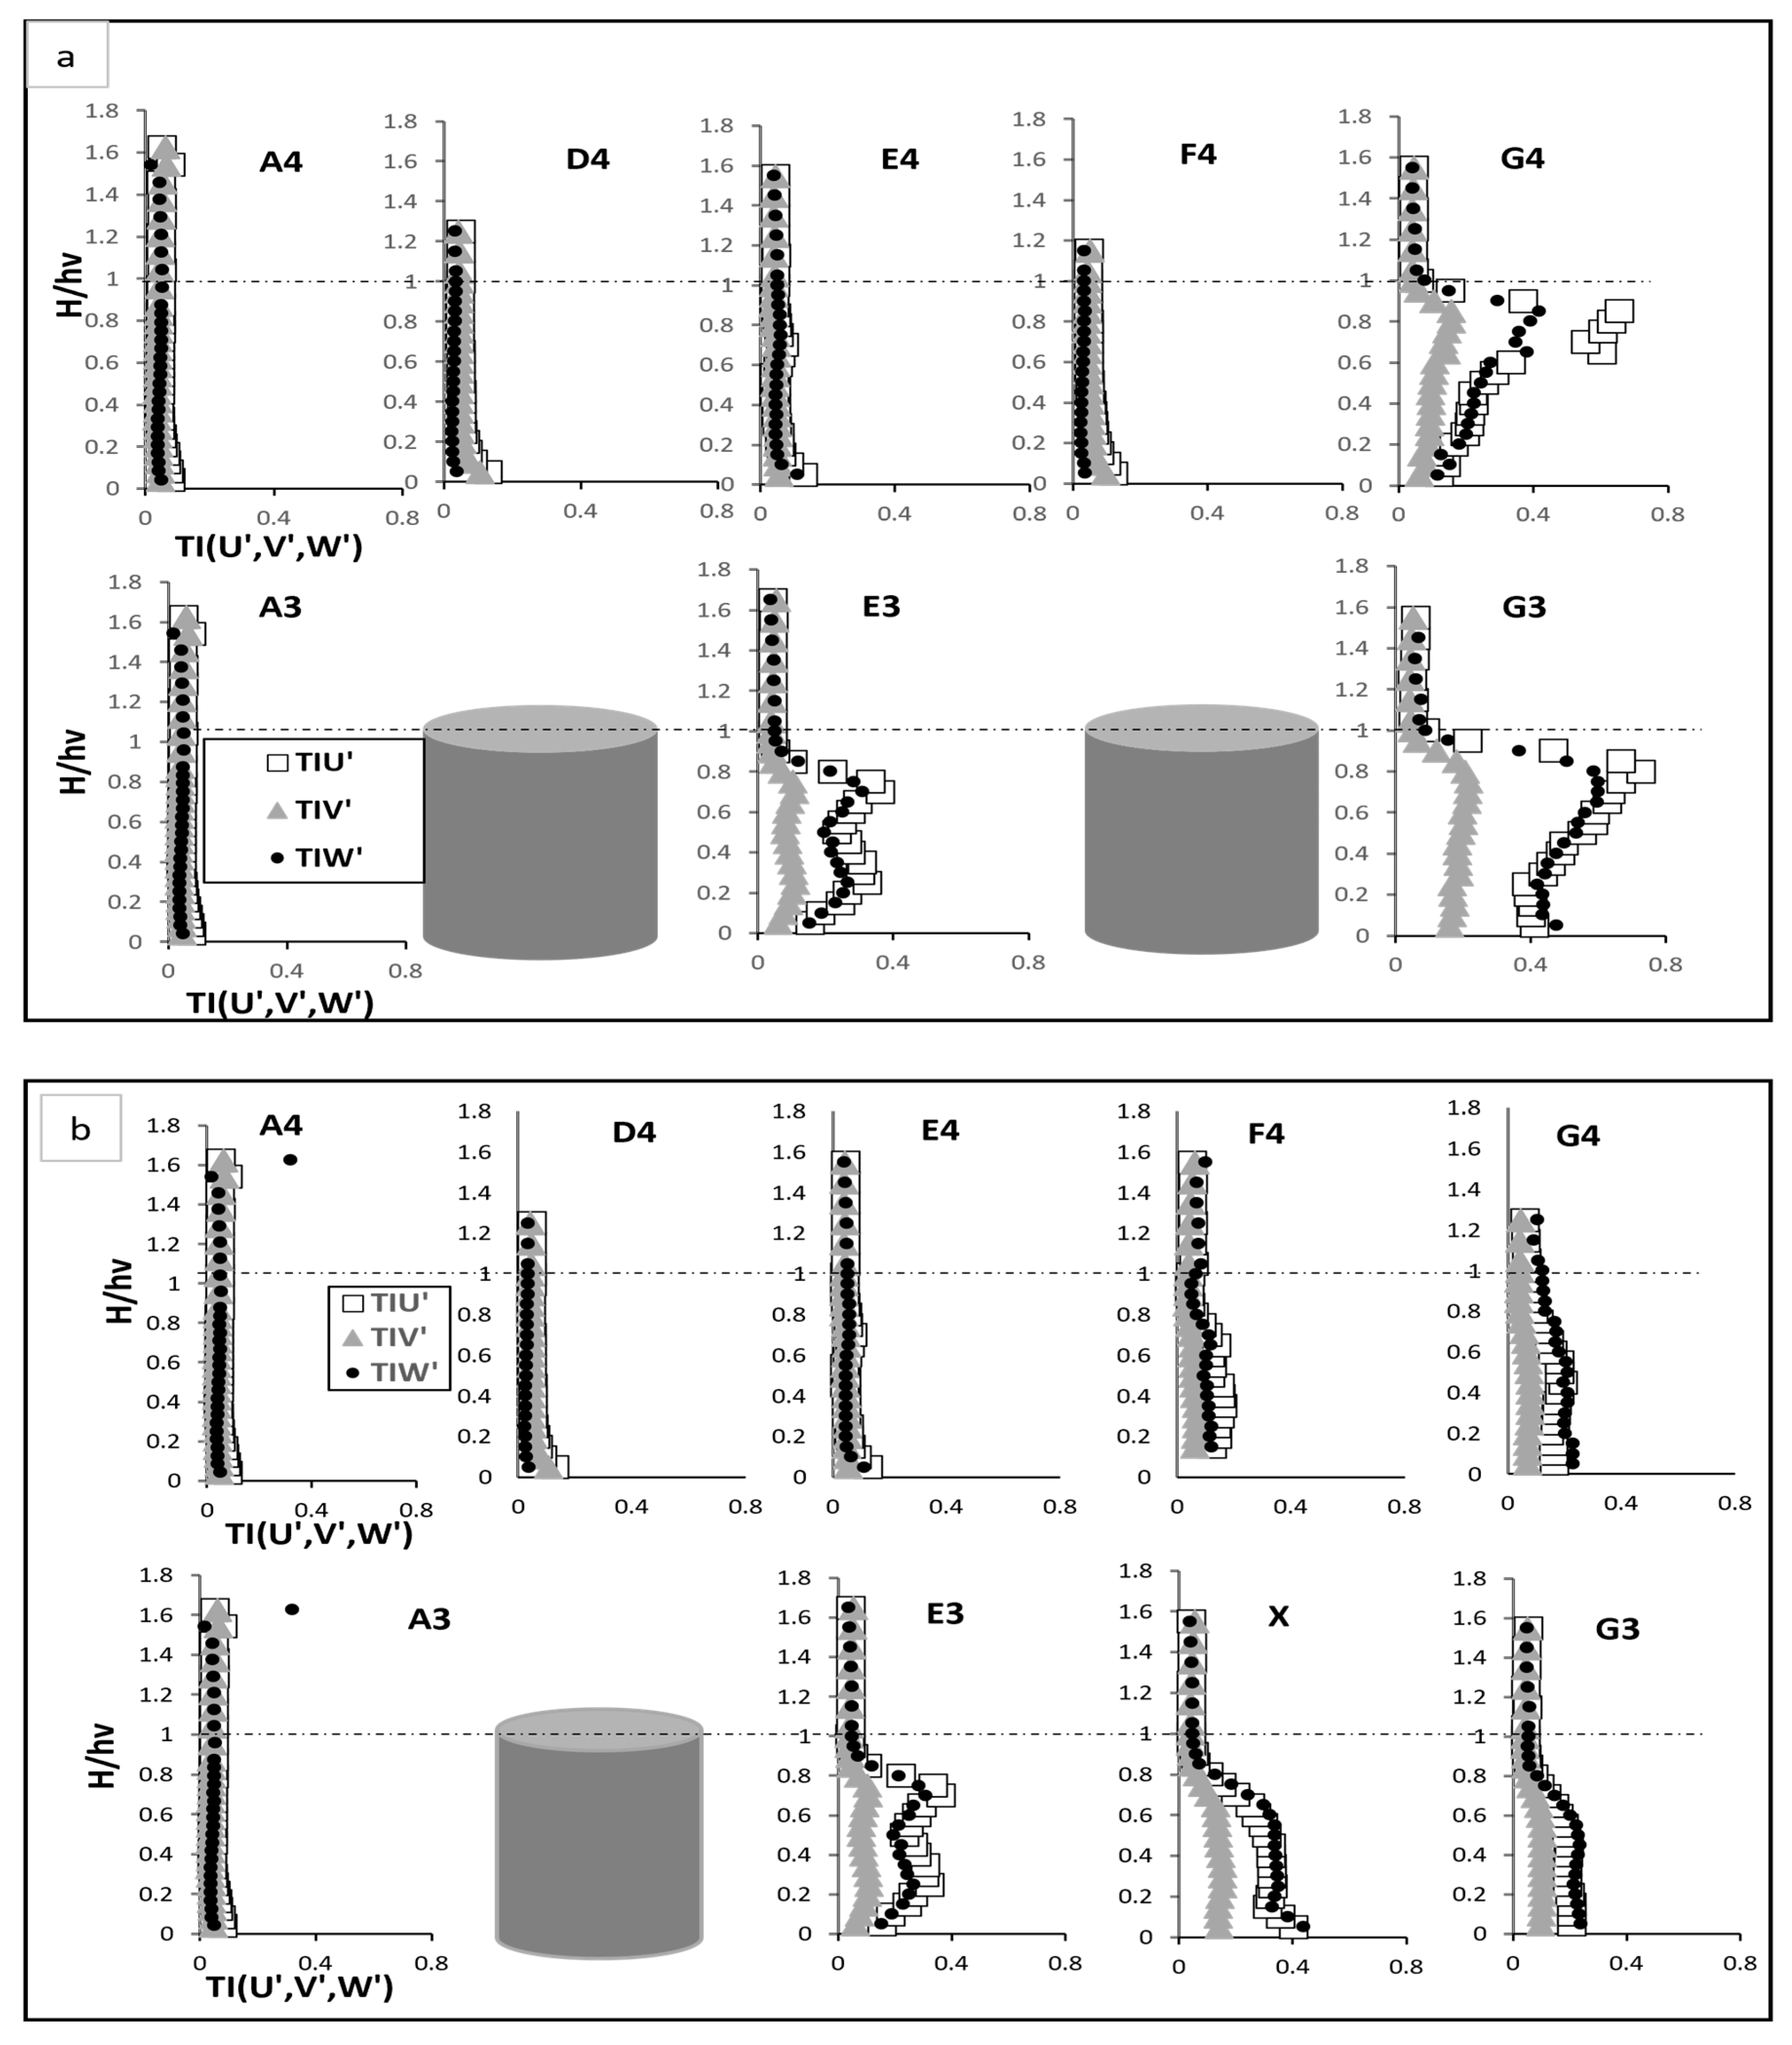

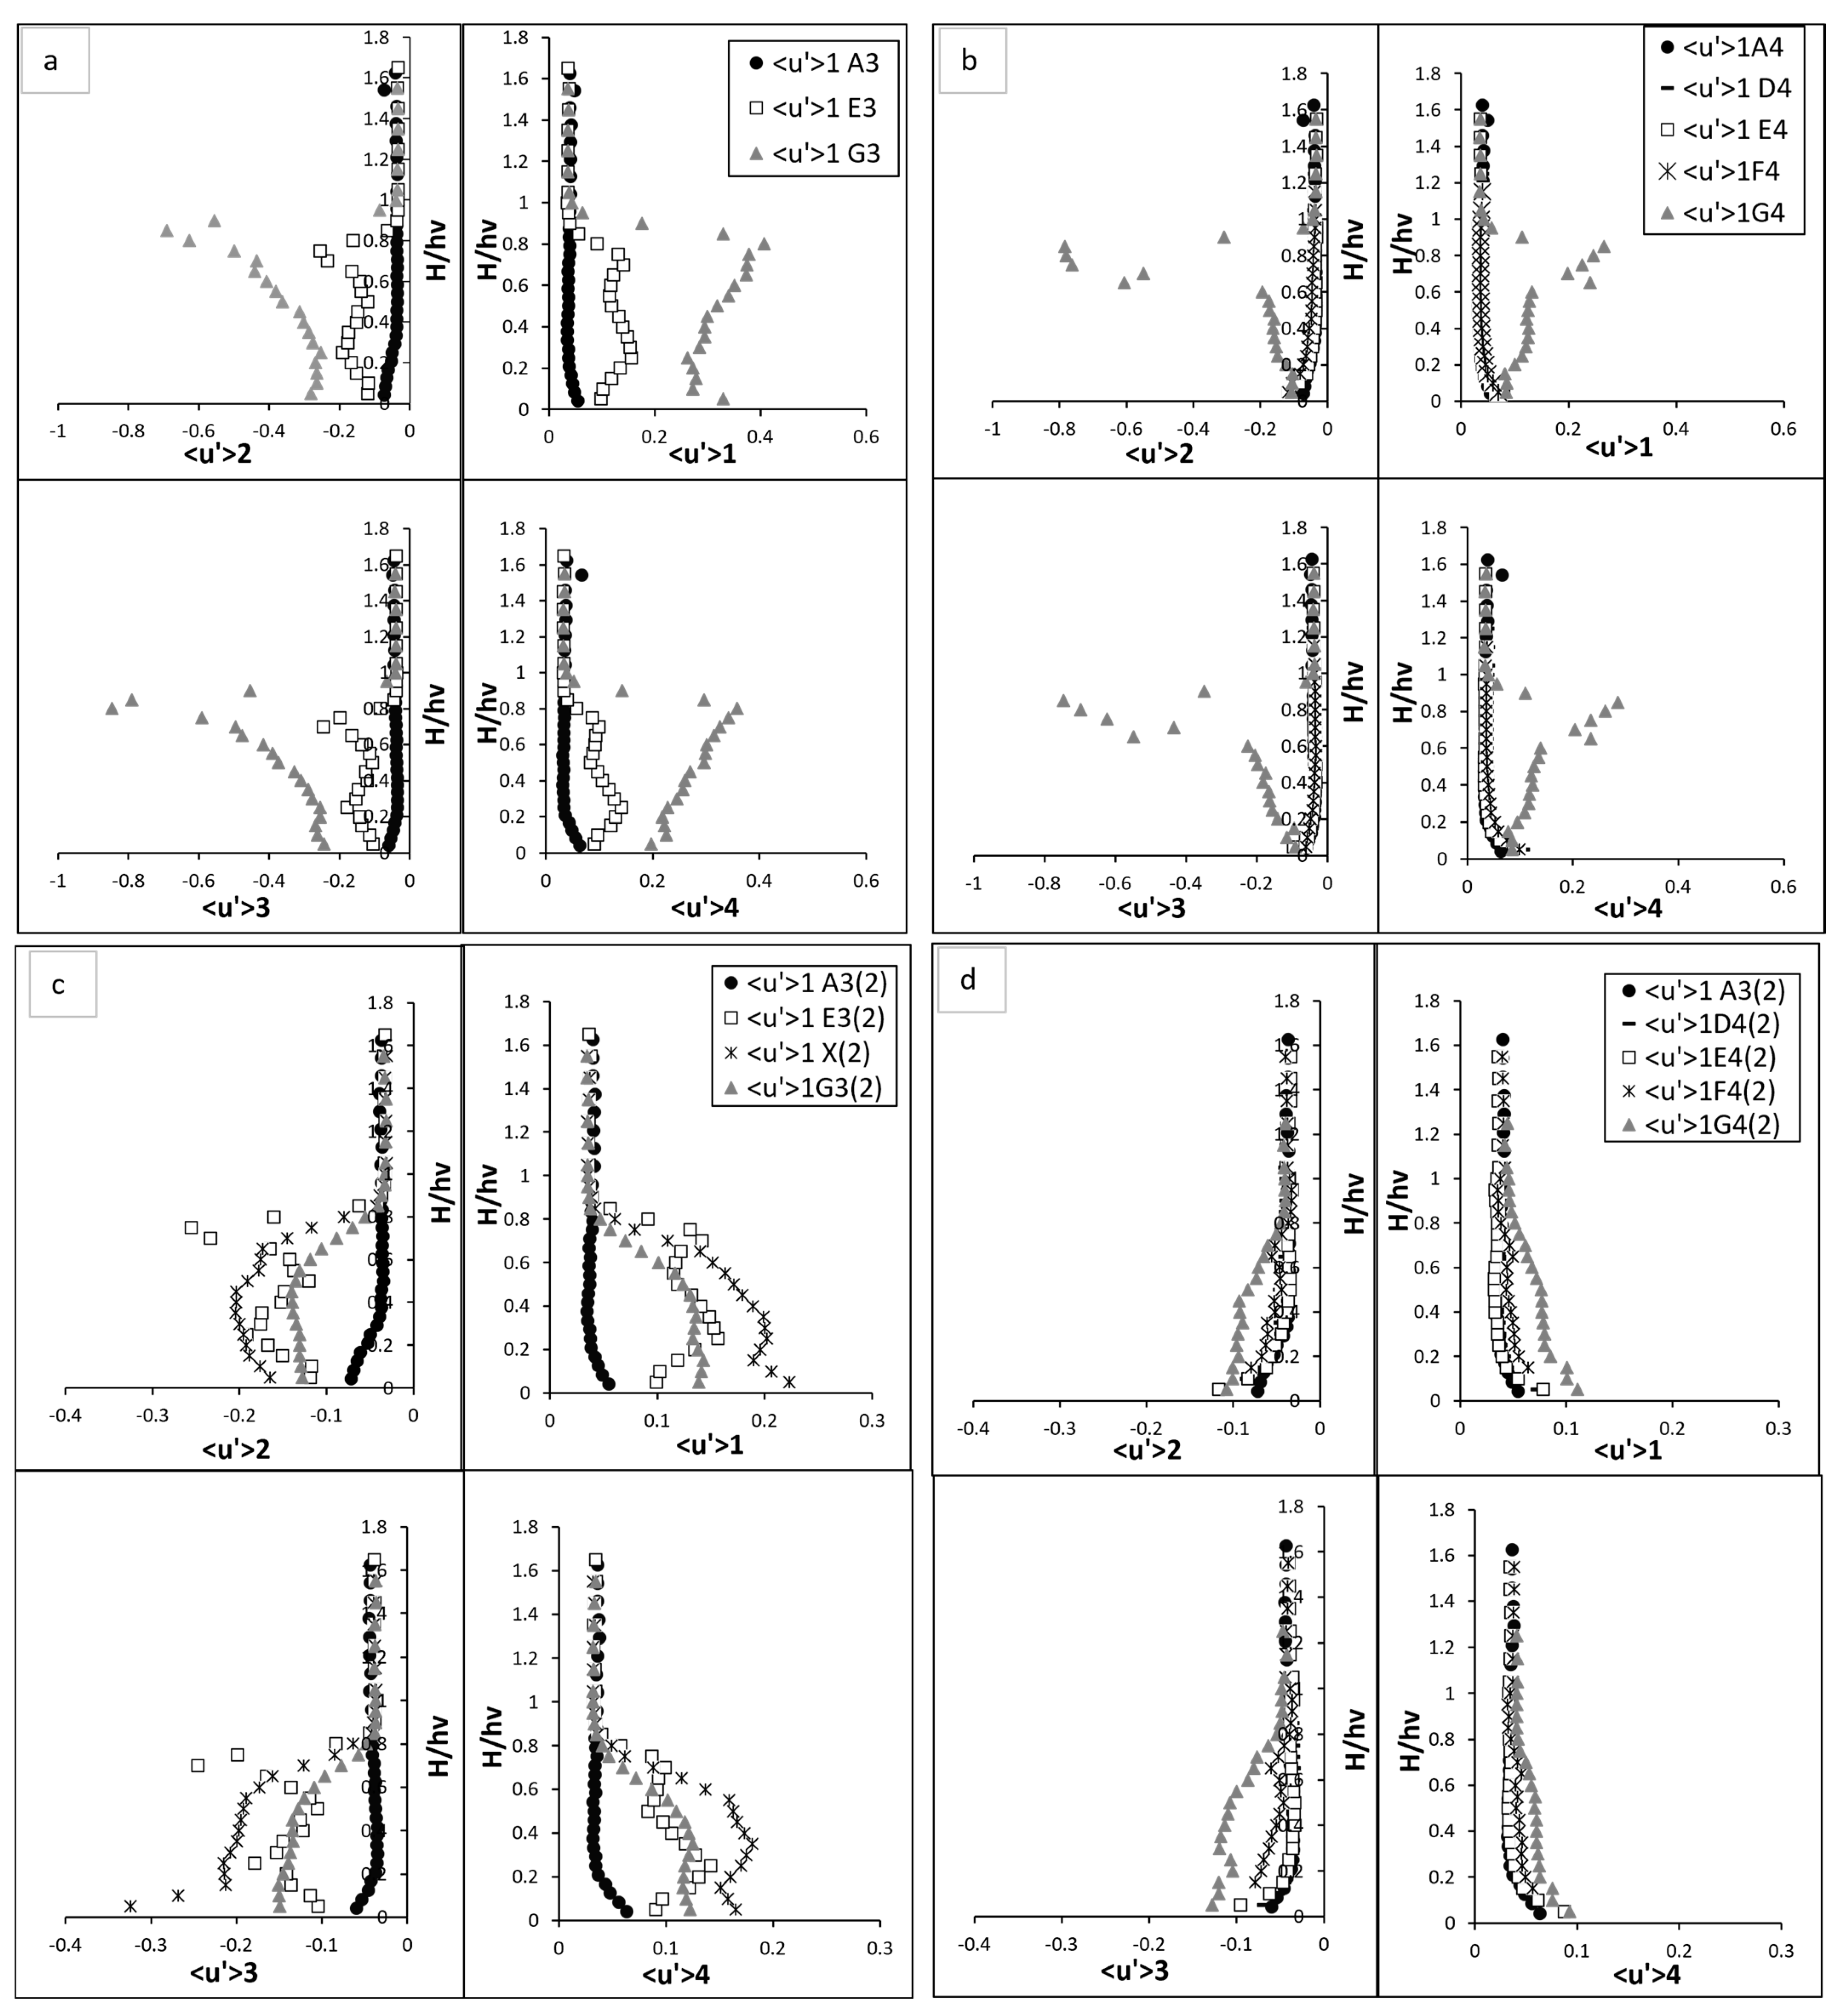
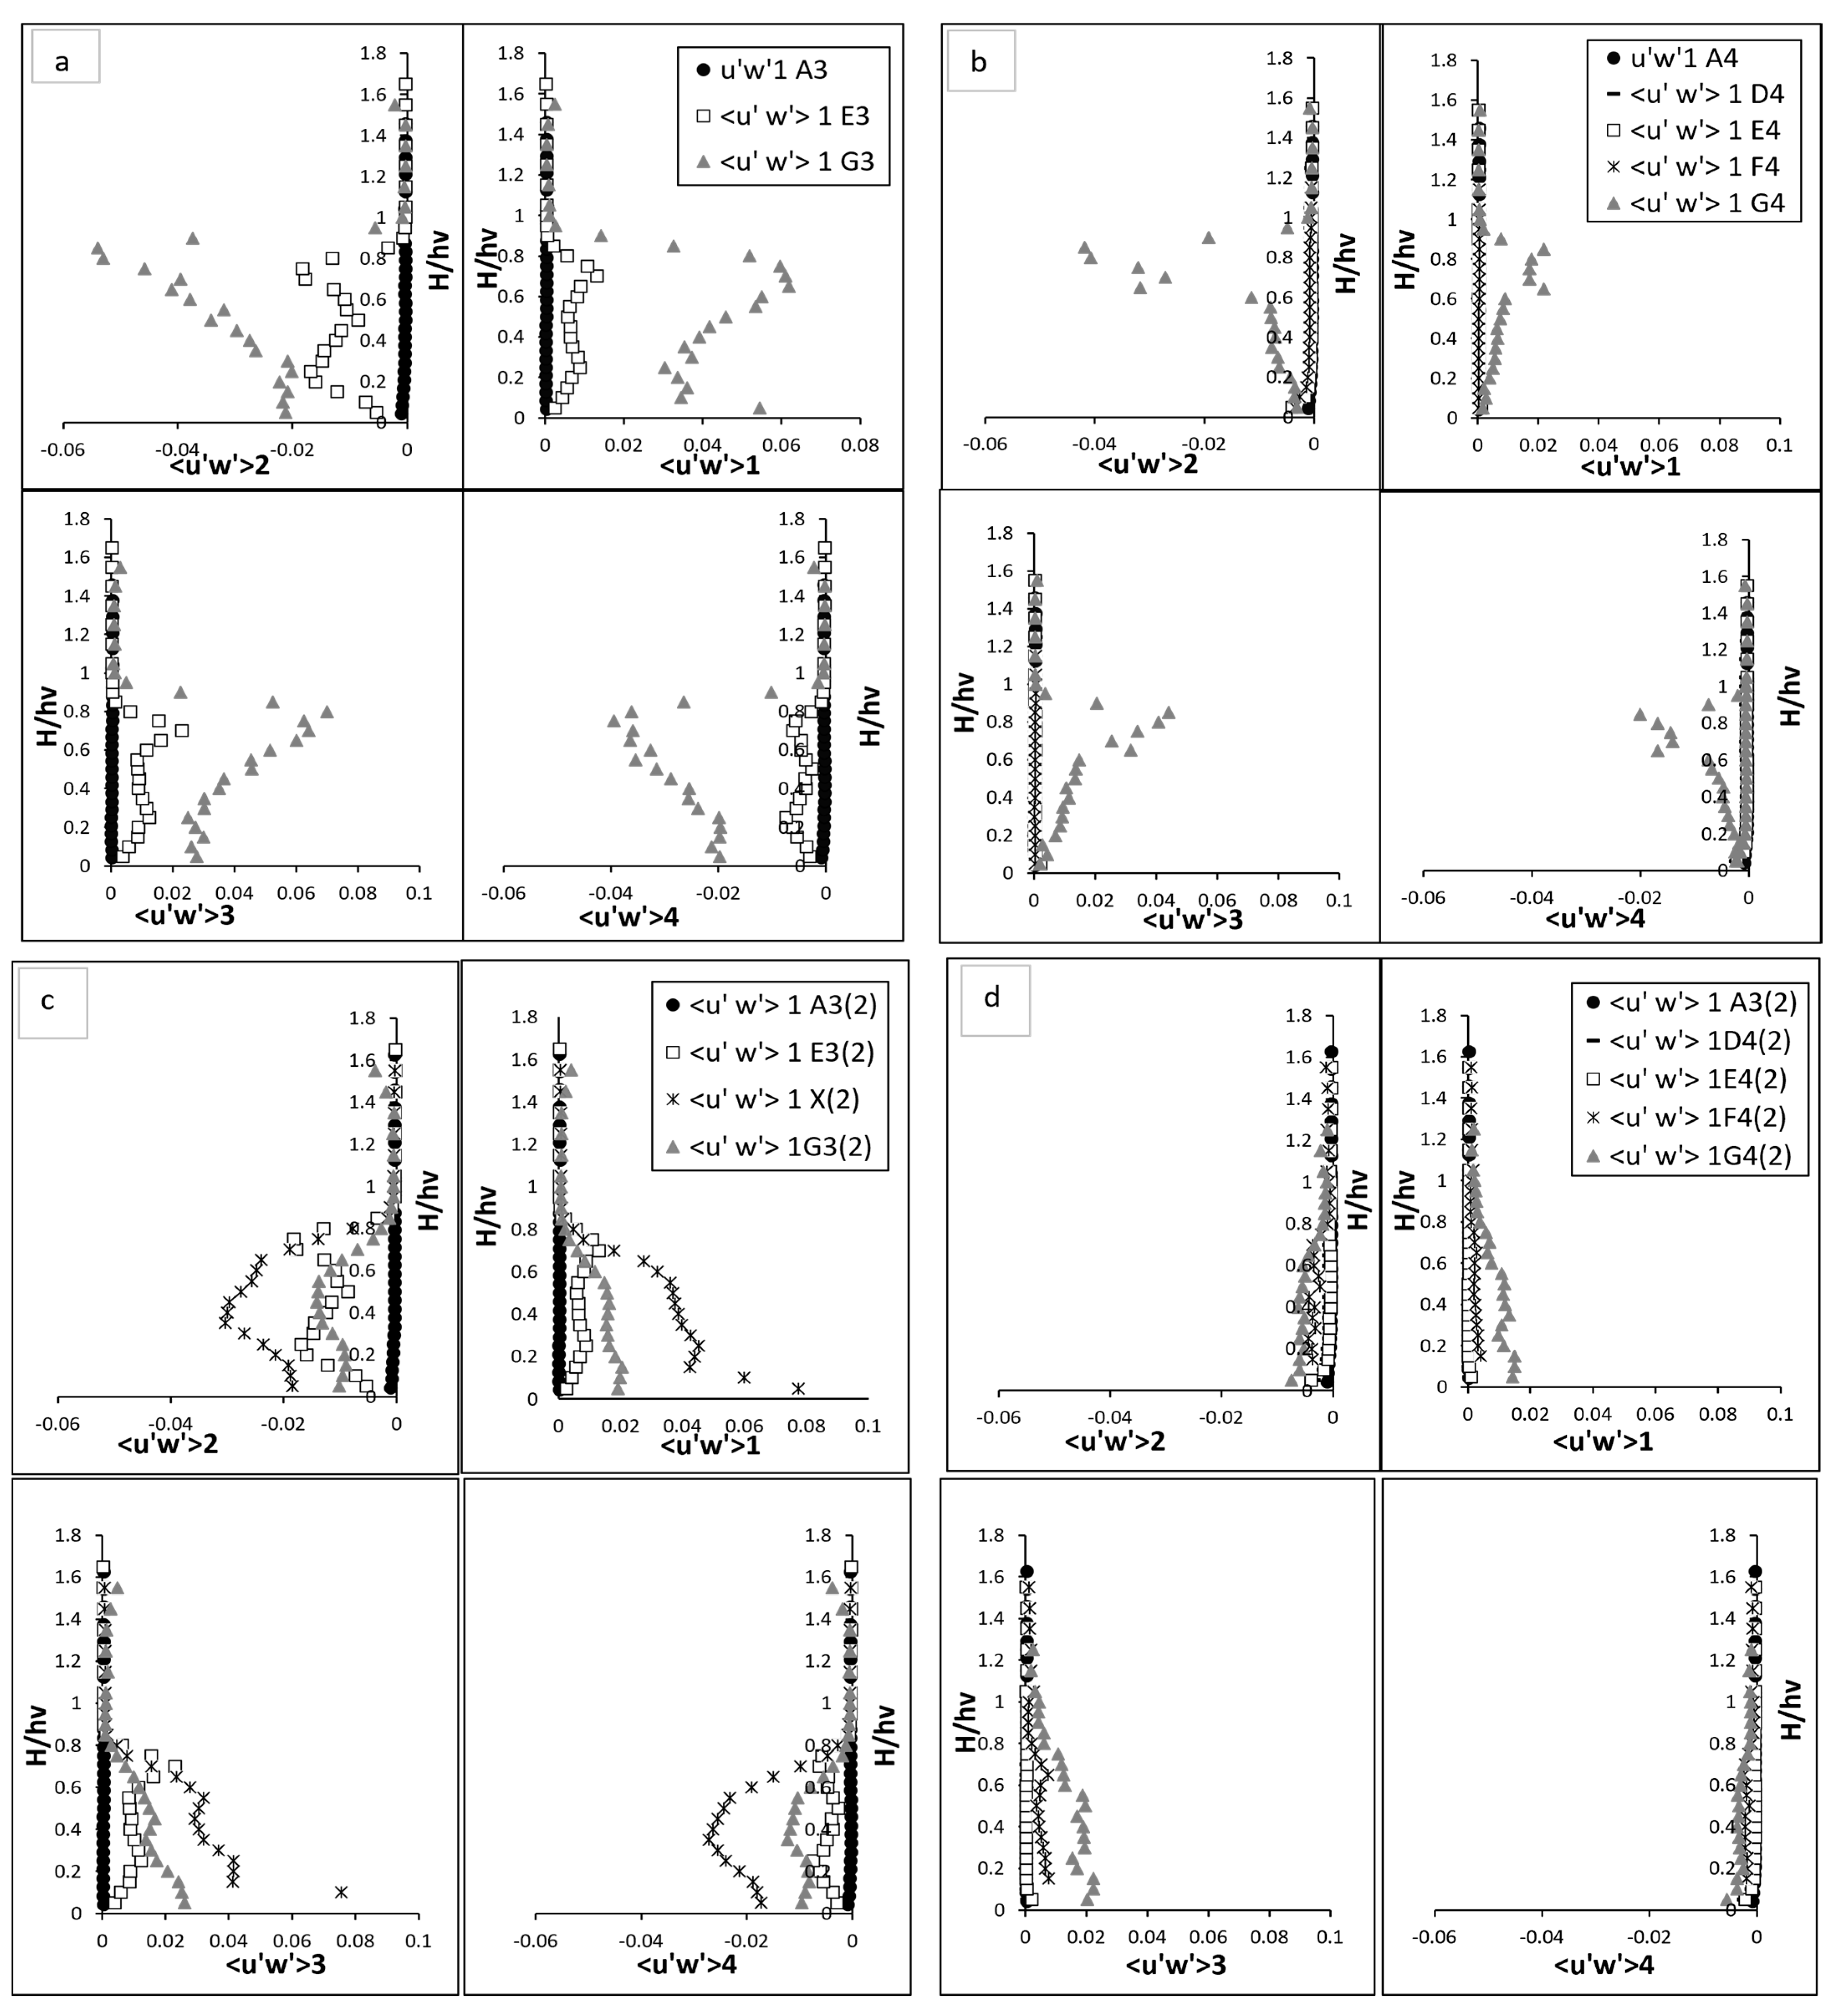
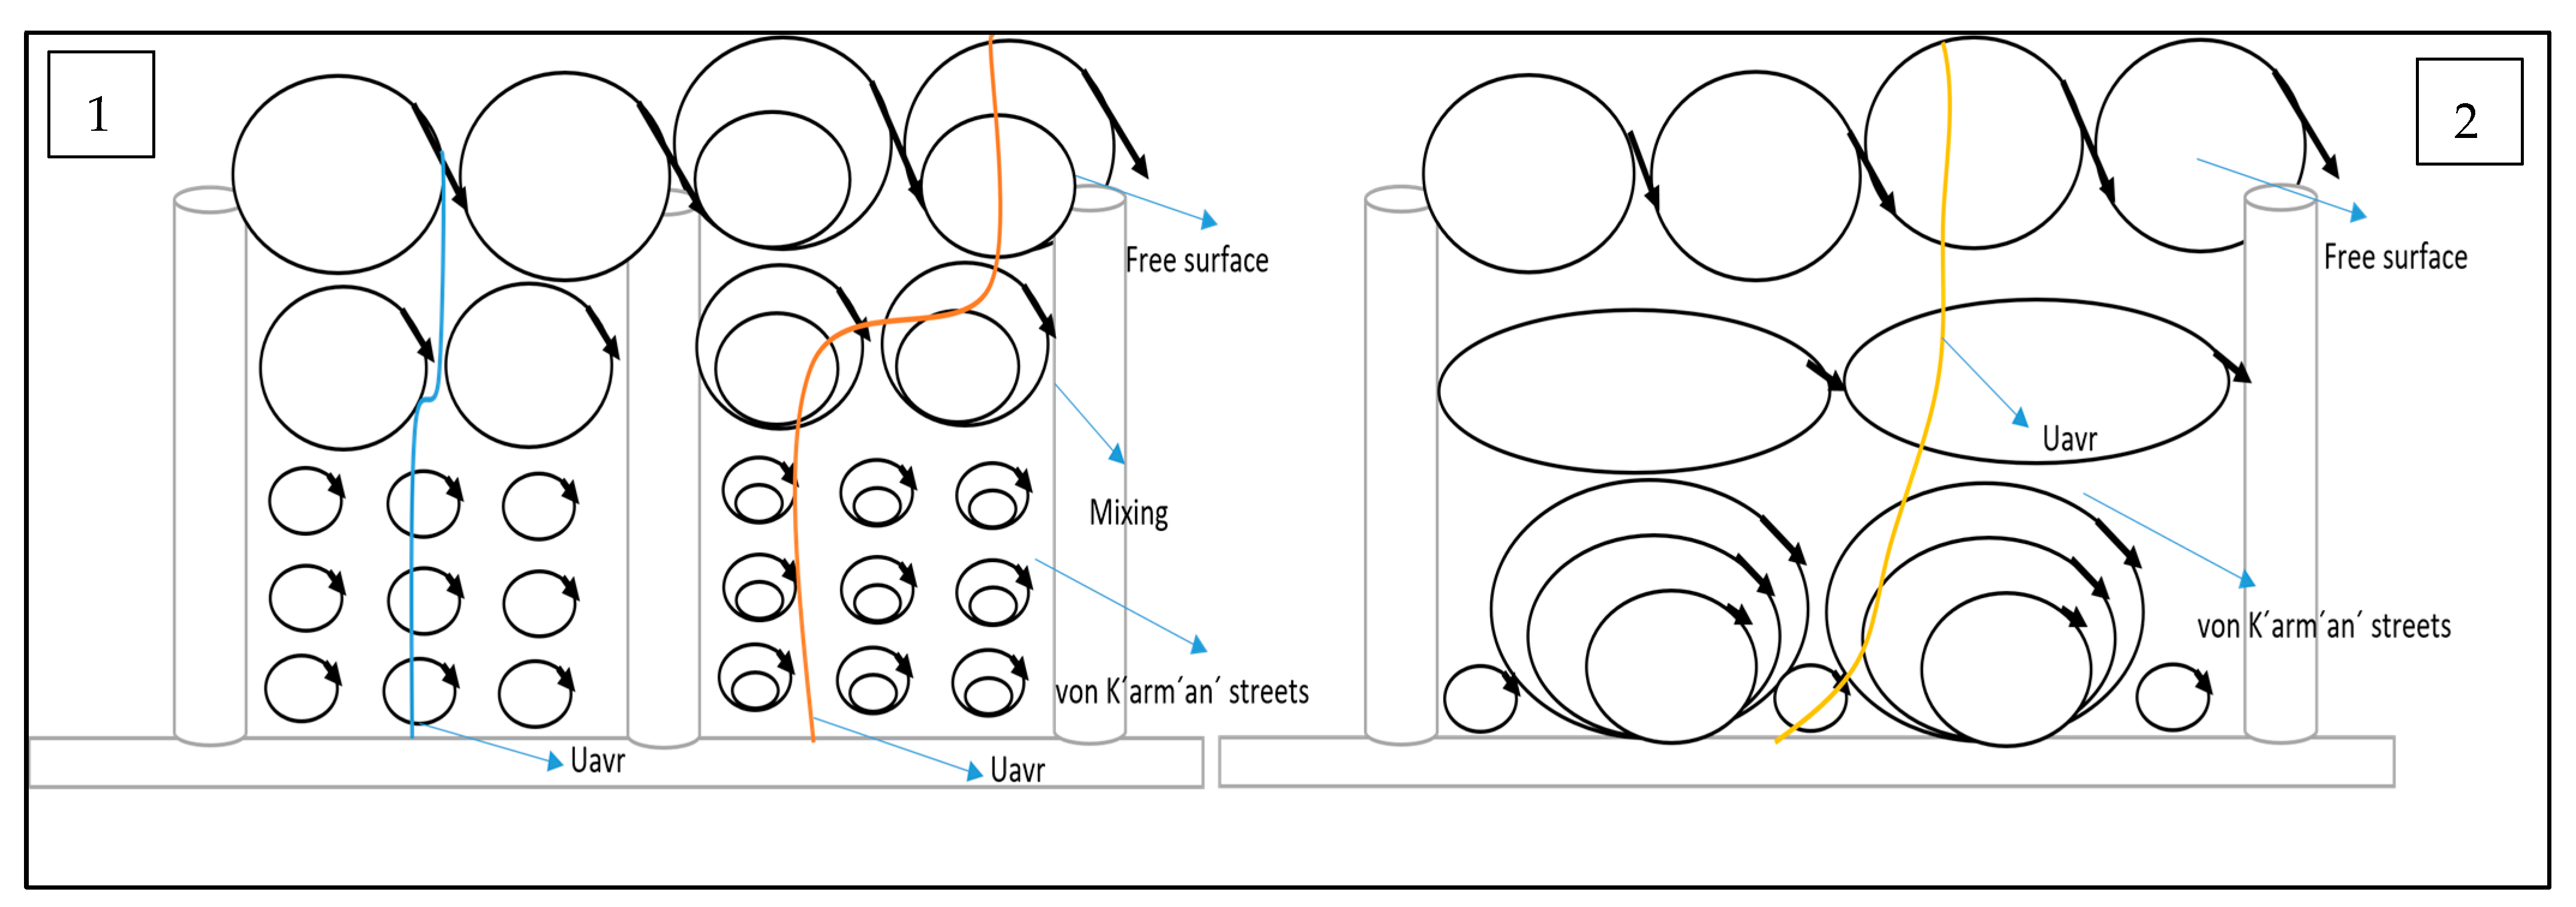
Disclaimer/Publisher’s Note: The statements, opinions and data contained in all publications are solely those of the individual author(s) and contributor(s) and not of MDPI and/or the editor(s). MDPI and/or the editor(s) disclaim responsibility for any injury to people or property resulting from any ideas, methods, instructions or products referred to in the content. |
© 2025 by the authors. Licensee MDPI, Basel, Switzerland. This article is an open access article distributed under the terms and conditions of the Creative Commons Attribution (CC BY) license (https://creativecommons.org/licenses/by/4.0/).