Abstract
Typhoons generate extreme waves that pose significant threats to offshore wind power platforms in deep-sea areas, a challenge not fully addressed in current design standards. This study investigates wind–wave coupling processes during typhoon events to provide guidance for typhoon selection in deep-sea wind power platform design. Using Pearson Type III frequency analysis of typhoon data from 1949 to 2019, the 50-year return period typhoon intensity was determined for the study area. The validated SWAN model was employed to simulate typhoon-induced waves, revealing that wave height contours align parallel to the coastline and increase sharply from nearshore to deep-sea areas. The maximum significant wave height reaches 7.78 m when a 50-year return period typhoon passes the engineering site. These findings offer critical insights for offshore wind farm design in typhoon-prone regions, providing a robust basis for wave load assessment, structural fatigue analysis, and safety optimization.
1. Introduction
The offshore wind farm industry has experienced rapid growth, with installed capacity continuously increasing, leading to a gradual shift in site selection toward deep-sea areas that offer greater development potential [1,2]. Among the various foundation types for wind turbines, the jacket structure has emerged as a promising support structure in recent years due to its adaptability to harsh marine environments [3,4]. However, deep-sea regions are particularly vulnerable to extreme waves generated by typhoons [5,6,7]. China, being one of the countries most severely affected by typhoons, faces significant challenges due to the destructive power of these storms [8,9]. Under the influence of global warming, both the frequency and intensity of severe typhoons have increased significantly [10,11], resulting in stronger wind waves and more complex wave conditions, including the wave height, direction, and wavelength. In addition, recent studies on tidal and wind energy potential in other coastal regions have highlighted the importance of accurate modeling frameworks for effective resource assessment and infrastructure design [12,13]. These factors play a crucial role in determining the structural loads on jacket foundations.
The design of offshore wind farm foundations typically employs a 50-year return period for environmental load calculations [14,15,16]. However, there is a lack of specific norms and standards for typhoon selection in jacket foundation design, despite its critical importance for understanding wind–wave coupling processes in engineering sea areas [17]. Current research on wind–wave and typhoon–wave interactions in offshore engineering primarily focuses on nuclear power plants and deep-sea oil platforms [18,19], with limited studies addressing the wind–wave coupling necessary for the structural design and fatigue analysis of deep-sea wind farms [20,21]. Therefore, it is essential to select typhoons of representative magnitudes and simulate their wind speeds, wave characteristics, and wind–wave angles at jacket locations using numerical wave models. Such analyses provide a scientific basis for evaluating wave load impacts, structural fatigue, and safety design, as well as supporting subsequent engineering construction.
To address these gaps, this study conducted a statistical analysis using the Pearson Type III (P-III) frequency method [22] on typhoon observational data from 1949 to 2019. The validated SWAN model [18] was employed to simulate typhoon-induced wind–wave processes, driven by real typhoon wind fields of representative intensity in the deep-sea region where the jacket structure is located. The results provide critical wave parameters, offering valuable references for the wave load analysis, structural fatigue assessment, and safety design of jacket foundations. These findings hold significant theoretical and practical value for offshore wind power engineering. The paper is organized as follows: Section 2 describes the data, methods, and models used in this study; Section 3 presents the results of typhoon-induced wave simulations for the deep-sea wind power platform design; and Section 4 provides the conclusions.
2. Materials and Methods
2.1. Typhoon Data and Samples Selection
Typhoon data from 1949 to 2019 were derived from the Chinese Meteorological Administration tropical cyclone data center [23,24] and can be obtained from https://tcdata.typhoon.org.cn/zjljsjj.html which is accessed on 21 August 2023. These data provide typhoon information including cyclone center positions, minimum sea level pressures (MSLPs) near the cyclone center, and the 10 m height maximum wind speed (MWS) each 6 h.
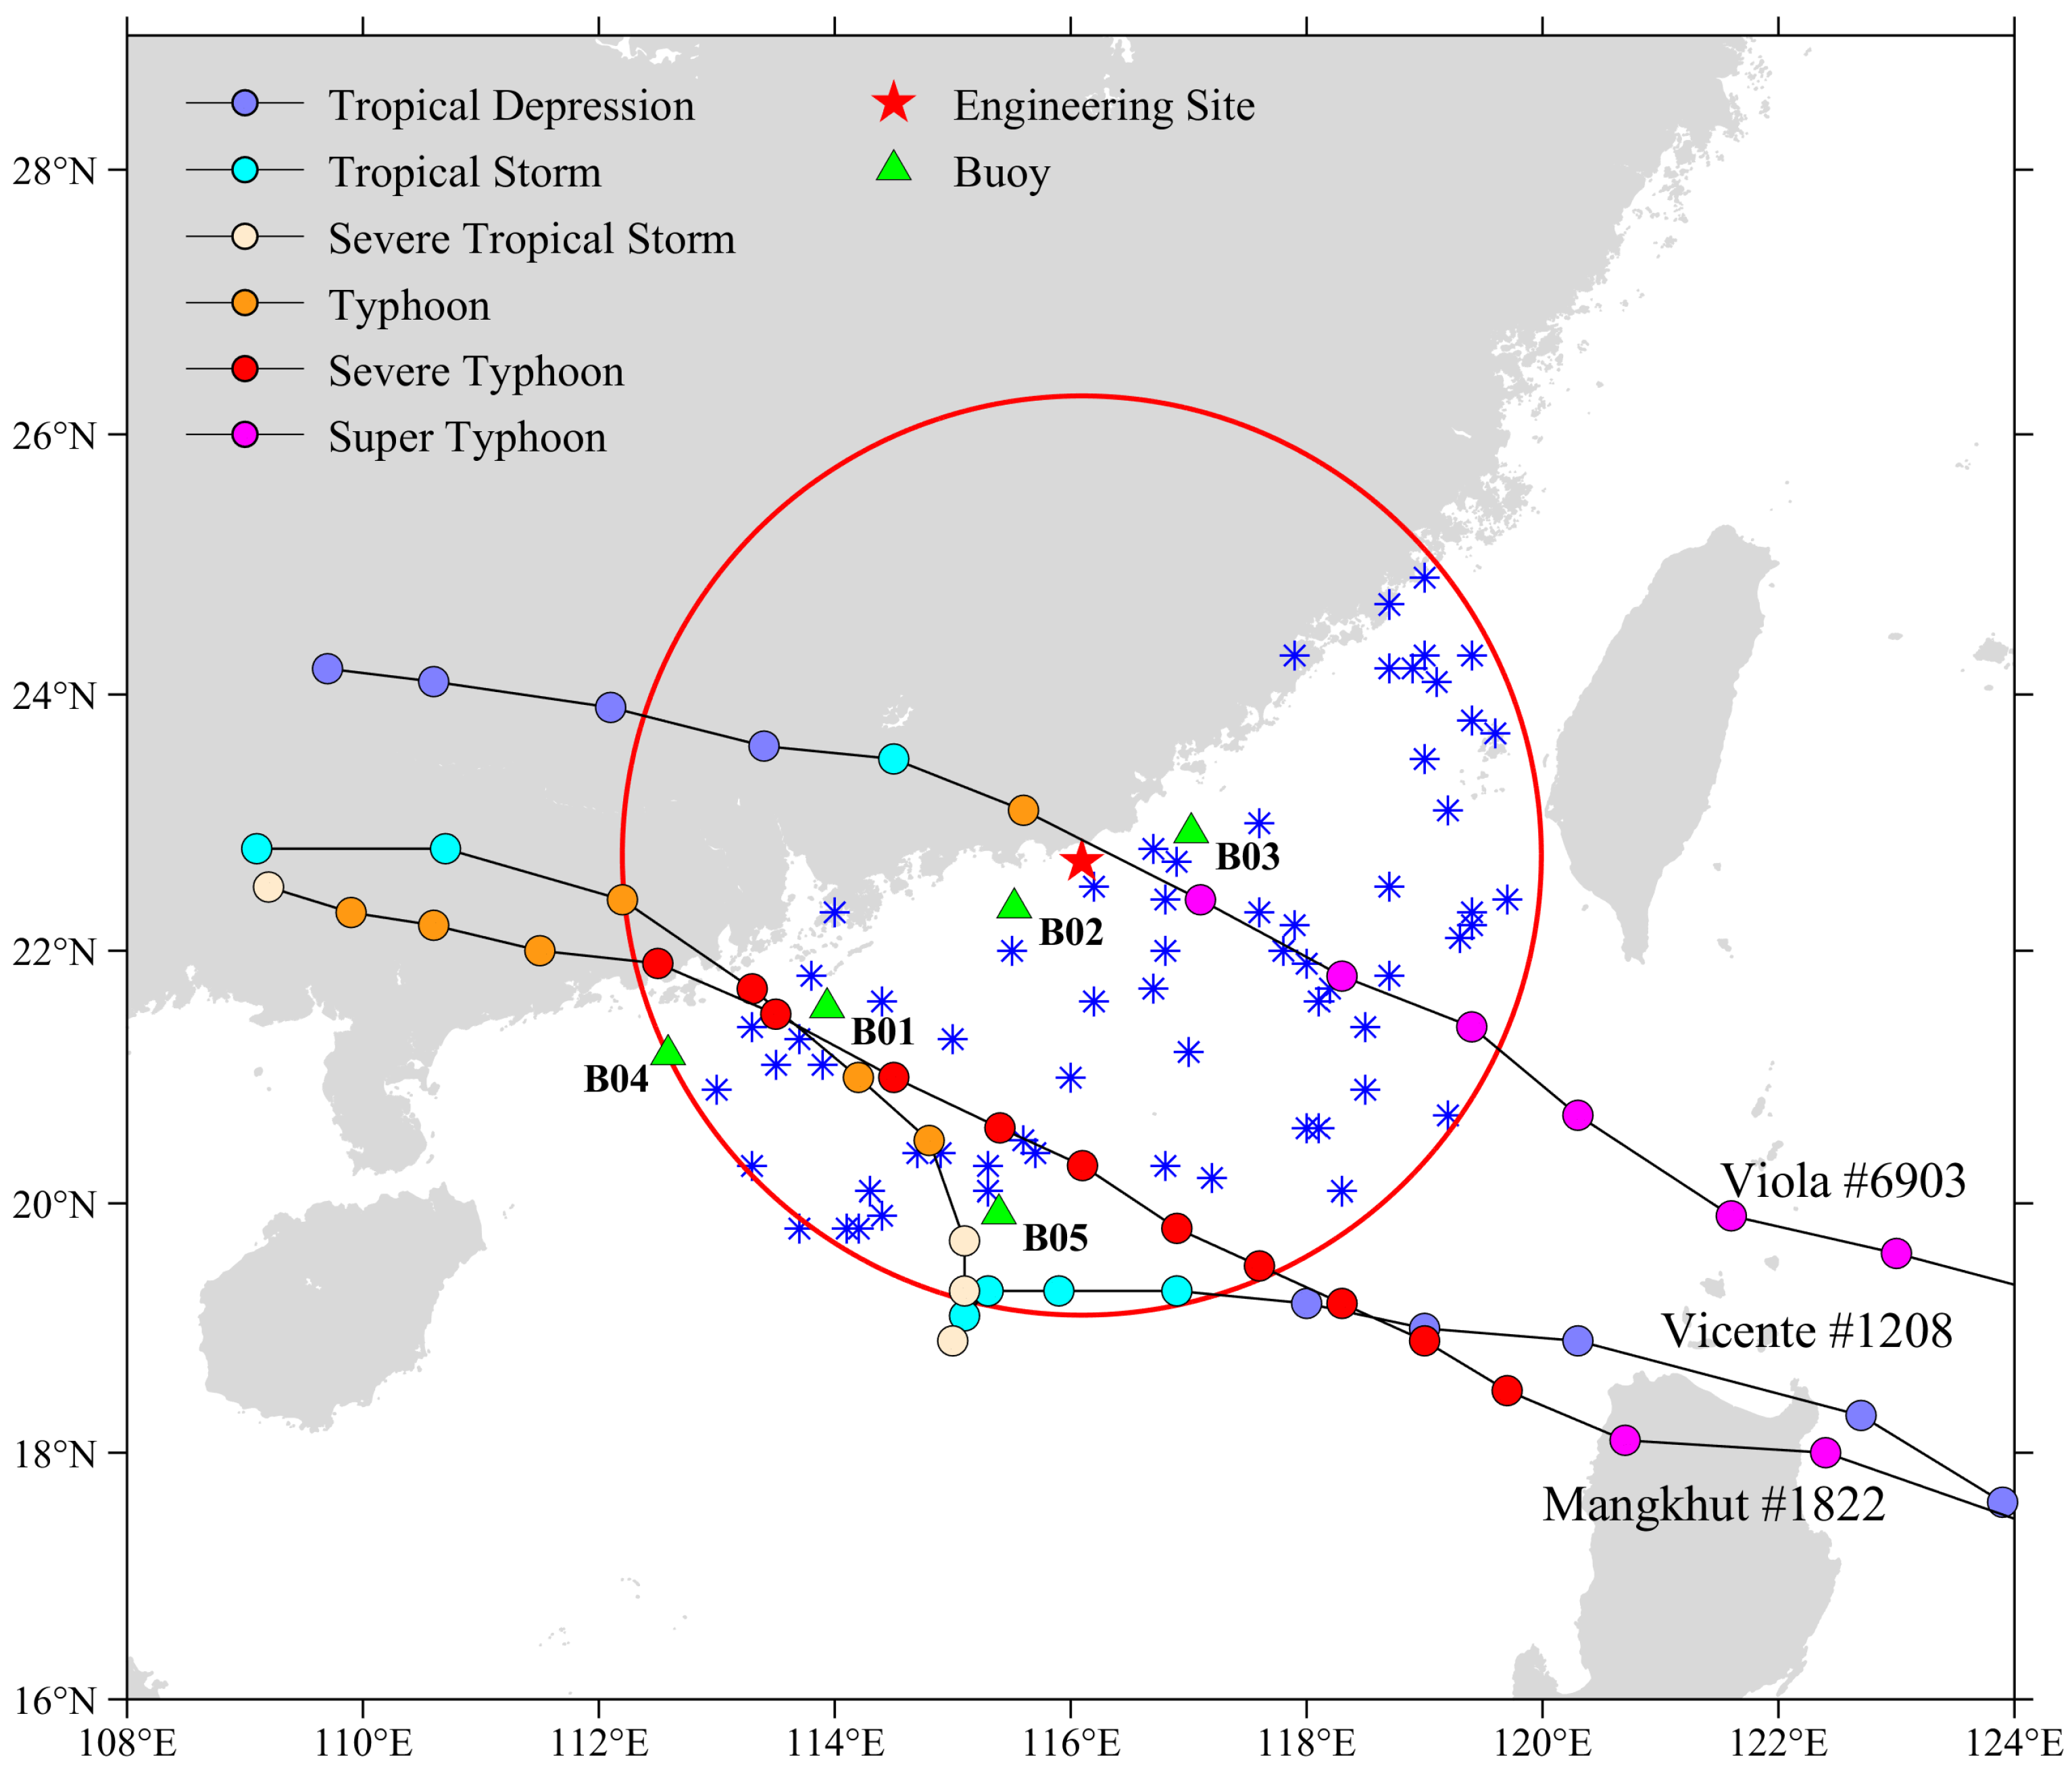
To improve the selection of further engineering sites, the present study defines the research area centering on a demonstration engineering site at (116°5′40.30″ E, 22°41′58.1″ N) with a radius of 400 km. Figure 1 displays the research area with the positions where typhoons attained their maximum intensities each year. From 1949 to 2019, 155 tropical cyclones (TCs) were found to have passed over the area during the TC period from May to November, namely, 3 super typhoons, 14 severe typhoons, 40 typhoons, 40 severe tropical storms, 34 tropical storms and 27 tropical depressions. On average, 2.2 TCs were observed in the research area per year.
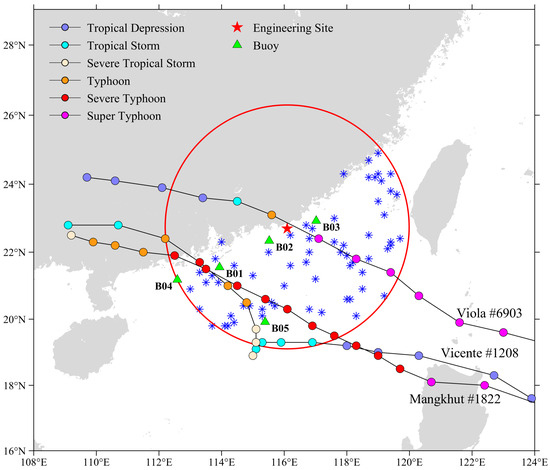
Figure 1.
Overview of the study area, typhoon centers with strongest intensity each year from 1949 to 2019 (red star, blue crosses, and green triangles denote the positions of the engineering site, centers of strongest typhoons per year, and wave buoys, respectively; circles in different colors indicate the typhoon center at various intensity levels) and the tracks and intensities of Typhoons Viola (6903), Vicente (1208), and Mangkhut (1822). All figures were plotted using MATLAB (Version 2018b).
2.2. Wave Observations from In Situ Wave Buoys
Wave buoy systems, representing advanced autonomous marine observation platforms, provide reliable telemetric measurements of critical oceanographic parameters. For model validation purposes, this study utilized high-resolution wave observations from a network of five directional wave buoys strategically deployed in the northern South China Sea (Figure 1 and Table 1). Wave variables were observed using the Datawell Directional Waverider Buoy (Datawell BV, Haarlem, The Netherlands), which is widely recognized as the global gold standard for high-precision directional wave measurements due to its gravity-stabilized platform sensor technology and real-time heave-based spectral output. The buoy array captured comprehensive wave parameters, including the wave height, peak period, and mean wave direction as detailed in Table 2.

Table 1.
Spatiotemporal characteristics of wave buoys.
Table 2.
Wave parameter measurement specifications from buoy observations.
2.3. SWAN Model for Typhoon-Induced Wave Simulation
The third-generation ocean wave numerical calculation model Simulating WAves Nearshore (SWAN) [25] is adopted in the present study along with the governing equation based on the spectral action density balance in Cartesian coordinates:
The first term on the left side of the equation represents the temporal variation of action density, while the second and third terms describe the spatial propagation of wave energy in geographical coordinates. The fourth term accounts for frequency shifting induced by variations in current velocity and water depth, and the fifth term characterizes the combined effects of wave refraction and shoaling due to current and bathymetric changes. The source term S on the right side of the equation incorporates all energy source and sink mechanisms, including wind energy input, white capping dissipation, bottom friction loss, depth-induced wave breaking, quadruplet wave–wave interactions, and triad wave interactions. The propagation velocities Cx, Cy, Cσ, and Cθ stand for transport rates of the dynamic spectral density in the x, y, σ, and θ domains, respectively:
where is the wave number, d is the water depth, is the velocity, s is the spatial coordinate along the direction θ, m is the coordinate perpendicular to , is the relative frequency, and ω is the natural frequency of the wave. The operator is defined as .
For source function terms:
The right three terms are the wind input term, dissipation term, and wave interaction term.
The wave characteristic elements of the output represent the points:
Significant wave height (SWH):
Mean period:
Mean wave direction:
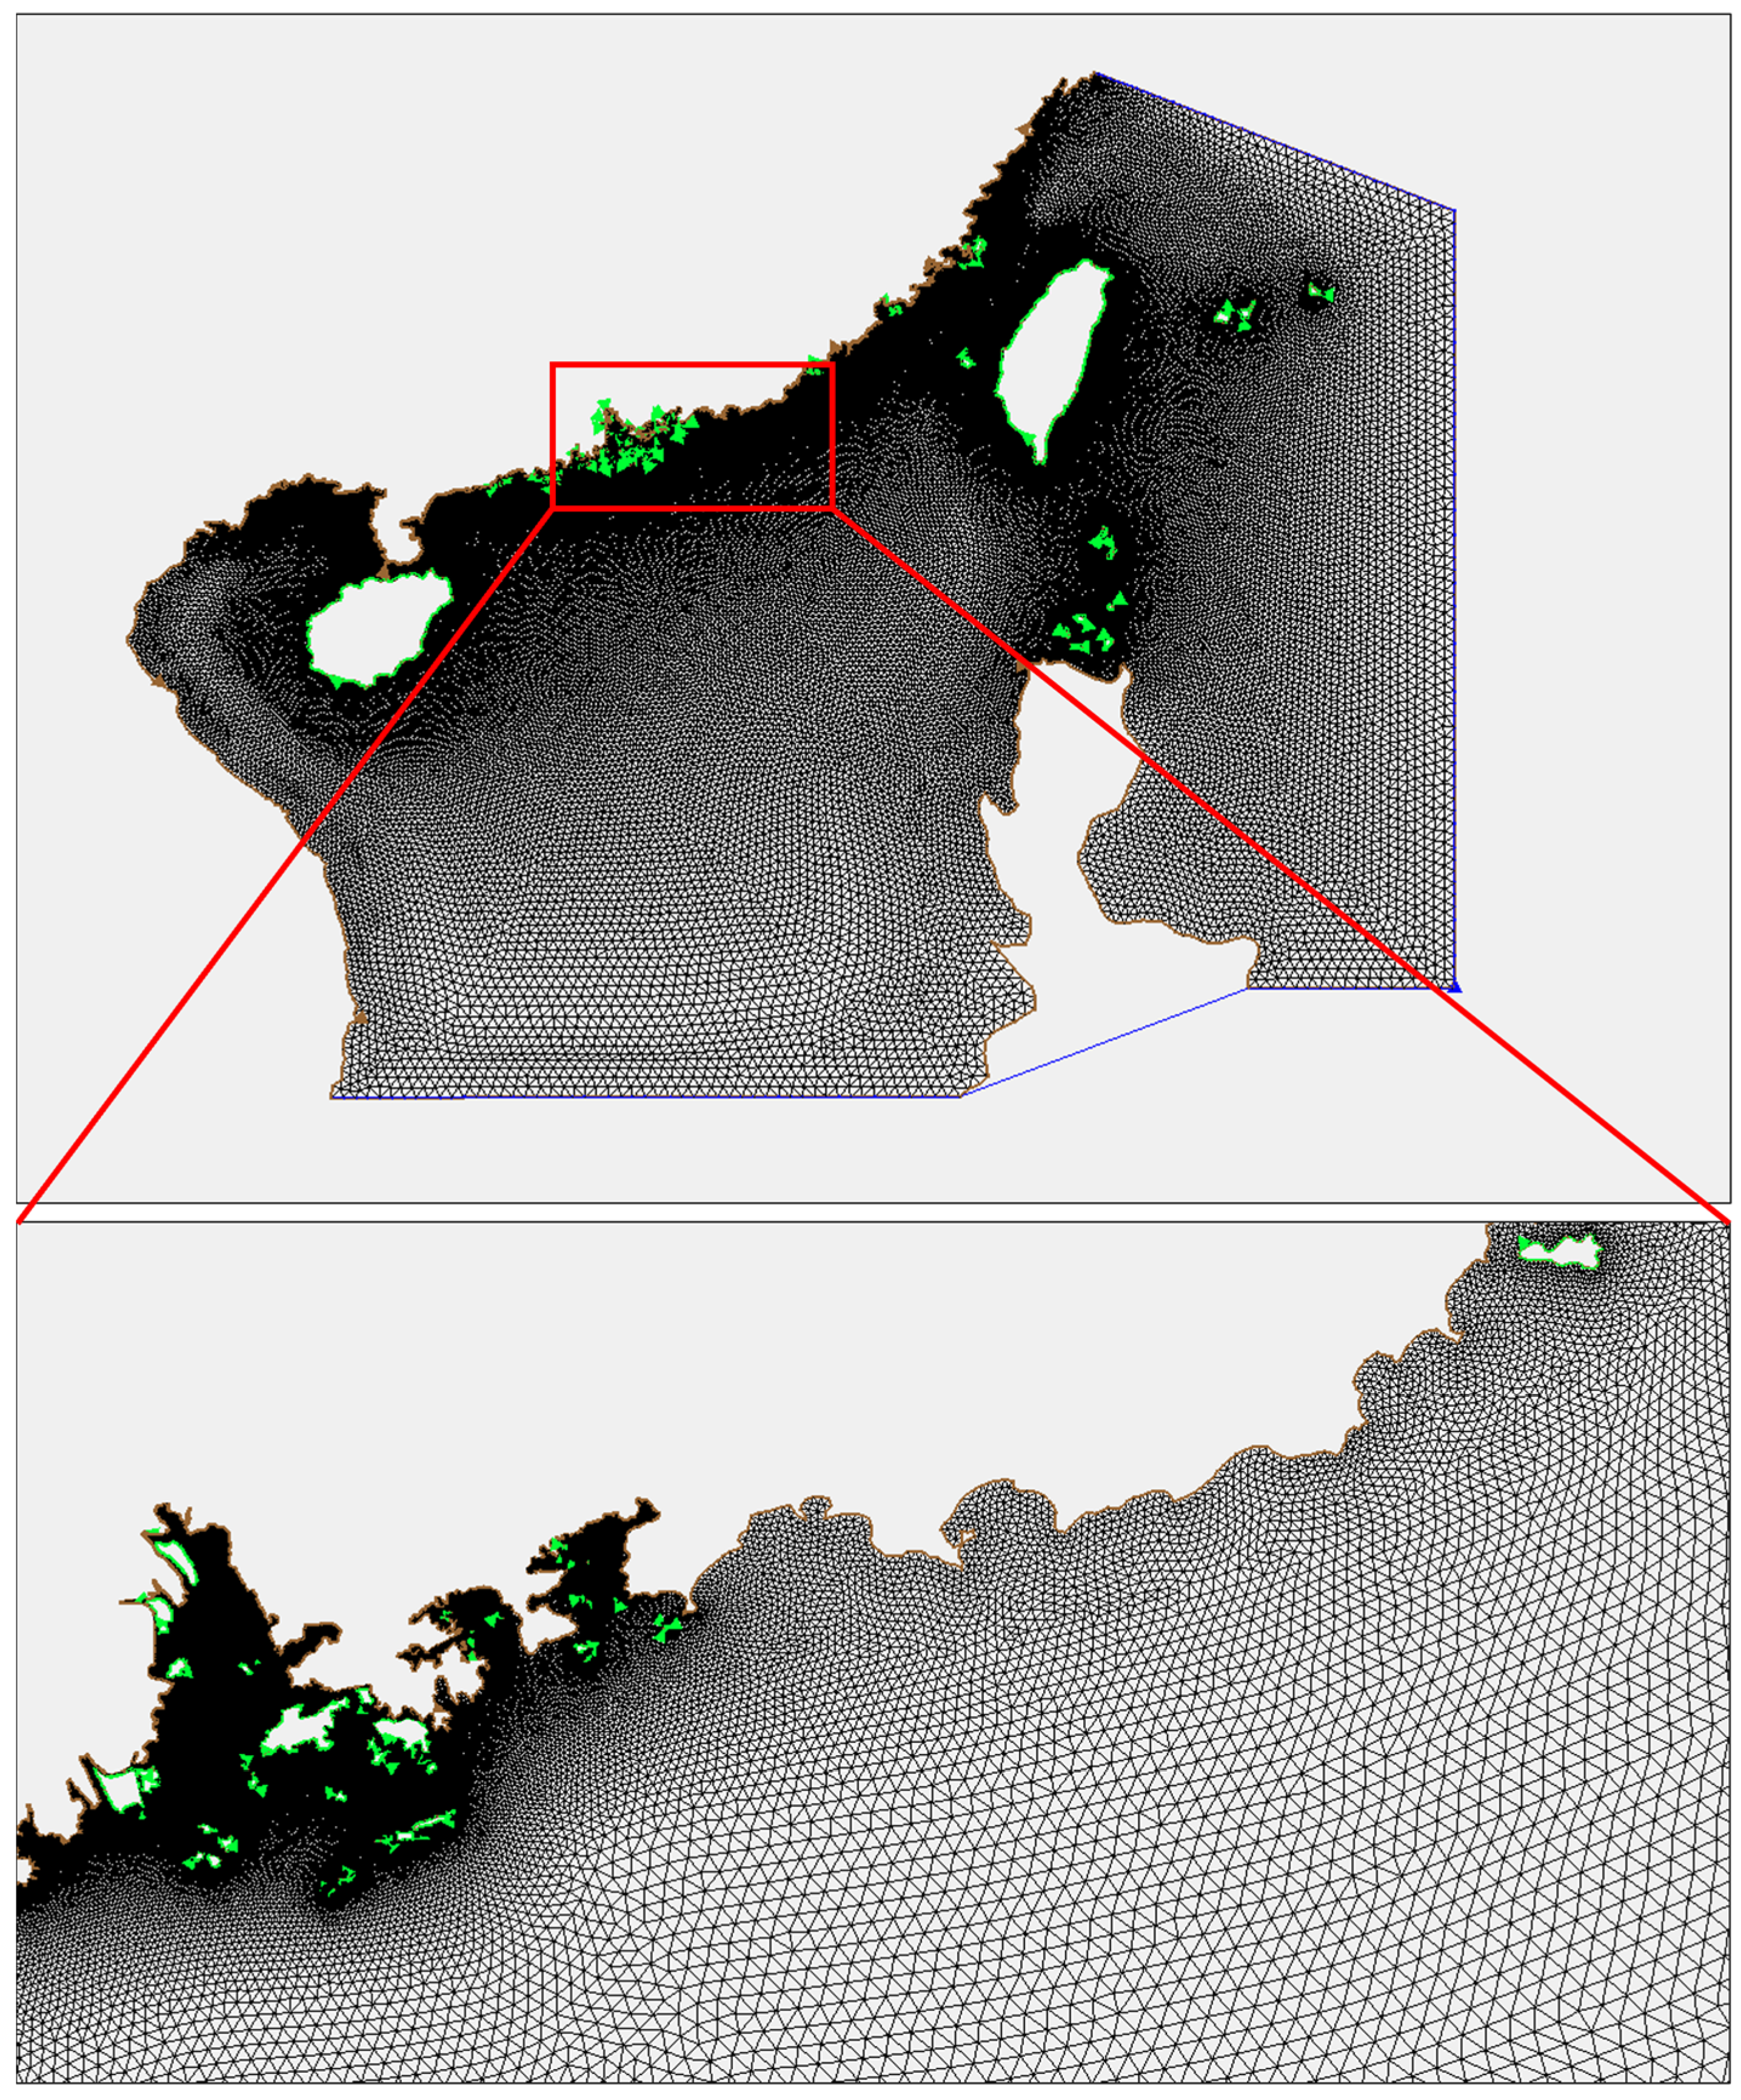
For wave modeling in the study area, an unstructured triangular grid was implemented with local refinement in key regions. The computational domain encompasses the South China Sea, Beibu Gulf, and Taiwan Strait, spanning 105.63° E to 127.66° E and 11.37° N to 28.41° N. The mesh system consists of 89,082 nodes and 170,295 triangular elements, with a spatial resolution varying from 200 m in the study area to 20 km at the open ocean boundaries. This multi-scale grid configuration ensures computational efficiency while maintaining high resolution in areas of interest. The wave spectrum was discretized into 36 directional bins and 24 frequency bins, covering a range from 0.04 Hz to 1 Hz. The model parameterization configuration followed the study by Jia et al. (2023) [26]. The Model parameterization configuration in the SWAN model is shown in Table 3.
Table 3.
Model parameterization configuration in SWAN model.
These parameterizations collectively ensure a comprehensive representation of the physical processes governing wave evolution in the study area. Bathymetric data for the numerical simulations with 1 arc-minute spatial resolution were obtained from the ETOPO1 global relief model provided by the National Oceanic and Atmospheric Administration (NOAA) [31], which can be obtained at https://www.ngdc.noaa.gov/mgg/global/relief/ETOPO1/data/ (accessed on 22 April 2015). The digital elevation data were preprocessed using linear interpolation to ensure smooth depth transitions across the computational domain. The model was integrated with a time step of 300 s to ensure numerical stability and to accurately capture the temporal evolution of typhoon-induced wave fields. At the open boundaries of the model domain, radiation boundary conditions were employed to allow outgoing wave energy to exit without reflection. No external spectral forcing was applied due to the large domain ensuring full wave development under typhoon wind forcing. The spatial distribution of the computational grid and bathymetric features is illustrated in Figure 2.
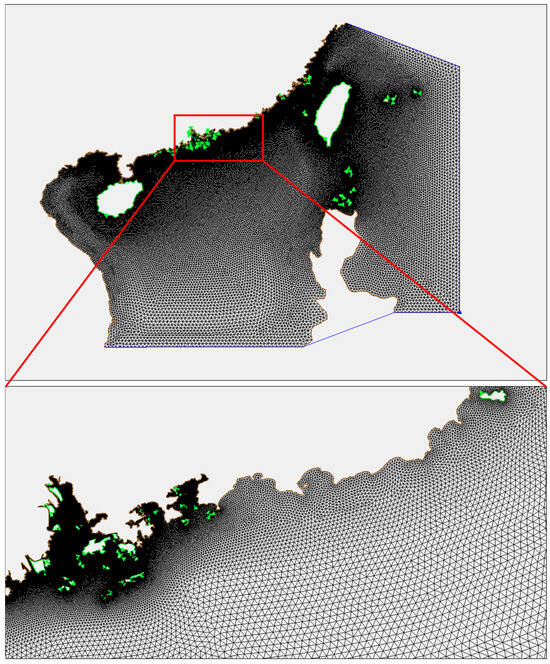
Figure 2.
Overview of the domains covering the research area: Outer domain with grids of 20–200 km and inner domain with grids of 200 m–20 km.
2.4. Typhoon Wind Field Reconstruction
Typhoon winds are constructed using the improved Jelesnianski empirical typhoon formula [32,33] for the input wind conditions of the SWAN model. The improved Jelesnianski empirical typhoon calculation formula is as follows:
where is typhoon winds; r is the distance from grids to the typhoon center; u and v are the zonal and meridional component of typhoon translation speed, respectively; is the maximum wind speed of typhoon, and are the wind speed of the force 10-beaufort and 7-beaufort level, respectively; and are the radius of the force 10-beaufort and 7-beaufort level, respectively; θ is the inflow angle and is set to 15°; are the typhoon center coordinates; and are the coordinates of grids.
3. Results
3.1. Return Period Values of Typhoon Intensity
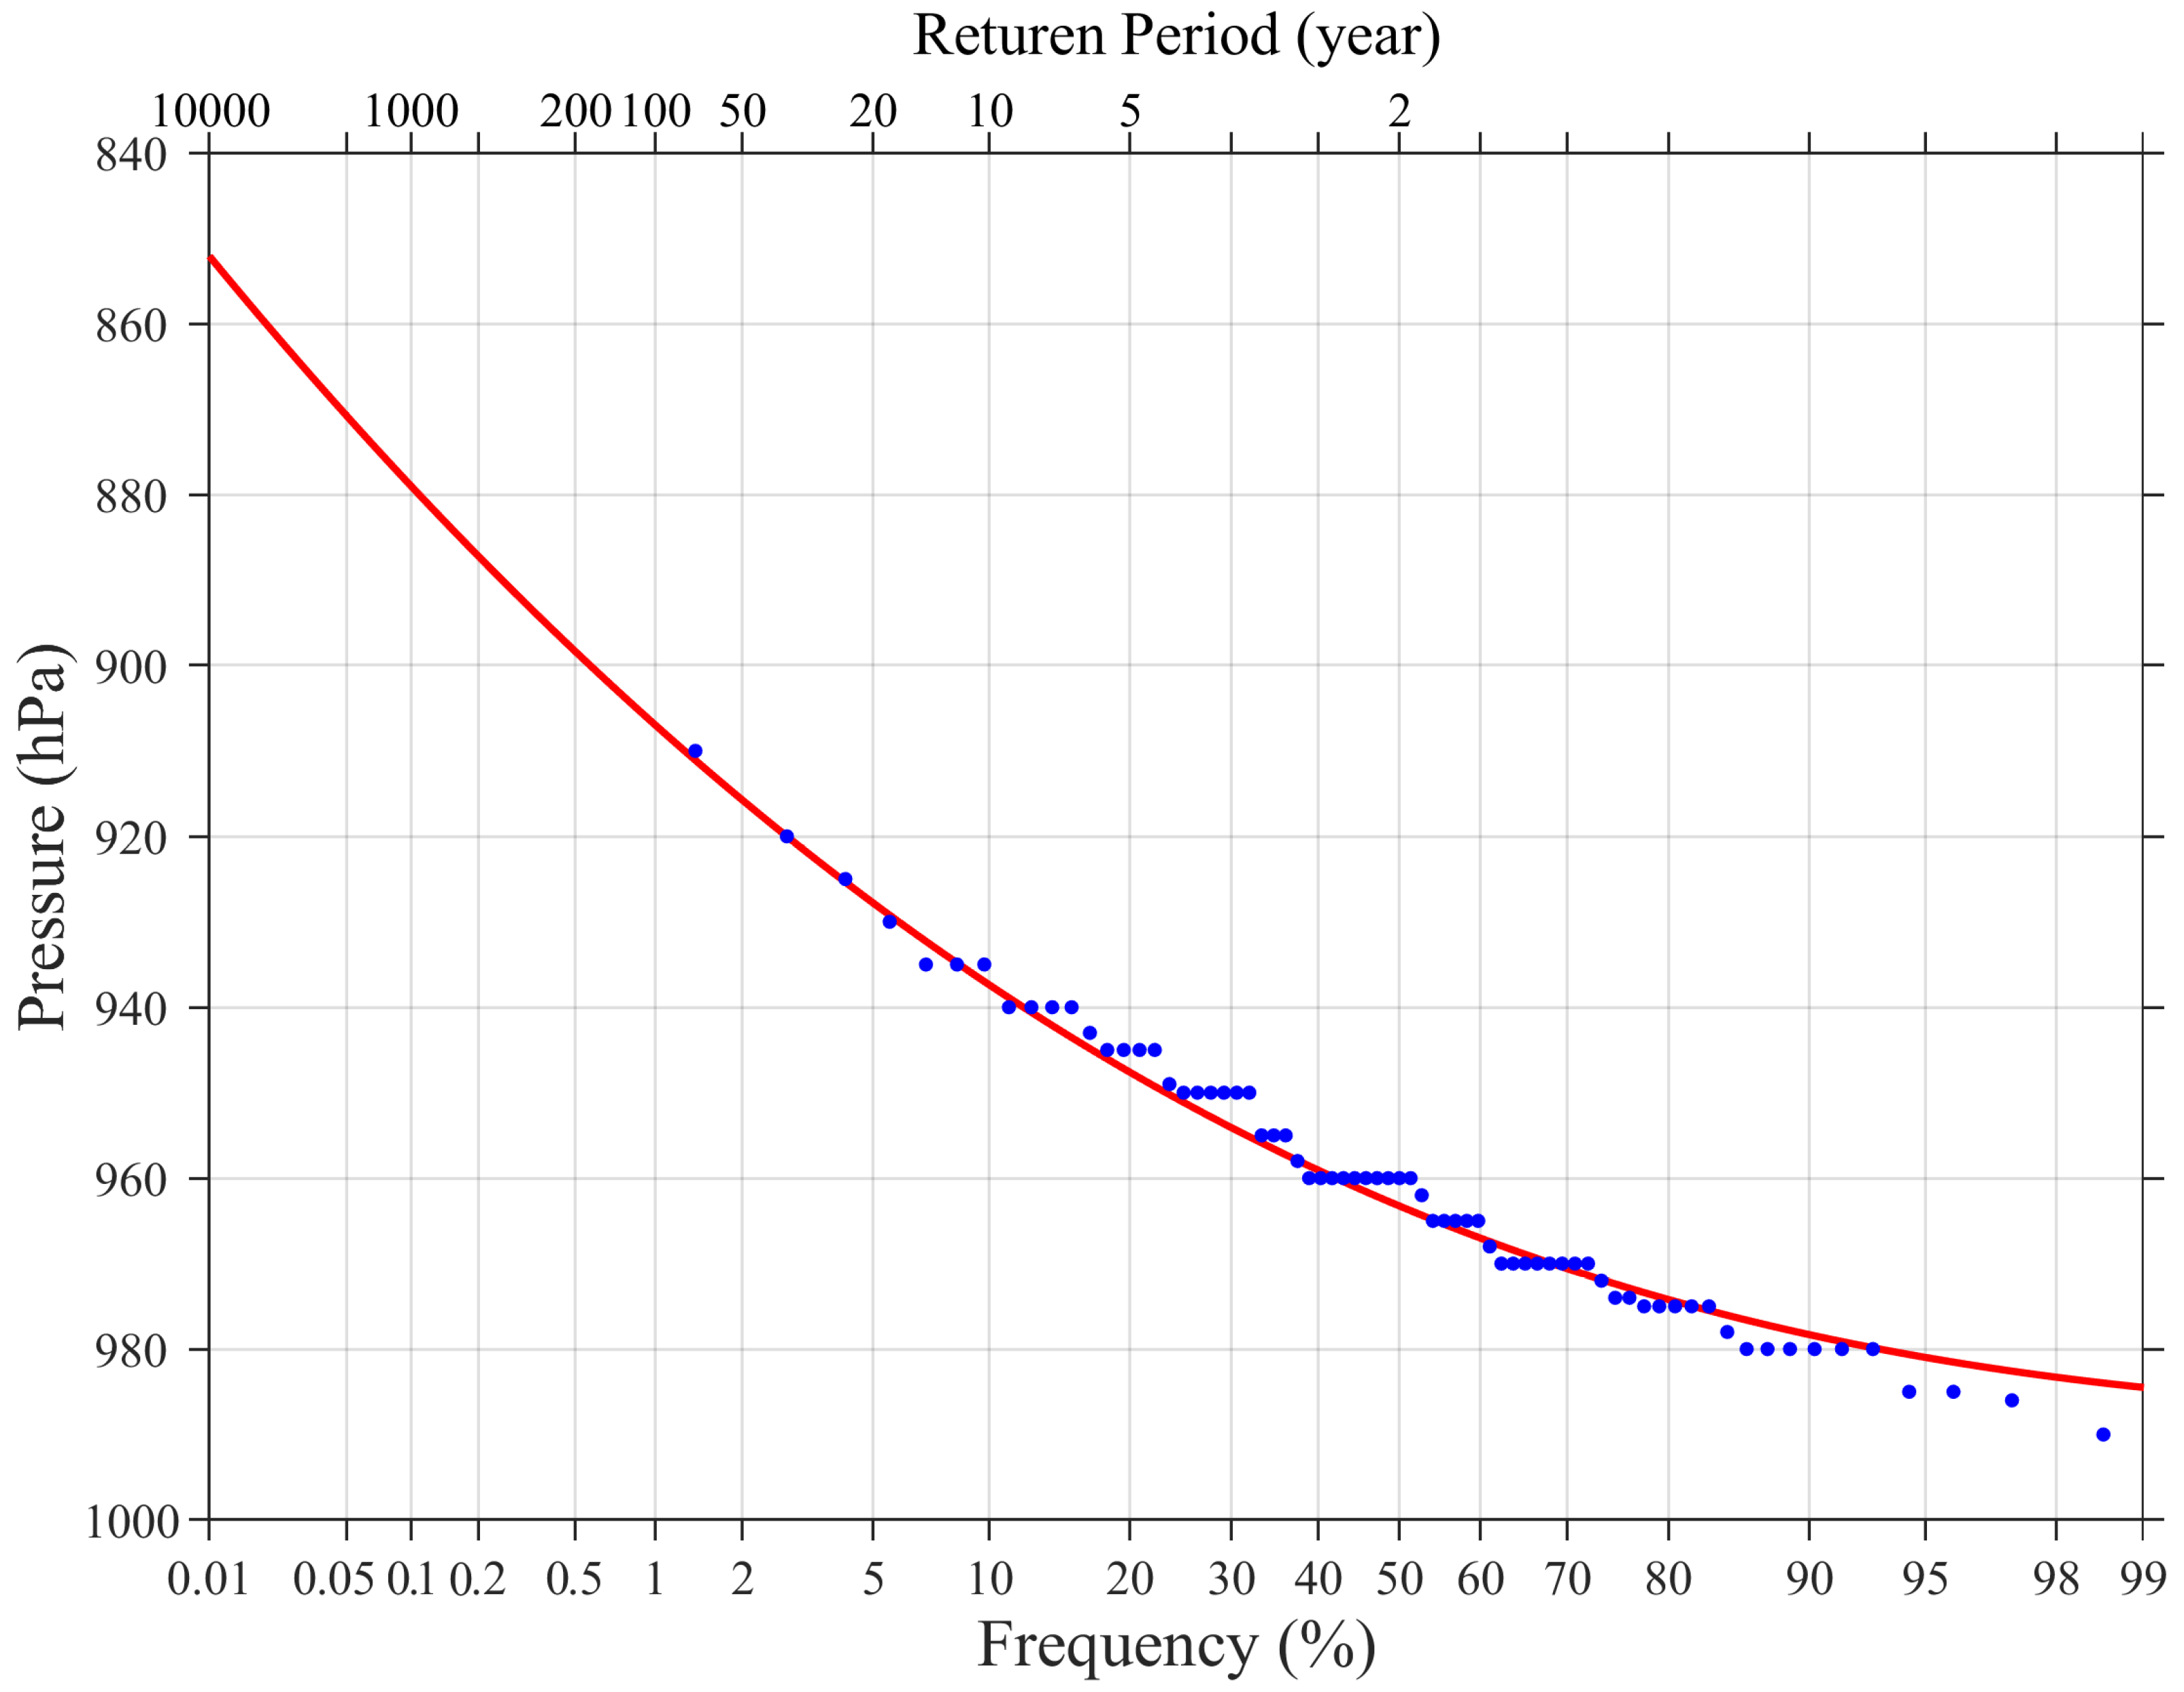
Figure 3 and Table 4 present the return period analysis of typhoon intensity, quantified by MSLP using P-III probability distribution, which is widely used in hydrological and meteorological studies for extreme value analysis. The analysis reveals that the 100-, 50-, 20-, and 5-year return period SLPs in the study area are 907, 916, 927, and 947 hPa, respectively. Among the 155 typhoon cases examined in this study, Super Typhoon Viola (6903) was selected as the representative 50-year event, not only because its intensity matches the 50-year return period benchmark commonly used in engineering design but also due to its trajectory passing near the engineering site. This specific typhoon event was subsequently selected for SWAN numerical modeling of typhoon wave characteristics. Prior to this numerical investigation, the model’s performance was validated using observational data from five wave buoys during two representative typhoon events, ensuring the reliability of the SWAN simulations for typhoon-induced wave conditions.
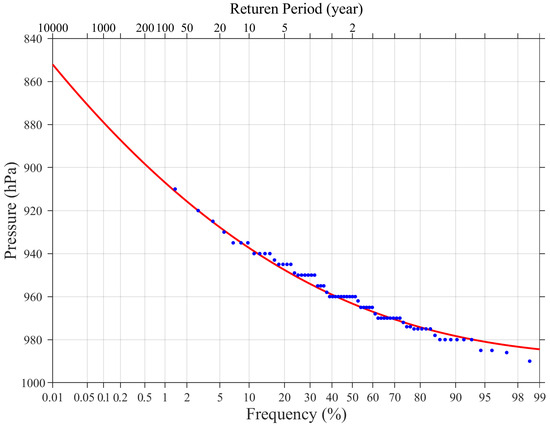
Figure 3.
Results of P-III analysis of typhoon intensities in MSLP from 1949 to 2019 (blue dots and red curve denote the MSLP and the fitted result, respectively).
Table 4.
Results of P-III analysis of typhoon intensities in MSLP from 1949 to 2019.
3.2. Verification of SWAN Simulations in Typhoon Waves
To evaluate the SWAN model’s performance in simulating typhoon-induced wave fields, we conducted a comprehensive validation framework utilizing high-resolution observational data from five wave buoys deployed in the study area during two representative typhoons, i.e., Vicente (1208) and Mangkhut (1822) (Figure 1). The buoy measurements encompassed comprehensive wave parameters, providing a robust dataset for model verification.
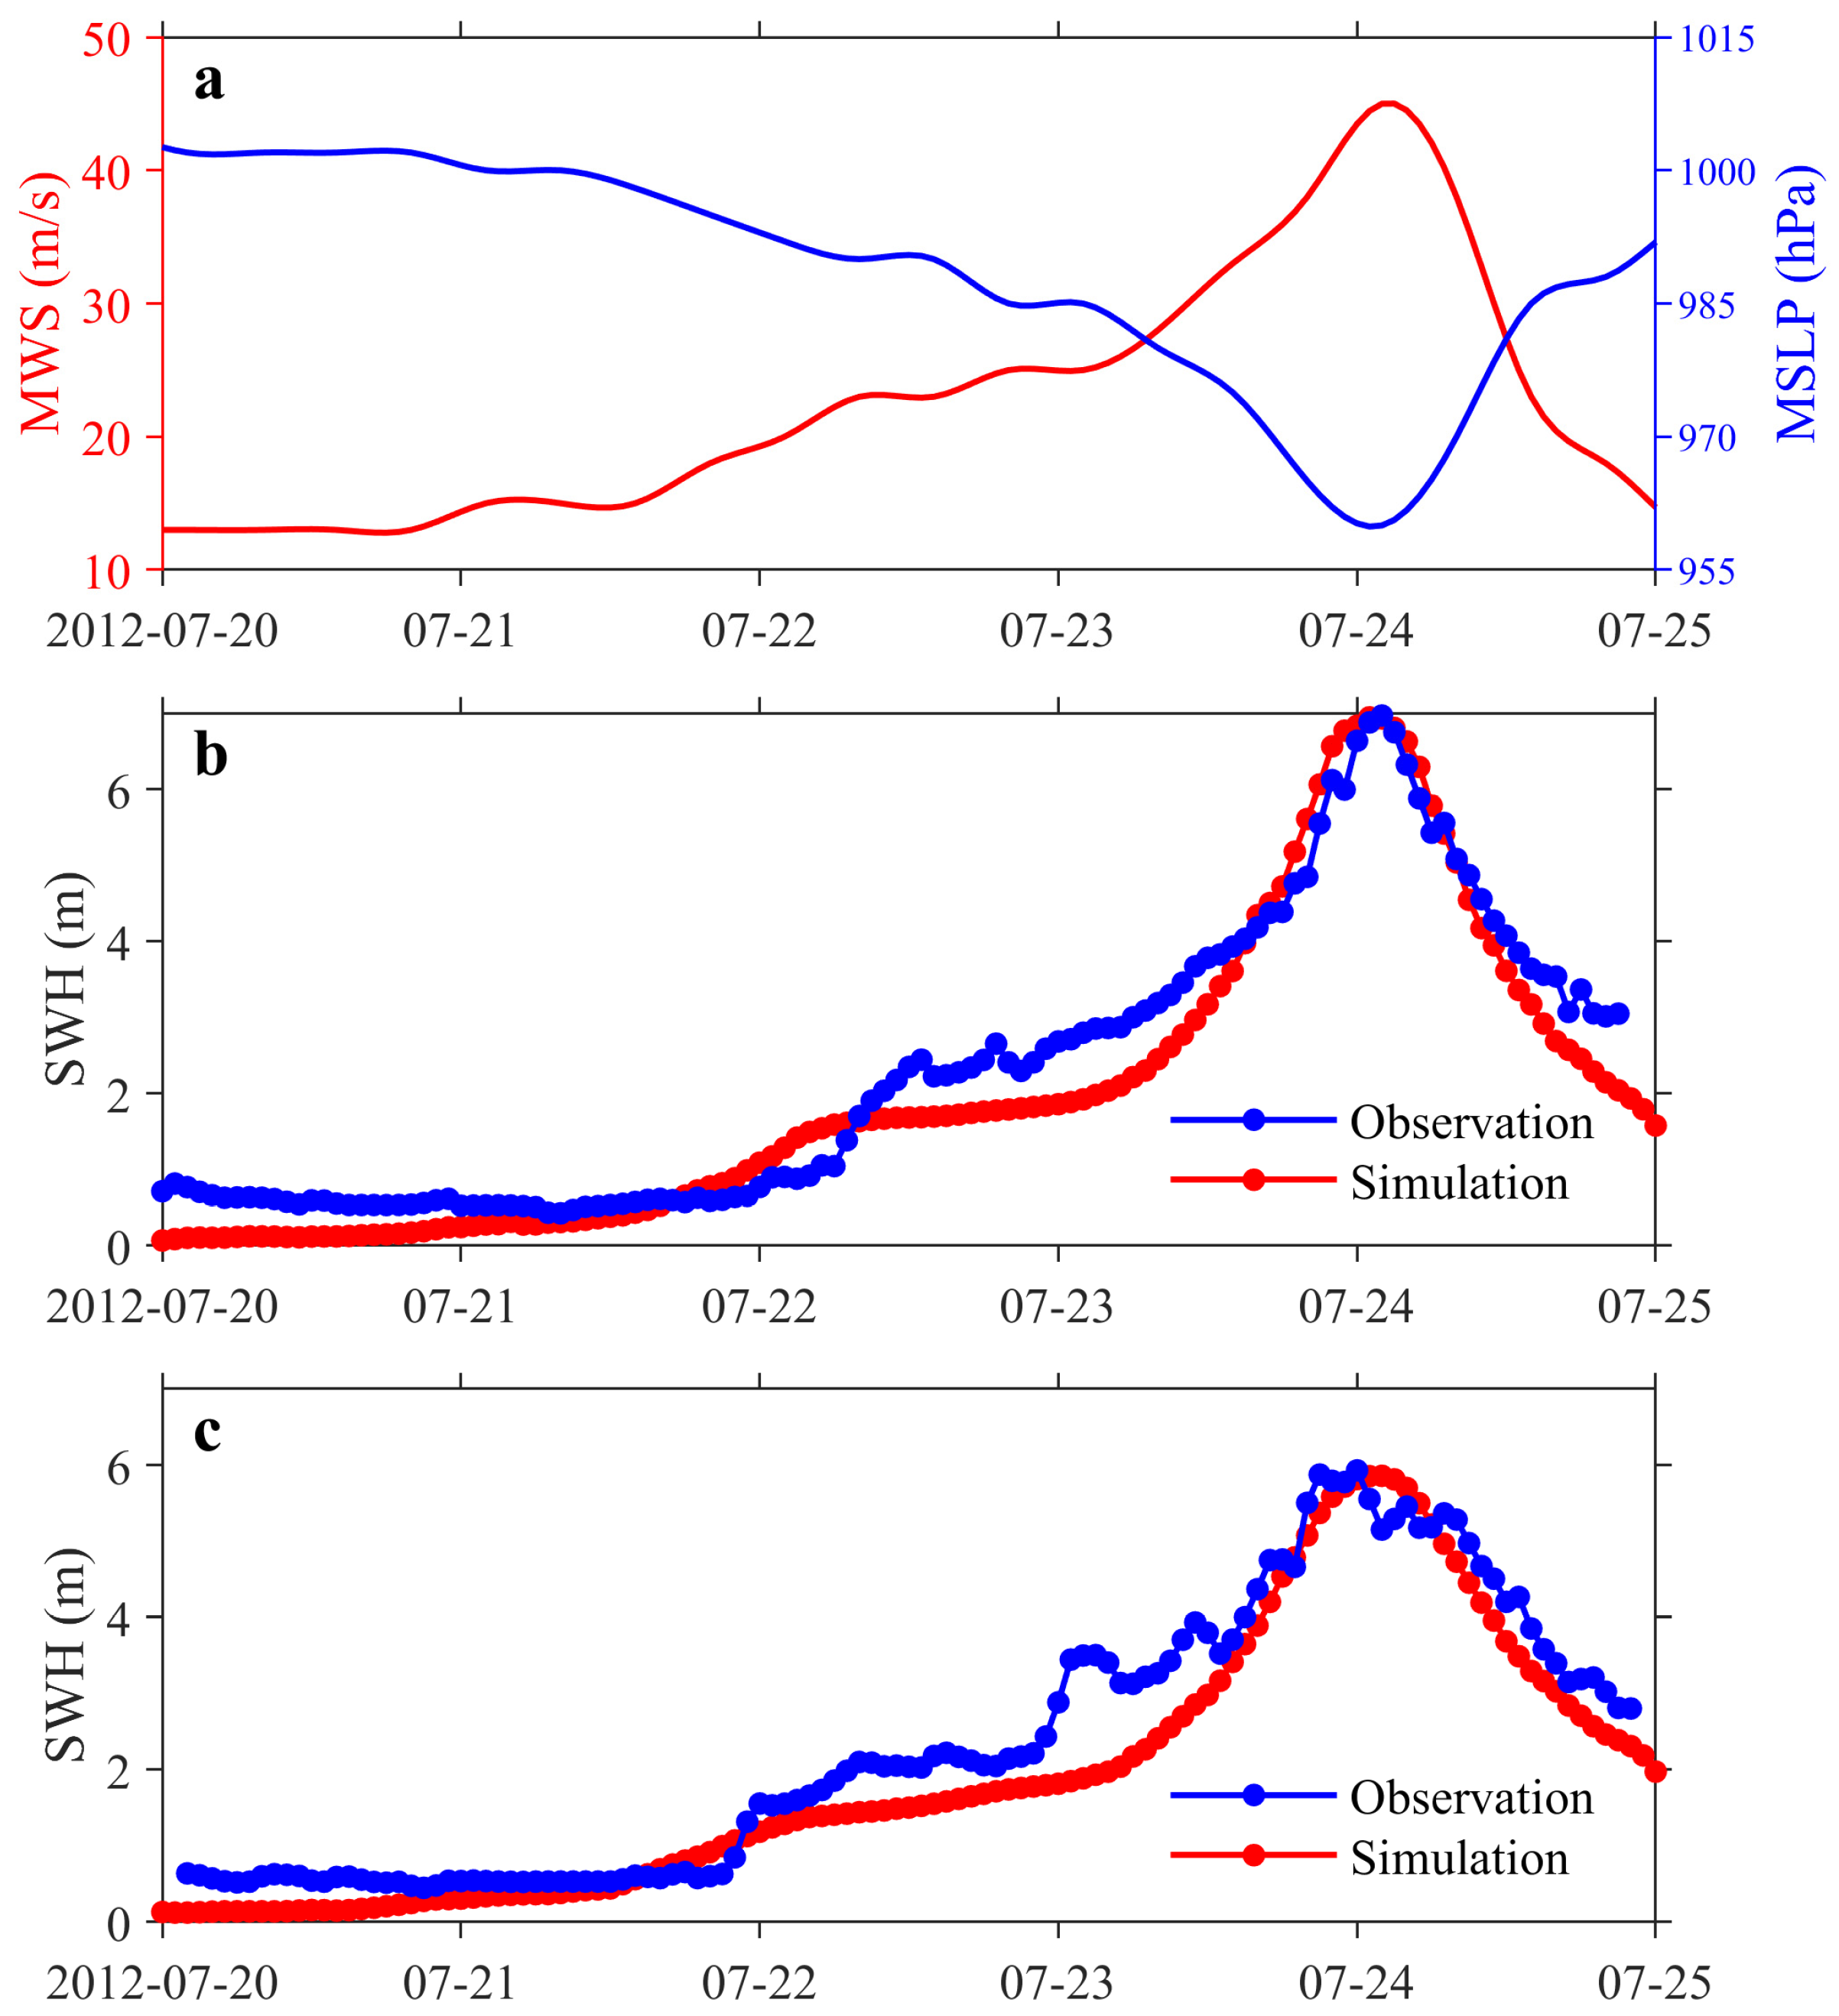
Figure 4 displays the development of Typhoon Vicente’s intensity (in 10 m MWS and MSLP) and compares the SWAN simulated SWH with buoy observations (from B01 and B02) during the typhoon period from 20 July 2012 to 25 July 2012. Typhoon Vicente was generated on 20 July 2012 over the Western North Pacific (WNP), entered the SCS on 22 July, and made landfall in Guangdong, China, on 24 July. The maximum typhoon intensity attained 45 m/s in 10 m MWS and 960 hPa in MSLP (Figure 4a). As revealed in the figures, the SWAN model demonstrates remarkable accuracy in simulating SWH in comparison with observations (Figure 4b,c) during typhoon development (Figure 4a). The simulated SWH values of 6.94 m at B01 and 5.86 m at B02 show excellent correspondence to the observed measurements of 6.97 m and 5.93 m, respectively (Figure 4b,c). Temporal analysis reveals that the observed SWH exhibits pronounced oscillations, potentially attributable to the complex interplay of submesoscale oceanic processes and atmospheric forcing mechanisms. Furthermore, the comparative analysis between buoy locations reveals a distinct spatial gradient in wave energy distribution, with wave intensities at the proximal station B01 (near the cyclone center) exceeding those at the distal station B02 by approximately 18.4% (Figure 1 and Figure 4b,c).
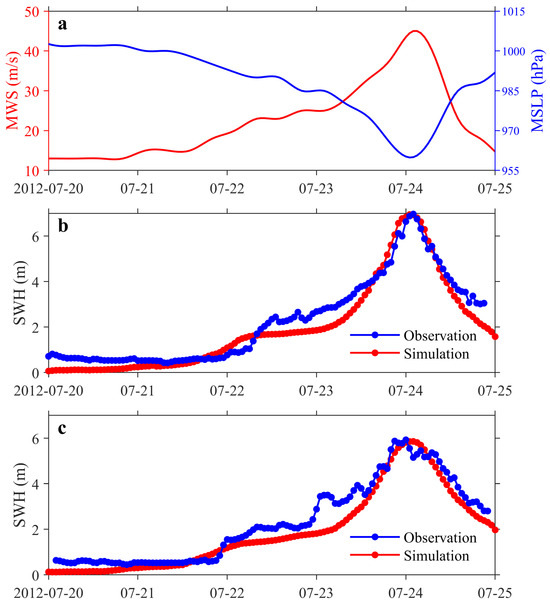
Figure 4.
(a) Temporal evolution of Typhoon Vicente’s intensity and the comparisons of the SWH between simulations and observations from buoy (b) B01 and (c) B02.
Figure 5 illustrates the temporal evolution of Typhoon Mangkhut’s intensity parameters, including 10 m MWS and MSLP, during its active period from 8 to 18 September 2018. The figure simultaneously presents a comprehensive comparison between the SWAN simulated SWH and in situ measurements obtained from four wave buoys (B01, B03, B04, and B05) during the peak typhoon impact period from 15 to 17 September 2018. Typhoon Mangkhut originated over the WNP on 7 September 2018, following a northwestward trajectory that resulted in successive landfalls on Luzon Island on 15 September and Chinese mainland on 16 September. Prior to the China landfall, Typhoon Mangkhut reached intensity with an MWS of 48 m/s and MSLP of 945 hPa (Figure 1 and Figure 5a). As demonstrated in Figure 5, the SWAN model successfully reproduces the observed wave characteristics with high fidelity. The simulated SWHs of 9.2 m (B01), 7.5 m (B03), 6.2 m (B04), and 9.9 m (B05) show excellent agreement with the corresponding observational data, which exhibited values of 9.21 m, 8.0 m, 6.3 m, and 10.0 m at these respective buoy stations. The mean absolute percentage error of 3.2% across all stations confirms the model’s capability to accurately replicate actual typhoon-induced wave dynamics. Furthermore, the spatial distribution of wave heights reveals a distinct radial dependence, with wave energy characteristics showing significant variation as a function of distance from the typhoon center, consistent with theoretical expectations of tropical cyclone wave fields.
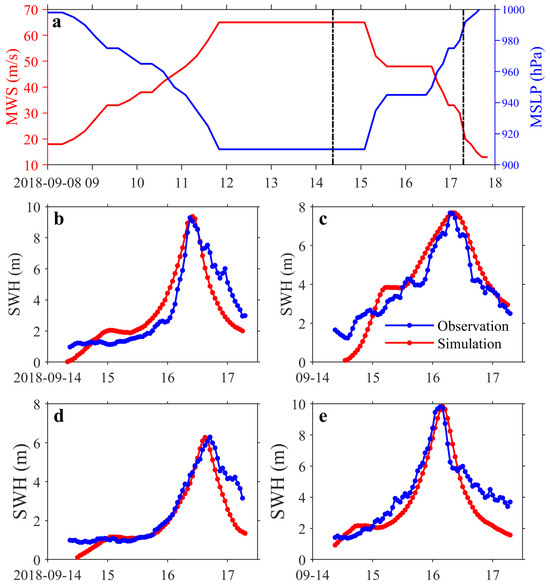
Figure 5.
(a) Temporal evolution of Typhoon Mangkhut’s intensity and the comparison of the SWH between simulations and observations from buoy (b) B01, (c) B03, (d) B04, (e) B05.
3.3. Temporal Evolution of 50-Year Return Period Typhoon-Induced Waves
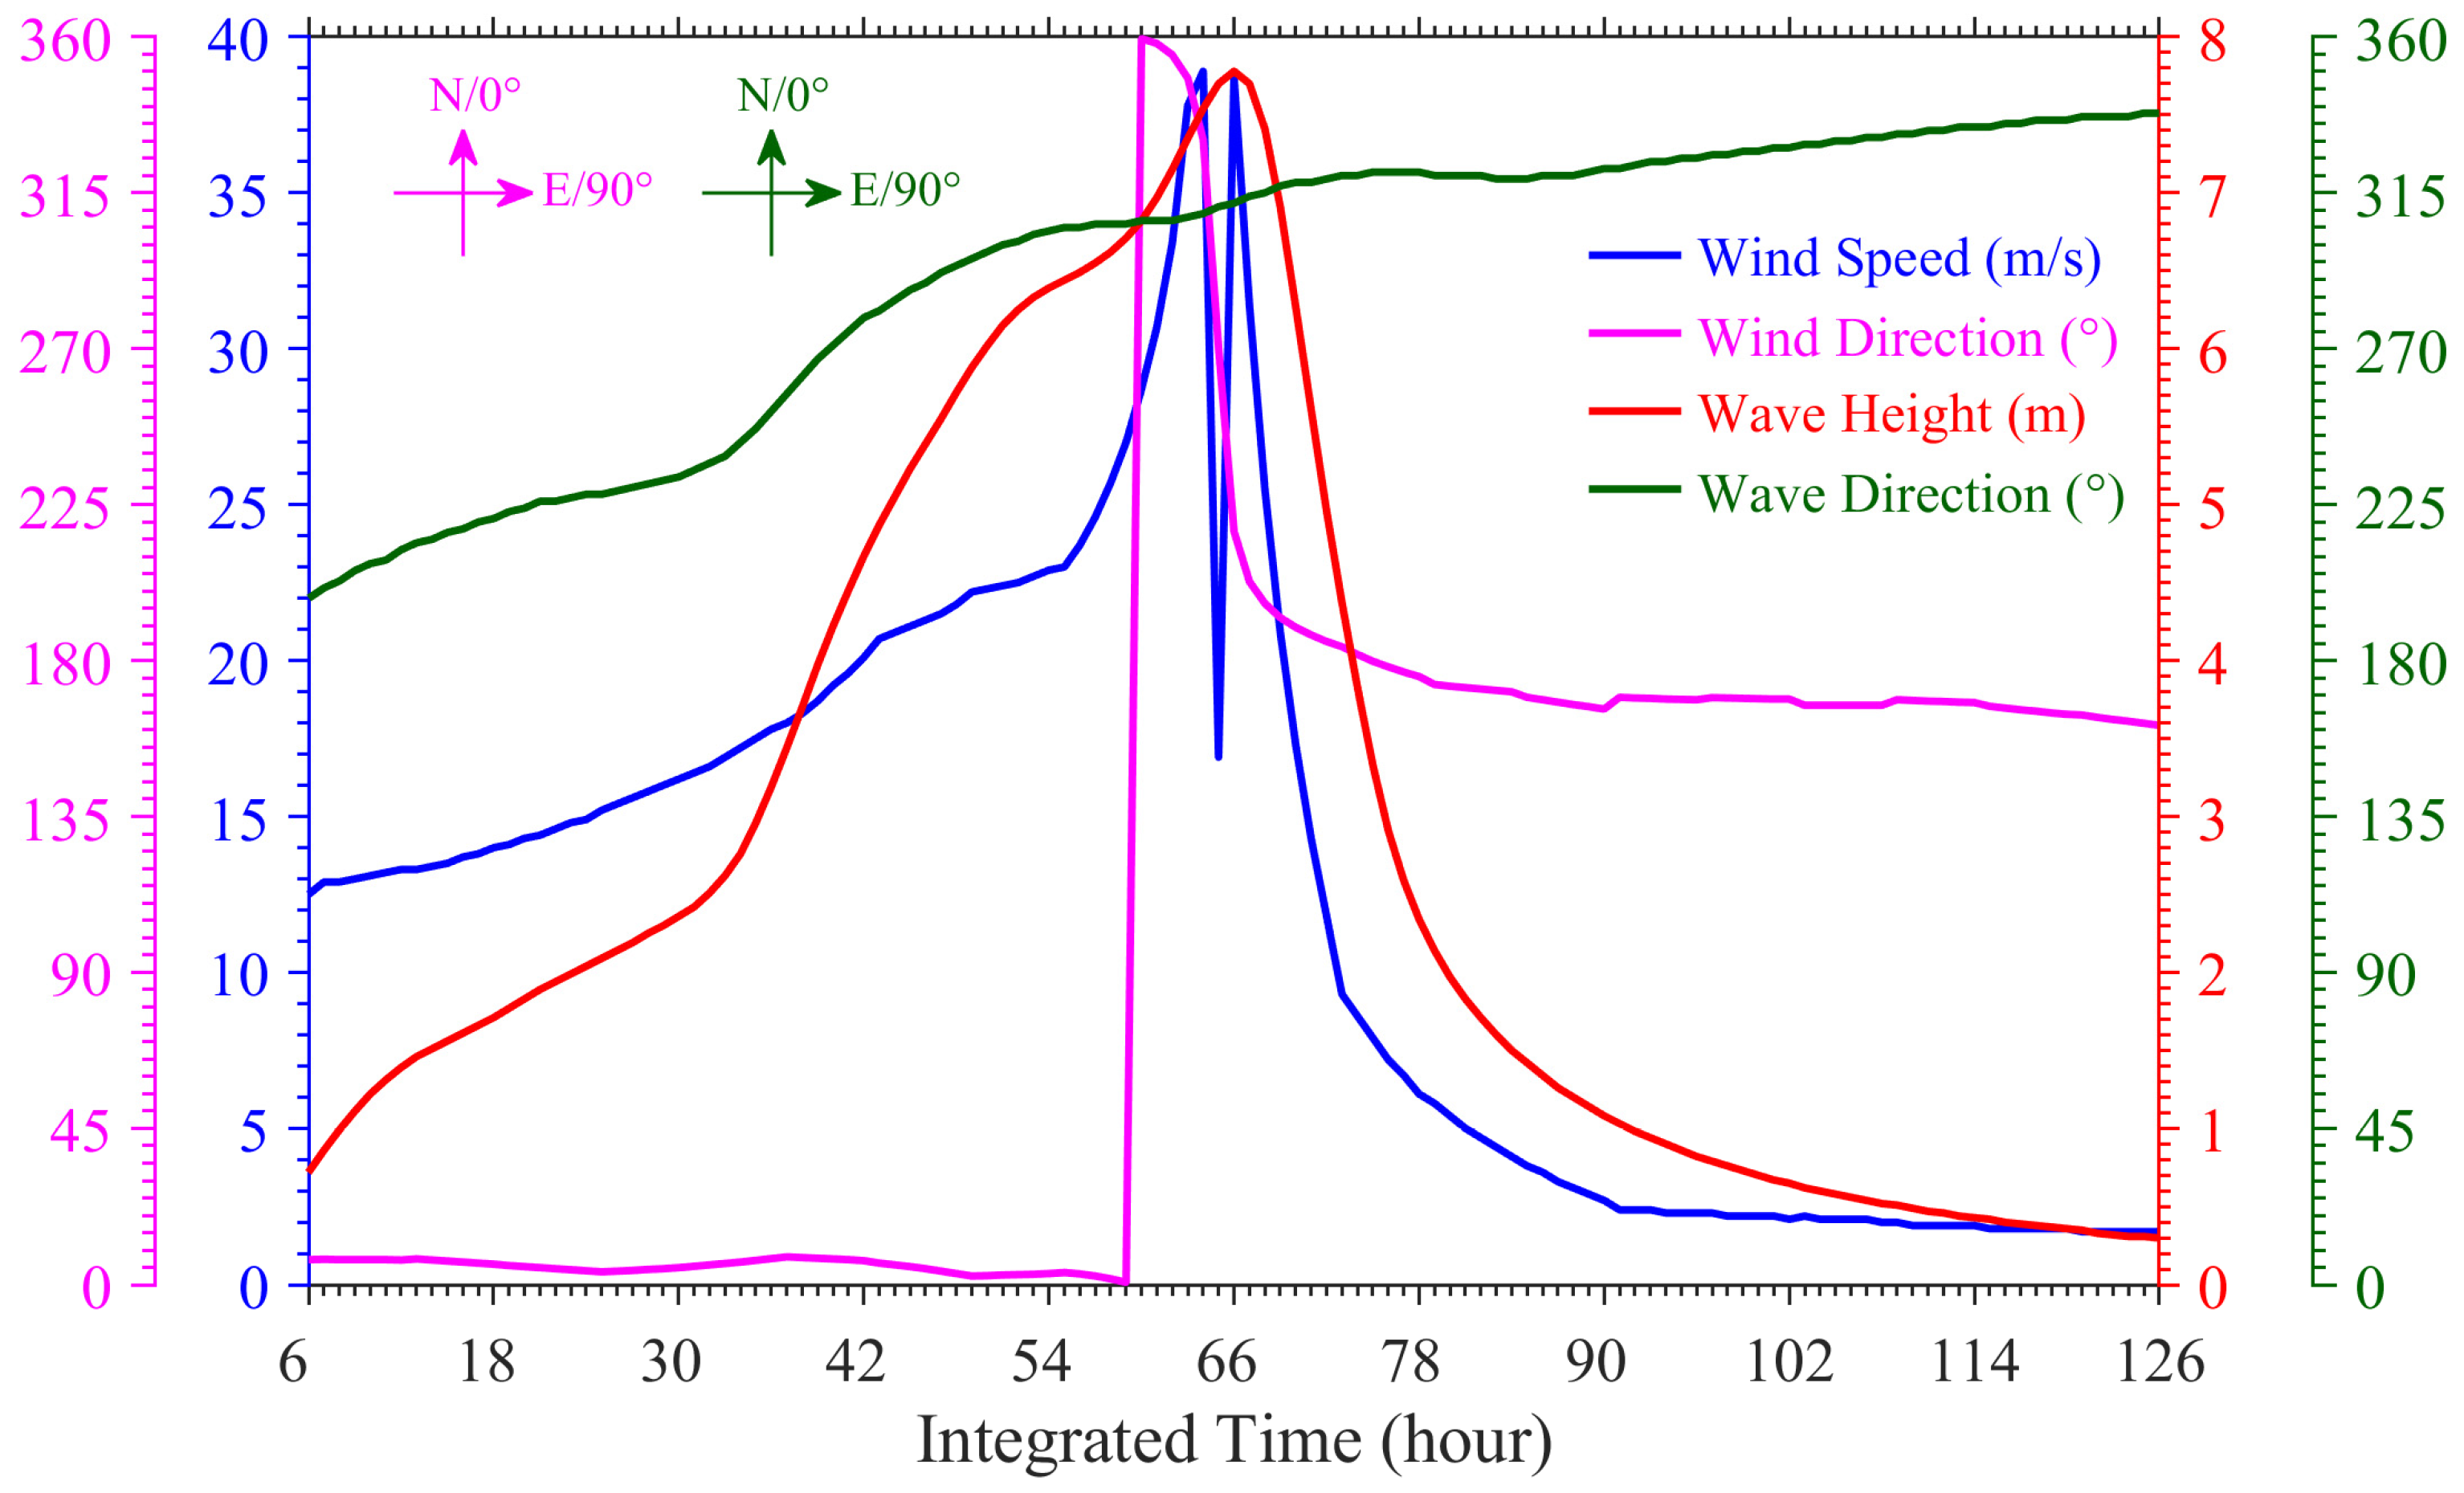
Figure 6 illustrates the temporal evolution of typhoon wind fields generated using Jelesnianski’s formulation and the corresponding SWAN-simulated wave characteristics during Typhoon Viola (6903), which represents a 50-year return period event. The wind field analysis reveals a bimodal distribution with peak wind speeds reaching 38.9 m/s and 38.7 m/s at the 64th and 66th hour, respectively, indicating the typhoon’s direct influence on the engineering site (Figure 1). During this period, the wind direction underwent a rapid transition from northerly (~0°) to southerly (150°–180°) components, reflecting the cyclonic rotation of the typhoon system.
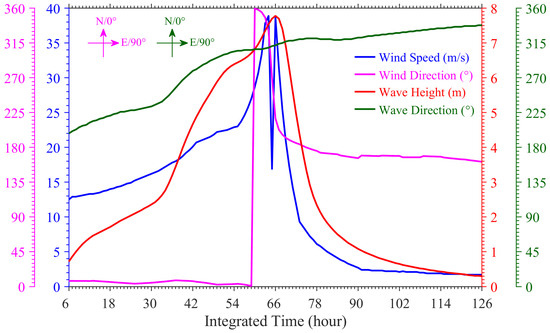
Figure 6.
Results of the wind speed (blue line), wind direction (magenta line), and simulated SWH (red line) and wave direction (green line) during Typhoon Viola at the engineering site.
The wave field response to these atmospheric forcing conditions exhibited distinct characteristics (Figure 6). As Typhoon Viola approached the study area, the SWH demonstrated a progressive increase, reaching its maximum value of 7.78 m at the 66th hour of model integration, coinciding with the typhoon’s closest approach to the site. Figure 6 also reveals a distinct asymmetry in the growth and decay characteristics of typhoon-induced waves, particularly evident around the 66th hour. The pre-peak phase demonstrates a gradual, quasi-linear increase in wave energy, reflecting the progressive accumulation of wind energy input over time. In contrast, the post-peak phase exhibits an exponential decay pattern, with wave energy dissipating rapidly following the cessation of wind forcing. The wave direction showed a strong correlation with the rotating wind field, while also being modulated by the coastal topography of the Chinese mainland. This spatiotemporal coupling between wind and wave fields highlights the complex interaction between atmospheric forcing and oceanographic response during extreme typhoon events.
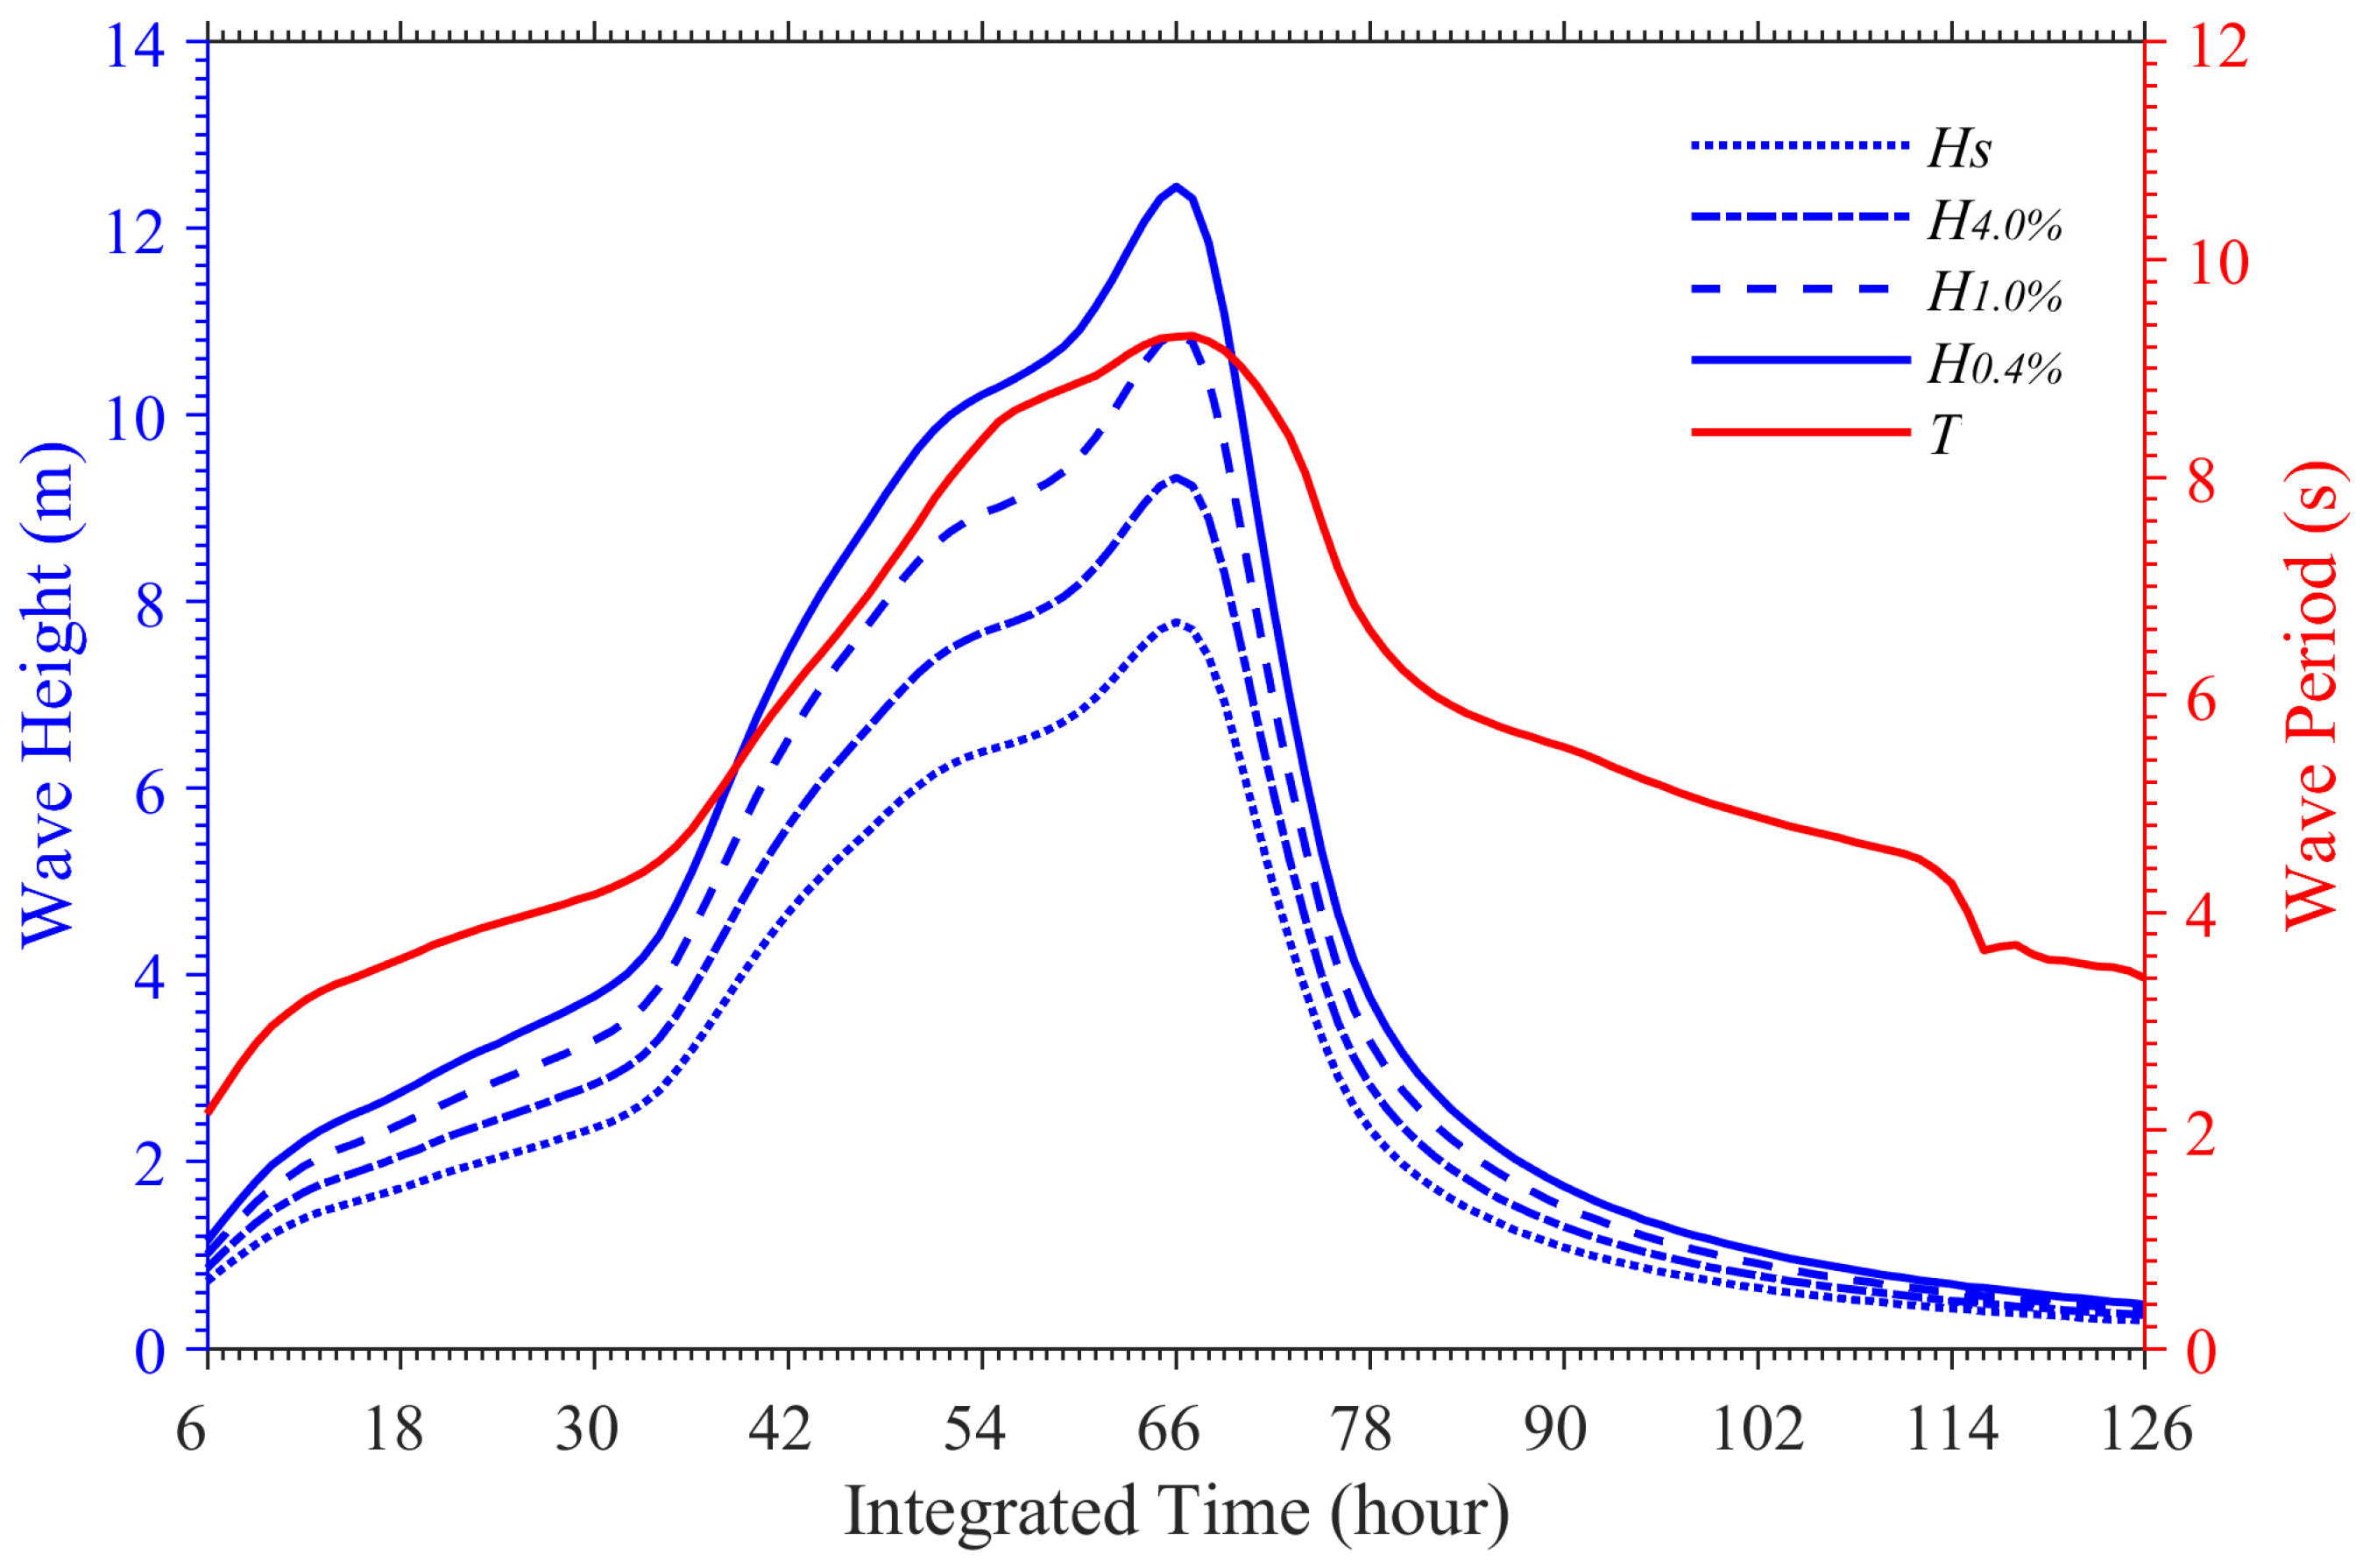
Figure 7 presents the temporal evolution of wave heights at the engineering site during Typhoon Viola (6903), including SWH (Hs), extreme wave height percentiles (H4.0%, H1.0%, H0.4%), and wave period (T). The extreme wave height percentiles were derived through post-processing of the SWAN-simulated time series by applying percentile-based sorting to the SWH records at the engineering site, which represent exceedance levels commonly used in offshore engineering design to account for rare but potentially hazardous wave conditions. The analysis reveals that H4.0%, H1.0%, and H0.4% exhibited a dynamic range from approximately 0.05 m during calm conditions to their respective peak values of 9.33 m, 10.89 m, and 12.45 m at the 66th hour of model integration. These maximum values significantly exceeded the corresponding SWH of 7.78 m, demonstrating the importance of considering extreme wave statistics for engineering design. Following the peak intensity, all wave parameters returned to background levels (<0.30 m) as the typhoon’s influence diminished, completing a full cycle from pre-storm calm through peak intensity to post-storm recovery.
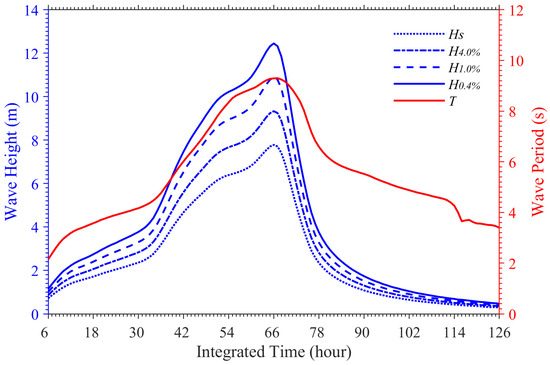
Figure 7.
Results of the SWAN simulated SWH (Hs), wave heights of the top 4% (H4.0), 1% (H1.0), and 0.4% (H0.4) in accumulated frequency and wave period (T) during Typhoon Viola at the engineering site.
3.4. Spatial Pattern of 50-Year Return Period Typhoon-Induced Wave Fields
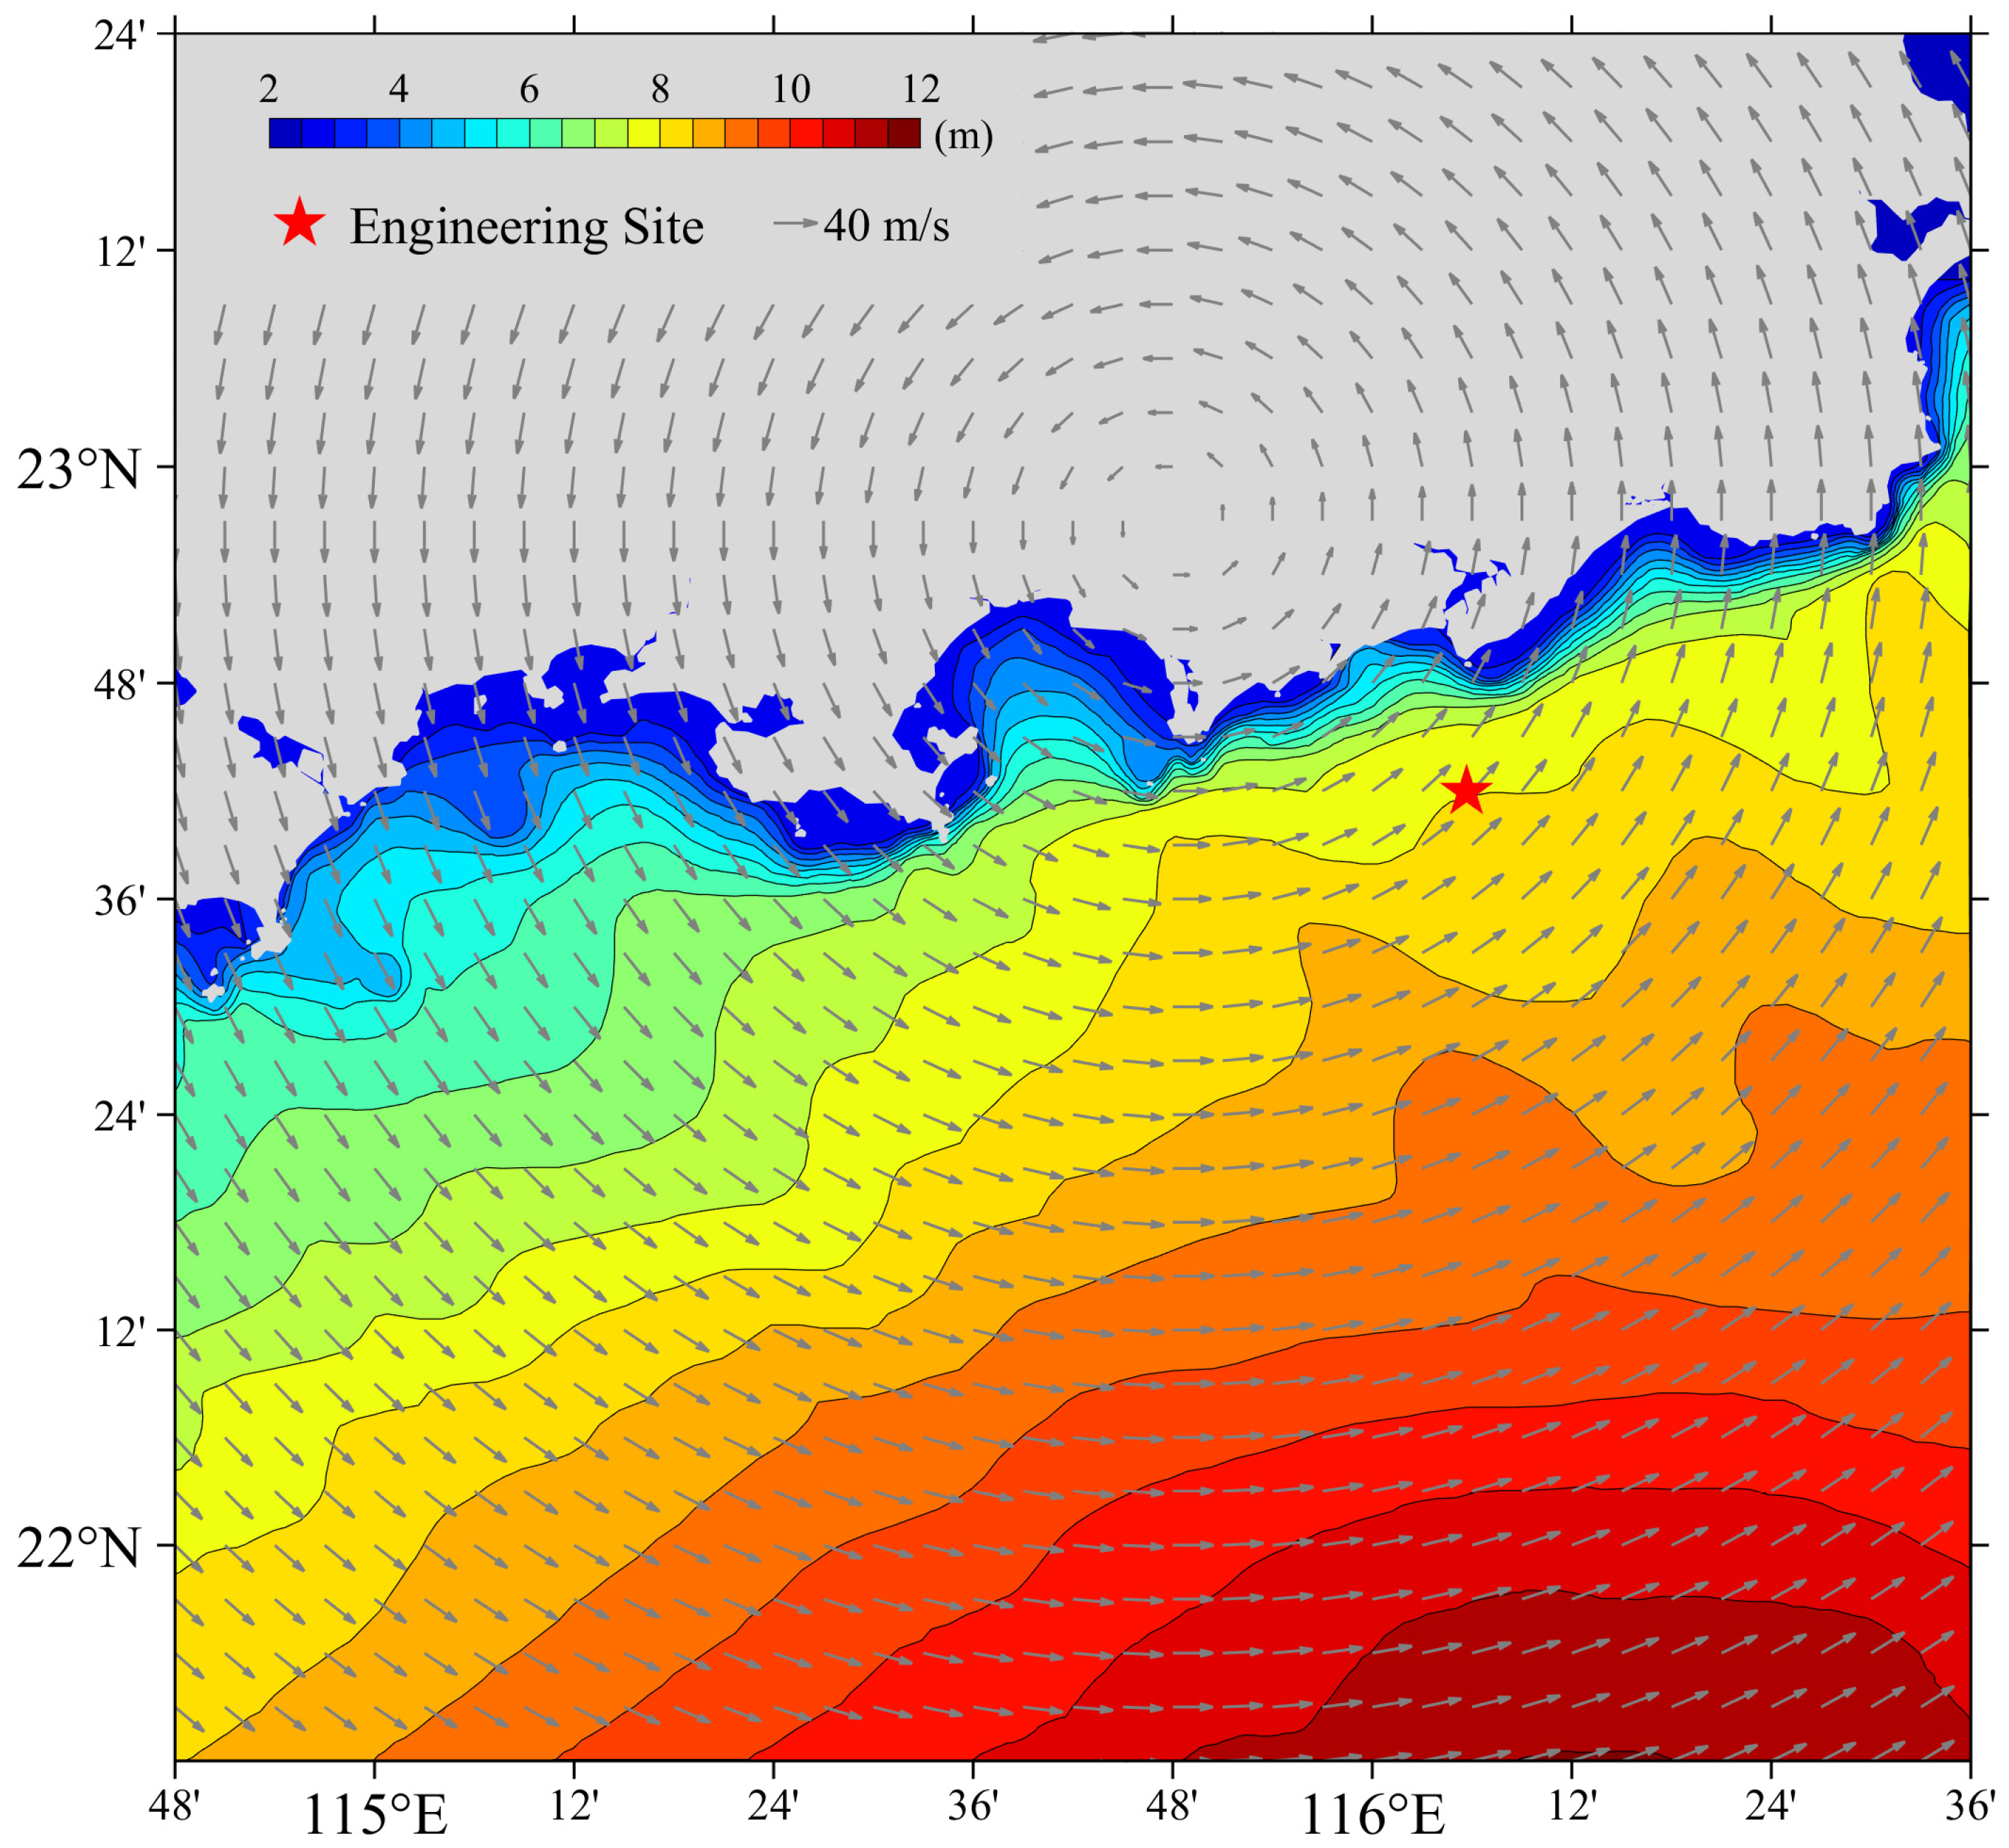
Figure 8 illustrates the spatial distribution of significant wave heights (SWHs) simulated by the SWAN model for the 50-year return period typhoon scenario during its closest approach to the engineering site. The wave field exhibits distinct spatial patterns, with SWH contours oriented along a SW-NE axis, demonstrating quasi-parallel alignment with the local coastline morphology. A pronounced offshore gradient is evident, with wave heights increasing dramatically from less than 2 m in nearshore regions to over 12 m in the deepwater areas southeast of the study site. This rapid transition in wave energy, occurring within a relatively short spatial scale, reflects the combined influence of bathymetric effects and typhoon wind field intensity on wave generation and propagation dynamics.
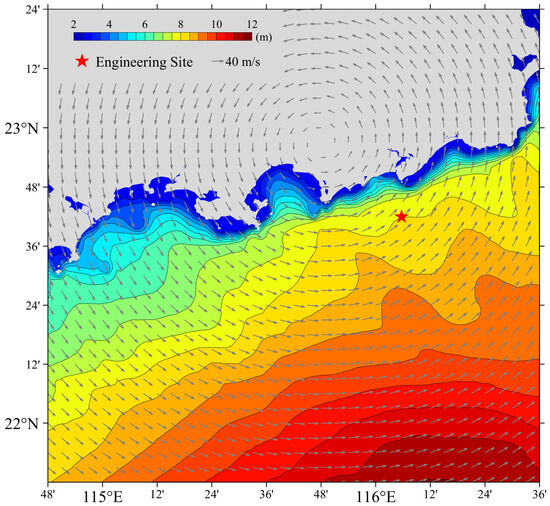
Figure 8.
Spatial distribution of SWAN-simulated SWH (color shading) and associated typhoon winds (gray vectors) at the 66th hour.
4. Discussion and Concluding Remarks
Site selection for offshore wind farms has increasingly shifted toward deeper sea areas, which offers greater development potential. Among the various foundation types for wind turbines, the jacket structure has emerged as a promising support structure in recent years due to its adaptability to harsh marine environments. The engineering site corresponds to a deep-sea jacket-type wind power platform designed according to the IEC 61400-3-1 standard [15], which stipulates a 50-year return period for wave load assessment. The simulation results of the wave heights and period derived in this study are directly applicable to the environmental load inputs for the structural design and fatigue assessment of this platform. The most extreme waves in these deep-sea regions are typically generated by typhoons, and the magnitude of these wave parameters critically determines the structural loads on jacket foundations. Therefore, the 50-year return period is widely adopted as the benchmark for calculating environmental loads in the design of offshore wind farm foundations.
In this study, a Pearson Type III (P-III) frequency analysis was conducted on the central pressure of typhoons within a 400 km radius of the engineering site from 1949 to 2019. The analysis revealed that the 50-year return period typhoon intensity corresponds to a central pressure of 916 hPa and a maximum wind speed of 38.7 m/s. The SWAN model was employed to simulate typhoon-induced wave fields, and its accuracy was rigorously validated using high-resolution observational data from five in situ wave buoys during two representative typhoon events: Vicente (1208) and Mangkhut (1822). The validated model was subsequently driven by the wind fields of Typhoon Viola (6903), whose intensity matches the 50-year return period, to analyze the characteristics of extreme typhoon-induced waves. The results demonstrate that a 50-year return period typhoon passing near the engineering site generates a maximum SWH of 7.78 m, with extreme wave heights (H4.0%, H1.0%, and H0.4%) reaching 9.33 m, 10.89 m, and 12.45 m, respectively. The spatial distribution of SWH contours exhibits a distinct SW-NE orientation, showing quasi-parallel alignment with the local coastline morphology. These findings highlight the critical importance of considering extreme wave conditions in the design and assessment of offshore structures, particularly in typhoon-prone regions. While this study focused on wave characteristics, the influence of storm surge, water level changes, and ocean currents on the total wave load was not explicitly modeled, which may influence wave propagation and breaking. The omission of these processes likely has minimal impact on deep-sea wave heights but may underestimate nearshore surge–wave–current interactions. Incorporating coupled surge–wave–current models will be a focus of future work to provide more comprehensive assessments of structural loading.
The present study provides innovative methodologies and valuable references for determining design wave and wind speed parameters in offshore wind power projects, particularly in typhoon-prone regions. The findings offer a robust scientific basis for assessing wave load impacts on jacket structures, conducting structural fatigue analysis, optimizing safety design criteria, and determining shutdown thresholds. The integration of P-III frequency analysis with high-resolution SWAN modeling represents a significant advancement in the field, providing both theoretical insights and practical applications for the design and operation of offshore wind farms in extreme marine environments. The proposed methodology is transferable to other typhoon-prone regions, but adaptation is necessary to account for local atmospheric and oceanographic conditions, including typhoon structure, bathymetry, and wave–current interaction dynamics.
Author Contributions
Conceptualization, J.Y., G.B. and J.S.; Methodology, P.L.; Software, J.Y.; Formal analysis, J.Y. and J.S.; Resources, G.B.; Writing—original draft, J.Y.; Writing—review and editing, J.Y., G.B., P.L. and J.S.; Supervision, P.L.; Funding acquisition, G.B. and J.S. All authors have read and agreed to the published version of the manuscript.
Funding
This study was funded by the Key R&D Program of Shandong Province, China, grant number 2024SFGC0201; the National Natural Science Foundation of China, grant number 42376030; and the Shandong Provincial Natural Science Foundation, grant number ZR2022MD020.
Data Availability Statement
The data that support the findings of this study are publicly available and can be obtained from the following sources: Typhoon data are from the Chinese Meteorological Administration tropical cyclone data center (https://tcdata.typhoon.org.cn/zjljsjj.html, accessed on 21 August 2023). Buoy data are available upon reasonable request.
Acknowledgments
The authors would like to acknowledge CMA for the provision of the datasets used herein.
Conflicts of Interest
Authors Jianjun Yi, Guangpu Bai, and Pengfei Li were employed by the company China Nuclear Power Design Co., Ltd. The remaining author declares that the research was conducted in the absence of any commercial or financial relationships that could be construed as potential conflicts of interest.
References
- Ma, X.; Li, M.; Li, W.; Liu, Y. Overview of Offshore Wind Power Technologies. Sustainability 2025, 17, 596. [Google Scholar] [CrossRef]
- Su, X.; Wang, X.; Xu, W.; Yuan, L.; Xiong, C.; Chen, J. Offshore Wind Power: Progress of the Edge Tool, Which Can Promote Sustainable Energy Development. Sustainability 2024, 16, 7810. [Google Scholar] [CrossRef]
- Jalbi, S.; Nikitas, G.; Bhattacharya, S.; Alexander, N. Dynamic design considerations for offshore wind turbine jackets supported on multiple foundations. Mar. Struct. 2019, 67, 102631. [Google Scholar] [CrossRef]
- Madhuri, S.; Bera, S.; Prasad, B. Dynamic Analysis of Offshore Wind Turbine Supported by Jacket Substructure under Wind and Wave Loading. ASPS Conf. Proc. 2022, 1, 1749–1755. [Google Scholar] [CrossRef]
- Li, Z.; Wang, J.; Wei, C.; Yu, J. Analysis of the Temporal and Spatial Characteristics of PWV and Rainfall with the Typhoon Movement: A Case Study of ‘Meihua’ in 2022. Atmosphere 2023, 14, 1313. [Google Scholar] [CrossRef]
- Wu, Z.-Y.; Gao, K.; Chen, J.; Zhang, H.-J.; Deng, B.; Jiang, C.-B.; Liu, Y.-Z.; Lyu, Z.; Yan, R. Typhoon-Induced Ocean Waves and Stokes Drift: A Case Study of Typhoon Mangkhut (2018). China Ocean Eng. 2024, 38, 711–724. [Google Scholar] [CrossRef]
- Zhu, T.; Ke, S.; Li, W.; Chen, J.; Yun, Y.; Ren, H. WRF-CFD/CSD analytical method of hydroelastic responses of ultra-large floating body on maritime airport under typhoon-wave-current coupling effect. Ocean Eng. 2022, 261, 112022. [Google Scholar] [CrossRef]
- Deng, B.; Cao, Y.; Wu, Z.; Jiang, C. Simulation of the storm surge in the South China Sea based on the coupled sea-air model. Chin. Sci. Bull. 2018, 63, 3494–3504. [Google Scholar] [CrossRef]
- Zhang, Y.; Zhang, T.; Shen, W.; Ou, Z.; Zhang, J. Economic loss assessment of typhoon-induced storm surge disasters in the South China Sea based on GSA-BP model. Front. Earth Sci. 2023, 11, 1258524. [Google Scholar] [CrossRef]
- Sun, J.; Wang, D.; Hu, X.; Ling, Z.; Wang, L. Ongoing Poleward Migration of Tropical Cyclone Occurrence Over the Western North Pacific Ocean. Geophys. Res. Lett. 2019, 46, 9110–9117. [Google Scholar] [CrossRef]
- Ju, X.; Sun, J.; Wu, D.; Li, L.; Hu, X.; Ren, Z.; Guo, Y.; Yu, L.; Hui, Z.; Xiong, X. Poleward Migration of Spatial Asymmetry in Tropical Cyclone Precipitation over the Western North Pacific. Atmosphere 2023, 14, 1074. [Google Scholar] [CrossRef]
- Rusvan, A.A.; Maricar, F.; Thaha, M.A.; Paotonan, C. Evaluation of Tidal Energy Potential Using a Two-Way Tidal Energy Model. Civ. Eng. J. 2024, 10, 3011–3033. [Google Scholar] [CrossRef]
- Shame, B.H.; Tjahjana, D.D.D.P.; Sabino, U.; Aziz, M.; Mbumba, M.T. Analysis of Seasonal Wind Energy Potential on Zanzibar Coastal Island. HighTech Innov. J. 2024, 5, 331–348. [Google Scholar] [CrossRef]
- Haselsteiner, A.F.; Frieling, M.; Mackay, E.; Sander, A.; Thoben, K.-D. Long-term extreme response of an offshore turbine: How accurate are contour-based estimates? Renew. Energy 2022, 181, 945–965. [Google Scholar] [CrossRef]
- IEC 61400-3-1; Wind Energy Generation Systems—Part 3-1: Design Requirements for Fixed Offshore Wind Turbines. IEC: Singapore, 2019.
- Roach, S.; Park, S.M.; Gaertner, E.; Manwell, J.; Lackner, M. Application of the New IEC International Design Standard for Offshore Wind Turbines to a Reference Site in the Massachusetts Offshore Wind Energy Area. In Journal of Physics: Conference Series; IOP Publishing: Bristol, UK, 2020; p. 1452. [Google Scholar] [CrossRef]
- NNSA. National Nuclear Safety Administration. Design basis tropical cyclone for nuclear power plants. Chinese National Regulatory Guide HAD 101/11. World J. Nucl. Sci. Technol. 1991, 2, 3. [Google Scholar]
- Cui, J.; Li, L.; Zhang, M.; Liu, H.; Qu, X. Dynamic Response Analysis of Floating Nuclear Power Plant Containment Under Marine Environment. In Proceedings of the 23rd Pacific Basin Nuclear Conference, Singapore, 7–10 October 2023; Volume 1, pp. 609–623. [Google Scholar]
- Li, J.; Bian, J.; Ma, Y.; Jiang, Y. Impact of Typhoons on Floating Offshore Wind Turbines: A Case Study of Typhoon Mangkhut. J. Mar. Sci. Eng. 2021, 9, 543. [Google Scholar] [CrossRef]
- Antoniou, M.; Kourkoulis, R.; Gelagoti, F.; Anastasopoulos, I. Simplified method for performance-based seismic design of suction caissons supporting jacket offshore wind turbines. Soil Dyn. Earthq. Eng. 2022, 155, 107169. [Google Scholar] [CrossRef]
- Cheng, X.; Liu, M.; Li, Q.; Lu, D.; Du, X. Dynamic response and fatigue damage analysis of offshore wind turbines supported by four-pile jacket in clays under typhoons. Acta Geotech. 2025, 1–21. [Google Scholar] [CrossRef]
- Raynal Villaseñor, J.A. Pearson Type III Distribution. In Frequency Analyses of Natural Extreme Events: A Spreadsheets Approach; Springer International Publishing: Cham, Switzerland, 2021; pp. 139–165. [Google Scholar]
- Feng, J.; Lu, X.; Yu, H.; Zhang, W.; Ying, M.; Fan, Y.; Zhu, Y.; Chen, D. An Overview of the China Meteorological Administration Tropical Cyclone Database. J. Atmos. Ocean Technol. 2014, 31, 287–301. [Google Scholar] [CrossRef]
- Lu, X.; Yu, H.; Ying, M.; Zhao, B.; Zhang, S.; Lin, L.; Bai, L.; Wan, R. Western North Pacific Tropical Cyclone Database Created by the China Meteorological Administration. Adv. Atmos. Sci. 2021, 38, 690–699. [Google Scholar] [CrossRef]
- Booij, N.; Ris, R.C.; Holthuijsen, L.H. A third-generation wave model for coastal regions: 1. Model description and validation. J. Geophys. Res. Oceans 1999, 104, 7649–7666. [Google Scholar] [CrossRef]
- Jia, L.; Wu, S.; Han, B.; Cai, S.; Wu, R. Wave hindcast under tropical cyclone conditions in the South China Sea: Sensitivity to wind fields. Acta Oceanol. Sin. 2023, 42, 36–53. [Google Scholar] [CrossRef]
- Komen, G.J.; Hasselmann, K.; Hasselmann, K. On the Existence of a Fully Developed Wind-Sea Spectrum. J. Phys. Oceanogr. 1984, 14, 1271–1285. [Google Scholar] [CrossRef]
- Hasselmann, S.; Hasselmann, K.; Allender, J.H.; Barnett, T.P. Computations and Parameterizations of the Nonlinear Energy Transfer in a Gravity-Wave Specturm. Part II: Parameterizations of the Nonlinear Energy Transfer for Application in Wave Models. J. Phys. Oceanogr. 1985, 15, 1378–1391. [Google Scholar] [CrossRef]
- Battjes, J.A.; Janssen, J.P.F.M. Energy loss and set-up due to breaking of random waves. In Proceedings of the 16th International Conference on Coastal Engineering, Hamburg, Germany, 27 August–3 September 1978; American Society of Civil Engineers: Reston, VI, USA, 1978; pp. 569–587. [Google Scholar]
- Hasselmann, K.; Barnett, T.P.; Bouws, E.; Carlson, H.; Cartwright, D.E.; Enke, K.; Ewing, J.A.; Gienapp, A.; Hasselmann, D.E.; Kruseman, P.; et al. Measurements of wind-wave growth and swell decay during the Joint North Sea Wave Project (JONSWAP). In Ergänzungsheft zur Deutschen Hydrographischen Zeitschrift; Deutches Hydrographisches Institut: Hamburg, Germany, 1973; pp. 1–95. [Google Scholar]
- Amante, C.; Eakins, B.W. ETOPO1 1 Arc-Minute Global Relief Model: Procedures, Data Sources and Analysis. NOAA Technical Memorandum NESDIS NGDC-24, 19. Open Access Libr. J. 2009, 6, 8. [Google Scholar]
- Jelesnianski, C.P. A Numerical Calculation of Storm Tides Induced by a Tropical Storm Impinging on a Continental Shelf. Mon. Weather Rev. 1965, 93, 343–358. [Google Scholar] [CrossRef]
- Gong, Y.; Dong, S.; Wang, Z. Development of a coupled genetic algorithm and empirical typhoon wind model and its application. Ocean Eng. 2022, 248, 110723. [Google Scholar] [CrossRef]

Disclaimer/Publisher’s Note: The statements, opinions and data contained in all publications are solely those of the individual author(s) and contributor(s) and not of MDPI and/or the editor(s). MDPI and/or the editor(s) disclaim responsibility for any injury to people or property resulting from any ideas, methods, instructions or products referred to in the content. |
© 2025 by the authors. Licensee MDPI, Basel, Switzerland. This article is an open access article distributed under the terms and conditions of the Creative Commons Attribution (CC BY) license (https://creativecommons.org/licenses/by/4.0/).