

Decarbonation Effects of Mainstream Dual-Fuel Power Schemes Focus on IMO Mandatory Regulation and LCA Method


Abstract
1. Introduction
1.1. Background
1.2. Literature Review
1.2.1. Evaluation of Decarbonization Effect Based on Different Marine Fuels and Traditional Technology Applications
1.2.2. Evaluation of Decarbonization Effects Under Mainstream Methods
1.3. Research Gap and Objectives
2. Examination of Prior Research and Methodology
2.1. Target Ship Selection
2.2. Effect Analysis of Dual-Fuel Selection Scheme Based on EEDI
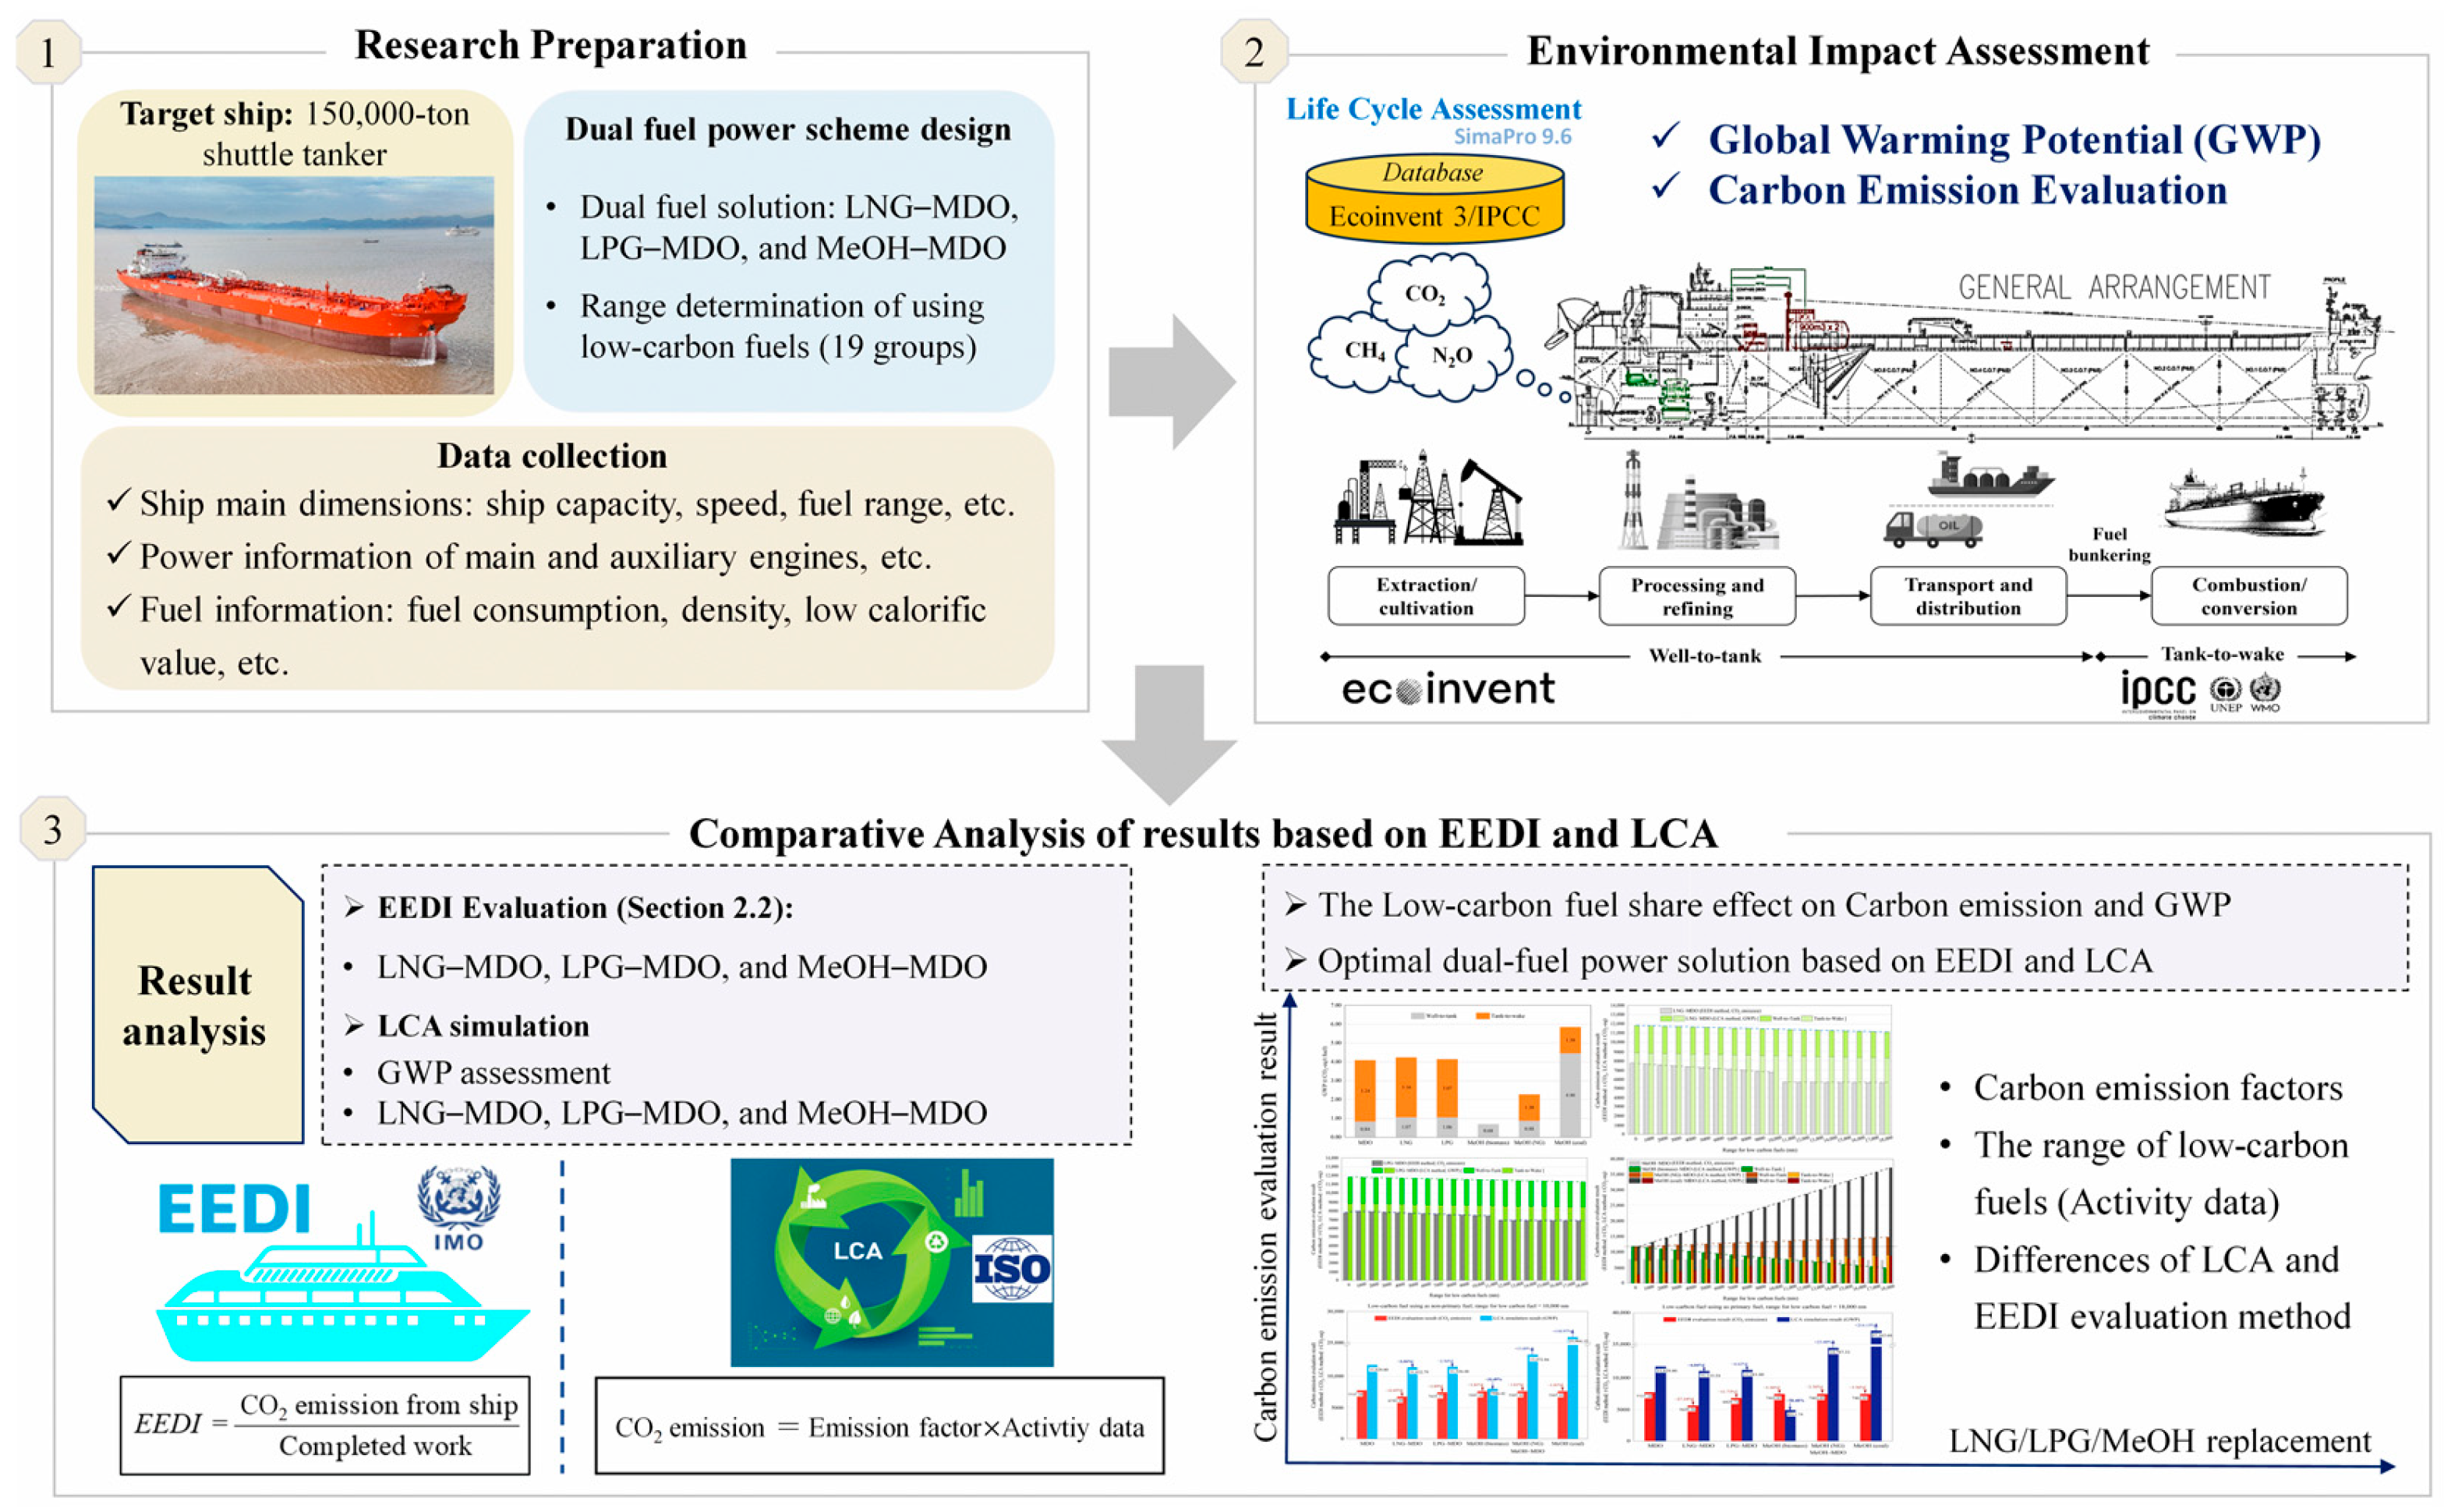
2.3. Research Approach
- Research preparation: Complete the data statistics of the target ship and develop corresponding dual-fuel power schemes based on the selection of the main engine.
- Environmental impact assessment: Conduct environmental impact assessments for different scenarios based on the Ecoinvent 3 database and IPCC database.
- Comparative analysis based on the EEDI and LCA: Considering the different focuses of the EEDI and LCA methods, the impact of different schemes on the results of both methods and the carbon emissions profile during the well-to-wake phase are considered.
3. LCA Simulation Result Analysis
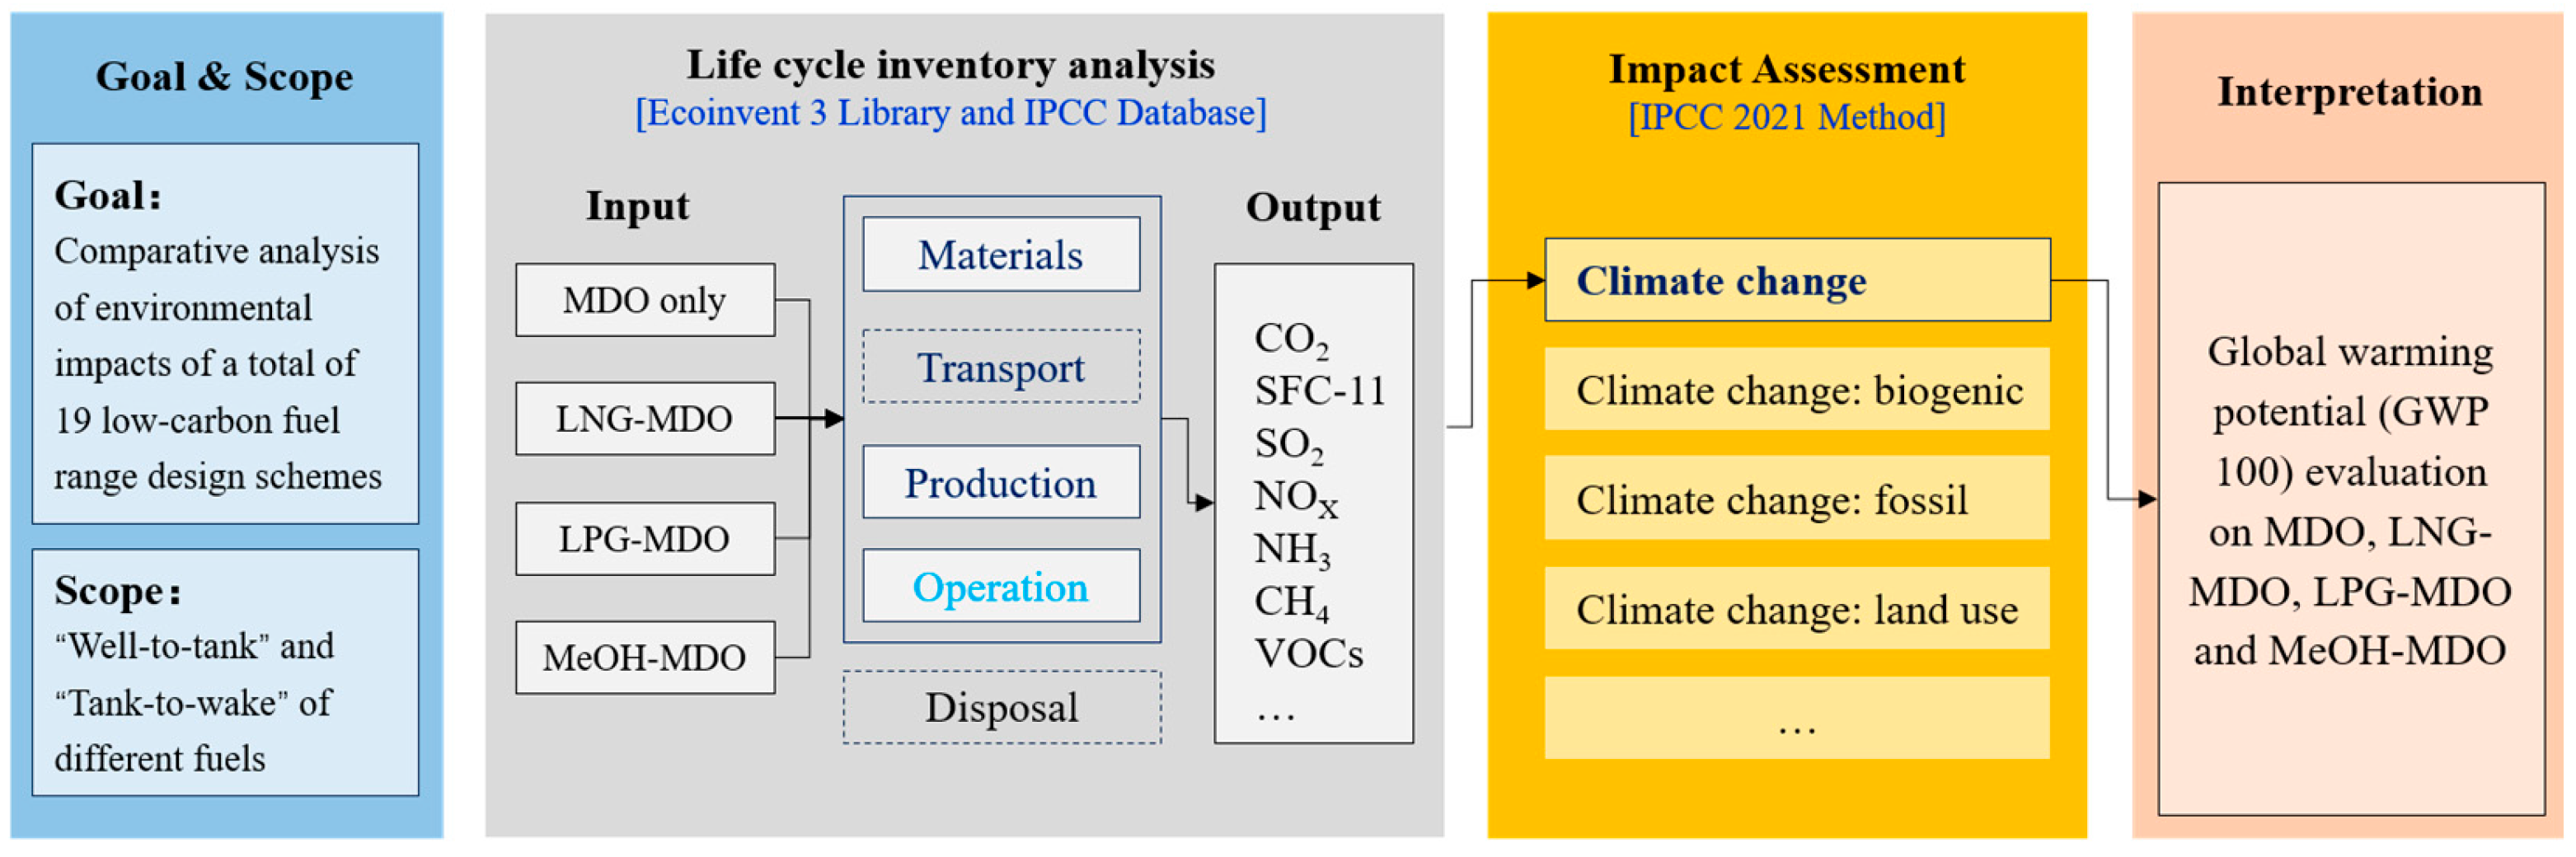
3.1. Methodological Framework
3.2. Goal and Scope Definition
3.3. Life Cycle Inventory
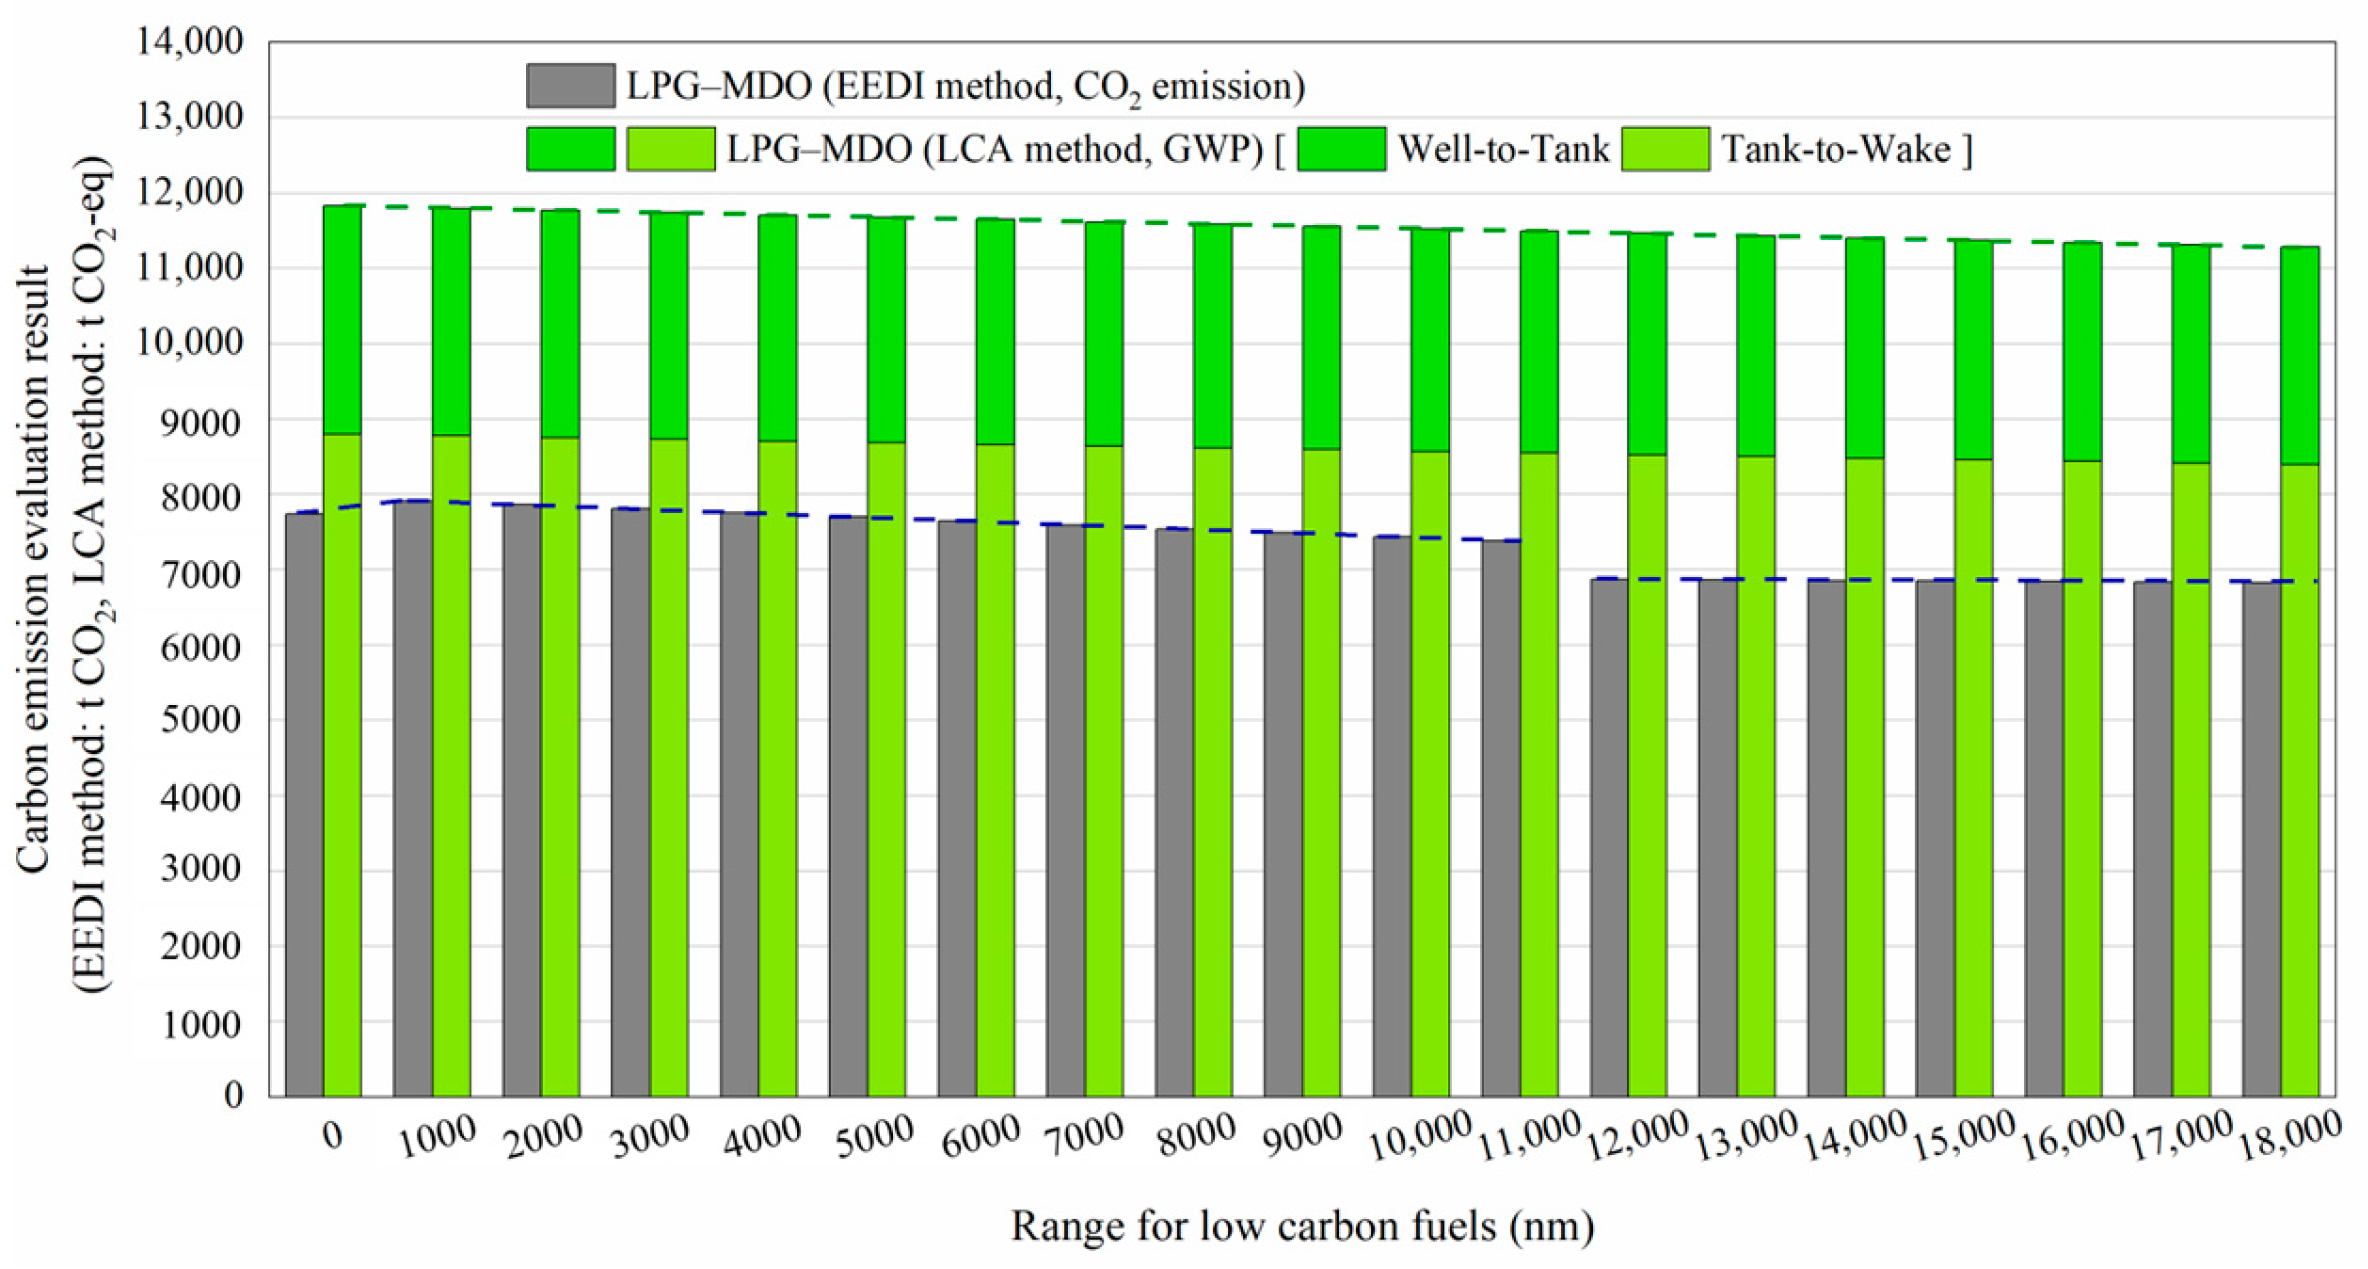
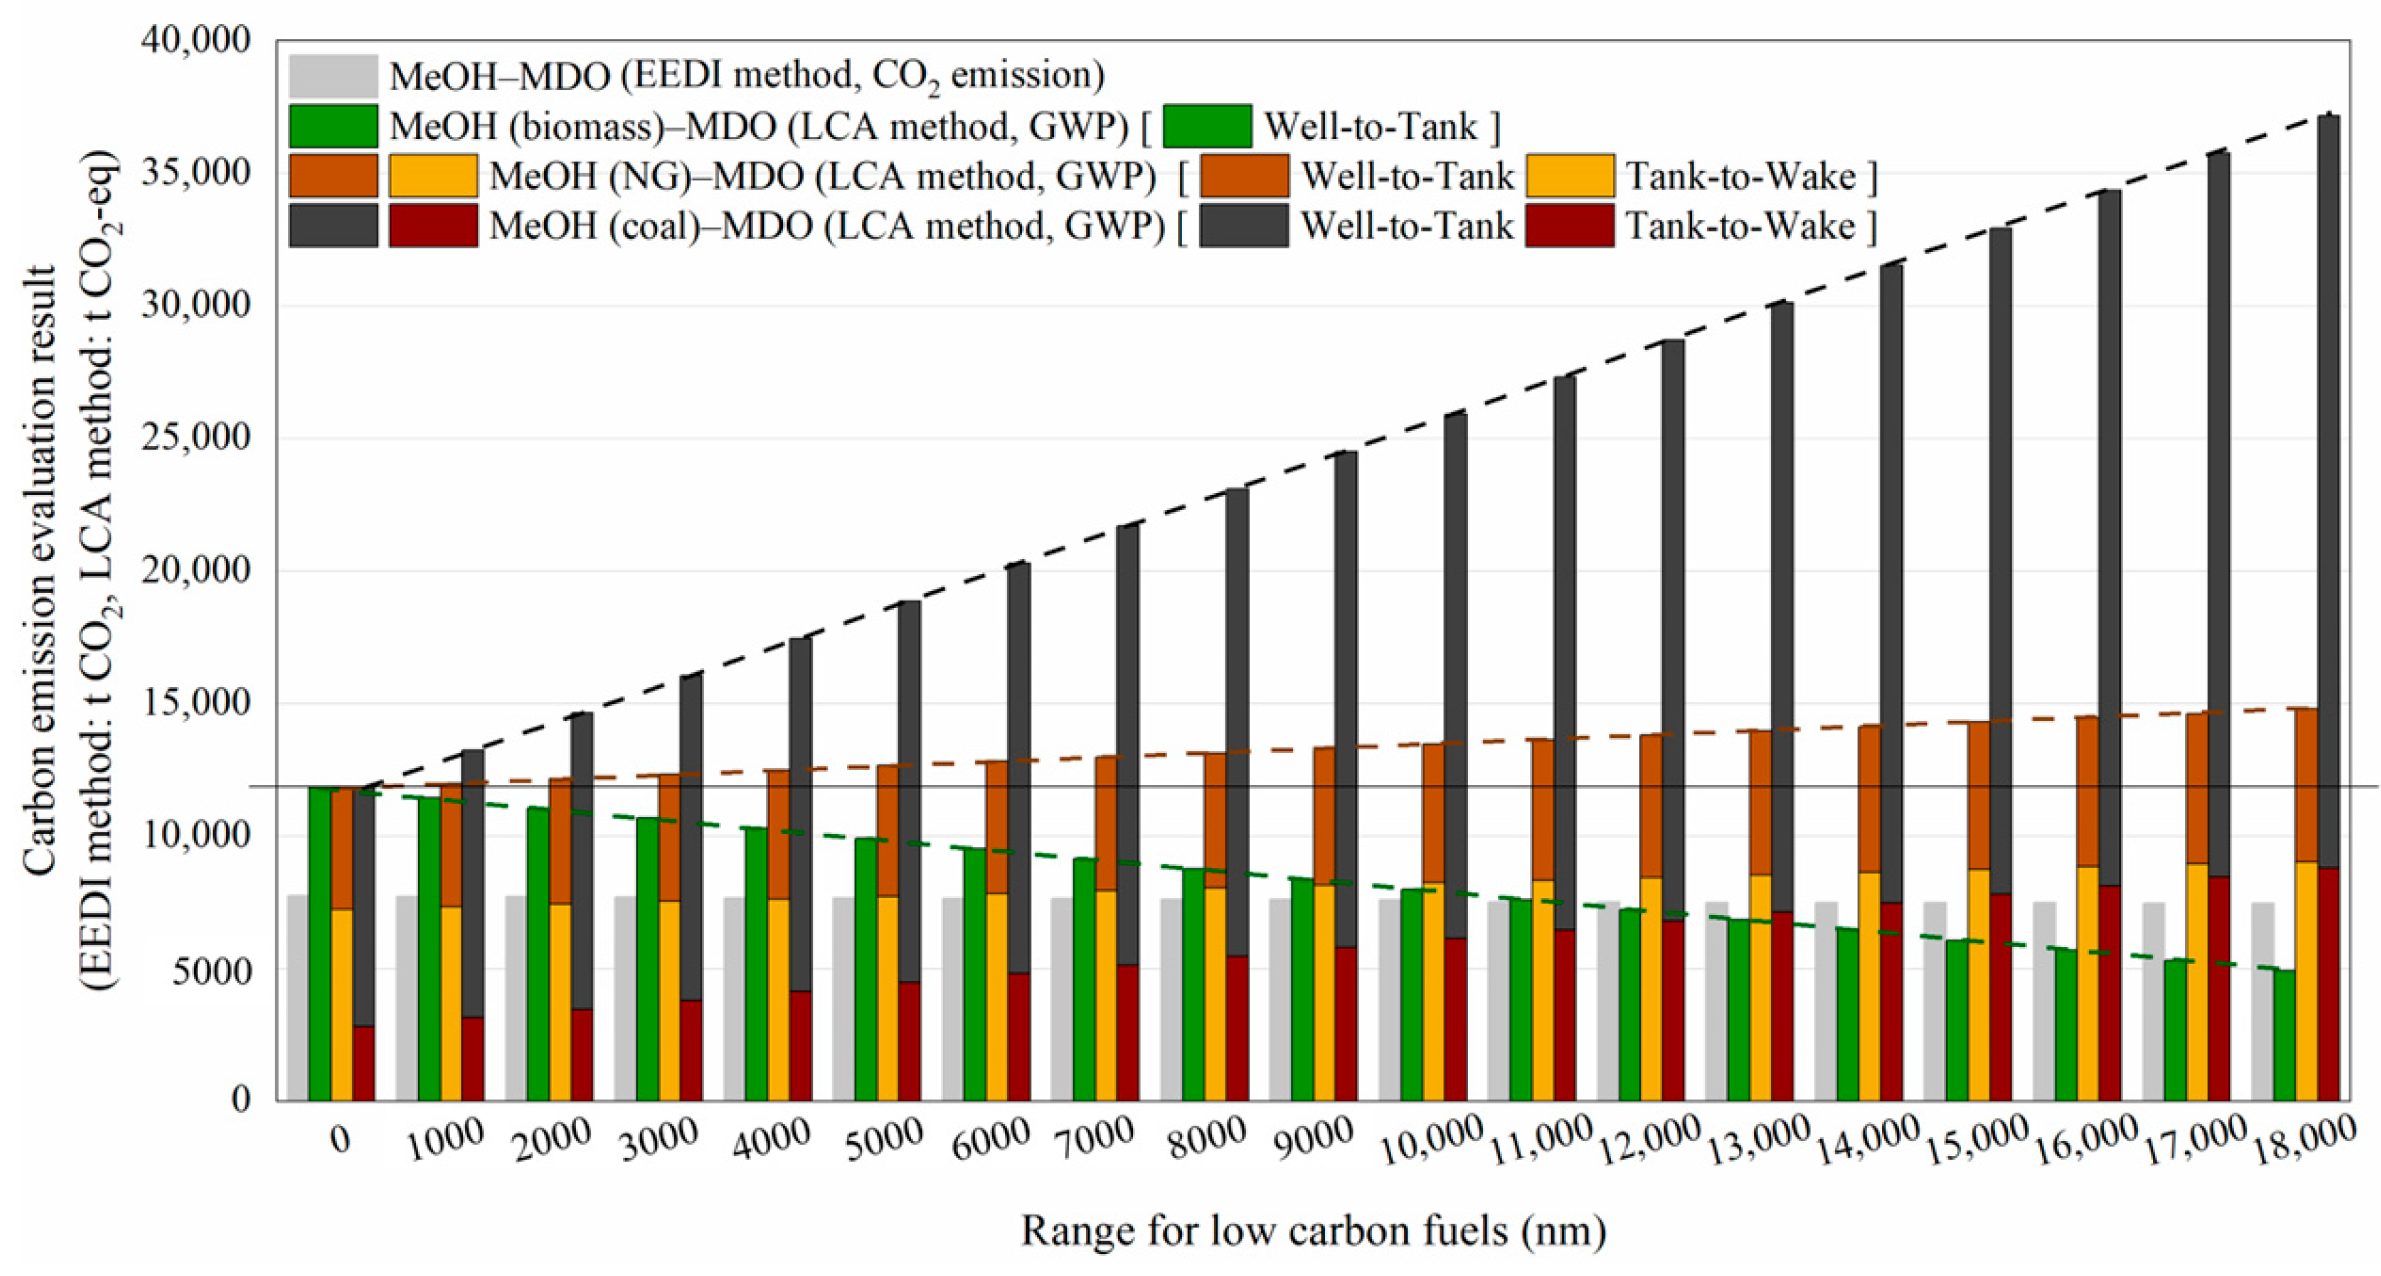
3.4. Evaluation of Impact Assessment and Result Analysis
4. Discussion
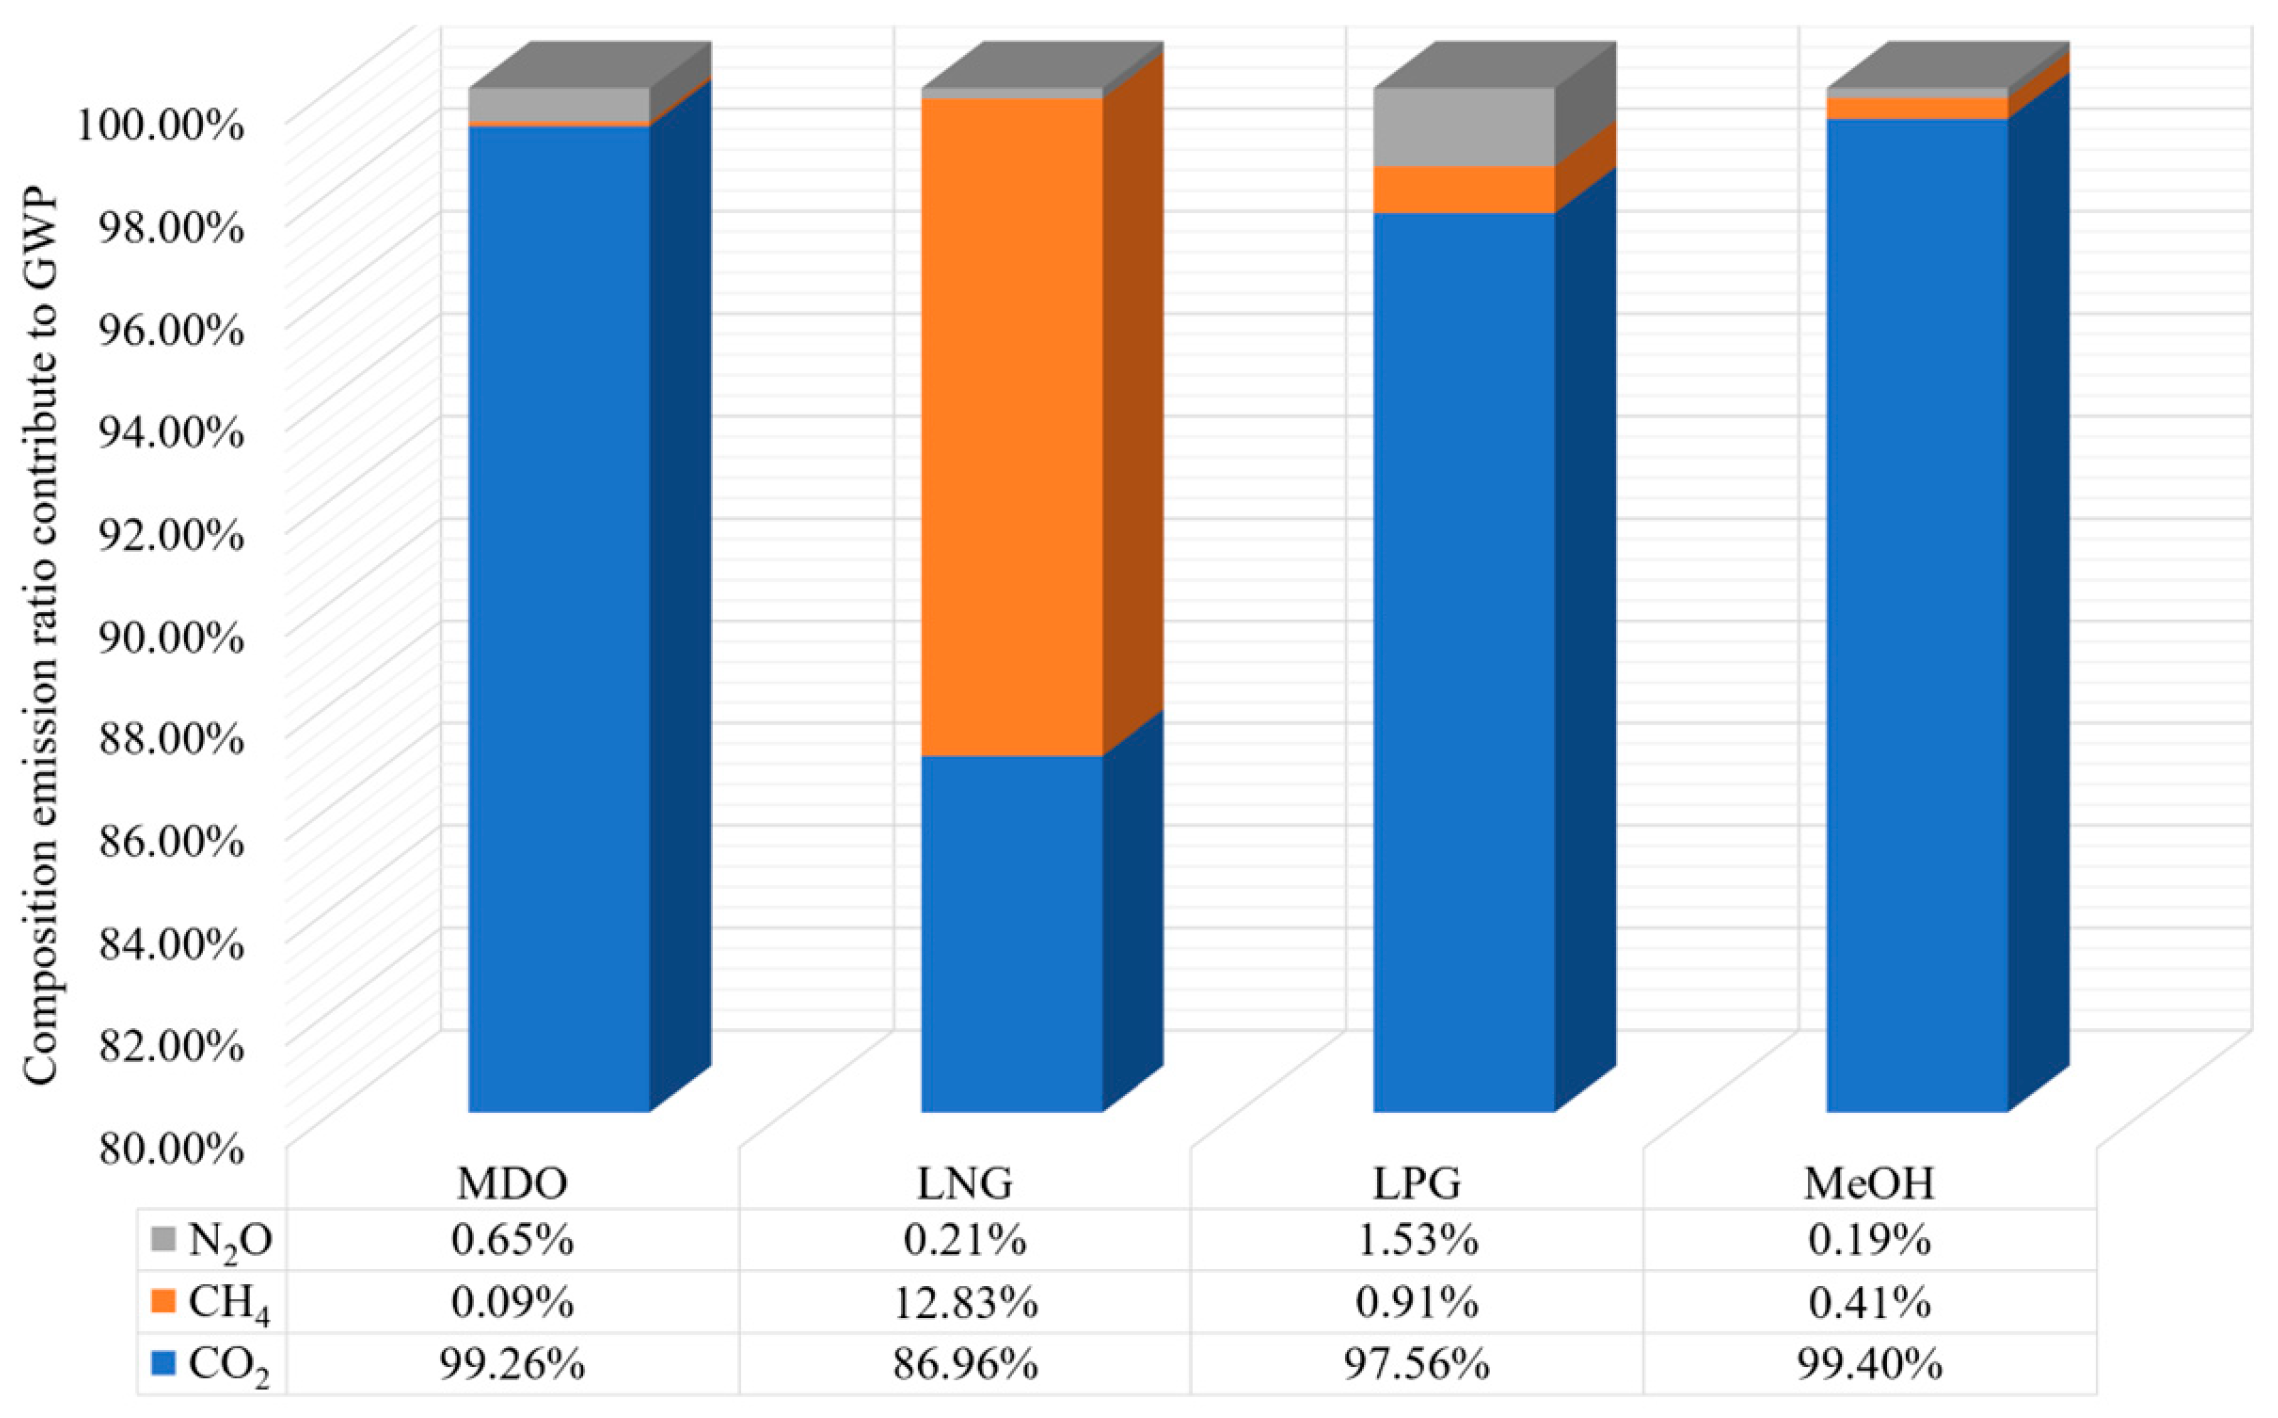
4.1. Effects of Emission Factors on GWP
4.2. Carbon Control Potential of Different Alternative Schemes
4.3. Prospect Analysis of Low-Carbon Alternative Fuels
5. Conclusions
Author Contributions
Funding
Data Availability Statement
Acknowledgments
Conflicts of Interest
References
- Borén, C.; Grifoll, M.; Castells-Sanabra, M. Emissions assessment of container ships sailing under off-design conditions. J. Mar. Sci. Eng. 2023, 11, 1983. [Google Scholar] [CrossRef]
- Elkafas, A.G.; Elgohary, M.M.; Shouman, M.R. Numerical analysis of economic and environmental benefits of marine fuel conversion from diesel oil to natural gas for container ships. Environ. Sci. Pollut. Res. Int. 2021, 28, 15210–15222. [Google Scholar] [CrossRef] [PubMed]
- Hu, Q.; Zhou, W.; Diao, F. Interpretation of the initial IMO Strategy on Reduction of GHG Emissions from Ships. Shipbuild. China 2019, 60, 195–201. [Google Scholar]
- International Maritime Organization. Report of the Marine Environment Protection Committee on Its Sixty-Second Session; MEPC 62; MEPC: London, UK, 2011. [Google Scholar]
- International Maritime Organization. International Maritime Organization’s Initial Greenhouse Gas Strategy; IMO Marine Environment Protection Committee (MEPC): London, UK, 2018. [Google Scholar]
- International Maritime Organization. IMO Regulations to Introduce Carbon Intensity Measures Enter Into Force; IMO Marine Environment Protection Committee (MEPC): London, UK, 2022. [Google Scholar]
- International Maritime Organization. IMO Strategy on Reduction of GHG Emissions from Ships; IMO Marine Environment Protection Committee (MEPC): London, UK, 2023. [Google Scholar]
- Ait Allal, A.; Mansouri, K.; Youssfi, M.; Qbadou, M. Toward an evaluation of marine fuels for a clean and efficient autonomous ship propulsion energy. Mater. Today Proc. 2019, 13, 486–495. [Google Scholar] [CrossRef]
- Adland, R.; Cariou, P.; Jia, H.; Wolff, F.C. The Energy efficiency effects of periodic ship hull cleaning. J. Clean. Prod. 2018, 178, 1–13. [Google Scholar] [CrossRef]
- Norlund, E.K.; Gribkovskaia, I. Reducing emissions through speed optimization in supply vessel operations. Transp. Res. Part D Transp. Environ. 2013, 23, 105–113. [Google Scholar] [CrossRef]
- Jia, T. Research on the Influence of Lightweight Structure to the Energy Efficiency Design Index; Dalian University of Technology: Dalian, China, 2016. [Google Scholar]
- Feng, Y.; el Moctar, O.; Schellin, T.E. Parametric Hull Form Optimization of Containerships for Minimum Resistance in Calm Water and in Waves. J. Mar. Sci. Appl. 2021, 20, 670–693. [Google Scholar] [CrossRef]
- Kang, J.G.; Kim, M.C.; Kim, H.U.; Shin, I.R. Study on Propulsion performance by varying rake distribution at the propeller tip. J. Mar. Sci. Eng. 2019, 7, 386. [Google Scholar] [CrossRef]
- Kumar, Y.H.; Kumar, R.V. Development of an energy-efficient stern flap for improved EEDI of a typical high speed displacement vessel. Def. Sci. J. 2020, 70, 95–102. [Google Scholar] [CrossRef]
- Ren, H.; Ding, Y.; Sui, C. Influence of EEDI (Energy Efficiency Design Index) on ship–engine–propeller matching. J. Mar. Sci. Eng. 2019, 7, 425. [Google Scholar] [CrossRef]
- Perčić, M.; Vladimir, N.; Fan, A. Life-cycle cost assessment of alternative marine fuels to reduce the carbon footprint in short-sea shipping: A case study of Croatia. Appl. Energy 2020, 279, 115848. [Google Scholar] [CrossRef]
- Zhao, Z.; Cui, W.; Qi, Y. Prospects of various ship power fuels under the transformation of marine energy. Marit. China 2022, 6, 42–48. [Google Scholar]
- Tu, H. Comprehensive analysis on the adaptability of clean energy for marine use. China Ship Surv. 2022, 1, 58–62. [Google Scholar]
- International Maritime Organization. Implementation of Sulphur 2020 Limit—Carriage Ban Adopted. Available online: https://www.imo.org/en/MediaCentre/PressBriefings/Pages/19-Implementation-of-sulphur-2020-limit-.aspx (accessed on 16 April 2025).
- Burel, F.; Taccani, R.; Zuliani, N. Improving sustainability of maritime transport through utilization of Liquefied Natural Gas (LNG) for propulsion. Energy 2013, 57, 412–420. [Google Scholar] [CrossRef]
- Li, C.; Hu, Y. Development of clean alternative fuel LPG in marine engines. Mar. Equip. Mater. Mark. 2022, 30, 68–73. [Google Scholar]
- Balcombe, P.; Brierley, J.; Lewis, C.; Skatvedt, L.; Speirs, J.; Hawkes, A.; Staffell, I. How to decarbonise international shipping: Options for fuels, technologies and policies. Energy Convers. Manag. 2019, 182, 72–88. [Google Scholar] [CrossRef]
- Jafarzadeh, S.; Paltrinieri, N.; Utne, I.B.; Ellingsen, H. LNG-fueled fishing vessels: A systems engineering approach. Transp. Res. D Trans. Environ. 2017, 50, 202–222. [Google Scholar] [CrossRef]
- Moroianu, C.; Postolache, F. Marine propulsion engine behaviour using fossil fuel and methanol. J. Phys. Conf. Ser. 2018, 1122, 012018. [Google Scholar] [CrossRef]
- Boretti, A.; Osman, A.; Aris, I. Direct injection of hydrogen, oxygen and water into a novel two stroke engine. Int. J. Hydrogen Engery 2011, 36, 10100–10106. [Google Scholar] [CrossRef]
- Fernández-Dacosta, C.; Shen, L.; Schakel, W.; Ramirez, A.; Kramer, G.J. Potential and challenges of low-carbon energy options: Comparative assessment of alternative fuels for the transport sector. Appl. Energy 2019, 236, 590–606. [Google Scholar] [CrossRef]
- Gilbert, P.; Walsh, C.; Traut, M.; Kesieme, U.; Pazouki, K.; Murphy, A. Assessment of full life-cycle air emissions of alternative shipping fuels. J. Clean. Prod. 2018, 172, 855–866. [Google Scholar] [CrossRef]
- Labeckas, G.; Slavinskas, S. Performance and emission characteristics of a direct injection diesel engine operating on KDV synthetic diesel fuel. Energy Convers. Manag. 2013, 66, 173–188. [Google Scholar] [CrossRef]
- Matzen, M.; Alhajji, M.; Demirel, Y. Chemical storage of wind energy by renewable methanol production: Feasibility analysis using a multi-criteria decision matrix. Energy 2015, 93, 343–353. [Google Scholar] [CrossRef]
- Tang, Y.T.; Ma, X.Q.; Lai, Z.Y.; Chen, Y. Energy analysis and environmental impacts of a MSW oxy-fuel incineration power plant in China. Energy Policy 2013, 60, 132–141. [Google Scholar] [CrossRef]
- Yan, X.; He, Y.; Fan, A. Carbon footprint prediction considering the evolution of alternative fuels and cargo: A case study of Yangtze River ships. Renew. Sustain. Energy Rev. 2023, 173, 113068. [Google Scholar] [CrossRef]
- Zubi, G.; Dufo-López, R.; Carvalho, M.; Pasaoglu, G. The lithium-ion battery: State of the art and future perspectives. Renew. Sustain. Energy Rev. 2018, 89, 292–308. [Google Scholar] [CrossRef]
- International Maritime Organization. MEPC 65/22/Annex 14. Guidelines for Calculation of Reference Lines for Use with the Energy Efficiency Design Index (EEDI); IMO Marine Environment Protection Committee (MEPC): London, UK, 2013. [Google Scholar]
- Han, Z.; Jang, J.; Souppez, J.-B.R.G.; Maydison Oh, D. Environmental implications of sandwich structure of glass fiber-reinforced polymer ship. Ocean Eng. 2024, 298, 117122. [Google Scholar] [CrossRef]
- Maydison, K.H.; Lim, H.K.; Heo, J.; Choe, S.-B.; Kim, J.-S.; Jang, J.; Oh, D. Sustainable retrofitting for shipping: Assessing LNG dual fuel impact on global warming potential through life cycle assessment. Results Eng. 2024, 23, 102484. [Google Scholar] [CrossRef]
- International Maritime Organization. Guidelines on Life Cycle GHG Intensity of Marine Fuels (2024 LCA GUIDELINES); IMO Marine Environment Protection Committee (MEPC): London, UK, 2024. [Google Scholar]
- ISO 14040; Environmental Management—Life Cycle Assessment—Principles and Framework. British Standards Institution: London, UK, 2006.
- ISO 14044; Environmental Management—Life Cycle Assessment—Requirements and Guidelines. British Standards Institution: London, UK, 2006.
- Fang, L. Research on Ship’s Carbon Footprint Based on Theory of Life Cycle; Ningbo University: Ningbo, China, 2015. [Google Scholar]
- Han, Z.; Jang, J.; Oh, D. Design margin of composite structures of Korean fishing vessel and assessment of its environmental impact. Shipbuild. China 2020, 61, 90–100. [Google Scholar]
- Chatzinikolaou, S.D.; Ventikos, N.P. Holistic framework for studying ship air emissions in a life cycle perspective. Ocean Eng. 2015, 110, 113–122. [Google Scholar] [CrossRef]
- Dong, D.T.; Cai, W. A comparative study of life cycle assessment of a Panamax bulk carrier consideration of lightship weight. Ocean Eng. 2019, 172, 583–598. [Google Scholar] [CrossRef]
- Jeong, B.; Wang, H.; Oguz, E.; Zhou, P. An effective framework for life cycle and cost assessment of marine vessels with the aiming to select optimal propulsion systems. J. Clean. Prod. 2018, 187, 111–130. [Google Scholar] [CrossRef]
- Ling-Chin, J.; Roskilly, A.P. Comparative life cycle assessment of marine power systems. Energy Convers. Manag. 2016, 127, 477–493. [Google Scholar] [CrossRef]
- Greer, K.; Zeller, D.; Woroniak, J.; Coulter, A.; Winchester, M.; Deng Palomares, M.L.; Pauly, D. Global trends in carbon dioxide (CO2) emissions from fuel combustion in marine fisheries from 1950 to 2016. Mar. Policy 2019, 107, 103382. [Google Scholar] [CrossRef]
- Jeong, S.; Woo, J.H.; Oh, D. Simulation of greenhouse gas emissions of small ships considering operating conditions for environmental performance evaluation. Int. J. Nav. Arch. Ocean Eng. 2020, 12, 636–643. [Google Scholar] [CrossRef]
- Olmer, N.; Comer, B.; Roy, B.; Mao, X.; Rutherford, D. Greenhouse Gas Emissions from Global Shipping, 2013–2015 Detailed Methodology; International Council on Clean Transportation: Washington, DC, USA, 2017; pp. 1–38. [Google Scholar]
- Blanco-Davis, E.; Zhou, P. Life Cycle Assessment as a complementary utility to regulatory measures of shipping energy efficiency. Ocean Eng. 2016, 128, 94–104. [Google Scholar] [CrossRef]
- Burman, M.; Kuttenkeuler, J.; Stenius, I.; Garme, K.; Rosén, A. Comparative Life Cycle Assessment of the hull of a high-speed craft. Proc. Inst. Mech. Eng. M 2016, 230, 378–387. [Google Scholar] [CrossRef]
- Wang, H.; Boulougouris, E.; Theotokatos, G.; Zhou, P.; Priftis, A.; Shi, G. Life cycle analysis and cost assessment of a battery powered ferry. Ocean Eng. 2021, 241, 110029. [Google Scholar] [CrossRef]
- Oh, D.; Lee, D.; Jeong, S. Environmental impact evaluation on lightweight structure design of a composite ship by LCA (Life Cycle Assessment). J. Korean Soc. Precis. Eng. 2019, 36, 875–881. [Google Scholar] [CrossRef]
- International Maritime Organization. Guidelines on the Method of Calculation of the Attained Energy Efficiency Design Index (EEDI) for New Ships; MEPC: London, UK, 2022; p. 364. [Google Scholar]
- Fan, A.; Xiong, Y.; He, Y.; Yang, L.; Yin, Q. Lifecycle Carbon Footprint Study for Alternative Fuel Power of Yangtze River Ships. Ship Eng. 2022, 44, 70–75. [Google Scholar]
- Ewemoje, T.A.; Oluwaniyi, O.O. Mechanised shea butter production in south-western Nigeria using Life Cycle Assessments (LCA) approach from gate-to-gate. Agric. Eng. Int. 2016, 18, 230–242. [Google Scholar]
- Huang, J.; Fan, H.; Xu, X.; Liu, Z. Life cycle greenhouse gas emission assessment for using alternative marine fuels: A very large crude carrier (VLCC) case study. J. Mar. Sci. Eng. 2022, 10, 1969. [Google Scholar] [CrossRef]
- Myhre, G.; Shindell, D.; Bréon, F.-M.; Collins, W.; Fuglestvedt, J.; Huang, J.; Koch, D.; Lamarque, J.-F.; Lee, D.B.; Nakajima, T.; et al. Anthropogenic and Natural Radiative Forcing. In Climate Change 2013: The Physical Science Basis. Contribution of Working Group I to the Fifth Assessment Report of the Intergovernmental Panel on Climate Change; Stocker, T.F., Qin, D., Plattner, G.-K., Tignor, M., Allen, S.K., Boschung, J., Nauels, A., Xia, Y., Bex, V., Midgley, P.M., Eds.; Cambridge University Press: Cambridge UK; New York, NY, USA, 2014; pp. 659–740. [Google Scholar]
- Seithe, G.J.; Bonou, A.; Giannopoulos, D.; Georgopoulou, C.A.; Founti, M. Maritime transport in a life cycle perspective: How fuels, vessel types, and operational profiles influence energy demand and greenhouse gas emissions. Energies 2020, 13, 2739. [Google Scholar] [CrossRef]
- Tabibian, S.S.; Sharifzadeh, M. Statistical and analytical investigation of methanol applications, production technologies, value-chain and economy with a special focus on renewable methanol. Renew. Sustain. Energy Rev. 2023, 179, 113281. [Google Scholar] [CrossRef]
- Comer, B.; Beecken, J.; Vermeulen, R.; Sturrup, E.; Paschinger, P.; Osipova, L.; Gore, K.; Delahaye, A.; Verhagen, V.; Knudsen, B.; et al. Fugitive and Unburned Methane Emissions from Ships (FUMES): Characterizing Methane Emissions from LNG-Fueled Ships Using Drones, Helicopters, and On-Board Measurements; International Council on Clean Transportation (ICCT): Washington, DC, USA, 2024. [Google Scholar]
- Ghiasirad, H.; Skorek-Osikowska, A. Biomethanol production via electrolysis, oxy-fuel combustion, water-gas shift reaction, and LNG cold energy recovery. Int. J. Hydrogen Energy 2024, 52, 610–626. [Google Scholar] [CrossRef]
- Khan, S.; Jain, G.; Srivastava, A.; Verma, P.C.; Pande, V.; Dubey, R.S.; Khan, M.; Haque, S.; Ahmad, S. Enzymatic biomethanol production: Future perspectivee. Sustain. Mater. Technol. 2023, 38, e00729. [Google Scholar] [CrossRef]
- Thakare, M.; Pandit, S.; Pandit, C.; Ray, S.; Alkahtani, A.M.; Alabbosh, K.F.; Ranjan, N.; Geetha, S.; Joshi, S.J. A concise review on biorefinery remedies for biomethanol production and processing. Biocatal. Agric. Biotechnol. 2024, 57, 103061. [Google Scholar] [CrossRef]
- Mehra, R.K.; Duan, H.; Juknelevičius, R.; Ma, F.; Li, J. Progress in hydrogen enriched compressed natural gas (HCNG) internal combustion engines—A comprehensive review. Renew. Sustain. Energy Rev. 2017, 80, 1458–1498. [Google Scholar] [CrossRef]
- Sapra, H.; Godjevac, M.; De Vos, P.; Van Sluijs, W.; Linden, Y.; Visser, K. Hydrogen-natural gas combustion in a marine lean-burn SI engine: A comparitive analysis of Seiliger and double Wiebe function-based zero–dimensional modelling. Energy Conserv. Manag. 2020, 207, 112494. [Google Scholar] [CrossRef]
- Acciaro, M. Real option analysis for environmental compliance: LNG and emission control areas. Transp. Res. Part D Transp. Environ. 2014, 28, 41–50. [Google Scholar] [CrossRef]
- Xing, H.; Stuart, C.; Spence, S.; Chen, H. Alternative fuel options for low carbon maritime transportation: Pathways to 2050. J. Clean. Prod. 2021, 297, 126651. [Google Scholar] [CrossRef]
- Bilgili, L. A systematic review on the acceptance of alternative marine fuels. Renew. Sustain. Energy Rev. 2023, 182, 113367. [Google Scholar] [CrossRef]


| Parameter | Value | Parameter | Value |
|---|---|---|---|
| Length (m) | 278.90 | 75% MCR fuel consumption of main engine (g/kWh) | 159.16 |
| Distance between perpendiculars (m) | 265.00 | Number of generators and MCR (kW) | 4000 for 5 units and 1600 for 1 unit |
| Molded breadth (m) | 47.00 | 50% MCR fuel consumption of generators (g/kWh) | 198.79 |
| Molded depth (m) | 24.90 | Correction factor for reinforcement of ship voluntary structure | 1.0105 |
| Summer draft (m) | 17.30 | CSR correction factor | 1.0150 |
| Empty ship weight (t) | 29,067 | Design speed (kn) | 14.5 |
| Deadweight tonnage (t) | 154,955 | Baseline EEDI | 3.574 |
| Number of main engines and MCR (kW) | 14,675 for 1 unit | Reached EEDI | 2.774 |
| Fuel | Main Engine Model | SMCR/NCR | Specific FOC | SPOC/SGC |
|---|---|---|---|---|
| LPG | MAN 6G70ME-C10.5 LGIP-HPSCR | 15,128 kW × 74 rpm/13,615 kW × 74 rpm | 157.3 g/kWh | 6.34/140.1 g/kWh |
| LNG | MAN 6G70ME-C10.5-GI | 14,675 kW × 74 rpm/13,208 kW × 74 rpm | 161.9 g/kWh | 2.93/130.7 g/kWh |
| MeOH | MAN 6G60ME-C10.5-LGIM-SCRBP | 14,675 kW × 94.5 rpm/13,208 kW × 94.5 rpm | 168.8 g/kWh | 8.90/343.0 g/kWh |
| Low-Carbon Fuel Range (nm) | Dual Fuel | Primary Fuel or Not (Y/N) | EEDI Value | Low-Carbon Fuel Range (nm) | Dual Fuel | Primary Fuel or Not (Y/N) | EEDI Value |
|---|---|---|---|---|---|---|---|
| 0 | LPG–MDO | N | 2.774 | 10,000 | LPG–MDO | N | 2.666 |
| LNG–MDO | LNG–MDO | 2.418 | |||||
| MeOH–MDO | MeOH–MDO | 2.724 | |||||
| 1000 | LPG–MDO | N | 2.838 | 11,000 | LPG–MDO | N | 2.647 |
| LNG–MDO | 2.738 | LNG–MDO | Y | 2.032 | |||
| MeOH–MDO | 2.769 | MeOH–MDO | Y | 2.694 | |||
| 2000 | LPG–MDO | N | 2.819 | 12,000 | LPG–MDO | Y | 2.463 |
| LNG–MDO | 2.702 | LNG–MDO | 2.030 | ||||
| MeOH–MDO | 2.764 | MeOH–MDO | 2.691 | ||||
| 3000 | LPG–MDO | N | 2.800 | 13,000 | LPG–MDO | Y | 2.461 |
| LNG–MDO | 2.667 | LNG–MDO | 2.028 | ||||
| MeOH–MDO | 2.759 | MeOH–MDO | 2.688 | ||||
| 4000 | LPG–MDO | N | 2.780 | 14,000 | LPG–MDO | Y | 2.458 |
| LNG–MDO | 2.631 | LNG–MDO | 2.026 | ||||
| MeOH–MDO | 2.754 | MeOH–MDO | 2.686 | ||||
| 5000 | LPG–MDO | N | 2.761 | 15,000 | LPG–MDO | Y | 2.456 |
| LNG–MDO | 2.595 | LNG–MDO | 2.024 | ||||
| MeOH–MDO | 2.749 | MeOH–MDO | 2.683 | ||||
| 6000 | LPG–MDO | N | 2.742 | 16,000 | LPG–MDO | Y | 2.453 |
| LNG–MDO | 2.560 | LNG–MDO | 2.022 | ||||
| MeOH–MDO | 2.744 | MeOH–MDO | 2.681 | ||||
| 7000 | LPG–MDO | N | 2.723 | 17,000 | LPG–MDO | Y | 2.451 |
| LNG–MDO | 2.524 | LNG–MDO | 2.020 | ||||
| MeOH–MDO | 2.739 | MeOH–MDO | 2.678 | ||||
| 8000 | LPG–MDO | N | 2.704 | 18,000 | LPG–MDO | Y | 2.449 |
| LNG–MDO | 2.489 | LNG–MDO | 2.018 | ||||
| MeOH–MDO | 2.734 | MeOH–MDO | 2.675 | ||||
| 9000 | LPG–MDO | N | 2.685 | ||||
| LNG–MDO | 2.453 | ||||||
| MeOH–MDO | 2.729 |
| Item | Unit | MDO | LNG | LPG | MeOH (Biomass) | MeOH (NG) | MeOH (Coal) | |
|---|---|---|---|---|---|---|---|---|
| Low Calorific Value (LCV) | MJ/kg | 42.7 | 48.0 | 46.3 | 19.9 | |||
| Density | kg/m3 | 900 | 450 | 610 | 790 | |||
| Emission Factors | CO2 | g/kg | 3212 | 2750 | 3000 | 1375 | ||
| CH4 | g/kg | 0.1 | 14.5 | 1 | 0.2 | |||
| N2O | g/kg | 0.0798 | 0.0245 | 0.1770 | 0.01 | |||
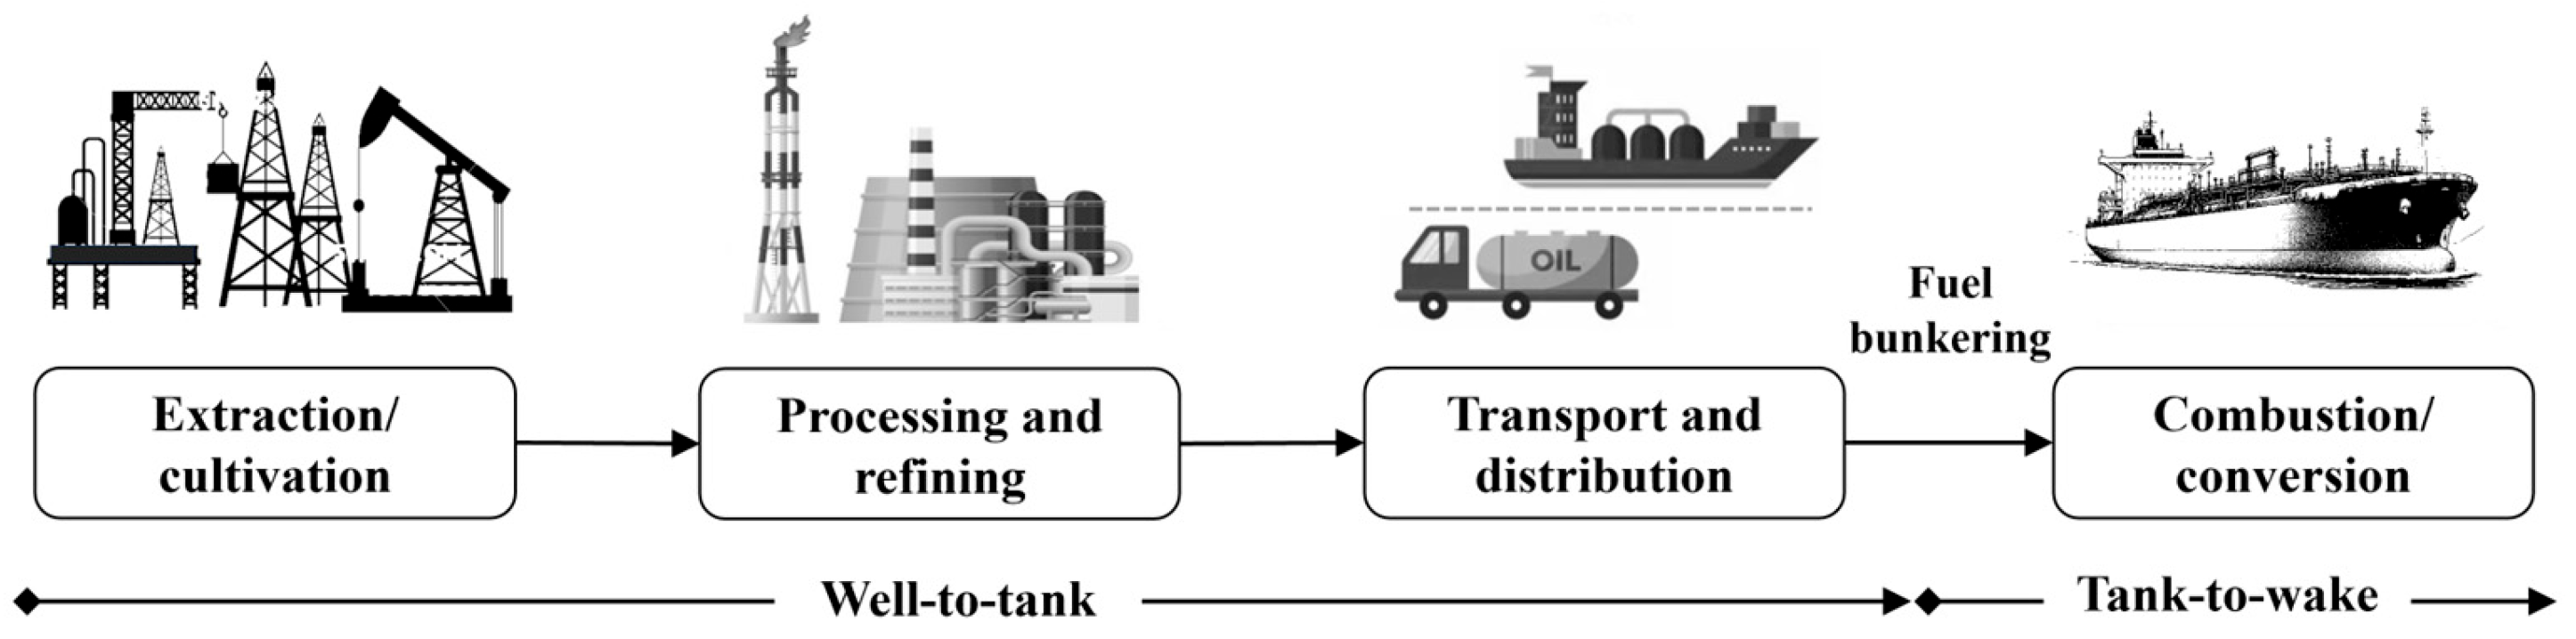
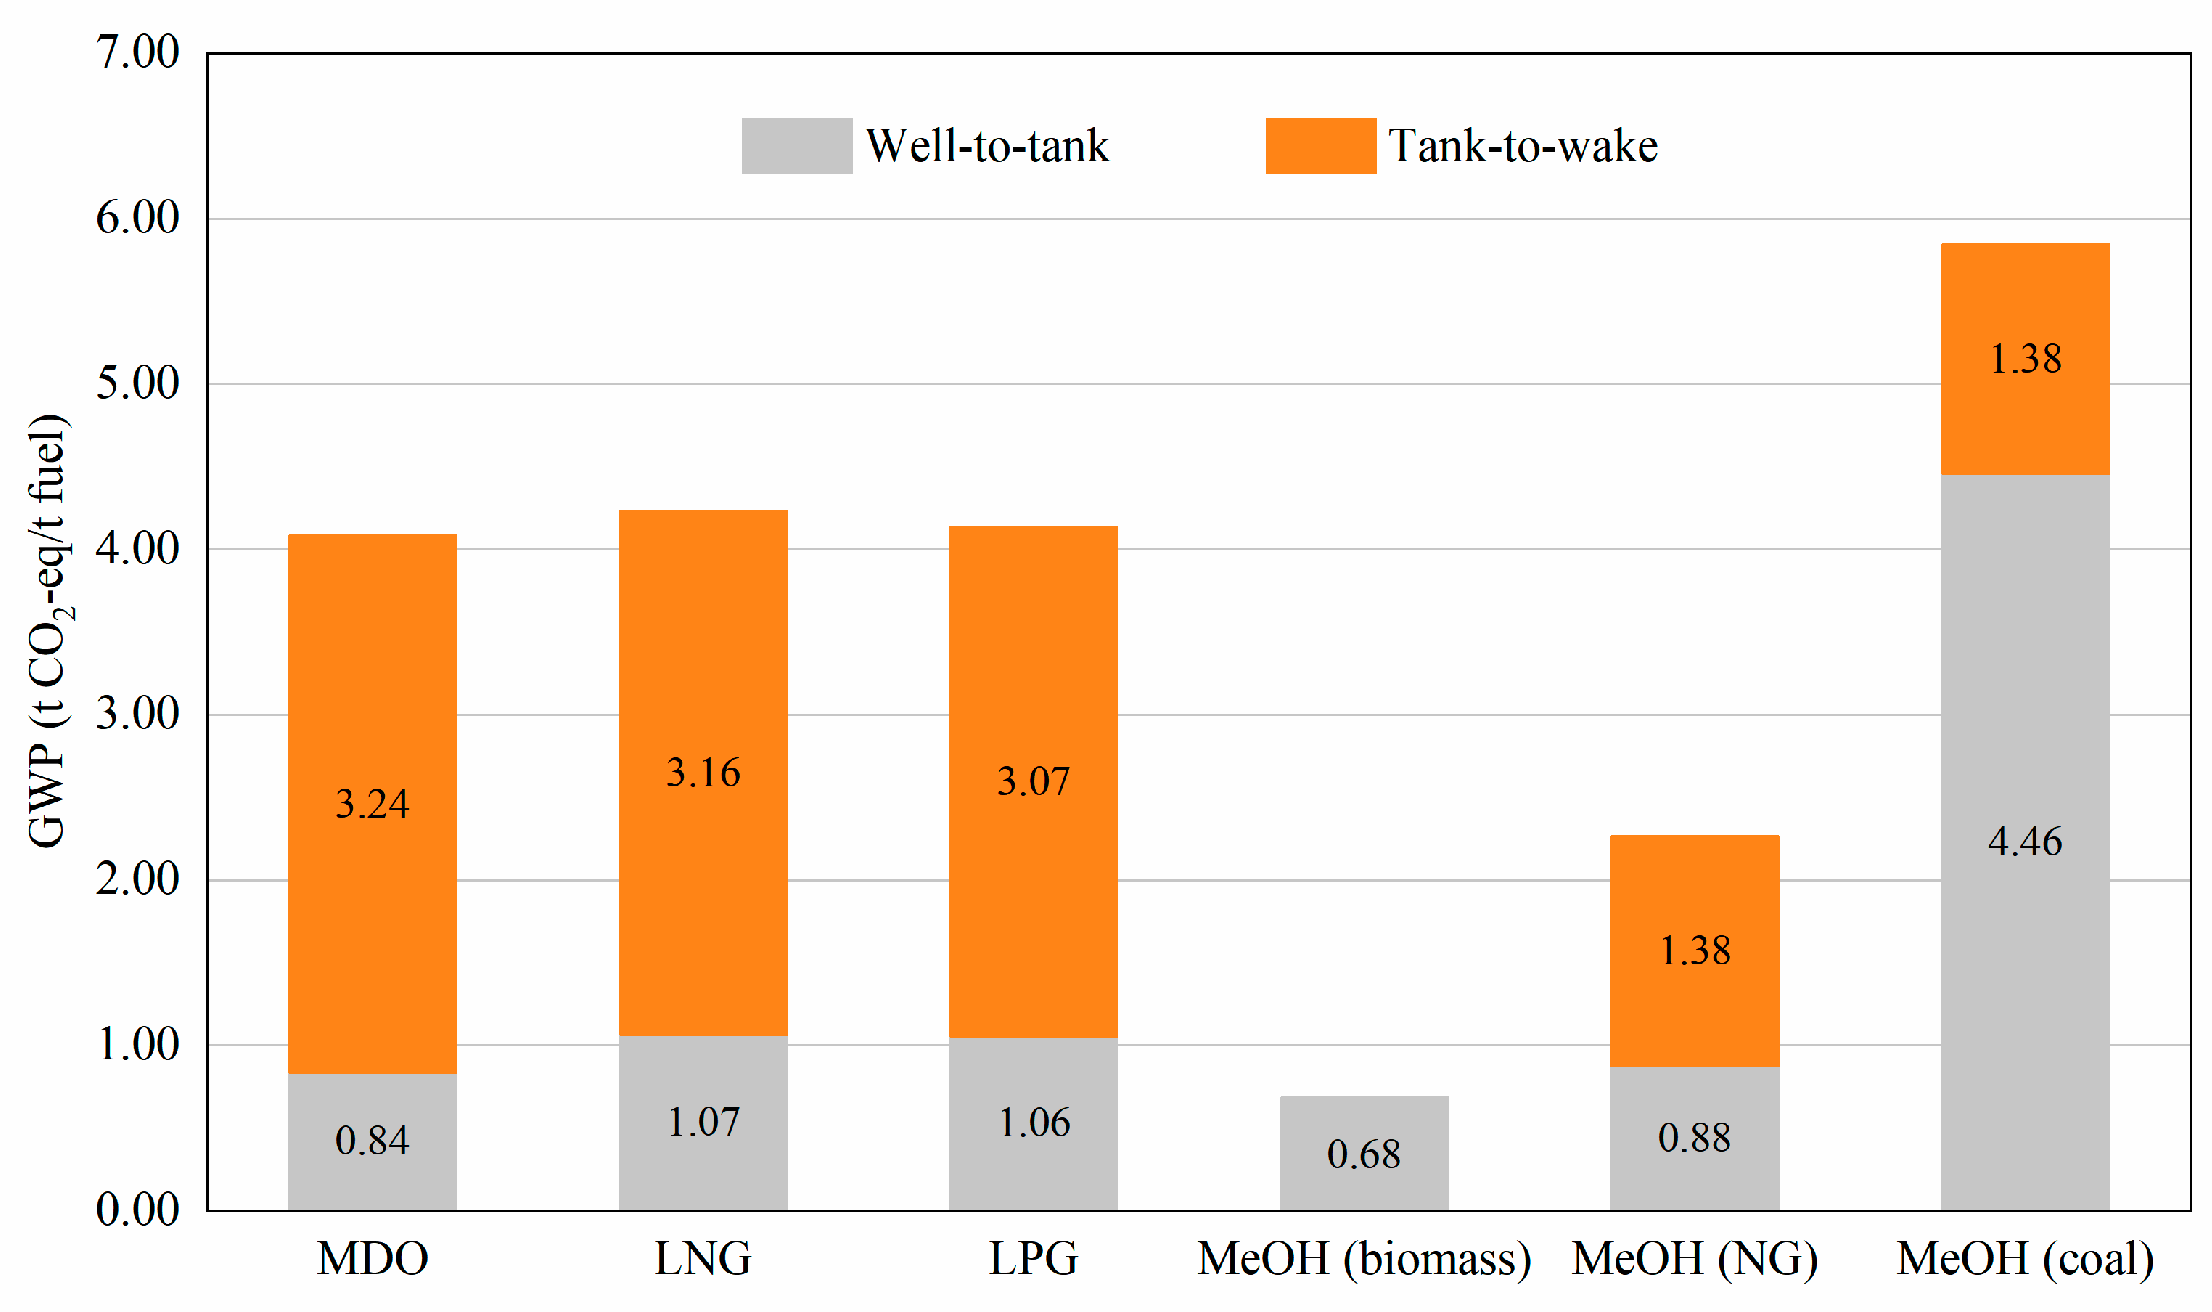
| well-to-tank | t CO2-eq | 0.84 | 1.07 | 1.06 | 0.68 | 0.88 | 4.46 | |
| tank-to-wake | t CO2-eq | 3.24 | 3.16 | 3.07 | 1.38 | 1.38 | ||
| Fuel Consumption (t) | Fuel Consumption (t) | ||||||||
|---|---|---|---|---|---|---|---|---|---|
| No. | Low-Carbon Fuel | Diesel Fuel | Pilot Oil | No. | Low-Carbon Fuel | Diesel Fuel | Pilot Oil | ||
| 1 | LPG | 0 | 2899.46 | 0 | 11 | LPG | 1452.52 | 1288.65 | 66.15 |
| LNG | LNG | 1431.24 | 29.65 | ||||||
| MeOH | MeOH | 3472.43 | 90.07 | ||||||
| 2 | LPG | 145.25 | 2738.38 | 6.61 | 12 | LPG | 1597.77 | 1127.57 | 72.76 |
| LNG | 143.12 | 2.97 | LNG | 1574.36 | 32.62 | ||||
| MeOH | 347.24 | 9.01 | MeOH | 3819.67 | 99.08 | ||||
| 3 | LPG | 290.50 | 2577.29 | 13.23 | 13 | LPG | 1743.02 | 966.49 | 79.38 |
| LNG | 286.25 | 5.93 | LNG | 1717.49 | 35.58 | ||||
| MeOH | 694.49 | 18.01 | MeOH | 4166.91 | 108.09 | ||||
| 4 | LPG | 435.76 | 2416.21 | 19.84 | 14 | LPG | 1888.28 | 805.40 | 85.99 |
| LNG | 429.37 | 8.90 | LNG | 1860.61 | 38.55 | ||||
| MeOH | 1041.73 | 27.02 | MeOH | 4514.16 | 117.10 | ||||
| 5 | LPG | 581.01 | 2255.13 | 26.46 | 15 | LPG | 2033.53 | 644.32 | 92.60 |
| LNG | 572.50 | 11.86 | LNG | 2003.73 | 41.52 | ||||
| MeOH | 1388.97 | 36.03 | MeOH | 4861.40 | 126.10 | ||||
| 6 | LPG | 726.26 | 2094.05 | 33.07 | 16 | LPG | 2178.78 | 483.24 | 99.22 |
| LNG | 715.62 | 14.83 | LNG | 2146.86 | 44.48 | ||||
| MeOH | 1736.21 | 45.04 | MeOH | 5208.64 | 135.11 | ||||
| 7 | LPG | 871.51 | 1932.97 | 39.69 | 17 | LPG | 2324.03 | 322.16 | 105.83 |
| LNG | 858.74 | 17.79 | LNG | 2289.98 | 47.45 | ||||
| MeOH | 2083.46 | 54.04 | MeOH | 5555.89 | 144.12 | ||||
| 8 | LPG | 1016.76 | 1771.89 | 46.30 | 18 | LPG | 2469.28 | 161.08 | 112.45 |
| LNG | 1001.87 | 20.76 | LNG | 2433.10 | 50.41 | ||||
| MeOH | 2430.70 | 63.05 | MeOH | 5903.13 | 153.13 | ||||
| 9 | LPG | 1162.02 | 1610.81 | 52.92 | 19 | LPG | 2614.54 | 0 | 119.06 |
| LNG | 1144.99 | 23.72 | LNG | 2576.23 | 53.38 | ||||
| MeOH | 2777.94 | 72.06 | MeOH | 6250.37 | 162.13 | ||||
| 10 | LPG | 1307.27 | 1449.73 | 59.53 | |||||
| LNG | 1288.11 | 26.69 | |||||||
| MeOH | 3125.19 | 81.07 | |||||||
| Industrial Designation or Common Name | GWP Values for 100-Year Time Horizon: Fifth Assessment Report (AR5) |
|---|---|
| Carbon dioxide (CO2) | 1 |
| Methane (CH4) | 28 |
| Nitrous oxide (N2O) | 265 |
| CO2-eq |
Disclaimer/Publisher’s Note: The statements, opinions and data contained in all publications are solely those of the individual author(s) and contributor(s) and not of MDPI and/or the editor(s). MDPI and/or the editor(s) disclaim responsibility for any injury to people or property resulting from any ideas, methods, instructions or products referred to in the content. |
© 2025 by the authors. Licensee MDPI, Basel, Switzerland. This article is an open access article distributed under the terms and conditions of the Creative Commons Attribution (CC BY) license (https://creativecommons.org/licenses/by/4.0/).
Share and Cite
Wang, Z.; Fan, S.; Han, Z. Decarbonation Effects of Mainstream Dual-Fuel Power Schemes Focus on IMO Mandatory Regulation and LCA Method. J. Mar. Sci. Eng. 2025, 13, 847. https://doi.org/10.3390/jmse13050847
Wang Z, Fan S, Han Z. Decarbonation Effects of Mainstream Dual-Fuel Power Schemes Focus on IMO Mandatory Regulation and LCA Method. Journal of Marine Science and Engineering. 2025; 13(5):847. https://doi.org/10.3390/jmse13050847
Chicago/Turabian StyleWang, Zhanwei, Shidong Fan, and Zhiqiang Han. 2025. "Decarbonation Effects of Mainstream Dual-Fuel Power Schemes Focus on IMO Mandatory Regulation and LCA Method" Journal of Marine Science and Engineering 13, no. 5: 847. https://doi.org/10.3390/jmse13050847
APA StyleWang, Z., Fan, S., & Han, Z. (2025). Decarbonation Effects of Mainstream Dual-Fuel Power Schemes Focus on IMO Mandatory Regulation and LCA Method. Journal of Marine Science and Engineering, 13(5), 847. https://doi.org/10.3390/jmse13050847