Abstract
Sedimentary coastal areas change rapidly and are economically and environmentally important. This research focuses on determining the extent to which natural dynamics and human activity have contributed to visible changes on Rodas, Cíes Islands in southwestern Galicia (NW Spain). The number of visitors to the islands has increased in recent years, and the port infrastructure has therefore been expanded. Previously, this zone experimented with important sand extraction phases. These changes have influenced the ecosystem directly by modifying the sedimentary behavior and indirectly by promoting even greater numbers of visitors to the area. Aerial images and orthophotographs of the study zone were examined to identify changes that have taken place over the last sixty-one years (1956–2017). Changes in the position of the shoreline, defined as the boundary of the dune vegetation, were mapped at different times between 1956 and 2017. Changes in the shoreline were quantified using GIS (Geographic Information System) technology and Digital Shoreline Analysis System (DSAS) software. The findings revealed that the system regressed by more than 30 m between 1956 and 1981, in part as a result of sand extraction. We also identified different erosion/accretion phases that occurred before the reformation of the Rodas dock in 2010. The system is currently undergoing important changes, especially in the northern area, with a regression of 14.14 m in the last seven years. In this context, LiDAR analysis from 2010 and 2015 using Geomorphic Change Detection (GCD) tools allowed variations in the dune system to be verified. The elevation in the study zone increased in 83% of the area, mainly in the frontal dune and close to the winter inlet (north sector). However, the variations were very small.
1. Introduction
The coastal zone is a very vulnerable area. Tidal and storm-induced flooding and changes in coastal dynamics have huge influences on this environment by transforming it and possibly causing important material damage in the areas most strongly impacted by anthropogenic activity [1].
Coastal dynamics are affected by multiple factors such as changes in the sea level [2], the frequency and intensity of storms [3,4,5], geomorphological dynamics close to the littoral zone, and the availability of sediments [6]. The need for in-depth knowledge of the factors related to coastline evolution has increased in recent years within the context of global change, and protocols have been developed to minimize the potential effects of such change [7,8].
The coastal zone comprises diverse types of land [9], which can be categorized simply as sedimentary or rocky. The former exhibits greater dynamism than the latter over a short space of time and its greater fragility has led many researchers to focus their studies on sedimentary coastline areas. The study of these systems has also been driven by the strong impact of tourism in many of these areas, as coastal planning requires knowledge of such impacts and the changes that occur [10].
Different methods have been used to analyze changes in coastal areas [11,12,13,14,15]. However, the essential starting point for any study of this type is to define and delimit the shoreline to enable quantification of any changes that take place. The shoreline refers to the intersection between the Earth’s surface and the sea. Nevertheless, delimitation of this line is not straightforward, as the intersection is highly dependent on the scale of both temporal and spatial analyses. Changes in the shoreline occur continuously and should be interpreted with this in mind and not by considering only one-off changes, as is commonly done [16]. In addition to the difficulty with mapping and delimitation, selection of the point where change can be monitored is also problematic. Different options have traditionally been used, the most common of which are the high-water line (HWL), the dune toe [17], and the cliff toe/top [18]. Selection of a marker is based on the availability of information about the area and characteristics such as the tidal range or presence/absence of dune vegetation.
In recent years, the number of studies about coastal vulnerability has grown [19,20]. This is due primarily to interest in the consequences of global change (e.g., an increase in frequency of storms or the sea level rise). These analyses have been made from multiple, such as the study of local newspapers on the periodicity and damages [21], or the use of remote sensing and aerial images [22]. It is necessary to highlight the great evolution of remote images in the last decades as well as the use of unmanned aerial vehicles (UAVs) for coastal analysis. This technology allows more detailed studies with centimetric accuracy [23,24,25].
Global change has great importance at the local level. These effects are especially relevant in areas where, due to their natural or landscape interest, attract a great number of people. This is the case for Illas Atlánticas Natural Park, where Cíes Island is located. In this archipelago, singular and valuable natural elements that do not appear in nearest continental shore are protected. Island access is very easy due to the excellent boat communication and the close proximity to Vigo city. This means that a relevant amount of people visits the islands to explore their beaches and not due to their natural value, as was seen in fieldwork campaigns. This human pressure on the beach-dune system of Rodas is a challenge to their stability, as also demonstrated in other insular places, such as Menorca [26]. The beach-dune system of Rodas is a singular space in the NW of the Iberian Peninsula. Thus, this research has the purpose of obtaining detailed information about natural and human-induced modifications that have occurred in this system over the last 61 years.
To analyze the variations in the Rodas system, two types of software were used. The DSAS (Digital Shoreline Analysis System) [27] was used to analyze the coastline variation (in two dimensions) from aerial images. On the other hand, to analyze the volumetric variations, GCD (Geomorphic Change Detection) software was used [28]. These data and software were used to obtain the variation values and temporal tendencies in the study area. This study seeks to understand how the shoreline variations are linked to the natural dynamics, historical use of the area, and pressure from tourism in recent years.
2. Study Area
The study was conducted on the Rodas beach-dune system on the sheltered eastern side of the Cíes Islands (Figure 1) about 5 km from the coast of southwestern Galicia (NW Spain) in the Illas Atlánticas de Galicia National Park. The cliffs on the western side of the archipelago are high (up to 170 m) and steeply sloping (80˚), while those on the eastern side are lower (150 m) and less steep (70˚).
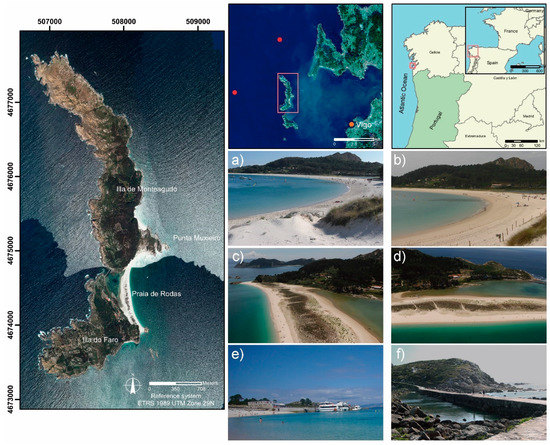
Figure 1.
Map of the study location. The red dots represent SIMAR model location points, and the orange dot represents the Vigo-2 mareograph location. The pictures show different island zones: (a) Rodas beach from the north, (b) Rodas beach from the central zone, (c) and (d) dune vegetation and lagoon, (e) Rodas dock and (f) dike between Monteagudo and Faro islands.
The swell affecting the archipelago predominantly comes from the west and northwest throughout the year (Figure 2). The waves have a clear western component during winter, and this changes towards the north as autumn approaches. Moreover, it is necessary to highlight the importance of SW waves, which are more important in energetic events. The waves reach maximum heights in winter, often exceeding 5 m between October and February. Sandy areas, including the Rodas system, only occur on the eastern side of the island where the influence of maritime storms is lower than on the western side [29]. The tidal regime (Figure 2) in the area is meso-tidal (2–4 m) and semidiurnal [30,31]. The Rodas system is affected by the most energetic events. In these moments, the waves exceed the dike and can erode the system, especially in the north sector, where there is currently an ephemeral inlet opening [32].
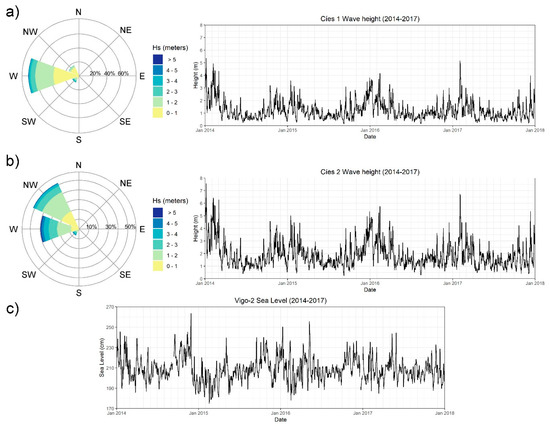
Figure 2.
Wave data from Cíes Islands. (a) Cíes 1 is SIMAR point 3014007, which is localized in the north of the islands, and (b) Cíes 2 is SIMAR point 1044069, which is localized in the west of the archipelago. (c) Sea level data correspond to the Vigo-2 mareograph. Data were taken from Puertos del Estado (2018).
Although a general study of the Cíes Islands was recently conducted [29], most research has concerned the Rodas beach-dune-lagoon system. This area was analyzed by Costas and colleagues from different perspectives, including the effect of storms on this low-energy beach [33], coastal evolution (using georadar technology) [34], quantification of system variations in the last decades [35], and the role of human influences on the evolution of the system [36]. These works do not include the last decade of information. A historical reconstruction of the system was recently conducted using marine records [37]. Other studies have investigated the influence of wildlife on the ecosystems of the archipelago [38,39,40], mainly focusing on the impacts of seagull colonies on the soil and vegetation. The aim of this study is to show the more recent system evolution as well as applying new techniques for calculating the volumetric variations experienced in recent years.
Rodas beach is about 1000 m in length, and its width varies between 40 m at the ends to 150 meters in the central zone. It is a sheltered/pocket beach where the structure and types of rocks are key factors to understand the geoforms. The wave action is very limited [33,41]. In this sector, on account of refraction and diffraction (northern headland), the NNW waves arrive at the beach in parallel [36]. For their part, the SW waves have a small angle of incidence, but generally, these waves have a great erosive potential, as demonstrated by their links with the most energetic events [33].
In the case of Rodas, the presence of a lagoon connected with the open sea at the occidental end is also significant. During the most energetic events, this facilitates dune erosion, and can even open a channel in the north of the sedimentary area in moments of storm and high tidal events. [36,42]. Until the 1950s, the inlet opened in the south sector [42]. These energetic events and the beach morphology hamper the availability of sediment for retrieval.
Rodas beach sediment consists predominantly of very well-rounded quartz (95%) and some biogenic material. Furthermore, in [43] a grain size of about 0.44 mm was identified in the dune, backshore, and beach, while in the steps, this value increased to 0.78 mm [42].
Tourism is a key factor for understanding the dynamics of Rodas. The number of visitors to the Cíes Islands has increased greatly in recent years, although there is now a limit of 2200 people and 800 campers per day. In recent years, there has been a conflict with the transport companies in relation to the maximum number of tourists. As a result, the companies have had to pay penalties, and the government has formed a new system for controlling visitor numbers. These visitors represent a new variable that must be taken into consideration when studying the dynamics of the system. Since regular boat trips to the islands first started in the 1950s [44], the number of visitors has undergone a dramatic increase, particularly in recent years. Thus, in 2008, the number of visitors arriving at Cíes by regulated transport was 135,494, and in 2016, the corresponding number was 244,337, i.e., an increase of more than 100,000 people in just eight years. These numbers do not include people arriving in private boats (26,578 in 2016) or researchers and participants in activities taking place in nearby waters (information provided by the public use area of the Atlantic Island of Galicia National Maritime-Terrestrial Park). It is relevant that currently, tourists visit the islands outside of high season. The arrival of tourists now occurs year-round, except the winter months, due to the meteorology conditions.
3. Material and Methods
Data were obtained from eight aerial surveys extending from 1956 to 2017 (Instituto Geográfico Nacional de España (IGN) (Table 1). From these images, the area was analyzed in different periods to understand the dominant dynamics at each moment.

Table 1.
Images used in the study with scale and image type.
One of the main difficulties with this type of study lies in the errors associated with the images (e.g., the errors associated with deformation of the images, terrain relief, georeferencing, the time of the year of acquisition, and the interpretation or measuring errors when mapping the shoreline) [45]. The level of error associated with aerial photographs is particularly high due to the great number of intermediate processes involved in producing these images. However, the level of error has been greatly reduced through the application of recent technologies and the use of high-resolution digital elevation models (DEMs) to produce orthophotographs. In this study, it was assumed that the error for each of the dates was accumulative [18], so the inherent uncertainty of the image was added to the associated georeferencing error in the case of aerial photographs and possible errors related to the cartography of the shoreline.
Different methods of shoreline delimitation were evaluated in relation to the quality of images available and the fact that the study area is characterized by sediments with the presence of dune vegetation. The seaward line of dune vegetation was selected as the reference line for determining change [16,46]. Use of the high-water level as the shoreline was excluded as there are significant differences in the meso-tidal zone, and the images were taken at different times of the year. The dune vegetation line [16,46] was considered to be the most easily identifiable and stable element in all images, even considering the difficulty in mapping this line, mainly due to the image quality and their capture in different seasons. In this study, the shoreline definition was done manually (Figure 3) based on the aerial photography or orthophotography interpretation at a scale of 1:500 for each image.
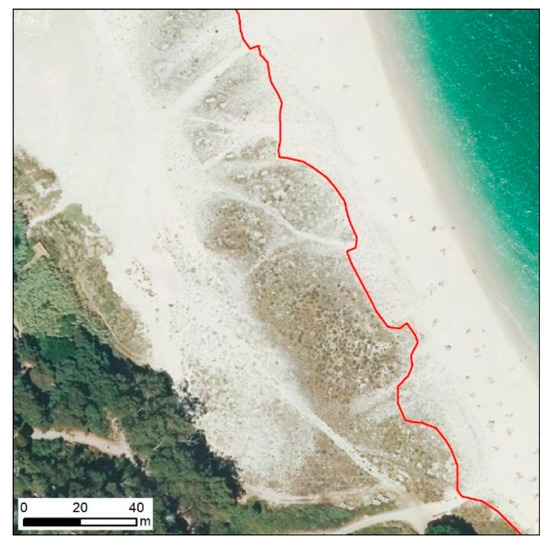
Figure 3.
Example of manual shoreline definition on a 2017 orthophotograph.
The analyzed area is 575 m long and was divided into three sectors designated north, central, and south to facilitate the interpretation of the results. Transects were established perpendicular to the shoreline at 5 m intervals. Analysis of the changes was carried out by mapping the existing shoreline at different times and subsequently applying the Digital Shoreline Analysis System (DSAS) [27], a software extension for ArcGIS 10.5 software (license USC) (Figure 4).
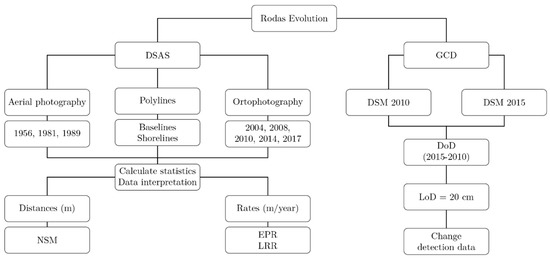
Figure 4.
Flowchart with DSAS (Digital Shoreline Analysis System) and GCD (Geomorphic Change Detection) methodology and data used in this study.
The results were interpreted by considering three different estimators: the net shoreline movement (NSM), the end point rate (EPR), used for the analysis of shorelines with the same level of uncertainty regarding their position, and linear regression (LRR), used for the periods when the shoreline position was associated with different levels of uncertainty [47]. These parameters are defined as follows:
The NSM is the difference (in m) between the oldest and most recent line.
The EPR is the value of the NSM divided by the number of years separating the two lines (expressed as the change in m/year).
LRR is equivalent to EPR but includes the uncertainty associated with the calculation of the regression line by adapting to the lines where the associated error is lowest [27]. This parameter fits the line with a least-squares technique. In all cases, the study used a confidence interval of 95%.
The analyses were carried out at different temporal scales. In order to obtain an overall view of the study area, the changes over the entire period between 1956 and 2017 were first considered. The period was then split into two broad phases, 1956–1981 and 1981–2017, in order to examine the possible effect of increasing anthropological activity on this coast. Finally, a more detailed analysis was conducted to examine the impact of infrastructure renovation by comparing the period of 2008–2010 with 2010–2017.
Following the analysis of 2D variations, the volumetric changes in the dune system were calculated from LiDAR data (IGN) from 2010 and 2015 using GCD software on ArcGIS 10.5 [28]. For this analysis, we used the complete point cloud (all categories) and filtered the anomalous values with the same software. This application generated two digital surface models (DSMs), one for each date, and calculated the variations considering a Limit of Detection (LoD) of ±0.2 meters for elevation values (Figure 5) in relation to LiDAR data technical specifications. The GCD software generated a new raster file named the Difference of DEM (DoD), which represented the variation between both dates.
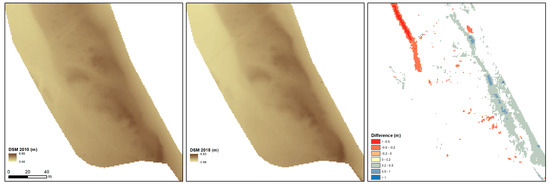
Figure 5.
GCD analysis example in a small Rodas sector. From left to right: Digital surface model (DSM) from 2010, DSM from 2015, and difference of digital elevation models (DEM) (DoD) between the two dates.
4. Results
The results of this study are presented in chronological order, from the longest to the shortest periods and from the oldest to the most recent analyses. In order to facilitate interpretation of the results and to identify the various dynamics existing along the study area, reference is always made to the changes in the three estimators defined in the Material and Methods Section.
4.1. Period 1956–2017
Analysis of the entire study period revealed a net shoreline retreat throughout the system (Figure 6), with the least erosion occurring in the central sector of Rodas Beach. The values were highest in the southern part of the north sector and in the south sector. These data suggest (Table 2) that mean rates of erosion were about 0.37 to 0.43 m year−1, but as the period is fairly long, it is likely that the beach experienced more rapid erosion events punctuated by compensatory sedimentary phases. As shown by the NSM parameter values, the total variation exceeded 30 m.
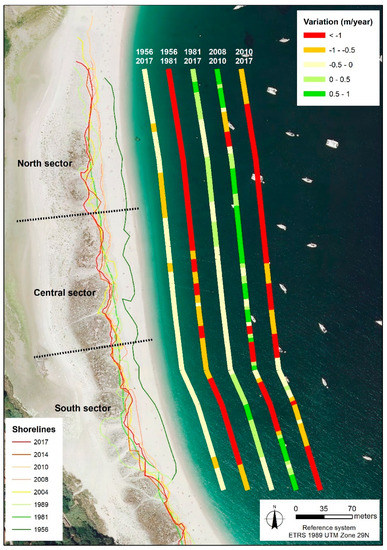
Figure 6.
Shoreline variation for all periods. The thin lines in the sand represent the shoreline position on each date. The change is represented parallel to the coastline in the sea and the variation is represented in m/year by the end point rate (EPR) for 1956–1981 and 2008–2010 and by LRR for the periods of 1956–2017, 1981–2017, and 2010–2017.
Table 2.
Evolution rates LRR (linear regression) and NSM (net shoreline movement) between 1956 and 2017.
4.2. Period 1956–1981
A high level of erosion occurred in the earlier part of the study period, particularly in the northern and southern sectors (Figure 6) and (Table 3). On average, the retreat was greatest in the northern sector (−1.48 m yr−1) and was significantly lower in the more central part (−1.01 m yr−1) of the beach. This period coincided with the highest waves—13.09% exceeded 3 m.
Table 3.
Evolution rates between 1956 and 1981.
4.3. Period 1981–2017
Erosion rates were much lower during this period than from 1956 to 1981, and there was also greater spatial variability in the rates along the beach (Table 4). The northern sector remained almost static, with a high level of accretion in the far north. Sedimentation also occurred in the majority of the south sector. In the rest of the system, there was generalized retreat of less than 5 m over the period. Rates of retreat were highest in the southern zone of the south sector and in various areas of the central sector (Figure 6). The prominence of areas that experienced little erosion or deposition is evident by the fairly low mean retreat rate in the NSM parameter. This was a very large period where the wave dynamics and NAO (North Atlantic Oscillation) values varied widely. This variation explains, in part, the low evolution rates in relation to different erosive and sedimentary phases.
Table 4.
Evolution rates between 1981 and 2017.
4.4. Period 2008–2010
Sedimentation was generally observed in the north and central sectors during this period (Table 5). Retreat rates showed very low erosion, with this being concentrated in the northern part of the southern sector (Figure 6). This was the only part of the beach with negative change values for this period. In these years, waves above 3 m represented the lower series value, with 10.52%. Furthermore, for these dates, the NAO index presented negative values, especially in 2010.
Table 5.
Evolution rates between 2008 and 2010.
4.5. Period 2010–2017
The shoreline retreated throughout almost the entire area during this period, especially in the north sector (Table 6). Small areas of deposition were detected in the northern part of the south sector and in the southern part of the central sector (Figure 6). Retreat was particularly high in the north sector and at the southern end of the system with NSM values above 14 m. There was an increase in waves above 3 m during this period, representing 12.4% of the total waves. The storm frequency increased during these years, especially in comparison to the preceding period.
Table 6.
Evolution rates between 2010 and 2017.
4.6. GCD Analysis 2010–2015
In global terms, for the period of June 2010 to July 2015, the Rodas system experienced an accretion phase over most of the study zone (Table 7). The surface analysis showed that, for an LoD of 0.2 m, the raised area exceeded 15,000 m2, representing over 75% of the total area. The net volume difference was positive in Rodas, with an increase of near to 6700 m3.
Table 7.
Analysis of GCD values in the Rodas system with different Limits of Detection (LoD).
This increase in elevation is especially important in the frontal dune along the whole system and in the north sector (Figure 7). In the frontal dune, this change could be related to beach gradient variations. These variations are mainly the result of the different forces that occur in this sector, such as the frequency and power of storms. The north accretion zone coincides with the area usually occupied by the winter inlet. This change can be linked to the different behaviors in winter in terms of the number of storms and their virulence. The 2014–2015 winter was less energetic in comparison with previous years, which facilitated sedimentation in this zone.
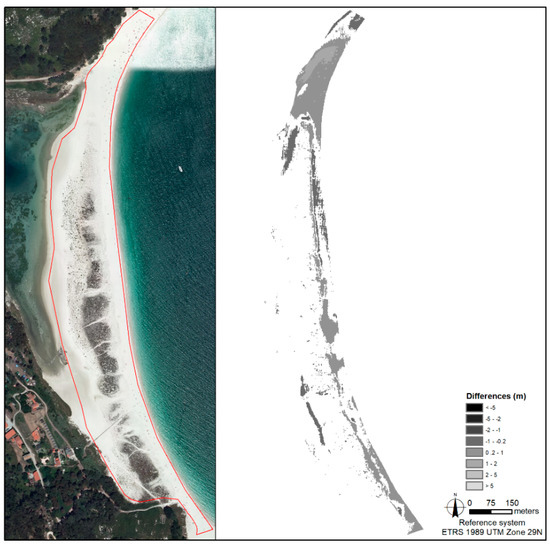
Figure 7.
GCD Analysis: The right part represents the study zone (red polygon) in the orthophotograph. The left side represents the elevation variations in the sector.
5. Discussion
Many studies have analyzed the interrelation between natural and anthropic factors in coastal areas [48,49]. For the most part, variation has been shown to exist in coastal systems, but the authors have not quantified the human impact related to these changes. Infrastructure development and urbanization in coastal areas are the main factors linked to the modern dynamics [50]. Discerning between natural and anthropic changes in the Rodas system, as in other zones, is very complicated, because these factors are interrelated in the time and space [51]. Thus, all suppositions about coastal analysis should understand this problem and make an effort to improve the analytical techniques, for example, determining, in detail, the effect of tourists in a determinate zone in relation to the loss of sand.
Erosion and/or accretion may occur between monitoring dates, and both processes depend on the season and the number of energy events that have occurred in a particular year. This becomes evident when analyzing shorter time cycles, e.g., in the central sector, both erosion phases (between 1956 and 1981) and sedimentation phases (between 2008 and 2010) were identified. The moment of aerial image acquisition should also be taken into consideration. In this sector, energetic events can modify the shape. In this case, the images are from the summer, when the waves are lower and the storms are not relevant.
One key factor for understanding the evolution of coastal systems is the availability of sediment in nearby areas. The amount of sediment remains almost stable in the archipelago as there is no input of sand from the mainland [34], thus ruling out the possibility that the construction of dams [52] has influenced the dynamics of the Rodas system. The input of sediment via circulation in the Ría de Vigo is greatly influenced by the dense population in this area. Generally, the largest proportion of sediment corresponds to old deposits containing a high proportion of biogenic material [32,36]. The most important changes in the Rodas system occurred between 1956 and 1981, during which the net retreat exceeded 30 m in the north and south sectors. This led to the appearance of an inlet in the northern part of Rodas that connects the lagoon with the sea during winter storms, while the inlet that formed up until the 1950s in the southern sector disappeared gradually [37]. The differences in this period are primarily due to the human activities in the area, such as sand extraction [43]. There is no data to quantify variation in this area due to these activities. To conduct a correct analysis of variations by examining old aerial photographs, the level of uncertainty must be considered (in this case, 4 m in the oldest images), as the estimated rates of retreat may be affected by this margin of error.
There is no information about wave dynamics or other information in relation to forces that impact Rodas for the entire period. Analysis with the SIMAR dataset was initiated in 1958 for point 1044069. With this dataset, the wave height variation for all periods could be verified. The higher values were in the period of 1956–1981, the moment of major erosion in the system, when the waves above 3 m represented 13.09% of all waves. Since the year 1981, the percentage of waves above 3 m has decreased, especially between 2008 and 2010.
During the period of 1981–2017, the erosive dynamics have only affected the central sector and, to a very small extent, the north sector. The coastline in the north sector of the Rodas system has retreated by more than 14 m since 2010. This may be due to the enlargement of the Rodas dock (in 2010) and the opening of the winter inlet from the lagoon at the north end of the system. The latter is particularly important when many storms occur in the area. Different energetic events occurred in the period considered, with waves higher 8 m, especially in 2013 and 2014 [53], which may have contributed to the more severe erosion in the north sector in relation to the ephemeral inlet [32]. The number of periods with waves above 6 m has increased in recent years. Since 2010, the winter of 2014, mentioned previously, and February 2017 should be highlighted as they had a mean wave direction of 265˚ when there were images of the storm impact in the lagoon and north sector. Both dates coincide with a positive NAO index [54].
Although in the latter periods there was a positive relation between erosion phases and NAO positive values, this was not always exact [55]. In the Galician coast context, the NAO influence is subtle in comparison with other zones, such as the United Kingdom [56].
In the first period considered (1956–1981), erosion was closely linked to the extraction of sand in the system, while in the most recent period, the presence of tourists was one of the most important factors affecting the changes in the Rodas system. The effect of the visitors can be clearly observed in the paths created through the dune vegetation [43]. These are easily recognizable in the most recent orthophotographs and influence the transport of sedimentary material in this area as well as in the dune vegetation and the general dynamics of the system. In recent years, the park created a light fence to prevent the tourists entering these areas. The increase in the number of visitors has led to the construction of more infrastructure or the expansion of existing infrastructure, as in the case of the Rodas dock (Punta Muxieiro). The length of this dock increased by ≈10 m and its width increased from <5 to >15 m. Shoreline retreat in the north sector may be related to the expansion of the Rodas dock carried out in 2010. The work done on this structure influenced the system by varying the availability of sediments in the north sector and the influence of the swell in this zone. Moreover, this sector is the closest to the area where visitors arrive and therefore, is one of the most frequented areas. Clear signs of erosion were also observed in the south sector in this period, following the dynamics observed throughout the historical series analyzed, in which a gradual loss of sand was observed in this area.
The volumetric variation analysis shows that the Rodas system experienced an accretion phase between 2010 and 2015. The elevation and volumetric differences for this period were very low. In the majority of the study zone, these variations did not exceed 0.2 m (the limit of detection). The main differences appeared in the frontal dune and in the north area, close to the current ephemeral inlet location. This is related to the minor importance of storms in this period (except in the winter of 2013–2014 [53]) and the possibility of the system recovering to a similar shape after the winter’s energetic events. This has a special significance in the north sector, which is the most affected by these events. This analysis allowed us to check the frequent variations in the Rodas system. It would be interesting to analyze these in detail to better understand the yearly behavior of the sedimentary system and to allow rapid detection of possible anthropogenic influences.
Other studies have estimated the amount of sand removed from the beach by tourists during their visits [57]. This factor may be of interest in a site such as the Cíes Islands. During the summer months, large numbers of tourists visit the Rodas system and are expected to influence the dynamics of this area. In this context, it is necessary that the authorities elaborate and follow a concrete plan to protect this zone and avoid possible damage linked to tourism or infrastructure expansion.
The improvement in processing techniques and data acquisition has led to great progress in coastal research. It is necessary to continue to analyze the annual dynamics in protected natural areas such as the Cíes Islands to better understand them. Simultaneously, it would be very interesting to monitor Rodas beach with new technologies, such as UAVs, to investigate the events that affect this area with a greater temporal and spatial resolution. More research could increase the knowledge of actual dynamics and improve the management measures. On the other hand, analyzing LiDAR data for other dates could be very interesting for determining the volumetric variations over a large period. Such analyses will allow us to determine the coastal dynamics and understand the system behavior in detail.
6. Conclusions
The following main conclusions can be drawn from this study:
- Aerial orthophotographs are very useful for this type of study because of the high level of detail that they provide, which improves the traditional estimates of changes in the littoral zone.
- New technologies can improve the results by providing better spatial and temporal resolution. In relation to this statement, it could be interesting to analyze Rodas beach with a greater temporal resolution to determine the sedimentary behavior in full detail.
- The coastline clearly retreated between 1956 and 2017. The most important erosive events occurred between 1956 and 1981.
- Since 2010, severe erosion has occurred in the system, especially in the north sector, which is the closest to the dock (enlargement in this period) and the opening of the winter inlet.
- The major storm periods in recent years have been linked to positive values of the NAO index. This relation can be used to better understand the recent dynamics in Rodas.
- The volumetric analysis showed that the north zone, in proximity to the ephemeral inlet, experienced an elevation between 2010 and 2015. This was related to the winter conditions and the possibility of system recovery.
- Anthropogenic activities, such as changes in infrastructure to cope with greater numbers of tourists, or extracting activities, can modify the existing dynamics in this coastal system, with subsequent loss of sediment.
Author Contributions
Conceptualization, A.P.-A., X.L.O.P. and A.G.-P.; methodology, A.G.-P.; formal analysis, A.G.-P.; investigation, A.P.-A. and X.L.O.P.; writing—original draft preparation, A.G.-P.; writing—review and editing, A.P.-A. and X.L.O.P.
Funding
This work is part of a research project entitled Monitorización de los procesos biogeoquímicos en suelos de acantilados y aguas costeras en relación con la influencia de las colonias de aves marinas del Parque Nacional Marítimo Terrestre de las Islas Atlánticas de Galicia, funded by Organismo Autónomo Parques Nacionales (Ref. 041/2010) of Ministerio de Medio Ambiente, Medio Rural y Marino. The work of AGP is supported by an FPU predoctoral contract from the Spanish government (Ministerio de Educación, Cultura y Deporte). Grant Number: FPU16/03050.
Acknowledgments
A.G.-P., A.P.-A. and X.L.O.P. are a part of the CRETUS strategic group (AGRUP2015/02). The authors also thank two anonymous reviewers for their helpful suggestions.
Conflicts of Interest
The authors declare no conflict of interest.
References
- Brown, A.G.; Tooth, S.; Bullard, J.E.; Thomas, D.S.G.; Chiverrell, R.C.; Plater, A.J.; Murton, J.; Thorndycraft, V.R.; Tarolli, P.; Rose, J.; et al. The geomorphology of the Anthropocene: Emergence, status and implications. Earth Surf. Process. Landforms 2017, 42, 71–90. [Google Scholar] [CrossRef]
- Devoy, R.J.N. Coastal Vulnerability and the Implications of Sea-Level Rise for Ireland. J. Coast. Res. 2008, 242, 325–341. [Google Scholar] [CrossRef]
- Keim, B.D.; Muller, R.A.; Stone, G.W. Spatial and temporal variability of coastal storms in the North Atlantic Basin. Mar. Geol. 2004, 210, 7–15. [Google Scholar] [CrossRef]
- Lozano, I.; Devoy, R.J.N.; May, W.; Andersen, U. Storminess and vulnerability along the Atlantic coastlines of Europe: Analysis of storm records and of a greenhouse gases induced climate scenario. Mar. Geol. 2004, 210, 205–225. [Google Scholar] [CrossRef]
- Clarke, M.L.; Rendell, H.M. The impact of North Atlantic storminess on western European coasts: A review. Quat. Int. 2009, 195, 31–41. [Google Scholar] [CrossRef]
- Del Río, J.L.; Malvárez García, G.; Navas, F. Aportes sedimentarios fluviales en el sistema litoral y su importancia para la gestión de costas: el caso de la Ensenada de Marbella. Geo-Temas 2015, 15, 165–168. [Google Scholar]
- Wolf, J.; Woolf, D.K. Waves and climate change in the north-east Atlantic. Geophys. Res. Lett. 2006, 33, 2–5. [Google Scholar] [CrossRef]
- Corbella, S.; Stretch, D.D. Predicting coastal erosion trends using non-stationary statistics and process-based models. Coast. Eng. 2012, 70, 40–49. [Google Scholar] [CrossRef]
- Finkl, C.W. Coastal Classification: Systematic Approaches to Consider in the Development of a Comprehensive Scheme. J. Coast. Res. 2004, 20, 166–213. [Google Scholar] [CrossRef]
- Phillips, M.R.; Jones, A.L. Erosion and tourism infrastructure in the coastal zone: Problems, consequences and management. Tour. Manag. 2006, 27, 517–524. [Google Scholar] [CrossRef]
- Chen, L.C. Detection of shoreline changes for tideland areas using multi-temporal satellite images. Int. J. Remote Sens. 1998, 19, 3383–3397. [Google Scholar] [CrossRef]
- Guariglia, A.; Buonamassa, A.; Losurdo, A.; Saladino, R.; Trivigno, M.L.; Zaccagnino, A.; Colangelo, A. A multisource approach for coastline mapping and identification of shoreline changes. Ann. Geophys. 2006, 49, 295–304. [Google Scholar]
- Jiménez, J.A.; Sanchez-Arcilla, A.; Bou, J.; Ortiz, M.A. Analysing Short-Term Shoreline Changes along the Ebro Delta (Spain) Using Aerial Photographs. J. Coast. Res. 1997, 13, 1256–1266. [Google Scholar]
- Kumar, A.; Jayappa, K.S. Long and Short-Term Shoreline Changes Along Mangalore. Int. J. Environ. Res. 2009, 3, 177–188. [Google Scholar] [CrossRef]
- Pérez-Alberti, A.; Pires, A.; Freitas, L.; Chaminé, H. Shoreline change mapping along the coast of Galicia, Spain. Proc. Inst. Civ. Eng. 2013, 166, 125–144. [Google Scholar] [CrossRef]
- Boak, E.H.; Turner, I.L. Shoreline Definition and Detection: A Review. J. Coast. Res. 2005, 21, 688–703. [Google Scholar] [CrossRef]
- Ponte Lira, C.; Silva, A.N.; Taborda, R.; De Andrade, C.F. Coastline evolution of Portuguese low-lying sandy coast in the last 50 years: An integrated approach. Earth Syst. Sci. Data 2016, 8, 265–278. [Google Scholar] [CrossRef]
- Del Río, L.; Gracia, F.J. Error determination in the photogrammetric assessment of shoreline changes. Nat. Hazards 2013, 65, 2385–2397. [Google Scholar] [CrossRef]
- Dwarakish, G.S.; Vinay, S.A.; Natesan, U.; Asano, T.; Kakinuma, T.; Venkataramana, K.; Pai, B.J.; Babita, M.K. Coastal vulnerability assessment of the future sea level rise in Udupi coastal zone of Karnataka state, west coast of India. Ocean Coast. Manag. 2009, 52, 467–478. [Google Scholar] [CrossRef]
- Denner, K.; Phillips, M.R.; Jenkins, R.E.; Thomas, T. A coastal vulnerability and environmental risk assessment of Loughor Estuary, South Wales. Ocean Coast. Manag. 2015, 116, 478–490. [Google Scholar] [CrossRef]
- Del Río, L.; Plomaritis, T.A.; Benavente, J.; Valladares, M.; Ribera, P. Establishing storm thresholds for the Spanish Gulf of Cádiz coast. Geomorphology 2012, 143–144, 13–23. [Google Scholar] [CrossRef]
- Mancini, F.; Dubbini, M.; Gattelli, M.; Stecchi, F.; Fabbri, S.; Gabbianelli, G. Using unmanned aerial vehicles (UAV) for high-resolution reconstruction of topography: The structure from motion approach on coastal environments. Remote Sens. 2013, 5, 6880–6898. [Google Scholar] [CrossRef]
- Pérez-Alberti, A.; Trenhaile, A.S. An initial evaluation of drone-based monitoring of boulder beaches in Galicia, north-western Spain. Earth Surf. Process. Landforms 2015, 40, 105–111. [Google Scholar] [CrossRef]
- Pérez-Alberti, A.; Trenhaile, A.S. Clast mobility within boulder beaches over two winters in Galicia, northwestern Spain. Geomorphology 2015, 248, 411–426. [Google Scholar] [CrossRef]
- Long, N.; Millescamps, B.; Guillot, B.; Pouget, F.; Bertin, X. Monitoring the topography of a dynamic tidal inlet using UAV imagery. Remote Sens. 2016, 8, 387. [Google Scholar] [CrossRef]
- Roig-Munar, F.X. Quantificació de les perdues de sediment produides pels usuaris de les platges de Menorca (Illes Balears) com a factor erosiu. Boll. Soc. Hist. Nat. Balear. 2006, 49, 115–122. [Google Scholar]
- Thieler, E.R.; Himmelstoss, E.A.; Zichichi, J.L.; Ergul, A. Digital Shoreline Analysis System (DSAS) version 4.0—An ArcGIS Extension for Calculating Shoreline Change; U.S. Geological Survey Open-File Report 2008-1278; U.S. Geological Survey: Reston, VA, USA, 2009. [Google Scholar]
- Wheaton, J.M.; Brasington, J.; Darby, S.E.; Sear, D.A. Accounting for uncertainty in DEMs from repeat topographic surveys: Improved sediment budgets. Earth Surf. Process. Landforms 2010, 35, 136–156. [Google Scholar] [CrossRef]
- Gomez-Pazo, A.; Perez-Alberti, A. Application of GIS in the morphological classification of types of coast: The example of Cíes Islands (Galicia, NW Iberian Peninsula). GOT Geogr. Spat. Plan. J. 2016, 161–185. [Google Scholar]
- Davies, J.L. A morphogenic approach to world shorelines. Z. Geomorphol. 1964, 8, 127–142. [Google Scholar]
- Rosón, G.; Cabanas, J.M.; Pérez, F.F. Hidrografía y dinámica de la Ría de Vigo: un sistema de afloramiento; Instituto de Estudios Vigueses: Pontevedra, Spain, 2008. [Google Scholar]
- Costas, S.; Sobrino, C.M.; Alejo, I.; Pérez-Arlucea, M. Holocene evolution of a rock-bounded barrier-lagoon system, Cíes Islands, northwest Iberia. Earth Surf. Process. Landforms 2009, 34, 1575–1586. [Google Scholar] [CrossRef]
- Costas, S.; Alejo, I.; Vila-Concejo, A.; Nombela, M.A. Persistence of storm-induced morphology on a modal low-energy beach: A case study from NW-Iberian Peninsula. Mar. Geol. 2005, 224, 43–56. [Google Scholar] [CrossRef]
- Costas, S.; Alejo, I.; Rial, F.; Lorenzo, H.; Nombela, M.A. Cyclical Evolution of a Modern Transgressive Sand Barrier in Northwestern Spain Elucidated by GPR and Aerial Photos. J. Sediment. Res. 2006, 76, 1077–1092. [Google Scholar] [CrossRef]
- Costas, S.; Alejo, I. Local and global influences on the evolution of a transgressive sand barrier: Cíes Barrier, Northwest Spain. J. Coast. Res. 2007, 1121–1125. [Google Scholar]
- Costas, S.; Alejo, I.; Nombela, M.A. Sand Barrier Behavior Under Man-Induced Inlet Relocation. J. Coast. Res. 2006, 428–432. [Google Scholar]
- Muñoz Sobrino, C.; García-Moreiras, I.; Martínez-Carreño, N.; Cartelle, V.; Insua, T.L.; Ferreiro Da Costa, J.; Ramil-Rego, P.; Fernández Rodríguez, C.; Alejo, I.; García-Gil, S. Reconstruction of the environmental history of a coastal insular system using shallow marine records: The last three millennia of the Cíes Islands (Ría de Vigo, NW Iberia). Boreas 2016, 45, 729–753. [Google Scholar] [CrossRef]
- Otero Pérez, X.L. Effects of nesting yellow-legged gulls (Larus cachinnans Pallas) on the heavy metal content of soils in the Cíes Islands (Galicia, North-West Spain). Mar. Pollut. Bull. 1998, 36, 267–272. [Google Scholar] [CrossRef]
- Mouriño, J.; Otero Pérez, X.L. Caracterización de la vegetación de los acantilados del Parque Natural de las Islas Cíes y su relación con la colonia de gaviota patiamarilla (Larus cachinnans). Cuad. Soc. Esp. Cien. For. 2002, 14, 135–142. [Google Scholar]
- Otero, X.L.; Tejada, O.; Martín-Pastor, M.; De La Peña, S.; Ferreira, T.O.; Pérez-Alberti, A. Phosphorus in seagull colonies and the effect on the habitats. The case of yellow-legged gulls (Larus michahellis) in the Atlantic Islands National Park (Galicia-NW Spain). Sci. Total Environ. 2015, 532, 383–397. [Google Scholar] [CrossRef]
- Trenhaile, A. Rocky coasts—Their role as depositional environments. Earth-Sci. Rev. 2016, 159, 1–13. [Google Scholar] [CrossRef]
- Costas, S.; Alejo, I.; Alcántara-Carrió, J. Human Influence on the Evolution of Islas Cíes Sand Barrier (NW Spain). In Littoral 2002, The Changing Coast. EUROCOAST/EUCC; Eurocoast: Porto, Portugal, 2002; pp. 283–287. ISBN 972-8558-09-0. [Google Scholar]
- Costas, S.; Alejo, I.; Nombela, M.A. The Role of Sediment Source in Beach Management. A Case Study from Cíes Islands (NW Spain). J. Coast. Res. 2006, 1389–1394. [Google Scholar]
- Paül Carril, V.; Pazos Otón, M. El transporte como producto turístico en galicia: Un análisis de la oferta actual. Rev. Galega Econ. 2009, 18, 1–29. [Google Scholar]
- Moore, L.J. Shoreline Mapping Techniques. J. Coast. Res. 2000, 16, 111–124. [Google Scholar]
- Garcia, T.; Ferreira, Ó.; Matias, A.; Dias, J.A. Overwash vulnerability assessment based on long-term washover evolution. Nat. Hazards 2010, 54, 225–244. [Google Scholar] [CrossRef]
- Martín Prieto, J.A.; Roig Munar, F.X.; Rodríguez Perea, A.; Mir Gual, M.; Pons Buades, G.X.; Gelabert Amengual, B. La erosión histórica de la playa de sa Ràpita (S. Mallorca). Investig. Geográficas 2016, 135–154. [Google Scholar]
- Cooper, J.A.G.; Alonso, I. Natural and anthropic coasts: Challenges for coastal management in Spain. J. Coast. Res. 2006, 1–7. [Google Scholar]
- Pagán, J.I.; Aragonés, L.; Tenza-Abril, A.J.; Pallarés, P. The influence of anthropic actions on the evolution of an urban beach: Case study of Marineta Cassiana beach, Spain. Sci. Total Environ. 2016, 559, 242–255. [Google Scholar] [CrossRef]
- Escudero, M.; Silva, R.; Mendoza, E. Beach Erosion Driven by Natural and Human Activity at Isla del Carmen Barrier Island, Mexico. J. Coast. Res. 2014, 71, 62–74. [Google Scholar] [CrossRef]
- Cappucci, S.; Valentini, E.; Del Monte, M.; Paci, M.; Filipponi, F.; Taramelli, A. Detection of Natural and Anthropic Features on Small Islands. J. Coast. Res. 2017, 77, 73–87. [Google Scholar] [CrossRef]
- Del Río, L.; Gracia, F.J.; Benavente, J. Shoreline change patterns in sandy coasts. A case study in SW Spain. Geomorphology 2013, 196, 252–266. [Google Scholar] [CrossRef]
- Masselink, G.; Castelle, B.; Scott, T.; Dodet, G.; Suanez, S.; Jackson, D.; Floc’h, F. Extreme wave activity during 2013/2014 winter and morphological impacts along the Atlantic coast of Europe. Geophys. Res. Lett. 2016. [Google Scholar] [CrossRef]
- Castelle, B.; Marieu, V.; Bujan, S.; Splinter, K.D.; Robinet, A.; Sénéchal, N.; Ferreira, S. Impact of the winter 2013-2014 series of severe Western Europe storms on a double-barred sandy coast: Beach and dune erosion and megacusp embayments. Geomorphology 2015, 238, 135–148. [Google Scholar] [CrossRef]
- Masselink, G.; Austin, M.; Scott, T.; Poate, T.; Russell, P. Role of Wave Forcing, Storms and Nao in Outer Bar Dynamics. Geomorphology 2014, 226, 76–93. [Google Scholar] [CrossRef]
- Castelle, B.; Dodet, G.; Masselink, G.; Scott, T. A new climate index controlling winter wave activity along the Atlantic coast of Europe: The West Europe Pressure Anomaly. Geophys. Res. Lett. 2017, 44, 1384–1392. [Google Scholar] [CrossRef]
- Roig-Munar, F.X. Microerosión inducida por los usuarios de las playas. El caso de Menorca (Islas Baleares). Investig. Geográficas 2007, 43, 161–167. [Google Scholar] [CrossRef]


© 2019 by the authors. Licensee MDPI, Basel, Switzerland. This article is an open access article distributed under the terms and conditions of the Creative Commons Attribution (CC BY) license (http://creativecommons.org/licenses/by/4.0/).