Article

Severe Weather-Induced Exchange Flows through a Narrow Tidal Channel of Calcasieu Lake Estuary

1
College of Harbor, Coastal and Offshore Engineering, Hohai University, 1 Xikang Road, Nanjing 210024, China
2
Department of Oceanography and Coastal Sciences, School of the Coast and Environment, Louisiana State University, Baton Rouge, LA 70801, USA
3
College of Road, Bridge and Harbor Engineering, Nanjing Communications Institute of Technology, Nanjing 211188, China
*
Author to whom correspondence should be addressed.
J. Mar. Sci. Eng. 2020, 8(2), 113; https://doi.org/10.3390/jmse8020113
Submission received: 17 January 2020 / Revised: 4 February 2020 / Accepted: 8 February 2020 / Published: 13 February 2020
(This article belongs to the Section Physical Oceanography)

Abstract

:
Exchange flows between estuaries and the coastal ocean are important for land-ocean interactions and ecosystem health. This study is aimed at resolving severe weather-induced exchange flows between the Calcasieu Lake Estuary and Gulf of Mexico. For that purpose, we use data from a long-term deployment of side-looking acoustic Doppler current profilers (ADCPs) and conductivity-temperature-depth sensors (CTDs) as well as flow velocity data from a boat operated survey. Regression between the transport measured from a boat mounted ADCP and the velocity data from a fixed side-looking ADCP is done to calculate a long-term transport along the Calcasieu Pass. Analyses have been done for the hydrodynamic response to 16 cold fronts passing the study area. Effects of six strongest cold fronts are discussed in more detail. Results have confirmed that the hydrodynamics is highly correlated with the frequent cold fronts. The highest correlation coefficient is r ~0.75 between the north wind and along channel transport. In general, winds from the southern quadrants push water into the estuary before each frontal passage; after the passage of the front, a rapid change of wind direction to the northern quadrants produces strong outward flows. A quasi-steady state balance between the wind stress and water level difference proposed in recent studies for different systems is further confirmed and discussed in this system. The quasi-steady state balance leads to a relatively high R2 value of greater than 0.8 between the modeled water level gradient and actual observed gradient. We have also applied a regression model, derived from the momentum balance requirement, for the subtidal exchange flow as a function of wind components and their squares which yield an R2 value greater than 0.7. With a confidence in the regression model, we further implement it for twelve years from 26 February 2007 to 10 April 2019. Four extreme events during this 12-year period of time are discussed–they include the Hurricane Ike (2008), Tropical Storm Lee (2011), a warm front, and a cold front. This hindcast of the exchange flows over multiple years can provide a useful tool for coastal management and research for estuarine channels where continuous observations of velocity are not always available.

1. Introduction

The Louisiana coast along the northern Gulf of Mexico contains 40% of the U.S. wetlands [1,2]. About 80% of the coastal erosion and wetland loss of the U.S. occur in this region [2]. Estuarine processes are important to long-term coastal erosion and sediment transport. The estuarine flows include the gravitational [3,4,5,6,7,8,9], tidally-driven [10,11,12,13,14], and wind-driven circulations [15,16,17,18,19]. It is found that the gravitational circulation can be overwhelmed by wind-driven flows [15], and the tidally-induced flows can be overwhelmed by wind-driven flows as well [20]. In the Louisiana estuaries, wind-driven flows are particularly important because of the micro-tidal environment [21].
Previous studies on wind-driven circulations are primarily focused on the effect of hurricane storm surges because of the strong wind of tropical cyclones and the potential hazardous impact. In contrast, the weaker but larger scale atmospheric frontal processes have received relatively less attention until recent years. Atmospheric fronts (mostly cold fronts) are common atmospheric phenomena and are most frequent from October to April [22], particularly in the mid-latitude, including the Gulf of Mexico. Cold fronts pass the northern Gulf of Mexico region 30–40 times each year at 3 to 7 day intervals. These events are important to the subtidal motions in estuaries [23,24,25]. Crout et al. [26] showed that seasonal variations of wind direction and intensity were responsible for coastal circulations, the autumn and winter cold fronts contributed to the westward coastal currents [27].
Dingler et al. [28] found that cold-front-associated storms caused the beach face to retreat about 20 m at the Isles Dernieres between Aug., 1986 and Sept., 1987. Cold fronts can cause saltwater intrusion into estuaries [29,30], increased flushing of bays [18], plumes of freshwater and suspended sediment [31,32], and exchange flows through tidal channels [24,25,33] and multiple inlets [20,21,34].
The above studies on cold front induced estuarine circulations and exchange flows are mostly focused on the southeastern Louisiana, except Lee et al. [24] and Lin et al. [30] in which the study was done for Calcasieu Lake Estuary. The Calcasieu Lake Estuary (Figure 1) is located in the southwestern Louisiana and has a shallow and broad bay but only a narrow channel connecting with the ocean, a quite unique estuary. Lee et al. [24] used a simple model to analyze the coherence and the phase difference between wind and water flow velocity. The work revealed that cold front winds were responsible for the water exchange between the Calcasieu Lake and Gulf of Mexico. Zhang et al. [35] used a numerical model to simulate water surface elevation and velocity due to tide and suggested that the manmade ship channel through the central estuary increased the water transport between the ocean and lake. That study, however, ignored the effect of wind. The study of Lin et al. [30] investigated the effect of winter storms and calculated circulations in the Calcasieu Lake Estuary. Cyclonic and anti-cyclonic eddies were found in the system, in which the wind-driven circulations dominate the saltwater intrusions and exchange flows. These studies have focused mostly on modeling but a further examination for the inner relationships between wind and hydrodynamic responses, such as the variation in water level and flow velocity, particularly the subtidal transport into and out of the estuary, are much needed.
The main objectives of this study are therefore to examine the link between weather systems including mostly cold-fronts and associated wind-induced subtidal volume transport and determine if the latter can be predicted by wind conditions. The specific question is if the subtidal exchange flows of an estuary with a narrow opening to the ocean can be determined by weather factors with a regression model based on observations and/or dynamics. Following a few recent studies in other systems [21,25,34,36,37], a quasi-steady state relationship between wind and water level difference in Calcasieu Lake will be examined. A regression model of Li et al. [21,34] is implemented with twelve years of wind data (from 26 February 2007 to 10 April 2019), followed by a discussion of the four most extreme events in this 12-year period.

2. Study Area and Data

2.1. Study Area

Calcasieu Lake Estuary is located in southwestern Louisiana and receives freshwater mainly from the Calcasieu River (Figure 1). It is very shallow (1~2 m) and surrounded by marshes with only one very narrow and relatively deep dredged ship channel (maximum ~16 m) connecting with the northern Gulf of Mexico. The ship channel is oriented roughly in the north-south direction and goes all the way through the entire estuary effectively dividing it into two triangles: one is the West Cove, which has a dimension of about 6 km (north-south) by 9 km (east-west), and the other triangle has a dimension of about 25 km (south-north) by 10 km (east-west).
The Calcasieu channel runs through the estuary from the port of Lake Charles all the way to the Gulf of Mexico. The channel’s width varies along the north-south direction but is very narrow in general: the widest part is about 870 m in the south, while the narrowest part is only 240 m in the north. Lake Charles is an important industrial city of Louisiana, with many refineries along the river and channel, and has substantial shipping activities. The depth and width of the ship channel have to be constantly maintained with dredging. In recent years, the sedimentation inside the channel has become a more serious issue for safe navigation. Better understanding of the hydrodynamics inside the channel and the Calcasieu Lake Estuary will help sound decision-making. In addition, the area has rich fishery resources, and a better understanding of the impact of recurring severe weather is useful for the fishery management.

2.2. Data and Processing

In this study, we used several different instruments including sensors deployed at fixed locations for several months and that used on a small moving vessel for a 24 h period. More specifically, the instruments included pressure sensors (for water level), CTDs (for water level and salinity), and acoustic Doppler current profilers (ADCP, for velocity profile time series). Data from these sensors were obtained which mainly included three time periods for this study. In the first two periods, several water pressure sensors (Onset HOBO pressure sensors) were deployed on coastal structures. They were used to collect water level data along the edges of the lake. The time period for C2 and C9 stations (Figure 1) ranged from 22 December 2011 to 1 February 2012, and the time period for C5 and C10 stations (Figure 1) covered 29 March 2012 to 24 April 2012. All data were sampled at 15 min intervals. A few small gaps of data were linearly interpolated. In order to examine the subtidal signals, the data were low-pass filtered with a 6th order Butterworth filter and 0.6 cycle per day cutoff frequency (40 h. cutoff in period).
The third period is between 4 December 2013 and 4 February 2014. In this period, data were obtained from two stations with the first station being at a USCG Tower (29.8307° N, 93.3497° W) in the southern part of the Calcasieu channel and northern Calcasieu Pass [38], which is labeled as CLAK3 in Figure 1 and Figure 2, where two horizontal ADCPs were deployed to measure 2-D horizontal current velocity: the along channel current (positive toward the north) and the cross channel current (perpendicular to the axis of the Calcasieu channel, positive toward the east). This is similar to our recent work in Barataria Bay [21] and Vermillion Bay [33] but different from another recent study in Port Fourchon [25] in which a vertical ADCP, rather than a horizontal one, was used. The two ADCPs were deployed roughly at ~1.4 m and ~4.7 m below the surface, respectively. At this station, two YSI conductivity-temperature-depth (CTD) sensors were also deployed, one at subsurface (~1 m) and one at mid-depth (~ 4 m), recording time series of water level and salinity. Three Seabird Electronics (SBE) CTDs with turbidity sensors were deployed at another station at the U.S. Coast Guard (USCG) Maker 47 (29.7633° N, 93.3466° W), which is labeled as CLAK1 in Figure 1 and Figure 2. The SBE CTDs were deployed at ~1.1 m, ~2.5 m, and ~3.7 m below the surface, respectively. These data have some small gaps, which were filled using linear interpolations, after which they were filtered with a 6th order Butterworth filter.
In addition to the deployed instrument and measurements, we also conducted a boat-based survey on 3–4 June 2013. It was based on an 8-m boat equipped with a multi-frequency M9 ADCP (Sontek, San Diego, CA, USA). In our survey the ADCP automatically switched between 1 MHz and 3 MHz frequencies based on the water depth. The velocity profiles were measured every second. The purpose of the boat-based survey was to measure the total transport across the channel and compare with the side-looking ADCP to establish a correlation between the velocity and total transport. The cross channel transport was provided by the software coming with the instrument. The software considered the effect of side-lobe interference from the bottom and the near surface blanking distance.
Alternatively, we could have used a method described in [20] to calculate the transport from the velocity profiles, which would produce essentially the same result. A regression could then be made and extended to the entire time of the velocity data for a longer time series of transport. The boat track is shown in Figure 2a and the times of the transects across the channel are shown in Figure 2b. The start time of the boat-based survey was 2135 UTC, 3 June 2013 and the end time was 2015 UTC, 4 June 2013.
Wind speed and direction at sea-level were obtained from the airport of Sulphur, Louisiana (30.1314° N, 93.3761° W), and the air pressure and air temperature data were from Station LCLL1 of National Data Buoy Center located at (30.2236° N, 93.2217° W). The discharge data from 4 December 2013 to 4 February 2014 were from the USGS 08015500 (30.5026° N, 92.9154° W). The hourly precipitation data were obtained from the Lake Charles station at (30.1247° N, 93.2283° W). All weather data, except the hourly precipitation, were also low-pass filtered with the 40-h Butterworth filter before further analysis. In addition, a time series of 12 years of wind data from 26 February 2007 to 10 April 2019 were selected from the Sulphur airport station for the regression of flow velocity. Within this 12-year data, there is a gap of about 50 days from 20 January 2016 to 10 March 2016. A regression model however does not require that the data having constant time intervals and thus this gap can be ignored.

3. Data Analysis

3.1. Fourier and Harmonic Analysis

Fourier analysis on the time series of water depth and along channel velocity are conducted using the ADCP velocity and CTD depth as mentioned in Section 2 (Figure 3a,b), from which 7 tidal constituents are identifiable in the time series data (O1, K1, M2, S2, N2, S1, P1) (Figure 3a,b). This is consistent with Lin et al. [30] such that the Calcasieu Lake is a region with mixed tide.
The results from harmonic analysis for the water depth and along channel velocity are shown in Figure 3c,d. For water depth time series, the M2, O1, K1, and S1 tidal constituents have the amplitudes of 0.095, 0.086, 0.061 and 0.05 m, respectively; those for N2, S2, Q1 are smaller than 0.03 m. The amplitudes of along channel velocity for the S1, K1 and P1 tidal constituents are 1.18, 0.81 and 0.62 m/s, respectively, while those for M2, O1, M1, S2, N2, are smaller, with 0.3, 0.2, 0.1, 0.08, 0.08 m/s, respectively. Obviously, tidal constituents for tidal elevation are not the same for those of tidal currents, as anticipated. They are however consistent in diurnal dominance.

3.2. Weather Background

Sixteen cold fronts passed through Calcasieu Lake from 4 December 2013 to 4 February 2014 (Table 1). The start and end times were estimated based on weather maps from Weather Prediction Center of NOAA. Because of the variations in weather conditions, the strength of these cold fronts varied. By examining the variation of velocity during each cold front, we define those cold fronts having associated low-pass filtered velocity greater than 0.5 m/s to be strong cold fronts. A total of six strong cold fronts thus defined are then identified. We will discuss the processes of these six events in more detail. Figure 4 shows the weather maps with these six cold fronts. Figure 5a shows the time series of temperature and air pressure and Figure 5b shows the hourly precipitation in millimeters. Figure 6 shows the wind speed. These weather maps show the frontal lines, types of fronts and barometric contours. These figures (Figure 4, Figure 5 and Figure 6) will be discussed below for the six major cold front events (Table 2).
The first front (Figure 4a; line 3 of Table 1). At 21 UTC, Dec. 13, 2013, a low-pressure center was seen along the Texas coast. A warm front was located along the Texas-Louisiana coast. The low-pressure center moved northeastward. The warm front moved with it over the Calcasieu Lake. At 06 UTC, 14 Dec. 2013, the weather maps showed a cyclonic circulation around the low-pressure center with cold and warm fronts. The cold front was just about to cross Calcasieu Lake Estuary from the northwest. In this event, the pressure dropped from 1033 hPa to 1013 hPa quickly, with a variation of −20 hPa (Figure 5; Table 2). Wind was first from the southerly quadrants and then switched to northerly quadrants with a magnitude of 9.5 m/s (Figure 6). The northerly wind lasted for about one day.
The second front (Figure 4b; line 5 of Table 1). This front was actually a couple of cold fronts that passed through within one day on 22 Dec. 2013, about a week after the first front discussed above. The earlier front of this pair was connected to a low air pressure center in Canada. The front passed the study site at round 0000 UTC, Dec. 22. Along this cold front extending from Canada all the way to the Gulf of Mexico, part of the cold front reversed direction of motion, forming a warm front, and a new center of low air pressure can be seen. By 1200 UTC, Dec. 22, this new low-pressure system (an extratropical cyclone) was centered southeast of the Great Lakes and a new trough developed into a cold front with its southern end moving toward the study site. At about 1900 UTC, the front passed the study site. The air pressure at station LCLL1 dropped nearly 20 hPa and then rebounded to 1035 hPa within about two days (Figure 5). The air pressure stayed at 1030 hPa for about two days (Figure 5). Wind changed from northerly to southerly from 21 Dec. 2013, and the northerly wind lasted for about 40 h. After the cold front, the wind became moderate, remained as northerly wind for about six days (Figure 6).
The third cold front (Figure 4c; line 7 of Table 1). The third front started to form on the first weather map of Jan. 1, 2014. It appeared as a long west-east cold-stationary front from Virginia to Kansas and to western Canada at 0000 UTC, Jan. 1. The center part of the front started to burst out toward the south before 1800 UTC. At about 1200 UTC, Jan. 2, 2014, the front passed the study site. The variation of air pressure was about 12 hPa (Figure 5; Table 2).
The fourth cold front (Figure 4d; line 8 of Table 1). After the passage of the third cold front, a high-pressure system occupied a large strip of areas between the Texas-Louisiana and southeastern Canada. The high-pressure system was oriented in the southwest-northeast direction and moved gradually toward the east as the front from the north-northwest developed and started moving into the region. At about 1200 UTC, 5 Jan. 2014, the front was about to move into Louisiana from the northwestern corner of the state. At about 1800 UTC, 5 Jan. 2014, the front passed the study site. The air pressure dropped by about 26 hPa during this process (Figure 5; Table 2). The wind changed from southwesterly to northerly (Figure 6).
The fifth cold front (Figure 4e; line 9 of Table 1). The fifth front can be seen originating from a line of warm front, stationary front, and cold front extending from western edge of Virginia, through Tennessee, Mississippi, Louisiana, Texas, Oklahoma, Colorado, New Mexico, and Utah, at 0300 UTC on 10 Jan. 2014. This complex line subsequently developed into a long warm front and a cold front with a low-pressure centered inside Kansas for the next 12 h. The low air pressure system moved northeast and the rear end of the long cold front swept through the study site in Louisiana at about 1500 UTC, 11 Jan. 2014 (Figure 5).
The sixth cold front (Figure 4f; line 14 of Table 1). The sixth front was from an arctic surge and preceded by a few cold fronts within two days. The arctic cold air appeared at the US-Canada border in the weather map of 0900 UTC, 22 Jan. 2014. By 1500 UTC, the center of the arctic air was identifiable on the weather map in southern Canada with a maximum sea level air pressure of 1045 hPa. The center of the high-pressure system moved into North Dakota at about 0600 UTC, 23 Jan., while the first of a double cold front already reached Louisiana. The cold front reached the study site at 1200 UTC the same day when most of the US continent was occupied by the arctic air. The wind direction was from the southwest before the cold front, northeast afterwards with a magnitude of 11.5 m/s, lasting for a long 45 h (Figure 6).
All of these six cold fronts were associated with systems from high latitudes, except the first one, which was formed locally from Texas coast. The orientations of the fronts were mostly NE-SW and W-E. The fronts moved from NW to SE, or West to East, except for the last one from the arctic surge which moved from north to south. The cold fronts all moved quickly and the passing time through the Calcasieu Lake Estuary were all about 3 h to 6 h, except the last arctic surge, which moved slowly and lasted longer than the other ones.

3.3. Response to Cold Fronts

In the first event, the depth of the YSI CTD (Figure 7a) was 1.73 m before the cold fronts and decreased to 1.35 m when the cold front arrived. The YSI CTDs were installed on stable structures, hence the variation of the sensor depth reflects the variation of water level. The along channel current velocity (Figure 7c) was northward into the Calcasieu Lake Channel with a speed of 0.1 m/s before the frontal passage, while after the front the flow reversed direction and flowed out of the estuary with a speed of 0.65 m/s. The flow was consistent with the variation of water level: when the flow was into the channel, the water level increased; when wind changed its direction, the currents flowed out of the channel, leading to lower water level.
In addition, the low-pass filtered salinity from the YSI CTD (Figure 7b) was higher prior to the cold front, and decreased after the flow direction was changed. This was anticipated as wind pushed the higher salinity ocean water into the estuary prior to the passage of the cold front, the salinity and water level rose with the influx of saline water; wind shifted its direction when cold front passed, and the lower salinity estuarine water flowed out of the channel together with the river water, leading to both lower water-level and lower salinity.
For the second cold front, the low-pass filtered water level increased so that the depth of the YSI CTD (Figure 7a) increased to 1.54 m before the front, followed by a 0.20 m decrease post front, before it rebounded slightly by 0.15 m more than the previous depth. The low-pass filtered flow velocity (Figure 7c) changed from 0.3 m/s (into the estuary) to 0.35 m/s (out of the estuary). The depth variations were consistent with the velocity variations. Comparing the salinity curve (Figure 7b), a corresponding response appeared. The low-pass filtered salinity declined from 19 PSU to 15.5 PSU, consistent with the outflow and falling water level.
For the third cold front, the flow velocity (Figure 7c) changed for about 0.6 m/s, from 0.1 m/s (landward) to −0.5 m/s (seaward). The low-pass filtered depth of the pressure sensor decreased from 1.68 m to 1.35 m (Figure 7a) when the wind shifted its direction (Figure 6).
The forth cold front caused a relatively large water level oscillation (Figure 7a), with a pressure sensor depth of 1.75 m before the front, and 1.25 m after (Figure 7a). It was a stronger event and had a water difference of 0.5 m. Low-pass filtered current velocity also showed relatively large fluctuations, from 0.20 m/s to −0.70 m/s (Figure 7c). The salinity decreased similarly from 17.5 PSU to 12.5 PSU (Figure 7b).
The fifth cold front system passed the study area quickly (Table 1). The wind direction shifted from southeast to northwest, but the intensity was weaker than the previous cold front events (Figure 6). The air pressure did not have a significant difference. But the flow velocity in the channel had a relatively large shift, which was from 0.15 m/s to −0.5 m/s (Figure 7c). The depth changed for about 0.2 m (Figure 7a).
For the last event, the water level was affected by a previous frontal passage and the prefrontal sensor depth was 1.23 m (Figure 7a), which was the lowest during the entire time period. The depth of the sensor rebounded to about 1.8 m afterwards, making a 0.57 m water level difference. The salinity showed a variation of 3.5 PSU, which declined from 16.5 PSU to 13 PSU (Figure 7b). The current velocity changed from 0.25 m/s to −0.52 m/s in this event (Figure 7c).
Generally speaking, for each cold front, wind direction changed from the southerly to northerly quadrants. In each cycle, the pre-frontal southerly wind led to net inflow (Figure 7c), water level set up (Figure 7a), salinity increase (Figure 7b); and the northerly winds caused outflow much stronger than the inflow (Figure 7c), water level set down (Figure 7a), and salinity decrease (Figure 7b). While these results are qualitatively known in other systems, the following will provide more quantitative analysis, particularly pertinent to this specific system.

3.4. Transport Response to Cold Fronts

Transport Regression

A boat-based survey with an ADCP can measure the cross-sectional current structure. By a sectional integration of the along channel velocity across a section, the total transport of water can be obtained. The total transport can then be related to the velocity from the side looking ADCP to establish a regression. This is the rationale of running the boat across the channel at different tidal phases (Figure 2). The regression coefficients can then be applied to the entire time period of the data from the side-looking ADCP to obtain a longer time series of the total transport. The transport can then be used to study the impact of the weather, particularly, in our case, the cold front events. This method has been used in a channel of the Port Fourchon in Louisiana successfully with an R2 value of 0.96–0.99 [25].
Using this method, we obtained the linear regression between the transport (y) from the boat based ADCP and the velocity (x) from the side-looking ADCP (Figure 8a) using y = α x + β , in which α = 4065 , β = 452 . The R2 value is high (0.82). The regression coefficients were then used in transport calculation from 4 Dec. 2013 to 4 Feb. 2014 using the velocity data from the side-looking ADCP. The regression calculated transport is low-pass filtered and shown in Figure 8b for the quantification of transport due to weather events. Apparently, the transport affected by the weather events can induce a significant transport of more than 2000 m3/s.
Alternatively, if there were no boat-based survey for the actual measurements of total transport, the transport can still be estimated from the data from side-looking ADCP. The volume is estimated according to;
V = Au
in which V , A , u are volume transport, cross-sectional area, and along channel velocity component, respectively. The average depth of the channel is ~10 m, and the width is ~300 m, with the cross-sectional area being ~3000 m2. The resultant transport calculated this way using the side-looking ADCP data was almost identical to that from the regression between the data from the boat measured transport and velocity from the side-looking ADCP. The following discussion uses the regression results.
It turns out that the largest outward transport occurred on 5 Jan. 2014, exceeding 2700 m3/s (Figure 8b,c). The strong outflow was forced by the 4th cold front discussed above, which accompanied with relatively strong northerly winds, and the wind speed reached about ~9.2 m/s. During the whole study periods, even the minimum transport reached ~1000 m3/s. In this event, the north-west wind lasted only for a few hours. The mean water transport of all events is 1700 m3/s and the water transport shifted from positive (inflow) to negative (outflow) in all events except the fifth event which was negative for that period. In the fifth event, northerly winds persisted for about five days and there was almost no southerly wind before the cold front, which is unique among all events. This is consistent with the continuous outflow during the fifth event. The precipitation data show that during the study period, rainfall was quite limited with a maximum of ~8 mm in an hour lasting for a few hours, mostly prior to the frontal passages (Figure 5b). Calcasieu Lake Estuary is roughly a triangle with a base length of ~19 km and a height of ~24 km. The volume of rainfall into the system under a maximum event scenario of 8 mm lasting for 3 h would be ~a = 5.5 × 10⁵ m3. For a low-pass filtered outward transport of even 500 m3/s for an event of 24 h, the total volume would be b = 4.3 × 10⁷ m3. The ratio a/b is about 1%. Note also that we are using the low-pass filtered transport while using the peak values of the precipitation. If the precipitation were also low-pass filtered, the ratio would have been smaller. A cold front event usually lasts more than 24 h, and the ratio would be even smaller. In addition, the precipitation can occur either outside or inside of the estuary. When the precipitation occurs inside of the estuary, there might be more outward flow, albeit a small addition; while when the precipitation occurs outside of the estuary, there might tend to be more inward flow. Statistically, one would assume that there may be equal chances for positive and negative values and therefore the opposing effects could essentially cancel each other, although neither effects are significant in any case. Therefore, with all these arguments, it is safe to conclude that there is no significant contribution of the rainfall to the water level change before or after the front.

3.5. Correlation Analysis

In order to evaluate the effect of atmospheric parameters, correlation coefficients and p values (Table 3) among eight pairs of parameters are calculated, which are (1) north wind vs. near-surface velocity; (2) east wind vs. near-surface velocity; (3) north wind vs. lower velocity; (4) east wind vs. lower velocity; (5) north wind vs. sensor depth (water level); (6) east wind vs. sensor depth; (7) air pressure vs. sensor depth; (8) air pressure vs. near-surface velocity. To account for the delayed effect of air pressure, two more pairs of parameters are used: (1) time-shifted pressure vs. sensor depth; (2) time-shifted air pressure vs. near-surface velocity. The results show that the correlation coefficient between air pressure and water level is only 0.12 (Table 3), but by shifting 31 h, the correlation coefficient of the air pressure and water depth increased to 0.68. Similarly, the near-surface velocity is not obviously correlated with the air pressure and the correlation coefficient between them is almost zero (−0.01), while it increased to 0.37 with a 17 h time shift.
The results further confirm that the water level and near-surface velocity responded to the front and the air pressure with different delays in time. The delay has a dynamic basis: when a front passes the area, the wind usually picks up speed, and the water level and transport would increase with time or respond to the wind speed with a lag in time. This is consistent with Li et al. [21] that there are lags in the exchange flows through multiple inlets of Barataria Bay driven by 51 cold fronts. The correlation coefficient between the north wind and water level is 0.35. Water level is inversely correlated with the easterly wind with a correlation coefficient of −0.50. The north wind and the flow velocity is positively correlated with the data from the upper ADCP with a coefficient of 0.75 and that from the lower ADCP with a coefficient of 0.44. At the same time, the east wind and flow velocity is moderately and negatively correlated with a correlation coefficient of −0.45 for the upper ADCP data and −0.55 for the lower ADCP data. The calculated p values are essentially all zeros. In short, the subtidal exchange processes are correlated with the atmospheric parameters.

4. Conceptual Model

Following some recent studies [21,25,34,36], the relationship between local wind and the water level differences is examined for the Calcasieu Lake Estuary. We start from the 2-D shallow water momentum equations:
u t + u u x + v u y f ν = g ζ x + τ ax ρ ( h + ζ ) τ bx ρ ( h + ζ )
ν t + u ν x + ν ν y + fu = g ζ y + τ ay ρ ( h + ζ ) τ by ρ ( h + ζ )
in which, u, v, f, ζ , g , ρ , h, τ ax , τ ay , τ bx ,   τ by are the east velocity (in the x direction), north velocity (in the y direction), Coriolis parameter, water level, gravitational acceleration, water density, water depth, wind stress in x direction, wind stress in y direction, bottom stress in x direction, and bottom stress in y direction, respectively.
Under a steady state condition and if we only consider the local wind effect so that the Coriolis force term can be neglected, the local acceleration and advection terms would also vanish, a simple balance between the surface elevation gradient induced pressure gradient force and the wind stress would hold. Equations (2) and (3) reduce to:
0 = g ζ x + τ ax ρ h
0 = g ζ y   + τ ay ρ h
If we take the water density ρ to have a value of 1020 kg/m3, the gravitational acceleration g = 9.81 m/s2, mean water depth h = 1.2 m, the distance in east-west direction between the two pressure sensor locations C9 and C2 to be 7.8 km (Figure 1), and the distance in the north-south direction between the two pressure sensor locations C10 and C5 to be 16 km (Figure 1), we can calculate the water level difference between shores and compare with observations. Wind stress is calculated using:
τ a = ρ a C d W 2
where ρ a is air density, which is 1.29 kg/m3, C d is drag coefficient and which is 1.24 × 10⁻³ [18], W is wind velocity.
The east-west water level differences from 22 Dec. 2011 to 1 Feb. 2012 and the south-north water level differences from 29 Mar. 2012 to 24 May. 2012 were thus calculated based on the wind data. Following Huang and Li [36], the calculated water level differences using (4) and (5) are compared with observations in the north-south, and east-west directions, respectively (Figure 9a,b). The observations (solid line) and the quasi-steady state results (dashed line) are quite consistent with a R2 of 0.85 in the north-south direction, but much lower for the east-west direction (0.36). The correlation coefficient between observations and quasi-steady state in the north-south direction (0.94) is greater than that in the east-west direction (0.62), which was similar to the result of Huang and Li [36,39].

5. Regression Model and Case Studies

5.1. Regression Model

In Li et al. [21,34], a Taylor series expansion is used on a hypothetical solution to derive a relationship between the flow velocity, wind velocity components, and air pressure anomaly. The following equation is obtained:
u ( t ) = AW n ( t ) + BW n 2 ( t ) + CW e ( t ) + DW e 2 ( t ) + E ( p a Ep a 0 ) + F
in which u(t), Wn(t), We(t), p a and p a 0 are, respectively, the time series of subtidal flow component (positive toward north), the along-channel wind velocity component, the cross-channel wind velocity component, the air pressure, and the averaged air pressure; t is time; and A, B, C, D, E, and F are coefficients from the Taylor series expansion. These coefficients can be obtained by a regression analysis using observed flow velocity and wind data described in Section 2. The flow velocity data from 4 Dec. 2013 to 22 Jan. 2014 was split into two phases, one was from 4 Dec. 2013 to 4 Jan. 2014, the other was from 4 Jan. 2014 to 22 Jan. 2014. The first for calculation of the coefficients and the second for verifications. The same 6th Butterworth low-pass filter with a 0.6 CPD cut-off frequency or 40-hR cutoff period is employed to all variables. Although the air pressure term is smaller compared to the wind velocity terms, it is still included. The R2 value between regression flow and observation flow is about 0.7.
The results show that the model is valid and the local wind (especially the north component) has a strong influence on the along-channel flow velocity. The first coefficient A is positive indicating that the northward wind (southerly) produced the inward flow; the C value is negative which means that the east wind contributes to the inward flow, apparently a remote wind effect through the Ekman transport by a water level setup under easterly wind and a water level decrease under westerly wind; the B and D are much smaller, the values are −0.0018 and 0.0030, respectively.
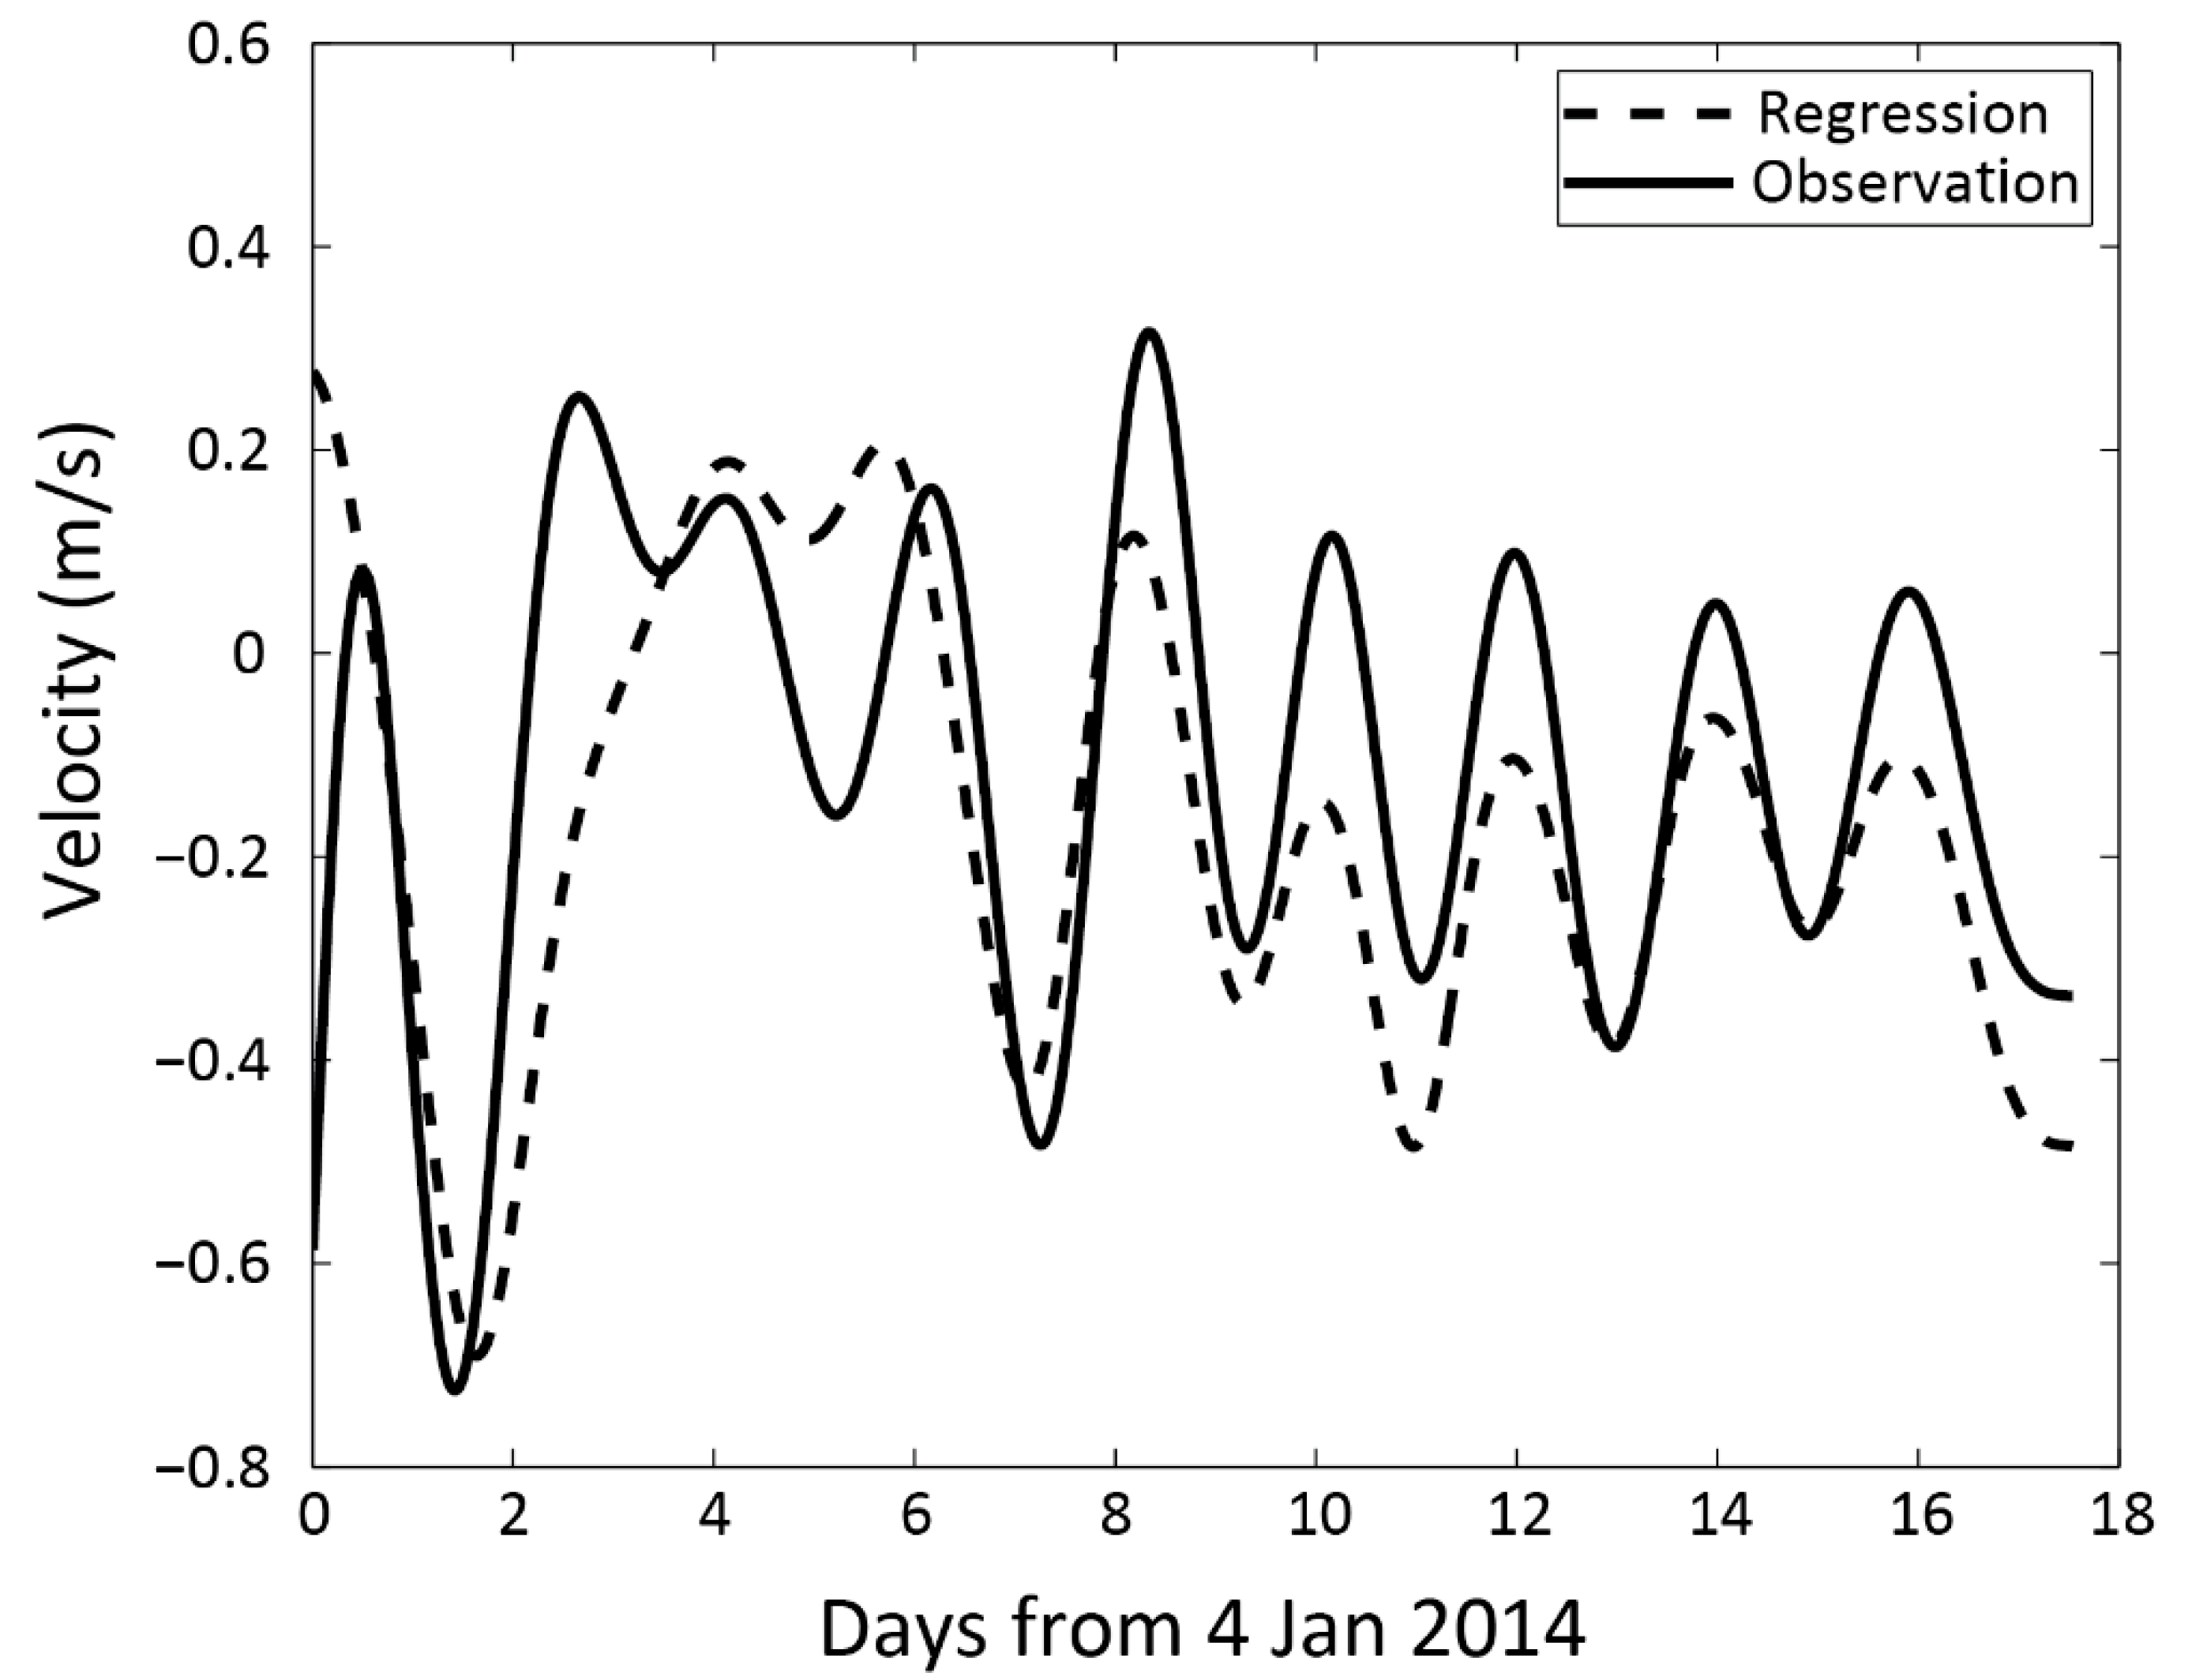
This regression model (Figure 10) shows a strong similarity between the calculated and observed velocities from 1730 UTC, 4 Jan. 2014 to 0700 UTC, 22 Jan. 2014, consistent with the high R2 value, although there are also some differences. The regression model is apparently a good predictor for weather-induced subtidal transport through the channel. Usually, continuous observations of velocity are not available in many estuarine channels. With a regression like this, a statistical hindcast or statistical prediction can be made if the wind data are provided, which are nowadays easily accessible for most coastal regions except remote areas.

5.2. A 12-Year Regression and Case Studies

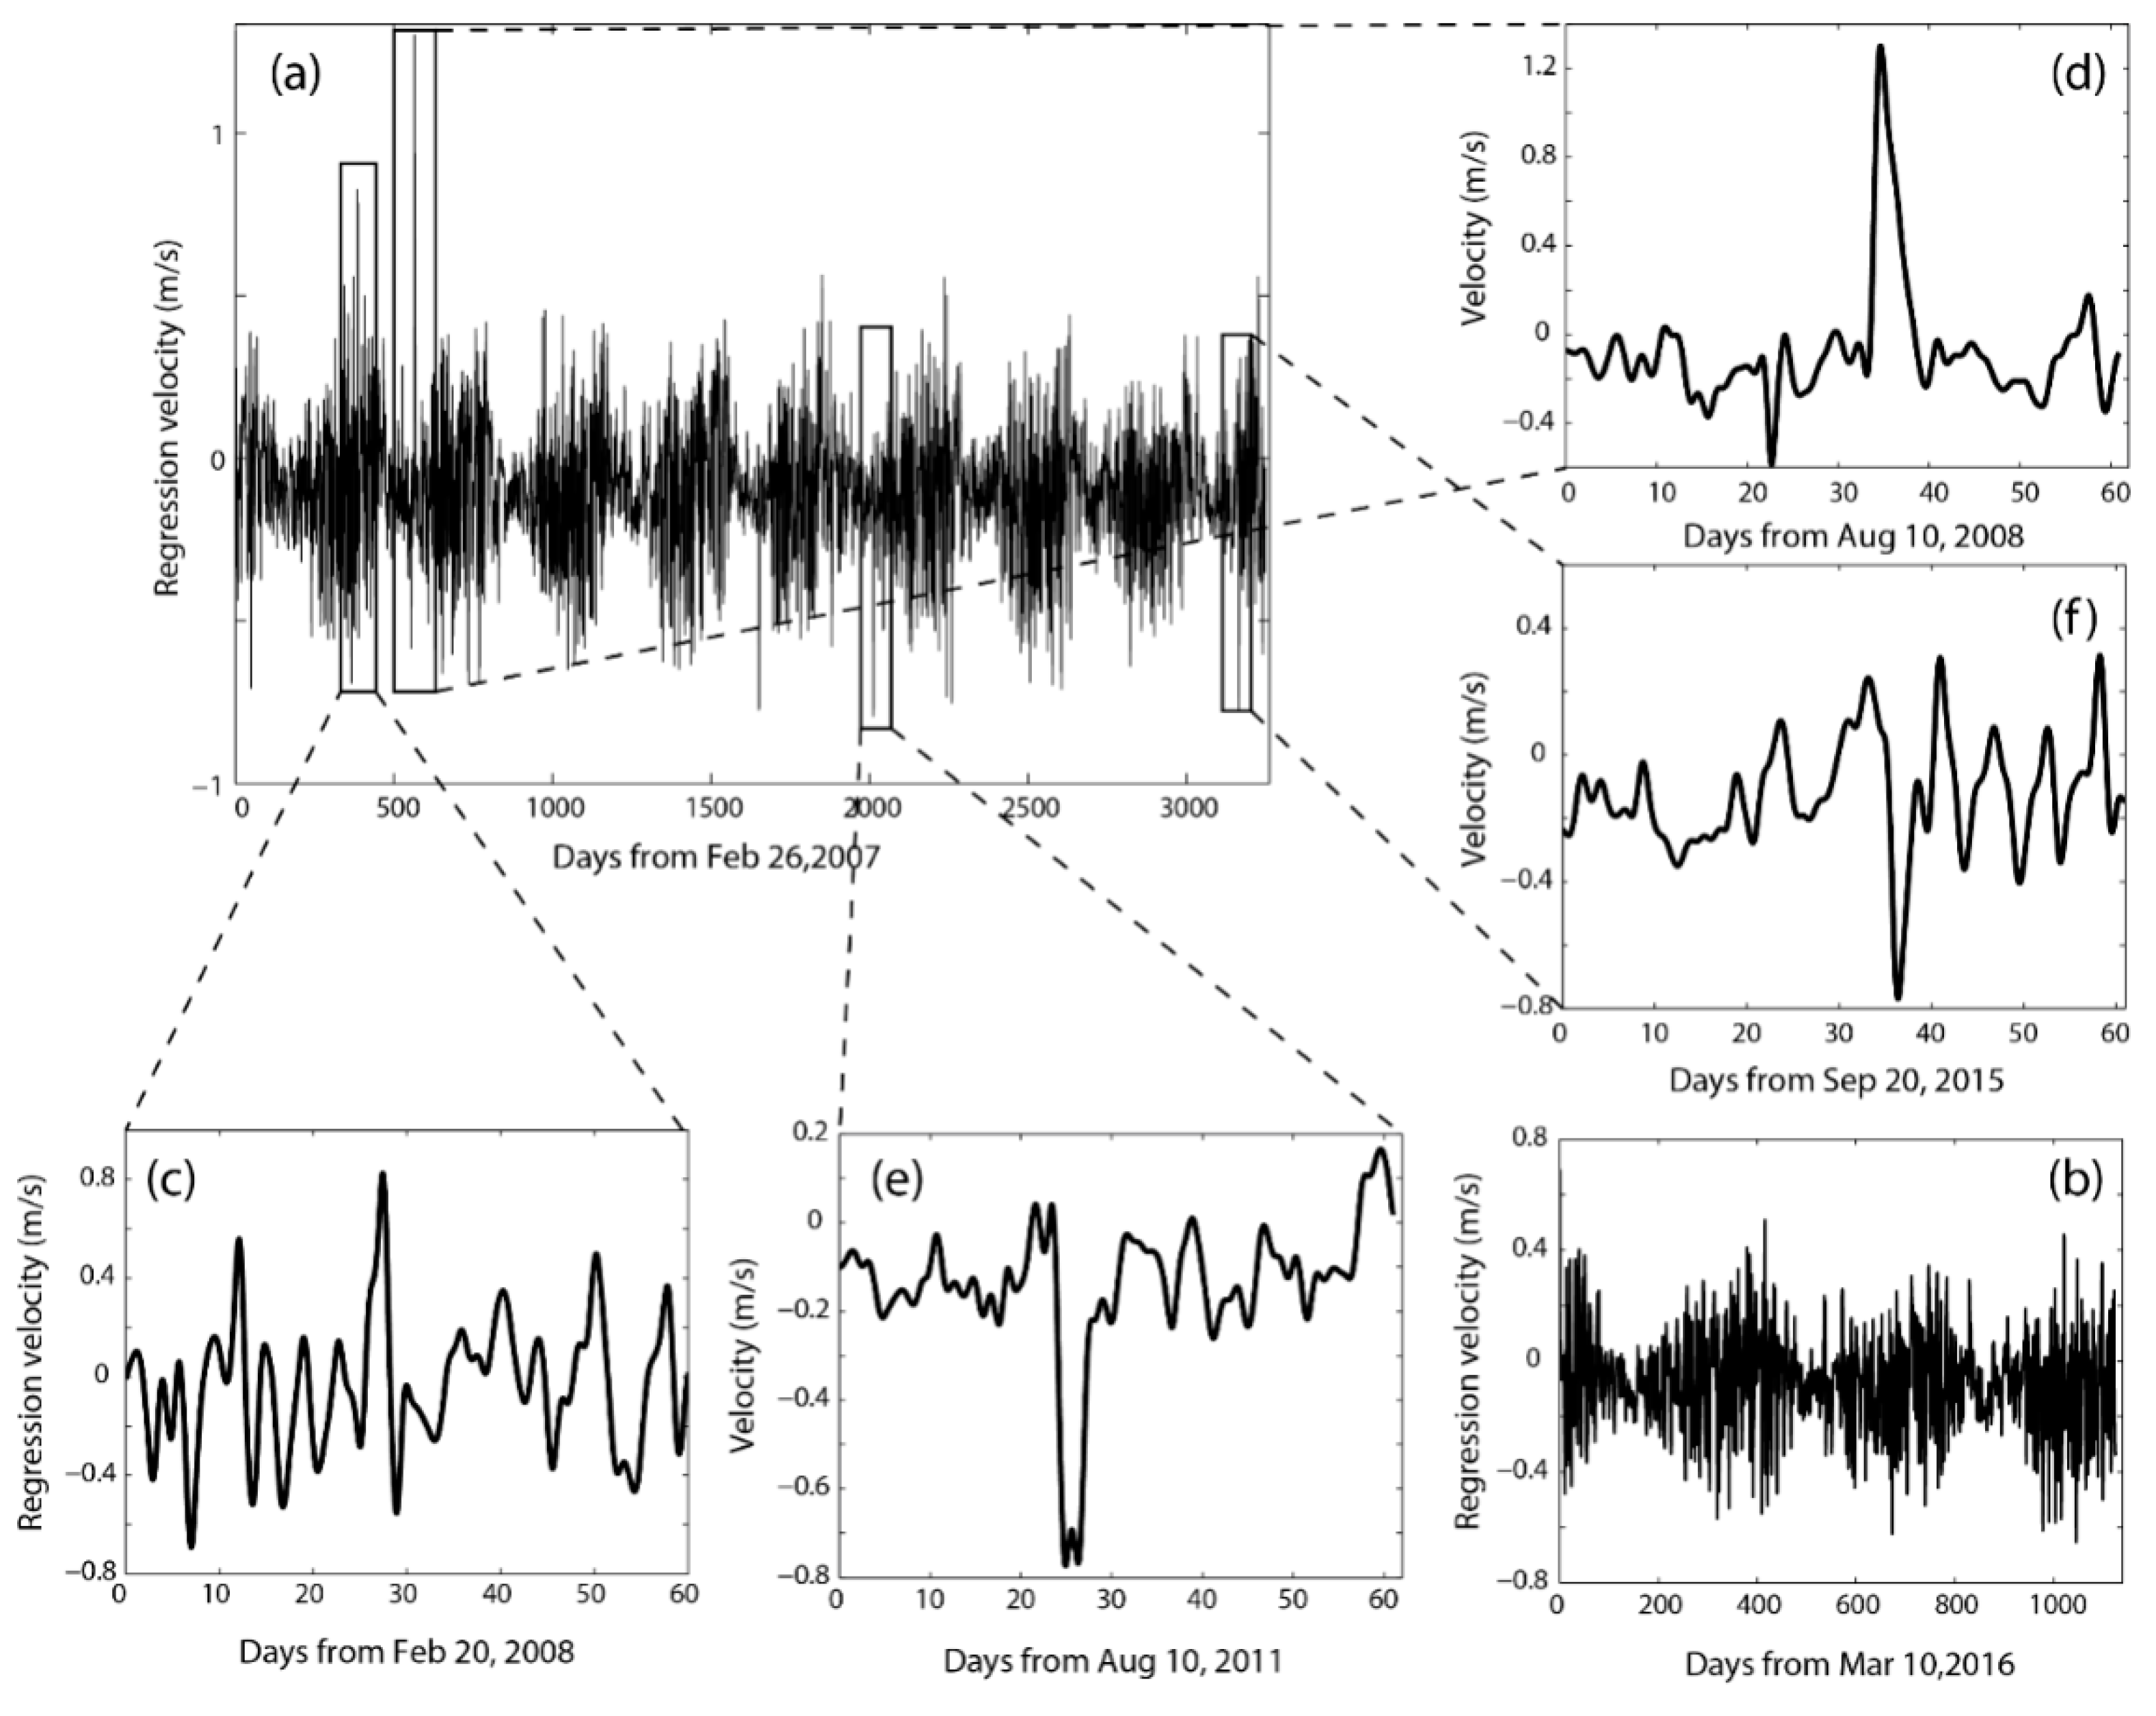
Now, we consider the regression model verified and apply it to the twelve years (from 26 Feb. 2007 to 10 Apr. 2019) of wind data to calculate the subtidal flow velocity. Since the wind data have a fifty-day gap (from 20 Jan. 2016 to 10 Mar. 2016), the time series of the velocity resulted from the regression model are shown separately with two segments. Figure 11a shows the velocity distribution from 26 Feb. 2007 to 20 Jan. 2016 and Figure 11b from 10 Mar. 2016 to 10 Apr. 2019. The flow velocity distribution is calculated by summing the number of occurrences when the flow velocity is within given range in the 12 years. By analyzing the flow velocity distribution over the total regression time, 28% of the flow is inflow, 72% outflow, indicating that outflow dominates. The time for outflow is three times longer than that for inflow. Among inflow, 2% is more than 0.4m/s, and 6% is less than −0.4 m/s among outflow. The number of events with the flow velocity amplitude being more than 0.4 m/s is calculated, the total inflow events (velocity more than 0.4 m/s) are 23 while the outflow events (velocity less than −0.4 m/s) are 212, which is far more than those of the inflow events.
To further quantify the relatively strong flow events (with a low-pass filtered velocity being greater than 0.4 m/s), the intensity of flow velocity is classified into four categories (Table 4). The thresholds are, 0.4 (−0.4), 0.5 (−0.5), 0.6 (−0.6) and 0.7 (−0.7) m/s. The number of events with velocity between 0.4 m/s and 0.5 m/s amounts to 56% of the total inflow events, while the fraction of inflow events between 0.5 m/s and 0.6 m/s is about 35% of the total inflow events (Figure 12a). There was no event for the velocity between 0.6 and 07 m/s. The number of events with velocity events between −0.5 m/s and −0.4 m/s amounts to 58% of the total outflow events, while the fraction of outflow velocity between −0.6 m/s and −0.5 m/s is about 30% of the total outflow events (Figure 12b). The moderate inflow velocity between 0.4 m/s and 0.6 m/s takes up about 91% of all inflow times and the outflow velocity between −0.6 m/s and −0.4 m/s is 88% of all outflow times. There are seldom events with the velocity more than 0.7 m/s or less than −0.7 m/s, however, the largest inflow velocity is about 1.3 m/s and the strongest velocity of outflow is about −0.8 m/s. These correspond to large water level oscillations.
We have identified four most extreme events to discuss (Figure 11c–f), including Hurricane Ike when the inflow velocity reached 1.3 m/s on 13 Sep. 2008. Hurricane Ike caused at least 195 deaths and a total of $38 billion in damage. The other three extreme events include the Tropical Strom Lee (2011), a strong warm front, and a strong cold front.
The first event (Figure 13a) was a warm front. At 0900 UTC, Mar. 16, 2008, there were two separated low-pressure centers, one being centered along Arizona, Utah, and Colorado, and another along North Carolina and Virginia. The western pressure centers moved to the southeast and the eastern pressure center moved to northeast, they merged to one trough at 1500 UTC, 16 Mar. The trough moved to the northeast, separated at 0600 UTC, 17 Mar., merged, and passed the Calcasieu Lake at 1200 UTC, 17 Mar., after which it continued moving to the northeast. The maximum inflow subtidal velocity reached 0.83 m/s at 1000 UTC, 18 Mar., after 22 h later. The inflow began at 1300 UTC, 16 Mar. 2008, and lasted for about 30 h. It took about five days for the velocity to recover to its previous conditions.
The second event (Figure 13b) was the powerful and catastrophic Hurricane Ike. On 29 Aug., 2008, a low-pressure area was developed along the west coast of Africa. It became a tropical depression at 0600 UTC, 1 Sep. 2008. The depression strengthened to a tropical storm quickly and moved west-northwestward. At 1800 UTC, 3 Sep, the tropical storm developed to a hurricane, the peak maximum wind speed reached 64 m/s at 0600 UTC, 4 Sep., which was a Category 4 hurricane. On 13 Sep. 2008, it made its landfall at Galveston, Texas, west of the study area. The strong southerly wind pushed the water landward. The maximum inflow velocity was about 1.3 m/s at 1300 UTC, 13 Sep., according to the regression model. The inflow began at 1500 UTC, 12 Sep., ended at 0200 UTC, 17 Sep., and lasted for about 5 d. The flow magnitude of the velocity dropped to -0.2 m/s at 1500 UTC, 18 Sep. Two days later, the flow velocity went back to its normal variations.
The third event (Figure 13c) was a combination of the Tropical Storm Lee and a cold front. A line of tropical wave oriented from southwest to northeast was seen at 1200 UTC, 31 Aug. 2011, in the northern Gulf of Mexico. The tropical wave moved northwestward, forming a low-pressure line at 1800 UTC, 1 Sep. 2011, which evolved into a tropical depression (Tropical Depression Thirteen) at 0300 UTC, 2 Sep. The Tropical Depression moved to northeast and developed into Tropical Storm Lee at 1800 UTC, 2 Sep. The center of storm moved northwestward. The moving speed was slow and finally made its landfall at southern Vermillion Bay, east of the study area, on the morning of 4 Sep. 2011. The maximum wind speed was about 20 m/s. As the storm center continued moving northeastward, a cold front originated from Quebec, Canada pushed toward the study area and passed the Calcasieu Lake at 0300 UTC, 5 Sep. The regression model reproduced the outflow velocity in responding to the tropical storm and subsequent cold front with a low-pass filtered flow velocity of −0.76 m/s at 0100 UTC, 4 Sep. and 0400 UTC, 5 Sep., respectively. The interval of the two events (the T.S. Lee’s landfall and the arrival of the cold front) was about one day. The outflow began at 1600 UTC, 2 Sep. and lasted for about 4 d.
The fourth event (Figure 13d) was a cold front originated from Quebec, Canada. Several low-pressure centers can be seen along Quebec, Pennsylvania, and Colorado on the weather map of 2100 UTC, 22 Oct. 2015. Pushed by a high-pressure center, the tail of this cold front was separated and left behind of the original extratropical cyclone. This shorter cold front moved to northwestern Gulf of Mexico with its own low-pressure center developed at 0300 UTC, 25 Oct. and continued to move to the east. The low-pressure center along Corpus Christi and Galveston, Texas moved northeastward along Texas and Louisiana coast and became more complicated in structure, which was connected with a cold front, a warm front, and a stationary front, and rotated when moving. The low-pressure center passed the study area at 0600 UTC, 26 Oct., continued to move. The outflow began at 0430 UTC, 25 Oct., reaching a minimum of −0.76 m/s at 0730 UTC, 26 Oct. and lasted for about 5 days before it reversed its direction. Prior to this event, the maximum subtidal flow velocity was 0.24 m/s, the velocity variation of this event reached about 1 m/s.
For each event, the regression model captures the starting time and ending time of the processes, time of flow direction change, and the maximum inflow or outflow velocity. The model provides a first order approximation of the severe weather induced flow velocity. This regression model was first proposed for exchange flows through multiple inlets of the Barataria Bay in Louisiana [21] and an arctic lagoon for similar synoptic scale weather induced flows for several months over a few years, verified by satellite images and numerical model simulations. Apparently, it also works in the Calcasieu Lake Estuary.

6. Discussion

As in previous studies for Lake Pontchartrain [36], Baratraia Bay [21], and the arctic Elson Lagoon [34], a wind-induced quasi-steady-state is verified in the Calcasieu Lake Estuary. From the results discussed in Section 4, the quasi-steady state balance also applies this estuarine system, which has only one channel connecting with the coastal ocean, in contrast to the other multiple inlet systems. The quasi-steady state balance in the north-south direction is found to be more accurate than that in the east-west direction; possibly because of the effect of remote wind or the Ekman transport reducing the R2 in the east-west direction.
In estuaries and bays, measurements of flow velocity are commonly obtained from ADCPs at fixed stations. Often times, due to constraints of funding and logistics, the measurements of flow velocity in water may be limited in time. On the other hand, wind data are much easier to obtain compared to the flow velocity data from ADCPs. Wind data are widely available from local observation stations or reanalysis products from NOAA. Because of these, using limited ADCP flow velocity data to obtain a regression with wind data is desirable. With the regression model, simple forecast or hindcast can be readily done. In this study, following recent work of Li et al. [21,34], we implement such a regression model using wind data to calculate flow velocity. The regression model is based on the one-month data (from 4 Dec. 2013 to 4 Jan. 2014) for flow velocity from ADCP data and wind data. The R2 value is up to 0.7 between observed and measured velocities. The regression coefficients and model are then applied to a 12-year record of wind (from 26 Feb. 2007 to 10 Apr. 2019) from the airport of Sulphur, to calculate the low-pass filtered subtidal flow velocity at the Calcasieu Pass.
The 12-year regression analysis allows us to estimate the weather induced oscillations of flows through Calcasieu Pass. The greatest low-pass filtered flow velocity in these 12 years is ~1.3 m/s. The number of major events (flow velocity exceeding 0.4 m/s) are counted to be 235 during the 12-year time period, averaging about 1.6 times a month. The top four events (with the flow velocity exceeding 0.8 m/s) are discussed in detail, which include the Hurricane Ike (2008), Tropical Storm Lee (2011), a cold front, and a warm front. The Hurricane Ike produces a large flow velocity about 1.3 m/s and the other three about 0.8 m/s. The third event is quite unique, with two minimum flow values in two days, due to two very close weather systems happening together: Tropical Storm Lee made its landfall on the morning of 4 Sep. 2011, followed immediately by a cold front arriving on the next morning on 5 Sep. 2011.

7. Conclusions

Aimed at a further understanding of wind-driven exchange flows through the narrow tidal channel of Calcasieu Lake Estuary, some hydrodynamic data (ADCPs & CTDs) from Calcasieu Lake Estuary and meteorological data from a nearby station were analyzed. Sixteen cold fronts occurred between 4 Dec. 2013 and 4 Feb. 2014, among which six of the strongest (with the low-pass filtered flow velocity exceeding 0.5 m/s) were selected for a more detailed examination. Prior to the cold fronts, winds are from the southern quadrants, inducing currents flowing into the Calcasieu Lake Estuary through the Calcasieu Pass, making water level higher inside the estuary. After the passage of the cold front, the abrupt change of wind direction pushes water out of the estuary. As a result, the water level reaches its minimum and the outward transport of estuarine water reaches its maximum as the northerly winds continue after the cold front. This confirms the findings from previous studies [18]. Although there are general characteristics of the water level, some variation also exists, depending on the orientation of the front line and the moving direction of the cold front system [22]. Cold fronts induced transport is calculated from the along channel velocity, and the outward transport has a maximum of 2300 m3/s, a minimum of about 1000 m3/s, and an average of about 1500 m3/s, which is considerable in such a narrow channel. A correlation is established between atmospheric and hydrodynamic parameters. The correlation coefficient is 0.7 between north wind and along channel velocity, and the coefficient between delayed air pressure and water level is 0.68, which further confirms that cold fronts are the dominant reasons for low-pass filtered water exchange between the estuary and coastal ocean in this region.
Based on this study, we conclude that, (1) cold fronts determine the major subtidal outward transport events in the Calcasieu Lake Estuary with a narrow channel during Fall-Spring seasons; other factors such as the rainfall are negligible; (2) A quasi-steady state balance is confirmed in this system, adding another member to the coastal bays and estuaries that have this property; (3) A regression model is shown to be reliable prediction tool for the weather induced transport based on wind data only. The regression model allows us to hindcast the hydrodynamic responses to a past weather event. The extreme weather events discussed here demonstrate the value of the regression model. This method can be widely applied in similar estuaries to provide flow velocity for the purpose of management and research. It appears to be an attractive alternative method of a full scale numerical simulation to obtain the wind-driven exchange flow velocity in similar systems.

Author Contributions

Conceptualization, C.L.; methodology, C.L. and J.W.; software, J.W. and W.H.; validation, J.W. and W.H.; formal analysis, J.W.; investigation, J.W.; resources, C.L.; data curation, J.W.; writing—original draft preparation, J.W. and C.L.; writing—review and editing, C.L. and J.W.; visualization, J.W.; supervision, C.L. and F.X.; project administration, C.L.; funding acquisition, C.L. and F.X. All authors have read and agreed to the published version of the manuscript.

Funding

This research was funded by the Louisiana Department of Wildlife and Fisheries. The first author was partially supported by Jiangsu Overseas Visiting Scholar Program for University Prominent Early & Middle Career Teachers.

Acknowledgments

Data for this study are from the Estuarine Coastal Ocean Dynamics Lab at LSU. This project was supported by the Louisiana Department of Wildlife and Fisheries. The first author was partially supported by Jiangsu Overseas Visiting Scholar Program for University Prominent Early & Middle Career Teachers. This work was completed during J.W.’s visiting of LSU from September 2018 to October 2019, as part of J.W.’s PhD dissertation under the supervision of F.X. and C.L. We thank anonymous reviewers who helped the improvement of the manuscript.

Conflicts of Interest

The authors declare no conflict of interest. The funders had no role in the design of the study; in the collection, analyses, or interpretation of data; in the writing of the manuscript, or in the decision to publish the results.

References

  1. Stone, G.W.; Grymes, J.M.; Dingler, J.R.; Pepper, D.A. Overview and Significance of Hurricanes on the Louisiana Coast, U.S.A. J. Coast. Res. 1997, 13, 656–669. [Google Scholar]
  2. Penland, S.; Roberts, H.H.; Williams, S.J.; Sallenger, A.H., Jr.; Cahoon, D.R.; Davis, D.W.; Groat, C.G. Coastal land loss in Louisiana. Gulf Coast Assoc. Geol. Soc. 1990, 40, 685–699. [Google Scholar]
  3. Pritchard, D.W. Salinity distribution and circulation in The Chesapeake Bay Estuarine system. J. Mar. Res. 1952, 11, 106–123. [Google Scholar]
  4. Pritchard, D.W. A study of the salt balance in a coastal plain estuary. J. Mar. Res. 1954, 13, 133–144. [Google Scholar]
  5. Pritchard, D.W. The dynamic structure of a coastal plain Estuary. J. Mar. Res. 1956, 15, 33–42. [Google Scholar]
  6. Hansen, D.V.; Rattray, M., Jr. Gravitational circulation in straits and estuaries. J. Mar. Res. 1965, 23, 104–122. [Google Scholar]
  7. Wong, K.-C. On the nature of transverse variability in a coastal plain estuary. J. Geophys. Res. 1994, 99, 14209–14222. [Google Scholar] [CrossRef]
  8. Valle-Levinson, A.; Reyes, C.; Sanay, R. Effects of Bathymetry, Friction and Rotation on Estuary-Ocean Exchange. J. Phys. Oceanogr. 2003, 3, 2375–2393. [Google Scholar] [CrossRef] [Green Version]
  9. Kasai, A.; Hill, A.E.; Fujiwara, T.; Simpson, J.H. Effect of the earth’s rotation on the circulation in regions of freshwater influence. J. Geophys. Res. 2000, 105, 16961–16969. [Google Scholar] [CrossRef]
  10. Kjerfve, B.; Proehl, J.A. Velocity variability in a cross-section of a well-mixed estuary. J. Mar. Res. 1979, 37, 409–418. [Google Scholar]
  11. Ianniello, J.P. Non-Linearly induced Residual Currents in Tidally Dominated Estuaries. Ph.D. Thesis, The University of Connecticut, Mansfield, CT, USA, 1977; p. 250. [Google Scholar]
  12. Ianniello, J.P. Tidally induced residual currents in estuaries of constant breadth and depth. J. Mar. Res. 1977, 35, 755–786. [Google Scholar]
  13. Bowers, D.G.; Al-Barakati, A. Tidal Rectification on Drying Estuarine Sandbanks. Estuaries 1997, 20, 559–568. [Google Scholar] [CrossRef]
  14. Li, C.; O’Donnell, J. Tidally driven residual circulation in shallow estuaries with lateral depth variation. J. Geophys. Res. 1997, 102, 27915–27929. [Google Scholar] [CrossRef]
  15. Elliott, A.J. Observations of the Meteorologically induced circulation in the Potomac Estuary. Estuar. Coast. Mar. Sci. 1978, 6, 285–299. [Google Scholar] [CrossRef]
  16. Garvine, R.W. A simple model of estuarine subtidal fluctuations forced by local and remote wind stress. J. Geophys. Res. 1985, 90, 11945–11948. [Google Scholar] [CrossRef]
  17. Engelund, F. Steady Wind Set-up in Prismatic Lakes. In: Environmental Hydraulics: Stratified Flows. Lect. Notes Coast. Estuar. Stud. 1986, 18, 205–212. [Google Scholar] [CrossRef]
  18. Feng, Z.; Li, C. Cold-front-induced Flushing of the Louisiana Bays. J. Mar. Res. 2010, 82, 252–264. [Google Scholar] [CrossRef]
  19. Gibbs, M.; Abell, J.; Hamilton, D. Wind forced circulation and sediment disturbance in a temperate lake. N. Z. J. Mar. Freshw. Res. 2016, 50, 209–227. [Google Scholar] [CrossRef]
  20. Li, C. Subtidal water flux through a multiple-inlet system: Observations before and during a cold front event and numerical experiments. J. Geophys. Res. Oceans 2013, 118, 1877–1892. [Google Scholar] [CrossRef]
  21. Li, C.; Huang, W.; Milan, B. Atmospheric Cold Front Induced Exchange Flows through a Microtidal Multi-inlet Bay: Analysis using Multiple Horizontal ADCPs and FVCOM Simulations. J. Atmos. Ocean. Technol. 2019, 36, 443–472. [Google Scholar] [CrossRef]
  22. Roberts, H.H.; Huh, O.K.; Hsu, S.A.; Rouse, L.J., Jr.; Rickman, D.A. Winter storm impacts on the Chenier Plain Coast of Southwestern Louisiana. In Proceedings of the Gulf Coast Association of Geological Societies and Gulf Coast Section of SEPM Meeting, Corpus Christi, TX, USA, 25–27 October 1989; pp. 515–522. [Google Scholar]
  23. Crout, R.L.; Hamiter, R.D. Response of bottom waters on the west Louisiana shelf to transient wind events and resulting sediment transport. Gulf Coast Assoc. Geol. Soc. Trans. 1981, 31, 273–278. [Google Scholar]
  24. Lee, J.; Wiseman, W.; Kelly, F.J. Barotropic, subtidal exchange between Calcasieu Lake and the Gulf of Mexico. Estuaries 1990, 13, 258–264. [Google Scholar] [CrossRef]
  25. Li, C.; Weeks, E.; Huang, W.; Milan, B. Weather-Induced Transport through a Tidal Channel Calibrated by an Unmanned Boat. J. Atmos. Ocean. Technol. 2018, 35, 261–279. [Google Scholar] [CrossRef]
  26. Crout, R.L. Wind-Driven, Near-Bottom Currents over the West Louisiana Inner Continental Shelf. LSU Historical Dissertations and Theses. 1983. Available online: https://digitalcommons.lsu.edu/gradschool_disstheses/3840 (accessed on 1 June 2019).
  27. Cochrane, J.D.; Kelly, F.J. Low-frequency circulation on the Texas-Louisiana continental shelf. J. Geophys. Res. 1986, 91, 10645–10659. [Google Scholar] [CrossRef]
  28. Dingler, J.R.; Reiss, T.E. Cold-front driven storm erosion and overwash in the central part of the Isles Dernieres, a Louisiana barrier-island arc. Mar. Geol. 1990, 91, 195–206. [Google Scholar] [CrossRef]
  29. Li, C.; Roberts, H.; Stone, G.W.; Weeks, E.; Luo, Y. Wind surge and saltwater intrusion in Atchafalaya Bay during onshore winds prior to cold front passage. Hydrobiologia 2011, 658, 27–39. [Google Scholar] [CrossRef]
  30. Lin, J.; Li, C.; Boswell, K.M.; Kimball, M.; Rozas, L. Examination of winter circulation in a northern Gulf of Mexico estuary. Estuaries Coasts 2016, 39, 879–899. [Google Scholar] [CrossRef]
  31. Walker, N.D.; Hammack, A.B. Impacts of winter storms on circulation and sediment transport: Atchafalaya-Vermilion Bay region, Louisiana, U.S.A. J. Coast. Res. 2000, 16, 996–1010. [Google Scholar]
  32. Li, Y.; Li, C.; Li, X. Remote Sensing Studies of Suspended Sediment Concentration Variations in a Coastal Bay During the Passages of Atmospheric Cold Fronts. IEEE J. Sel. Top. Appl. Earth Obs. Remote Sens. 2017, 10, 2608–2622. [Google Scholar] [CrossRef]
  33. Weeks, E.; Robinson, M.E.; Li, C. Quantifying cold front induced water transport of a bay with in situ observations using manned and unmanned boats. Acta Oceanol. Sin. 2018, 37, 1–7. [Google Scholar] [CrossRef]
  34. Li, C.; Boswell, K.M.; Chaichitehrani, N.; Huang, W.; Wu, R. Weather induced subtidal flows through multiple inlets of an arctic microtidal lagoon. Acta Oceanol. Sin. 2019, 38, 1–16. [Google Scholar] [CrossRef]
  35. Zhang, N.; Zheng, Z.C.; Yadagiri, S. A hydrodynamic simulation for the circulation and transport in coastal watersheds. Comput. Fluids 2011, 47, 178–188. [Google Scholar] [CrossRef]
  36. Huang, W.; Li, C. Cold Front Driven Flows Through Multiple Inlets of Lake Pontchartrain Estuary. J. Geophys. Res. 2017, 122, 8627–8645. [Google Scholar] [CrossRef] [Green Version]
  37. Huang, W.; Li, C.; White, J.R.; Bargu, S.; Milan, B.; Bentley, S. Numerical Experiments on variation of freshwater plume and leakage effect from Mississippi River diversion in the Lake Pontchartrain Estuary. J. Geophys. Res. 2020, 125. [Google Scholar] [CrossRef]
  38. Li, C.; Li, X.; Zhang, G.; Boswell, K.M.; Kimball, M.E.; Shen, D.; Lin, J. Estuarine plume: A case study by satellite SAR observations and in situ measurements. IEEE Trans. Geosci. Remote Sens. 2017, 55, 2276–2287. [Google Scholar] [CrossRef]
  39. Huang, W.; Li, C. Spatial Variation of Cold Front Wind-driven Circulation and Quasi-steady State Balance in Lake Pontchartrain Estuary. Estuar. Coast Shelf Sci. 2019, 31, 224. [Google Scholar] [CrossRef]
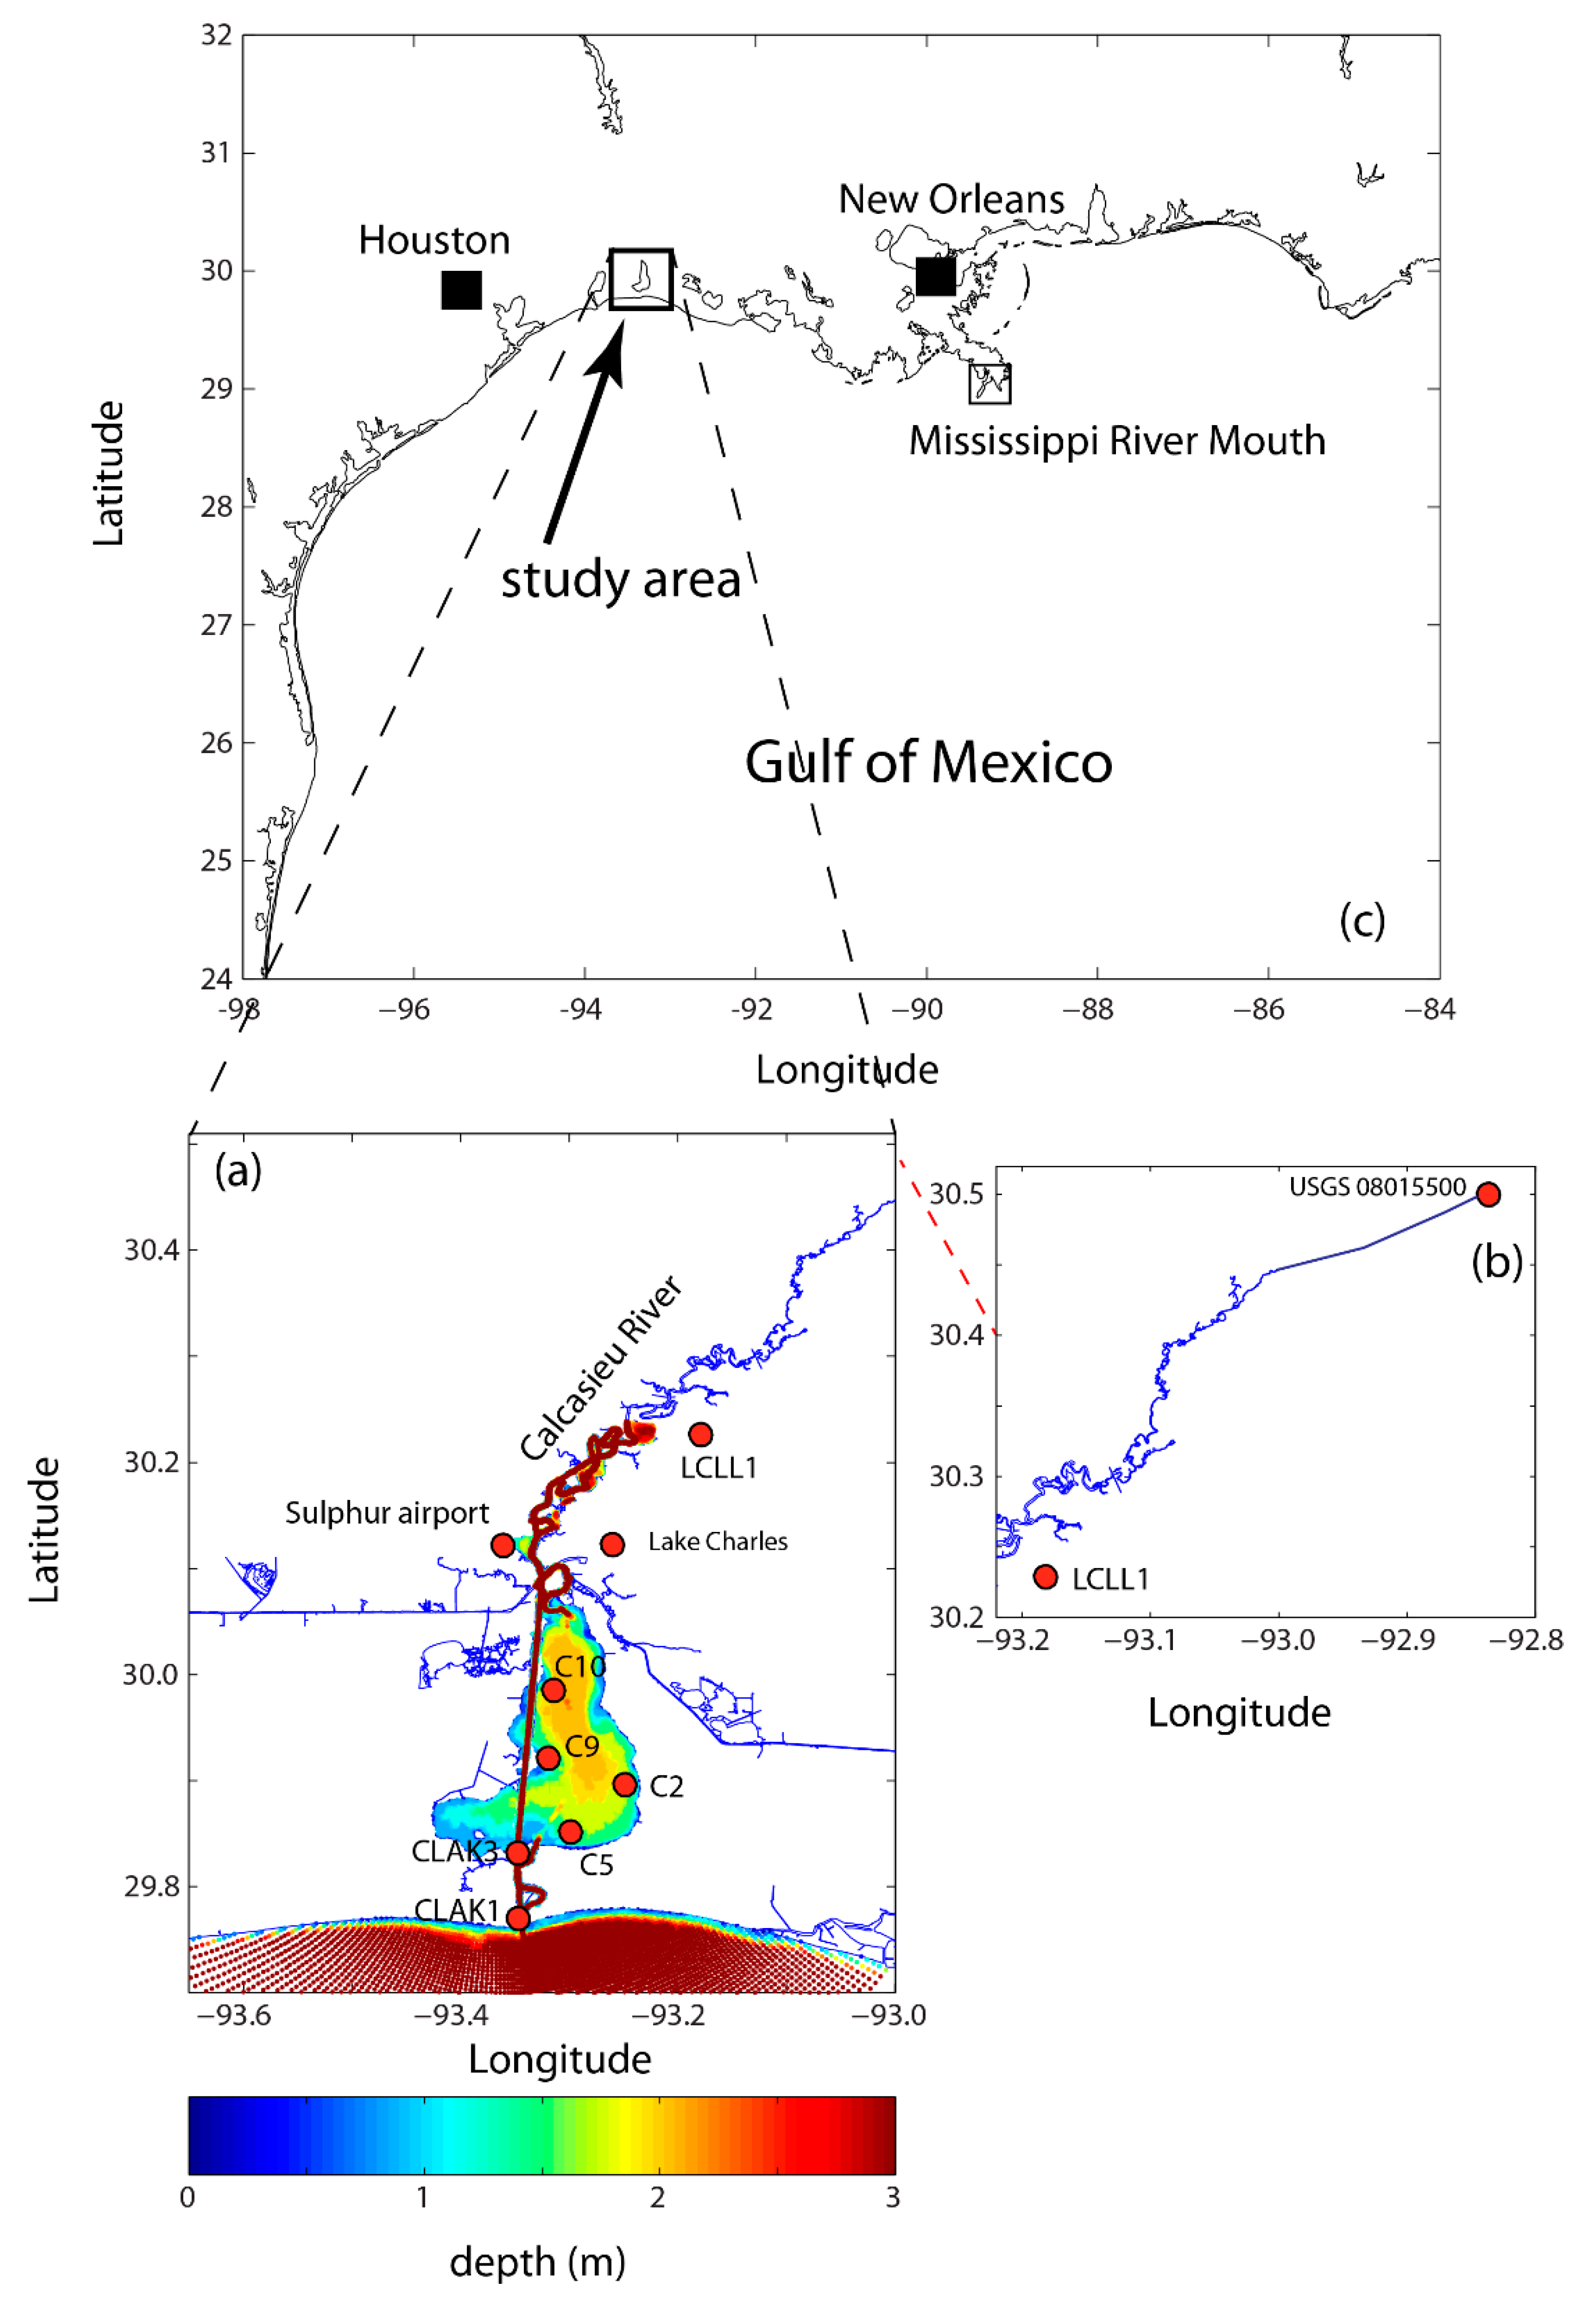
Figure 1. Study area and stations for instruments. (a) The Calcasieu Lake Estuary and the mean water depth, color coded in meters; (b) Extension of the northeast corner of (a); (c) zoomed-out view of the map showing the location of study along the northern Gulf of Mexico. The various stations are indicated by solid circles filled in red, e.g., CLAK1 (USCG Maker), CLAK3 (USCG Tower) in the north inside the Calcasieu Pass, the HOBO deployment sites (C5, C10, C2 and C9), discharge station at USGS 08015500, and the weather stations at Sulphur Airport, LCLL1, and Lake Charles, respectively. CLAK2 is between CLAK1 and CLAK3 but it is not used in this paper and therefore not shown on the map.
Jmse 08 00113 g001
Figure 2. Boat-based survey inside the Calcasieu Pass on 3–4 June 2013. (a) Boat track of the survey; (b) the vertical bars indicate the times when the boat based survey was done across the transects. Each bar is essentially one occupation of one of the transects in Figure 2a.
Jmse 08 00113 g002
Figure 3. Results of FFT and harmonic analysis: spectrum for (a) water level and (b) along channel velocity; tidal constituents from the harmonic analysis for (c) water level and (d) along channel velocity. Units here are m for water level and m/s for the along channel velocity.
Jmse 08 00113 g003
Figure 4. Weather map from NOAA. (a) 14 Dec. 2013; (b) 22 Dec. 2013; (c) 2 Jan. 2014; (d) 5 Jan. 2014; (e) 11 Jan. 2014; (f) 23 Jan. 2014.
Jmse 08 00113 g004
Figure 5. Weather conditions (temperature and air pressure) (a) from station LCLL1 (30.2236° N 93.2217° W); the black line is temperature and the gray line is air pressure; the vertical lines indicate the timing of an atmospheric frontal passage; the six major events were labeled with the time of frontal passage; (b) hourly precipitation (mm) from Lake Charles station at (30.1247° N, 93.2283° W); the arrows indicate the timing of the major frontal passages.
Jmse 08 00113 g005
Figure 6. Time series wind vector (a) between 4 Dec. 2013 and 4 Feb. 2014; the vertical bars indicate the timing of the six major cold frontal passages; (b) a typical cold front process; the vertical line indicates the time of the 5th atmospheric frontal passage.
Jmse 08 00113 g006
Figure 7. Low-pass filtered (a) sensor depth; (b) salinity; and (c) along channel velocity.The vertical dashed lines are times of atmospheric frontal passages, the solid gray lines are the six selected major fronts.
Jmse 08 00113 g007
Figure 8. (a) regression between boat measured transport and velocity from the side-looking ADCP, in which α = 4065, and β = 452; (b) time series of volume transport from the regression; (c) the maximum inward (toward north) or outward (toward south) volume transport during each of the sixteen cold fronts, positive means inflow before cold fronts and negative means outflows after the atmospheric frontal passages. The dashed line is averaged outward transport value, two horizontal thick lines on the right side are maximum and minimum outward volume transports, respectively.
Jmse 08 00113 g008
Figure 9. Water level differences from observations and calculations: (a) in the north-south direction and (b) in the west-east direction. The solid lines are observations and the dashed lines are from calculations.
Jmse 08 00113 g009
Figure 10. The regression curve compared with observations. The bold line is from observations and the dashed line is from the regression equation.
Jmse 08 00113 g010
Figure 11. Regression curve: (a) Feb 26, 2007 to Jan 20, 2016, (b) Mar 10, 2016 to Apr 10,2019; (c) zoomed-in view for the selected warm front; (d) zoomed-in view for Hurricane Ike; (e) zoomed-in view for Tropical Storm Lee; and (f) zoomed-in view for the selected cold front.
Jmse 08 00113 g011
Figure 12. Statistical analysis of flow events. All flow events (amplitude more than 0.4 m/s) are counted: (a) the distribution of inflow events, and (b) the distribution of outflow events.
Jmse 08 00113 g012
Figure 13. Weather map from NOAA. These maps show the time fronts across the Calcasieu Lake. (a) 17 Mar. 2008; (b) 13 Sep. 2008; (c) 4 Sep. 2011; (d) 26 Oct. 2015.
Jmse 08 00113 g013
Table 1. Cold/warm fronts passage.
No.* Starting Time (UTC)CL Time (UTC)*Ending Time (UTC)
12100 05 Dec 20130300 06 Dec 20130000 07 Dec 2013
20300 09 Dec 20130600 09 Dec 20131200 09 Dec 2013
30000 14 Dec 20130900 14 Dec 20132100 14 Dec 2013
41200 21 Dec 20130000 22 Dec 20130900 22 Dec 2013
51900 22 Dec 20131800 22 Dec 20130900 23 Dec 2013
62100 20 Dec 20130900 30 Dec 20132100 30 Dec 2013
70600 02 Jan 20141200 02 Jan 20141500 02 Jan 2014
81200 05 Jan 20141800 05 Jan 20140000 06 Jan 2014
90600 11 Jan 20141800 11 Jan 20142100 11 Jan 2014
101500 13 Jan 20141800 13 Jan 20140000 14 Jan 2014
112100 14 Jan 20140600 15 Jan 20142100 15 Jan 2014
120000 17 Jan 20140600 17 Jan 20141200 17 Jan 2014
130000 21 Jan 20140600 21 Jan 20141200 21 Jan 2014
140000 23 Jan 20142100 23 Jan 20140000 24 Jan 2014
150900 27 Jan 20141800 27 Jan 20142100 27 Jan 2014
160300 02 Feb 20140000 03 Feb 20140900 03 Feb 2014
* Starting time: the time when a cold front enters Louisiana, *Ending time: the time when a cold front leaves Louisiana, and CL time: the time when the cold front passes the Calcasieu Lake ADCP site. The boldface lines are events discussed in detail. The highlighted lines are those most severe events discussed in more details.
Table 2. Summary of six cold fronts.
Cold Fronts
(Sequence Number)
Air Pressure (mba)Wind Speed (m/s)Passing Time (Hour)
MaxMinMaxMin
First103310137.12.821
Second103510076.01.314
Third103110198.90.59
Fourth103910138.73.512
Fifth102110126.50.915
Sixth103810218.50.324
Table 3. Correlation coefficient.
No.Parameter PairCorrelation *
1north wind, near-surface velocity0.75
2east wind, near-surface velocity−0.45
3north wind, lower velocity0.44
4east wind, lower velocity−0.55
5north wind, sensor depth0.35
6east wind, sensor depth−0.50
7pressure, sensor depth0.12
8pressure, near-surface velocity−0.01 (p = 0.68)
9delayed pressure, sensor depth0.68
10delayed pressure, near-surface velocity0.37
* The p-values are all zeros except for the 8th line where p = 0.68.
Table 4. Counts of flow velocity events.
No.Inflow Velocity (m/s)NumberOutflow Velocity (m/s)Number
10.4~0.513−0.4~−0.5123
20.5~0.68−0.5~−0.663
30.6~0.70−0.6~−0.719
4> = 0.72< = −0.77
Total 23 212