Abstract
The 2011 Tohoku tsunami had a serious impact, such as an increase in harmful substances and salinity over a large area. Herein, we evaluated transitions in bacterial communities in agricultural fields in the four years after the 2011 Tohoku tsunami. Bacterial communities were compared across four different types of soil—unflooded field (UF) soil, soil flooded for a short term (ST), soil flooded for the long term (LT), soil flooded long term and cultivated fields (LTC), and marine environmental materials (bay sediment, sea sand and sea water), using a polymerase chain reaction (PCR) and pyrosequencing of 16S ribosomal RNA genes. In the soil bacterial communities that were flooded by the 2011 Tohoku tsunami, these effects were not seen after 2013. Although the difference in bacterial communities between LT and UF became smaller during the four years, the bacterial communities in LT were different from those in UF in several ways, such as a higher tendency frequency of sulfur-oxidizing bacteria (SOB) and the presence of halotolerant SOB. Therefore, it is thought that the Tohoku tsunami affected the microbial communities in the soil for more than four years. Especially genus Halothiobacillus, which is Halotolerant SOB in flooded soils, was detected neither in unflooded soil nor in the marine environment. Therefore, it is thought that inundation by a tsunami produces a unique environment with bacterial communities to form in soil. Further, SOB structure, especially halotolerant, might serve as a good indicators of the impacts of inundation on bacterial communities in agricultural fields over the long term.
1. Introduction
The 2011 Great East Japan Earthquake was one of the most powerful earthquakes ever recorded, and this event triggered a tsunami (2011 Tohoku tsunami), which had a serious impact on a large area [1,2]. Agriculture is one of the major industries in the area, and agricultural fields were seriously contaminated by seawater and marine sediment [3].
Seawater inundation by tsunami causes an increase in harmful substances (such as arsenic) and salinity in agricultural fields, which directly affects plant growth [4,5,6]. Inundation also greatly affects the soil microbial communities. In our previous study, this effect was evaluated using molecular biological techniques [7]. A year after the Tohoku tsunami, the phyla Acidobacteria and Proteobacteria were dominant in unflooded and flooded soil, respectively.
In detail, chemoautotrophic sulfur-oxidizing bacteria (SOB) and nitrite-oxidizing bacteria (NOB) in flooded soil tended to be present with high and low abundance, respectively. Furthermore, zeta-Proteobacteria, which had previously only been found in marine environments and halotolerant SOB (genus Halothiobacillus), were detected in severely flooded soil. Aoyagi et al. [8] reported that incubation of marine sediments deposited by the Great East Japan Earthquake in 2011 caused a decrease in nitrate nitrogen (NO3−–N), increase in sulfate sulfur (SO42−-S), and a shift to an SOB-dominated community. Ihara et al. [9] also reported that SOB was predominant in marine sediment which was launched onto land by the Great East Japan Earthquake. In addition, Ogura et al. [10] reported on microbial communities, metabolic dynamics and activities in the biomass degradation process after the Tohoku disaster. Bacosa et al. [11] evaluated the polycyclic aromatic hydrocarbon biodegradation potential and the diversity of microbial consortia in incubated sediment taken from tsunami-affected fields.
Thus, it was revealed that massive tsunami inundation affected soil microorganisms. However, the effects over several years of inundation on the soil microbial communities in agricultural fields have not been reported. We hypothesized that the microbial community would return to their original state in a few years, leaving no trace of the inundation.
Following our previous study, to investigate the transitions in soil microbial communities over the four years after tsunami inundation, we analyzed the 16S rRNA gene sequences of soil bacterial communities in flooded agricultural fields in the areas nearest to the epicenter of the earthquake. Data were compared among fields and years, and the transitions in bacterial communities were investigated.
2. Materials and Methods
2.1. Sample Collection
Soil samples were collected from agricultural fields (rice fields) located in Higashimatsushima City, Miyagi Prefecture, Japan, from 2013 to 2015 (Figure 1). The average air temperatures in the area during April of 2013, 2014 and 2015 were 9.0 °C, 9.3 °C and 10.6 °C, respectively. Soil samples were taken from unflooded field (UF; Field 1 (UF1)), fields flooded for two weeks (short term, ST; Field 2 (ST2)) and fields flooded for two months (long term, LT; Field 3 (LT3)), the same as in our previous study [7]. Sampling fields were continuously cultivated with the same rice variety (Japonica cv. Hitomebore) for more than five years up to 2010. UF was continued with this same cultivation after 2011. Cultivation in ST and LT were resumed after 2012 (before sampling in 2013) and 2016 (after the sampling in this study), respectively. To analyze the effect of cultivation on the fields, soil samples were taken from long-term flooded and cultivated fields (LTC; Field 4 (LTC4), 5 (LTC5)) in 2014 and 2015. Cultivation in LTC was resumed the year before sampling began. The soil type for all sampling points was Entisol. Until 2010, all fields had been continuously used as rice paddies (Japonica cv. Hitomebore) for at least five years. Fields were sampled prior to water supply and wet tillage. The characteristics of the fields are shown in Table 1. Soil samples were collected from three points in each field (triplicate). To avoid the collection of a dry part, up to 1 cm of surface soil in the field was removed, and portions from up to 3 cm depth were collected using a sterile spatula. Samples were taken avoiding stones and plant residues. Samples for chemical analysis and DNA extraction were stored at 4 °C and −30 °C, respectively. In addition, to compare with marine environmental bacteria, bay sediment (BYS), sea sand (SS) and seawater (SW) samples were taken in 2014 and 2015 (Figure 1). All samples were analyzed within a month.
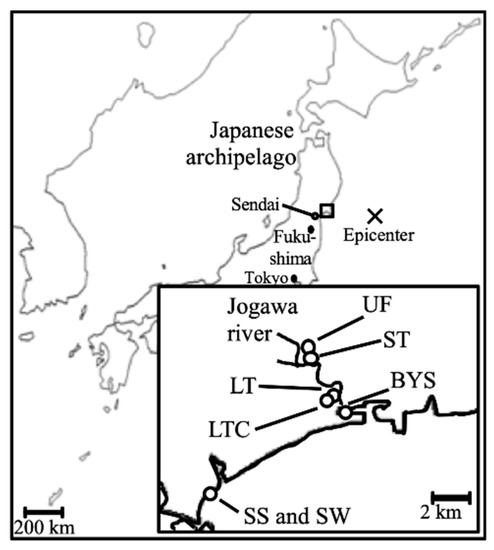
Figure 1.
Location of the sampling sites. Samples were taken from unflooded fields (UFs), fields flooded for two weeks (short term, ST), fields flooded for two months (long term, LT), long-term flooded + cultivated fields (LTC), bay sediment (BYS), sea sand (SS), and seawater (SW) in the areas nearest the epicenter.

Table 1.
Degree of tsunami inundation and agricultural usage of sampling places.
2.2. Chemical Analysis
Samples were suspended in distilled water, and the supernatant was filtered through a 0.45 µm membrane filter and then diluted. Nitrite nitrogen (NO2−–N), NO3−–N, SO42−–S, phosphate phosphorus (PO43−–P), and chloride (Cl−) concentrations in the solution were measured using an ion chromatograph (ICS-2100, Thermo Fisher Scientific K.K., Yokohama, Japan). The ammonium nitrogen (NH4+–N) concentration in the solution was determined by colorimetry using the indophenol blue method and an autoanalyzer (QuA Atro2-HR BLTEC, Osaka, Japan). The pH and electrical conductivity (EC) were measured using a portable pH meter (B-212, HORIBA, Kyoto, Japan) and an EC meter (B-173, Horiba), respectively.
The total inorganic nitrogen (TIN) was calculated from the summation of NH4+–N, NO2−–N, and NO3−–N. The dry matter weight was determined by drying samples at 105 °C.
2.3. DNA Extraction
We performed DNA extraction via the same method as in our previous study [7]. The total DNA was extracted from 500 mg soil using a FastDNA Spin Kit for Soil (MP Biomedicals, Santa Ana, CA, USA) according to the manufacturer’s instructions. DNA was dissolved in Milli-Q water (Merck, Darmstadt, Germany) and stored at −80 °C until polymerase chain reaction (PCR) amplification.
2.4. PCR Amplification and Pyrosequencing
PCR amplification and pyrosequencing were also performed as in our previous study [7]. To analyze the bacterial communities, 16S rDNA was amplified by polymerase chain reaction (PCR) using the specific primer pair 8F/518R [12,13]. A unique sequence tag for the identification of individual samples (454 sequencing adapters, key tags, and molecular identifier (MID) tags; Roche, Penzberg, Germany) was attached to the forward and reverse primers [14,15]. Hence, an example primer pair would have the following sequence: forward, 5′-CCATCTCATCCCTGCGTGTCTCCGAC-TCAG-ACGAGTGCGT-AGAGTTTGATCCTGGCTCAG-3′ (adapter-Key-MID1-8F); reverse, 5′-CCTATCCCCTGTGTGCCTTGGCAGTC-TCAG-GTATTACCGCGGCTGCTGG-3′ (adapter-Key-518R). The mixture for the amplification consisted of 1× Go Taq Green Master Mix (Promega), 0.25 μM each primer and 0.2 ng/μL template DNA in a final volume of 100 μL. The amplification conditions were as follows: 94 °C for 3 min; 30 cycles at 94 °C for 20 s, 58 °C for 45 s and 72 °C for 1 min; and a final extension at 72 °C for 8 min. Each PCR amplification was verified by electrophoresis on 1.2% agarose gels and visualized using the SYBR Safe DNA Gel staining reagent (Invitrogen) under The Safe Imager (Invitrogen). Specific bands were excised from the gels using cutter blades. PCR products were recovered from the excised gels using Quantum Prep Freeze’N Squeeze DNA Gel Extraction Spin Columns (Bio-Rad) and purified using the MinElute PCR Purification Kit (Qiagen). The DNA was quantified using Quant-iT PicoGreen dsDNA reagent and kits (Invitrogen). All PCR products were normalized to the same molecule concentration (1.0 × 10⁹/μL) and mixed in equal volumes. Mixed PCR products were diluted to an emulsion PCR (emPCR) working concentration of 1 × 10⁷ molecules/μL. Then, emPCR was performed using the GS Junior Titanium emPCR Kit (Lib-L; Roche) according to the manufacturer’s instructions. Amplified DNA fragments were sequenced using a GS Junior Titanium Sequencing Kit (Roche) and the GS Junior Titanium PicoTiter Plate Kit (Roche) on a 454 GS Junior system (Roche) according to the manufacturer’s instructions.
2.5. Sequencing Data Analysis
Raw sequencing reads were derived with a MID tag, which differed depending on the sample, using the Initial Process in the Ribosomal Database Project (RDP) Pyrosequencing Pipeline (http://pyro.cme.msu.edu/). The primer sequences were removed from the sequencing reads. Reads of 150 bp or fewer, and those containing a sequence with a quality value of 10 or less, were removed. Sequences were trimmed to 350 bp fragments to obtain only high-quality sequences. Chimeric sequences were removed using the Fungene chimera check (http://fungene.cme.msu.edu/). Chimera-filtered sequences were classified phylogenetically using the RDP Classifier with a cut-off value of 0.8. Sequences classified as class chloroplast were removed. Sequences classified as chemoautotrophic SOB, or NOB were compared with sequences registered in the database of the DNA Data Bank of Japan (DDBJ) using the Basic Local Alignment Search Tool (BLAST) (http://blast.ddbj.nig.ac.jp/top-j.html) to determine the most similar sequences. The sequences which exhibited more than 97% similarity to 16S rDNA sequences classified as SOB, or NOB were considered.
After the excluding chloroplast sequences, the remaining reads were classified into operational taxonomic units (OTUs) of sequences with over 97% similarity to one another using Qiime (http://qiime.org/index.html). Rarefaction analysis was performed using the RDP Rarefaction tool based on the number of sequences and OTUs for each sample. Diversity indices, such as Chao1 and the abundance-based coverage estimate (ACE), were also calculated using EstimateS (http://viceroy.eeb.uconn.edu/estimates/) [16].
2.6. Statistical Analysis
Analysis of variance (ANOVA) was conducted using R software (www.r-project.org). Means of chemical parameters and diversity indices were compared among fields using Tukey–Kramer tests. A 5% probability level was used to indicate statistical significance for all analysis. To determine differences in bacterial community structure among the samples, OTUs were examined by principal coordinate analysis (PCoA) using R software.
3. Results
3.1. Chemical Characteristics
The chemical characteristics of the soil samples are outlined in Table 2. The results from the ANOVA indicated that all chemical characteristics varied across fields and sampling years. In 2013, NH4+–N, Cl−, SO42−–S, and EC in the LT fields were significantly higher than those in UFs (p < 0.05), while the pH in LT fields was significantly lower than that in UFs. PO43−–P in ST fields was significantly higher than that in UFs and LT fields. In 2014, the TIN in UFs significantly increased from the value in 2013, and was significantly higher than that in the ST and LT fields. In 2015, significant differences were not seen in all chemical characteristics.
Table 2.
Chemical characteristics of the soil samples.
3.2. Bacterial Community Structure
Pyrosequencing provided 3182–19,437 rDNA sequences and 192–4868 OTUs from the soil samples (Table 3). Significant differences among the fields in same year were not seen in diversity indices. Diversity indices in UFs were decreased in 2014; these indices were high in STs throughout the investigation period and tended to be low in LTs in 2013. Rarefaction curves indicated that some soil samples not reached saturation (Supplementary Figure S1).
Table 3.
Number of sequences, number of operational taxonomic units (OTUs), and diversity indices for soil samples.
All sequences were classified phylogenetically. The relative abundances of the phyla in these samples are shown in Figure 2. In UF, Acidobacteria and Proteobacteria were predominant in 2013 and 2015, and the average relative abundances of these phyla were 24.7% and 28.9%, respectively. However, Acidobacteria levels decreased (8.4%), and Actinobacteria tended to be predominant (13.1%) in UF in 2014. Acidobacteria and Proteobacteria were predominant in ST during 2013–2015, and the relative abundances of these phyla were 25.6% and 29.3%, respectively. In LT, Actinobacteria and Proteobacteria were predominant in 2013, and the relative abundances of these phyla were 20.4% and 51.1%, respectively. Bacteroidetes (LT: 11.9%, LTC: 15.6%) and Proteobacteria (LT: 51.3%, LTC: 41.0%) were predominant in LT and LTC in 2014, while Acidobacteria (LT: 17.8%, LTC: 11.6%) and Proteobacteria (LT: 37.0%, LTC: 41.4%) were predominant in 2015.
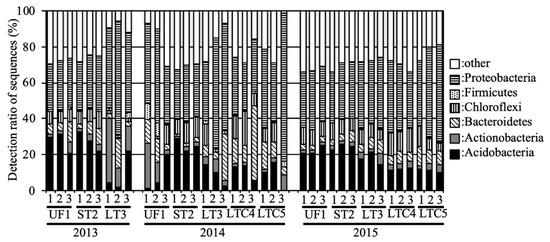
Figure 2.
Relative abundances of the phyla in the soil samples. Percentages add up to the percentage of phylum Proteobacteria in Figure 2.
With regard to the subgroups of Proteobacteria—one of the predominant phyla—the alpha, beta, and delta subgroups were predominant in UF and ST during the investigation period (Figure 3). The gamma subgroup tended to be higher in LT compared to UF and ST. The gamma and epsilon subgroups tended to be higher in LTC in 2014 and 2015, respectively. The zeta subgroup was detected only in LT in 2013 (0.08%).
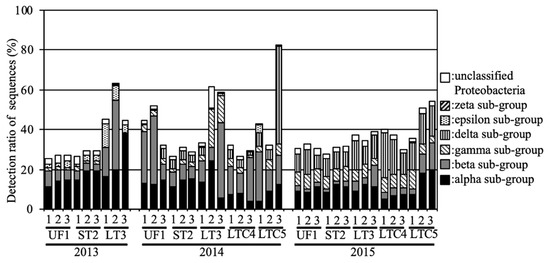
Figure 3.
Relative abundances of the Proteobacteria subgroups in the soil samples.
The bacterial community structure was further analyzed via PCoA of the OTUs (Figure 4). Principal Component (PC)1 and PC2 of the PCoA represented 58.6% and 11.6% of the variation, respectively. Data for the same fields (UF, ST and LT) in 2012 [7] and data under equivalent conditions for the two field types UF and ST in 2013 were added to the analysis in order to compare with the previous study year and to compare UFs and STs in detail for 2013, respectively. For the entire investigation period, the PC1 and PC2 scores of the UFs were almost the same except for some point of 2014 (Figure 4a,f). In 2012, the scores for LT and ST were plotted far from those for UFs (Figure 4b). In 2013, the scores of ST fields were plotted near those of UFs, and a similar result was also obtained from the analysis of an increased number of samples (Figure 4c). The scores of ST fields were plotted in substantially the same position for 2013 onwards (Figure 4g). However, the scores of the LT fields in 2013 were plotted at a position further away from the UFs than in 2012. In 2014, the plotted scores of the UFs showed variation (Figure 4f). The LT scores were plotted away from the UF scores, but the distances were closer than those in 2013. The plotted LTC scores also showed variation. In 2015, the LT and LTC scores were plotted near those for the UFs and STs (Figure 4e).
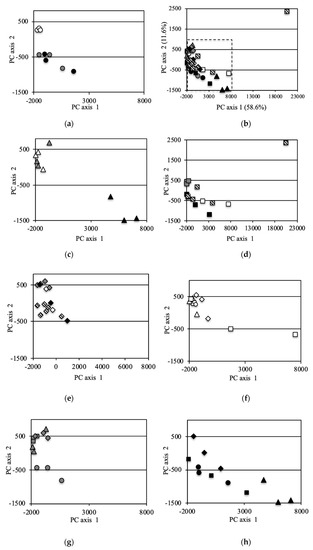
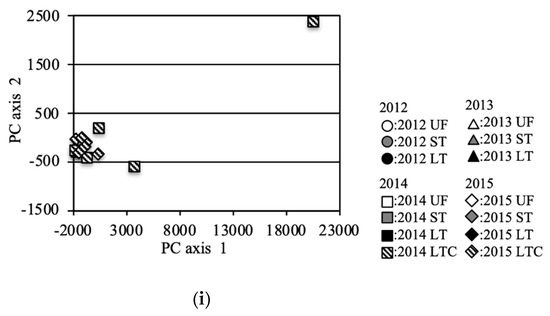
Figure 4.
Principal coordinate analysis (PCA) (incremental Euclidean distance) of the OTUs: (a): all soil samples, (b): soil samples in 2012 (referred to Asano et al. [7]), (c): soil samples in 2013, (d): soil samples in 2014, (e): soil samples in 2015, (f): sample in UF, (g): sample in ST, (h): sample in LT, (i): sample in LTC. b (2012), c (2013), e (2015) f (UF), g(ST), and h (LT) show the area enclosed by the dotted line in a (all soil samples).
In our previous study, chemoautotrophic SOB in flooded soil tended to occur with high abundance [7]. To analyze the SOB structure in detail, 2434 sequences classified as SOB were compared to registered sequences in the database using the Basic Local Alignment Search Tool (BLAST).
The average relative abundances of SOB in UF and ST were 0.08% and 0.10%, respectively (Figure 5), and the relative abundances in these fields were under 0.2% during the investigated period. Members of genus Thiobacillus, such as Thiobacillus denitrificans ME16 (GenBank Accession Number EU546130) and Thiobacillus thioparus (AF005628), were the predominant SOB in these fields.
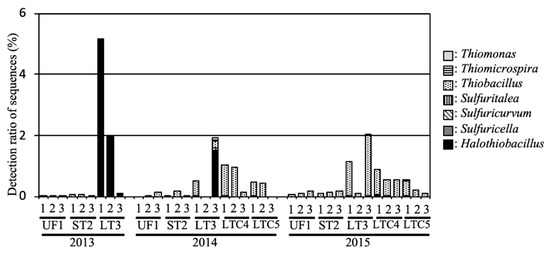
Figure 5.
Relative abundance of sulfur-oxidizing bacteria (SOB) in the soil samples.
In LT, a large number of rRNA sequences in the flooded soil exhibited membership of the genus Halothiobacillus, including halotolerant SOB, such as Halothiobacillus neapolitanus NTV01 (KJ027464) and Halothiobacillus sp. NP37 (EU196318). The average relative abundances of SOB and the genus Halothiobacillus in LT were 24.3% and 2.42%, respectively, in 2013. The relative abundances of SOB in LT were 0.82% and 1.12% in 2014 and 2015, respectively, and genus Halothiobacillus was detected during the entire investigated period. The average relative abundances of SOB in LTC were 0.52% and 0.49% in 2014 and 2015, respectively.
3.3. Sulfur-Oxidizing Bacteria
In our previous study, the chemoautotrophic SOB in flooded soil tended to occur with high abundances [6]. To analyze the SOB structure in detail, 2434 sequences classified as SOB were compared to registered sequences in the database using BLAST.
The average Relative abundances of SOB in UF and ST were average of 0.07% and 0.09%, respectively (Figure 5), and the relative abundances in these fields were under 0.2% during the investigation period. Members of genus Thiobacillus, such as Thiobacillus denitrificans ME16 (GenBank Accession Number EU546130) and Thiobacillus thioparus (AF005628), were the predominant SOB in these fields.
In LT, a large number of rRNA sequences in the flooded soil exhibited membership of the genus Halothiobacillus, which including halotolerant SOB, such as Halothiobacillus neapolitanus NTV01 (KJ027464) and Halothiobacillus sp. NP37 (EU196318). The average relative abundances of SOB and the genus Halothiobacillus in LT were averages of 2.42% and 2.41%, respectively, at in 2013. The relative abundances of SOB in LT were 0.81% and 1.12% in 2014 and 2015, respectively, and the genus Halothiobacillus was detected in all the entire investigation period. The average relative abundances of SOB in LTC were an average of 0.5% and 0.48% in 2014 and 2015, respectively.
3.4. Nitrite-Oxidizing Bacteria
In our previous study, NOB were also detected, and in flooded soil, they tended to occur with low abundance [7]. To analyze the NOB structure in detail, 419 sequences classified as NOB were compared to registered sequences in the database using BLAST.
The average relative abundances of NOB in UF and ST were 0.17% and 0.21%, respectively (Figure 6). In 2013, NOB were not detected in LT fields. The relative abundances of NOB in LT were 0.05% and 0.09% in 2014 and 2015, respectively. The average relative abundances of NOB in LTC were 0.07% and 0.05% in 2014 and 2015, respectively. Members of the genus Nitrospira, such as Nitrospira japonica (AB818959) and Nitrospira sp. GC86 (Y14644), were the predominant NOB in all fields.
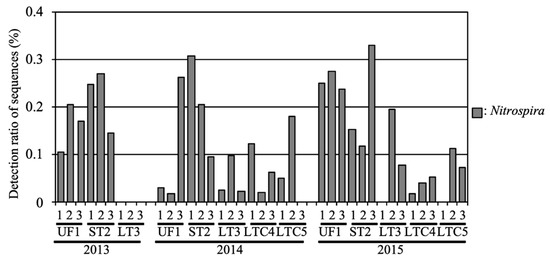
Figure 6.
Relative abundance of the nitrite-oxidizing bacteria (NOB) in the soil samples.
3.5. Bacterial Communities in Marine Materials
To compare with the bacterial communities in inundated soil, marine environment bacterial communities were also analyzed. The phyla Proteobacteria and Bacteroidetes were predominant in all marine samples (Figure 7). With regards to the subgroups of Proteobacteria, the delta, gamma, and alpha subgroups were consistently predominant in BYS, SS and SW, respectively. The zeta subgroup was consistently detected in BYS (0.5% and 0.9% in 2014 and 2015, respectively). SOB such as those in the genera Thiobacillus, Sulfurimonas and Sulfuricurvum were consistently detected in BYS. However, the relative abundances of SOB were below 0.4%. NOB such as genera Nitrospira was also consistently detected in BYS and SW.
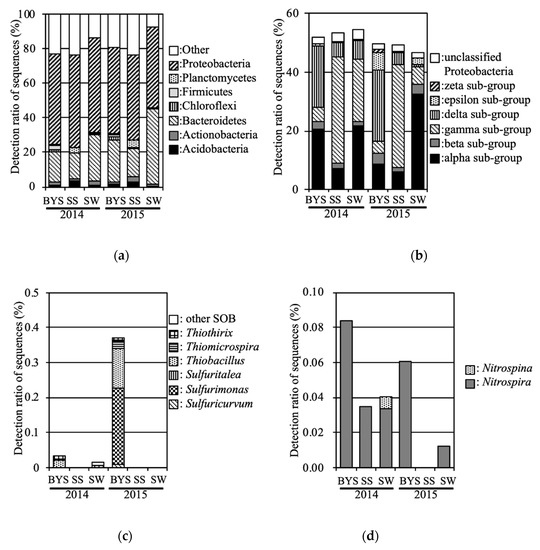
Figure 7.
Relative abundance levels in the marine samples: (a): phyla, (b): Proteobacteria subgroups, (c): SOB, (d): NOB.
4. Discussion
Large areas of agricultural fields in Eastern Japan were seriously damaged by the 2011 Tohoku tsunami. In Miyagi Prefecture in particular, 12% of the agricultural land suffered from tsunami encroachment [3]. In our previous study, the effects of the 2011 Tohoku tsunami on soil bacterial communities in agricultural fields were shown to have potentially lasted at least one year. To investigate transitions in the soil microbial community over the four years after tsunami inundation, we analyzed soil bacterial communities in the same fields as in our previous study during the 2–4 years after the tsunami. Unfortunately, we were unable to obtain soil samples from each field prior to the Tohoku tsunami. Therefore, soil samples from UF fields which (i) used water from the same irrigation system as tsunami-flooded fields, (ii) continuously cultivated the same rice variety (Japonica cv. Hitomebore) as the flooded fields for more than five years up to 2010, (iii) continued this same cultivation after 2011, and (iv) were close to the investigated flooded fields were analyzed.
Some chemical characteristics in 2013 (such as Cl− and SO42−–S) in LT significantly differed from those in UF soil, and PO43−–P in ST was significantly higher than that in other fields. However, significant differences in chemical characteristics between the fields were not found for 2015. In our previous study, we found that Cl− and SO42−–S levels in flooded fields tended to be higher than those in UFs in 2012 [7]. In 2013, a similar tendency was observed in LT, but significant differences between UF and ST in terms of chemical characteristics were not. It is thought that the chemical characteristics of the ST fields were similar to those of UF in the one year of 2012–2013. LTC was cultivated from a year before sampling began and tilled with straw. Abdel-Fattah [17] reported that the amending of straw compost decreased EC in leaching experiment for reclamation of clay saline–sodic soils. However, no significant difference in EC between the LT and LTC fields was seen in this study. In addition, the TIN in UFs was temporarily increased in 2014. It is thought that this increase was caused by the supply of rice bran for soil amendment.
The number of sequences in each sample varies (up to 6 times). Because rarefaction curves indicated that some soil samples not reached saturation, these number in this study might not enough to detect minor species of bacteria. Therefore, we took triplicate sampling in each field in this study. Significant differences among the fields in same year were not seen in diversity indices (Table 3).
In general, the dominant phyla in the soil bacterial communities were Proteobacteria, Acidobacteria, Actinobacteria, Verrucomicrobia, Bacteroidetes, Chloroflexi, Planctomycetes, Gemmatimonadetes and Firmicutes [18]. In our previous study, the dominant phyla in UFs in 2012 were Proteobacteria and Acidobacteria [7]. In this study, the UF bacterial communities in 2013 and 2015 were similar to those in our previous research. Therefore, it is thought that these bacterial communities were common before the planting of rice fields in this area. However, the bacterial communities in UFs in 2014 differed from those in the UFs in 2013 and 2015. The supply of organic matter to the soil causes a change in the microbial community. For example, Briceño et al. [19] reported that supply of cattle manure to the soil causes a dominance of Bacteroidetes and Acinetobacter. Therefore, it is thought that the supply of rice bran caused a change in the microbial community for short turn (within a year).
In our previous study, bacterial communities in flooded soil in 2012 tended to have high levels of SOB and low levels of NOB [7]. Furthermore, zeta-Proteobacteria and halotolerant SOB (genus Halothibacillus) were detected in severely flooded fields (LT). In this study, the bacterial communities in ST did not have these features after 2013, and the PCoA scores of ST fields were plotted near those of UFs. Therefore, it is thought that effects of the tsunami on bacterial communities in ST soil ceased after 2013. Concerning the bacterial communities in LT fields, zeta-Proteobacteria were detected until 2013, NOB abundance tended low until 2014, SOB abundance tended high until 2015, and halotolerant SOB were detected until 2015. Therefore, massive tsunami inundation still affected the bacterial communities in flooded soil after four years. In addition, no clear difference in microbial community structure between the LT and LTC fields was seen in 2014 or 2015. In other words, the promotion of recovery for bacterial communities by irrigation and planting was not seen in this study.
To compare with bacterial communities in inundated soil, marine environment bacterial communities were also analyzed in 2014 and 2015. As result, the zeta subgroup was detected in BYS. These sequences were classified into the OTU, which was detected in LT fields at 2012 and 2013 [6]. Therefore, the Proteobacteria zeta subgroup in LT is considered to have been supplied from marine sediment including BYS point by the tsunami, and to have remained for more than two years. This result supports the hypothesis that marine environment bacteria invaded and remained in inundated fields.
Interestingly, the predominant SOB in marine environments were of the genera Thiobacillus, Sulfurimonas, Thiomicrospira, and Sulfuricurvum. Genus Halothiobacillus was not detected. Aoyagi et al. [8] reported that SOB, especially genus Sulfurimonas, were predominant in incubated marine sediments deposited by the Great East Japan Earthquake in 2011. Ihara et al. [9] also reported that SOB, especially genus Sulfurimonas, were predominant in the uppermost launched marine sediment in 2011, and these significantly decreased in 2012 and 2013.
The distance between their sampling site and BYS was approximately 1 km, so sediments in BYS might have been supplied to this site by the tsunami. In this study, Sulfurimonas was most predominant SOB genus in BYS in 2015 (Figure 7). Therefore, these SOB might also invade and survive in fields inundated with sediments. However, genus Sulfurimonas was not detected in LT fields in our previous or current study, although the LT fields were sited near BYS like the sampling sites of Aoyagi et al. and Ihara et al. [8,9]. In the study by Aoyagi et al. [8], soil samples were taken 6 months after the tsunami (September 2011), whereas the first samples in our study were taken after 13 months (April 2012). During both studies, the predominant SOB might change due to such factors as the rise in the salt concentration caused by drying of the soil. Although genus Sulfurimonas is isolated from marine environments [20,21], the genus Halothiobacillus can grow under salt concentrations higher than those found in seawater (>0.86 M NaCl) [22]. Therefore, the supply of marine material by the Tohoku tsunami caused a rapid increase of SOB followed by a slow decrease of them. The predominant SOB were of the genus Sulfurimonas immediately after the tsunami; following that, genus Halothiobacillus was predominant in agricultural fields. The difference from Ihara et al. [9] might be caused from the land use conditions; their sampling site seems from geographic information to be a nonagricultural field. Ogura et al. [10] reported that the metabolic dynamics and activities in the biomass degradation process differed considerably between soils from agricultural and abandoned fields in the Tohoku disaster area.
NOB were also detected in the marine environment. Sequences belonging to the same OTU (classified as Nitrospira) were detected in UFs and BYS. Nevertheless, NOB tended to occur at low abundances in flooded soil in our previous and current study.
In addition, Bacosa et al. [11] reported that the abundances of genera Sphingomonas, Sphingobium, Dokdonella, etc., were increased in incubated sediment taken from tsunami-affected fields. In this study, genus Sphingomonas was more abundant in 2013–2014 (data not shown).
From the above results, we conclude that inundation by a tsunami produces a unique environment with bacterial communities to form in soil. Some bacteria which invaded by way of the tsunami might have remained for more than two years, such as zeta-Proteobactera, whereas other bacteria which have adapted to this environment might also predominate in flooded soil, such as genus Halothiobacillus.
5. Conclusions
In soil bacterial communities that were flooded by the 2011 Tohoku tsunami, effects were seen in 2012, but these effects in ST fields were not seen after 2013. Although the difference in bacterial communities between LT and UF fields became smaller, halotolerant SOB were detected in LT fields up until 2015. Therefore, it is thought that the Tohoku tsunami affected the microbial communities in the near-coastal farmland for more than four years. Some predominant bacteria in flooded soils (such as genus Halothiobacillus) were detected in neither unflooded soil nor the marine environment. Therefore, it is thought that inundation by a tsunami produces a unique environment with bacterial communities to form in soil. In addition, the SOB structure was affected by the tsunami longer than the chemical characteristics were and might serve as a good indicator of the effects of seawater inundation on soil bacterial communities in agricultural fields over a long period.
Supplementary Materials
The following are available online at https://www.mdpi.com/2077-1312/8/2/76/s1, Figure S1: Rarefaction curves for the different soil samples calculated from the number of OTUs and sequence for each sample. An OTU consisted of sequences with more than 97% similarity. (a): soil samples in 2013, (b): soil samples in 2014, (c): soil samples in 2015.
Author Contributions
Methodology, R.A., J.F., Y.N. and T.I.; formal analysis, R.A., A.H., Y.S. and M.A.; investigation, R.A.; writing—original draft preparation, R.A.; writing—review and editing J.F., Y.N. and T.I. All authors have read and agreed to the published version of the manuscript.
Funding
This research received no external funding.
Acknowledgments
We thank the Watanabe, Miura Asano, and Honda farms in Higashimatsushima for their kind donations of soil samples. We wish to thank the Biotechnology Center, Faculty of Bioresource Sciences, Akita Prefectural University, for the use of their GS Jr. pyrosequencing instrument. This work was supported in part by the Science and Technology Integration Center Project at Akita Prefectural University (Asano R. and Fukushima J.).
Conflicts of Interest
The authors declare no conflict of interest.
References
- Maeda, T.; Furumura, T.; Sakai, S.; Shinohara, M. Significant tsunami observed at ocean-bottom pressure gauges during 2011 off the Pacific coast of Tohoku Earthquake. Earth Planets Space 2011, 63, 803–808. [Google Scholar] [CrossRef]
- Mimura, N.; Yasuhara, K.; Kawagoe, S.; Yokoki, H.; Kazama, S. Damage from the great east Japan earthquake and tsunami—a quick report. Mitig. Adapt. Strateg. Glob. Chang. 2011, 16, 803–818. [Google Scholar] [CrossRef]
- Guo, H.D.; Chen, Y.; Fen, Q.; Lin, Q.Z.; Wang, F. Assessment of damage to buildings and farms during the 2011 M 9.0 earthquake and tsunami in Japan from remote sensing data. Chin. Sci. Bull. 2011, 56, 2138–2144. [Google Scholar] [CrossRef][Green Version]
- Tsuchiya, N.; Inoue, C.; Yamada, R.; Yamasaki, S.; Hirono, N.; Okamoto, A.; Ogawa, Y.; Watanabe, T.; Watanabe, N.F.; Watanabe, N. Risk assessments of Arsenic in tsunami sediments from Iwate, Miyagi and Fukushima Prefectures, Northeast Japan, by the 2011 off the Pacific coast of Tohoku Earthquake. J. Geol. Soc. Jpn. 2012, 118, 419–430. [Google Scholar] [CrossRef][Green Version]
- Kume, T.; Umetsu, C.; Palanisami, K. Impact of the December 2004 tsunami on soil, groundwater and vegetation in the Nagapattinam district, India. J. Environ. Manag. 2009, 90, 3147–3154. [Google Scholar] [CrossRef]
- McLeod, M.K.; Slavich, P.G.; Irhas, Y.; Moore, N.; Rachman, A.; Ali, N.; Iskandar, T.; Hunta, C.; Caniago, C. Soil salinity in Aceh after the December 2004 Indian Ocean tsunami. Agric. Water Manag. 2010, 97, 605–613. [Google Scholar] [CrossRef]
- Asano, R.; Nakai, Y.; Kawada, W.; Shimura, Y.; Inamoto, T.; Fukushima, J. Seawater inundation from the 2011 Tohoku tsunami continues to strongly affect soil bacterial communities one year later. Microb. Ecol. 2013, 66, 639–646. [Google Scholar] [CrossRef] [PubMed]
- Aoyagi, T.; Kimura, M.; Yamada, N.; Navarro, R.R.; Itoh, H.; Ogata, A.; Sakoda, A.; Katayama, Y.; Takasaki, M.; Hori, T. Dynamic transition of chemolithotrophic sulfur-oxidizing bacteria in response to amendment with nitrate in deposited marine sediments. Front. Microbiol. 2015, 6, 426. [Google Scholar] [CrossRef] [PubMed]
- Ihara, H.; Hori, T.; Aoyagi, T.; Takasaki, M.; Katayama, Y. Sulfur-Oxidizing Bacteria Mediate Microbial Community Succession and Element Cycling in Launched Marine Sediment. Front. Microbiol. 2017, 8, 152. [Google Scholar] [CrossRef] [PubMed]
- Ogura, T.; Date, Y.; Tsuboi, Y.; Kikuchi, J. Metabolic dynamics analysis by massive data integration: application to tsunami-affected field soils in Japan. ACS Chem. Biol. 2015, 10, 1908–1915. [Google Scholar] [CrossRef] [PubMed]
- Bacosa, H.P.; Inoue, C. Polycyclic aromatic hydrocarbons (PAHs) biodegradation potential and diversity of microbial consortia enriched from tsunami sediments in Miyagi, Japan. J. Hazard. Mater. 2015, 283, 689–697. [Google Scholar] [CrossRef] [PubMed]
- Baker, G.C.; Smith, J.J.; Cowan, D.A. Review and re-analysis of domain-specific 16S primers. J. Microbiol. Methods 2003, 55, 541–555. [Google Scholar] [CrossRef] [PubMed]
- Horz, H.P.; Vianna, M.E.; Gomes, B.P.; Conrads, G. Evaluation of universal probes and primer sets for assessing total bacterial load in clinical samples: general implications and practical use in endodontic antimicrobial therapy. J. Clin. Microbiol. 2005, 43, 5332–5337. [Google Scholar] [CrossRef] [PubMed]
- Binladen, J.; Gilbert, M.T.P.; Bollback, J.P.; Panitz, F.; Bendixen, C.; Nielsen, R.; Willerslev, E. The use of coded PCR primers enables high-throughput sequencing of multiple homolog amplification products by 454 parallel sequencing. PLoS ONE 2007, 2, e197. [Google Scholar] [CrossRef] [PubMed]
- Wegner, K.M.; Shama, L.N.S.; Kellnreitner, F.; Pockberger, M. Diversity of immune genes and associated gill microbes of European plaice Pleuronectes platessa, Estuar. Coast. Shelf Sci. 2012, 108, 87–96. [Google Scholar] [CrossRef]
- Chao, A.; Bunge, J. Estimating the number of species in a stochastic abundance model. Biometrics 2002, 58, 531–539. [Google Scholar] [CrossRef]
- Abdel-Fattah, M.K. Role of gypsum and compost in reclaiming saline-sodic soils. ISOR-JAVS 2012, 1, 30–38. [Google Scholar] [CrossRef]
- Janssen, P.H. Identifying the dominant soil bacterial taxa in libraries of 16S rRNA and 16S rRNA genes. Appl. Environ. Microbiol. 2006, 72, 1719–1728. [Google Scholar] [CrossRef]
- Briceño, C.; Jorquera, M.A.; Demanet, R.; Mora, M.L.; Durán, N.; Palma, G. Effect of cow slurry amendment on atrazine dissipation and bacterial community structure in an agricultural Andisol. Sci. Total Environ. Sci. 2010, 408, 2833–2839. [Google Scholar] [CrossRef]
- Inagaki, F.; Takai, K.; Kobayashi, H.; Nealson, K.H.; Horikoshi, K. Sulfurimonas autotrophica gen. nov., sp. nov., a novel sulfur-oxidizing epsilon-proteobacterium isolated from hydrothermal sediments in the Mid-Okinawa Trough. Int. J. Syst. Evol. Microbiol. 2003, 53, 1801–1805. [Google Scholar] [CrossRef]
- Labrenz, M.; Grote, J.; Mammitzsch, K.; Boschker, H.T.; Laue, M.; Jost, G.; Glaubitz, S.; Jürgens, K. Sulfurimonas gotlandica sp. nov., a chemoautotrophic and psychrotolerant epsilonproteobacterium isolated from a pelagic redoxcline, and an emended description of the genus Sulfurimonas. J. Syst. Evol. Microbiol. 2013, 63, 4141–4148. [Google Scholar] [CrossRef] [PubMed]
- Kelly, D.P.; Wood, A.P. Genus Halothiobacillus. In Bergey’s Manual of Systematic Bacteriology, 2nd ed.; Garrity, G.M., Ed.; Springer: New York, NY, USA, 2005; Volume 2, pp. 58–59. [Google Scholar]


© 2020 by the authors. Licensee MDPI, Basel, Switzerland. This article is an open access article distributed under the terms and conditions of the Creative Commons Attribution (CC BY) license (http://creativecommons.org/licenses/by/4.0/).