Abstract
There are many factors involved in the layout optimization of cabin equipment, and human factors should be considered in the early stage of layout design. Human reliability is an effective index to evaluate the probability of success of the human completion of tasks. In order to put forward the method of human reliability which is more suitable for the layout optimization of cabin equipment, the existing methods of human reliability analysis (HRA) are systematically studied. At the same time, taking HRA, equipment correlation and cabin balance as objective functions, the optimization problem of cabin equipment layout was quantified into a mathematical model. When solving the model, the visibility graph method was used to model the cabin path planning, and a solution platform for the optimization of cabin equipment layout was developed on the basis of a genetic algorithm. Finally, the developed platform was applied with a ship example, and the results before and after the layout optimization were displayed through a three-dimensional model. At the same time, equipment layout evaluation software was used to simulate the experimental results so as to compare the improvement of important parameters before and after the layout optimization.
1. Introduction
The layout of a ship cabin is subject to the Facility Layout Problem (FLP), an NP-hard problem in mathematics that has high complexity in modeling and calculation [1]. The focus of the early foreign research on equipment layout problems lies in the mathematical analysis method of logistics sequence and material flow between equipment; until 1961, Systematic Layout Planning (SLP) was proposed by Richard Muther. Since then, with the discussion of the device layout problem by scholars, the layout problem has been applied in various industries and innovated in research and solution methods. Because there are many constraints and objectives to be considered in the equipment layout problem, fuzzy theory and optimization algorithms are usually the important methods to solve the layout problem [2,3,4]. In the layout of cabin equipment, in addition to solving the layout problems between the equipment, it is also necessary to fully consider the human-machine relationship issues in the layout design process [5].
At the same time, statistics show that the main reason for equipment damage in a cabin is the lack of fuel, installation, maintenance and other problems caused by human error or negligence [6]. The performance standard of people in the cabin can be evaluated by human reliability. If people are in a certain environment and their reliability is higher, human errors or negligence can be avoided. At the same time, the maintenance method of the equipment in the cabin can also be evaluated by the human reliability method, and if the human reliability is higher in a certain maintenance method system, it proves that this maintenance system is more suitable for the current environment [7].
There are many methods to evaluate human reliability problems, and choosing a good method can greatly help to solve the problem. Regarding the problem of choosing a suitable method, the Analytic Hierarchy Process (AHC) is a possible method [8,9]. However, the existing HRA methods are also not applicable to all task scenarios, they should be improved and extended according to different task scenarios and the correctness of the proposed new methods should be proved with actual cases [10]. The improvement of the method is usually to solve the error problem. The error problem can be solved from the error generation conditions and error influencing factors so as to make the evaluation method more suitable for the problem to be solved [11,12]. The main existing human reliability methods and the evaluation of each method are shown in Table 1.

Table 1.
Human reliability analysis (HRA) methods.
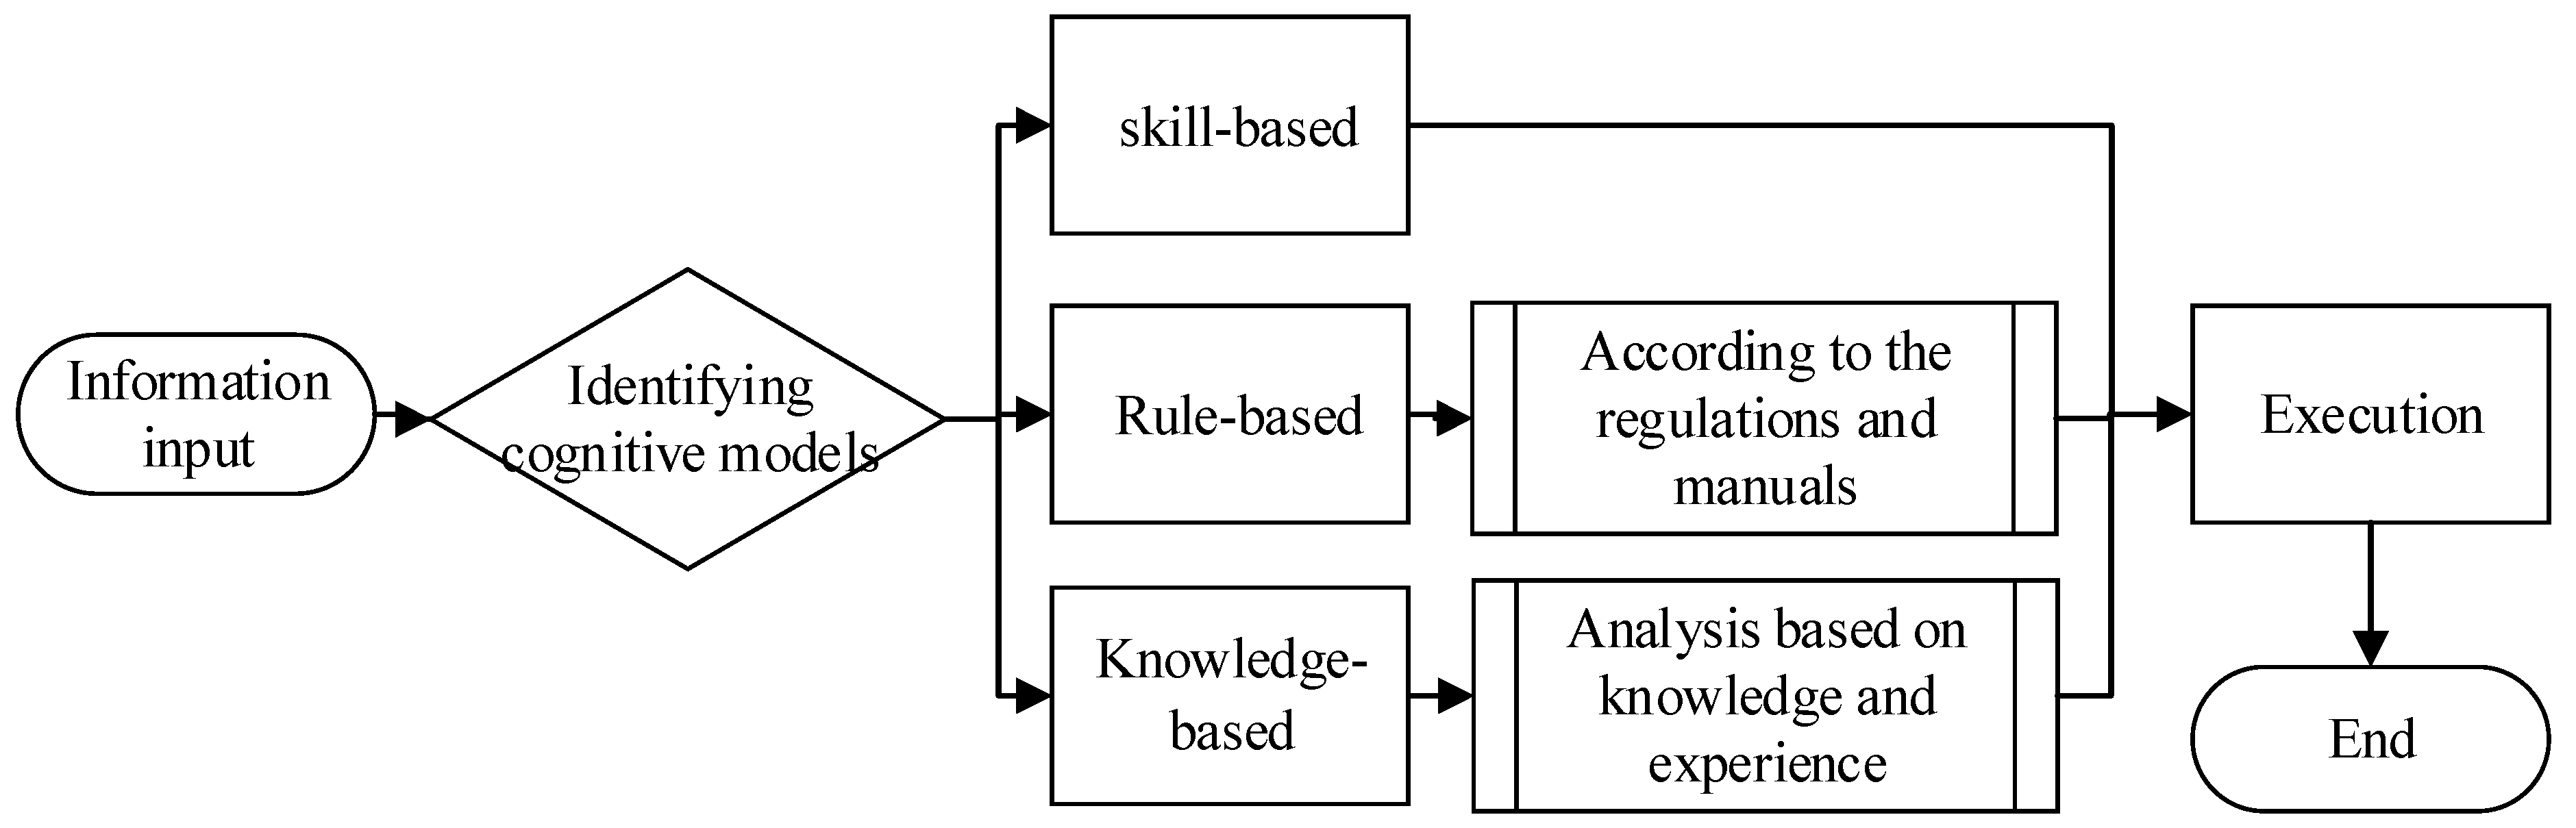
From the above analysis, we can get two methods, HCR and CREAM, which are more suitable for solving the problem of equipment layout in the cabin. The Human Cognitive Reliability (HCR) model is a more commonly used quantitative analysis method in HRA. The method uses fewer Performance Shaping Factors (PSFs) and is based on cognitive psychology, focusing on the dynamic cognitive process of humans in a certain period of time. It includes observation, analysis, planning and execution, etc. [13]. The calculation of the HCR method relies on the Weibull distribution formula of three parameters. The values of the three parameters α, β and γ can be determined according to the type of cognitive behavior. Cognitive behavior includes skill-based, rule-based and knowledge-based [14]. The discrimination of the three cognitive behaviors depends on the person’s knowledge of the task. A flow chart of the three cognitive behaviors is shown in Figure 1.
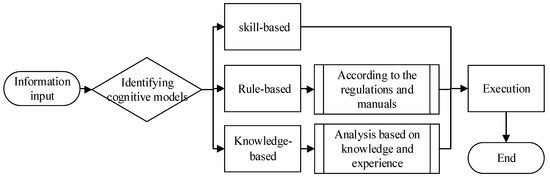
Figure 1.
A flowchart of cognitive behavior.
Apart from the difference in cognitive behavior, the influence of PSFs between personnel cannot be ignored. In HCR, the execution time () in the three-parameter Weibull distribution formula was corrected. Three correction factors were selected in the model, namely operating experience (), psychological pressure () and man-machine interface (), to reduce the error of execution time () caused by attributes.
Cognitive Reliability and Error Analysis Method (CREAM) is the second generation of more typical analysis methods among HRA. CREAM’s cognitive model relies on the Contextual Control Model (COCOM). In COCOM, the cognitive function is divided into four parts: observation, interpretation, planning and execution. The control mode is divided into four modes: scrambled control, opportunistic control, tactical control and strategic control. The basic method of CREAM predictive analysis can obtain the range of the probability of human error but cannot obtain the exact value. However, its extension method assigns or adds weights to certain parameters on this basis to obtain accurate human error values [15,16].
There are two extension methods, one of which adds weights to the control model and then corrects the values of the cognitive functions. The other is to derive a new table combining the cognitive function score table and the Common Performance Conditions (CPC) table, and then the weight of cognitive function that corresponds to the CPC factor corrects the cognitive function value [17]. Both methods split the task into several subtasks and determine what type of cognitive function failure it is, from which the corresponding cognitive function failure probability is derived. Then, they correct the values of cognitive function failure through their own methods to obtain accurate human reliability values. Of the two methods, the first method is efficient but accuracy will be somewhat lacking; the second method is more accurate but more time-consuming.
The difference between the two methods is the method of correction for cognitive functions, and the similarity is that both have to find the specific value of cognitive function first. In COCOM, the values of the four cognitive function parts are clearly defined in CREAM. However, to determine a specific value, it needs to be combined with the type of task. The failure probability of the whole task can be determined by the failure probability of each subtask.
The abundant PSFs in CREAM make the factors considered in the calculation of HRA more comprehensive. Its advantage is exactly what the HCR method lacks, but the HCR method is more suitable for the model environment of the cabin equipment. According to the discussion of CREAM, the use of common performance conditions is similar to the theoretical thinking that the PSFs are assigned weights and then calculated in the traditional HEART method. Using this theoretical idea for reference, the paper will effectively combine CPCs and HCR methods to obtain a new human reliability analysis method that is more suitable for the layout of the equipment in the cabin [18]. Based on this method, the objective function and constraints for solving equipment layout in the cabin are constructed by combining the basic requirements of cabin layout, so that an equipment layout with full consideration of human reliability can be derived. The article concludes with an application example to verify the effectiveness of the proposed method.
2. Methodology—Improvement of HRA Method
To obtain a HRA method suitable for the cabin environment, the existing HRA method needs to be improved. The improvement of the HRA starts from the correction factor. The crew in the cabin must follow the work process and record in time when working. Therefore, the inspection and maintenance operations in the cabin are defined as rule-based. According to the three-parameter rule in the HCR method, the available values are shown in Table 2.
Table 2.
The number of .
In the HCR method, three correction coefficients () are used to correct the execution time . Considering that HCR is to be used jointly with CREAM, and the 9 factors in CPCs are collectively referred to as correction factors and are jointly analyzed as PSFs.
The cognitive model in the cabin environment follows the COCOM model in CREAM. On the one hand, the reason is that the supporting use of the COCOM model and CREAM is relatively mature and has good compatibility; on the other hand, the reason is that the process of maintenance task in the cabin conforms to the setting of the COCOM model.
According to the basic principles and methods of the cabin layout and combined with the crew’s tasks, [19,20] the cabin environment PSFs were proposed, and corresponding to the correction factors in HCR and CREAM, the relationship table between CPCs and PSFs in the cabin environment was obtained. The adequacy of human-machine interface and operational support and adequacy of training and preparation in the CPCs table of CREAM are similar to the meaning of MMI and operating experience () in HCR. Additionally, the CPC factors, as a correction coefficient, are used in conjunction with the HCR method, and the CPC factors do not affect each other. Therefore, after considering the PSFs of the cabin environment, the CPC factors’ influence weight table for cognitive function is adjusted, as shown in Table 3. The relationship between the correction factors in the HCR method and the PSFs of the cabin environment is shown in Table 4. The improved correction factor more comprehensively analyzes the behavior formation factors in the cabin environment and provides detailed theoretical support for human reliability analysis.
Table 3.
CPCs and PSFs for cabin environment.
Table 4.
HCR method correction factors with PSFs of cabin environment.
The maintenance task in the cabin can be described as judging whether the equipment in the cabin is in normal working condition within a certain period of time. The maintenance process is usually to observe the instruments of each equipment and check for abnormal sounds and oil leakage. There is usually a defined maintenance path in the cabin and both sides of this path cover as much of the equipment in the cabin as possible. When people perform maintenance on each device along the maintenance path, the reliability of the human will change according to the time required to complete the entire task and the environmental impact factors of the cabin.
Based on the overhaul tasks in the cabin and the above analysis of the improvement of the correction factor, the formula for calculating the probability of human-caused errors based on the cabin layout was proposed:
where is the behavior type parameter, t is task-allowed execution time, is task execution time and C is correction factor.
The values of were determined according to Table 2. The value of t varies according to different types of ship models, and the specific value is determined by the average time of inspection tasks for ship cabins and similar types of cabins designed by the research institute. The value of was corrected according to Formula (2).
Through the above analysis of HCR and CREAM, the modification of the HCR parameters only needs to modify the execution time (), and the correction method is to consider the influence of human state and surrounding environment on human reliability and to quantify the influence factor. However, the CPCs are used in CREAM as a correction to CFP, so it was proposed to logically calculate the weights corresponding to the cabin environment PSFs in Table 3 to derive the correction coefficient C. C was then used to make a more comprehensive correction to the cabin environment for the execution time () in the HCR method. The determination of the correction coefficient C is based on the following two reasons.
- (1)
- Methodology—The correction coefficient processing method in the classic human reliability calculation HEART method is used for reference.
- (2)
- The cabin environment—The possible cognitive function failures of each device in the cabin are different, and the evaluation of the PSFs in the method needs to be conducted according to the environment and task flow of the entire cabin.
Therefore, we took the maximum value of the four cognitive function products corresponding to each correction factor evaluation level in Table 3 as the correction coefficient C. The formula for the correction coefficient C is shown below.
where j is the serial numbers in the CPCs weights and PSFs table of the engine room environment, i is the 4 cognitive functions of the COCOM and is weights of factors for different levels of CPCs.
For the PSFs of cabin environments in different ships, the factor levels that can be determined in Table 3 and Table 4 are different. The specific ship cabin factor level is determined by the relevant experts or the ship’s cabin crew scoring the factors in the two tables. See Appendix A.
3. Optimizing Engine Room Layout
3.1. Optimization Model of Equipment Layout in Engine Room
In addition to the equipment in the cabin, there are numerous pipelines, which are simplified and assumed as follows in order to better solve the problem of equipment layout optimization.
- (1)
- The main consideration in the study is the equipment that has a large impact on the layout of the cabin, without considering pipes, lines, wall hangings, etc.
- (2)
- Simplify complex shaped devices or modular devices into appropriate enveloping cubes.
- (3)
- The three-dimensional equipment in the cabin is reduced to a two-dimensional layout problem in the deck plane by the projection method.
- (4)
- The basic equipment such as the diesel engine and gearbox in the cabin is assumed to be fixed equipment.
- (5)
- The parameters of the questionnaire are needed in the HRA to be calculated as known data.
Then, we defined the layout space S in the cabin.
where D is the length of the cabin in the x-axis direction and H is the length of the cabin in the y-axis direction.
The equipment in the cabin is all simplified as a cuboid, and the sides of the cuboid are parallel to the x-axis and y-axis, respectively. When analyzing the layout of the device, the simplified rectangular parallelepiped of the device can only be translated or rotated by 90°. The shape of the device can be defined as follows.
where is the length of equipment, is the width of the device, n is number of equipment, is the length of the device in the x-axis direction, is the length of the device in the y-axis direction, is the coefficient for determining the direction, the value is 0 or 1 and is a collection of the number of devices.
The device () in the value range S can be expressed as:
where is centroid coordinates of device i.
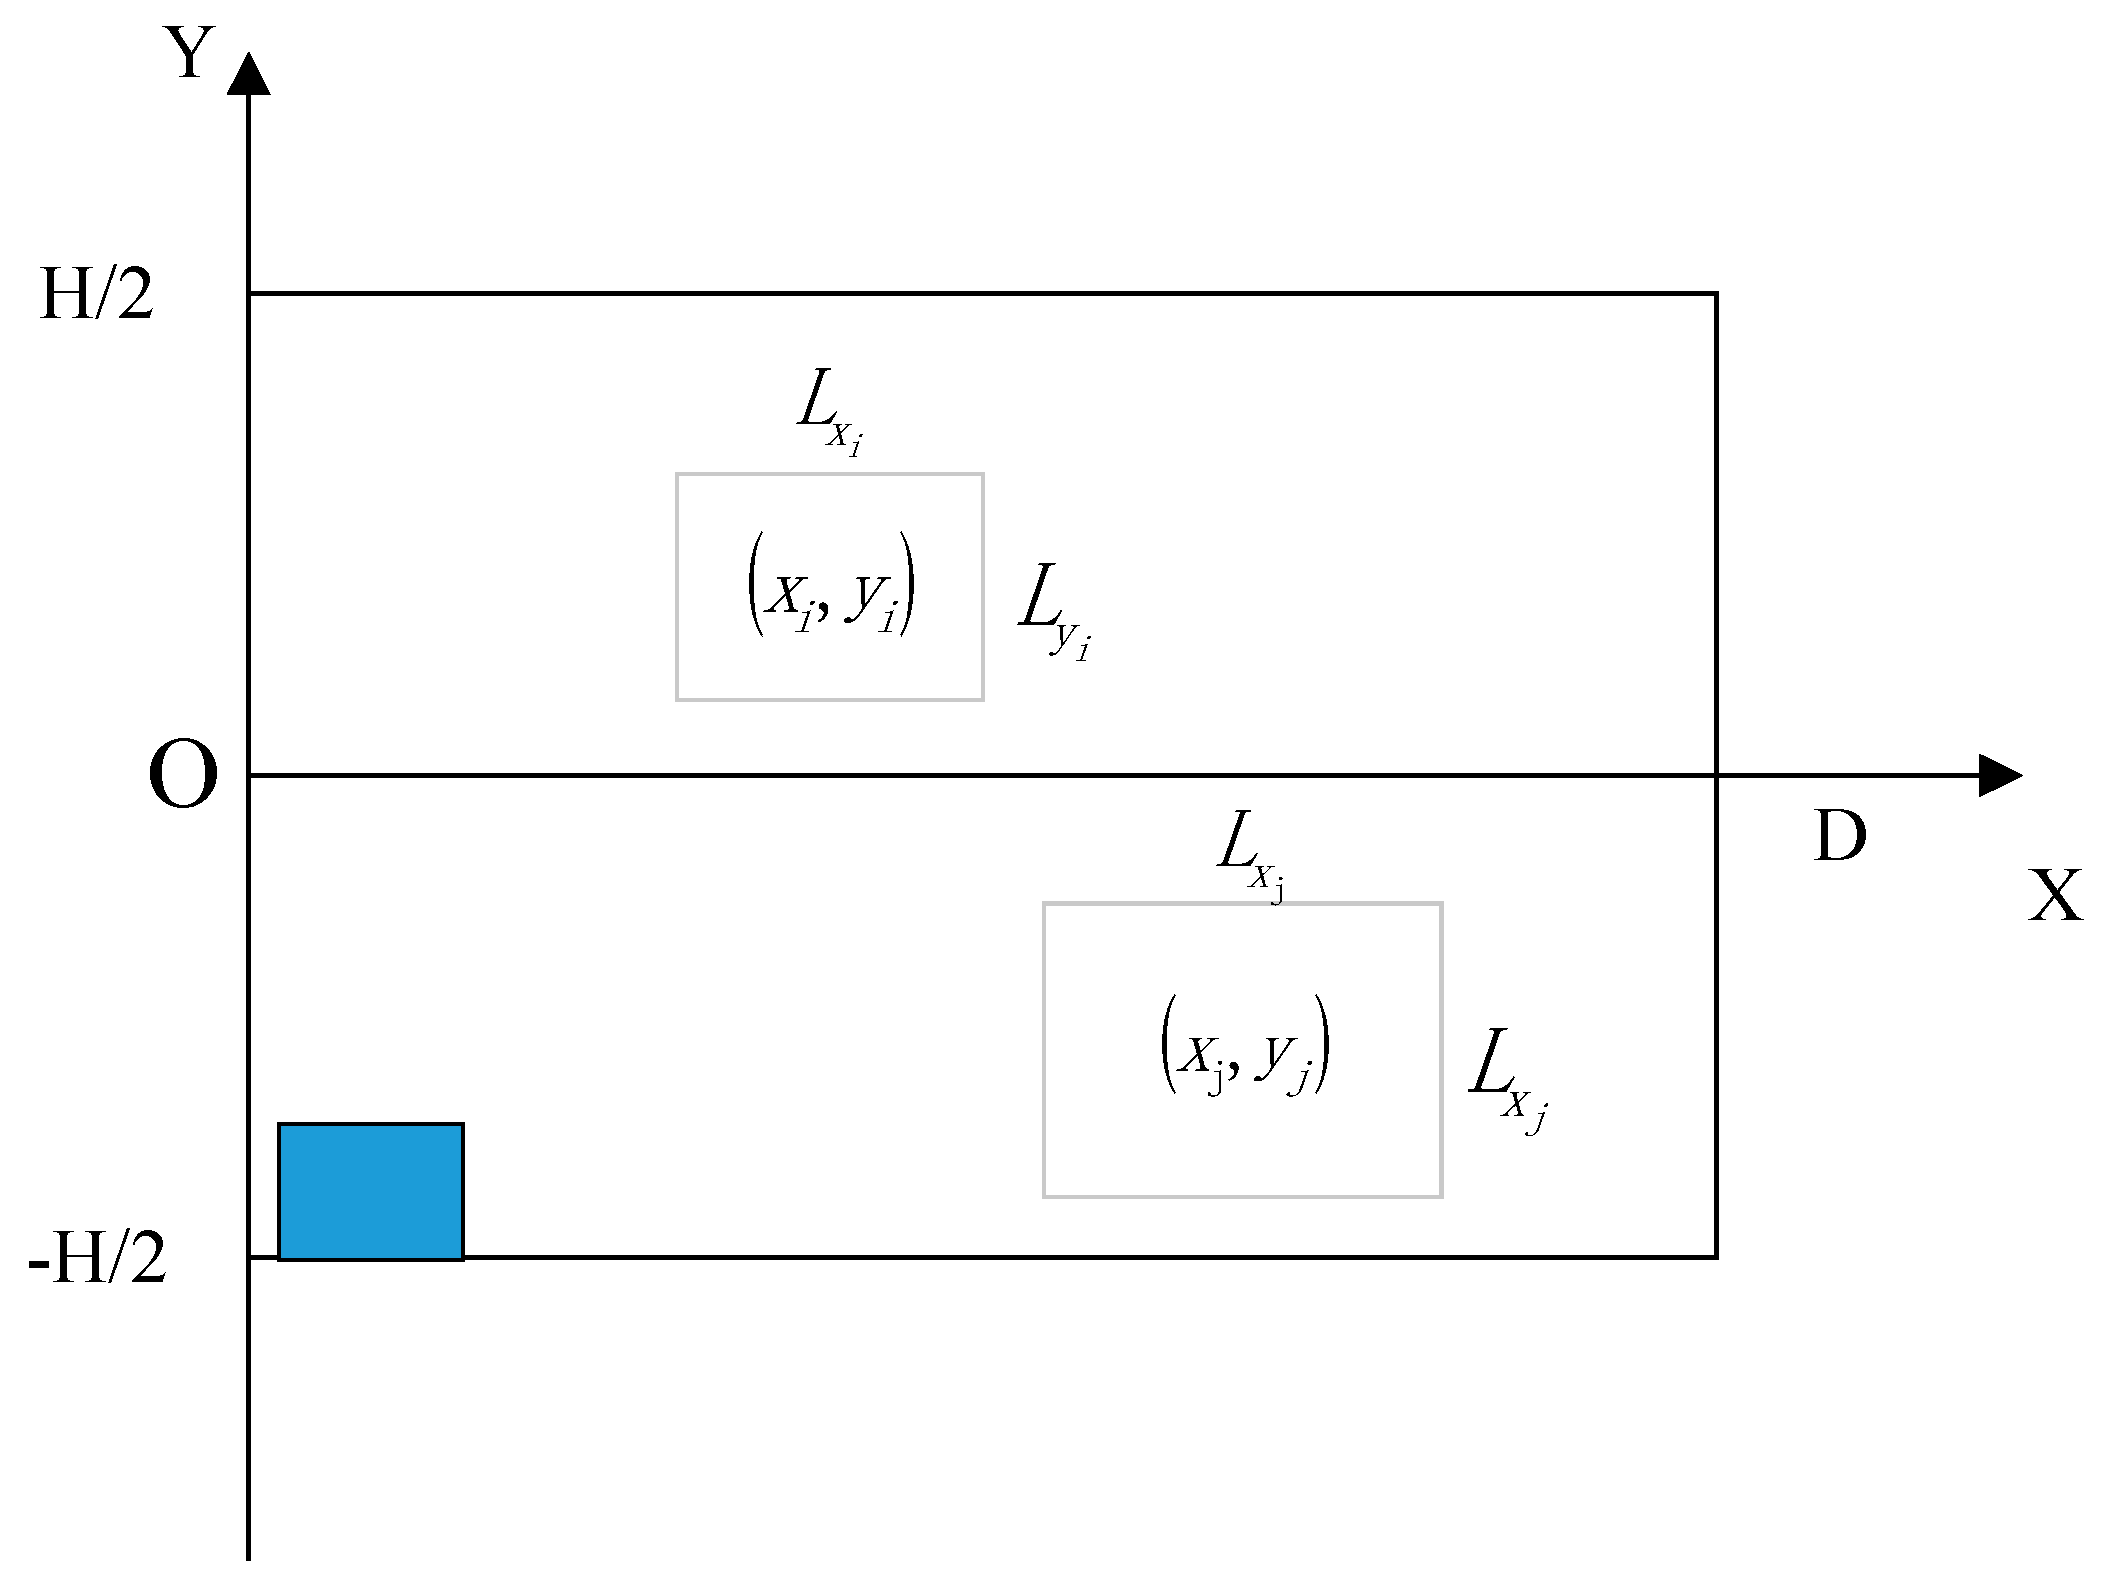
According to the above description, the schematic diagram of the cabin space and equipment is shown in Figure 2.
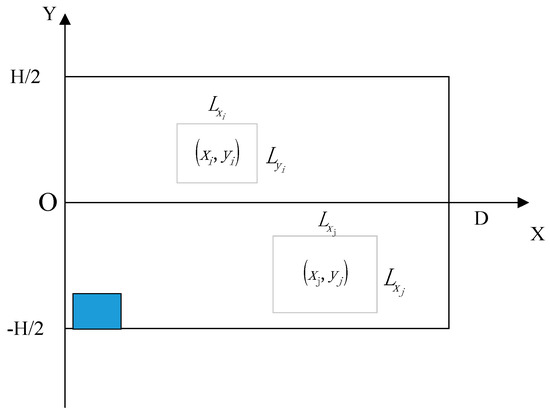
Figure 2.
Diagram of cabin equipment.
Among them, the value of is not the simple envelope value of the equipment, but also considers the value of the maintenance space. MSC.158 (78) in SOLAS stipulates that the ship inspection and repair channel should be greater than 600 mm. In order to meet the principal provisions as well as the working space required by the human, on the basis of the actual size of the equipment, it is necessary to increase the length and width of simplified devices by 390 mm, which is the standard mannequin P90 half-hand function extension size after rounding. In addition, the entrance and exit are special equipment. The doorway must be able to pass normally, and there must be enough space for the maintenance of surrounding equipment. Therefore, the door was defined as a special fixed device with a length and width of 780 mm, as shown in the lower-left corner of the schematic diagram.
- Objective Functions
- (1)
- Human Reliability
The human error rate has a vital impact on the smooth operation of the cabin. Therefore, the human error rate function was considered one of the objective functions to reflect human reliability. The smaller the value, the better.
where C is as described in Formula (3); the correction method of is as described in (2), is the basic inspection time of the cabin crew, which can be defined according to the inspection path.
where is the average inspection time per device and v is the average walking speed of the inspectors.
is the shortest distance for maintenance personnel from the entrance to the inspection of each piece of equipment and back to the entrance; the value is obtained by path planning, and the specific solution will be described in detail in the optimization algorithm design subsection.
- (2)
- Cabin balance
The equipment in the cabin is heavy and large in quantity. Therefore, the torque caused by the weight of the equipment on the ship should be fully considered in the layout. The torque formula is shown in Formula (9).
where is the mass of the equipment and g is the gravitational acceleration.
- (3)
- Relevance of the equipment
The relevance of the equipment refers to the degree of connection between the devices. The closer the connection degree, the closer the device should be placed. We then defined matrix D as the distance matrix between devices, and its expression is shown in Equation (10).
The D is the symmetric matrix, i.e., D = . when i = j, where is the distance between devices i and j, which can be expressed by Equation (11).
Another important parameter of equipment relevance is the degree of linkage between the equipment. A matrix of equipment relevance coefficients was defined, which can be represented by the matrix R.
where is the correlation coefficient of the devices i and j, and ; when i = j, = 1, since will lead to the duplication of the definition of the degree of connection in the calculation process. Equation (12) is transformed into the upper triangular matrix as shown in Equation (13).
where the values of range from , and the stronger the correlation, the larger the value should be.
In summary, the correlation of the device can be calculated and solved by the matrix D and R, as shown in Equation (14), and it can be seen from the question asked that the value of device correlation is as small as possible.
- 2.
- Restrictions
In addition to satisfying the above-mentioned objective function, the final layout plan of the cabin equipment is also subject to some constraints.
- (1)
- No interference between equipment
Non-interference between the equipment ensures the location between the equipment and leaves enough space for maintenance. The constraints expressed in terms of equipment and are as follows.
- (2)
- The equipment needs to be arranged within the allowable range of the cabin
The equipment should all be arranged within an acceptable cabin range, and no interference with the engine room wall is allowed. The specific restrictions are as follows.
- (3)
- The equipment’s own function limitation
Certain equipment in the cabin can only be positioned in a certain area according to functional restrictions. For example, the main engine of a single-engine ship is only allowed to be positioned on the central axis, etc.
where is considering the constraints of equipment functional requirements and knowledge of the cabin layout.
According to the rules of cabin compartment equipment layout, design experience and the human reliability requirements proposed in this paper, the objective function and constraints are determined and the mathematical model of the layout optimization design of the cabin is established as follows.
3.2. Optimal Solution of Engine Room Equipment Layout Based on Genetic Algorithm
3.2.1. Solution to Optimization Model of Engine Room Equipment Layout
In genetic algorithms (GA), the fitness function is a more important indicator; that is, the fitness function is used to evaluate the merit of the calculation results. The fitness function of the basic GA is usually a simple transformation of the objective function, and it is known from the mathematical modeling part that the cabin equipment layout problem is a multi-objective optimization problem [21,22]. This paper uses the weight coefficient transformation method to determine the Pareto solution, which is calculated as shown in Equation (20).
where is the sub-objective function and is the weight of the i-th sub-goal.
The three objectives of the cabin equipment layout problem are human factor reliability, cabin balance and equipment relevance. According to Equation (20), the first thing to determine is the weights of their three, and the weights can be determined by the analytic hierarchy process (AHC) [23]. The three elements discussed in this paper, and , are constructed by selecting the scale values from the rules in the AHC and constructing the judgment matrix A.
From A, we can get its eigenvalue λ = 3.0092 and the eigenvector .
To judge whether the structure of matrix A is reasonable, it is necessary to judge whether A can pass the consistency test. The consistency test must first determine the consistency index, and the formula for calculating the consistency index is shown below.
The magnitude of the consistency index is measured by the consistency ratio, which is shown in Equation (23).
where RI is the random consistency index; the value was selected from Table 5.
Table 5.
Random consistency index (RI).
It is generally believed that when CR < 0.1, the structure of the judgment matrix is reasonable, and its eigenvectors can be used as element weights after normalization. The element weights (W) are as follows.
The weights of the three objectives of the cabin equipment layout problem, human factor reliability, cabin balance and equipment relevance, are 0.5396, 0.2969 and 0.1634, respectively.
Then, the multi-objective optimization problem was transformed into an objective function, according to Equation (20) as in Equation (24).
The evaluation function in the GA can be obtained according to the objective function and the relationship between the objective function and the evaluation function, as shown in Equation (25).
In the formula, and are as shown in Formulas (7), (9) and (14); the constraint conditions are as shown in Formulas (15)–(17).
In genetic algorithms, both the fitness function and the determination of control parameters are important components. The control parameters include the binary code length, crossover probability () and variation probability (), etc. The binary code length (k) is limited by Equation (26).
where is the value of variable interval and d is the required accuracy.
The controls how often the crossover operation is used. Too high a will lead to the destruction of goodness in the population, and too small a probability will lead to an insufficiently comprehensive search so that the results fall into a local optimum and its value will generally fit within the recommended value. The effect of on the population is essentially similar to that of , but contributes mainly to preventing the generation of local optimal solutions. is also too large or too small and cannot produce more desirable results; usually, its value will generally be in line with the recommended range of values.
In addition, there are selection operators in the algorithm, and the roulette wheel selection method is one of the more commonly used methods of selection operators and can meet the needs of the problem. The population size (N) in the control parameter is similar to the nature of , and the value taken will generally be within the recommended range. A population size that is too small will easily produce a local optimal solution; the opposite will lead to a larger computational effort and lower efficiency.
3.2.2. Solving Cabin Environment Path Planning Based on Visibility Graph
The problem is that is a non-deterministic polynomial (NP) in a mathematical model. It is necessary to construct an environmental model and use an intelligent algorithm to find the optimal path to determine . In addition, path planning is also an important reference basis for determining the maintenance access in the optimized layout.
The simplified device model in this paper is a quadrilateral, and the device was considered an obstacle. Therefore, the more suitable visibility graph algorithm was chosen as the method to construct the environment model. The modeling environment expressed by the visibility graph algorithm is two-dimensional, connecting the starting point S, the vertices of the obstacle and the target point G, and ensuring that all connecting lines do not cross the obstacle. The diagram composed of all elements is called viewable [24,25].
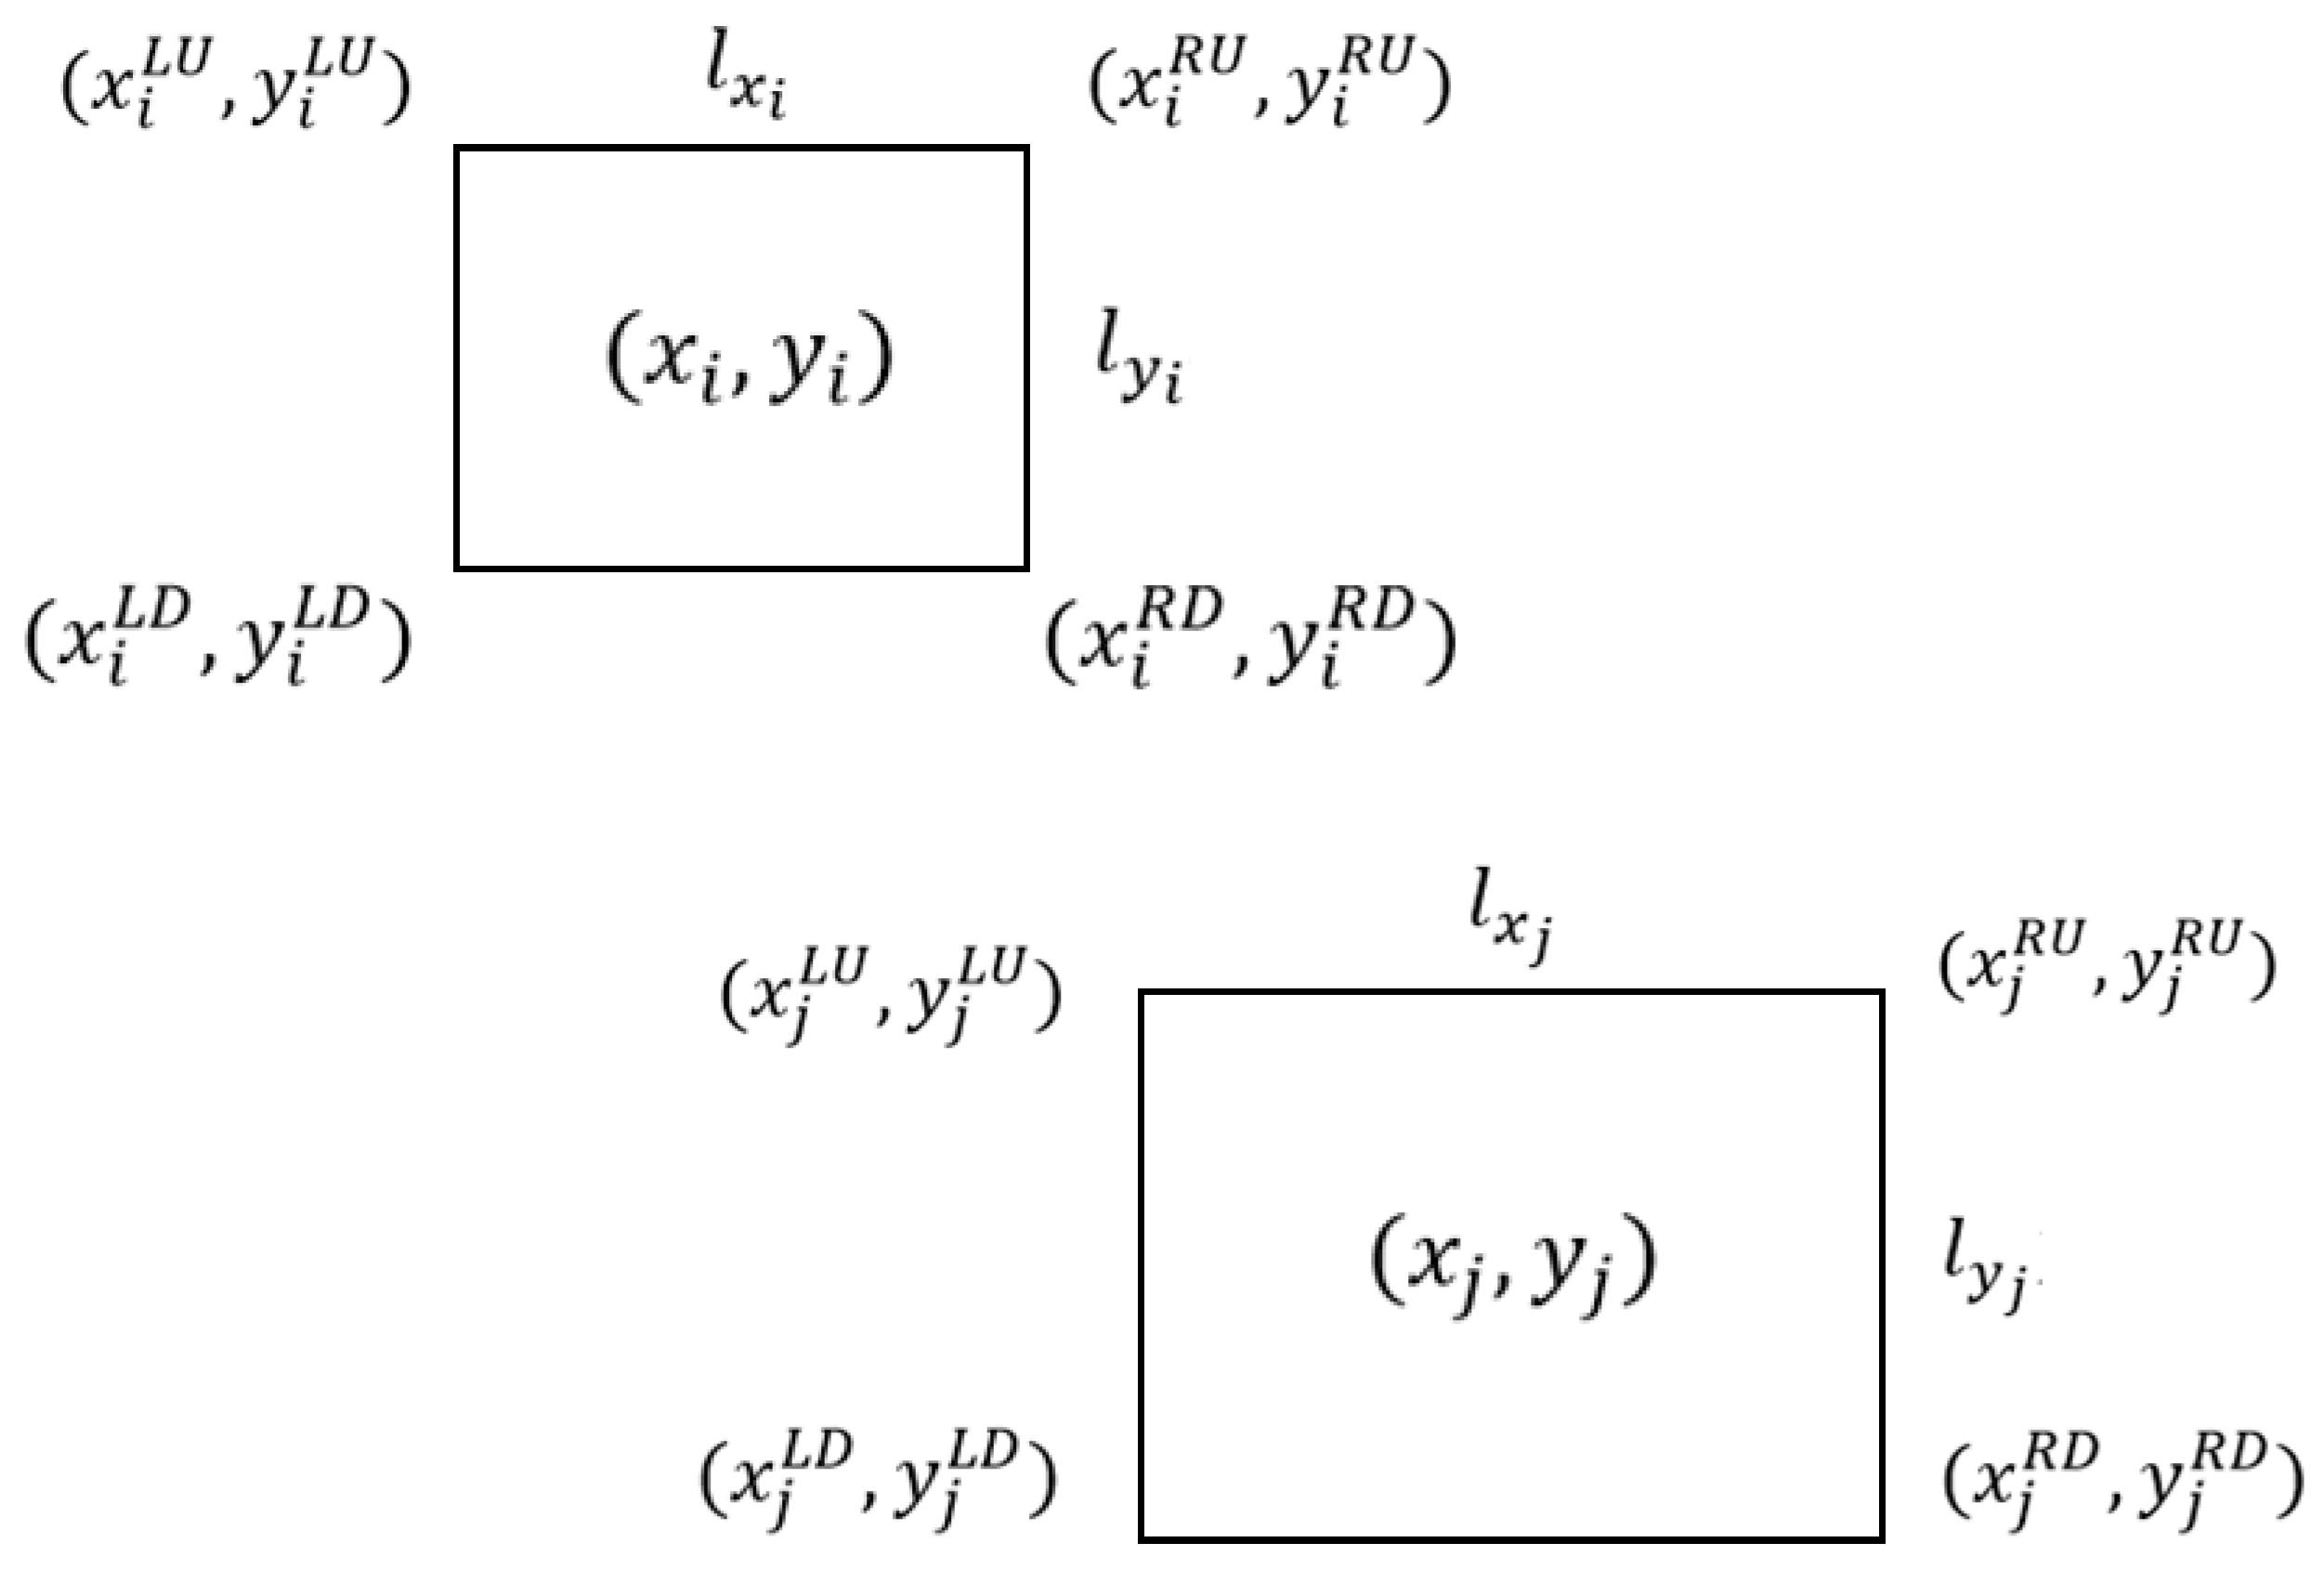
The maintenance and overhaul path in the cabin requires entering from the entrance and exit of the cabin and finally back to the entrance and exit, and the path needs to pass through every device. However, the viewable lines of the optimal path in the viewable view do not necessarily intersect with every device, so the cabin devices are redefined here as in Figure 3, where all parameters are used only when solving for the optimal path.
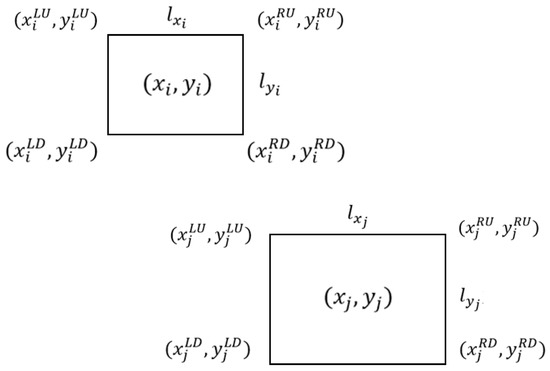
Figure 3.
Schematic diagram of equipment coordinate parameters.
Where is the center coordinates of devices i and j; and are the x-axis direction length and y-axis direction width of the device envelope; and and are the upper-left, upper-right, lower-left and lower-right coordinates of device i, respectively, which are related to the center coordinates , as shown in Equations (27)–(30).
The coordinates of the upper-left corner, upper-right corner, lower-left corner and lower-right corner of device j are the same as those of device i. Then, the shortest path of the two devices can be obtained by comparing the length of the viewable line/The shortest path is the one with the smallest total length . The shortest path from device i to j in the schematic diagram can be expressed by Equation (31).
The path planning requirements in the cabin must pass through each device. According to the nature of the problem to be solved, it can be judged as a Travel Merchant Problem (TSP). TSP means that the coordinates of each city are known and the traveler is required to visit each city once and eventually return to the city of departure. The overview diagram for solving the shortest path in this process is shown in Figure 4, and the results need to be found with the help of programming [26,27].
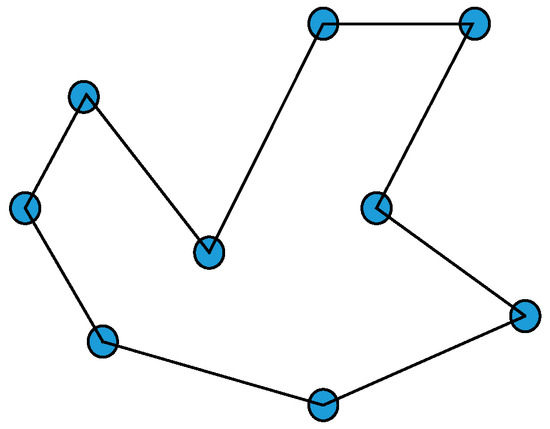
Figure 4.
Schematic of TSP.
The problem to be solved is different from the traditional TSP. In cabin path planning, the environment is modeled using the visual graph method, and each device will have four vertex coordinates. There will be 4 n + 1 coordinate points in the cabin layout plan, where n is the number of devices and 1 is the departure point. Any two equipment barriers with visible lines are considered separately as sub-views, and the path of the entire cabin is planned as a collection of all subsets.
The nature of the cabin equipment layout optimization problem shows that only one of the four vertex coordinates of each device can be used. When using the intelligent algorithm to search the path, in addition to the coordinates used, the other three coordinates on the one device are not in the range of subsequent path search vertices. It follows that the coordinates of device i in the path between devices i and j can be considered as known and obtain the expression for the path .
where k is the C Standard of the viewable point among the four vertices on the device j and the values 1, 2,⋯, Vn correspond to the visible parts of the above-defined LU, LD, RU and RD. Vn is the number of visible points of the visible line on the device j.
According to the above discussion, the cabin path planning problem can be categorized as a special TSP problem. In this paper, GA was used in the layout optimization model design stage, and GA has certain advantages in solving the TSP problem; therefore, it was also chosen as the solution algorithm in this path planning problem.
The ultimate goal of the cabin environment path planning problem is to find a path where the distance of the path is the shortest, that is, to find in the mathematical model of cabin layout optimization. According to the analysis in the environmental modeling process, solving the TSP problem is key, and the mathematical model is now established according to the TSP problem-solving ideas.
The viewable view G = (V, E), V is the vertex set, E is the edge set and the distance of each vertex. Assuming that
We derived the shortest path objective function.
where n is the number of viewable coordinate vertices in the set.
According to the relationship between the evaluation function and the objective function, the evaluation function can be obtained as shown in Equation (36).
4. Results and Discussion
4.1. Application
The main engine compartment of this vessel is divided into the diesel cabin and the auxiliary machine cabin. The diesel cabin has less equipment, except for the propulsion diesel engine and generator, so the layout optimization is not very representative. Therefore, this paper selected the auxiliary machine cabin with more equipment for layout optimization analysis and verification. The length of the auxiliary machine cabin is 7000 mm and the width is 8400 mm, where the name, size and weight of the equipment are shown in Table 6, where the double weight is arranged for two identical devices together. Their relative positions are determined according to the original layout, and the length and width in the table are also the overall length and width of the two devices. Eventually, we considered the two devices as one device.
Table 6.
Parameters of equipment name, size and weight in the cabin.
For the convenience of the person being tested, the range of correlation coefficients for each device is . In order to facilitate the evaluation of correlations for each device, the range of values was linearly transformed according to Equation (37), and the range became .
Based on the contact information between the equipment, the determination of the correlation coefficient was made as specified in Table 7.
Table 7.
Quantitative table of equipment relevance.
Following this provision, the correlation coefficient matrix structure of the equipment in the cabin is shown in Table 8. In the example, the required overhaul time t = 300 s and the average time = 7 s for inspecting a device in special cases are taken. Then, 20 people, including wheelwrights and experts and scholars on board the ship, were asked to rate the parameters of Table 3 and Table 4, and the questionnaire was used in Appendix A. The selections were summarized after the questionnaire was completed, and the results are shown in Table 9 and Table 10.
Table 8.
Correlation coefficient matrix.
Table 9.
Questionnaire summary of CPCs factor weights.
Table 10.
Questionnaire summary of HCR correction factor.
According to the nature of the work of the equipment, the equipment can be characterized as no special location requirements, but the door is a special fixed equipment. Therefore, the data to be input are as follows: (a) The number of required position equipment and the number of other equipment () are and respectively. (b) The required inspection time t = 300 s. The cabin width D = 8400 mm. The cabin length L = 7000 mm. The average time to inspect a device = 7 s.
To facilitate the calculation of the data, the grouped data were processed in an entry format. The parameters for grouping included: the coordinates, length and width and weight of all equipment, correlation coefficient matrix, weights of CPCs and the number of correction factors.
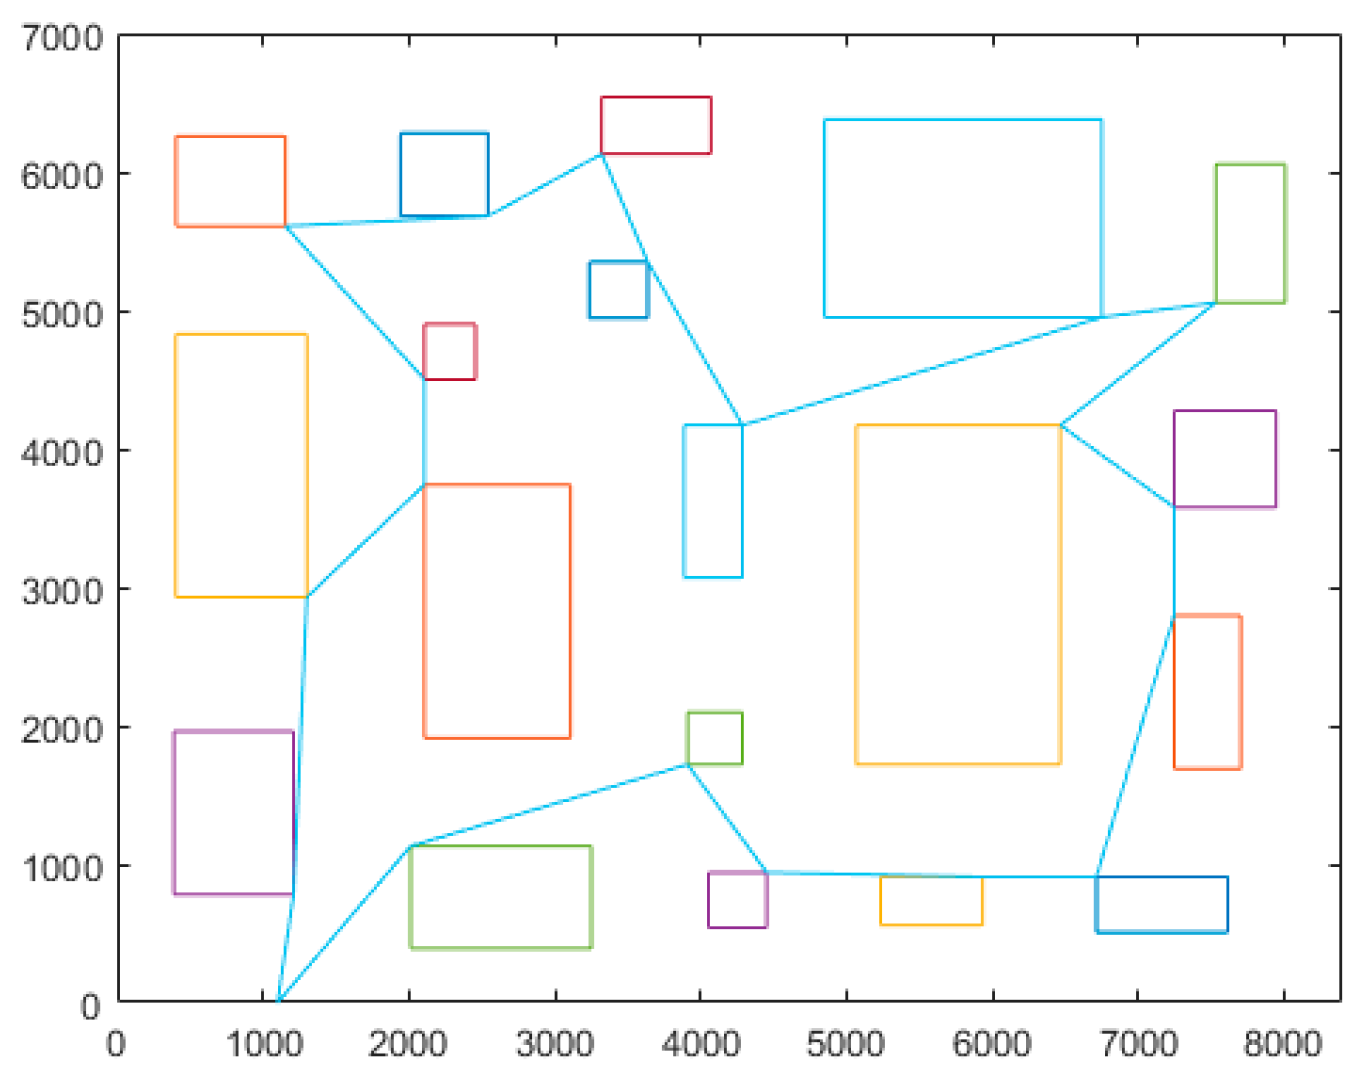
After the above analysis, the basic parameters of the ship required to solve the simulation platform were obtained, and these parameters were entered into the platform developed by applying the GA to obtain the layout optimization results as shown in Figure 5.
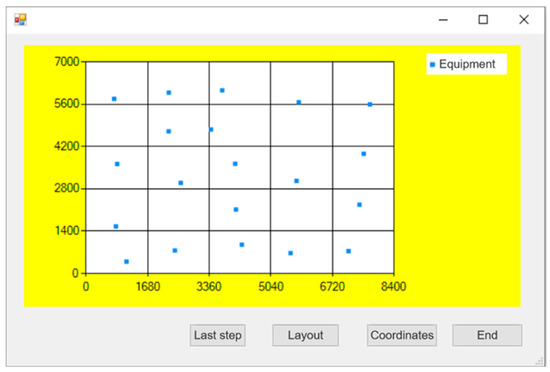
Figure 5.
Optimized layout.
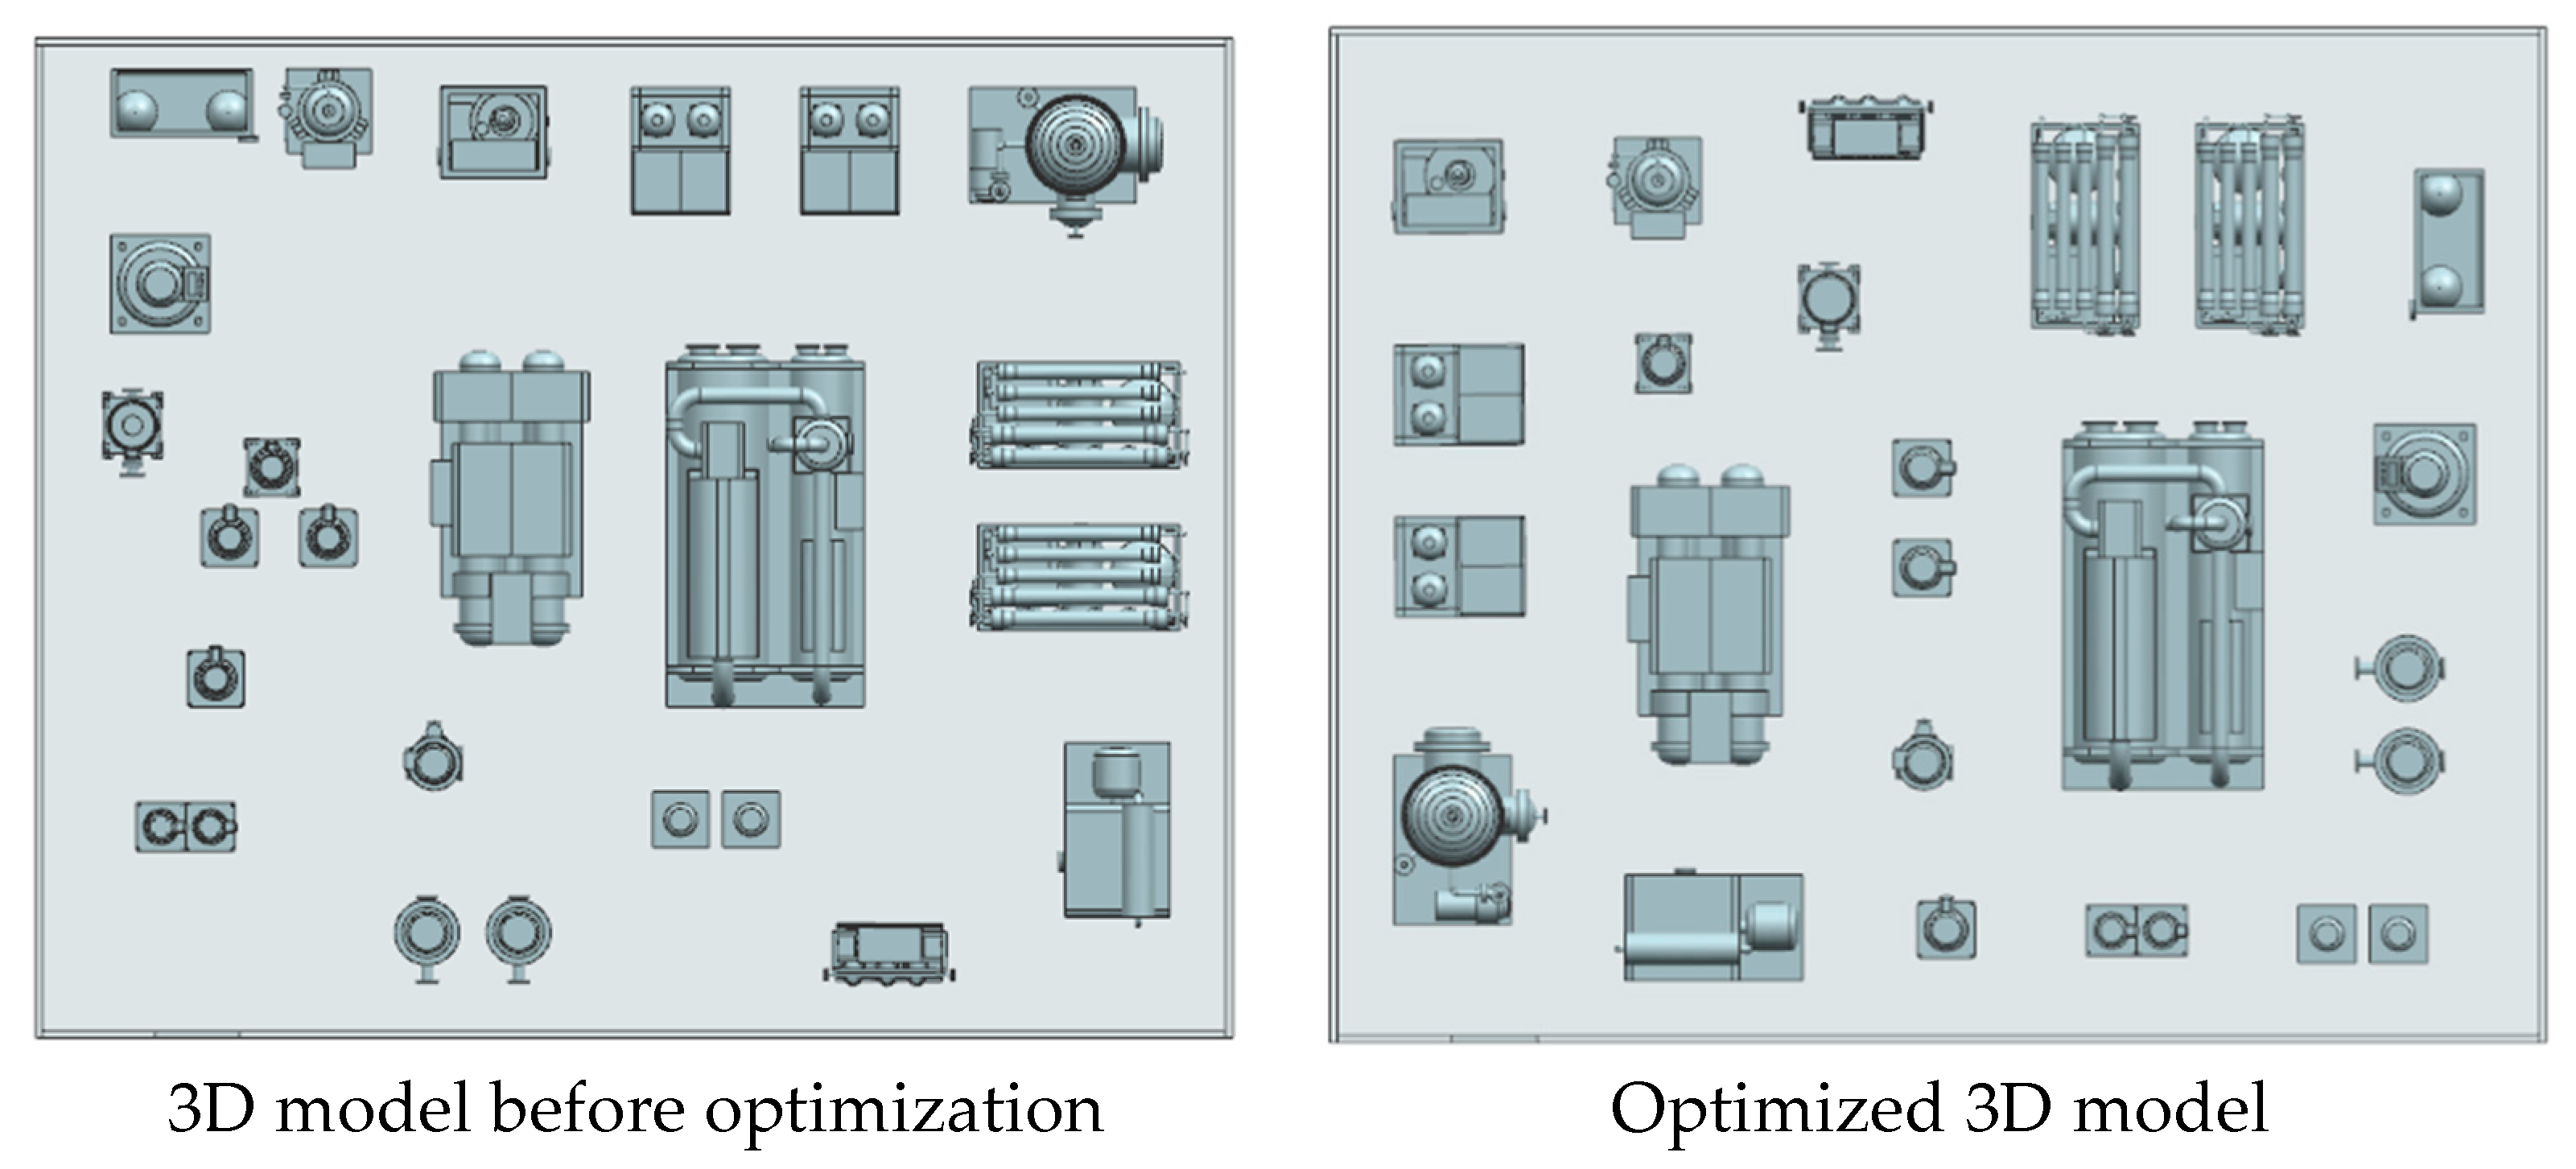
The position of each device was determined, and the actual assembly visualization model was obtained according to the optimized before and after coordinate position assembly 3D model, as shown in Figure 6.
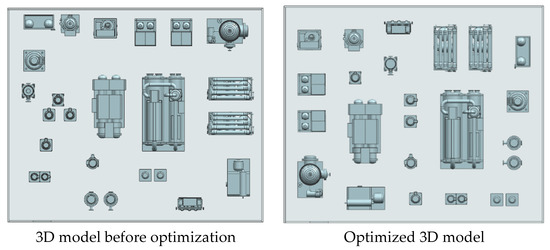
Figure 6.
3D model before and after layout optimization.
4.2. Analysis of Results
From the three-dimensional model of layout optimization before and after, it is obvious that the optimization of the passage and maintenance space was improved. Thus, the human comfort, vision range, ease of use of tools and psychological pressure will be improved, which affect human reliability. In the experiment, 20 people who are either experts, scholars or experienced workers evaluated the environment of the cabin after the layout optimization and the scoring table used in Appendix A. The scores of each factor in the table can determine a part of the parameters in the Formula (7). The optimized layout got the average score, as shown in Table 11 and Table 12.
Table 11.
Questionnaire summary of CPCs factors weights after layout optimization.
Table 12.
Questionnaire summary of HCR correction factor after layout optimization.
According to the values in Table 11 and Equation (3), we can obtain = 0.4 (human reliability correction coefficient after layout optimization); the human reliability correction coefficient before layout optimization can be calculated according to the data in Table 9 to obtain = 0.5.
Another important parameter in the process of calculation, in addition to the correction coefficient, is , which the data in Table 12 and the time of complete task can determine; however, the time needs to be determined with the help of a simulation. According to the actual maintenance process in the cabin, we know that the main point of the check is whether some equipment parameters are within a certain range, including temperature, pressure, power, voltage, current and frequency, etc. In addition, it is also important to check whether there are any running and leaking phenomena and abnormal sounds and smells in the cabin. According to the above discussion, we know that the main tasks of the simulation of the cabin crew inspection process are divided into the following two kinds.
- For non-pump equipment, the crew should go to the equipment to observe and record the meter values and check for oil leaks or abnormal noises;
- For the pump body equipment, the crew should go to the pump to observe if any oil leakage occurs and to check if the pump is running properly.
The main check paths before and after the layout optimization should be determined first. The main passage path in the layout before optimization is provided by the crew in the cabin of the ship, and the main passage path in the layout after optimization is determined by cabin environment path planning. However, what is obtained from path planning is the optimal solution of theory. Some of the paths may be omitted by human turns and other movements in practice. Therefore, the path after layout optimization should be further determined by experts who refer to the results of the path optimization algorithm.
To ensure the comparability of the experimental data during the simulation, the parameters of the time to complete the task in both the pre-optimized and post-optimized layouts were obtained from the simulation, and the flow of the task was the same. In the simulation process, for the task of observing the instrumentation, the time was set to 5 s. For the task of checking whether there was oil leakage, abnormal sound and normal operation of the pump, the time was set to 3 s.
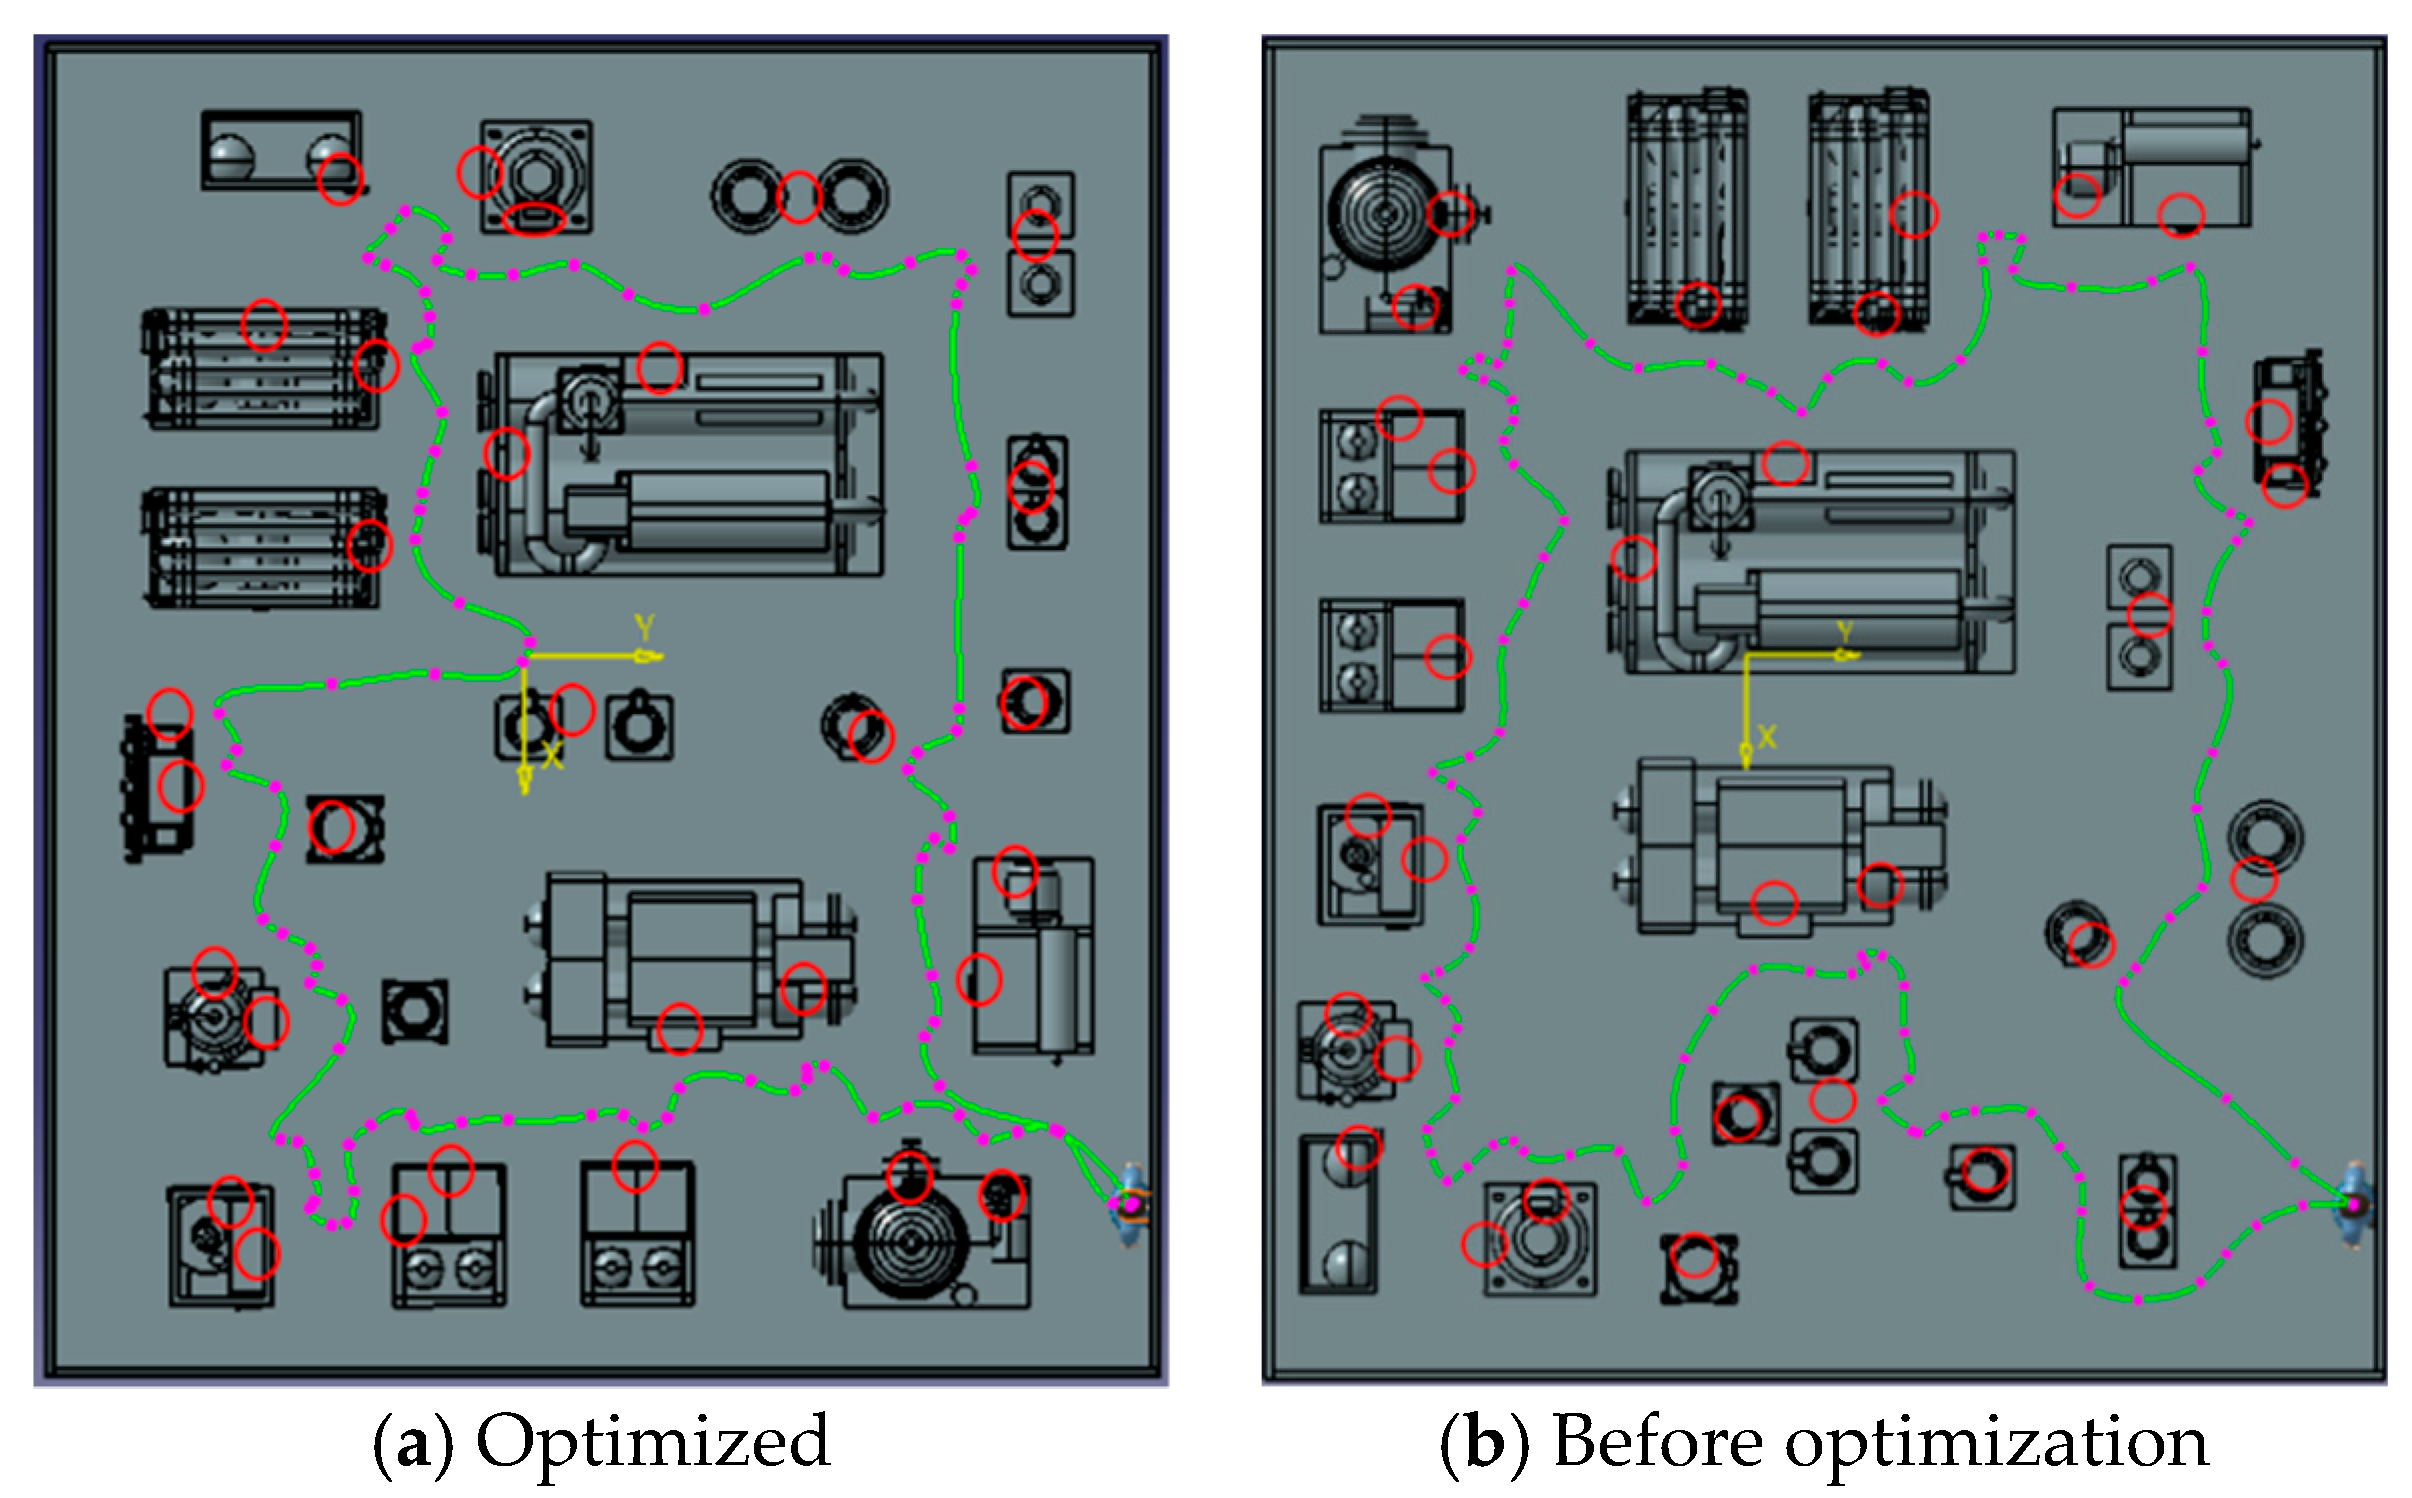
The optimal path in the optimized layout can be obtained by the path planning algorithm, and the results are shown in Figure 7. Based on the path planning results, the main paths in the actual cabin environment can be further determined by experts. The main paths and equipment inspection points are shown in the simulation Figure 8a, where the red markers are places where certain tasks need to be performed, and they are determined according to the actual requirements.
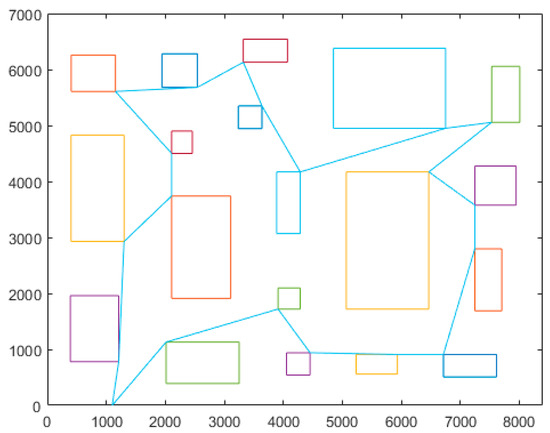
Figure 7.
Path planning results.
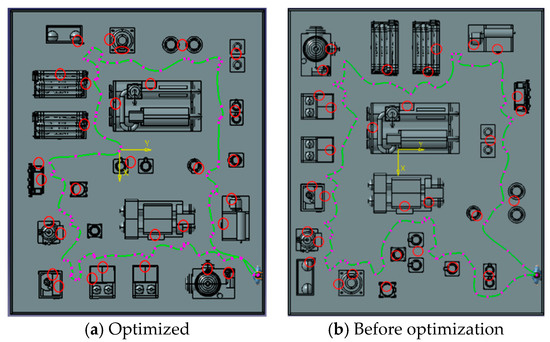
Figure 8.
Schematic diagram of the main paths and task execution points.
In the layout before optimization, the settings of the parameters are the same as those in the layout after optimization, and the device needs to execute the task at the same place as the optimized layout. However, the main path was determined by the actual situation. The main path and task execution points are shown in Figure 8b.
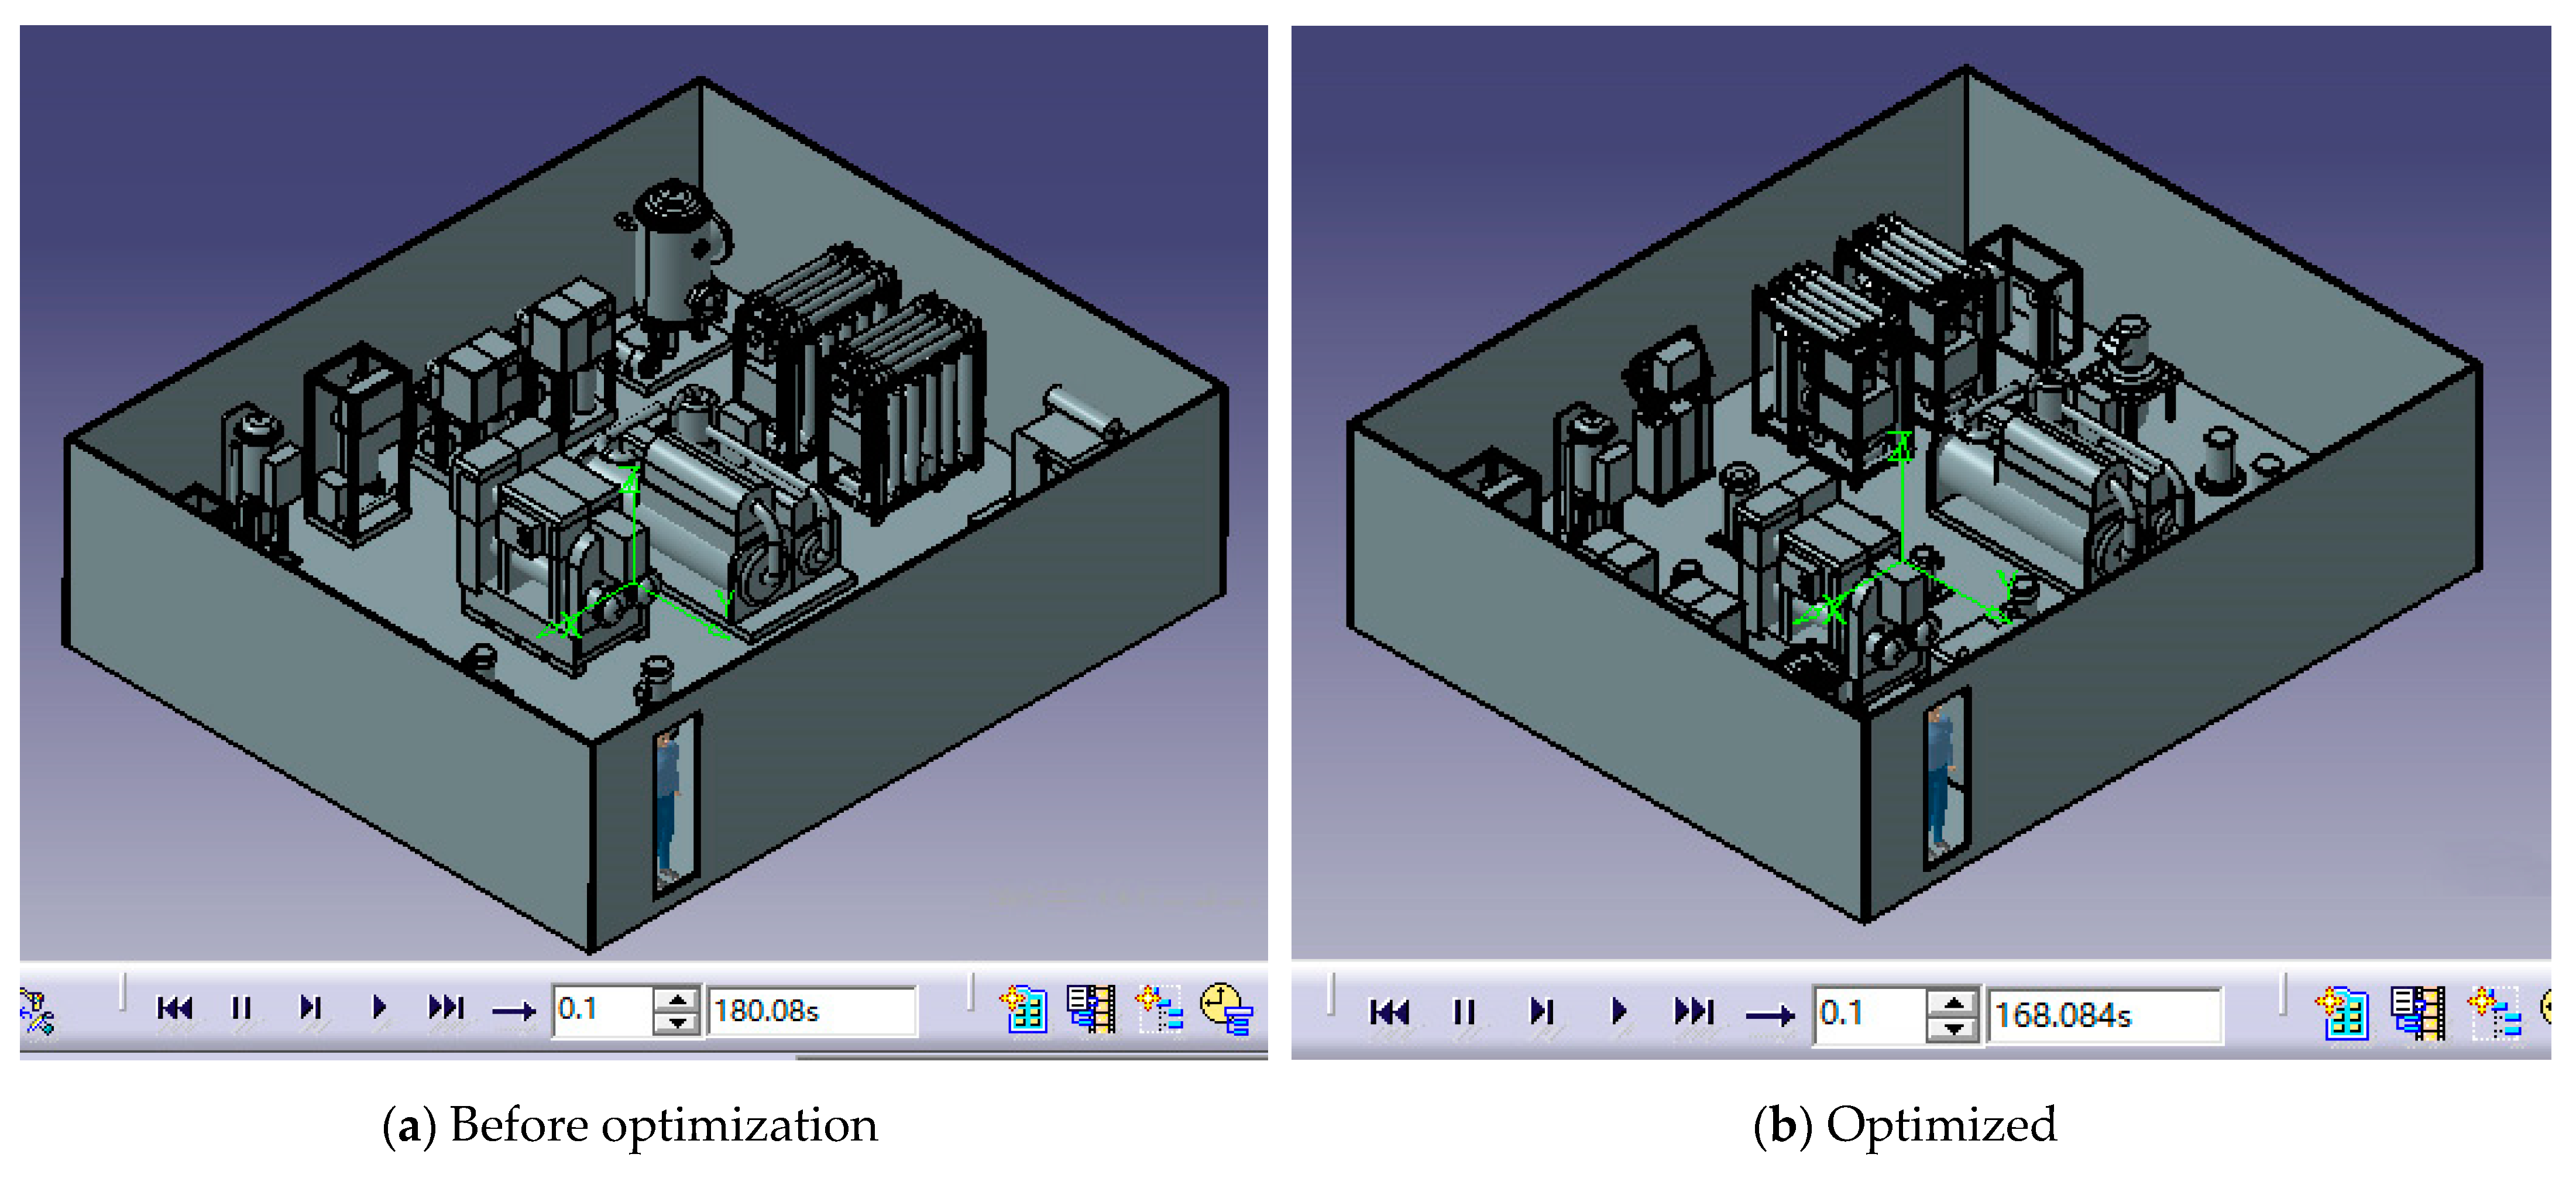
The simulation results before and after the layout optimization are shown in Figure 9. The result before optimization is =180.08 s; The result after optimization is 1=168.084 s.
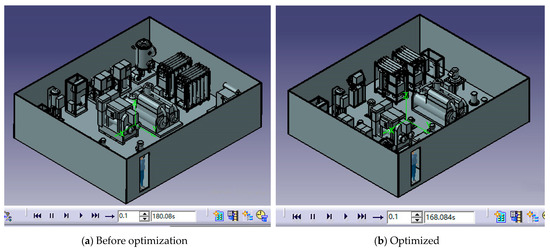
Figure 9.
Simulation results.
According to the simulation results and the human reliability correction coefficient (C), the human error probability can be obtained from Equation (7). The human error probabilities before and after layout optimization are and , and their values are as follows.
From the results, it can be seen that the error rate of cabin crew working in the layout before optimization can reach 2.89067%, while the error rate after layout is only 0.30453% and the error rate after layout optimization has significantly decreased. In addition, the unbalance moment generated by the weight of the equipment itself is also an important parameter in the layout of the cabin. According to the weight and coordinates of the equipment before and after the layout optimization., the value of unbalance moment before layout optimization () was 62601.48 and the value of unbalance moment after layout optimization () was 39,155.24 from the moment calculation Formula (39).
where G is the weight of the equipment and L is the arm of force the device from the midline.
The unbalanced moment of the optimized layout was significantly reduced, thus the ship’s capsize resistance will be relatively better. Through the discussion of the maintenance space and human reliability, etc., each index of the cabin after layout optimization was improved and the overall layout was more reasonable.
5. Conclusions
This paper takes the ship cabin layout optimization problem as the research object. Two HRA methods were analyzed, and a new HRA method was derived by combining the characteristics of a cabin environment. The new analysis method not only has the advantages of two HRA methods, HCR and CREAM, but also analyzes the PSFs in the cabin environment in more detail than the existing methods.
A mathematical model of ship cabin layout optimization considering constraints such as equipment correlation, cabin balance, location constraints between the equipment and its own function was proposed, and the model was solved by GA. Finally, the proposed method was applied to the actual ship cabin as an example, and the before and after results of cabin equipment layout optimization were analyzed using equipment layout evaluation software to verify the feasibility of the proposed method. This method can be used to obtain a better layout during the arrangement of equipment in the cabin.
However, there are some limitations to this paper. First, the environmental conditions of the cabin were limited while meeting the assumptions. For example, the equipment could be projected as two-dimensional without violating the actual function of the equipment; the number of wall hangings was not very large, and the impact on the whole cabin environment was within a manageable range, etc. Secondly, the group of people completing the score were either experts in theoretical design or experienced workers, who are very familiar with the cabin environment. Finally, the proposed method requires more parameters to be prepared before use. Subsequent research can develop an expert system based on this to achieve a more convenient layout optimization design of the equipment.
Author Contributions
Conceptualization, H.S. and J.K.; software, X.M.; validation, X.M., H.S. and J.K.; writing—original draft preparation, X.M.; supervision, H.S. All authors have read and agreed to the published version of the manuscript.
Funding
This research received no external funding.
Institutional Review Board Statement
Not applicable. There are no ethical issues in the paper.
Informed Consent Statement
Not applicable.
Conflicts of Interest
The authors declare no conflict of interest.
Appendix A
Table A1.
The Evaluation of Cabin Environmental PSFs.
Table A1.
The Evaluation of Cabin Environmental PSFs.
| Name | Level | Score (1–10) | Description |
|---|---|---|---|
| Adequacy of organization | Very efficient (7.5, 10] | The quality of resources in the cabin that provide assurance for maintenance tasks, including communication systems, safety management systems, and mission activity support systems. | |
| Efficient (5, 7.5] | |||
| Inefficient (2.5, 5] | |||
| Deficient (0, 2.5] | |||
| Working conditions | Advantageous (6.5, 10] | The environment in which the cabin works, such as visual accessibility, size of operating space, posture comfort, etc. | |
| Compatible (3, 6.5] | |||
| Incompatible (0, 3] | |||
| Adequacy of MIMI and operational support () | Very distinction (8, 10] | What is the quality of the human-machine interface of the equipment in the cabin, as well as the accessibility of the maintenance location and tool availability of the equipment during maintenance work. | |
| Distinction (6, 8] | |||
| Good (4, 6] | |||
| Average (2, 4] | |||
| Poor (0, 2] | |||
| Availability of procedures/plans | Appropriate (6.5, 10] | The protocols to be followed for cabin equipment maintenance tasks, including routine and emergency situations. | |
| Acceptable (3, 6.5] | |||
| Inappropriate (0, 3] | |||
| Number of simultaneous goals | Fewer than capacity (6.5, 10] | The number of tasks or equipment to be serviced to which the maintenance operator must pay attention. | |
| Matching current capacity (3, 6.5] | |||
| More than capacity (0, 3] | |||
| Available time | Adequate (6.5, 10] | The time required for repair and overhaul when the ship is underway. | |
| Temporarily inadequate (3, 6.5] | |||
| Continuously inadequate (0, 3] | |||
| Time of day | Day-time (5, 10] | The time at which the task was performed, and in particular, whether the personnel was adjusted to the current time. | |
| Night-time (0, 5] | |||
| Operating experience () | Sufficient and experienced (6.5, 10] | Whether the maintenance personnel is experienced and whether they perform maintenance work frequently. | |
| Sufficient and little experienced (3, 6.5] | |||
| Not sufficient (0, 3] | |||
| Crew collaboration | Very efficient (7.5, 10] | Quality of cooperation of maintenance personnel, including personnel technical cooperation, level of trust and mutual relations. | |
| Efficient (5, 7.5] | |||
| Inefficient (2.5, 5] | |||
| Deficient (0, 2.5] | |||
| Mental stress () | Very serious (7.5, 10] | Stressful situations in the mind when performing maintenance tasks. | |
| Serious (5, 7.5] | |||
| General (2.5, 5] | |||
| Little (0, 2.5] |
Note: Simply mark the score at the point.
References
- Qinglei, Z.; Fan, Z.; Jianguo, D. Layout optimization of large marine power component production workshops based on DMPSO algorithm. China Mech. Eng. 2020, 31, 344–351. [Google Scholar]
- Dixit, V.; Verma, P.; Raj, P. Leveraging tacit knowledge for shipyard facility layout selection using fuzzy set theory. Expert Syst. Appl. 2020, 158, 113423. [Google Scholar] [CrossRef]
- Derhami, S.; Smith, J.S.; Gue, K.R. Space-efficient layouts for block stacking warehouses. Des. Manuf. 2019, 51, 957–971. [Google Scholar] [CrossRef]
- Jafaryeganeh, H.; Ventura, M.; Soares, C.G. Application of multi-criteria decision making methods for selection of ship internal layout design from a Pareto optimal set. Ocean Eng. 2020, 202, 107151. [Google Scholar] [CrossRef]
- Mallam, S.C.; Lundh, M.; MacKinnon, S.N. Integrating Human Factors & Ergonomics in large-scale engineering projects: Investigating a practical approach for ship design. Int. J. Ind. Ergon. 2015, 50, 62–72. [Google Scholar]
- Xiaomin, S. Maintenance Technology for Ship Machinery and Equipment; Peking University Press: Beijing, China, 2008; pp. 15–16. [Google Scholar]
- Kandemir, C.; Celik, M. A human reliability assessment of marine auxiliary machinery maintenance operations under ship PMS and maintenance 4.0 concepts. Cogn. Technol. Work. 2019. prepublish. [Google Scholar] [CrossRef]
- Petruni, A.; Giagloglou, E.; Douglas, E.; Geng, J.; Leva, M.C.; Demichela, M. Applying Analytic Hierarchy Process (AHP) to choose a human factors technique: Choosing the suitable Human Reliability Analysis technique for the automotive industry. Saf. Sci. 2019, 119, 229–239. [Google Scholar] [CrossRef] [Green Version]
- Mehran, M.; Rezgar, H.; Taher, A.; Park Chul, B. Comparative study on air gasification of plastic waste and conventional biomass based on coupling of AHP/TOPSIS multi-criteria decision analysis. Chemosphere 2021, 286, 131867. [Google Scholar]
- Kandemir, C.; Celik, M.; Akyuz, E.; Aydin, O. Application of human reliability analysis to repair & maintenance operations on-board ships: The case of HFO purifier overhauling. Appl. Ocean Res. 2019, 88, 317–325. [Google Scholar]
- Islam, R.; Abbassi, R.; Garaniya, V.; Khan, F. Development of a human reliability assessment technique for the maintenance procedures of marine and offshore operations. J. Loss Prev. Process Ind. 2017, 50, 416–428. [Google Scholar] [CrossRef]
- Akyuz, E.; Celik, E.; Celik, M. A practical application of human reliability assessment for operating procedures of the emergency fire pump at ship. Ships Offshore Struct. 2018, 13, 208–216. [Google Scholar] [CrossRef]
- Zekan, C. Research on Human Reliability Analysis and Its Application to SGTR Accident of AP1000 Nuclear Power Plants. Ph.D. Thesis, Shanghai Jiao Tong University, Shanghai, China, 2015. [Google Scholar]
- Hannaman, G.W.; Spurgin, A.J.; Lukic, Y.D. Human Cognitive Reliability Model for PRA Analysis; NUS-4531; NUS Corporation: Palo Alto, CA, USA, 1984; pp. 125–130. [Google Scholar]
- Il, A.S.; Emek, K.R. Application of a CREAM based framework to assess human reliability in emergency response to cabin fires on ships. Ocean Eng. 2020, 216, 108078. [Google Scholar]
- Katakura, H.; Takemoto, T. Applying the Cognitive Reliability and Error Analysis Method to DPS Accidents. Navigation 2020, 211, 25–26. [Google Scholar]
- Hollnagel, E. Cognitive Reliability and Error Analysis Method; Alden Group of Oxford: Oxford, UK, 1998. [Google Scholar]
- Evans, M.; He, Y.; Maglaras, L.; Janicke, H. HEART-IS: A novel technique for evaluating human error-related information security incidents. Comput. Secur. 2018, 80, 74–89. [Google Scholar] [CrossRef]
- Standardization Administration of the People’s Republic of China. The Ship Maintenance System: GB/T 16558-2009; Standards Press of China: Beijing, China, 2009. [Google Scholar]
- Yongxiang, Z. Ship Engine Management; Harbin Engineering University Press: Harbin, China, 2011; Volume 1, pp. 274–300. [Google Scholar]
- Tapia, A.; del Nozal, A.R.; Reina, D.G.; Millán, P. Three-dimensional optimization of penstock layouts for micro-hydropower plants using genetic algorithms. Appl. Energy 2021, 301, 117499. [Google Scholar] [CrossRef]
- Xiaoxiao, L.; Baojia, D.; Wenyan, G. Research on Fuzzy Control Strategy and Genetic Algorithm Optimization for Parallel Hybrid Electric Vehicle. J. Phys. Conf. Ser. 2021, 1986, 012106. [Google Scholar]
- Doğan, D.C.; İç, Y.T. Reliability Centered Maintenance Analysis Using Analytic Hierarchy Process for Electro-mechanical Actuators. Aerotec. Missili Spaz. 2021. prepublish. [Google Scholar] [CrossRef]
- Feng, G. Research on Collision Avoidance Planning Method for Small USV under High Speed Motion. Ph.D. Thesis, Harbin Engineering University, Harbin, China, 2019. [Google Scholar]
- Guibas, L.; Hershberger, J. Computing the visibility graph of n line segments in O(n2) time. Theoret. Comput. Sci. 1985, 26, 13–20. [Google Scholar]
- Sara, C.; Manuel, I.; Roberto, R. Exact methods for the traveling salesman problem with multiple drones. Transp. Res. Part C 2021, 130, 103280. [Google Scholar]
- Mohsen, M.; Manbir, S.; Wettergren, T.A. The Traveling Salesman Problem with Job-times (TSPJ). Comput. Oper. Res. 2021, 129. prepublish. [Google Scholar]


Publisher’s Note: MDPI stays neutral with regard to jurisdictional claims in published maps and institutional affiliations. |
© 2021 by the authors. Licensee MDPI, Basel, Switzerland. This article is an open access article distributed under the terms and conditions of the Creative Commons Attribution (CC BY) license (https://creativecommons.org/licenses/by/4.0/).