Article

Transient Responses Evaluation of FPSO with Different Failure Scenarios of Mooring Lines

1
State Key Laboratory of Coastal and Offshore Engineering, Dalian University of Technology, Dalian 116024, China
2
Sortec Offshore Pte. Ltd., Singapore 677670, Singapore
3
School of Civil Engineering, Qingdao University of Technology, Qingdao 266033, China
*
Authors to whom correspondence should be addressed.
J. Mar. Sci. Eng. 2021, 9(2), 103; https://doi.org/10.3390/jmse9020103
Submission received: 27 December 2020 / Revised: 16 January 2021 / Accepted: 18 January 2021 / Published: 20 January 2021
(This article belongs to the Special Issue Ocean and Shore Technology (OST))

Abstract

:
During the long-term service condition, the mooring line of the deep-water floating platform may fail due to various reasons, such as overloading caused by an accidental condition or performance deterioration. Therefore, the safety performance under the transient responses process should be evaluated in advance, during the design phase. A series of time-domain numerical simulations for evaluating the performance changes of a Floating Production Storage and Offloading (FPSO) with different broken modes of mooring lines was carried out. The broken conditions include the single mooring line or two mooring lines failure under ipsilateral, opposite, and adjacent sides. The resulting transient and following steady-state responses of the vessel and the mooring line tensions were analyzed, and the corresponding influence mechanism was investigated. The accidental failure of a single or two mooring lines changes the watch circle of the vessel and the tension redistribution of the remaining mooring lines. The results indicated that the failure of mooring lines mainly influences the responses of sway, surge, and yaw, and the change rule is closely related to the stiffness and symmetry of the mooring system. The simulation results could give a profound understanding of the transient-effects influence process of mooring line failure, and the suggestions are given to account for the transient effects in the design of the mooring system.

1. Introduction

Energy is an important fundamental for the development of a country that directly affects the economic lifeline. With the rapid development of human society, land energy is becoming increasingly scarce, so people are turning their attention to the sea. Various countries have made significant efforts in the deep-water oil and gas exploitation, with relatively mature technologies. At present, many floating platforms have been developed and installed, such as the Floating Production Storage and Offloading (FPSO), Spar, Semi-submersible, and Tension Leg Platform (TLP). The FPSO is the most widely adopted floating platform in the world due to its unique advantages in the storage, navigation ability, and low cost [1,2,3,4].
The deep-water floating platform is anchored at a specific location, using the mooring system, to ensure its normal operation within a safe location range. When the platform has been in service for a long time, the mooring system is at risk of breakage under the mild or severe environmental conditions, with many uncertainties [5]. Since 2000, there have been at least 23 incidents of mooring failure, and some of them have caused catastrophic accidents [6]. These failures have occurred for various reasons, for example, manufacturing defects, damage during installation, weathering, corrosion, fatigue, and out-of-plane bending in chains. After the mooring failure, the position of the platform changes substantially, which increases the risk level of the platform and nearby structures. Therefore, it is of great significance to study and evaluate the possible variations of platform motion and mooring tension when the different failure modes of mooring lines occurs.
Some scholars have investigated the changes in global responses of platform and mooring line tension considering the failure of tension leg based on numerical simulations. For the TLP platform with top tension risers (TTRs), the effects of the simultaneous failure of different numbers of tendons and the continuous failure of multiple tendons on the platform motion and tendon tension under the extreme sea conditions are analyzed [7]. The motions of TLP with one tendon failure and the loads on the remained tendons under different hull ballast were studied by using the commercial software HydroD and OrcaFlex [8]. The transient motion responses of the Extended Tension Leg Platform (ETLP) platform when the tendon disconnection occurs under harsh environmental conditions were analyzed [9]. The dynamic stability and survivability of a four-column classic TLP under less-than-extreme storm conditions where one or more tendon failures due to damage or disconnect were investigated, the transient responses of the platform and tendon tensions at the moment of disconnection are in the time domain [10,11]. The behavior of tensions of TLP tendons under the damaged tendon condition in the wave frequency range was analyzed [12]. The dynamic responses and tension characteristics of a TLP with one tendon broken were investigated [13]. A time domain hull–tendon–riser coupled dynamic analysis was developed for the transient effects of tendon disconnection of a TLP [14]. The stochastic responses of TLP under the intact and damaged tendon conditions, considering the random wave and current conditions, were conducted [15]. The structural safety assessment of TLP in the hurricane environment was analyzed [16].
There are also investigations on the change in global responses of other types of floating platforms in the oil and gas industry, considering the failure of mooring lines based on numerical simulations. The effects of mooring diameters, fairlead slopes, and pretensions on the dynamic responses of a truss spar platform under the intact and damaged mooring line conditions were studied by Montasir et al. [17]. Feng et al. [18] presented a method for analyzing the stability of floating platforms after the mooring line is broken, based on the time-domain analysis. Mura et al. [19] conducted the analysis on the hydrodynamic responses of a floating body and mooring lines in the case that a mooring line in contact with the seabed is broken. Zhang et al. [20] investigated the progressive mooring line failure process of a deep-water Mobile Offshore Drilling Unit (MODU) in the hurricane conditions. Kim et al. [21] solved the platform motion and mooring line tension, using the high-order boundary element method, convolution method, and finite element method, in view of the single cable fracture of the Floating Storage and Regasification Unit (FSRU) mooring system, and compared the results with the intact mooring condition. Han et al. [22] examined the transient behavior of mooring lines and FPSO in the single mooring line broken for some operational conditions. Giron et al. [23] analyzed the relevance of the transient effects on the FPSO under the severe storm conditions by using two different mooring system arrangements. Ma and Sun [24] introduced the software of FPSO Mooring Management System to track and control the FPSO mooring situation, including the main failures of the mooring system. Lian et al. [25,26] analyzed the effects of different levels of damaged ropes on the dynamic responses of FPSO and its taut-wire mooring system.
In addition, there are some investigations that used the model tests method to study the influences of mooring failure. Kurian et al. [27] conducted the model tests of a semi-submersible platform with a scale of 1:100 and investigated the effects of single mooring line failure on the vessel motions. Hong et al. [28] conducted the model tests of an FPSO with broken mooring line, to investigate the characteristics of vessel motions and mooring line tensions.
Furthermore, several studies have been conducted to investigate the influences of a single mooring line failure on the floating wind turbines under the survival conditions. A time-domain aero–hydroservo–elastic-mooring coupled dynamic analysis was developed for TLP floating wind turbine, and the performance changes with broken mooring line were discussed [29]. A coupled dynamic analysis on the fracture of some blades of floating wind turbine was conducted [30]. The transient response of a Spar-type floating wind turbine with fractured mooring lines was investigated [31]. The influences of single tendon failure on the transient responses of WindStar TLP floating wind turbine were studied in different environmental conditions [32].
Most of the previous investigations mentioned above about the influences of mooring failure on the offshore floating platforms and floating wind turbines only consider the single most loaded mooring line failure under the extreme harsh sea condition with the combination of the same direction of the wave, wind, and current, which is consistent with the requirement of design standard [33]. However, during the actual service conditions in the different sea states, there are various reasons for the mooring failure, such as the design, material quality, installation and transportation, inspection and maintenance, etc., which could also cause the mooring failure in the normal operation sea state, and single mooring line failure is often accompanied by another mooring line failure [6]. Therefore, establishing the numerical model to calculate the coupled dynamic responses of vessel motions and mooring line tensions under the sudden mooring line breakage at a certain time, considering the possible single or two mooring lines failure conditions under the extreme harsh or operating sea conditions, the comprehensive performance evaluation of vessel motion responses under the different mooring line failure conditions, and the corresponding transient responses analysis should be further investigated.
In this study, the evaluation of the transient response of FPSO with different mooring lines failure was investigated, including the single mooring line or two mooring lines failure under ipsilateral, opposite, and adjacent sides. This paper is organized as follows: In Section 2, the coupling model of FPSO and its mooring system is established. In Section 3, a DEEPSTAR internal turret FPSO is presented as the research objective, and the corresponding numerical model for calculating the motion responses is validated by the model tests. In Section 4, the environmental conditions and mooring failure cases are presented, including four different mooring failure conditions under different environmental sea states. In Section 5, the comprehensive safety evaluation of vessel motion responses and mooring line tensions are conducted and analyzed, including the mooring failure location and environmental load direction on the vessel motion responses and the tension redistribution of the remaining mooring lines. In Section 6, the conclusions are presented.

2. Governing Equations and Formulation

2.1. Mooring Line Model

The mooring line is generally presumed to be a completely flexible component during the motion analysis; using the governing equation of motion proposed by Berteaux [34], the dynamic of mooring line can be solved by lumped mass method [35]:
m V t = F D n + F D t + F I n + F I t + T s + G
F D n = 1 2 ρ w C D n D | U n V n | ( U n V n )
F D t = 1 2 ρ w C D t π D | U t V t | ( U t V t )
F I n = ρ w A r C I n ( U n t V n t )
F I t = ρ w A r C I t ( U t t V t t )
where m is the mass of mooring line per unit length; V is the velocity vector; T is the mooring line tension; T s is the mooring line tension variation; G is the net weight; F D n , F D t , F I n , and F I t are the drag forces and inertia forces per unit length in the normal and tangential directions, respectively; ρ w is the seawater density; D is the equivalent diameter of mooring line; A r is the equivalent area; C D n , C D t , C I n , and C I t are the drag coefficients and inertia coefficients in the normal and tangential directions, respectively; V n , V t , U n , and U t are the mooring line velocity and fluid velocity in the normal and tangential directions, respectively.

2.2. Hydrodynamic Model of FPSO

2.2.1. Wave Force Calculation

The wave forces on the FPSO are calculated by the boundary element method based on the diffraction theory, using the commercial software AQWA. Ignoring the interaction effects between waves and currents, it is supposed that the first-order wave force of the floating structure is composed of wave excitation force and radiation force, which can be superposed linearly. The wave excitation force is composed of incident force and diffraction force, and radiation force can be regarded as additional mass force and radiation damping force. The potential of the first-order wave force is defined as follows:
Φ ( X , Y , Z , t ) = ϕ ( X , Y , Z ) = [ ( ϕ I + ϕ D ) + Σ 6 j = 1 ϕ j x j ] e i ω t
where ϕ I is the incident potential, ϕ D is the diffraction potential, and x j represents the amplitude of the j freedom motion of the floating structure.
The first-order velocity potential is substituted into the linear Bernoulli equation:
p ( X , t ) = ρ Φ t
By summing the wave excitation force and radiation force, the first-order wave force (unit amplitude) on the floating structure could be given as follows:
F = F j + F j i
F j = S p I D n j d S = S i ω ρ ( ϕ I + ϕ D ) n j d S
F j i = S p i n j d S = S i ω ρ ϕ i n j d S = A j i x ¨ i B j i x ˙ i
where F j is the wave excitation force in the j direction; F j i is the j direction radiant force caused by the i freedom motion of the floating platform; S is the wet surface of the floating structure; n j is the normal vector in the j direction; A j i and B j i are the added mass and the radiation damping coefficient, respectively, which can be expressed as follows:
A j i = ρ ω S ϕ i Im n j d S
B j i = ρ S ϕ i Re n j d S
Under the action of waves, the floating platform will not only receive the first-order wave force consistent with the wave frequency, but also the nonlinear second-order wave force. The components of the second-order wave force mainly include average wave drift force, low-frequency wave drift force and high-frequency wave drift force.
The average wave drift force and the low-frequency wave drift force are proportional to the square of the incident wave amplitude, and the proportional relationship is defined as the second-order wave force quadratic transfer function (QTF).
F drift i ( t ) = Σ j = 1 n Σ k = 1 n Re { Q d i ( ω j , ω k ) a j a k exp [ i ( ω j ω k ) t ( ϕ j ϕ k ) ] }
where, when i = 1 , , 3 , F d r i f t   i ( t ) is, respectively, the wave drift force in the x, y, and z directions in the local coordinate system of the platform, when i = 4 , , 6 , F d r i f t   i ( t ) is respectively the wave drift moment of x, y, and z axes in the local coordinate system of the platform; n is the number of waves that are divided into irregular waves; Q d i represents the n-order low-frequency QTF matrix in the direction of i degrees of freedom; Q d i ( ω j , ω k ) is the low-frequency wave force transfer function value of two regular waves with frequencies ω j and ω k in the QTF matrix; a j and a k are the amplitudes of the jth and kth regular waves, respectively; ϕ j and ϕ k are the phases of the jth and kth regular waves, respectively. In the above formula, when j = k , a term that has nothing to do with time appears, which represents the average wave drift force; when j k , it represents the low-frequency wave drift force.
By summing the Equations (8) and (13), the wave force on the floating structure could be obtained as F wave i ( t ) = F + F drift i ( t ) .

2.2.2. Wind Force Calculation

The wind force on the FPSO is obtained by the following:
F w i n d i ( t ) = C W i U W ( t ) | U W ( t ) | i = 1 , , 6
where F current i ( t ) is the current force in the x, y, and z directions and the current torque around the x, y, and z axes in the local coordinate system of the platform; C C i is the current force/moment coefficient corresponding to the incident angle of the current load at time, t , which is related to the platform type (refer to the API specification [34]); U C ( t ) represents the real-time relative velocity of the current and the platform along the direction of current propagation.

2.2.3. Current Force Calculation

Moreover, ignoring the interaction effects between waves and currents, the current force on the FPSO is obtained by the following:
F current i ( t ) = C C i U C ( t ) | U C ( t ) | i = 1 , , 6
where F current i ( t ) is the current force in the x, y, and z directions and the current torque around the x, y, and z axes in the local coordinate system of the platform; C C i is the current force/moment coefficient corresponding to the incident angle of the current load at time, t , which is related to the platform type (refer to the API specification [34]); U C ( t ) represents the real-time relative velocity of the current and the platform along the direction of current propagation.

2.2.4. Coupled Analysis of FPSO and Mooring Lines

Considering the wind, wave, and current load on the platform and the interaction with the mooring system, the governing equation of the platform’s motion responses, x j ( t ) , in the time domain can be expressed as follows:
Σ j = 1 6 [ ( M i j + m i j ) x j ( t ) + 0 t R ij ( t τ ) x j ( τ ) d τ + C ij x j ( t ) + K ij x j ( t ) ] = F wave i ( t ) + F wind i ( t ) + F current i ( t ) + F moor i ( t ) ( t = 1 , , 6 )
where M i j is the mass matrix of floating structure; m i j is the added mass matrix; R i j is the hysteresis function matrix; C i j is the viscous damping matrix; K i j is the static recovery stiffness matrix of the platform; F w a v e   i ( t ) is the wave force vector; F w i n d   i ( t ) is the wind force vector; F c u r r e n t   i ( t ) is the current force vector; F m o o r   i ( t ) is the force vector of the instantaneous mooring system.
According to the convolution method, the additional mass matrix, m i j , and the delay function matrix, R i j , can be obtained by the additional mass coefficient, A i j , and the radiation damping coefficient, B i j , obtained by hydrodynamics in the frequency domain:
m i j = A i j ( )
B i j ( t ) = 2 π 0 B i j ( ω ) cos ( ω t ) d ω

2.2.5. Simulation of Mooring Line Breakage at a Certain Time

The simulation of mooring line breakage at a certain time is divided into the following steps: (1) Conduct the coupled dynamic responses analysis of FPSO and intact mooring lines in the time domain; (2) choose the certain time of mooring line breakage as the maximum tension occurrence of the most loaded mooring line; (3) set the breakage number and occurrence time of mooring lines, while keeping other conditions unchanged; (4) re-conduct the coupled dynamic responses analysis of FPSO and damaged mooring lines in the time domain.

3. FPSO and Mooring System Arrangement

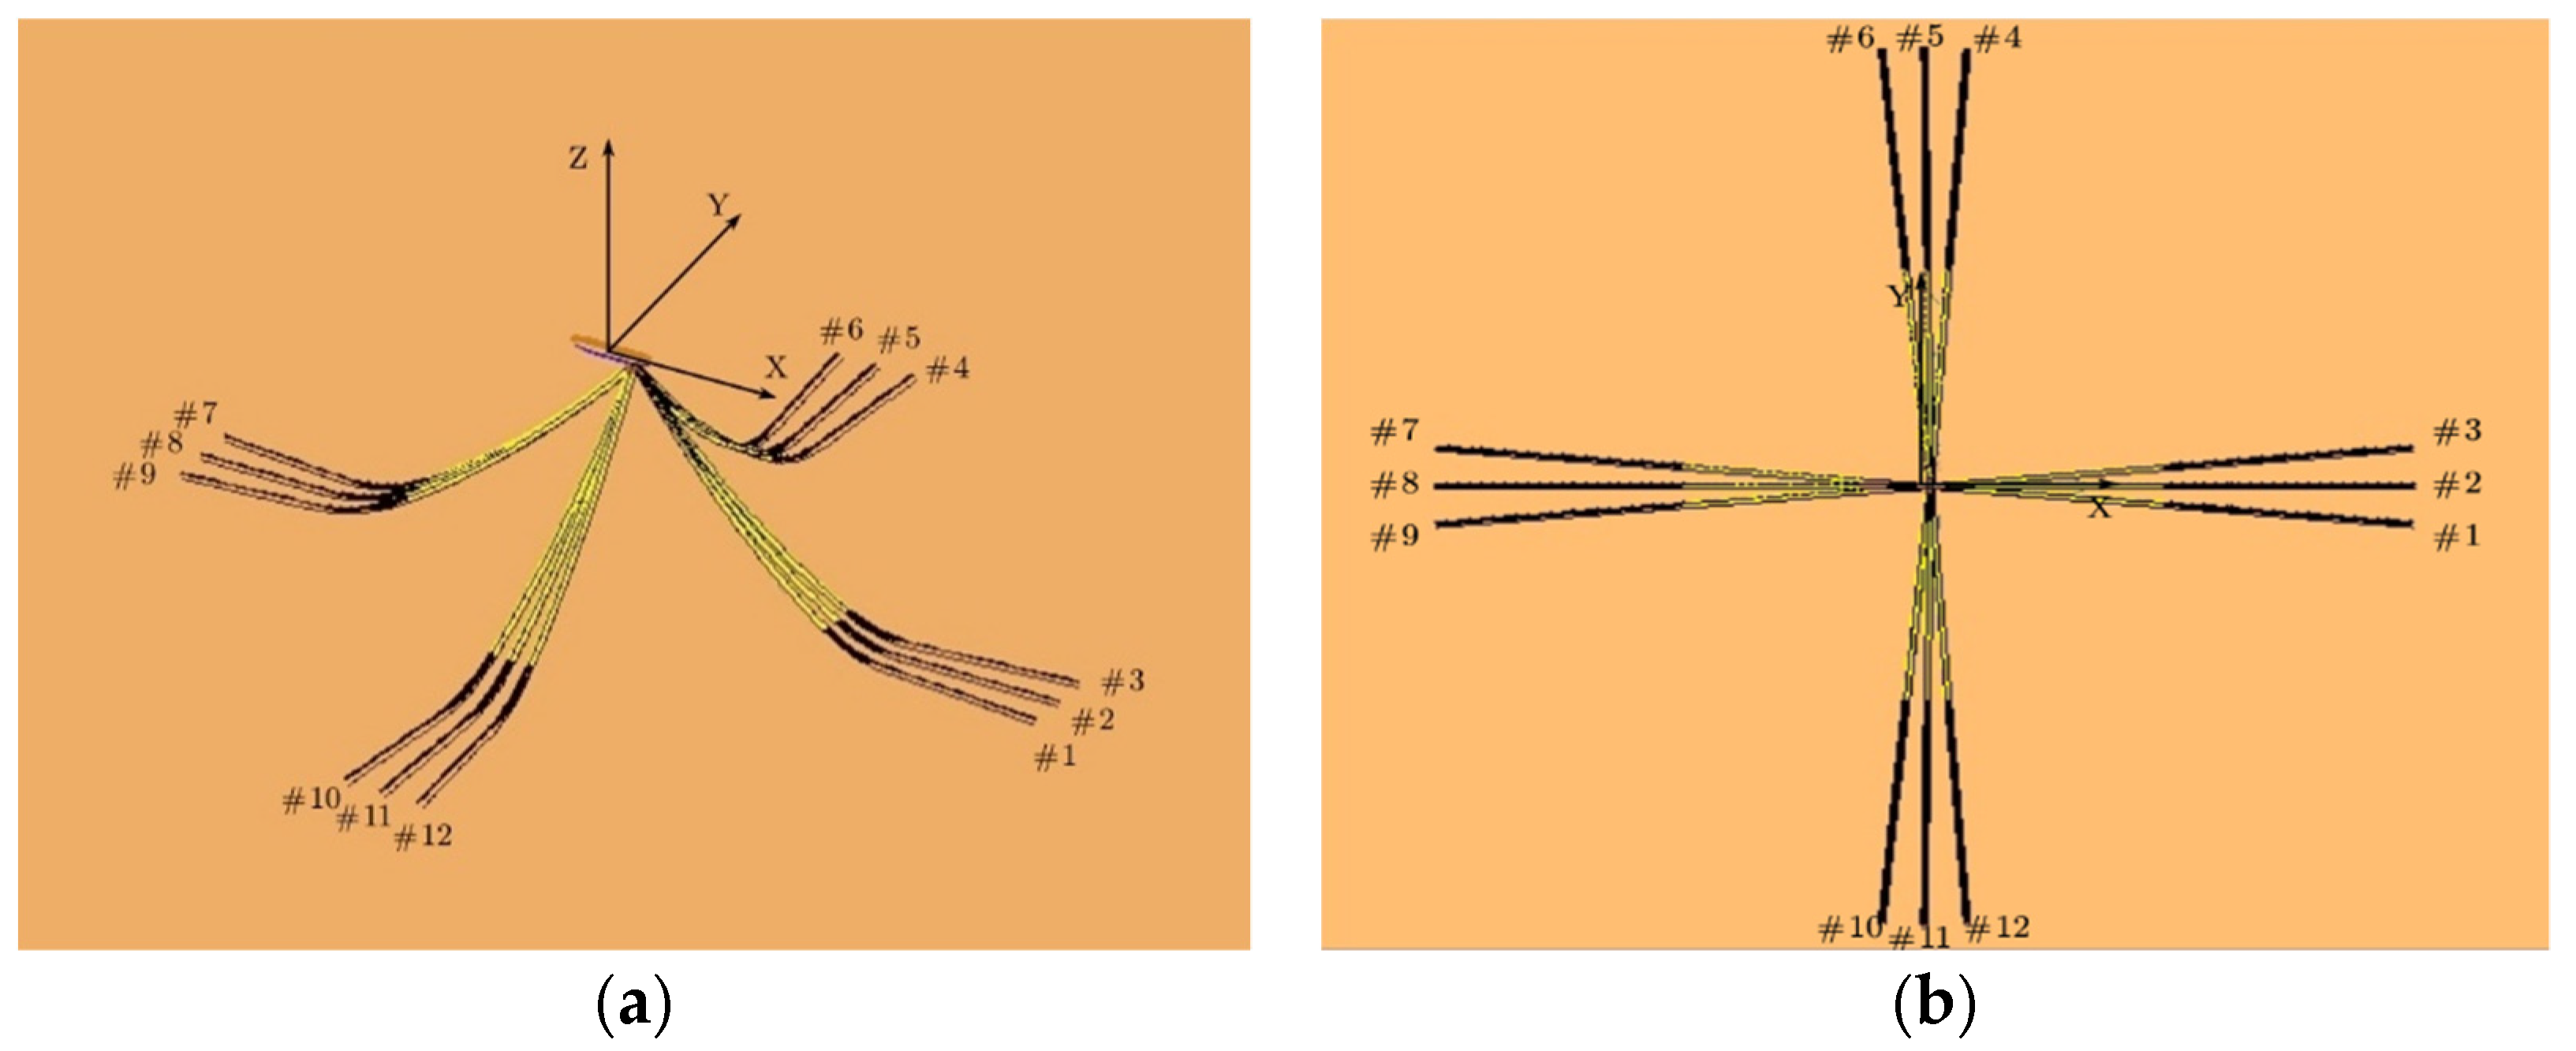
3.1. Description of FPSO and Mooring System

In this study, a typical DEEPSTAR internal turret FPSO and its mooring system with an operating water depth of 914 m were selected as the research objective. The coordinate origin was set as the gravity center of FPSO. The mooring system consists of 4 × 3 groups, as shown in Figure 1. Each group in the mooring system is positioned at 90° apart, and the mooring lines in each group are positioned at 5° apart. The top of each mooring line is connected to the turret, and the bottom is anchored to the seabed. The pretension of each mooring line is 1200 KN. The specific parameters of the FPSO and mooring system are shown in Table 1 and Table 2, respectively.

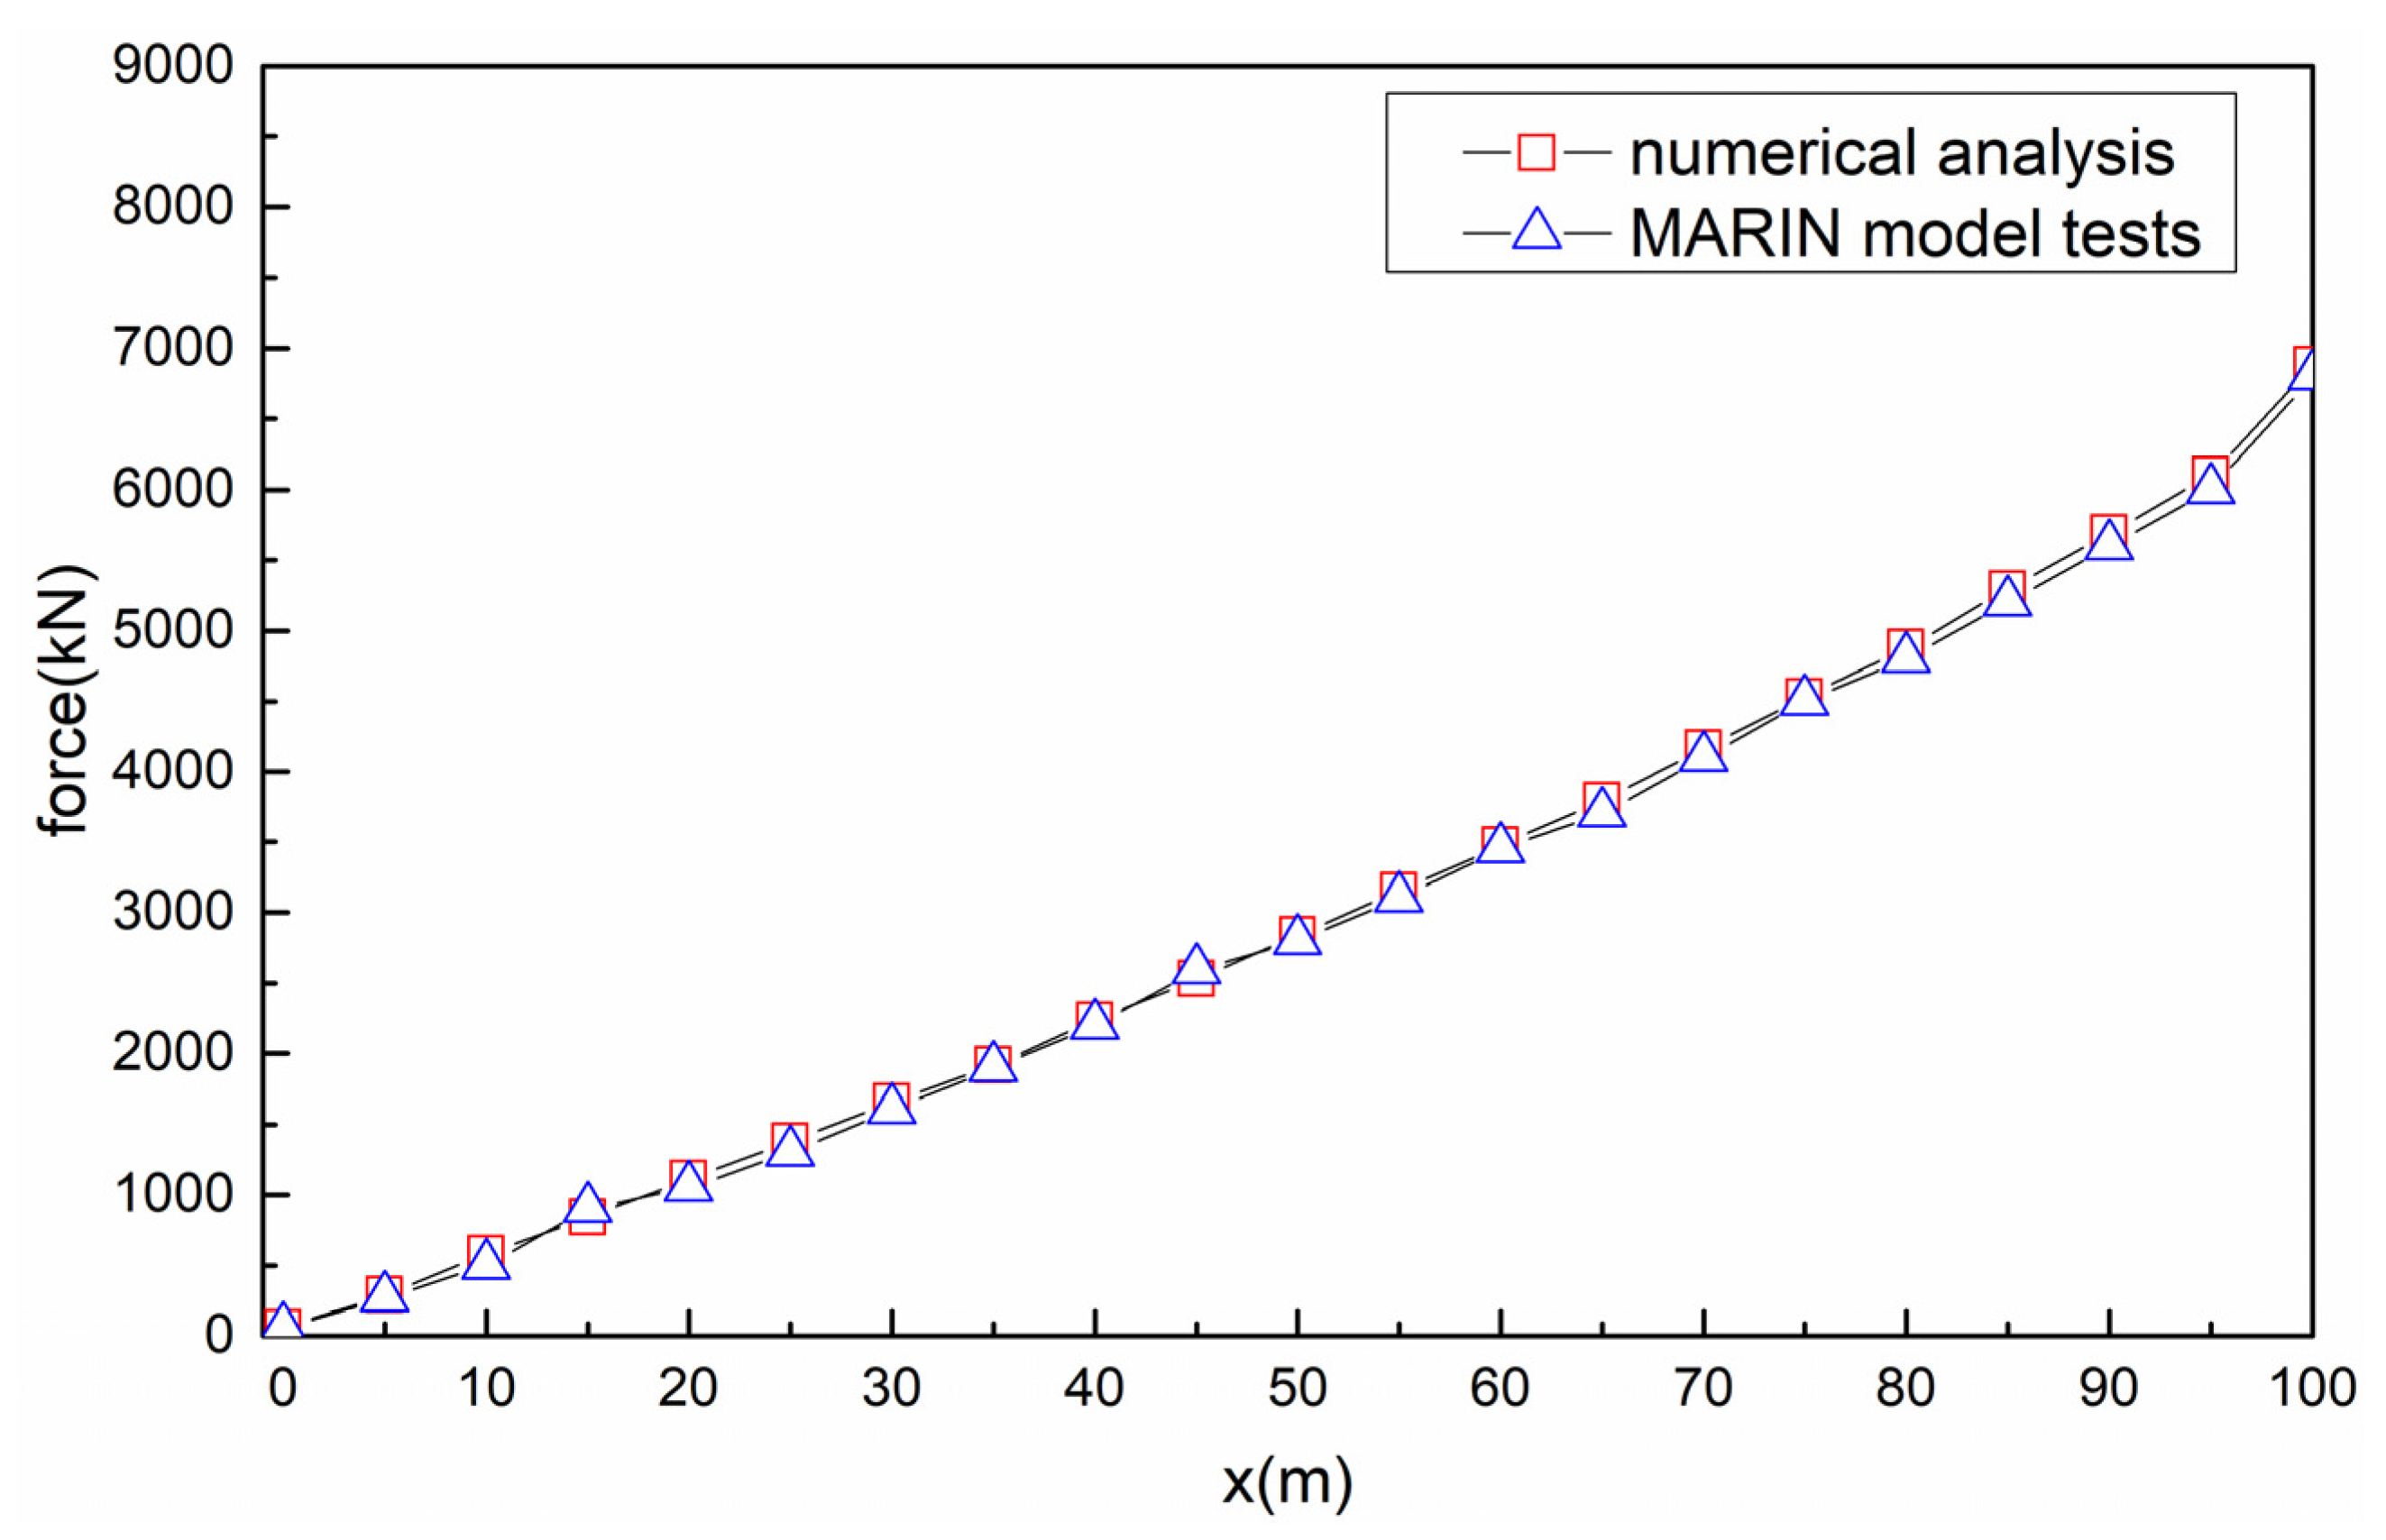
3.2. Motion Responses Calculation Model Verification

In order to verify the established numerical model of calculating the motion responses of FPSO and its mooring system shown in Section 2 above, the numerical simulation results are compared with the model tests results from MARIN [36].
Firstly, the comparison of the static characteristics of the FPSO mooring system is shown in Figure 2. According to the static load–displacement curve, the results shown in the numerical simulation and model tests are in good agreement, which indicates that the initial layout and design of the entire FPSO and its mooring system in the numerical and experimental model are well mutually verified.
Secondly, the motion responses of FPSO and the mooring line tensions under the 100-year hurricane environment in the Gulf of Mexico were compared, as shown in Table 3. It can be seen that the numerical simulation results of the responses of FPSO and mooring line tensions are both in good agreement with the results of the MARIN model tests; the maximum error is within a reasonable range, which indicates that the established numerical simulation model could be used directly in the following study.

4. Environmental Condition and Mooring Line Broken Cases

Due to the weathervane effect on the single point mooring system of FPSO and the symmetry arrangement of the mooring system, as shown in Figure 1, the steady-state motion responses of FPSO are the same when the environmental load direction is 0°/90°/180°/270° or 45°/135°/225°/315°. Therefore, the collinear and non-collinear environmental load directions of 100-year hurricane and operation sea states in the Gulf of Mexico were chosen as the representative environmental conditions, as shown in Table 4.
In order to analyze the mooring line broken cases as comprehensively as possible, the single and two mooring line failures are chosen under each environmental condition. Considering the symmetry of the mooring system arrangement and the environmental incident directions, four representative mooring line broken conditions are chosen as the case studies. The most loaded mooring line #2 in CaseA/D is set as the basic case of single mooring line failure, and the ipsilateral, opposite, and adjacent sides of mooring line #2 are set as the cases of two mooring lines failure. All of the mooring lines failure cases are listed in Table 5, and the 3 h numerical simulation of motion responses of FPSO and its mooring system are conducted with the time step of 0.1 s. The mooring lines broken occur at a certain time of 1600 s, which is the occurrence time of maximum tension of mooring line #2 in the intact condition.

5. Analysis of FPSO System with Broken Mooring Lines

5.1. Static Analysis

The mooring lines failure will certainly lead to the changes of mooring system stiffness and the static equilibrium position of FPSO. The restoring force curves of different mooring systems in the surge and sway direction, including the intact and broken conditions, are shown in Figure 3.
According to Figure 1, the mooring system is symmetrical about the x-axis and y-axis, and the layout is the same. Therefore, the intact mooring system has the same stiffness in the surge and sway directions. As shown in Figure 3a, the stiffness of the mooring system in the surge direction is Kintact > K1 = K4 > K3 > K2, in which the Kintact, K1, K2, K3, and K4 represent the stiffness of intact mooring system, mooring line broken CaseA/B/C/D-1, CaseA/B/C/D-2, CaseA/B/C/D-3, and CaseA/B/C/D-4, as shown in Table 5. In CaseA/B/C/D-1 and CaseA/B/C/D-4, the restoring force is mainly provided by the remaining mooring lines #1, #3, #7, #8, and #9, so the mooring stiffness in the surge direction of these two conditions is the same, which is reduced by 6%, compared with the intact condition. In CaseA/B/C/D-2, the number of broken mooring lines in the surge direction is the largest, so the mooring stiffness provided by the remaining lines is the smallest, which is reduced by 40.4%, compared with the intact condition. In CaseA/B/C/D-3, the mooring lines broken location are on the opposite side, and the surge stiffness are reduced by 31.8% at these conditions. It can be seen that the stiffness of the mooring system under a certain direction is determined by the number of broken lines in that direction and the failure location. The greater the number of mooring lines failures, the smaller the stiffness, and the failure on the same side has a smaller stiffness than the failure on the opposite side. As shown in Figure 3b, the stiffness of the mooring system in the sway direction is Kintact = K1 = K3 > K2 > K4. Because the mooring lines #2 and #8 only provide restoring force in the surge direction, the stiffness in the sway direction in CaseA/B/C/D-1 and CaseA/B/C/D-3 remains unchanged. There is a small 5° apart between the mooring line #1 and the x-axis; it still provides a little restoring force contribution in the sway direction. Therefore, in CaseA/B/C/D-2, the stiffness is reduced by 1.8%, compared with the intact condition. In CaseA/B/C/D-4, because the failure of mooring line #11 has a large contribution, the stiffness in the sway direction is reduced by 18.36%. The summaries of stiffness reduction under different mooring failure conditions are listed in Table 6.
When the mooring lines are broken, the FPSO will be re-moved to the new equilibrium position under the action of the remaining mooring lines, which is considered to be the initial position in the following dynamic analysis of FPSO motion responses and mooring lines tensions. The static equilibrium positions are shown in Table 7. It can be seen that there is almost no change of the static equilibrium position when the opposite side of mooring lines #2 and #8 are broken (CaseA/B/C/D-3), which is basically the same as the intact condition. The yaw responses occur when the ipsilateral mooring line #2 and #1 are broken (CaseA/B/C/D-2), which means the bow of FPSO will turn to the new static equilibrium position. The significant sway responses occur when the ipsilateral mooring line #2 and #11 are broken (CaseA/B/C/D-4), which means that the FPSO will laterally move to the new static equilibrium position.
The failure of mooring lines will lead to change in the stiffness of mooring system and the motion responses of FPSO; thus, the tensions of the remaining mooring lines will also be affected. The requirements of the minimum safety factor of mooring line tension under different states are listed in Table 8 [34], which could be considered as the safety evaluation criteria in the following analysis.

5.2. Results of CaseA

In this section, the motion responses of FPSO and the mooring line tensions are analyzed where the collinear environmental load directions of the 100-year hurricane in the Gulf of Mexico are considered. The directions of the wave, wind, and current are all along 180° in CaseA.

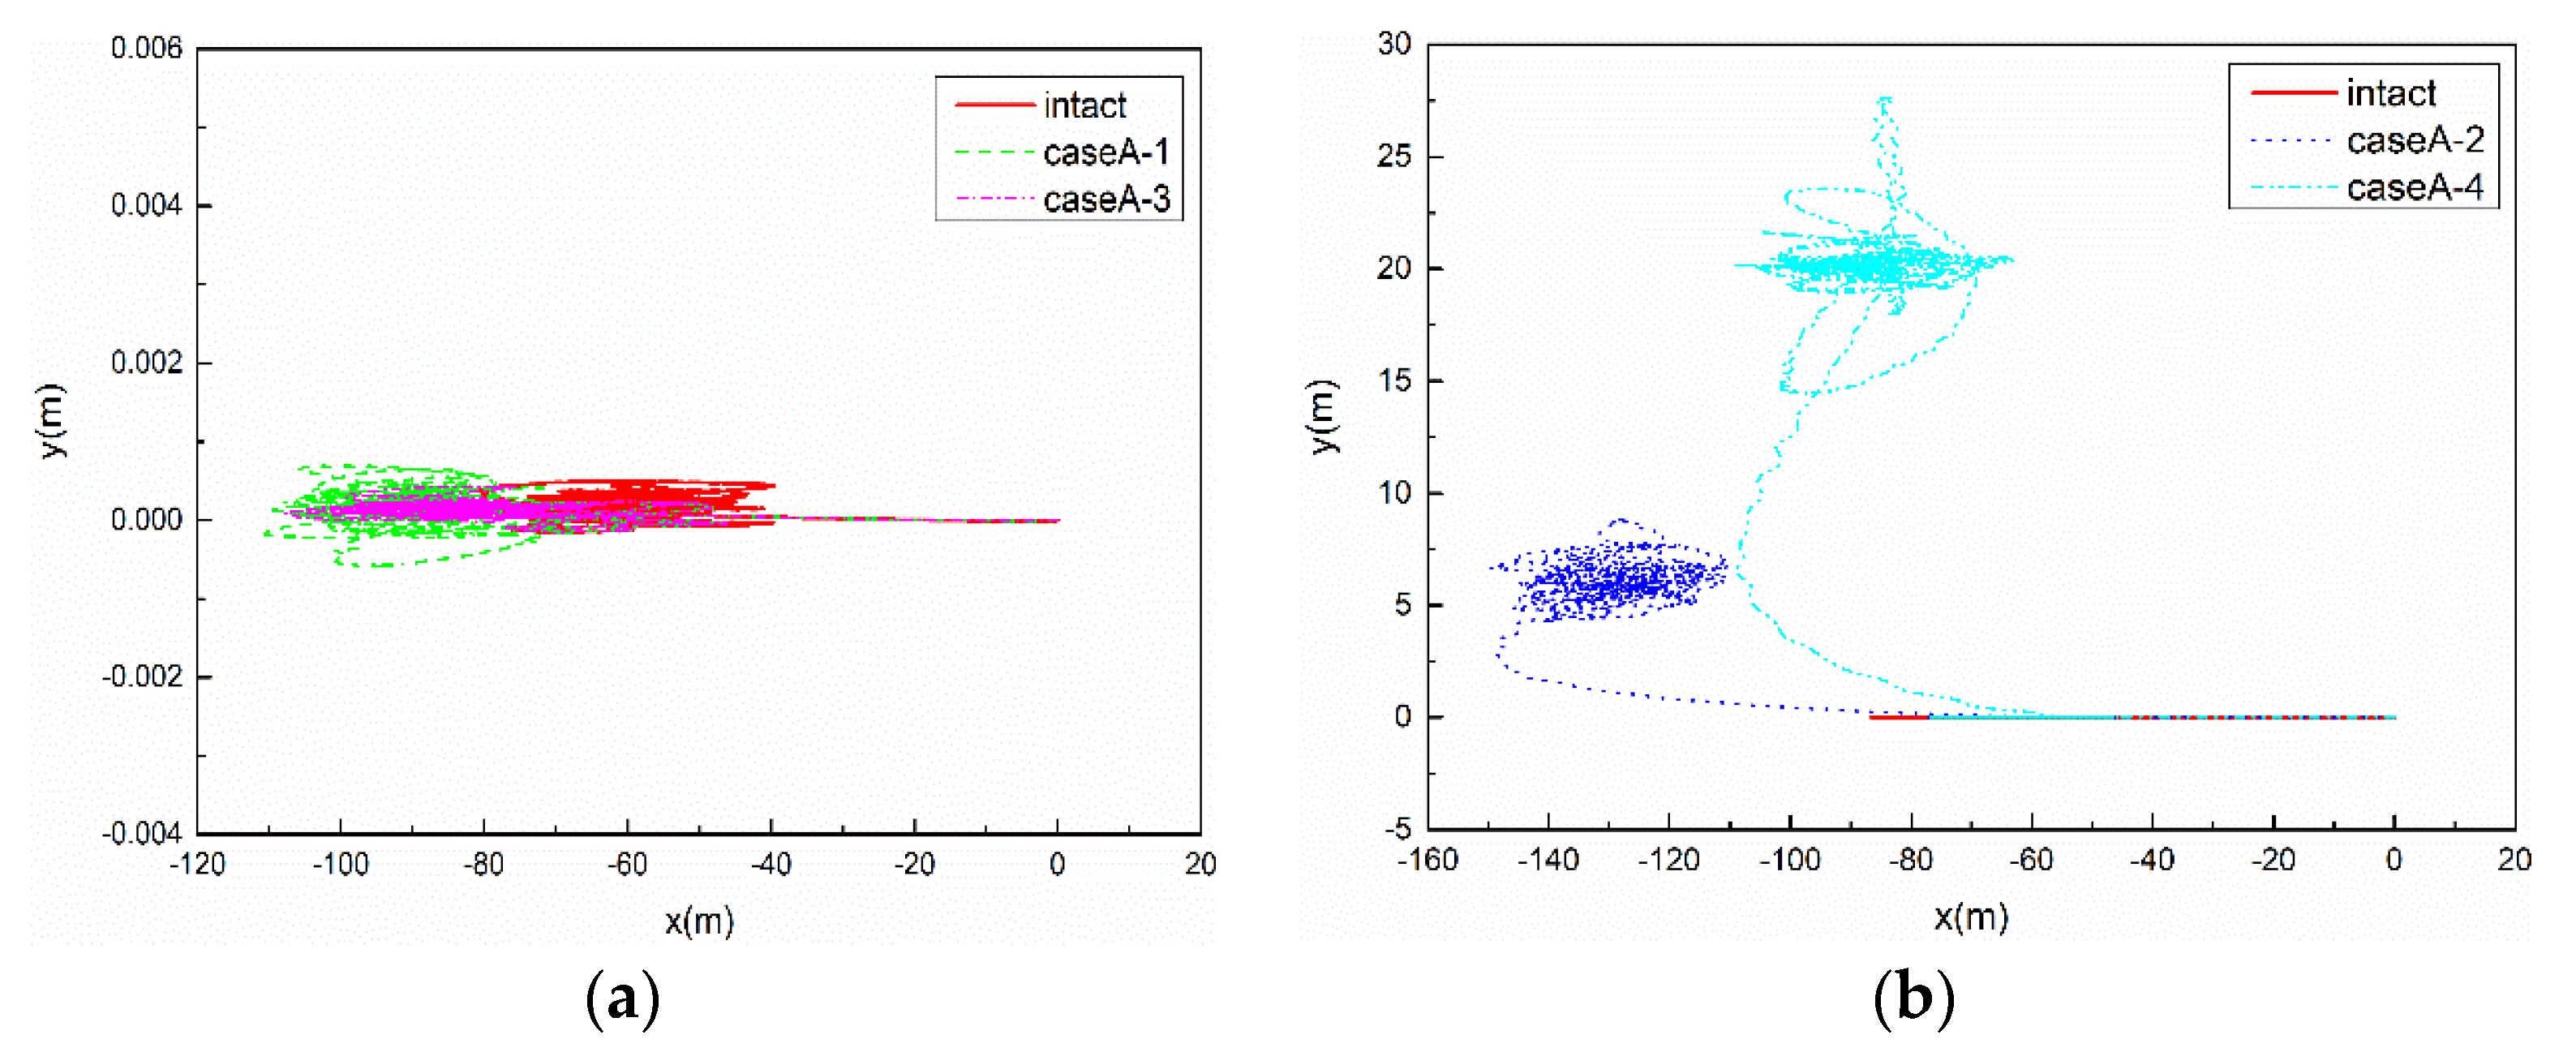
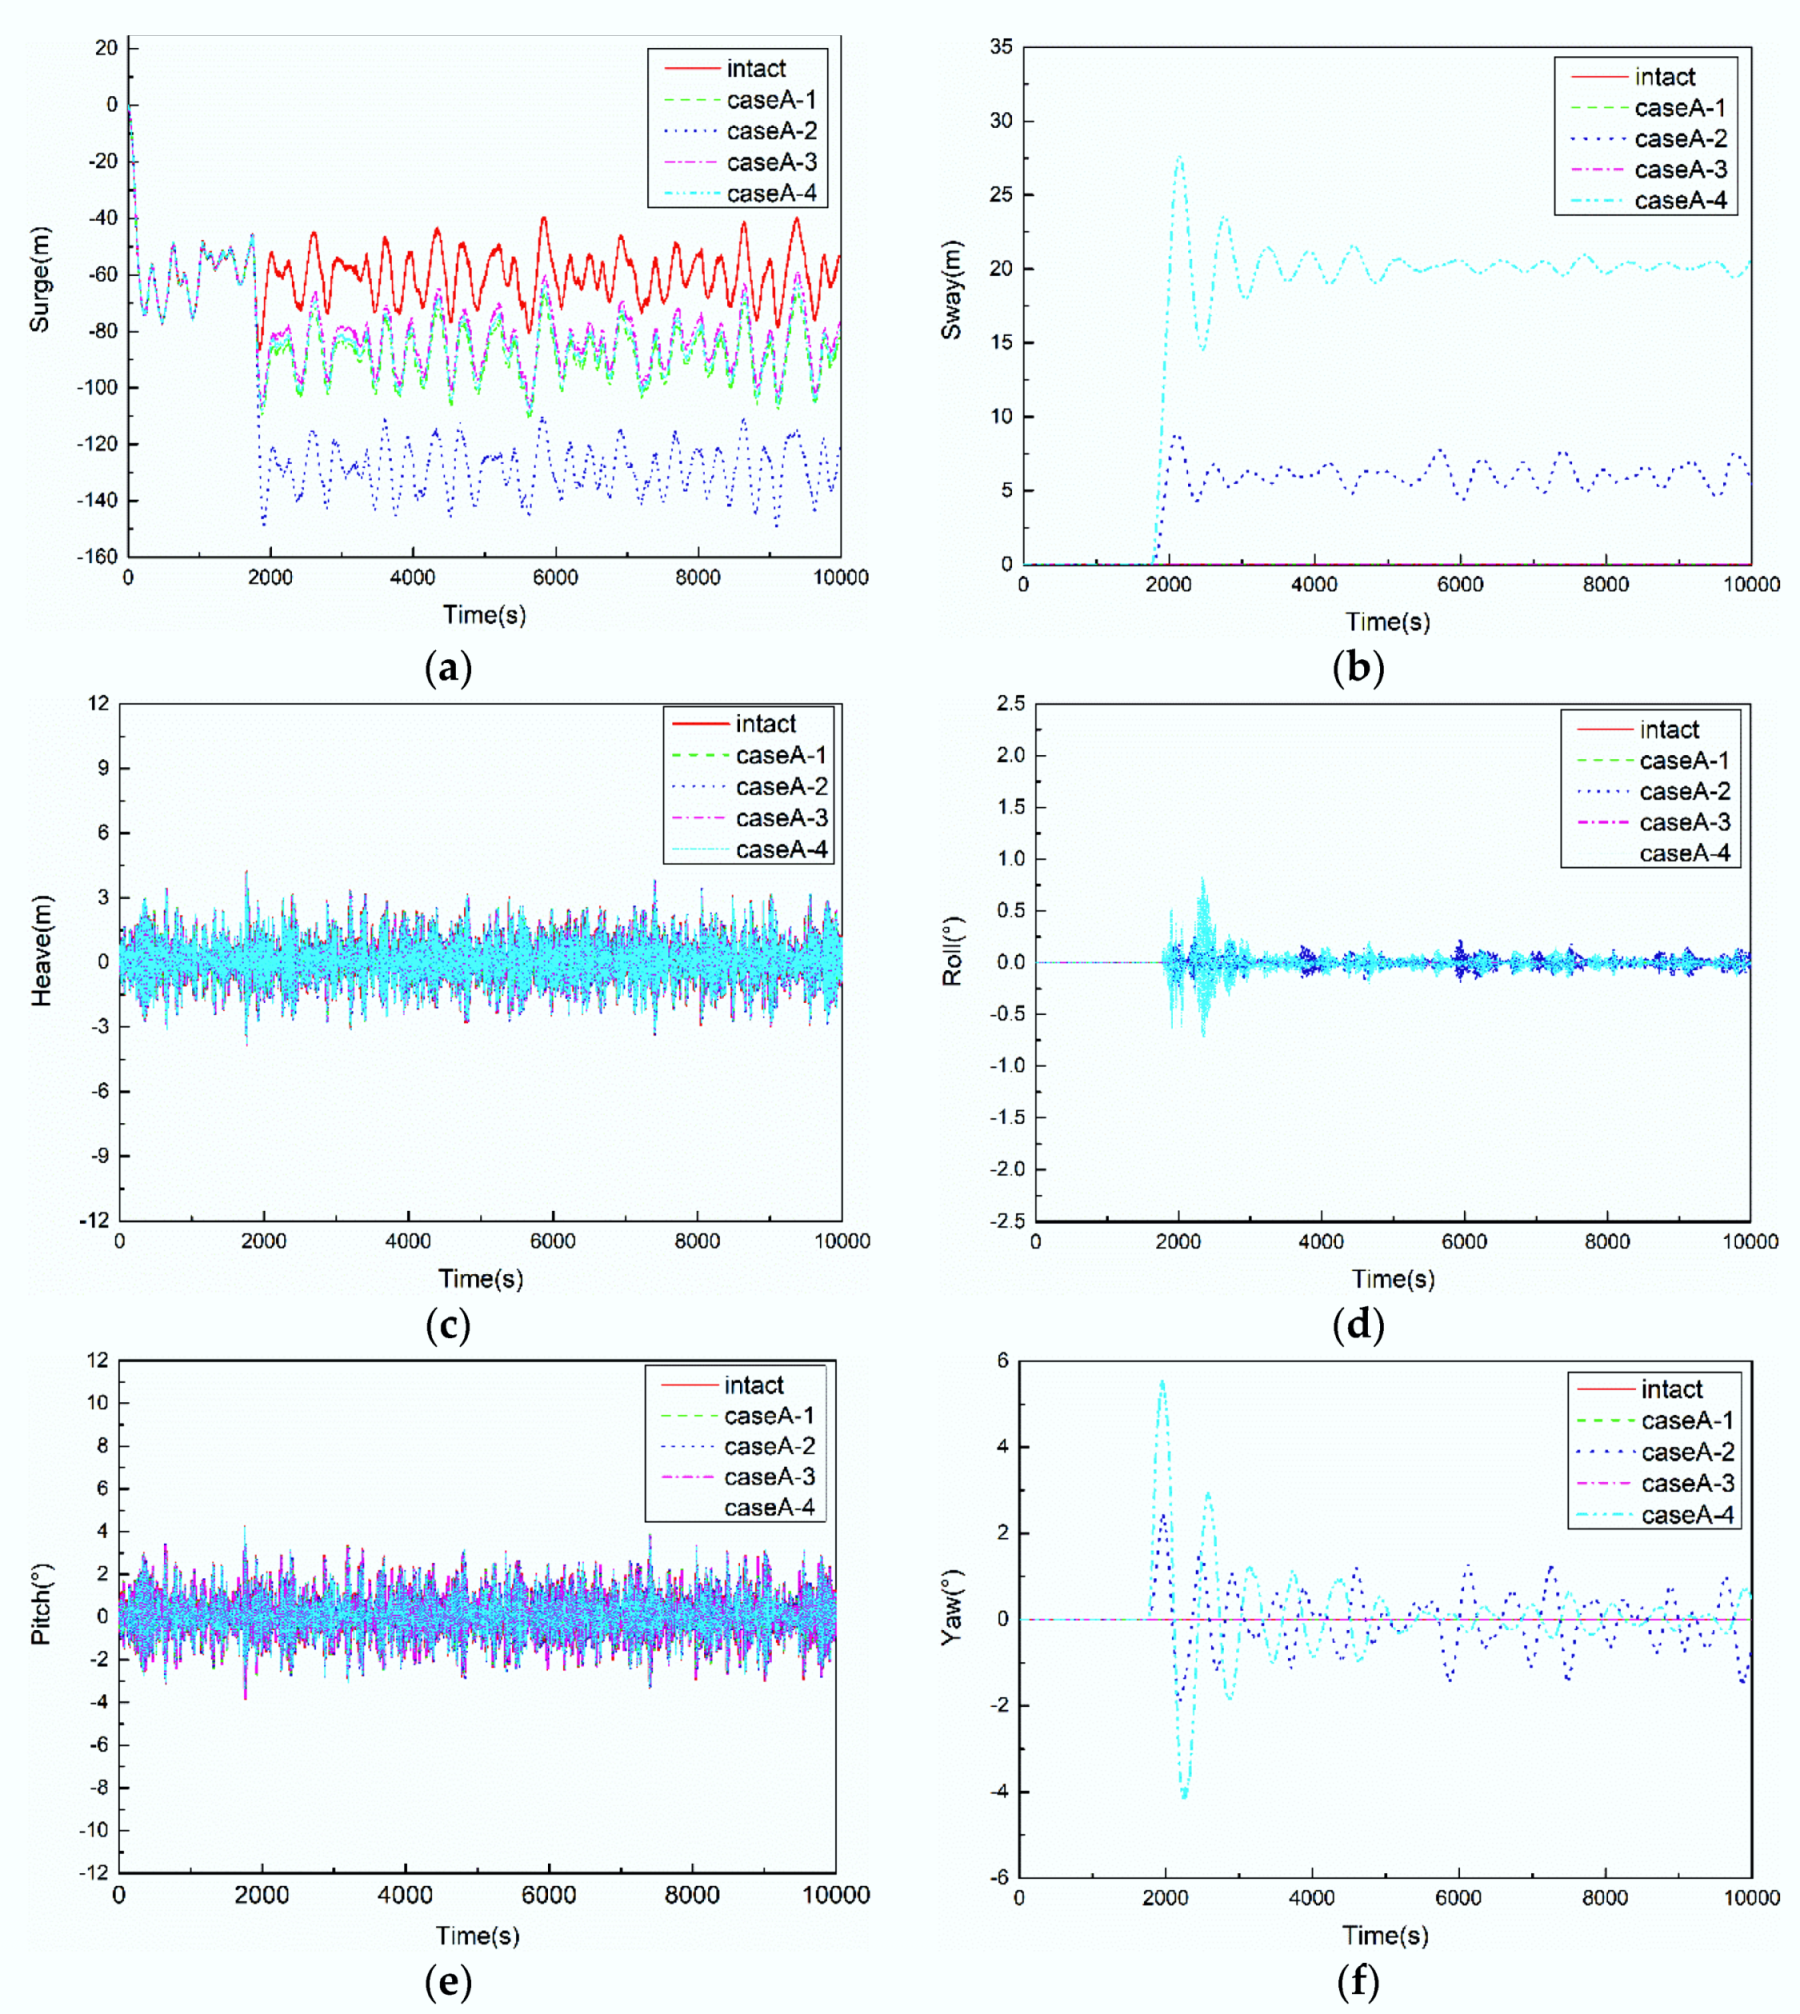
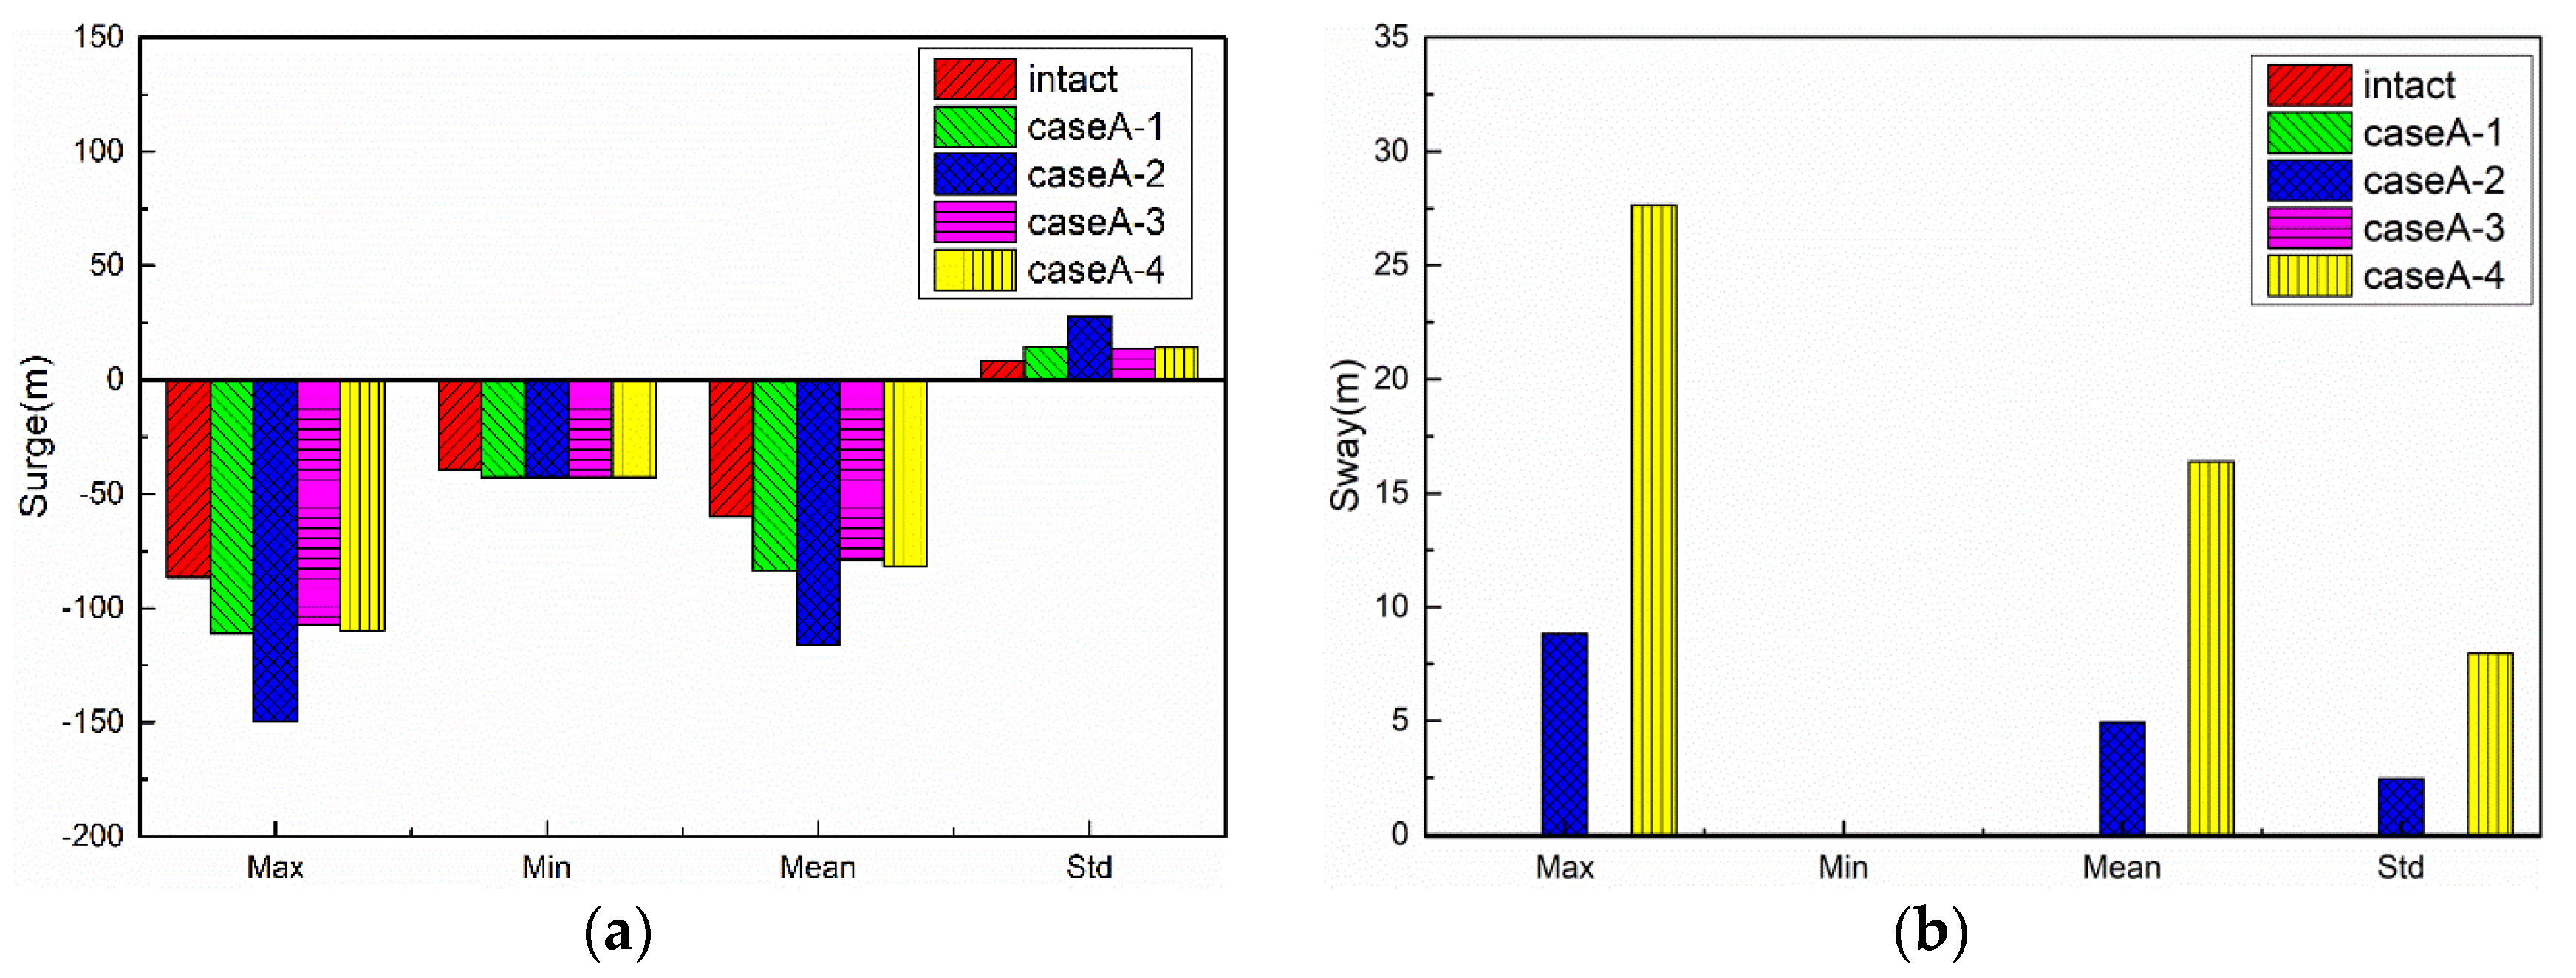
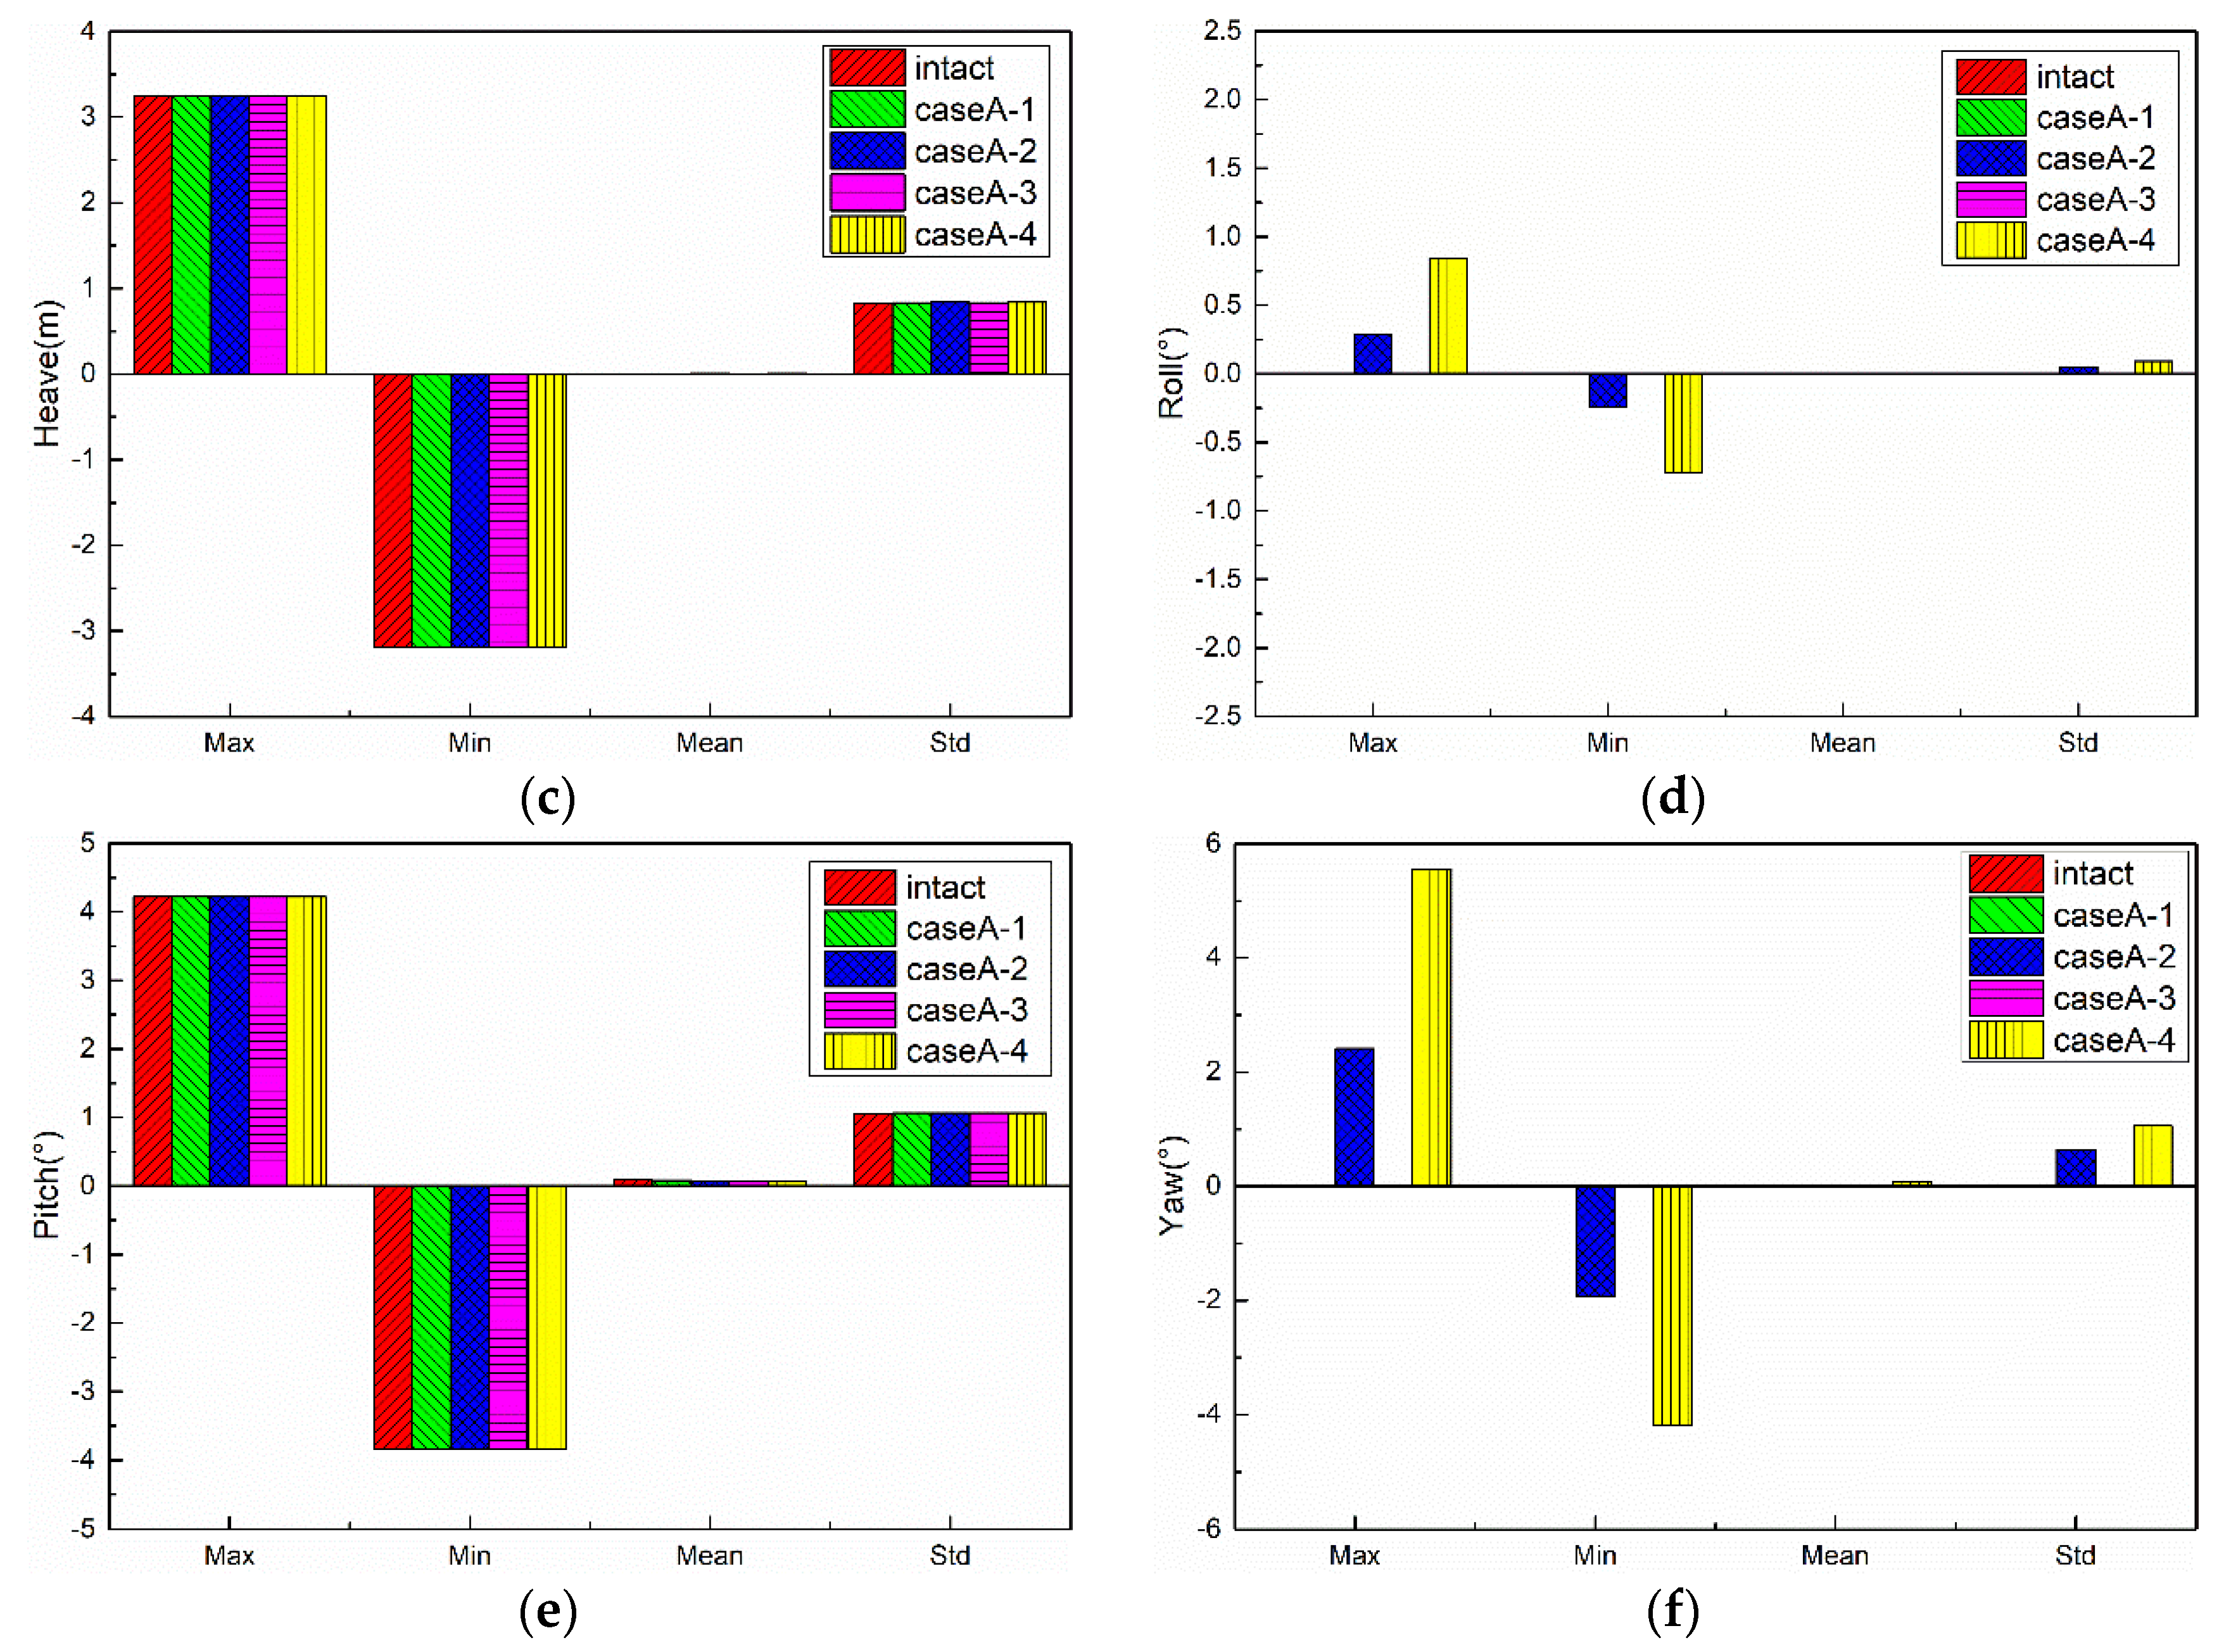
5.2.1. Motion Responses of FPSO

The traces of FPSO are shown in Figure 4, the time series of FPSO motions are shown in Figure 5, and the comparisons of FPSO motions statistics are shown in Figure 6.
Based on the simulation results of the surge motions of FPSO, the average surge motions are −83.52 and −81.87 m in CaseA-1 and CaseA-4, and they increase by 39.36% and 36.61%, respectively, compared with the intact condition. The values of the surge motions are almost the same, as the stiffness of the mooring system is the same in these two conditions. The average surge motion is −116.18 m in CaseA-2, and it increases by 93.87%, compared with the intact condition, due to the smallest stiffness of the mooring system in this condition. Although the stiffness of the mooring system is Kintact > K1 = K4 > K3 > K2 in the surge direction, the average surge motion in CaseA-3 is −79.42 m, and it only increases by 32.52%, compared with the intact condition, which is smaller than CaseA-1 and CaseA-4. The reason is that the mooring line break occurs on the opposite side, along the surge direction, and a new asymmetry about the y-axis is formed in the mooring system. The static equilibrium position of FPSO after the mooring lines’ failure in CaseA-3 is the same as the intact condition, while the static equilibrium positions of FPSO in CaseA-1 and CaseA-4 both move along the negative direction of the x-axis. The maximum, minimum, and standard deviation have similar change laws with the average surge motion. In general, the mooring lines’ failure will lead to the changes of static equilibrium position and stiffness of the mooring system, which together determine the motion responses of FPSO under a certain environmental load condition. Under the same static equilibrium position, the greater the stiffness, the smaller the FPSO motion responses. With the same stiffness, the smaller the static equilibrium position changes, the smaller the FPSO motion responses.
Based on the results of the sway motions of FPSO, a significant increase of sway motion occurs in CaseA-2 and CaseA-4, and the simulation results show almost no impact in CaseA-1 and CaseA-3. Due to the largest reduction of stiffness of the mooring system in CaseA-4, the average sway motion response reaches 16.38 m, which may also introduce a significant increase in the mooring line tension.
Based on the results of the heave motions of FPSO, there are no significant change when the mooring lines failure occur. The reason is that the stiffness of the mooring system mainly influences the motion responses of FPSO in the horizontal plane, including the surge, sway, and yaw. The motion responses of FPSO in the vertical plane, including the heave, roll, and pitch, are mainly determined by the stiffness of the waterline. Therefore, the mooring lines failure has very limited influence on the heave motion responses of FPSO.
Based on the results of the roll motions of FPSO, there is little increase in CaseA-2 and CaseA-4, while the results show almost no impact in CaseA-1 and CaseA-3. The reason is that the mooring lines’ failure in CaseA-2 and CaseA-4 causes the asymmetric stiffness of the mooring system, and the extent of asymmetry on the roll direction is larger in CaseA-4.
Based on the results of the pitch motions of FPSO, there are also no significant change when the mooring lines’ failure occurs, with the similar reason of heave motion.
Based on the results of the yaw motions of FPSO, there is also some increase in CaseA-2 and CaseA-4, with the reason of asymmetric stiffness of mooring system, and the simulation results show almost no impact in CaseA-1 and CaseA-3.

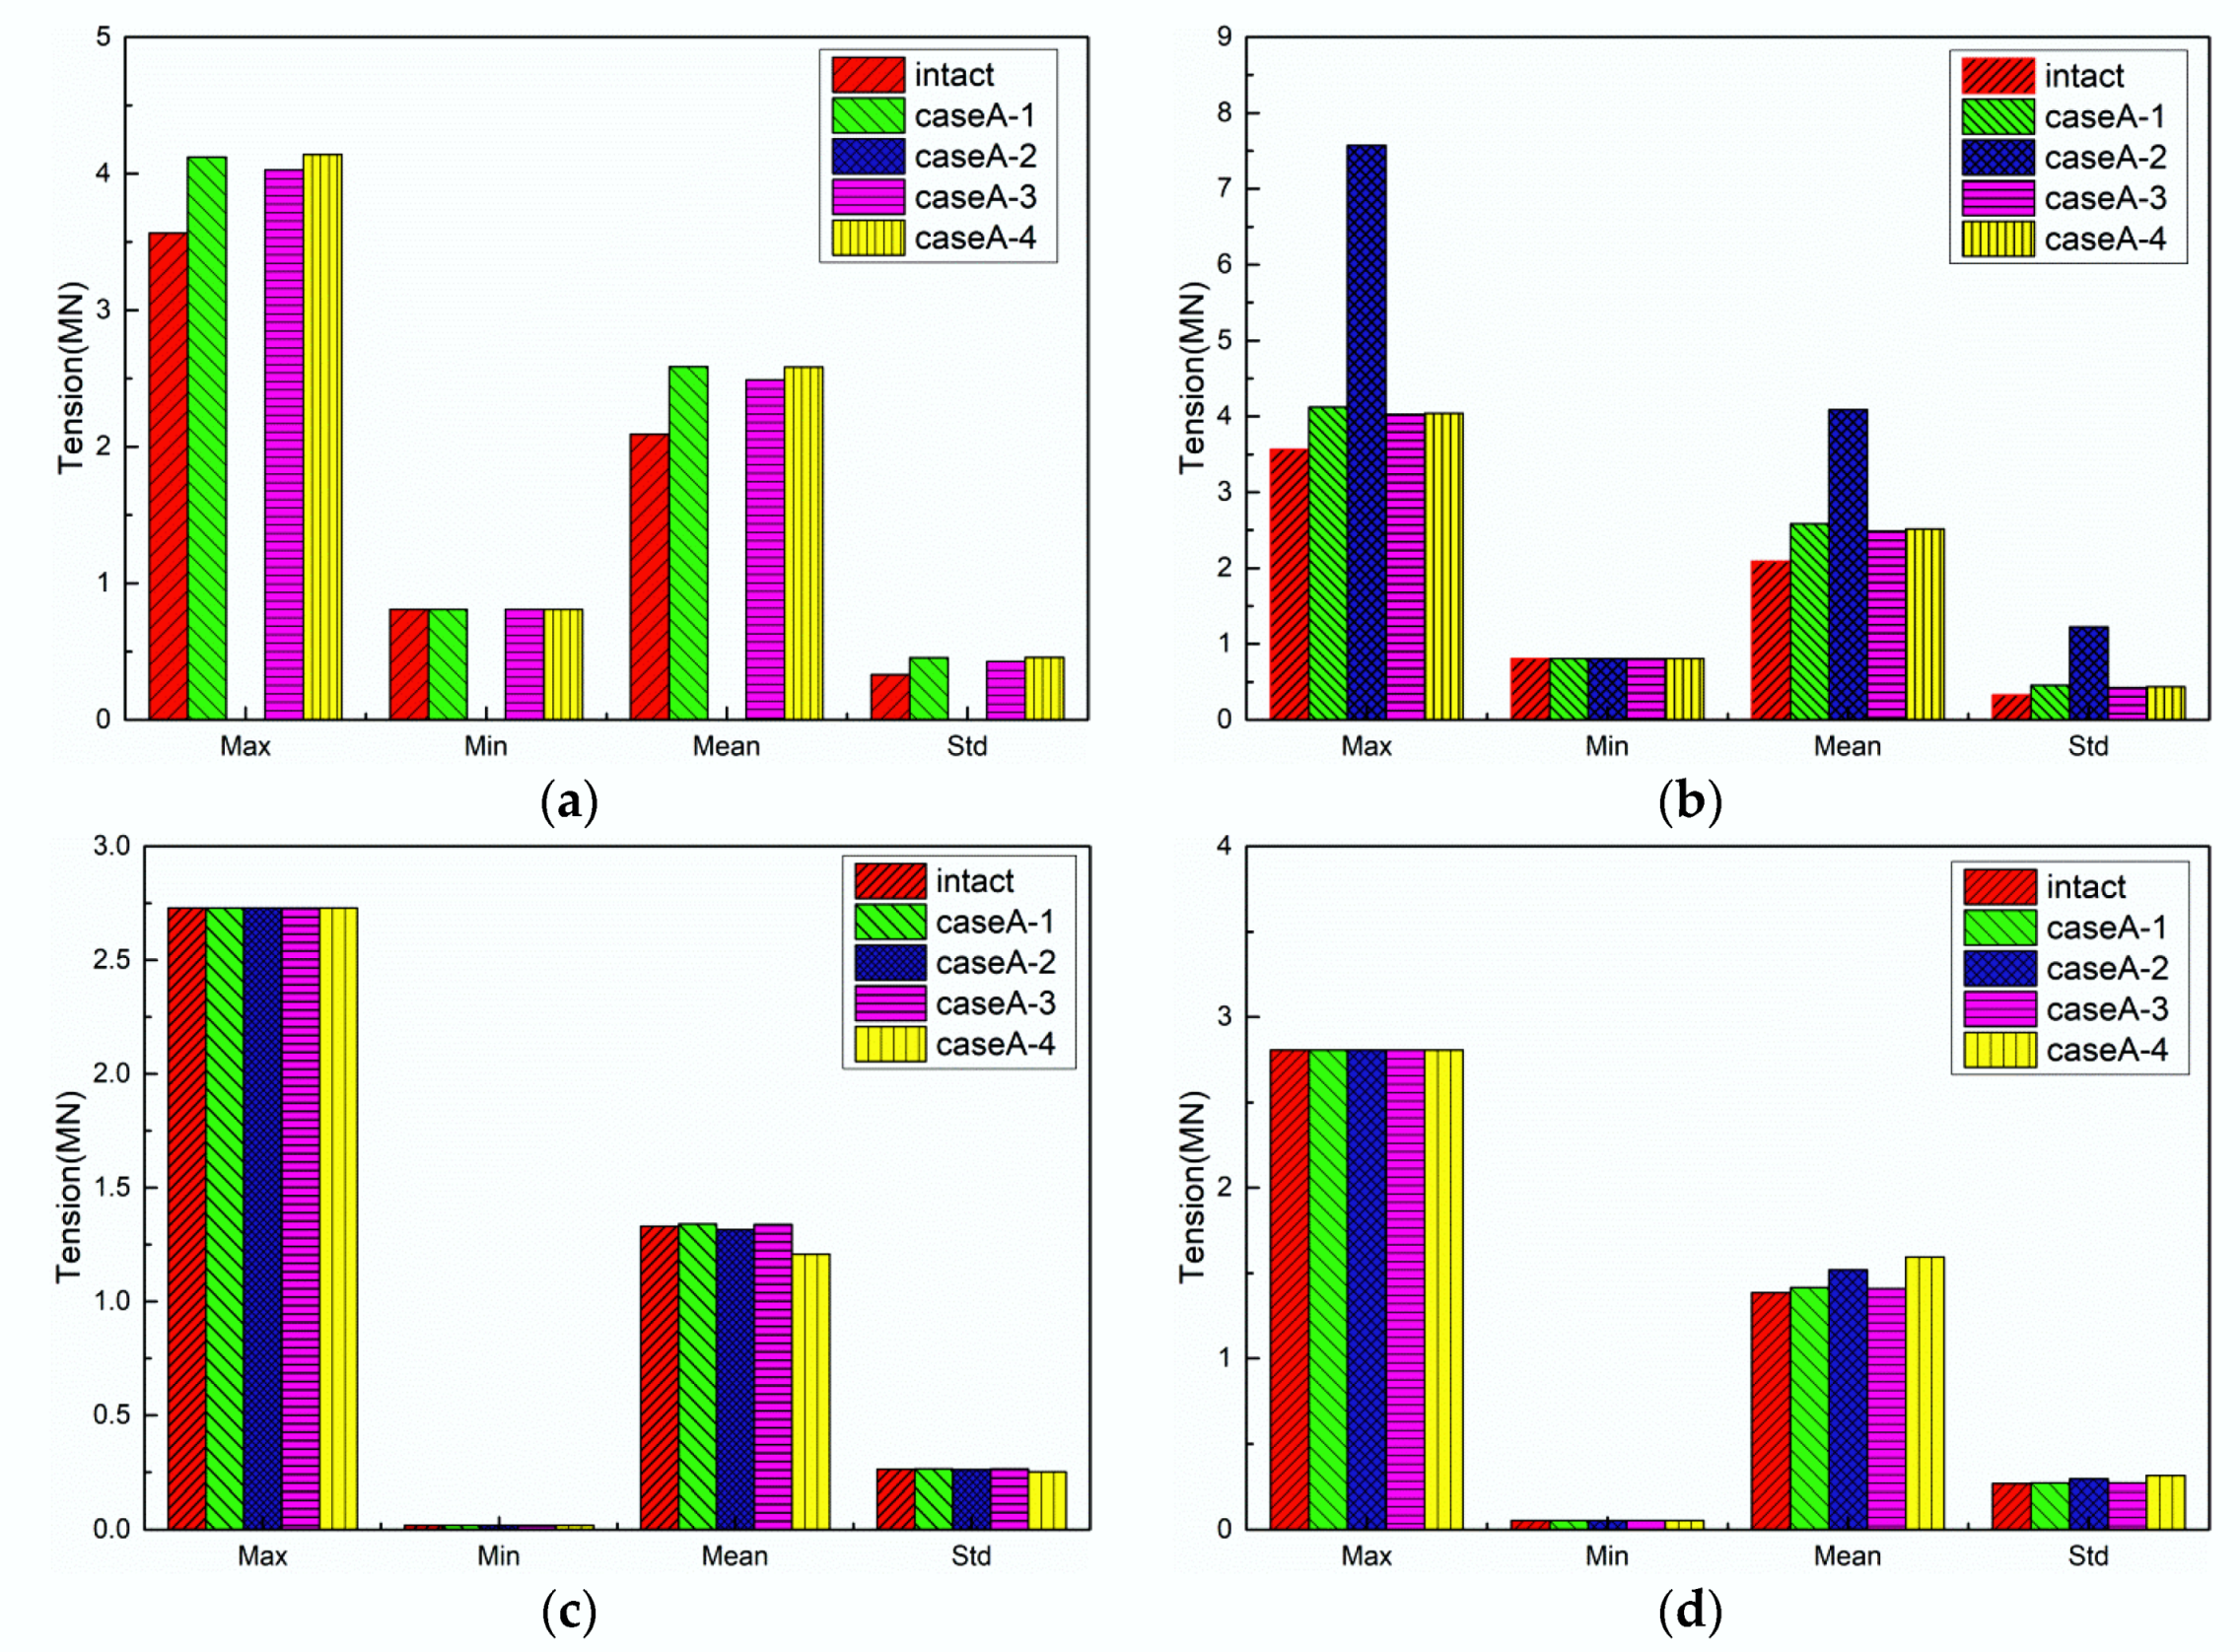
5.2.2. Mooring Line Tension

Considering the environmental load direction and the mooring lines layout, the mooring lines #1, #3, #5, and #12 were chosen as the representative mooring lines in CaseA. The time series of mooring line tensions under the intact and mooring lines’ failure conditions are shown in Figure 7, the comparisons of mooring line tensions statistics are shown in Figure 8, and the safety factor of mooring lines in CaseA are shown in Figure 9.
Based on the results of the tensions of mooring line #1, the average tensions in CaseA-1 and CaseA-4 are similar, which increases by 23.7% compared with the intact condition. The reason is that the surge motions in these two cases are similar. In CaseA-3, the surge motion is a little smaller than CaseA-1 and CaseA-4, so the tension is also slightly smaller, which increases by 19%, as compared with the intact condition.
When the mooring lines #1 and #2 fail together, only the mooring line #3 remains in the head wave direction, and the surge motion of FPSO is the largest. As a result, the tension of mooring line #3 increases to 7.574 MN within 160 s, which is 2.12 times the maximum tension and 3.62 times the average tension compared with the intact condition. The instantaneous tension of mooring line #3 will exceed the minimum breaking load, and the safety factor cannot meet the specification requirements.
In CaseA-1 and CaseA-3, the sway motion of FPSO is the same compared with the intact condition, and a significant increase occurs in CaseA-2 and CaseA-4. As a result, the tension of mooring line #5 decreases by 1% and 9.3%, respectively, in these two cases, while the tension of mooring line #12 increases by 9.67% and 15.2%, compared with the intact condition.
In summary, when a certain mooring line failure occurs, the stiffness of the mooring system changes, and the FPSO will re-move to the new equilibrium position under the effect of the remaining mooring lines. The increase in the FPSO motion responses will lead to the corresponding increase in the mooring line tension, and the change of mooring line tension is therefore closely related to the FPSO motion responses.

5.3. Results of CaseB

In this section, the motion responses of FPSO and the mooring line tensions are analyzed where the non-collinear environmental load directions of the 100-year hurricane in the Gulf of Mexico are considered. The direction of the wave is 180°, the direction of the wind is 210°, and the direction of current is 150° in CaseB.

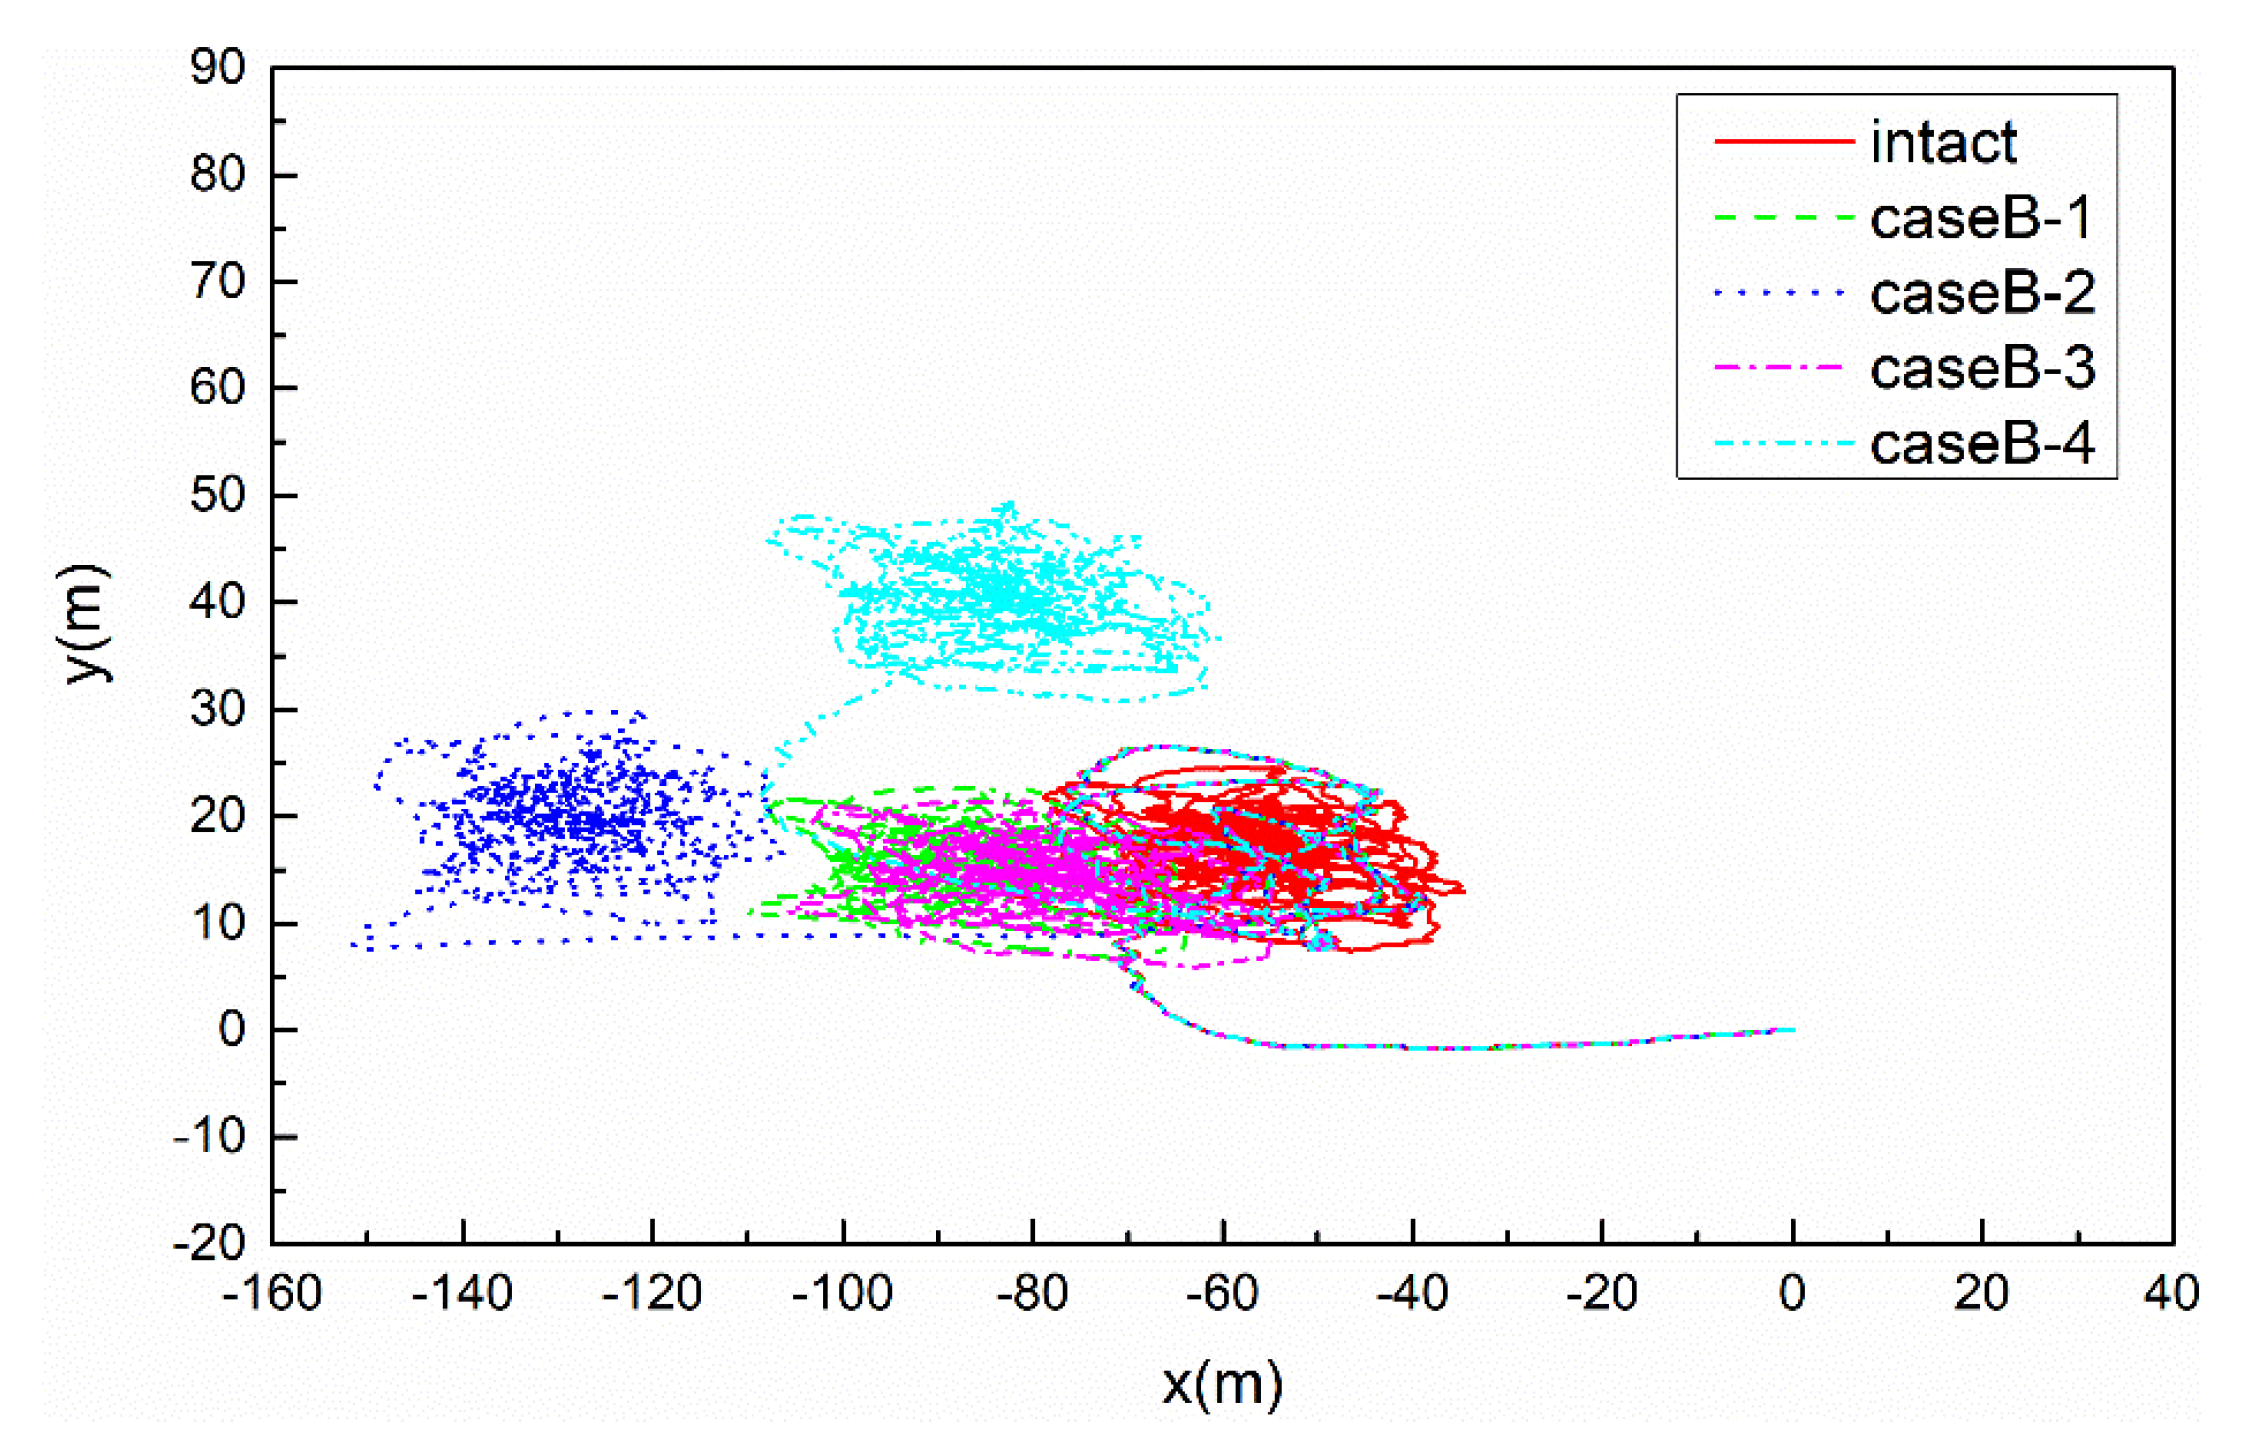
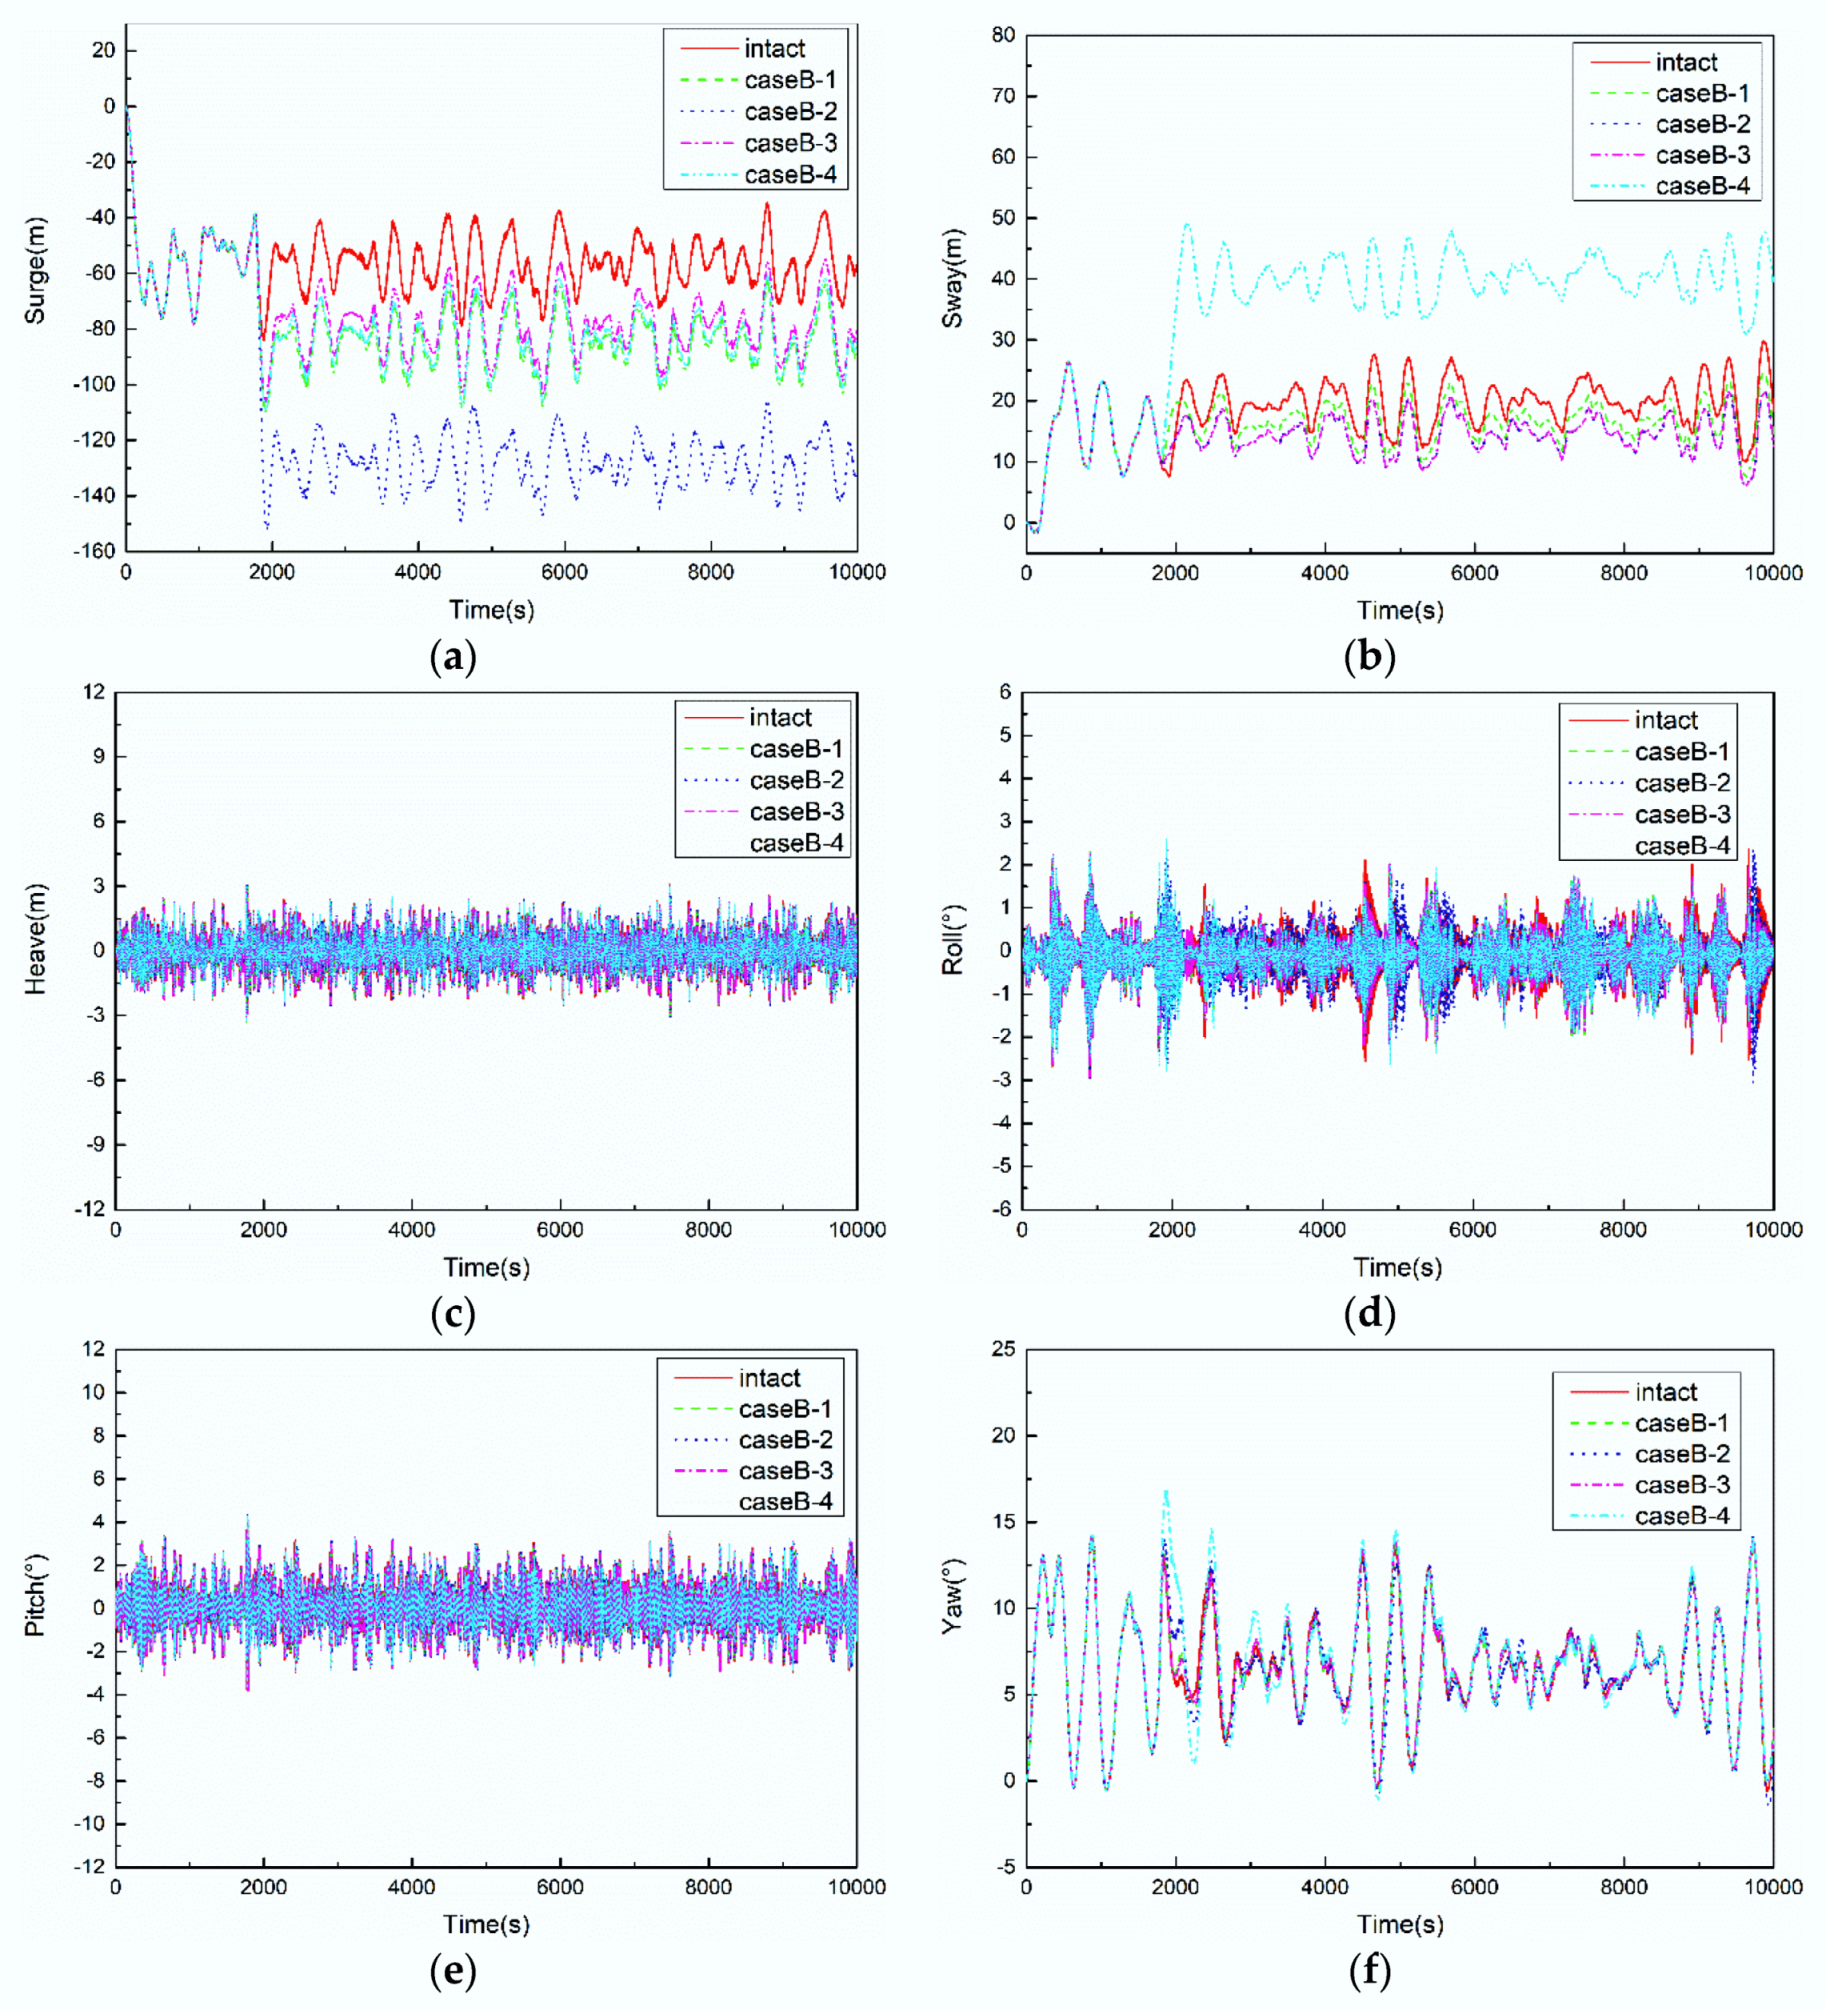
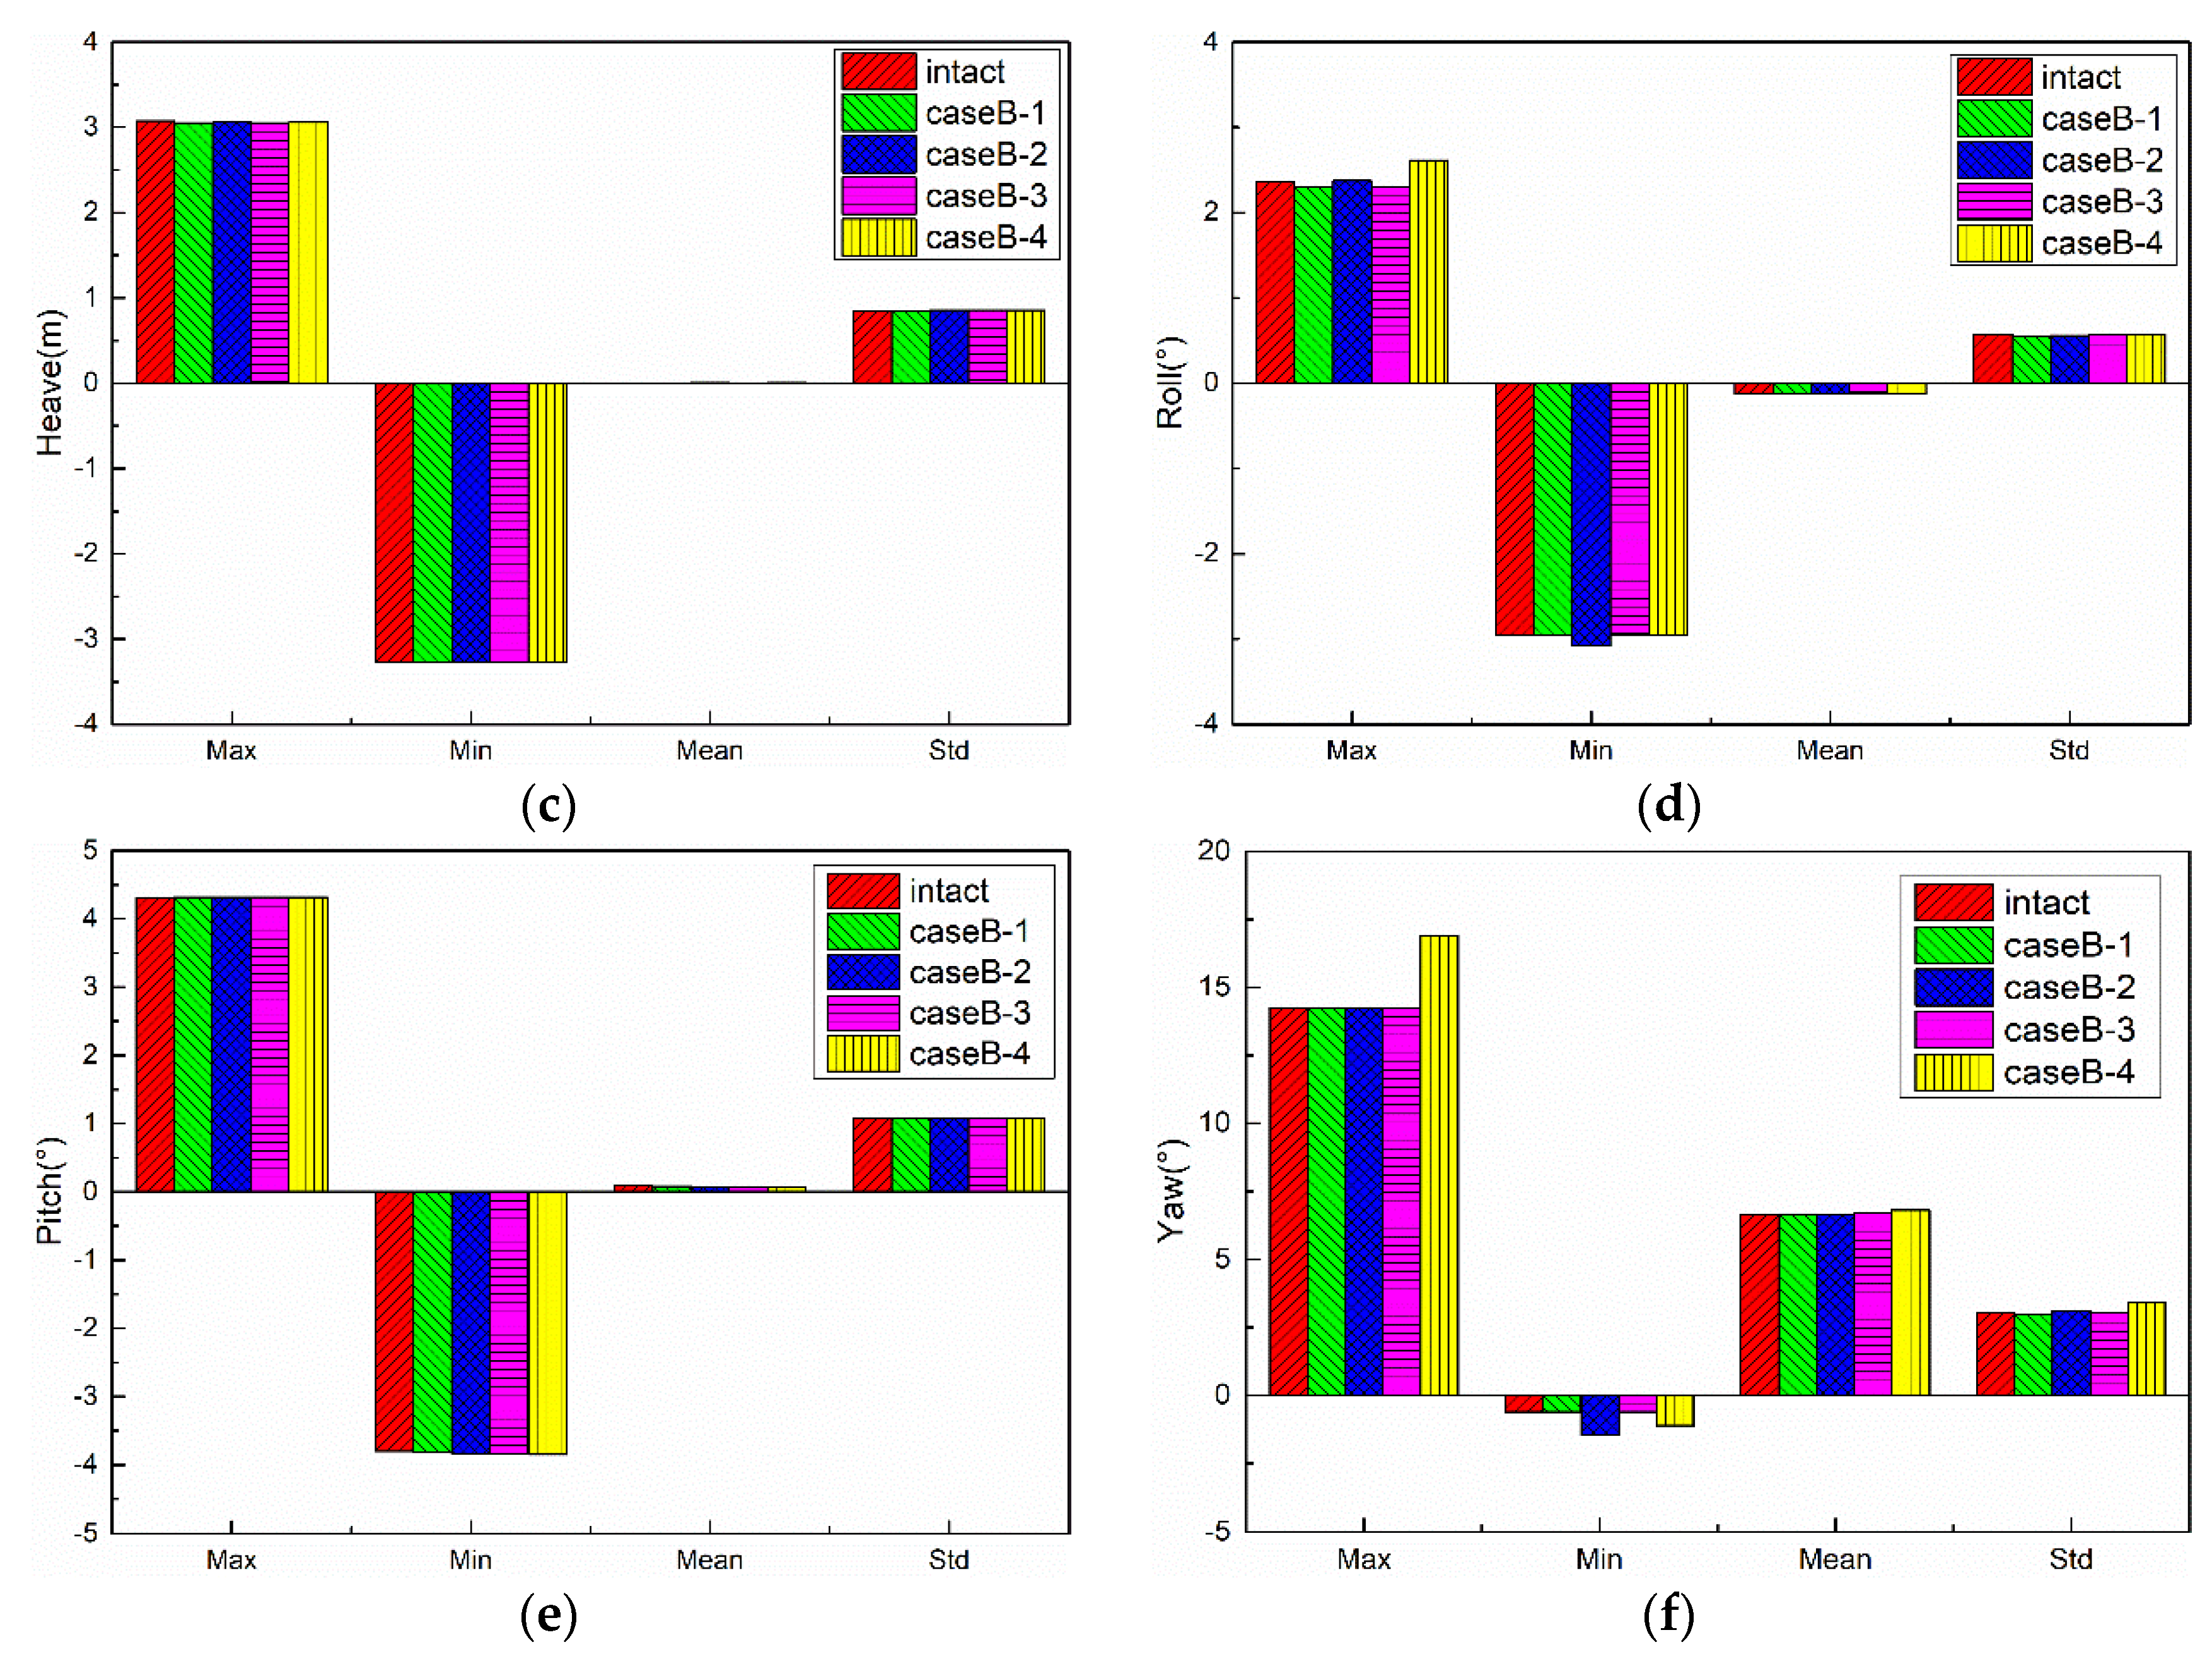
5.3.1. Motion Responses of FPSO

The traces of FPSO are shown in Figure 10, the time series of FPSO motions are shown in Figure 11, and the comparisons of FPSO motions statistics are shown in Figure 12.
Based on the results of the surge motions of FPSO, the smallest surge motion still occurs in CaseB-3, and the average surge motion is −74.993 m, increased by 33.19%, compared with the intact condition. Meanwhile, it is 5.57% smaller than that in case A-3, when the wind, wave, and current are collinear. The surge motions are −79.98 and −78.56 m in CaseB-1 and CaseB-4, which still increase similarly by 15.25% and 14.82%, compared with the intact condition, and decrease by 4.14% and 4.04%, compared with the collinear environmental condition in CaseA. The largest surge motion still occurs in CaseB-2, and the average surge motion is −14.69 m; it increases by 103.7%, compared with the intact condition; and it decreases by 1.28%, compared with the collinear environmental condition in CaseA. Comparing the results of CaseB and CaseA, it can be seen that the motion responses of FPSO are similar when the dominated wave loads are the same. When the wind, wave, and current directions are collinear, the motion responses under the same broken cases are about 3.8% larger than that under the condition of non-collinear environmental load directions with 30° between the wind, wave, and current.
Based on the results of the sway motions of FPSO, similar to CaseA, there is also an increase in sway motion in CaseB-2 and CaseB-4, but the increasing level is weaker compared with CaseA, because of the additional contribution from wind load along the negative sway direction. The largest sway motion also occurs in CaseB-4, with the same reason of the largest stiffness reduction of the mooring system. However, there are minor decreases of 11.76% and 20.74% in sway motion, as compared with the intact condition in CaseB-1 and CaseB-3, respectively. The reason is that the wind load is along the negative sway direction, while the current load is along the positive sway direction, and the wind load is larger than the current load; thus, the combination of wind and current load causes the decrease in sway motion when the stiffness of mooring system in the positive sway direction decreases slightly in CaseB-1 and CaseB-3.
Based on the results of the heave and pitch motions of FPSO, there are also no significant change when the mooring lines failure occur, with a similar reason in CaseA.
Based on the results of the roll motions of FPSO, similar to CaseA, there are also slight increases in CaseB-2 and CaseB-4, and the increasing level is weaker when compared with CaseA, because of the additional combination contribution of wind and current load. The results also show almost no impact on CaseA-1 and CaseA-3, similar to CaseA.
Based on the results of the yaw motions of FPSO, similar to CaseA, there are also slight increases in CaseB-4, and the increasing level is also weaker when compared with CaseA. The reason is that the additional combination contribution of wind and current load restrain the effects of asymmetric stiffness of mooring system. As a result, there is almost no increase of yaw motion in CaseB-2, which is different from CaseA-2.

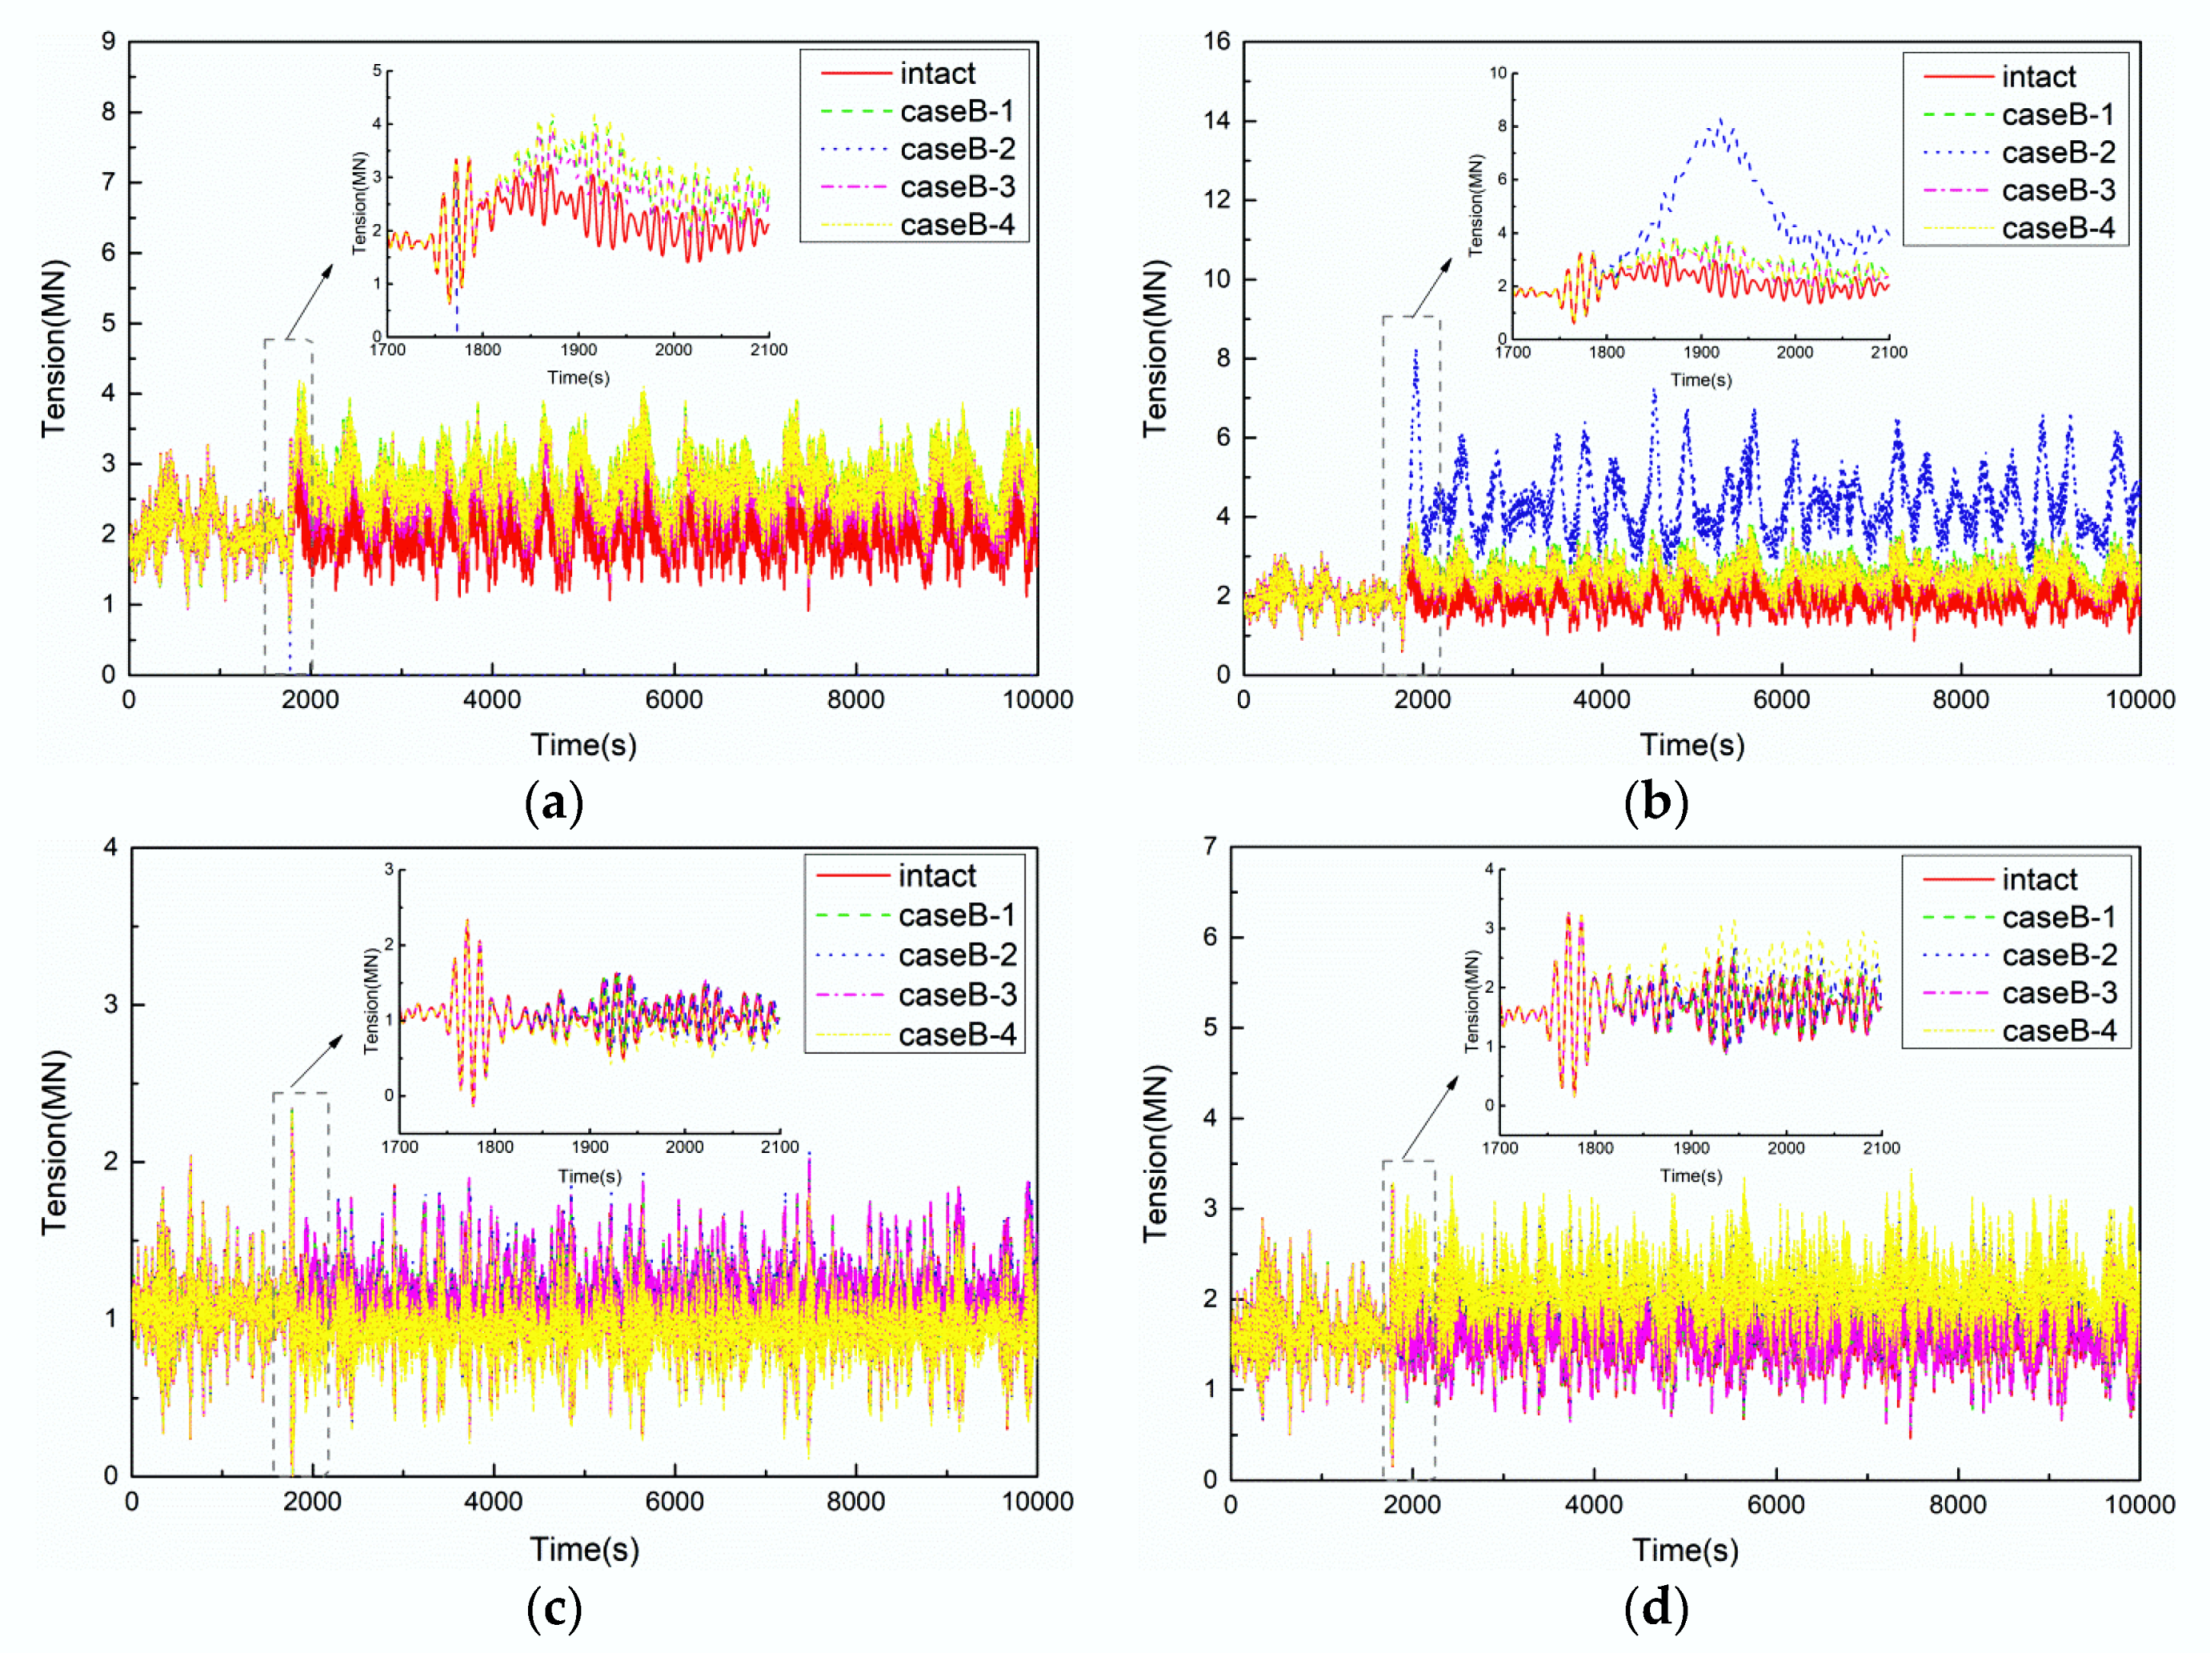
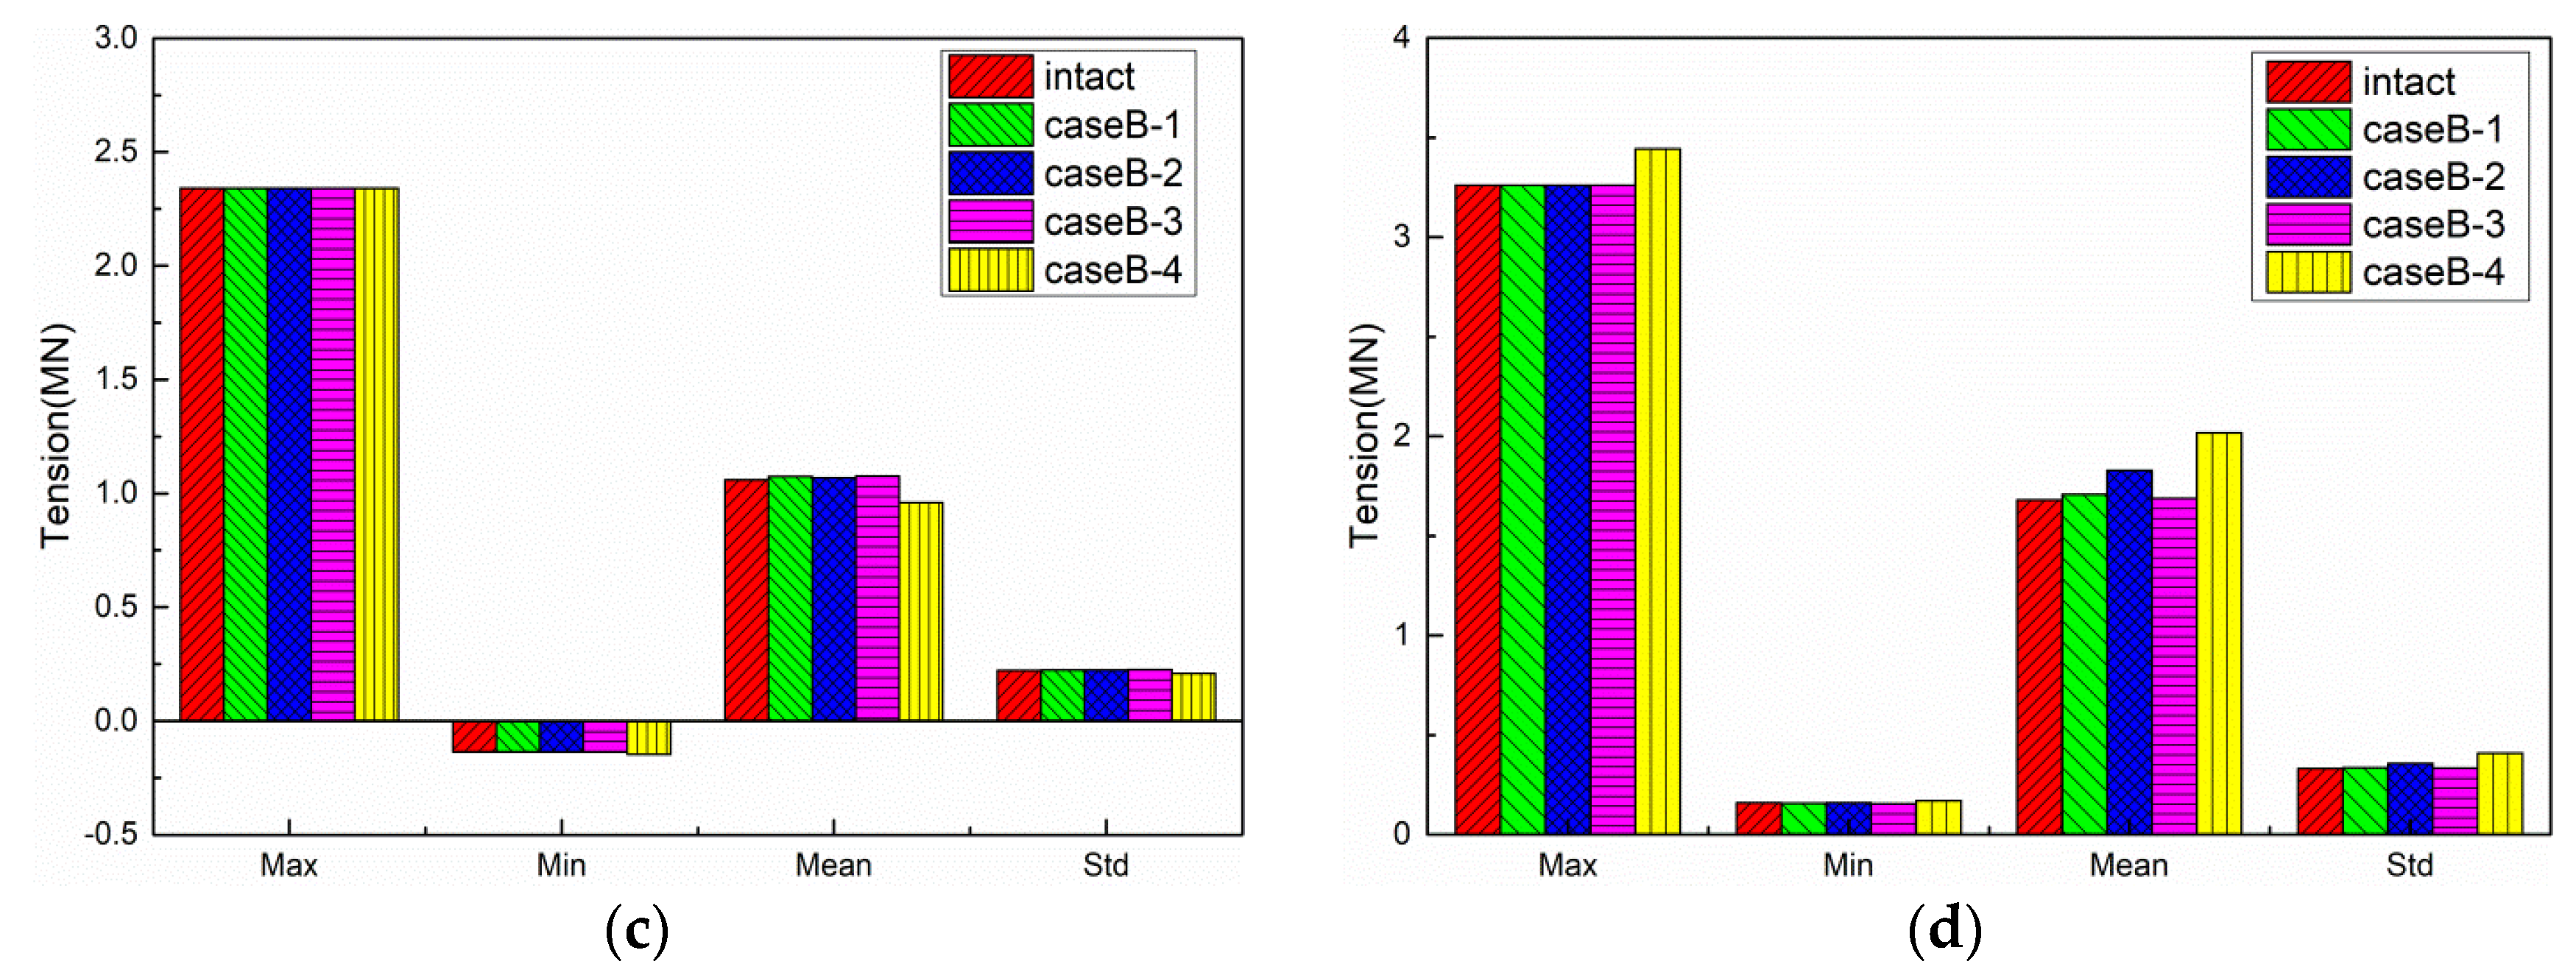
5.3.2. Mooring Line Tension

Similar to CaseA, the time series of tensions of representative mooring lines #1, #3, #5, and #12 under the intact and mooring lines’ failure conditions are shown in Figure 13; the comparisons of mooring line tensions statistics are shown in Figure 14; and the safety factor of mooring lines in CaseB are shown in Figure 15.
The maximum tension still occurs when only mooring line #3 remains in the head waves in CaseB-2. The maximum tension of mooring line #3 increases to 8.31 MN within 160 s, which is 2.6 times, compared with the intact condition. The increasing range is significant when compared with CaseA, and the reason is that the increased sway motion further increases the mooring line tension. The instantaneous tension of mooring line #3 will also exceed the minimum breaking load, and the safety factor also cannot meet the specification requirements. In general, when one or two mooring lines failure occur, the remaining mooring lines on the same side will bear the whole environmental load, and this will cause an instantaneous increase in the remaining mooring line tension, which is the most dangerous condition for the mooring system and FPSO.
The mooring line tension of #1 in CaseA and CaseB remains unchanged, except that the maximum tension in CaseB-4 is slightly larger than that in CaseA-4 when the mooring lines #2 and #11 are broken together. The reason is that the increased sway motion in CaseB-4 causes additional mooring line tension than that of CaseA-4.
The mooring line tension of #5 in CaseB is smaller than that in CaseA, while the mooring line tension of #12 in CaseB is larger than that in CaseA. The reason is that the increased sway motion in CaseB causes the counterbalanced mooring line tension for the unloaded mooring line #5 and causes the additional mooring line tension for the unloaded mooring line #12.
In general, when the non-collinear environmental load directions are considered, the wave load is also dominant, and the wind load is larger than the current load. The wind load has a contribution to the negative sway direction, while the current load has a contribution to the positive direction of sway direction. Under the combination of non-collinear wave, wind, and current load, the motion responses of FPSO and corresponding mooring line tensions are changed, as compared with the collinear environmental load condition.

5.4. Results of CaseC

In this section, the motion responses of FPSO and the mooring line tensions are analyzed where the other collinear environmental load directions of the 100-year hurricane in the Gulf of Mexico are considered. The directions of the wave, wind, and current are all 135° in CaseC.

5.4.1. Motion Responses of FPSO

The traces of FPSO are shown in Figure 16, the time series of FPSO motions are shown in Figure 17, and the comparisons of FPSO motions statistics are shown in Figure 18.
Comparing the surge motions responses of CaseC and CaseA, it can be seen that the manner of change in surge motions responses of FPSO is very similar. The smallest surge motion still occurs in caseC-3, and the increasing level is weaker compared with CaseA-3 due to the force in the surge motion decomposed from the total environmental load. The surge motions in CaseC-1 and CaseC-4 are still similar compared with the intact condition. The largest surge motion still occurs in CaseB-2, and the maximum surge motion is −79.26 m, increased by 3.4 times when compared with the intact condition.
Comparing the sway motions responses of CaseC and CaseA, it can be seen that the manner of change in sway motions responses of FPSO are also very similar. The increase in sway motion occurs in CaseC-2 and CaseC-4, and the increasing level is weaker compared with CaseA, for the same reason as the surge motion changes. However, there are minor decreases of 1.23% and 2.29% in the sway motion, compared with the intact condition in CaseC-1 and CaseC-3, respectively. The reason is that the tension of mooring line #1 is along the negative sway motion, while the tensions of mooring line #2 and #8 are both along the positive sway motion under the collinear environmental load direction of 135°. The tension contribution from the mooring line along the positive sway motion decreases when the mooring line #2 fails in CaseC-1 and mooring lines #2 and #8 both fail in CaseC-3.
Similar to CaseA, there is also no significant change in heave and pitch motions of FPSO when the mooring lines failure occurs.
The roll motions of FPSO in CaseC are significantly larger than those in CaseA, and the reason is that the environmental load decomposition is much larger in CaseC. Due to the symmetric failure of mooring lines #2 and #11 in CaseC-4, the roll motions are almost the same as the intact condition. The failure of mooring line #2 in CaseC-1 induces further asymmetry than the failure of mooring lines #2 and #8 in CaseC-3; thus, the roll motions in CaseC-1 are slightly larger than that in CaseC-3.
Based on the results of the yaw motions of FPSO, similar to the roll motions, the yaw motions are mainly determined by the symmetry reduction of mooring lines failure.

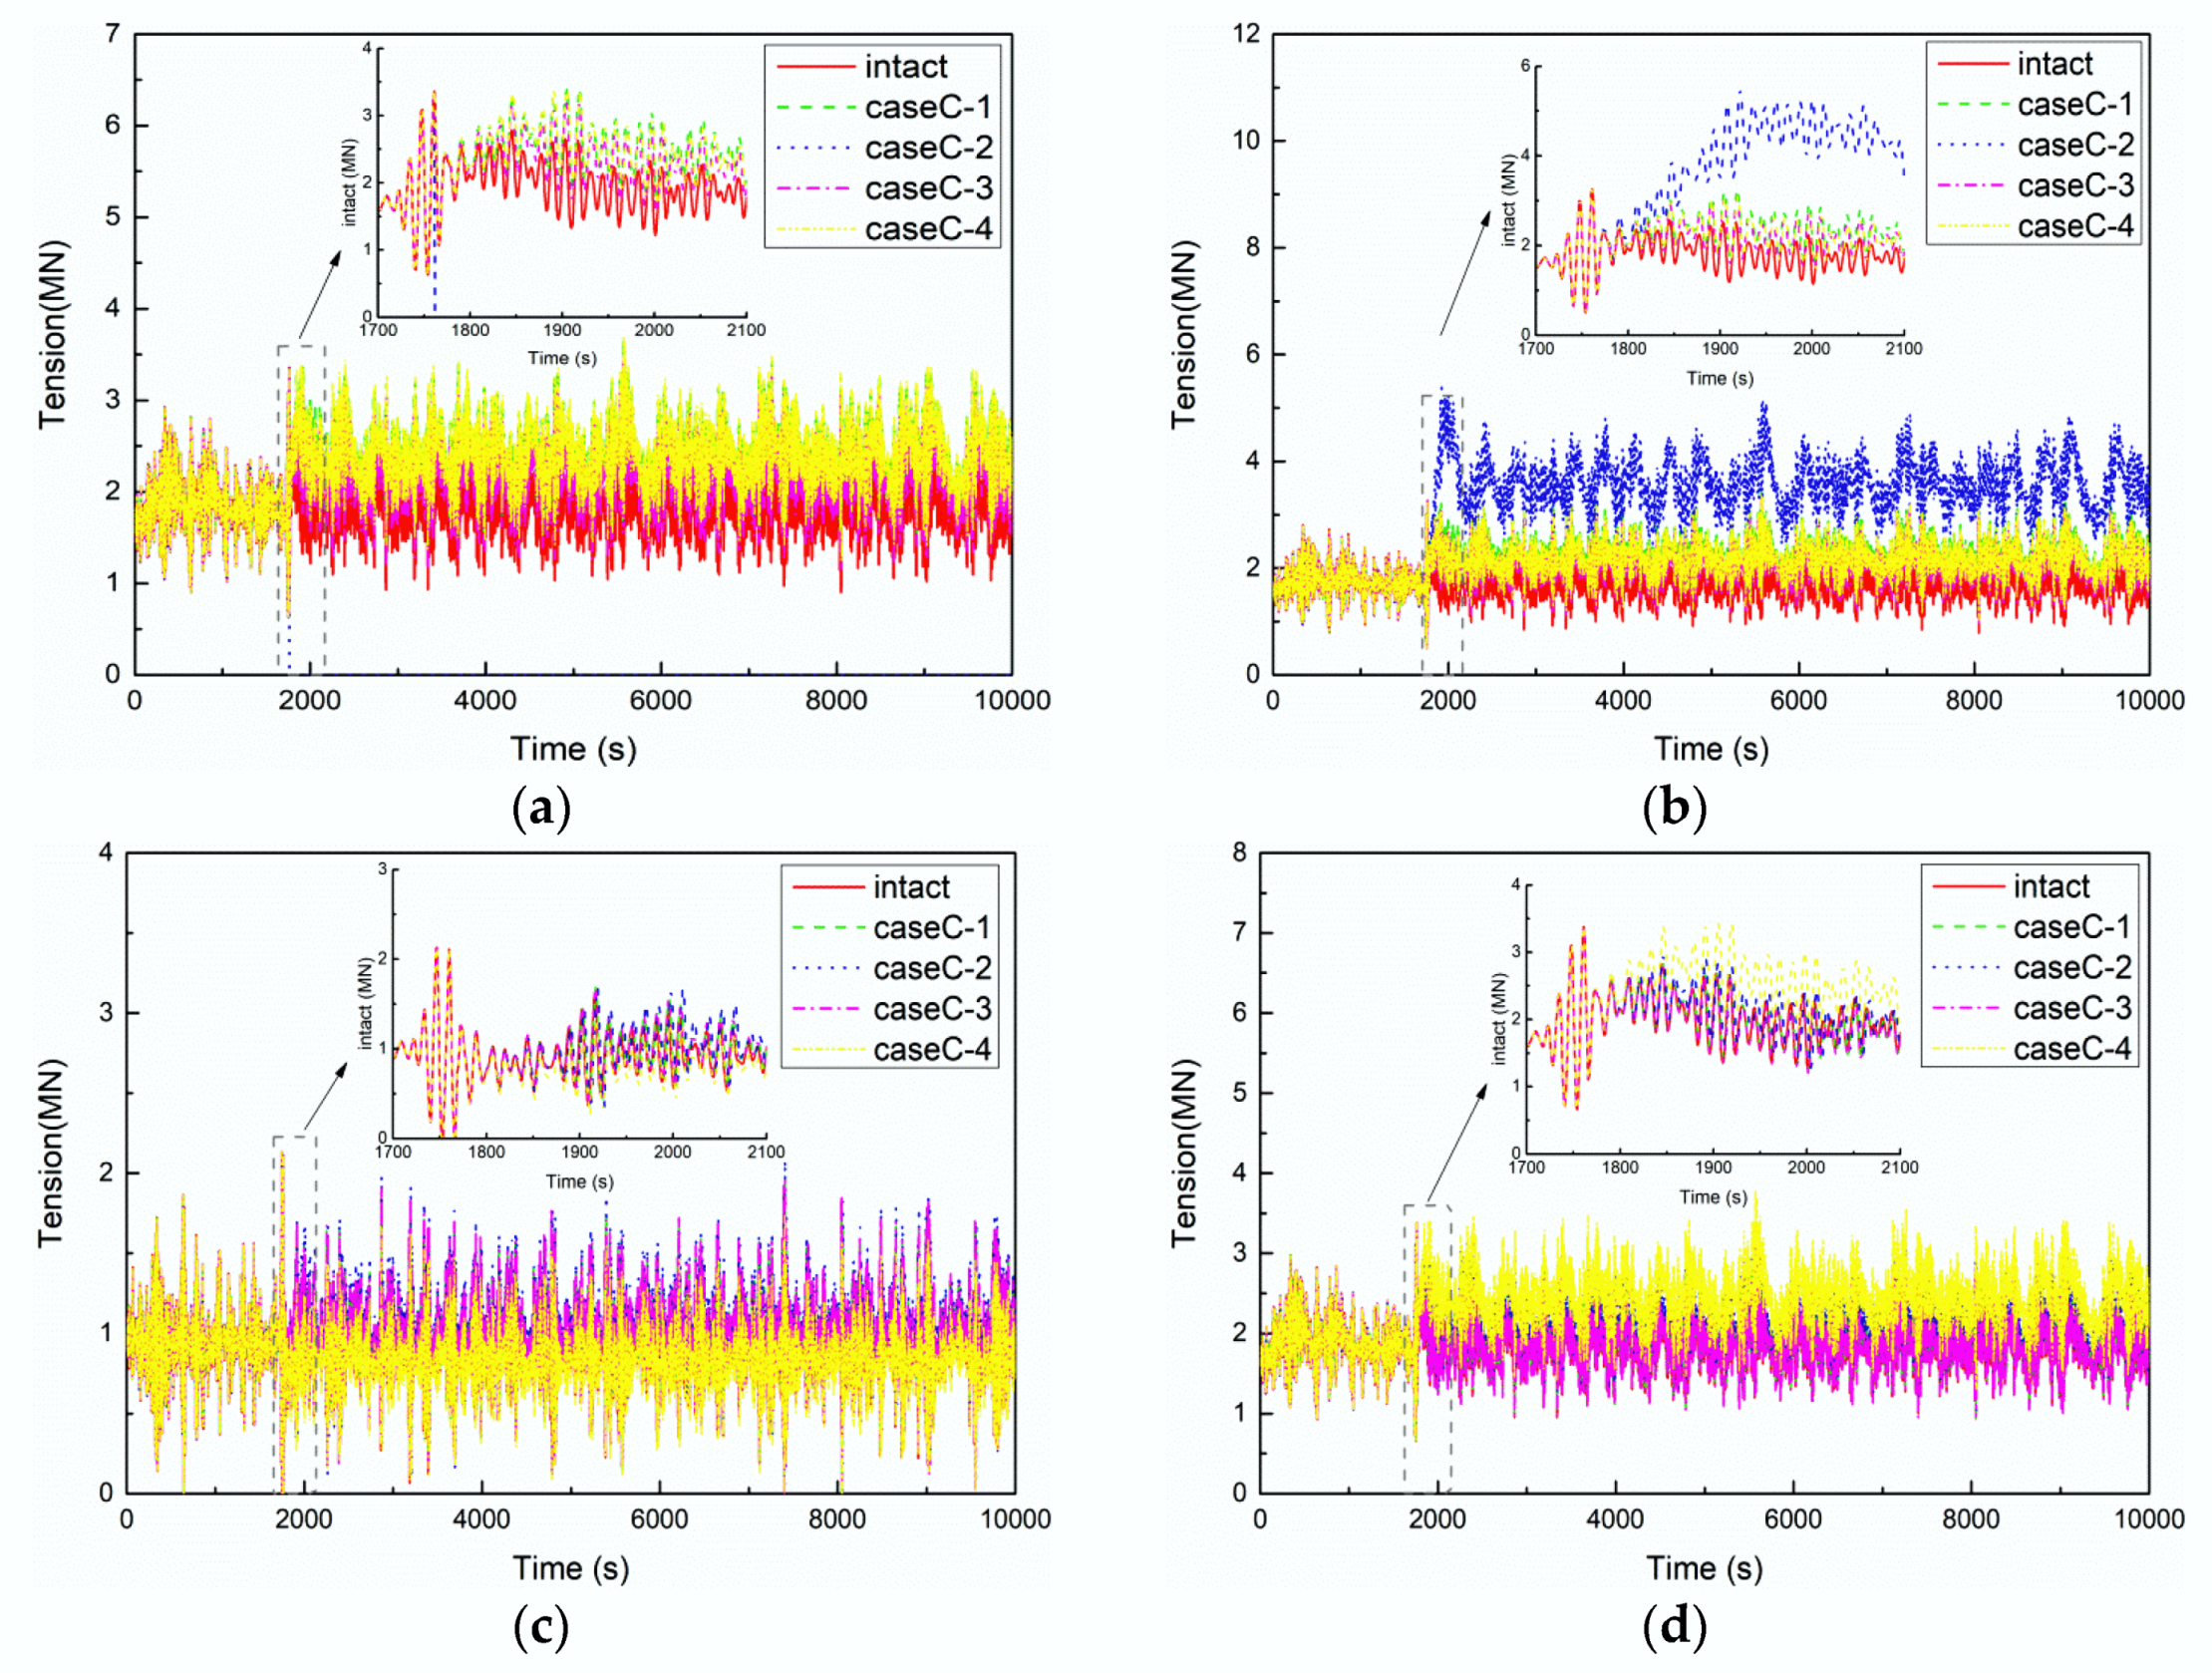
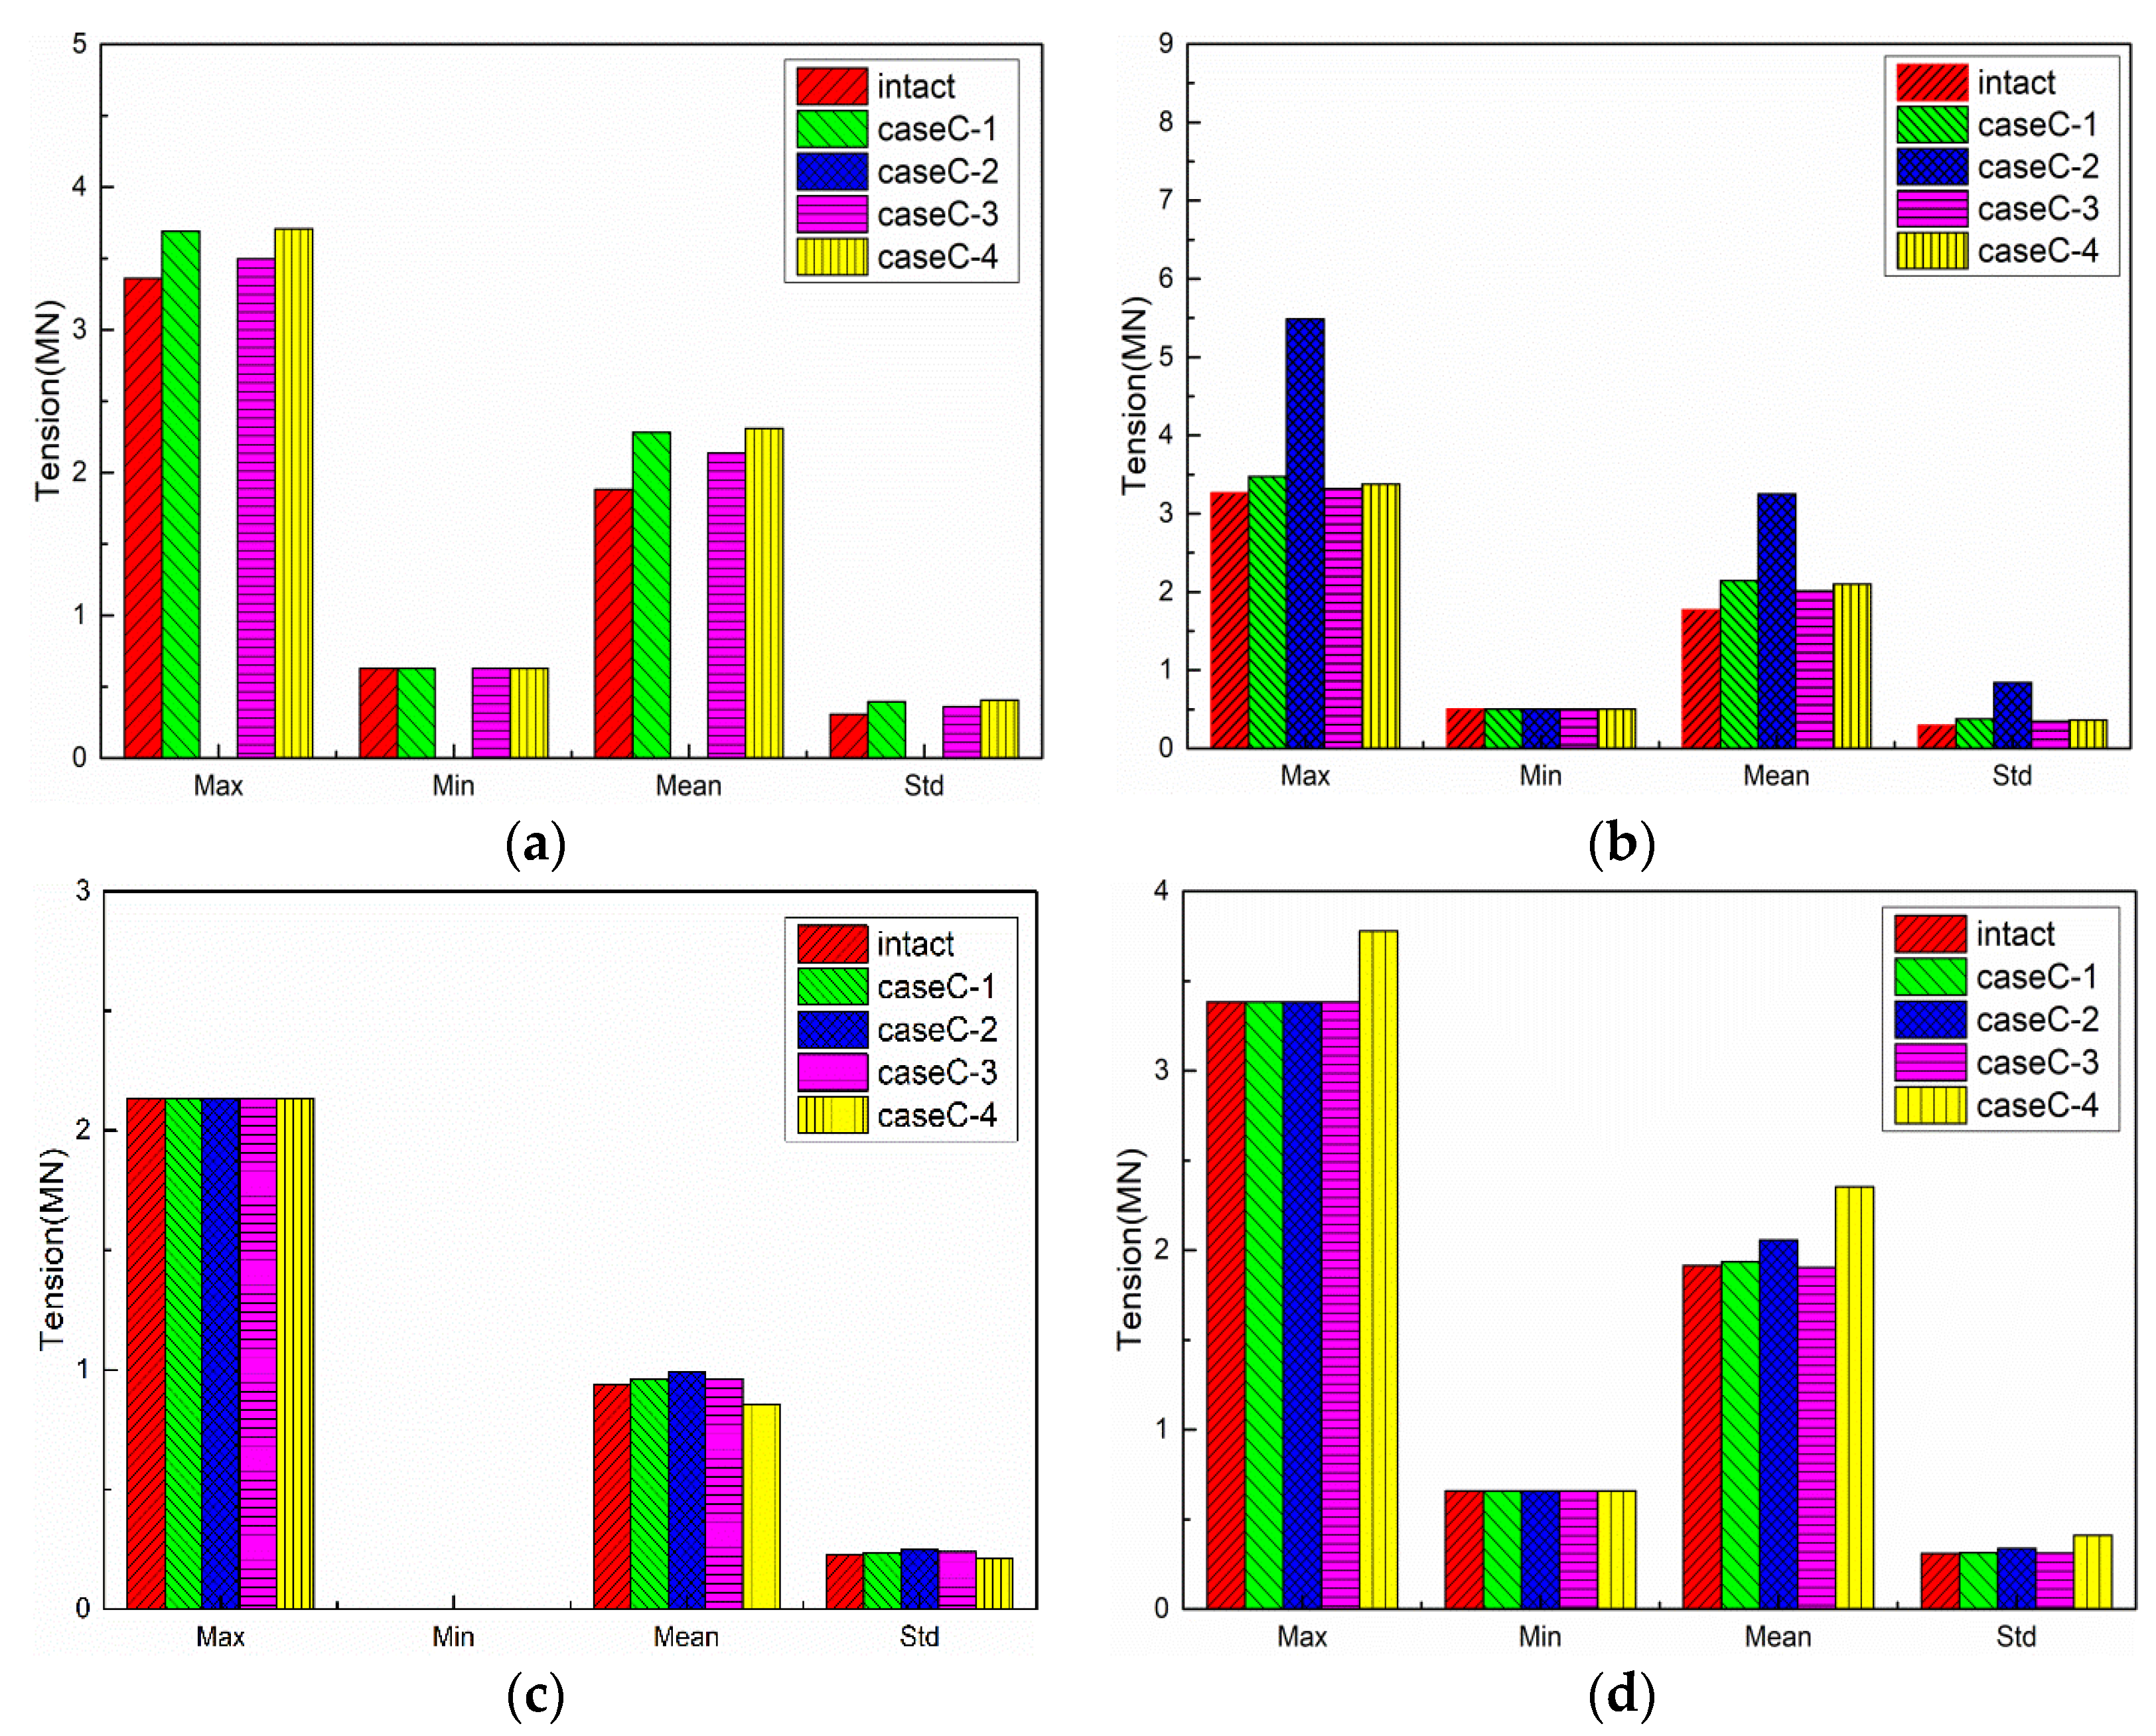
5.4.2. Mooring Line Tension

Similar to CaseA and CaseB, the time series of tensions in representative mooring lines #1, #3, #5, and #12 under the intact and mooring lines’ failure conditions are shown in Figure 19; the comparisons of mooring line tensions statistics are shown in Figure 20; and the safety factor of mooring lines in CaseC are shown in Figure 21.
Similar to CaseA, the maximum tension still occurs when only mooring line #3 remains in CaseC-2. The maximum tension of mooring line #3 increases to 5.49 MN within 160 s, which is 1.84 times of that under the intact condition. The increasing level is weaker than that in CaseA-2 and CaseB-2, and the reason is that the surge motions’ responses are smaller in CaseC-2.
The manners of change are almost the same in CaseC and CaseA, except that the tension of mooring line #1 in CaseC is smaller than that in CaseA. The reason is that the surge motion in CaseC is smaller, as shown in Section 5.4.1.
The tension of mooring line #5 in CaseC is also smaller than that in CaseA, and the reason is that the environmental load in CaseC is decomposed from that in CaseA and the increased positive sway motion decreases the tension of mooring line #5.
The tension of mooring line #12 in CaseC is larger than that in CaseA, and the reason is that the increased positive sway motion increases the tension of mooring line #12.
In summary, when the collinear environmental load directions change from 180° to 135°, the decreased positive surge motion and the increased positive sway motion collectively influence the changes of mooring line tensions.

5.5. Comparison of Different Sea States

In this section, the motion responses of FPSO and the mooring line tensions are analyzed where the collinear environmental load directions of operation sea state in the Gulf of Mexico are considered. The directions of the wave, wind, and current are all 180° in CaseD.

5.5.1. Motion Responses of FPSO

The traces of FPSO are shown in Figure 22, the time series of FPSO motions are shown in Figure 23, and the comparisons of FPSO motions statistics is shown in Figure 24.
Comparing the motion results of CaseA, we see that all values of the surge, sway, heave, roll, and pitch are much smaller in CaseD, with the reason that the environmental loads of operation condition are smaller than that of 100-year hurricane condition. Meanwhile, compared with the intact condition, the increase rate considering the mooring lines failure in CaseD is much larger than that of CaseA. Besides this, the yaw motion in CaseD-4 is slightly larger than that in CaseA-4. When the mooring lines #2 and #11 are broken in CaseA/D-4, the asymmetry of the mooring system will cause the yaw motion, and the change in yaw motion is determined by the environmental loads and stiffness of the mooring system. Compared with CaseA-4, the decrease rate of stiffness is larger than that of the environmental loads in CaseD-4.

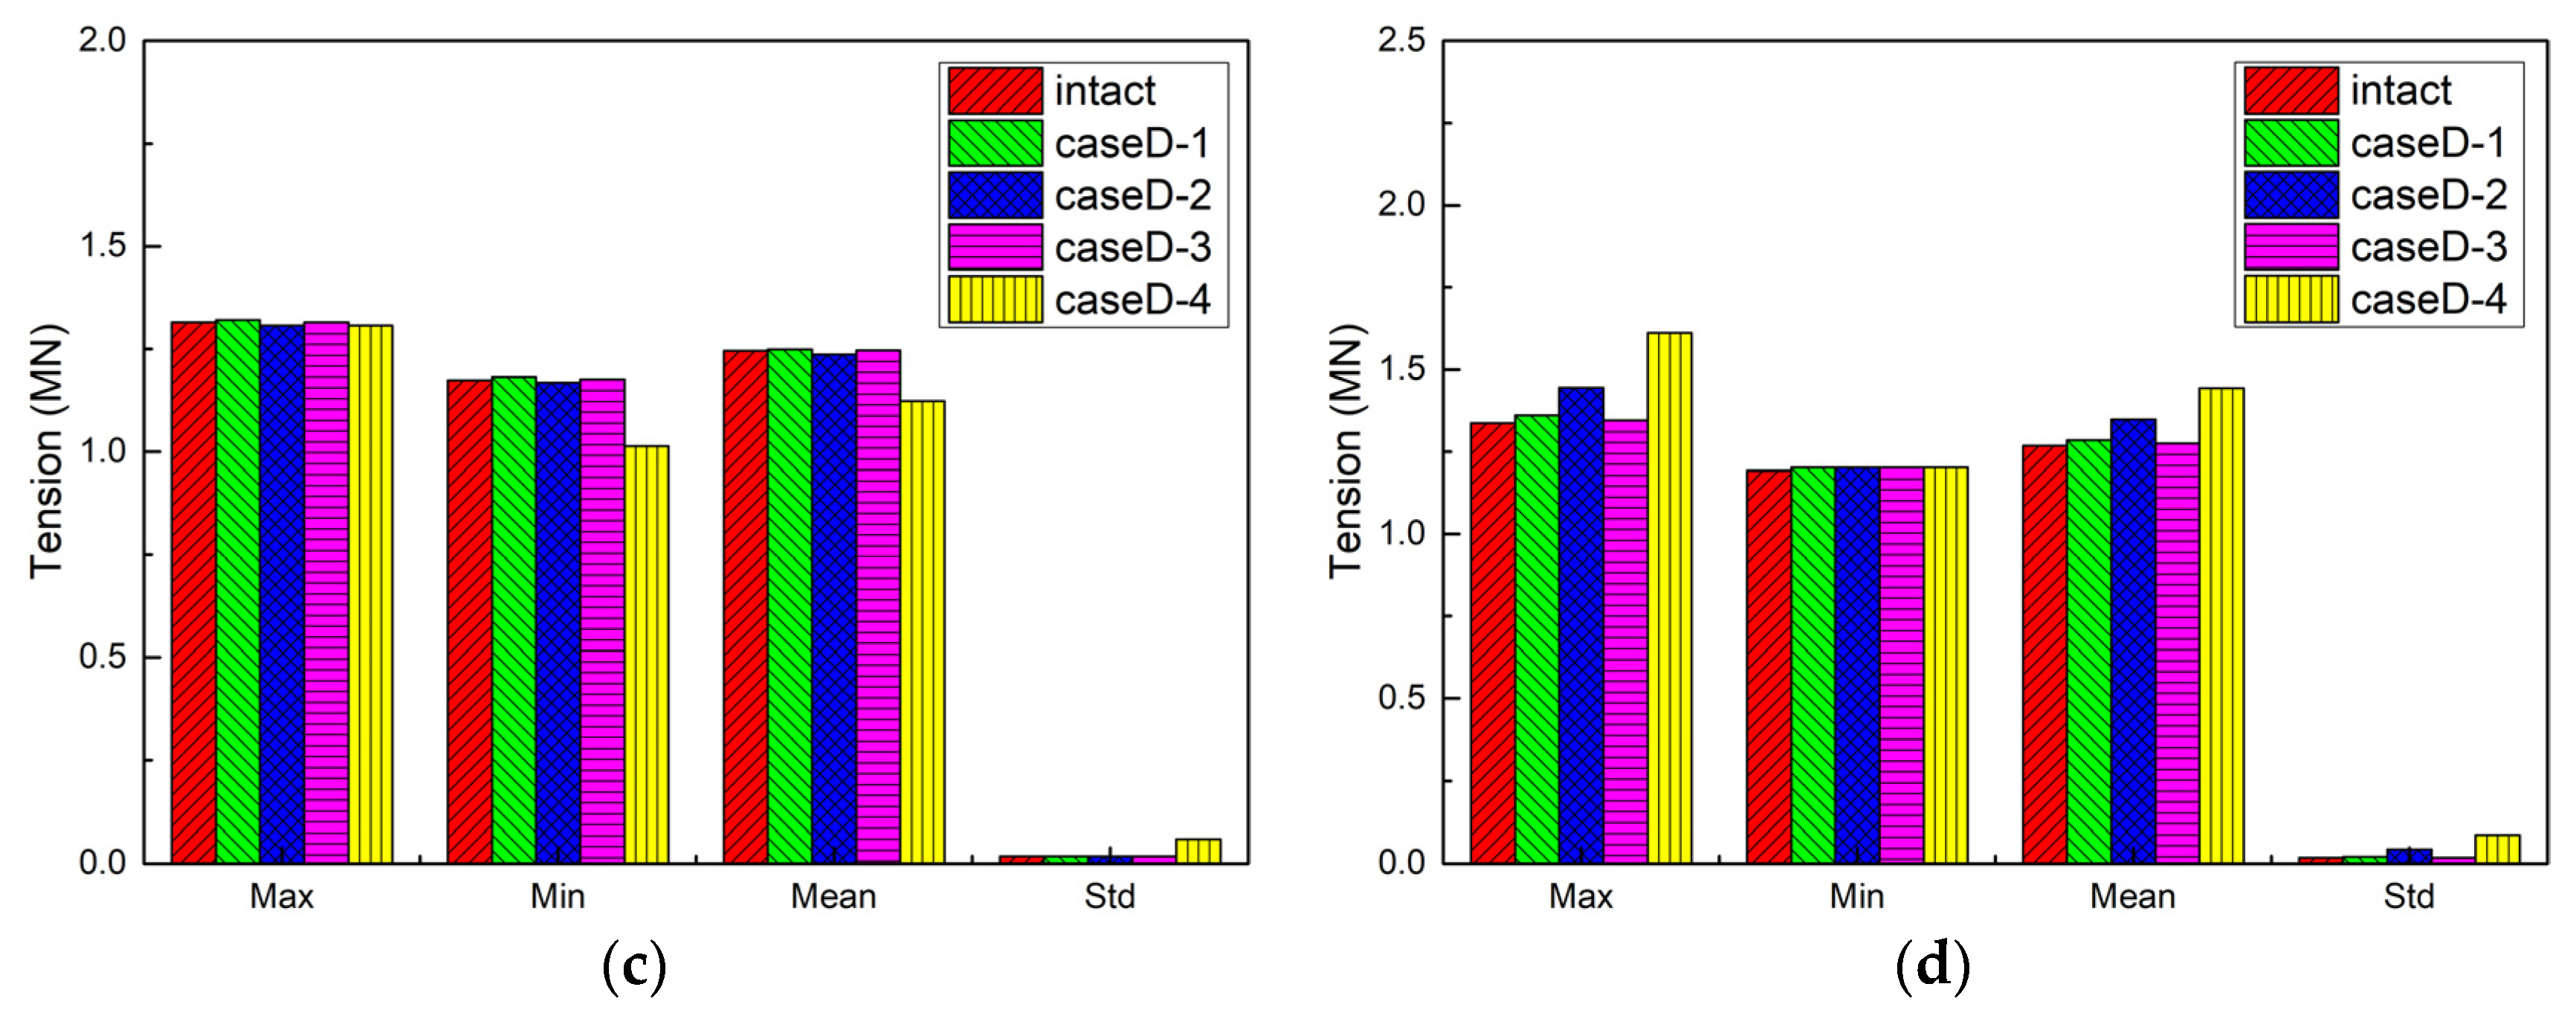
5.5.2. Mooring Line Tension

The time series of mooring line tensions under the intact and mooring lines failure conditions are shown in Figure 25, the comparisons of mooring line tensions statistics are shown in Figure 26, and the safety factor of mooring lines in CaseD are shown in Figure 27.
Comparing the mooring line tension results of CaseA, similar to the manner of change in the motion responses results, all of the values of mooring line tension are much smaller in CaseD. Besides, the change of tension of mooring lines #5 and #12 in CaseD-4 is larger than that in CaseA-4, with the reason of that the average sway motion is slightly smaller and the stiffness is much smaller in CaseD-4.

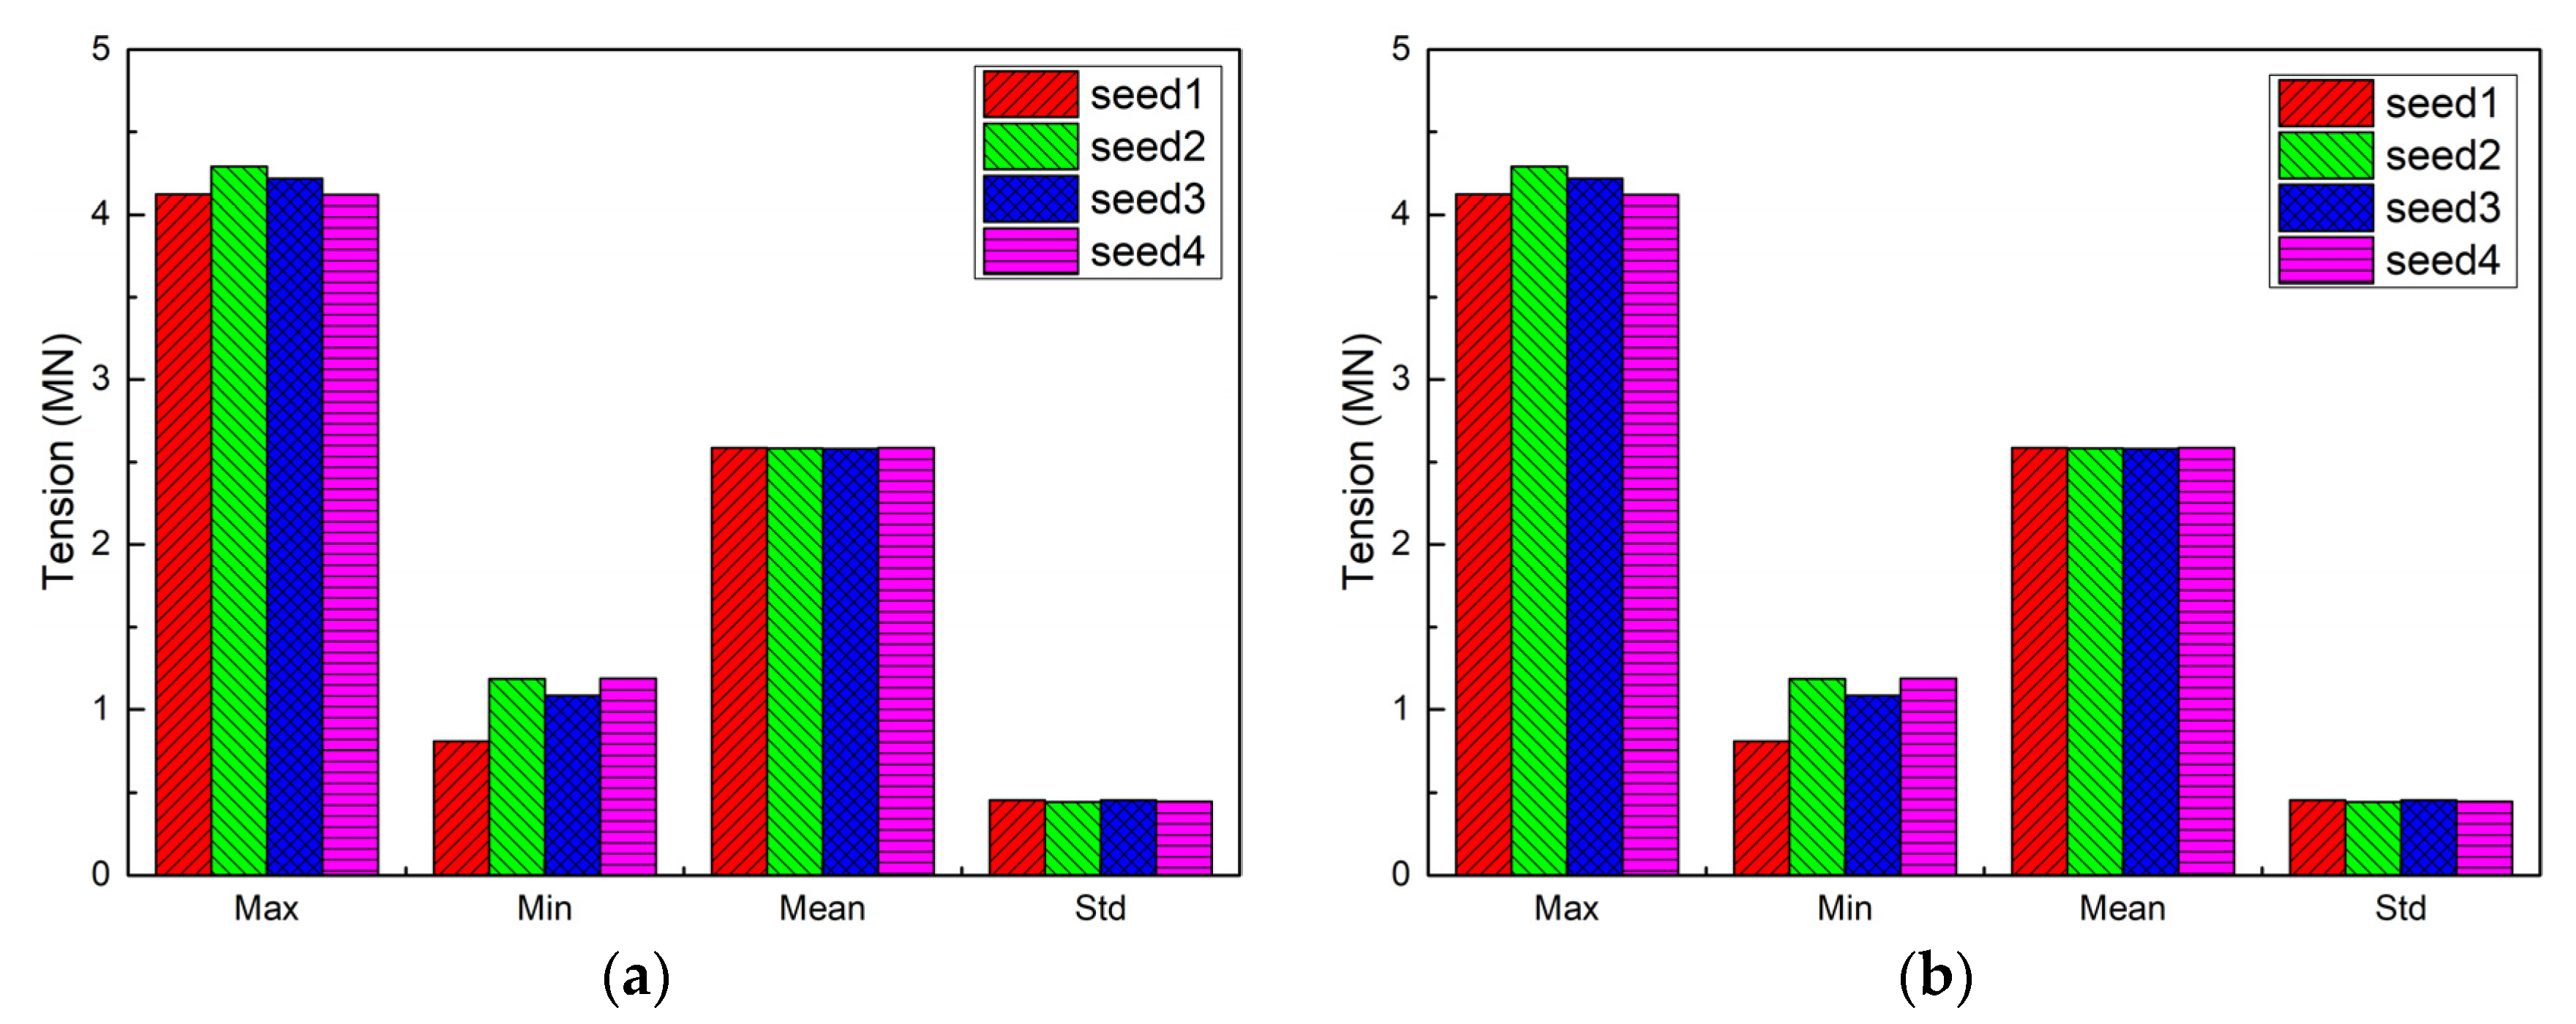
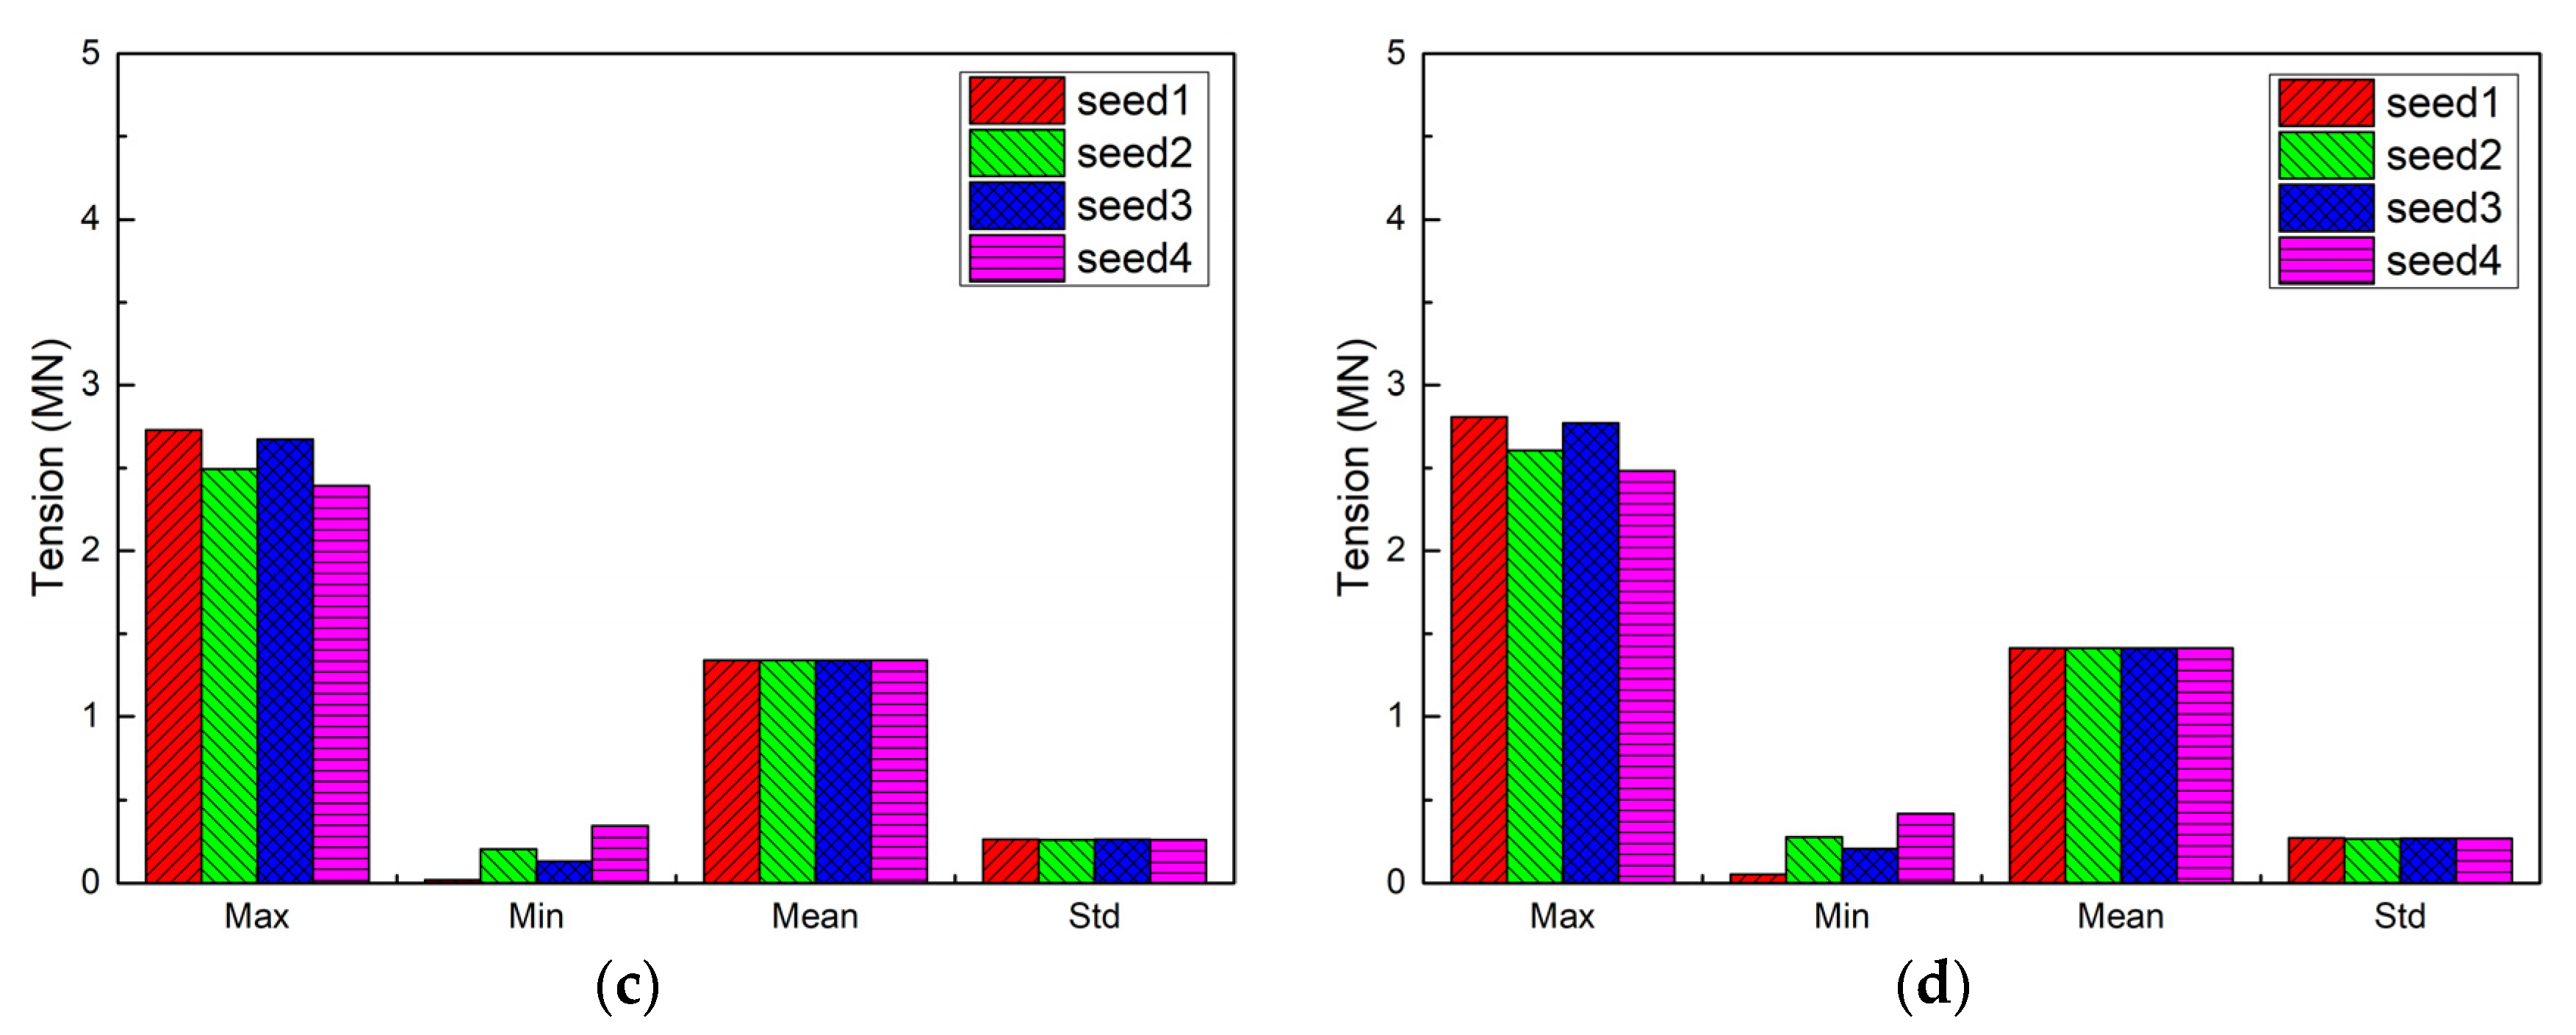
5.6. Comparisons of Different Random Seeds of Wave

In this section, the influences of different random seeds on the mooring line tensions are analyzed, and the collinear environmental load directions of the 100-year hurricane sea state in the Gulf of Mexico are considered, in which the directions of the wave, wind, and current are all 180°. Based on CaseA-1, four different random seeds of wave were selected for calculation and analysis, and they generated different time histories of wave height. The time series of mooring line tensions are shown in Figure 28, and the comparisons of mooring line tensions statistics are shown in Figure 29.
According to Figure 28 and Figure 29, considering the randomness of irregular waves, the four different random seeds of wave have minor effect on the mean mooring tension and its standard deviation. As shown in Table 9, the randomness time histories of wave height cause the peak tension of mooring line vary under the same wave period and wave height. Using the results of Seed-1 as the reference, the peak mooring line tension has about 2–8% variation, which indicates that the peak tension of mooring line should consider about conservative 10% variable uncertainty if applying only one certain irregular wave condition in the random sea state analysis.

6. Conclusions

In this paper, the evaluation of the transient responses of a typical DEEPSTAR internal turret FPSO with different failure scenarios of mooring lines was conducted. The coupled numerical analyses were carried out to simulate the dynamic responses of vessel motion and mooring line tension under the sudden mooring line breakage at a certain time in which the coupled numerical simulation model was validated by the model tests. Four representative mooring line broken conditions, including the single mooring line or two mooring lines failure under ipsilateral, opposite, and adjacent sides, were considered as the case studies. The main conclusions are as follows:
(1)
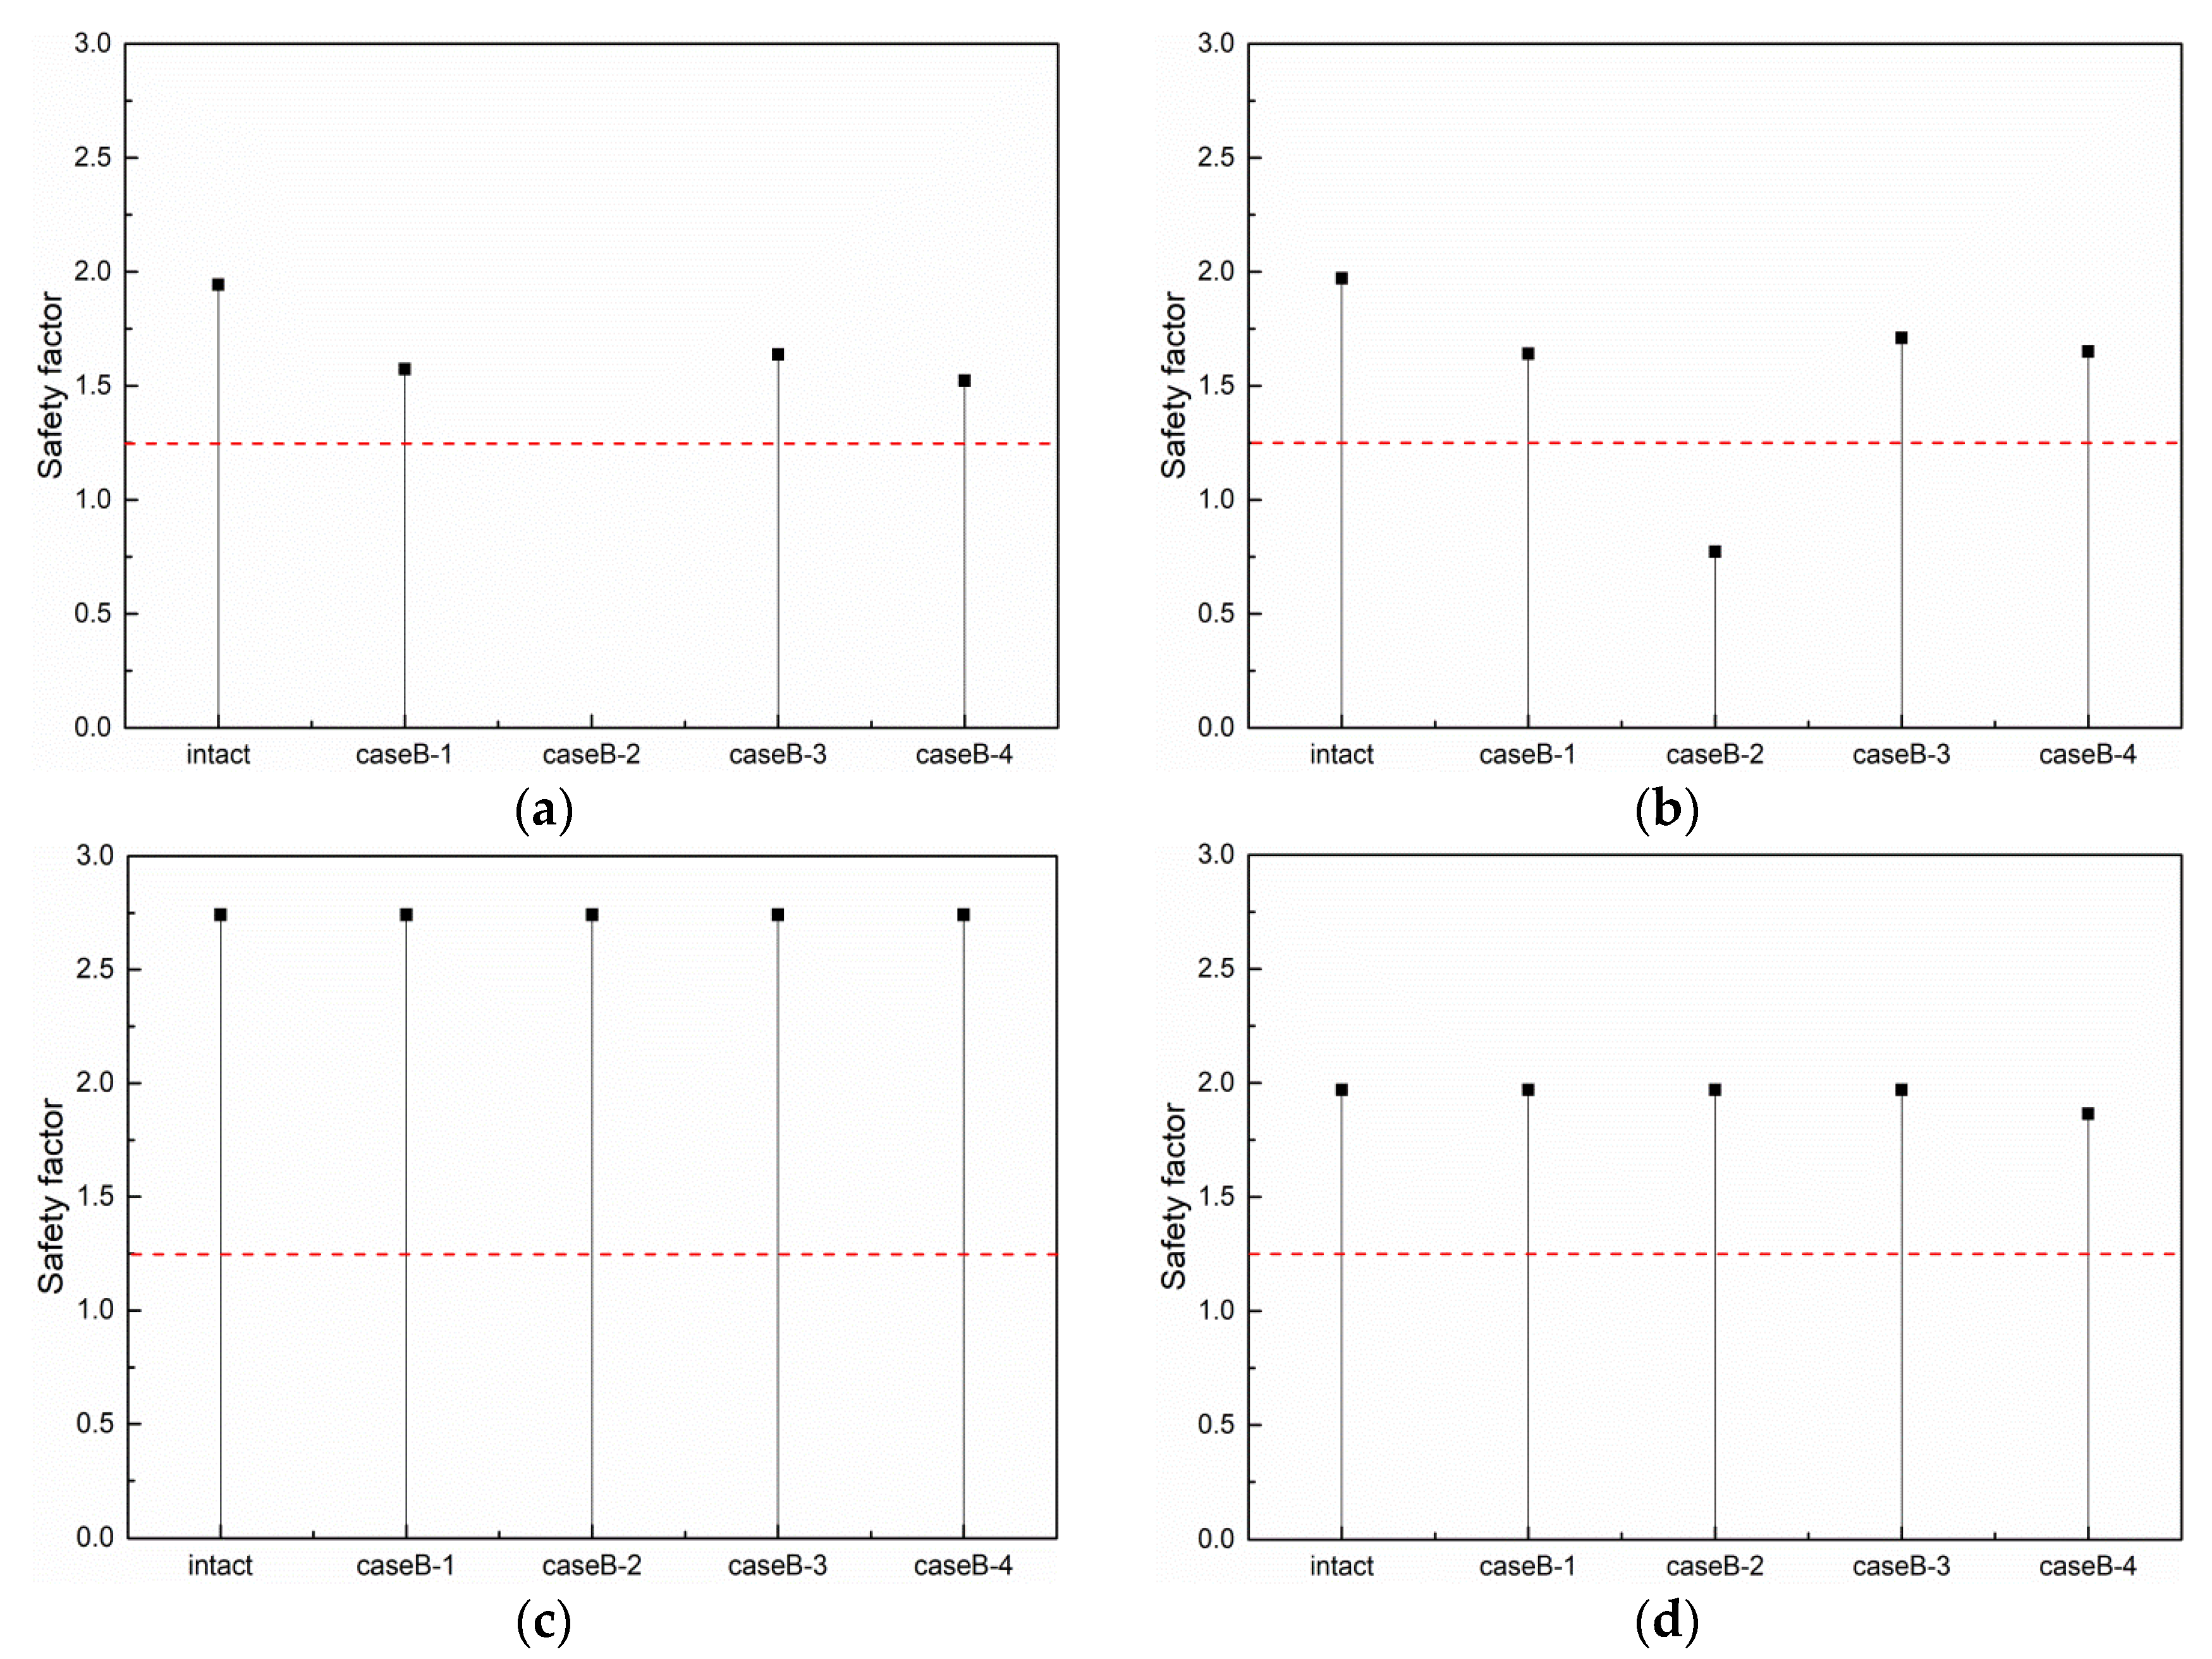
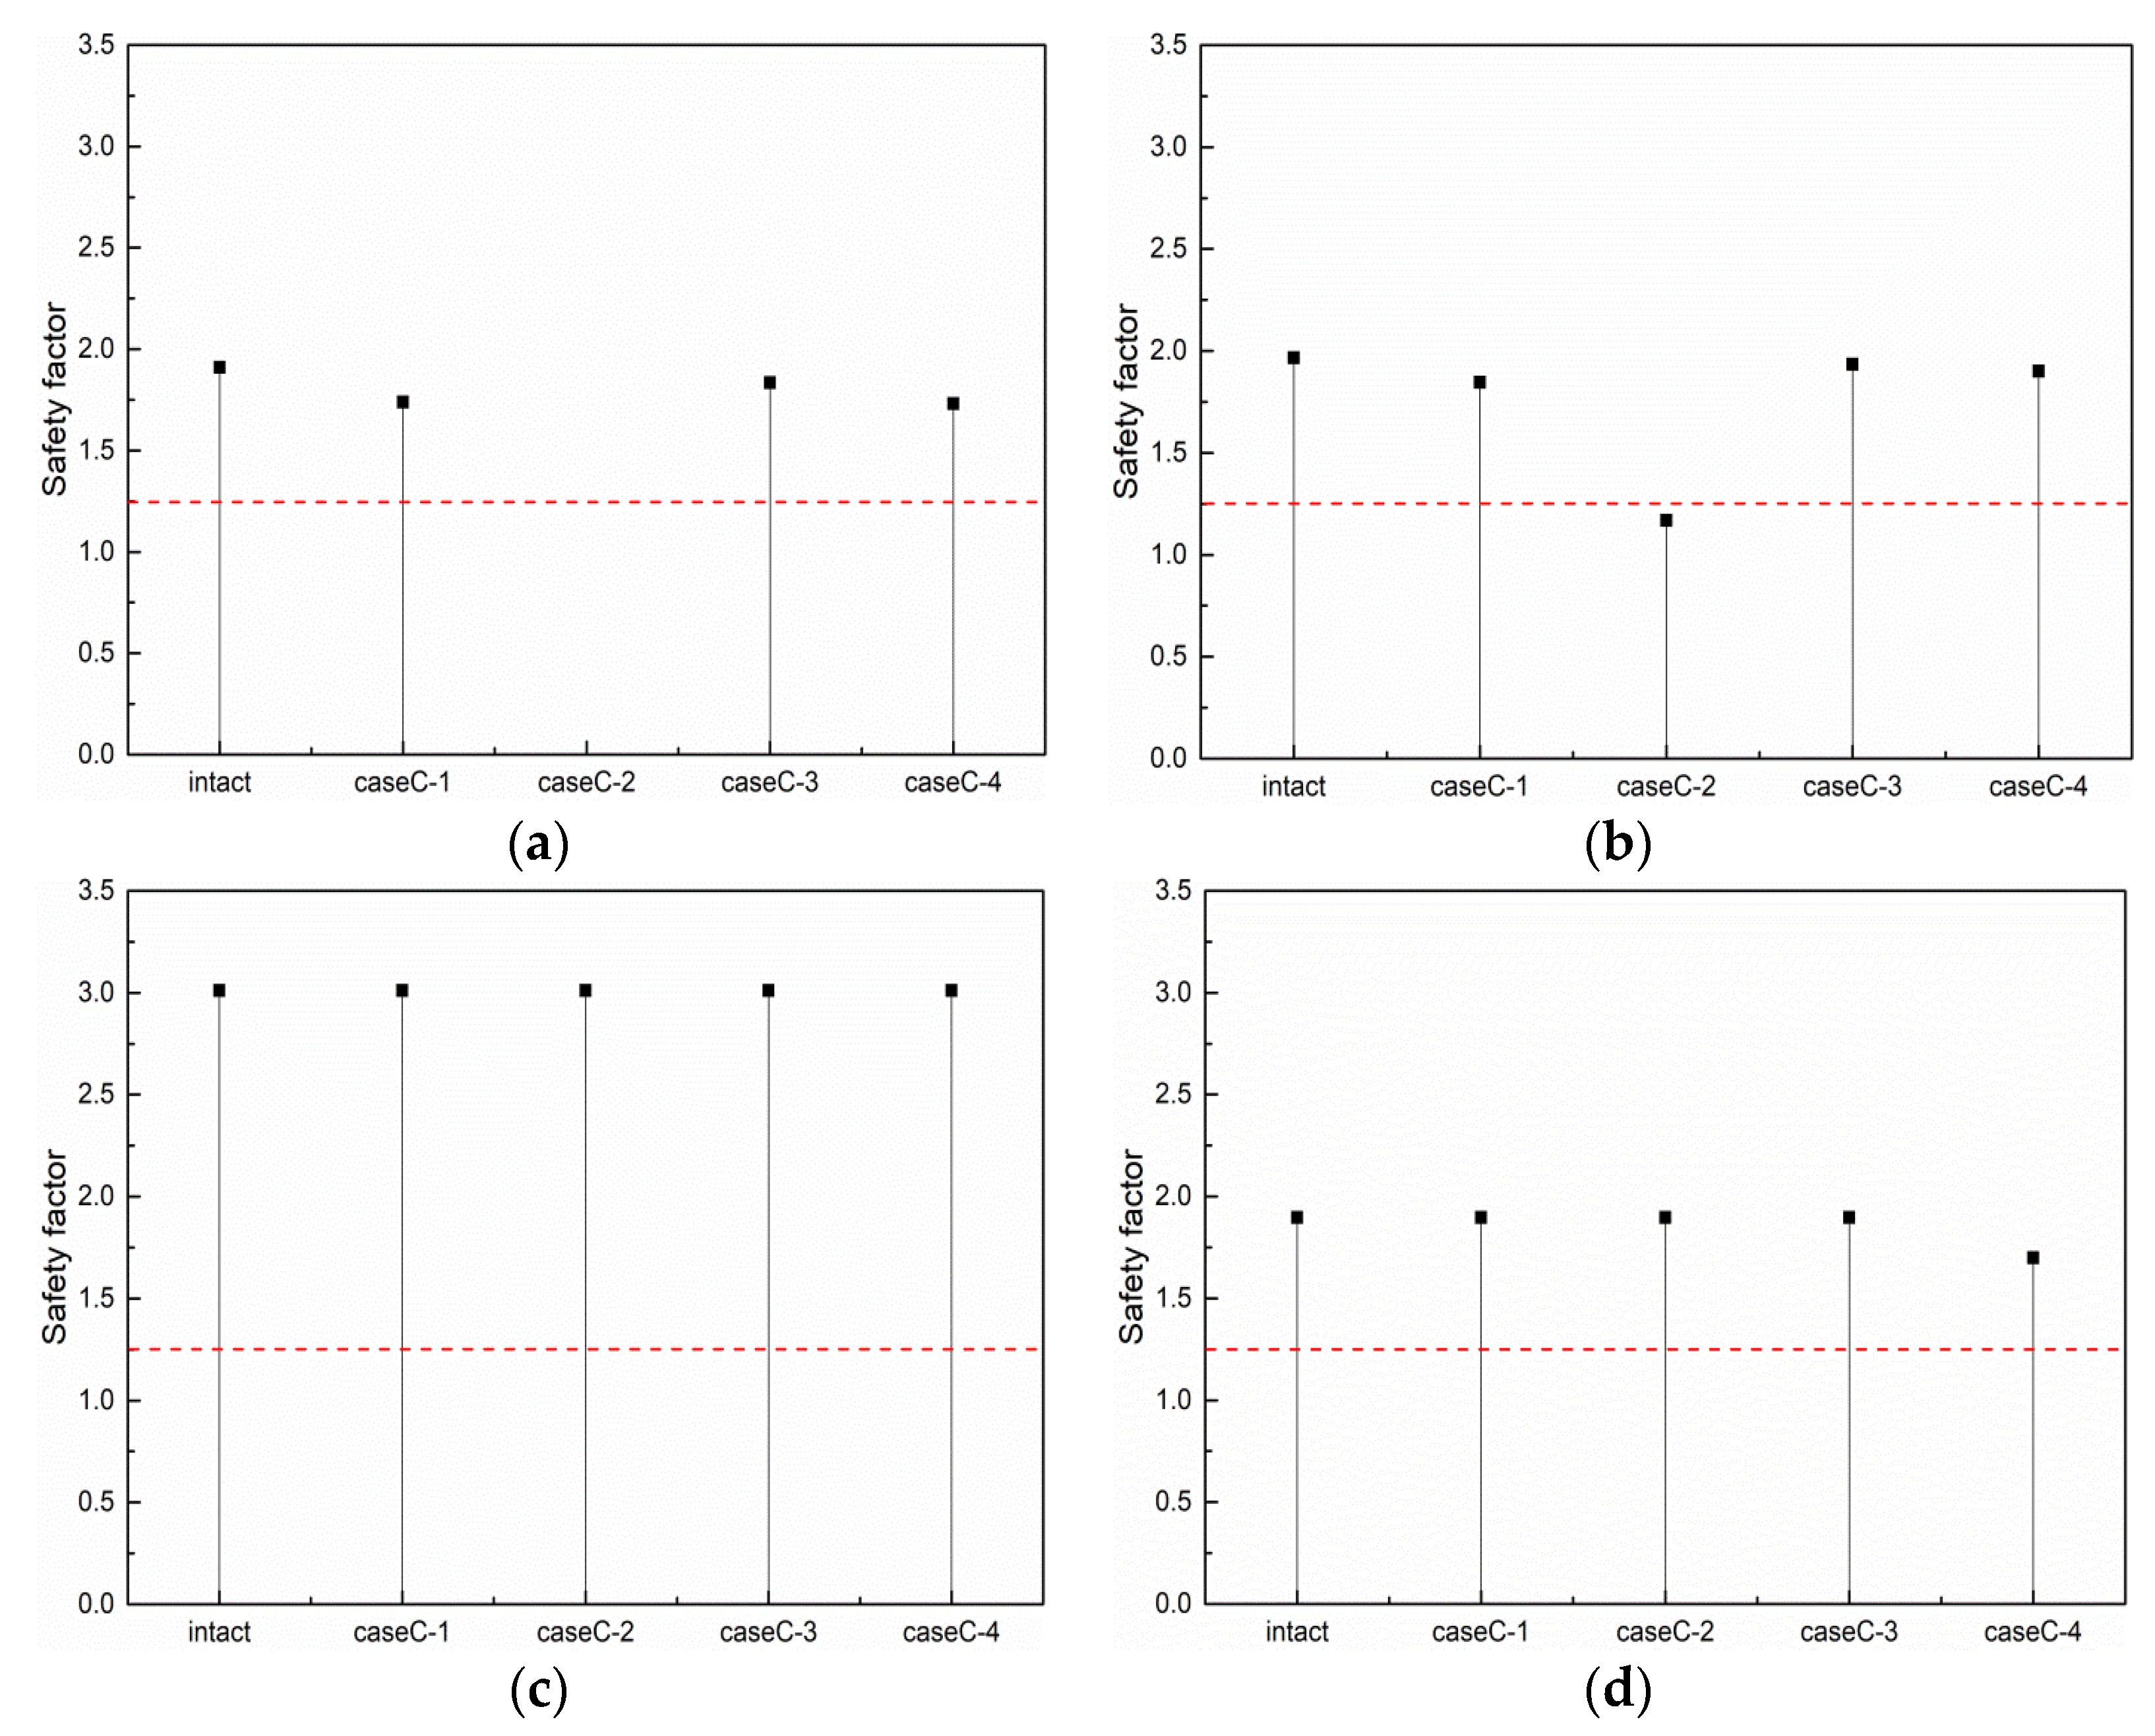
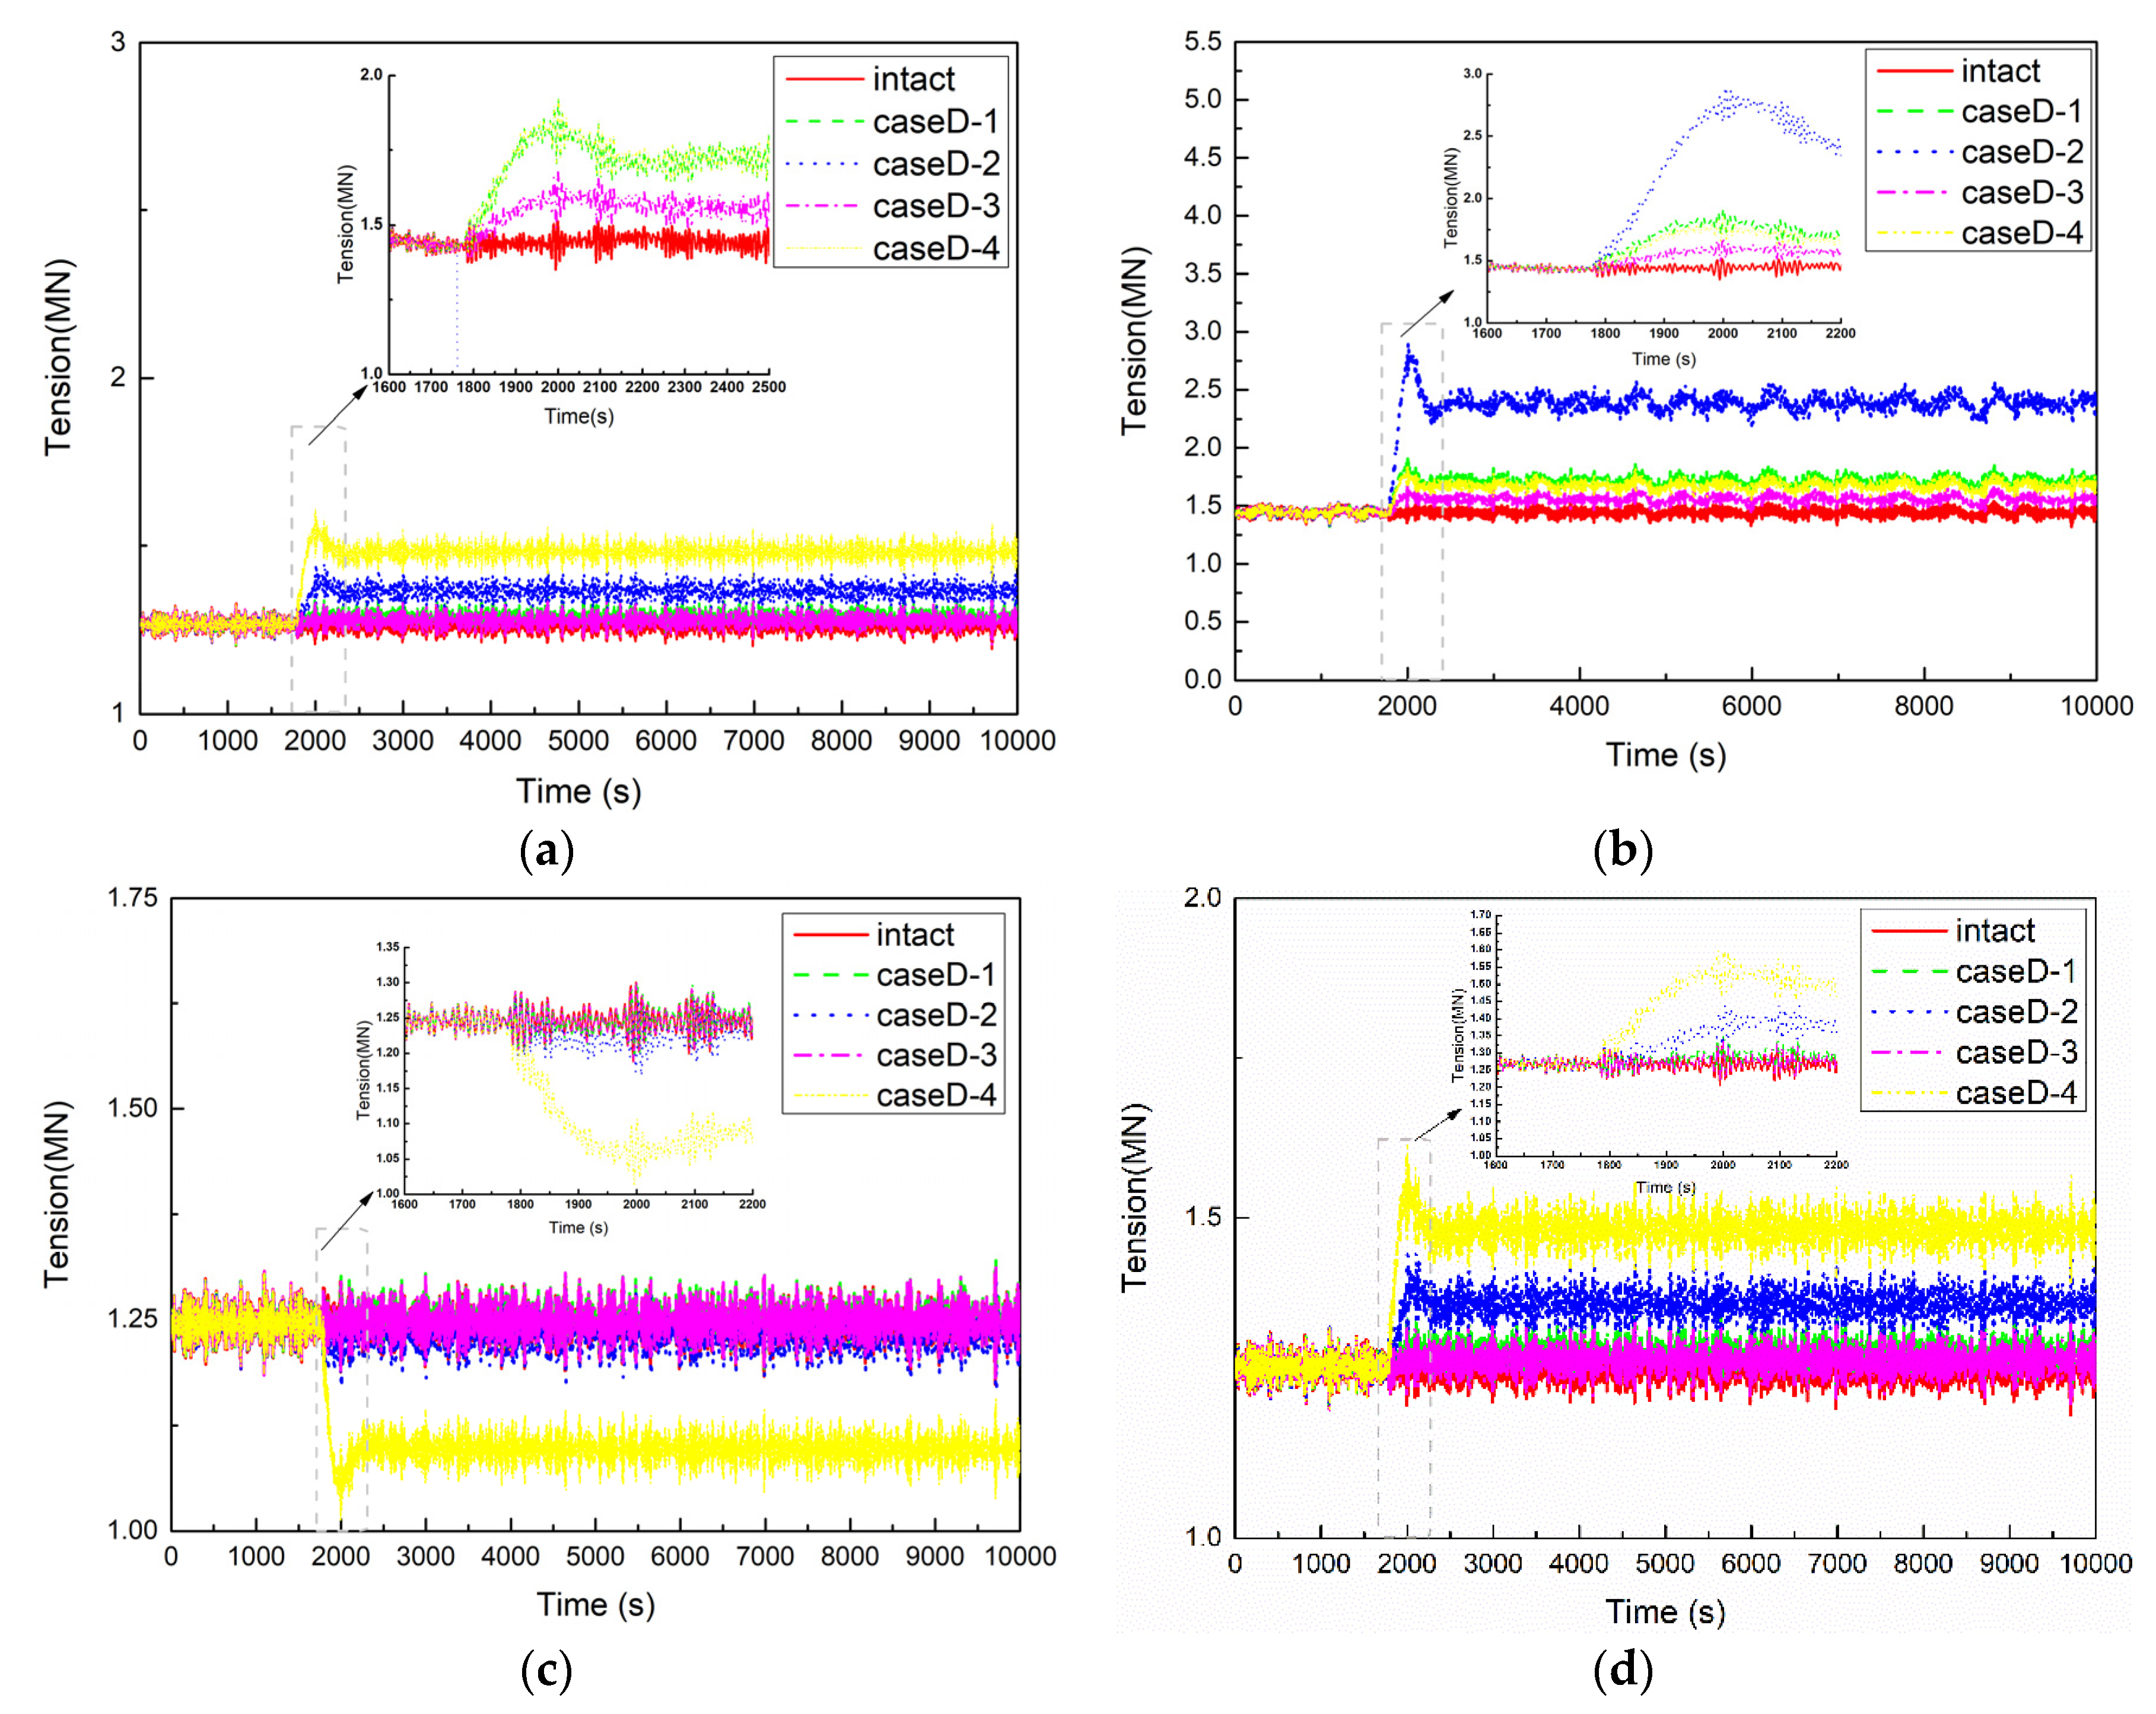
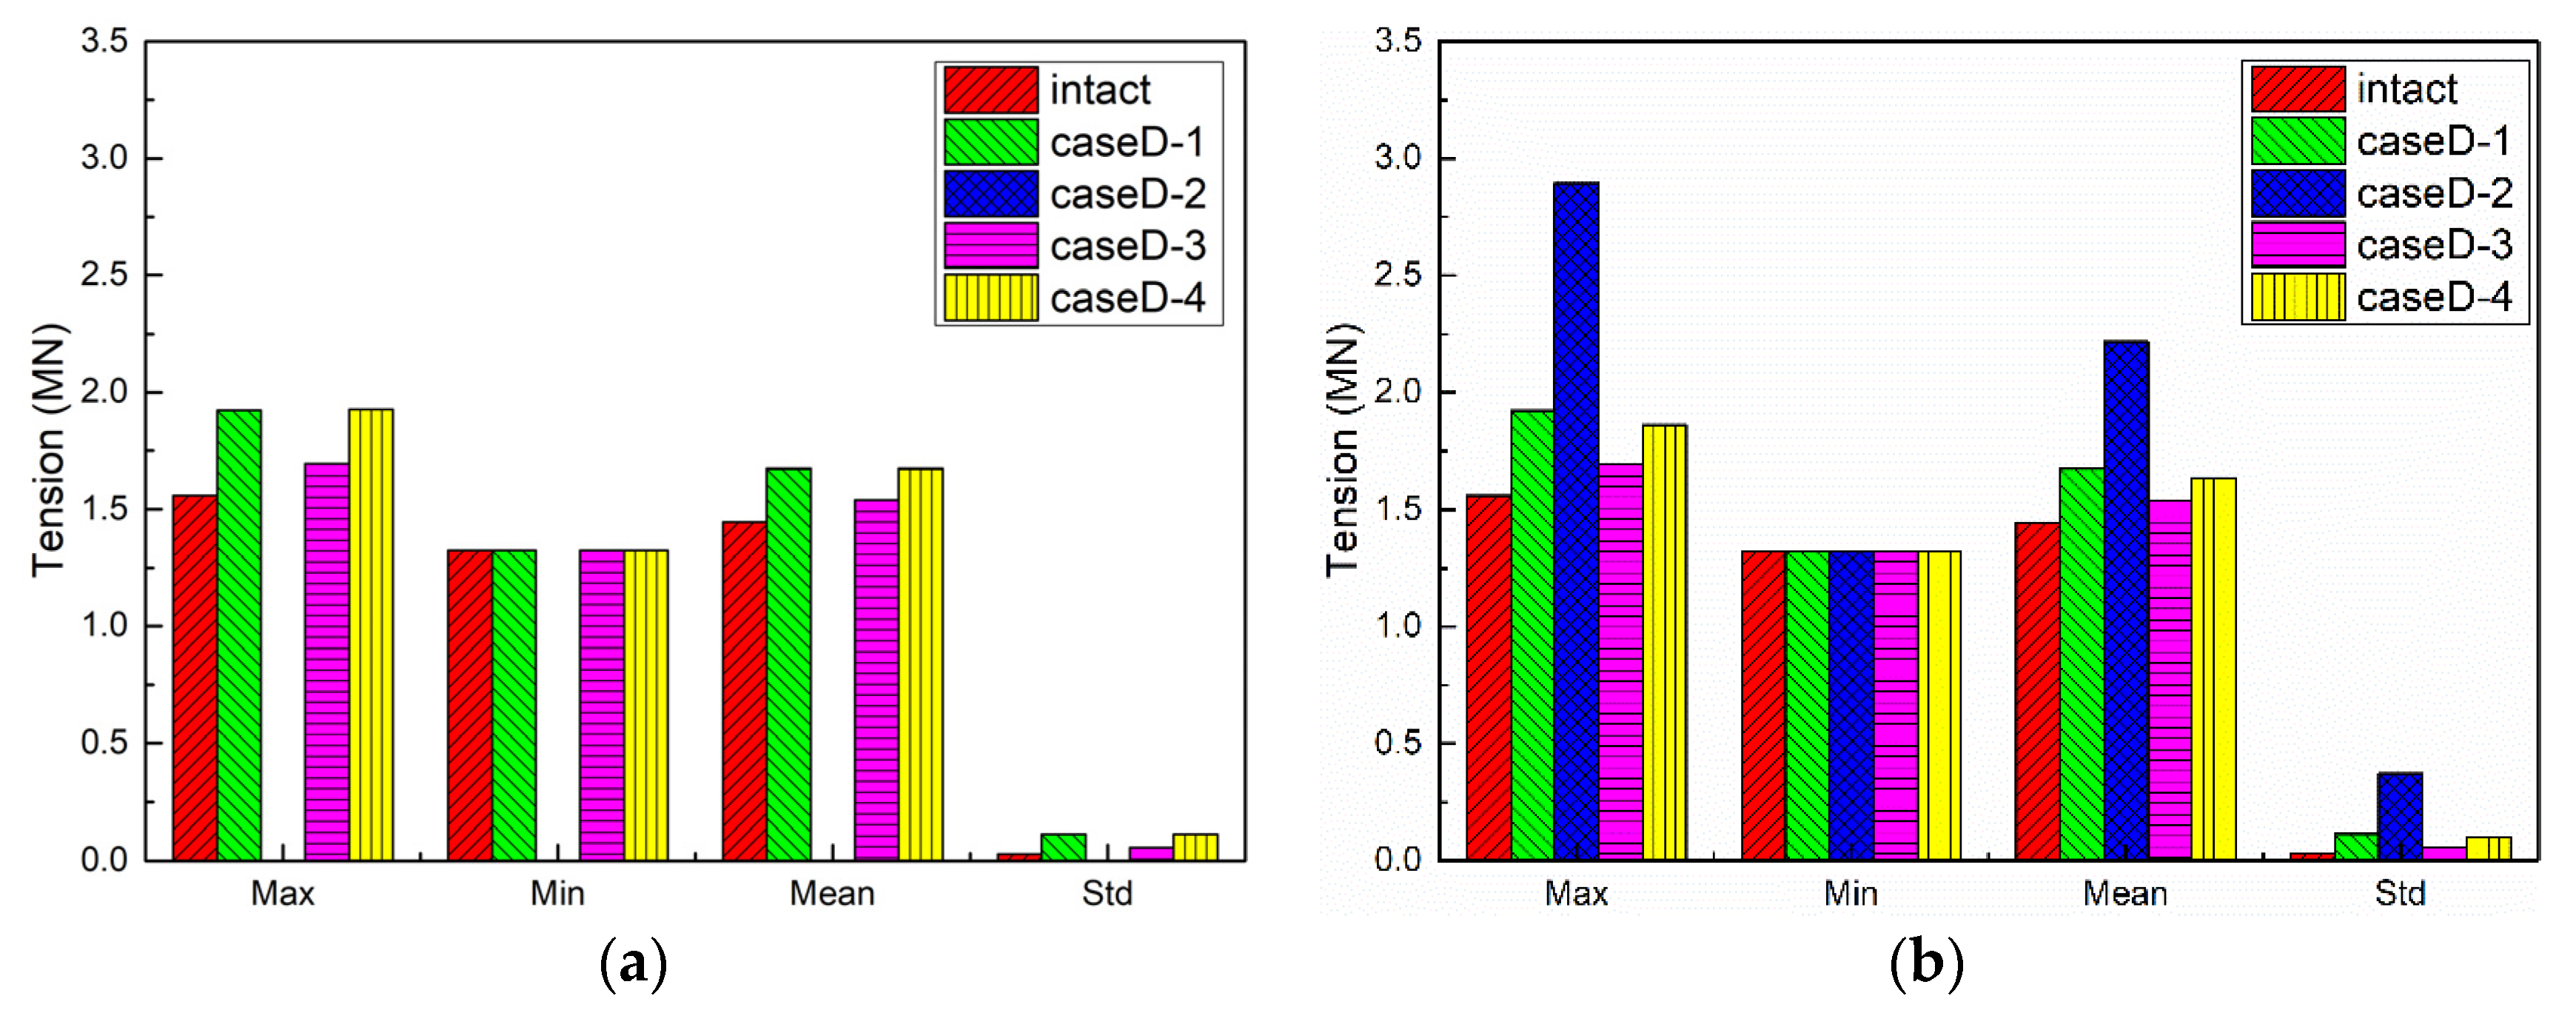
The global assessment of motion responses of the floating platform and mooring line tensions should consider the different numbers and locations of mooring line failure, especially when the two ipsilateral mooring lines fail together, which may result in the mooring line tensions cannot meet the recommended safety factor and indicate a potential risk to the long-term reliability of the system. For instance, the results shown in Figure 15b indicate that the safety factor of CaseB-2 drops below the recommended factor of 1.25 for mooring line #3.
(2)
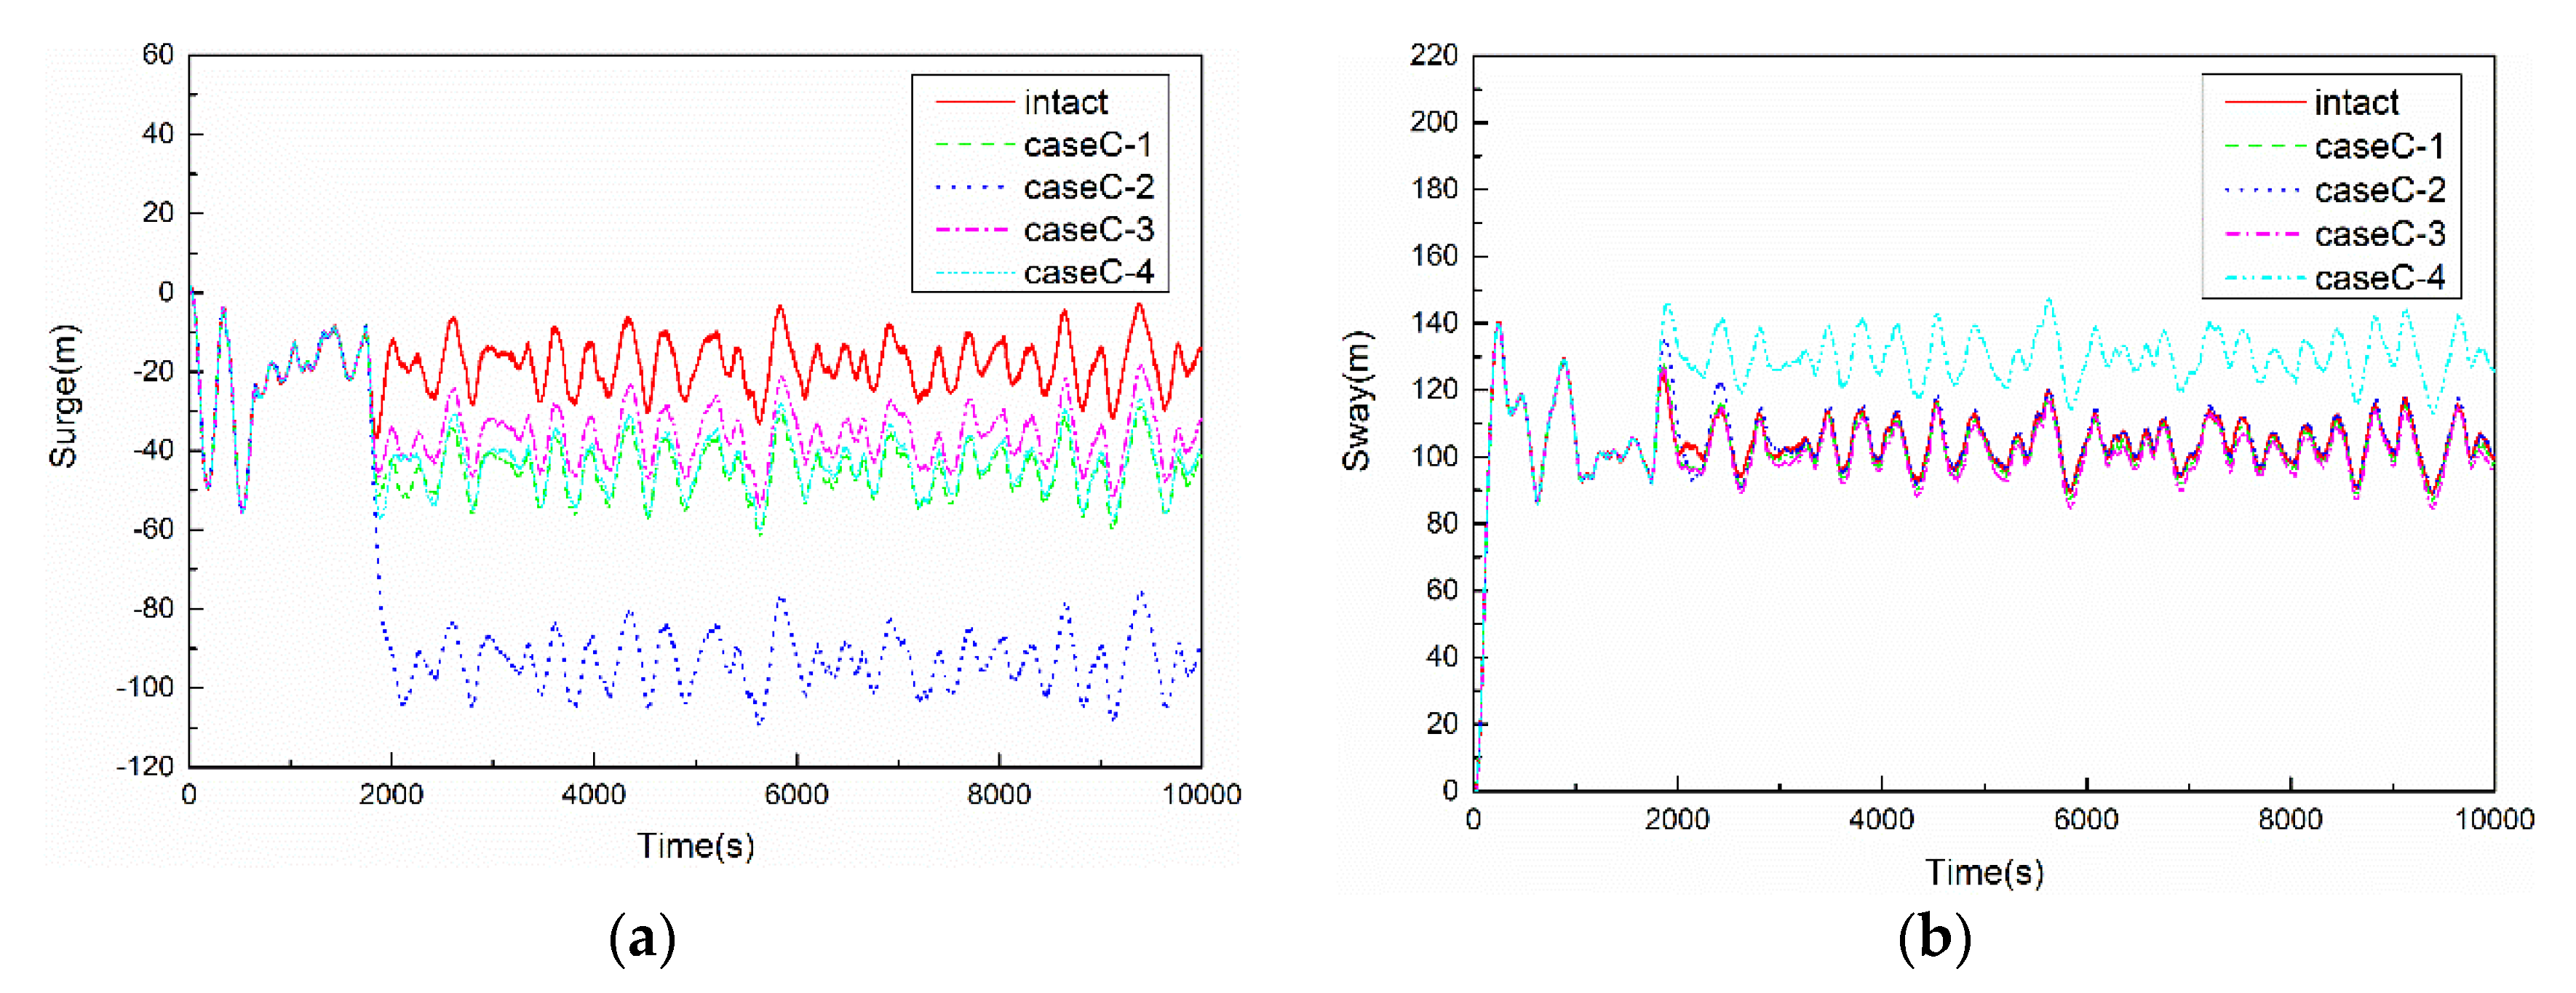
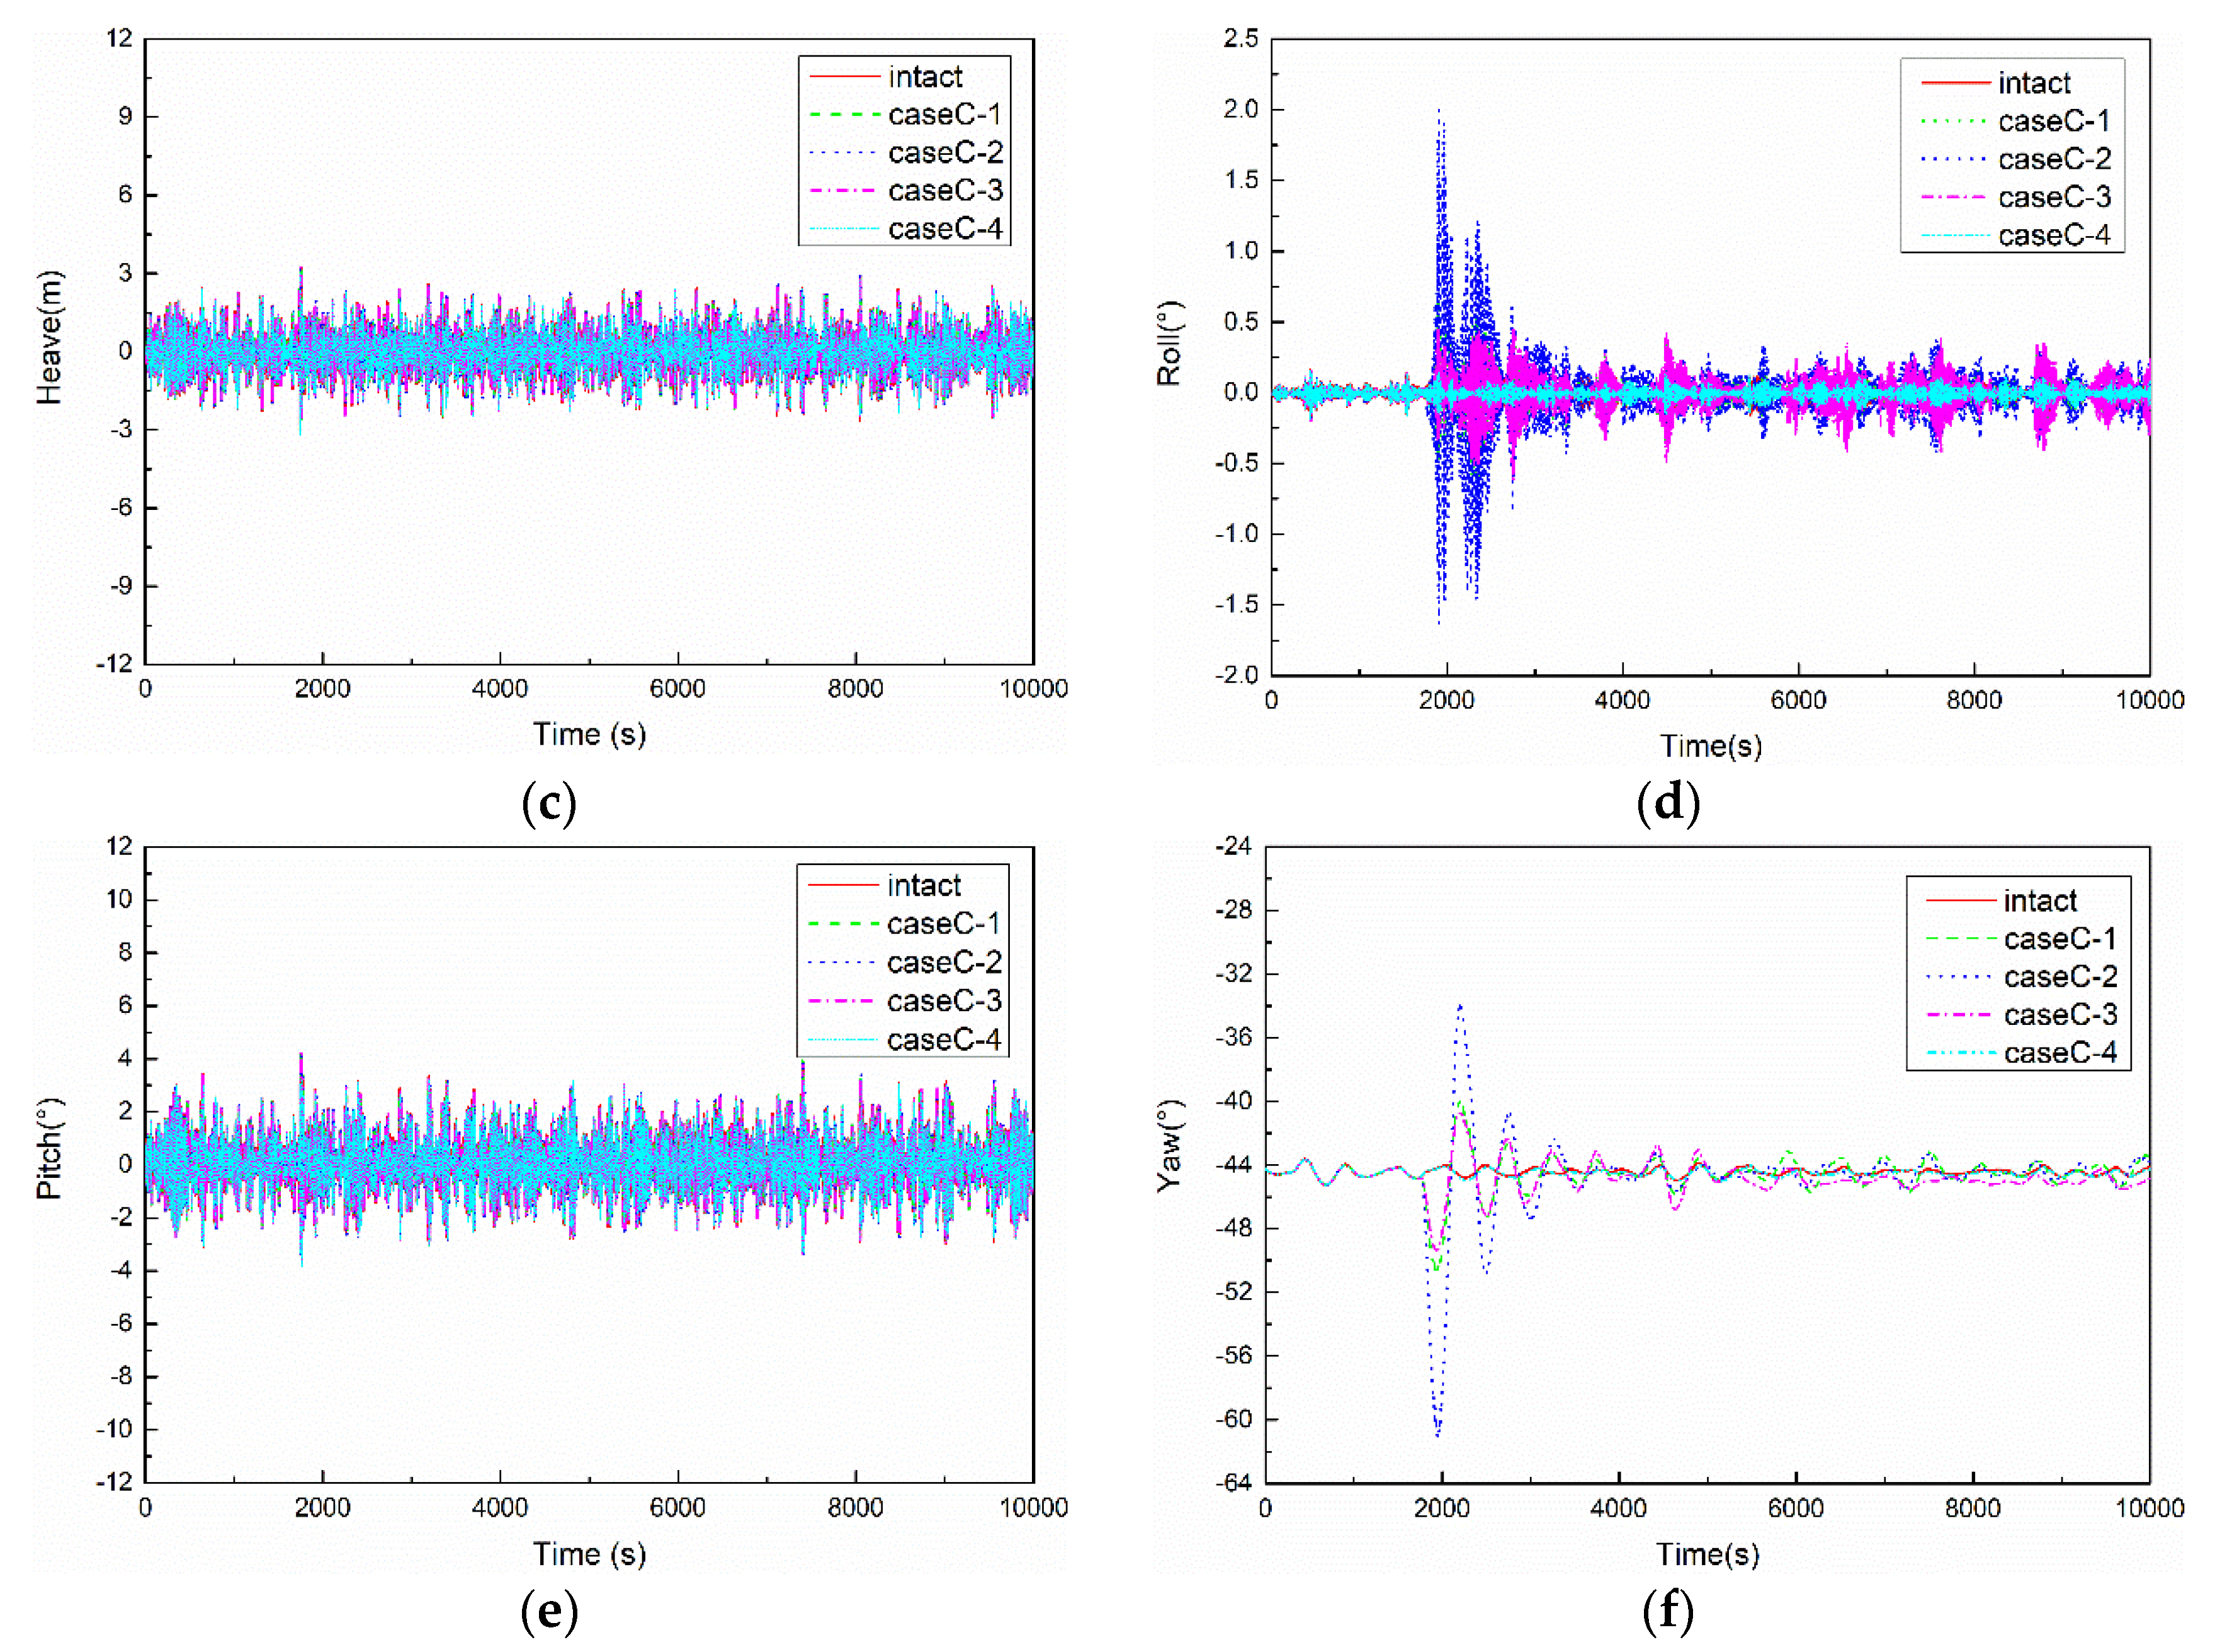
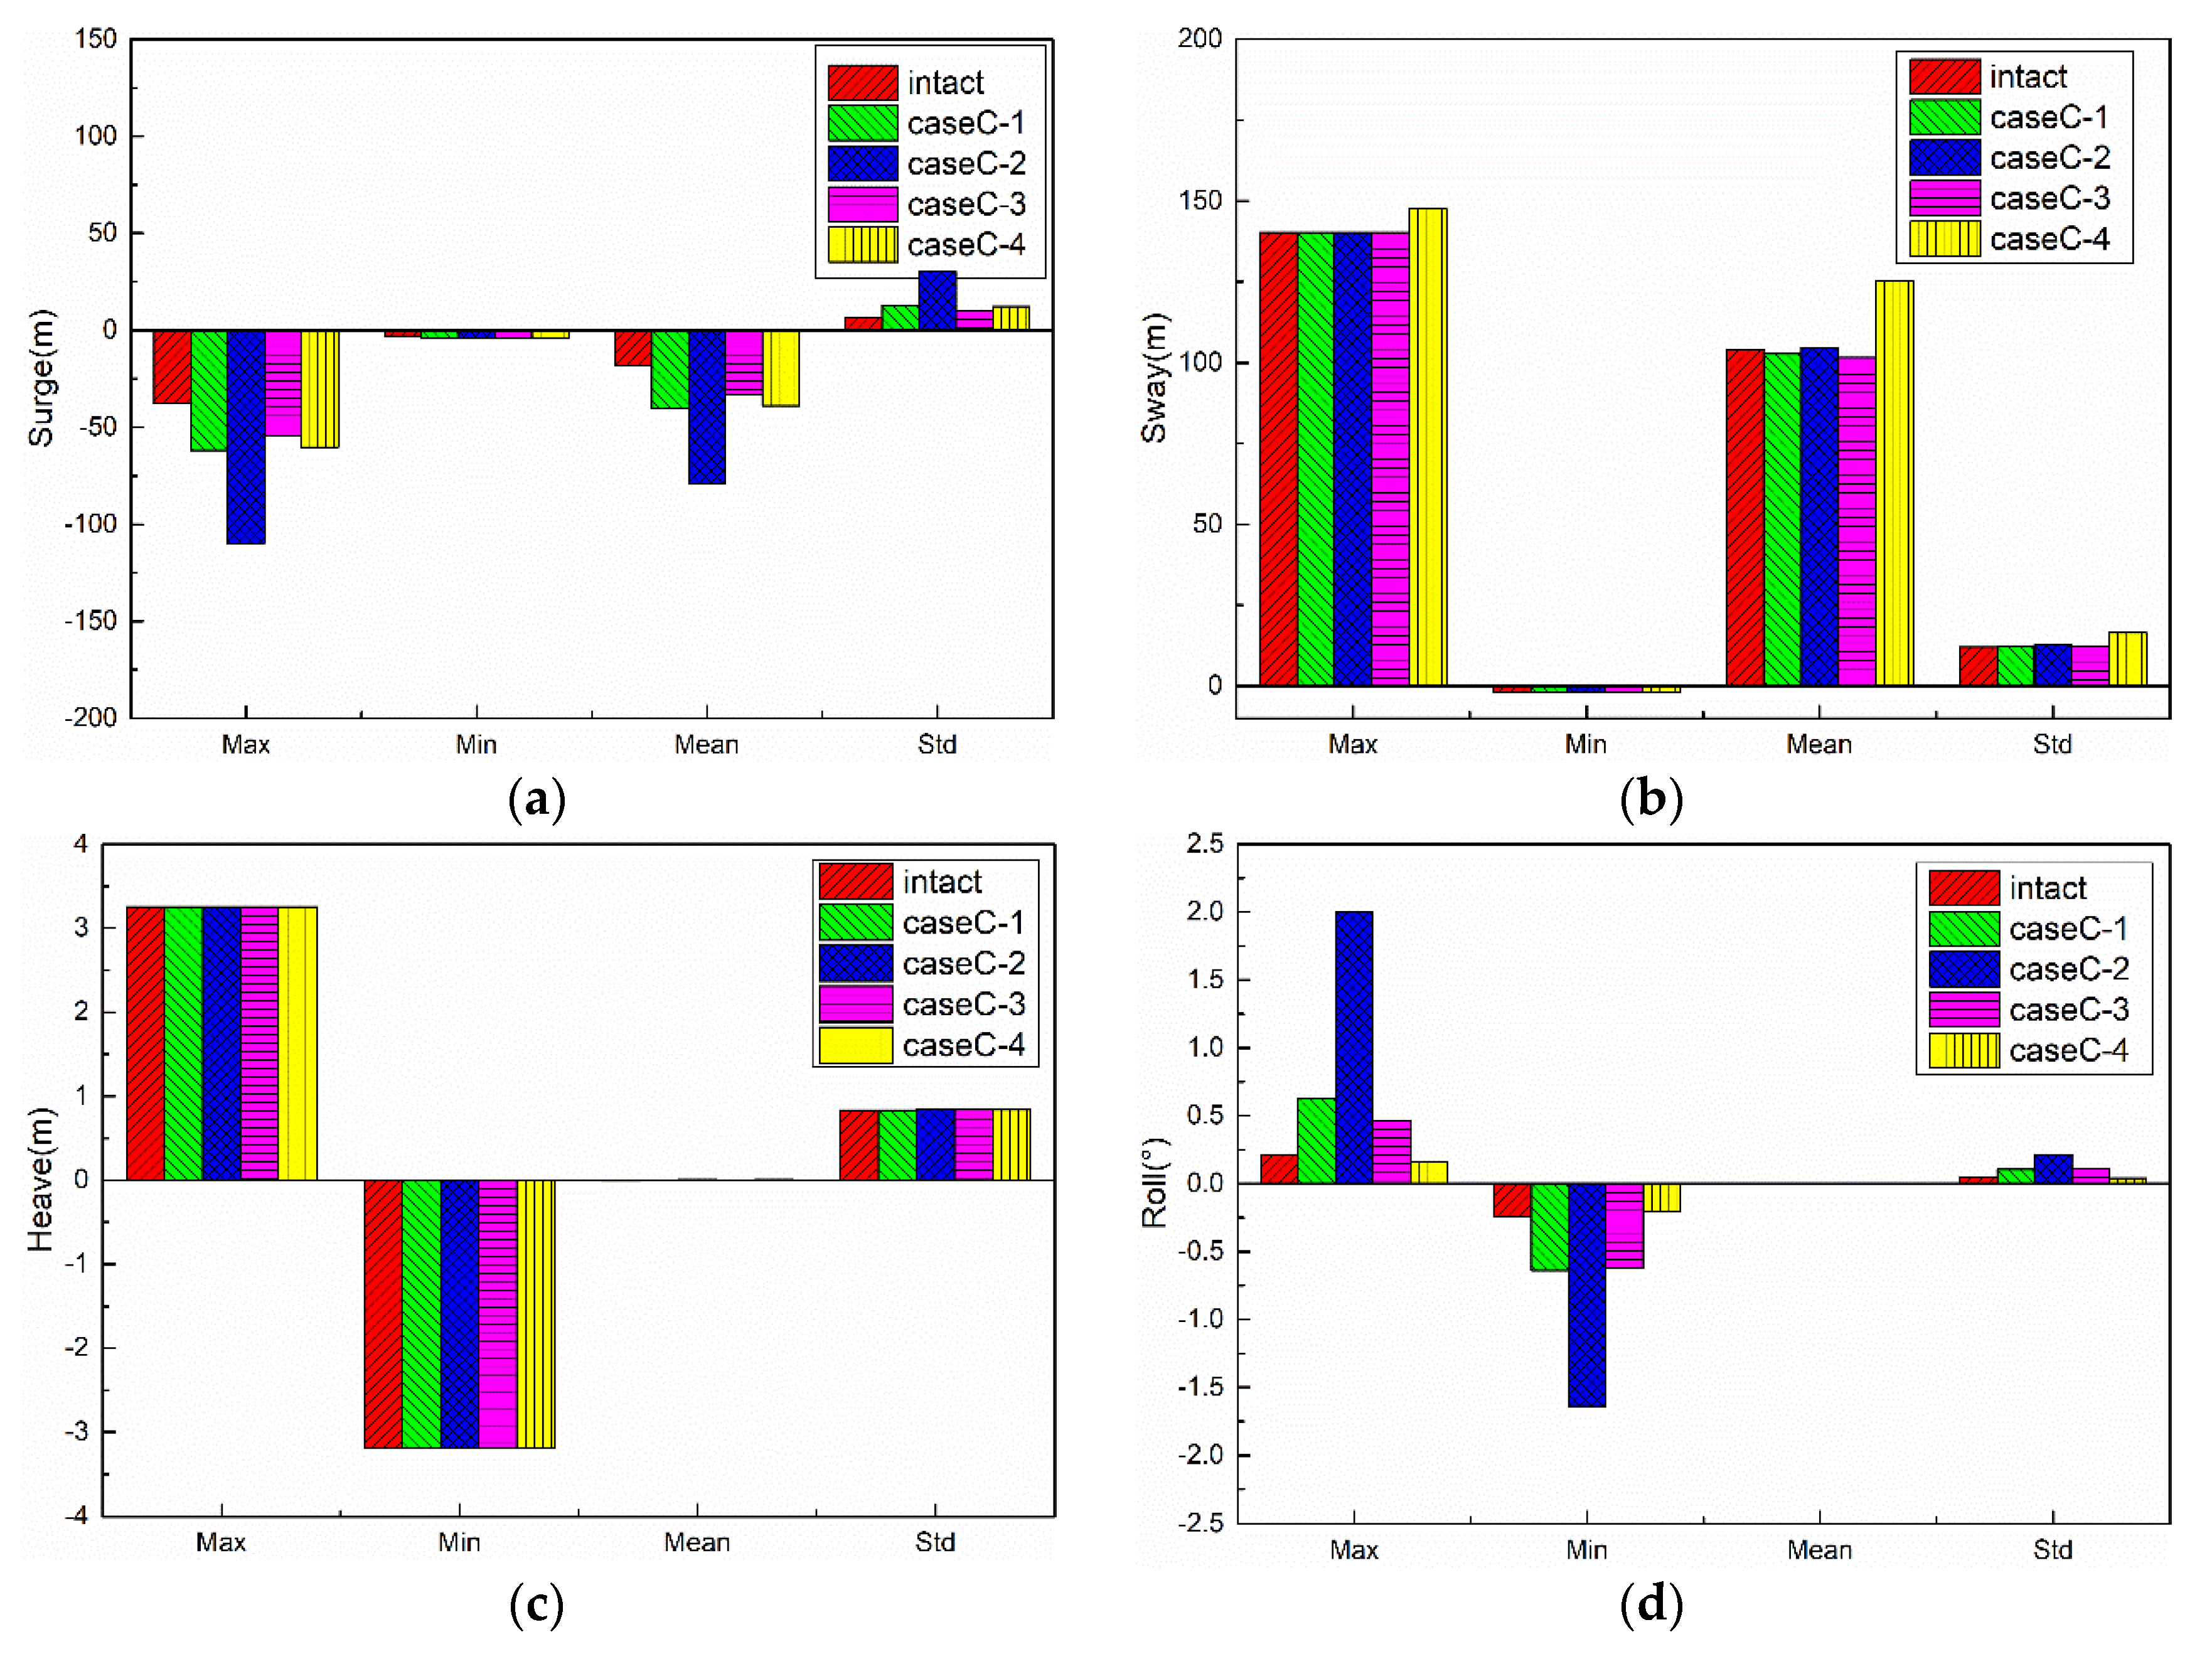
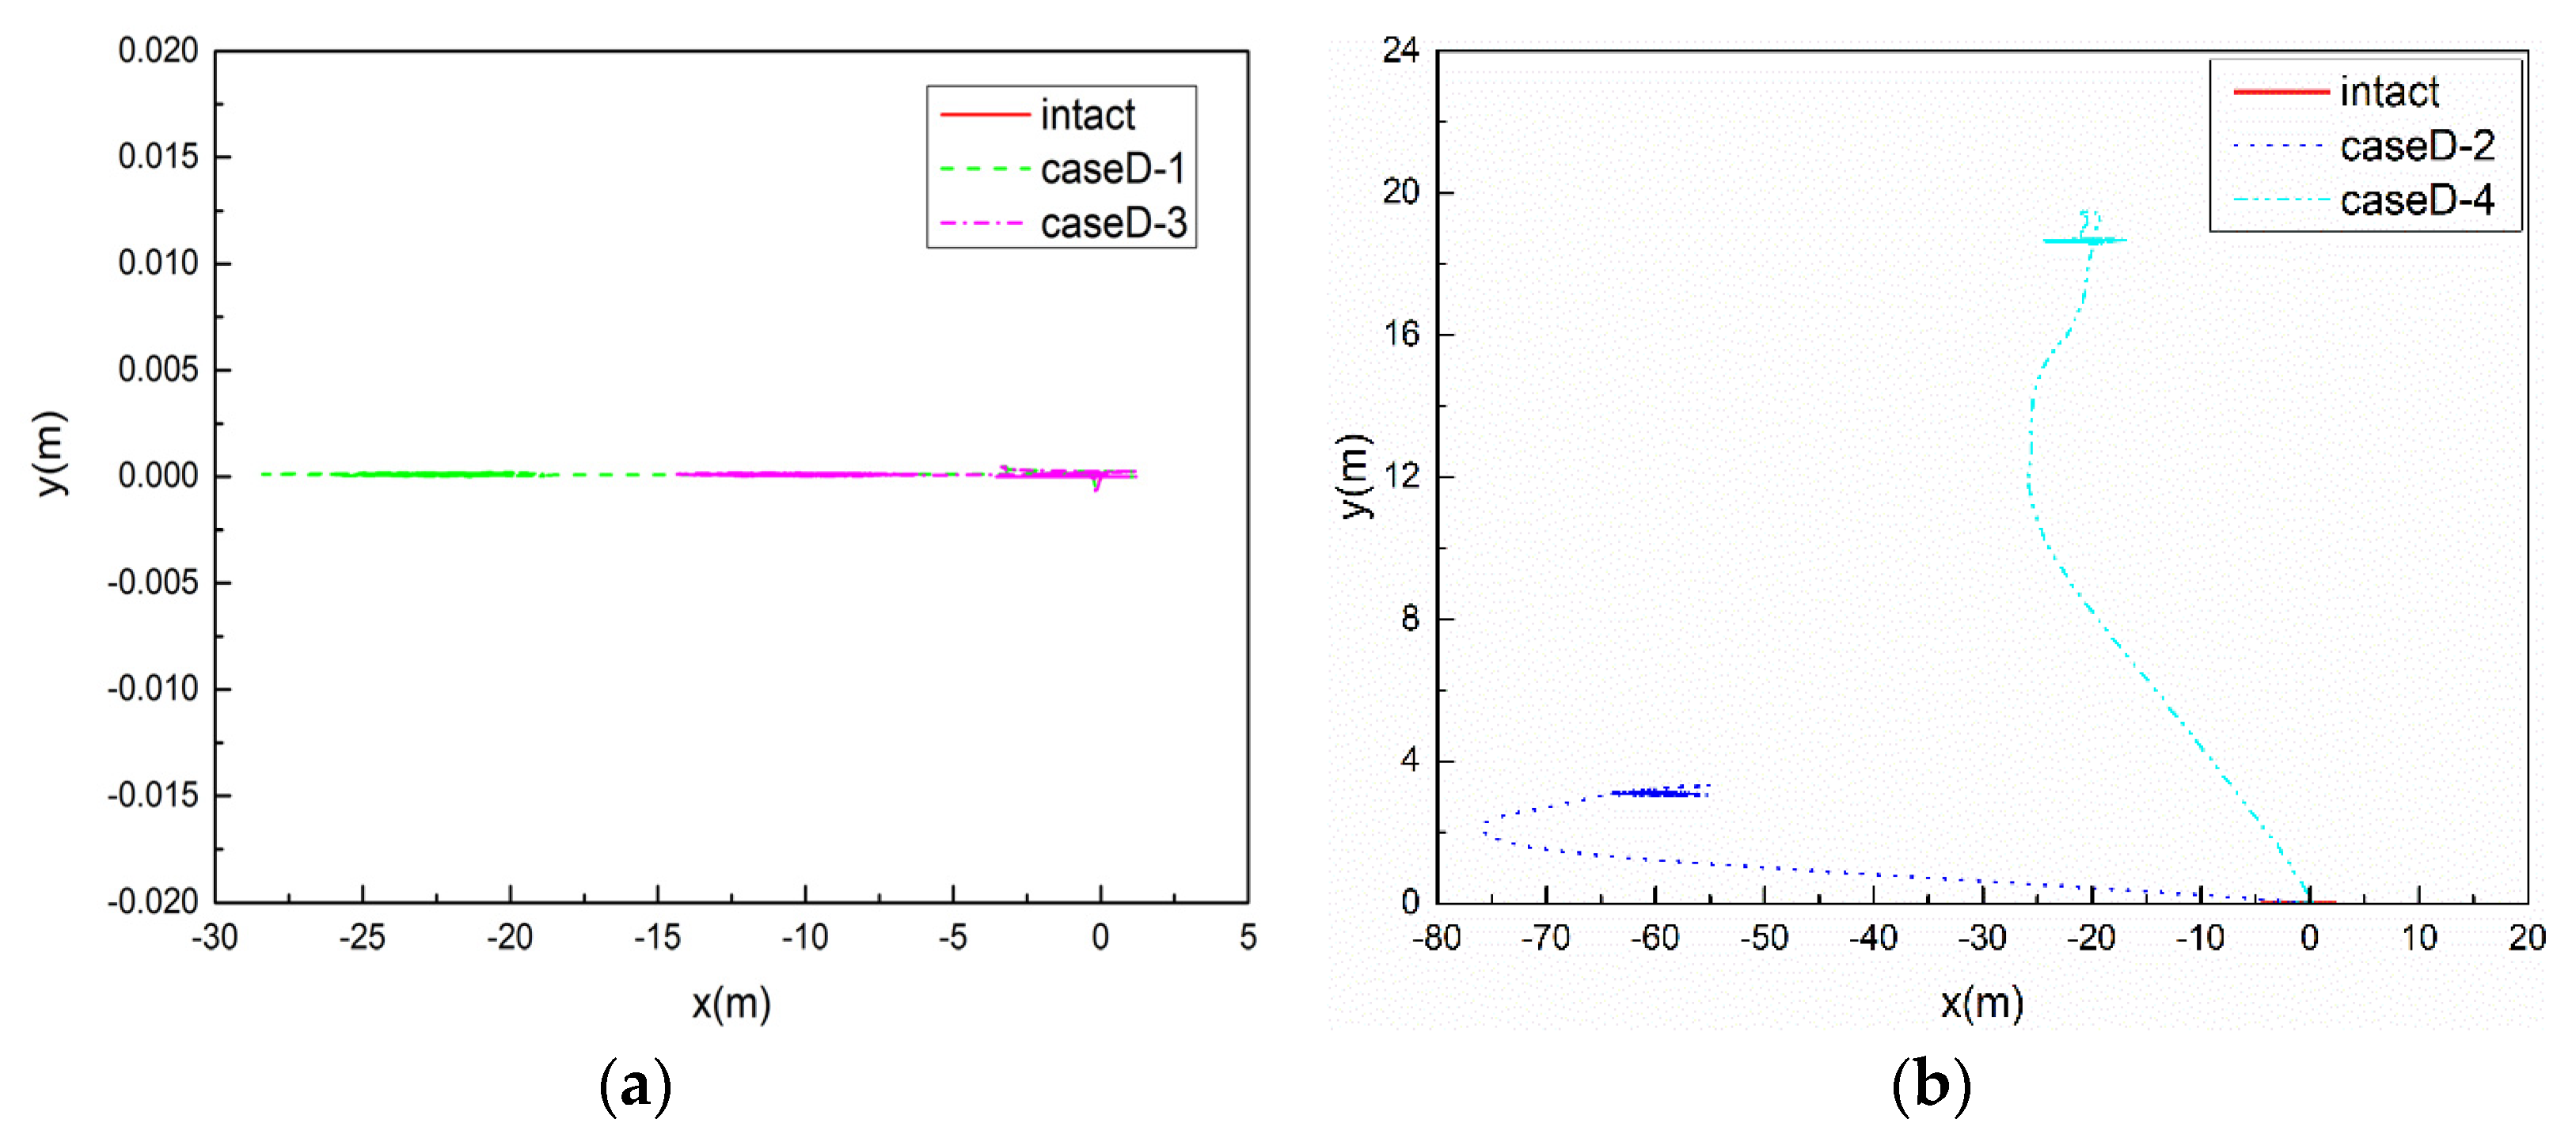
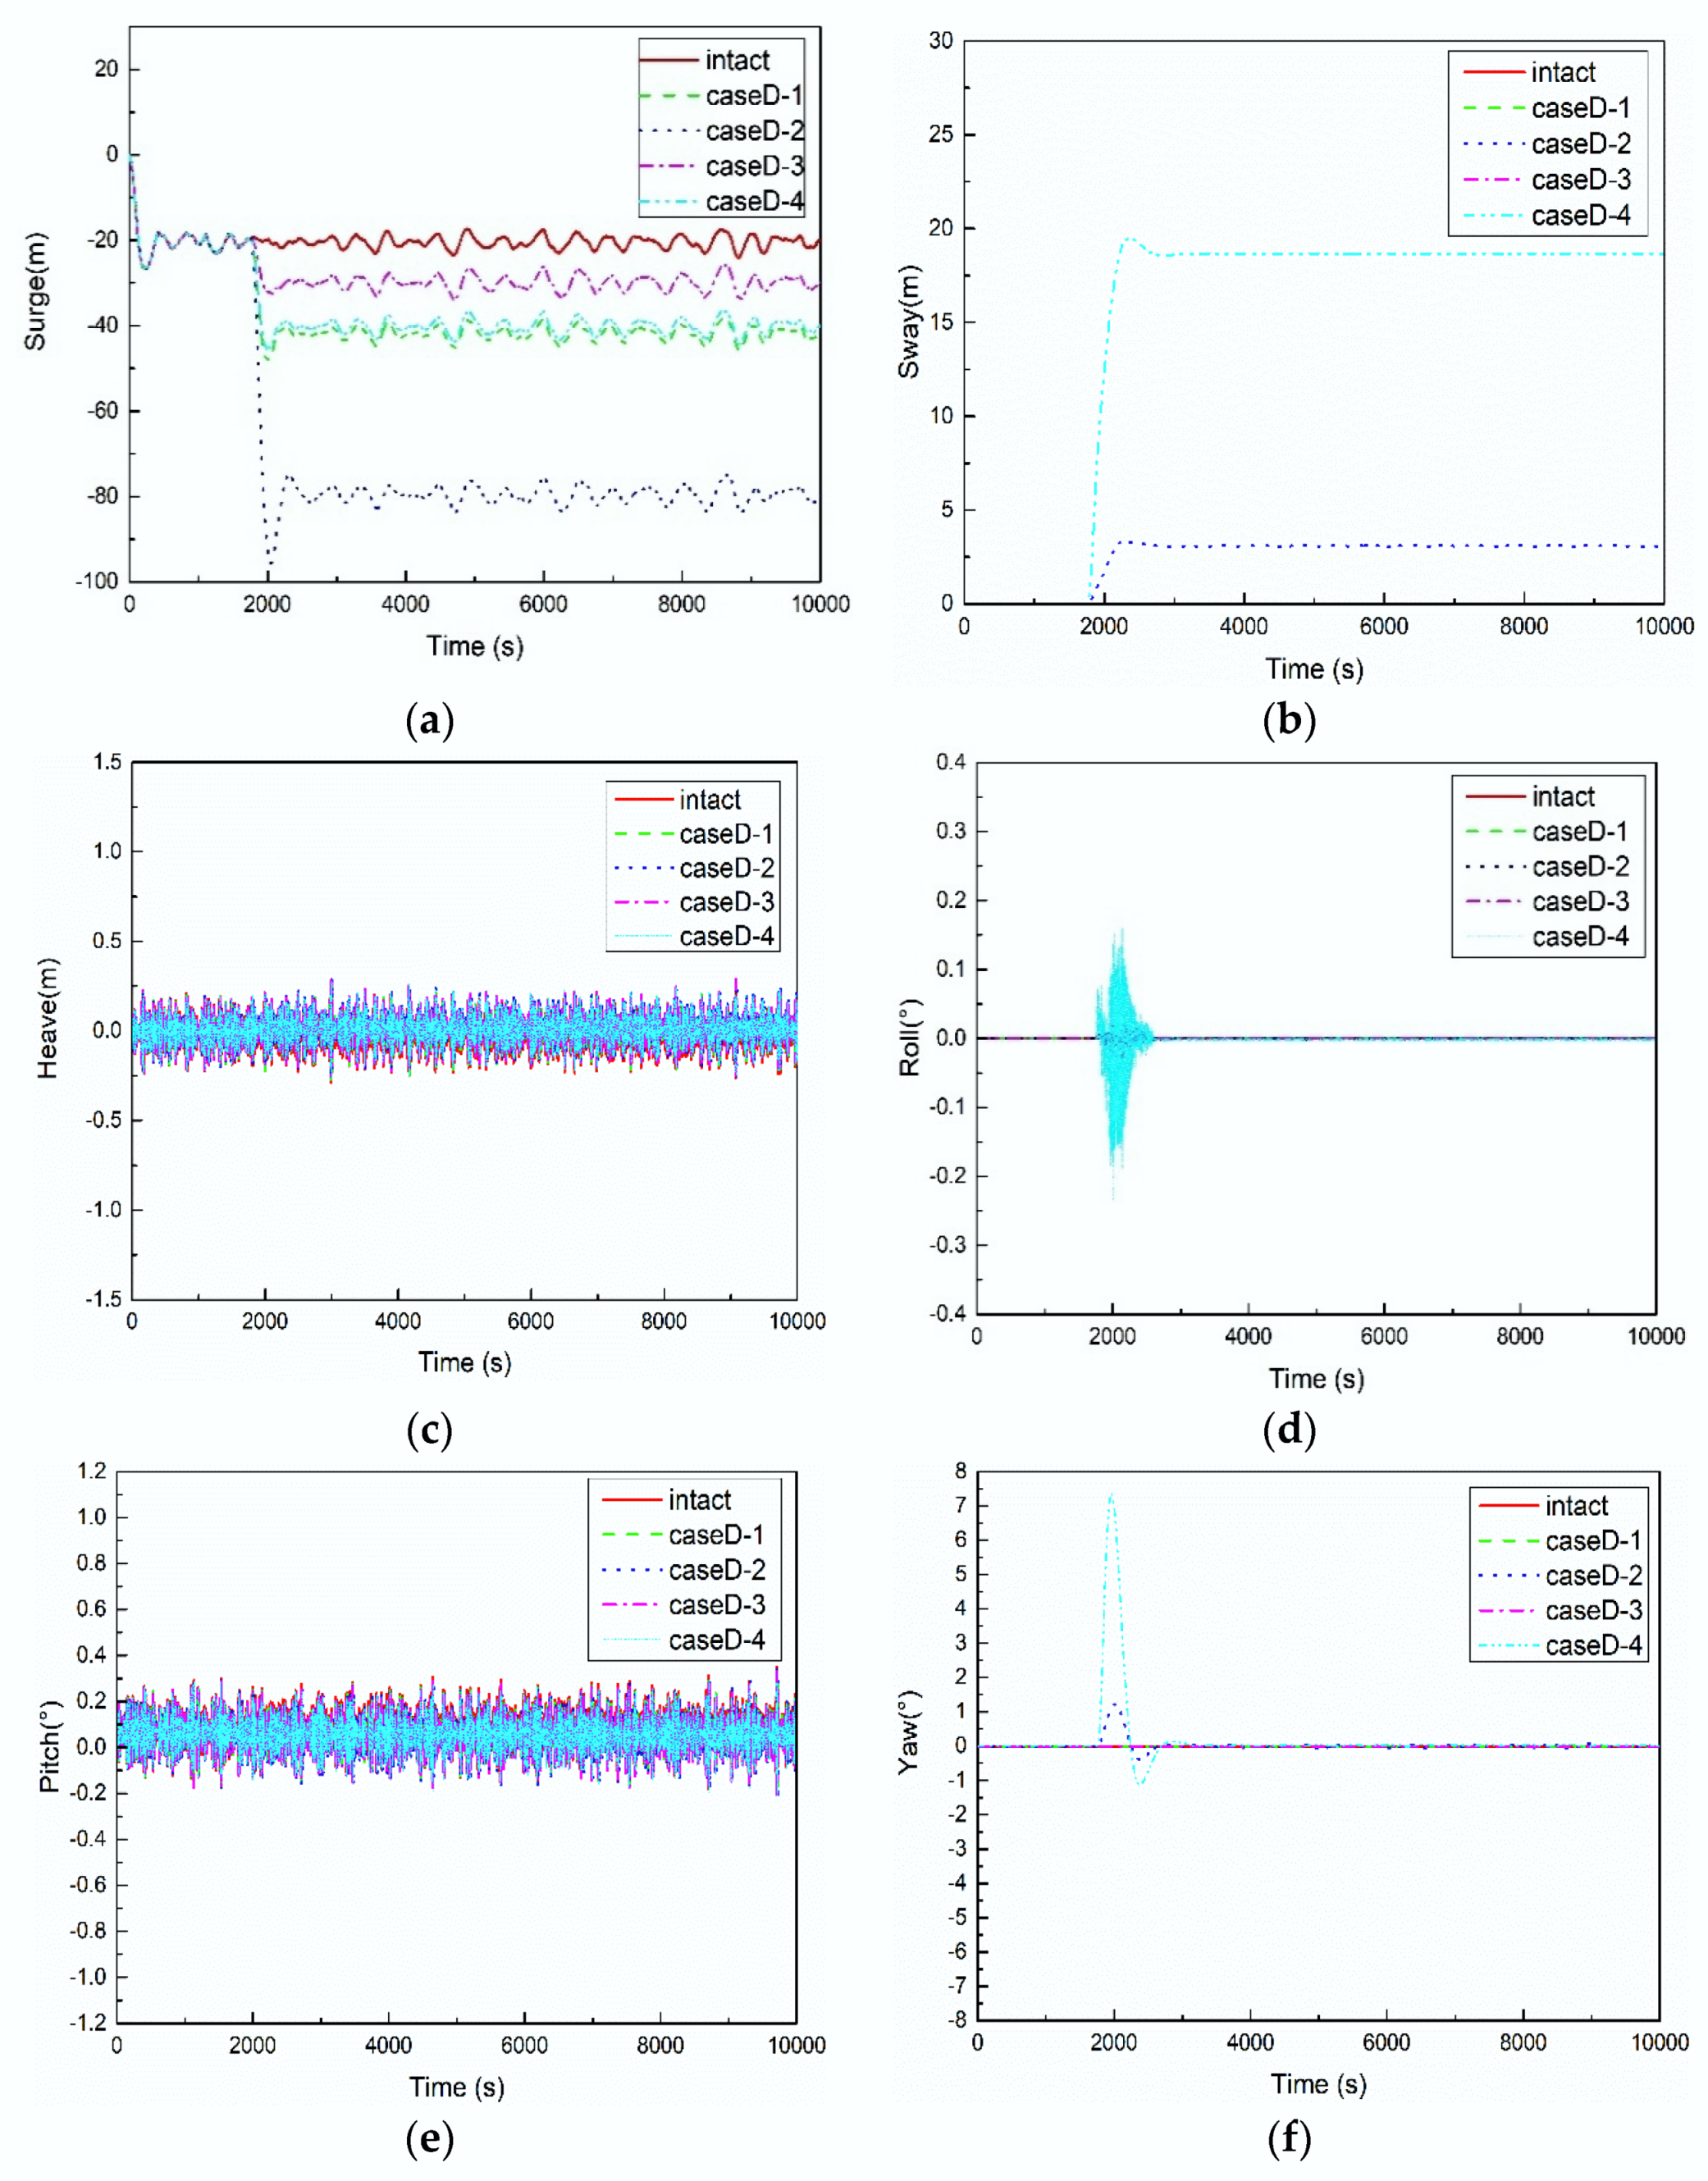
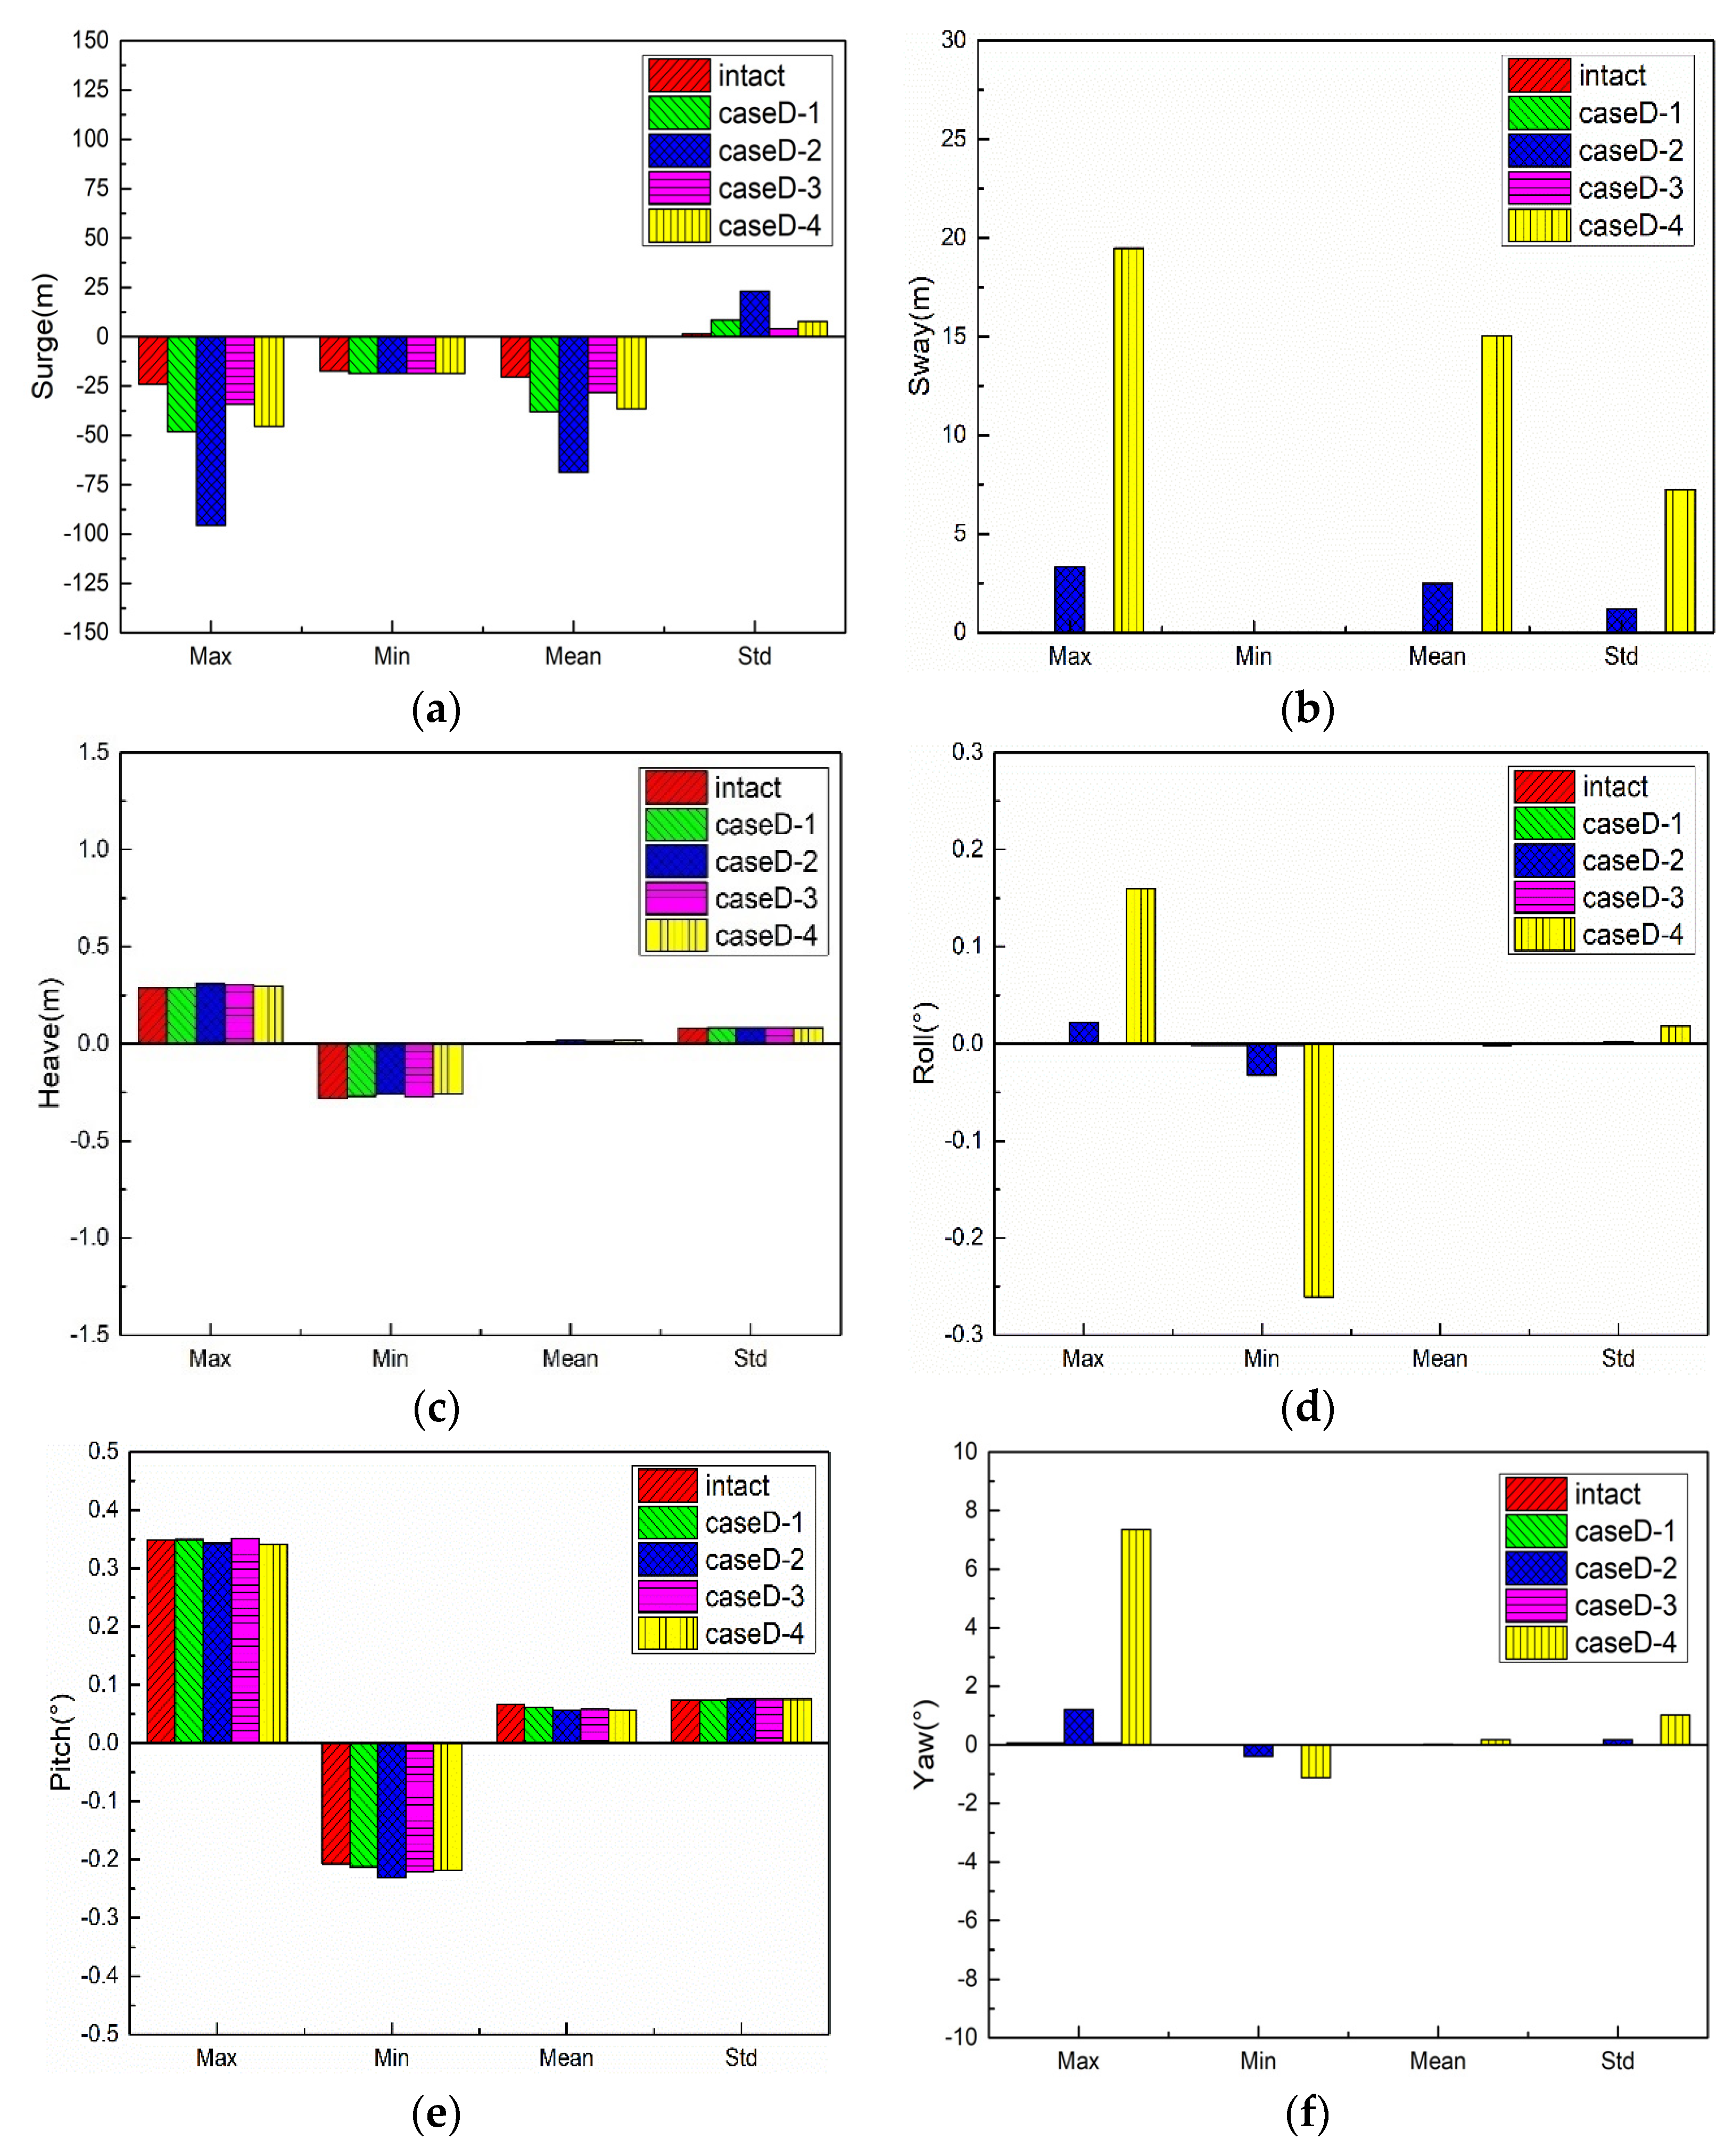
The mooring lines failure mainly affect the motion responses of the FPSO in the horizontal plane, and the yaw motion has the largest changes due to the loss of symmetry of mooring tensions caused by failed lines. When a certain mooring line failure occurs, the FPSO re-moves to a new equilibrium position under the effect of the remaining mooring lines, and then it reaches the steady motion responses under the environmental loads.
(3)
The transient responses evaluation of FPSO with different failure scenarios of mooring lines should also consider the selection of design sea states. Under different sea states, the manner changes in motion responses and mooring line tensions are also different considering the same mooring line failure mode and environmental incident directions.
(4)
The average peak tension of the mooring line should consider about conservative 10% variable uncertainty if applying only one certain irregular wave condition in the random sea state analysis, based on the simulation results in this paper.
In additional to the presented work in this paper, future efforts may involve studies such as the interaction between wave and current loads, progressive rather than the two mooring lines failure simultaneously, model tests methods, more sea states’ conditions, various mooring line configurations and their sensitivity to line breakage, etc. Together with the presented work, these studies would greatly help inform the industrial design, as it is critical to have comprehensive evaluations of the global responses of the floating platform due to mooring lines’ failure.

Author Contributions

Conceptualization, D.Q. and B.L.; methodology, J.Y. and Y.Q.; writing—original draft preparation, D.Q. and H.L.; writing—review and editing, B.L. and D.N. All authors have read and agreed to the published version of the manuscript.

Funding

This research was funded by the National Key R&D Program of China (Grant No. 2016YFE0200100), National Natural Science Foundation of China (Grant No. 51979030), and Fundamental Research Funds for the Central Universities.

Institutional Review Board Statement

Not applicable.

Informed Consent Statement

Not applicable.

Conflicts of Interest

The authors declare no conflict of interest.

References

  1. Xiao, L.F.; Yang, J.M. Review of the research on FPSO hydrodynamics. Ocean Eng. 2006, 24, 116–123. [Google Scholar]
  2. Shan, L.Z.; Dong, B.J.; Liu, M.; Wang, Q.; Li, Y.; Qi, D.S. Study of technical state and development tendency for FPSO. Oil Field Equip. 2008, 37, 26–30. [Google Scholar]
  3. Allahyarzadeh-Bidgoli, A.; Salviano, L.O.; Dezan, D.J. Energy optimization of an FPSO operating in the Brazilian Pre-salt region. Energy 2018, 164, 390–399. [Google Scholar] [CrossRef]
  4. Mastrangelo, C.F.; Lan, C.M.; Smith, C.E. From tanker-ships to the first FPSO in the US GoM. In Proceedings of the Offshore Technology Conference, Houston, TX, USA, 6–9 May 2019. [Google Scholar]
  5. Vijayaraghavan, V. Operational Readiness and Operational Safety on FPSO Project. In Proceedings of the SPE Asia Pacific Oil and Gas Conference and Exhibition, Brisbane, Australia, 23–25 October 2018; Society of Petroleum Engineers: Richardson, TX, USA, 2018. [Google Scholar]
  6. Fontaine, E.; Kilner, A.; Carra, C.; Washington, D.; Ma, K.T.; Phadke, A.; Kusinski, G. Industry survey of past failures, pre-emptive replacements and reported degradations for mooring systems of floating production units. In Proceedings of the Offshore Technology Conference, Houston, TX, USA, 5–8 May 2014. [Google Scholar]
  7. Yu, J.; Hao, S.; Yu, Y.; Chen, B.; Cheng, S.; Wu, J. Mooring analysis for a whole TLP with TTRs under tendon one-time failure and progressive failure. Ocean Eng. 2019, 182, 360–385. [Google Scholar] [CrossRef]
  8. Qi, Y.; Tian, X.; Guo, X. The hydrodynamic performance of a tension leg platform with one-tendon failure. Ships Offshore Struct. 2019, 14, 523–533. [Google Scholar] [CrossRef]
  9. Yang, C.K.; Padmanabhan, B.; Murray, J.; Kim, M.H. The transient effect of tendon disconnection on the global motion of ETLP. In Proceedings of the ASME 27th International Conference on Offshore Mechanics and Arctic Engineering, Estoril, Portugal, 15–20 June 2008. [Google Scholar]
  10. Kim, Y.; Sclavounos, P.D. A finite-depth unified theory for the linear and second-order problems of slender ships. J. Ship Res. 1998, 42, 297–309. [Google Scholar] [CrossRef]
  11. Kim, M.H.; Zhang, Z. Transient effects of tendon disconnection on the survivability of a TLP in moderate-strength hurricane condition. Int. J. Nav. Archit. Ocean Eng. 2009, 1, 13–19. [Google Scholar] [CrossRef] [Green Version]
  12. Tabeshpour, M.R.; Ahmadi, A.; Malayjerdi, E. Investigation of TLP behavior under tendon damage. Ocean Eng. 2018, 156, 580–595. [Google Scholar] [CrossRef]
  13. Gu, J.Y.; Chen, Y.; Geng, P.T.; Liu, W.M. Study on the dynamic response and tension characteristics of a TLP with one tendon broken. J. Ship Mech. 2015, 19, 1488–1497. [Google Scholar]
  14. Yang, C.K.; Kim, M.H. Transient effects of tendon disconnection of a TLP by hull–tendon–riser coupled dynamic analysis. Ocean Eng. 2010, 37, 667–677. [Google Scholar] [CrossRef]
  15. Oyejobi, D.O.; Jameel, M.; Sulong, N.H.R. Stochastic response of intact and a removed tendon tension leg platform to random wave and current forces. Arab. J. Sci. Eng. 2017, 42, 1065–1076. [Google Scholar] [CrossRef]
  16. Yang, C.K.; Kim, M.H. The structural safety assessment of a tie-down system on a tension leg platform during hurricane events. Ocean Syst. Eng. 2011, 1, 263–283. [Google Scholar] [CrossRef]
  17. Montasir, O.A.; Yenduri, A.; Kurian, V.J. Mooring system optimisation and effect of different line design variables on motions of truss spar platforms in intact and damaged conditions. China Ocean Eng. 2019, 33, 385–397. [Google Scholar] [CrossRef]
  18. Feng, J.; Yu, Y.; Qu, Y.; Xie, W.; Wu, M.; Zhao, J. A conjoint analysis of the stability and time-domain analysis on floating platform during mooring line breaking. In Proceedings of the ASME 38th International Conference on Ocean, Offshore and Arctic Engineering, Glasgow, Scotland, UK, 9–14 June 2019. [Google Scholar]
  19. Murai, M.; Suyama, N. Coupled motion response of a moored floating body in breaking a mooring line in waves. In Proceedings of the Twenty-Fifth International Ocean and Polar Engineering Conference, Kona, HI, USA, 21–26 June 2015. [Google Scholar]
  20. Zhang, Z.; Kim, M.H.; Ward, E.G. Progressive mooring-line failure of a deepwater MODU in hurricane conditions. In Proceedings of the ASME 28th International Conference on Ocean, Offshore and Arctic Engineering, Honolulu, HI, USA, 31 May–5 June 2009. [Google Scholar]
  21. Kim, B.W.; Sung, H.G.; Hong, S.Y.; Hong, S.W. Dynamic coupled analysis of FSRU with broken mooring line. In Proceedings of the Twenty-Fourth International Ocean and Polar Engineering Conference, Busan, Korea, 15–20 June 2014. [Google Scholar]
  22. Han, J.S.; Son, Y.J.; Choi, H.S.; Rho, J.B. The transient behavior of mooring systems in line-broken condition. In Proceedings of the Twenty-First International Offshore and Polar Engineering Conference, Maui, HI, USA, 19–24 June 2011. [Google Scholar]
  23. Girón, A.R.C.; Kim, B.W.; Farfán, J.A.M.; Hernández, A.O.V. Transient effects of an FPSO with a broken mooring line. In Proceedings of the Twenty-Fifth International Ocean and Polar Engineering Conference, Kona, HI, USA, 21–26 June 2015. [Google Scholar]
  24. Ma, G.; Sun, L. The design and implementation of FPSO mooring management system. In Proceedings of the ASME 27th International Conference on Offshore Mechanics and Arctic Engineering, Estoril, Portugal, 15–20 June 2008. [Google Scholar]
  25. Li, W.; Liu, H.; Lian, Y. Impacts of damaged ropes on the dynamic response of the taut-wire mooring system. Ocean Eng. 2017, 35, 11–20. [Google Scholar]
  26. Lian, Y.; Yim, S.C.; Zheng, J. Effects of damaged fiber ropes on the performance of a hybrid taut-wire mooring system. J. Offshore Mech. Arct. Eng. 2020, 142, 011607. [Google Scholar] [CrossRef]
  27. Kurian, V.J.; Yassir, M.A.; Harahap, I.S.H. Dynamic response of semisubmersibles with damaged mooring lines. In Proceedings of the Twenty-Second International Offshore and Polar Engineering Conference, Rhodes, Greece, 17–22 June 2012. [Google Scholar]
  28. Hong, J.P.; Cho, S.K.; Seo, J.H.; Sung, H.G.; Lee, D.Y.; Park, I.B.; Kim, D.W. Experimental study of effect of mooring line failure on behavior of turret-moored FPSO ship. J. Ocean Eng. Technol. 2015, 29, 231–240. [Google Scholar] [CrossRef]
  29. Bae, Y.H.; Kim, M.H.; Kim, H.C. Performance changes of a floating offshore wind turbine with broken mooring line. Renew. Energy 2017, 101, 364–375. [Google Scholar] [CrossRef]
  30. Bae, Y.H.; Kim, M.H.; Yu, Q. Coupled dynamic analysis of FOWT (Floating Offshore Wind Turbine) with partially broken blade. In Proceedings of the Twenty-Third International Offshore and Polar Engineering Conference, Anchorage, AK, USA, 30 June–5 July 2013. [Google Scholar]
  31. Li, Y.; Zhu, Q.; Liu, L.; Tang, Y. Transient response of a SPAR-type floating offshore wind turbine with fractured mooring lines. Renew. Energy 2018, 122, 576–588. [Google Scholar] [CrossRef]
  32. Wu, H.; Zhao, Y.; He, Y. Transient response of a TLP-type floating offshore wind turbine under tendon failure conditions. Ocean Eng. 2021, 220, 108486. [Google Scholar] [CrossRef]
  33. American Petroleum Institute. Design and Analysis of Station Keeping Systems for Floating Structures—API Recommended Practice 2SK, 3rd ed.; American Petroleum Institute: Washington, DC, USA, 2005. [Google Scholar]
  34. Berteaux, H.O. Buoy Engineering; Wiley: New York, NY, USA, 1976. [Google Scholar]
  35. Hall, M.; Goupee, A. Validation of a lumped-mass mooring line model with DeepCwind semisubmersible model test data. Ocean Eng. 2015, 104, 590–603. [Google Scholar] [CrossRef] [Green Version]
  36. Wihers, J.E.W.; Devlin, P.V. Effect of Coupling of Mooring Lines and Risers on the Design Values for a Turret Moored FPSO in Deep Water of the Gulf of Mexico. In Proceedings of the Eleventh International Offshore and Polar Engineering Conference, Stavanger, Norway, 17–22 June 2001. [Google Scholar]
Figure 1. Mooring system configuration of Floating Production Storage and Offloading (FPSO). (a) Vertical view. (b) Side view.
Jmse 09 00103 g001
Figure 2. The static load–displacement curve of FPSO mooring system.
Jmse 09 00103 g002
Figure 3. Restoring force curves: (a) surge direction and (b) sway direction.
Jmse 09 00103 g003
Figure 4. Traces of FPSO in CaseA. (a) CaseA-1 and CaseA-3. (b) CaseA-2 and CaseA-4.
Jmse 09 00103 g004
Figure 5. Time series of FPSO motions in CaseA. (a) surge. (b) sway. (c) heave. (d) roll. (e) pitch. (f) yaw.
Jmse 09 00103 g005
Figure 6. Comparisons of FPSO motions statistics in CaseA: (a) surge, (b) sway, (c) heave, (d) roll, (e) pitch, and (f) yaw.
Jmse 09 00103 g006aJmse 09 00103 g006b
Figure 7. Time series of mooring line tensions in CaseA. (a) Mooring line #1. (b) Mooring line #3. (c) Mooring line #5. (d) Mooring line #12.
Jmse 09 00103 g007
Figure 8. Comparisons of mooring line tensions statistics in CaseA. (a) Mooring line #1. (b) Mooring line #3. (c) Mooring line #5. (d) Mooring line #12.
Jmse 09 00103 g008
Figure 9. Safety factor of mooring lines in CaseA. (a) Mooring line #1. (b) Mooring line #3. (c) Mooring line #5. (d) Mooring line #12.
Jmse 09 00103 g009
Figure 10. Traces of FPSO in CaseB.
Jmse 09 00103 g010
Figure 11. Time series of FPSO motions in CaseB: (a) surge, (b) sway, (c) heave, (d) roll, (e) pitch, and (f) yaw.
Jmse 09 00103 g011
Figure 12. Comparisons of FPSO motions statistics in CaseB: (a) surge, (b) sway, (c) heave, (d) roll, (e) pitch, and (f) yaw.
Jmse 09 00103 g012aJmse 09 00103 g012b
Figure 13. Time series of mooring line tensions in CaseB. (a) Mooring line #1. (b) Mooring line #3. (c) Mooring line #5. (d) Mooring line #12.
Jmse 09 00103 g013
Figure 14. Comparisons of mooring line tensions statistics in CaseB. (a) Mooring line #1. (b) Mooring line #3. (c) Mooring line #5. (d) Mooring line #12.
Jmse 09 00103 g014aJmse 09 00103 g014b
Figure 15. Safety factor of mooring lines in CaseB. (a) Mooring line #1. (b) Mooring line #3. (c) Mooring line #5. (d) Mooring line #12.
Jmse 09 00103 g015
Figure 16. Traces of FPSO in CaseC.
Jmse 09 00103 g016
Figure 17. Time series of FPSO motions in CaseC: (a) surge, (b) sway, (c) heave, (d) roll, (e) pitch, and (f) yaw.
Jmse 09 00103 g017aJmse 09 00103 g017b
Figure 18. Comparisons of FPSO motions statistics in CaseC: (a) surge, (b) sway, (c) heave, (d) roll, (e) pitch, and (f) yaw.
Jmse 09 00103 g018aJmse 09 00103 g018b
Figure 19. Time series of mooring line tensions in CaseC. (a) Mooring line #1. (b) Mooring line #3. (c) Mooring line #5. (d) Mooring line #12.
Jmse 09 00103 g019
Figure 20. Comparison of mooring line tensions statistics in CaseC. (a) Mooring line #1. (b) Mooring line #3. (c) Mooring line #5. (d) Mooring line #12.
Jmse 09 00103 g020
Figure 21. Safety factor of mooring lines in CaseC. (a) Mooring line #1. (b) Mooring line #3. (c) Mooring line #5. (d) Mooring line #12.
Jmse 09 00103 g021
Figure 22. Traces of FPSO in CaseD. (a) CaseD-1 and CaseD-3. (b) CaseD-2 and CaseD-4.
Jmse 09 00103 g022
Figure 23. Time series of FPSO motions in CaseD: (a) surge, (b) sway, (c) heave, (d) roll, (e) pitch, and (f) yaw.
Jmse 09 00103 g023
Figure 24. Comparison of FPSO motions statistics in CaseD: (a) surge, (b) sway, (c) heave, (d) roll, (e) pitch, and (f) yaw.
Jmse 09 00103 g024
Figure 25. Time series of mooring line tensions in CaseD. (a) Mooring line #1. (b) Mooring line #3. (c) Mooring line #5. (d) Mooring line #12.
Jmse 09 00103 g025
Figure 26. Comparison of mooring line tensions statistics in CaseD. (a) Mooring line #1. (b) Mooring line #3. (c) Mooring line #5. (d) Mooring line #12.
Jmse 09 00103 g026aJmse 09 00103 g026b
Figure 27. Safety factor of mooring lines in CaseD. (a) Mooring line #1. (b) Mooring line #3. (c) Mooring line #5. (d) Mooring line #12.
Jmse 09 00103 g027
Figure 28. Time series of mooring line tensions under different random seeds of wave in CaseA-1. (a) Mooring line #1. (b) Mooring line #3. (c) Mooring line #5. (d) Mooring line #12.
Jmse 09 00103 g028
Figure 29. Comparison of the mooring lines statistics under different random seeds of wave in CaseA-1. (a) Mooring line #1. (b) Mooring line #3. (c) Mooring line #5. (d) Mooring line #12.
Jmse 09 00103 g029aJmse 09 00103 g029b
Table 1. Particulars of FPSO.
DesignationSymbolUnitValue
LengthLppm310
BreadthBm47.17
DepthHm28.04
DraftTm18.90
DisplacementDkg2.40 × 108
Center of gravity above baselineKGm13.32
Distance between turret and bow-m63.55
Transverse radius of gyrationKXXm14.77
Longitudinal radius of gyrationKYYm77.47
Yaw radius of gyrationKZZm79.30
Table 2. Particulars of mooring system.
DesignationUnitValue
Upper/Bottom ChainLength (L1/L3)m45.7/914.4
Diametermm88.90
Dry weightN/m1617.10
Wet weightN/m1406.90
StiffnessKN794,484
Minimum breaking loadKN6512
Normal/tangential drag coefficient-2.00/0.65
Normal/tangential inertia coefficient-1.00/0.50
Middle WireLength (L2)m1127.80
Diametermm88.90
Dry weightN/m412.23
Wet weightN/m349.75
StiffnessKN689,858
Minimum breaking loadKN6418
Normal/tangential drag coefficient-1.00/0.30
Normal/tangential inertia coefficient-0.50/0.25
Table 3. Comparison of FPSO motion responses and mooring line tensions.
Data SourcesSurge
(m)
Sway
(m)
Roll
(deg)
Yaw
(deg)
Line #2
(MN)
Line #8
(MN)
MaxNumerical analysis−34.1226.494.2315.233.131.60
MARIN tests−34.6028.594.5416.682.971.55
MinNumerical analysis−84.845.79−3.871.750.670.32
MARIN tests−85.105.27−4.241.940.610.30
MeanNumerical analysis−54.1116.430.347.532.010.77
MARIN tests−52.5016.600.378.121.820.75
SDNumerical analysis7.534.150.992.920.260.13
MARIN tests6.904.501.102.700.240.12
Table 4. Parameters of environment conditions.
DescriptionUnitEnvironment AEnvironment BEnvironment CEnvironment D
WaveHsm12.1912.1912.193.96
Tps1414149.0
Wave spectrum-JONSWAPJONSWAPJONSWAPJONSWAP
Wave directiondeg180180135180
Wind1 h mean speedm/s41.1241.1241.1221.61
Wind spectrum-APIAPIAPIAPI
Directiondeg180210135180
CurrentSpeedm/s1.071.071.070.9
Directiondeg180150135180
The bold here to emphasize the different load angles.
Table 5. Mooring line failure conditions.
CasesMooring Line Failure Modes
CaseACaseA-1
(single)
CaseA-2
(ipsilateral)
CaseA-3
(opposite)
CaseA-4
(adjacent)
Mooring line
#2 broken
Mooring line
#2 and #1 broken
Mooring line
#2 and #8 broken
Mooring line
#2 and #11 broken
CaseBCaseB-1CaseB-2CaseB-3CaseB-4
Mooring line
#2 broken
Mooring line
#2 and #1 broken
Mooring line
#2 and #8 broken
Mooring line
#2 and #11 broken
CaseCCaseC-1CaseC-2CaseC-3CaseC-4
Mooring line
#2 broken
Mooring line
#2 and #1 broken
Mooring line
#2 and #8 broken
Mooring line
#2 and #11 broken
CaseDCaseD-1CaseD-2CaseD-3CaseD-4
Mooring line
#2 broken
Mooring line
#2 and #1 broken
Mooring line
#2 and #8 broken
Mooring line
#2 and #11 broken
Table 6. Stiffness of different mooring line failure conditions.
IntactCaseA/B/C/D-1CaseA/B/C/D-2CaseA/B/C/D-3CaseA/B/C/D-4
Surge direction (kN/m)54.594532.5537.2344.57
Reduction (%)/17.5740.3731.8018.36
Sway direction (kN/m)54.5954.1753.6054.0944.57
Reduction (%)/0.771.800.9218.36
Table 7. Static equilibrium position of FPSO under different mooring line failure conditions.
IntactCaseA/B/C/D-1CaseA/B/C/D-2CaseA/B/C/D-3CaseA/B/C/D-4
Surge (m)0−16.99−44.940−17.19
Sway (m)002.01017.18
Heave (m)000.010.010.01
Roll (deg)00000
Pitch (deg)00000
Yaw (deg)000.3400
Table 8. Requirements of the minimum safety factor of mooring line tension.
Analysis MethodLimitation of Maximum Mooring Line Tension (Percentage of Minimum Breaking Load)Safety Factor
IntactQuasi-static502.0
IntactDynamic601.67
Mooring lines brokenQuasi-static701.43
Mooring lines brokenDynamic801.25
This bold is intended to emphasize the criteria for judging whether a mooring line is safe or not as follows.
Table 9. Peak tension of mooring line under different wave seeds.
Peak Tension (MN)
Seed-1Seed-2Seed-3Seed-4
Mooring Line #14.294.1234.2124.12
Mooring Line #34.294.1234.2174.12
Mooring Line #52.4962.7292.6742.394
Mooring Line #122.6072.8082.7722.484
Publisher’s Note: MDPI stays neutral with regard to jurisdictional claims in published maps and institutional affiliations.

