Article

Experimental Study on Stiffness Degradation and Liquefaction Characteristics of Marine Sand in the East Nan-Ao Area in Guangdong Province, China

1
Department of Geotechnical Engineering, Tongji University, Shanghai 200092, China
2
Shanghai Investigation, Design & Research Institute Co., Ltd., Shanghai 200434, China
3
China Three Gorges Renewables Group Co., Ltd., Beijing 100053, China
*
Author to whom correspondence should be addressed.
J. Mar. Sci. Eng. 2021, 9(6), 638; https://doi.org/10.3390/jmse9060638
Submission received: 23 April 2021 / Revised: 31 May 2021 / Accepted: 4 June 2021 / Published: 8 June 2021
(This article belongs to the Special Issue Instability and Failure of Subsea Structures)

Abstract

:
Offshore wind power, as an efficient renewable energy source, is being vigorously developed nowadays. However, the liquefaction of marine sand due to earthquakes brings potential safety hazards to the wind turbine structures. In this study, a series of resonant column and undrained cyclic triaxial tests were carried out to investigate the stiffness degradation and liquefaction characteristics of marine sand in the offshore wind farm at the East Nan-ao area in Guangdong Province (China). Results show that the confining pressure increases the shear modulus of sand and restrains the nonlinearity of modulus. The liquefaction resistance of soils significantly increases with the increase of relative density. The effect of particle size on the liquefaction resistance is related to the cyclic shear stress ratio. The additional pressure induced by the presence of the wind turbine structure enlarges the energy required for shallow soil liquefaction. Besides, a model for predicting shear modulus and another modified model based on Seed’s pore pressure development model have been established, which can efficiently fit the dynamic shear modulus and the generation of excess pore water pressures in the tests, respectively.

1. Introduction

Nowadays, energy consumption is rapidly increasing, driven by economic growth and social development, while energy transition and low-carbon development have become hot topics of global concern. To face this challenge, China has put forward its “carbon neutrality” plan and takes wind power as essential for low-carbon development, setting a target of at least 800 million kilowatts of installed capacity by 2030 [1,2]. In particular, offshore wind turbines have been given much attention due to their unique superiorities, such as abundant wind resources, high power generation efficiency, and no land occupation. However, these offshore wind turbines are inevitably exposed to potential threats due to the complex environmental conditions. For example, many of the established or to-be-established large-scale wind farms are located in or near seismic zones, such as the west coast of the United States, and the Yellow Sea and East Sea of China [3]. The seismic action leads to the weakening of foundation soils and the generation of excess pore water pressure, which reduces the bearing capacity of the foundation, and may result in instability or significant deformation of offshore wind turbine structures [4,5]. In order to ensure the safe operation of these wind turbines in seismically active areas, the dynamic characteristics of the soil layer in the relevant sea areas should be correctly investigated.
In earthquake engineering research, dynamic properties such as shear modulus and damping ratio of soil layer are important indexes which are widely used in soil response analysis [6] and liquefaction discrimination [7]. The degradation of soil shear modulus caused by cyclic loading also determines the service life of offshore wind turbines to a large extent [8] and affects the natural frequency of wind turbine structure systems [9]. Wang et al. [10] and Kong et al. [11] found that the soil around the offshore wind turbine has a significant impact on the dynamic response of the wind turbine in the centrifugal test. Thus, when establishing the dynamic analysis method of the offshore wind turbine system, it is necessary to summarize a reasonable soil degradation model [12]. So far, many scholars have carried out experimental research on the modulus of soil. Hardin et al. [13] proposed a hyperbolic model to describe the nonlinearity of soil modulus observed in the resonant column test. In recent years, Gu et al. [14,15,16,17,18] carried out a large number of resonant column and bending element tests on Toyoura sand to study the mechanism of sand modulus reduction and optimized the dynamic degradation model. Actually, marine soil layers are usually high in water content, mixed with many biological impurities, and the regional difference of dynamic characteristics is noticeable. Large offshore wind turbines are planned to be built in the east Nan-ao area in Guangdong Province of China, which is just located in the middle of the coastal seismic zone of the South China Sea. There are many biological impurities and inorganic salt deposits in the sand layer in this area, and the soil properties may differ from the corresponding soil samples to the previous theoretical analysis. However, the research on dynamic shear modulus of marine soil mainly focused on shallow soft clay [19,20]. Thus, the dynamic properties of these typical soil in this location are required to ensure structural safety. Moreover, the test results will enrich the current understanding of the dynamic characteristics of marine soils and modify the previous shear modulus models in describing the soils in the practical marine site instead of ideal pure sand samples.
Silty and sandy strata with high liquefaction possibility are widely distributed in the shallow site of the Nan-ao area. Once the soil liquefaction process is initiated due to an earthquake, the soil strength will be significantly lost, and a large flow deformation may occur. In order to better understand the anti-liquefaction ability of soil, Rui et al. [18] discussed the effect of particle size of calcareous sand on liquefaction resistance by cyclic simple shear test; Li et al. [21,22,23] investigated the liquefaction characteristics of different soil samples through dynamic triaxial tests in recent years, and verified the improvement effect of methods such as adding rubber powder and artificial cementation on liquefaction. Lentini et al. [24,25] and Grasso et al. [26] comprehensively evaluated the dynamic characteristics and liquefaction resistance of sand in the Ritiro area under cyclic loading in the Ritiro area by laboratory methods and in situ measurements, respectively. However, some scholars have found that the pressure of the structure can improve the liquefaction of the shallow soil layer and reduce the treatment of liquefiable layer. Bhatnagar et al. [27] and Ye et al. [28] obtained the compaction effect and liquefaction improvement effect of dam construction on liquefiable layer utilizing numerical simulation; Huang et al. [29] used dynamic triaxial test to quantify the improvement of dam weight on soil sample liquefaction resistance. Similarly, the offshore foundations are also large structures. The diameter of the gravity foundation and suction tube foundation used in practical projects nowadays can reach tens of meters, which will definitely exert significant additional pressure on the shallow foundation soil [1]. When Ding et al. [30], Eshfeh et al. [31,32], and Zhang et al. [33] carried out numerical simulations of the offshore wind turbine, they all observed that the additional pressure of the foundation on the shallow sand layer limits the growth of excess pore pressure in the sand layer under dynamic load, which makes it more challenging to enter the liquefaction state. However, most of the constitutive models and parameters used in the modeling process are based on the previous test results of ideal pure sand, which lack reliable evaluations of the dynamic strength of practical marine soils. Therefore, it is still necessary to carry out cyclic triaxial tests on the soil in marine sites to study the factors affecting anti-liquefaction resistance and summarize liquefaction characteristics.
This paper aims to investigate the soil dynamic parameters and liquefaction resistance of the marine sands, and propose recommendations for the long-term safe operation of offshore wind turbines. The shear modulus of silty sand and medium sand in the East Nan-ao area is tested first through resonant column tests to verify the reliability of the existing models for describing the stiffness degradation of marine soil. Furthermore, the empirical methods characterizing the dynamic shear modulus of site soils have been compared. Secondly, cyclic triaxial tests are carried out to analyze the effects of relative density and particle sizes on the liquefaction resistance of marine sand, and the development model of excess pore pressure was then proposed. Besides, considering the additional pressure of the shallow liquefiable layer, the effect of structure weight on the liquefaction resistance and dynamic response of the soil layer has been discussed.

2. Materials and Methods

2.1. Experiment Material

Typical soil samples, which are mainly composed of silty and medium sand, were collected from drilling cores obtained at a site in the East Nan-ao area. In this location, the thickness of the Quaternary overburden is 2.20–26.60 m, and the bedrock lithology is mainly mixed granite. The mineral composition of silty is mainly quartz, containing a small number of clay particles, and the medium sand particles are quartz. The fundamental physical and mechanical indexes of silty and sand used in the test are given in Table 1.
Previous studies show that the self-weights of the wind turbines have a liquefaction inhibitory effect on the shallow sand layer under the foundation [21]. Therefore, the cyclic triaxial tests have been carried out for the shallow silty sand and medium sand in this study. Since it is difficult to obtained undisturbed sand samples, reconstituted soil samples were used in the test. The gradation curve and physical parameters of the soil samples are shown in Figure 1 and Table 2, respectively.
The burial depth of the soil sample is about 5 m, so the initial confining pressure is 50 kPa, and the relative density is 45%. In the test group of the silty layer, considering the self-weight pressure of suction bucket foundation (50 kPa) and gravity foundation (130 kPa), the consolidation confining pressure of silty in the cyclic triaxial test is 50 kPa, 100 kPa and 180 kPa. In order to compare the effect of compactness on liquefaction, those with Dr = 70% were added to the group. Besides, the test groups of medium sand (C16-C18) are set to compare the effect of particle size. For the soil samples with the same density and confining pressure, three tests with different cyclic stress are needed to obtain the resistance curve, so a total of 18 cyclic triaxial tests have been carried out in this study, as shown in Table 3.

2.2. Experimental Apparatus and Operations

Figure 2a shows the GDS resonant column device used in this study. The test process can be mainly divided into three steps: (1) install a soil sample whose diameter and height are 50 mm and 100 mm, respectively; (2) install the top drive head and LVDT sensor, and carry out the isotropic consolidation according to the scheme; (3) After consolidation, the torsional harmonic load amplitude is increased step by step to obtain the resonant frequency as well as the dynamic shear modulus G of the specimen at the shear strain amplitude of 5 × 10⁻⁶~1 × 10⁻³.
The cyclic triaxial test is carried out with the GDS cyclic triaxial device, as shown in Figure 2b. The test process can be mainly divided into five steps: (1) the soil sample was dried and crushed, passed through a 5 mm standard sieve, and only the part under the sieve was retained; (2) based on the moisture tamping method, the sand is compacted into a Φ50 mm × 100 mm soil sample layer by layer in the mold; (3) through the backpressure channel, CO2 and de-aired water are successively introduced, and back pressure saturation is carried out to ensure that the pore water pressure coefficient B of the soil sample is greater than 0.95; (4) isotropic consolidation of soil samples according to the test scheme; (5) the equal amplitude deviatoric stress is applied according to the scheme, and the test is stopped after the soil is liquefied. The frequency of the cyclic load is set as 1 Hz, and the liquefaction criterion is that the ratio of excess pore water pressure (Ru = ∆u/σm′) is larger than 1.0 or the double strain amplitude is greater than 5%.

3. Results of Resonant Column Test and Prediction Model of Shear Modulus

3.1. Maximum Shear Modulus

In the resonant column test, when the exciting voltage is less than 5 × 10⁻⁴ V, the shear strain in the soil sample is in the order of 10−6. At this time, the soil is close to the state of approximate elasticity, and the value of G is defined as the maximum shear modulus Gmax. The test results are shown in Figure 3. The maximum shear modulus of all kinds of soil increases with the confining pressure, which is consistent with previous laboratory test results in references [34,35,36].
As seen in Figure 3, Gmax increases linearly with the increase of effective confining pressure. Because the void ratio of each layer in the site does not change much, the prediction model of Gmax can be given in the form of Equation (1) according to Yang et al. [37]:
G max = ( A + n × 0 . 1 σ m )
where A and n are fitting parameters, and σm′ represents the effective confining pressure on the soil.
The values of fitting parameters are shown in Table 4. The maximum shear modulus of sandy layers under different depths can be easily obtained by the linear fitting formula, and the determinable coefficients are all above 0.95, which means the fitting reliability is high. Furthermore, it can be observed from Figure 3 that the shear modulus of medium sand is larger than that of silt under small confining pressure, but the slope of the curve is lower, which indicates that confining pressure has a more significant effect on the improvement of the shear modulus of fine-grained soil.

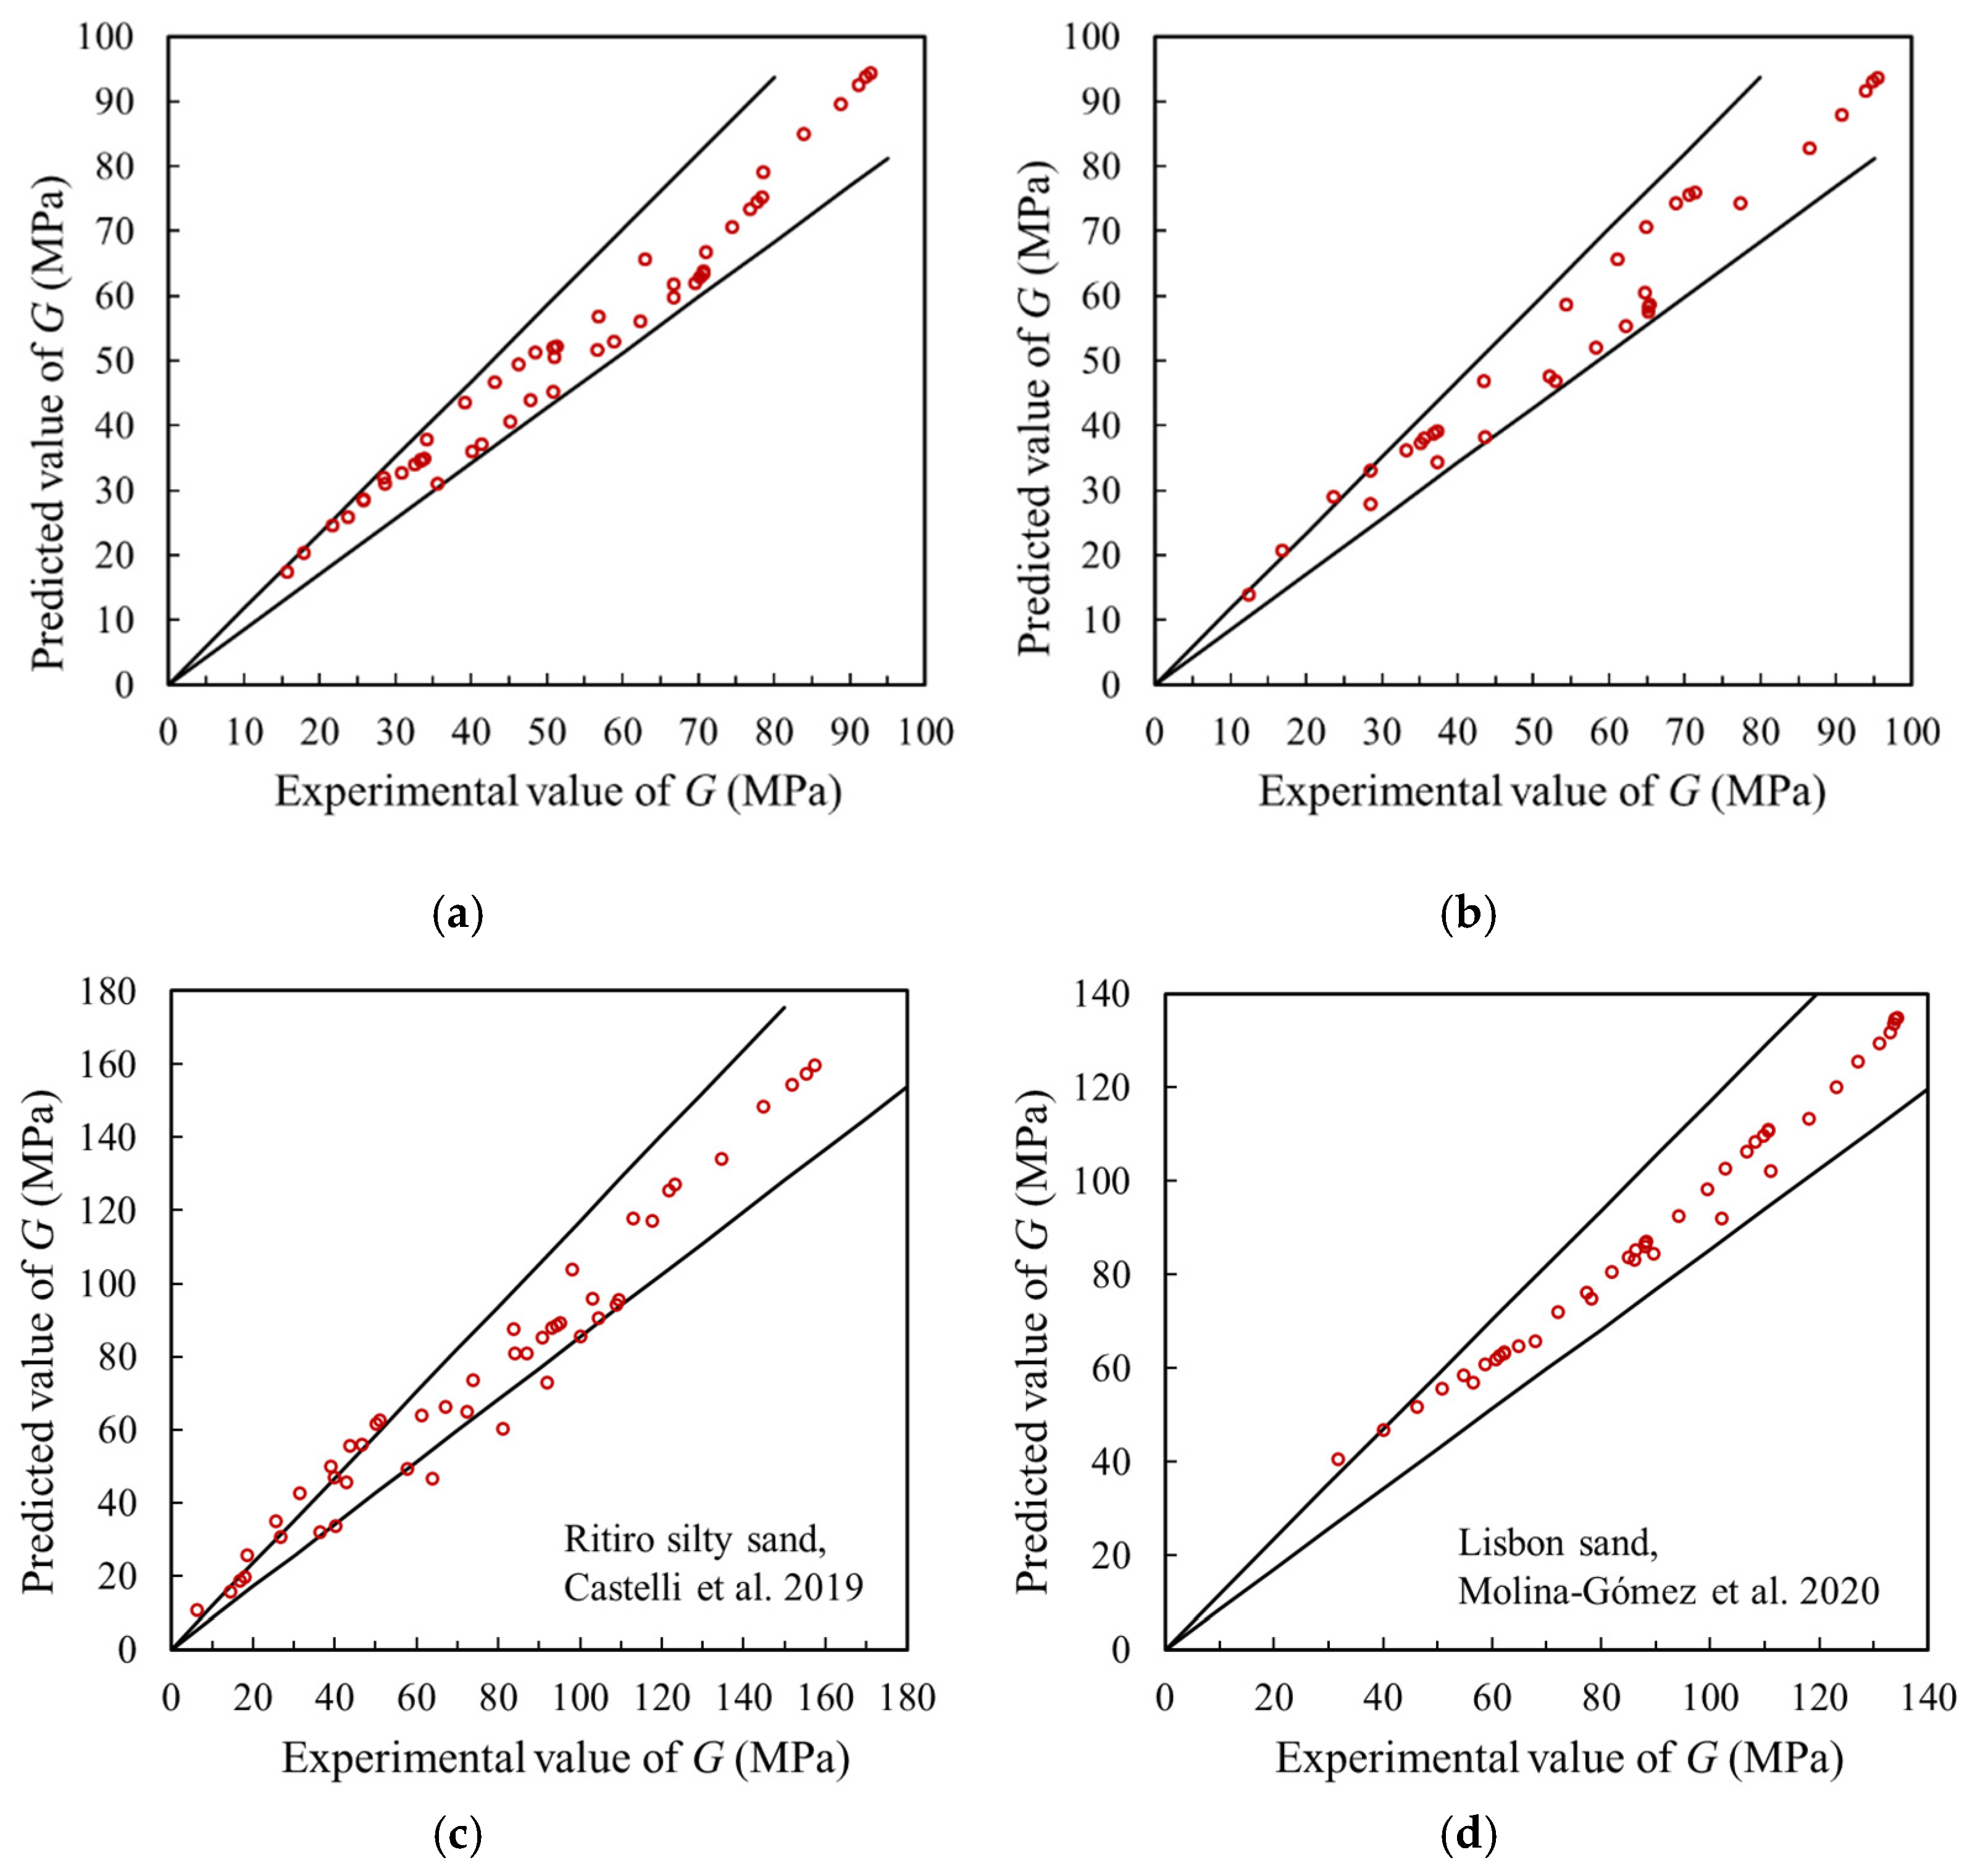
3.2. Nonlinearity of Dynamic Shear Modulus

Figure 4 is the curve of normalized shear modulus (G/Gmax) of all kinds of soils. It can be seen from the diagram that the variation of shear modulus with strain is basically in a narrow band, indicating that the dynamic shear modulus of marine soil has a good identity to Gmax. With the increase of confining pressure, the G/Gmax-γ curve of the samples gradually moves to the upper right, and the curve decreases slowly with strain, that is, the increase of confining pressure leads to the lower nonlinear of soil shear modulus.
The nonlinear model suitable for predicting the shear modulus of the soil layer in the offshore area is still inconclusive. In order to better reflect the “strain-softening” rule, Davidenkov’s three-parameter model is used as Equation (2) to fit the normalized shear modulus [38]. The fitting curve has been drawn in Figure 4.
G G max = 1 [ ( γ / γ 0 ) 2 β 1 + ( γ / γ 0 ) 2 β ] α
where γ is the shear strain of the sample during the test, and γ0, α and β are the fitting parameters.
The fitting parameters of the model and the determinable coefficients between fitting values and measured values of this test are shown in Table 5. The fitting coefficient R2 of the Davidenkov model for the normalized shear modulus of two kinds of marine soils in the East Nao-ao area is over 0.97, which indicates that the three-parameter model is highly reliable. It also shows that the influence of soil depth (represented by confining pressure) on normalized shear modulus is small.
Combined with Equations (1) and (2), the prediction model of shear modulus G based on effective confining pressure and shear strain can be established, and its form is shown in Equation (3):
G = ( A + n × 0 . 1 σ m ) × [ 1 ( ( γ / γ 0 ) 2 β 1 + ( γ / γ 0 ) 2 β ) α ]
The predicted shear modulus calculated by Equation (3) is obtained using the fitting parameters in Table 4 and Table 5. The predicted values are compared with the measured values of the resonant column test, and the results are shown in Figure 5. As shown in the chart, the error between the predicted values and the experimental values obtained is within ±10%. The thickness of the cover layers of the wind farm involved in this test is within 30 m, and the pore characteristics of the silty and medium sand layers investigated in the test do not change obviously with the depth, so it has a limited effect on the shear modulus. In addition, the reliability of the model is verified based on the shear modulus test data of liquefiable sand by Castelli et al. [39] and Molina-Gómez [40]. The parameters used in fitting are shown in Table 6. It can be seen from Figure 5c,d that the error of shear modulus G predicted by Equation (3) is a little greater when the modulus reduction is more significant, but the error between the predicted value and experimental value is generally in the range of ±10%. Therefore, this model provides convenience for seismic analysis to obtain shear modulus parameters under certain error conditions.

4. Results and Discussions of Cyclic Triaxial Test

4.1. Liquefaction Resistance of Marine Sand under Cyclic Loading

In the cyclic triaxial test, the silt layer with a depth of 5 m in Nan-ao area farm is taken as the primary research object, and compared from three aspects: relative density (45% or 70%), different soil types (silty or medium sand) and additional pressure (+50 kPa or +130 kPa). Three groups of dynamic shear stress ratios (CSR = σd/2σm′) were tested under each working condition, and the cyclic strength curve CSR-Nf was drawn by recording the cyclic vibration times entering the initial liquefaction (Nf).

4.1.1. Effect of Relative Density on Cyclic Strength

Figure 6 shows the cyclic strength curves of silty sand with 45% and 70% relative densities under confining pressures of 100 kPa and 180 kPa, respectively. Under the same consolidation confining pressure, the cyclic strength curve of silty sand with higher compactness (Dr = 70%) moves up to the right obviously, which indicates that the soil with higher compactness can bear more cyclic vibration times and the liquefaction resistance increases significantly when the same amplitude dynamic shear stress is applied. However, it is worth mentioning that soil samples with high density often require a longer saturation process when conducting tests. The sample with high density has fewer pore channels and the pore water distribution may be uneven, and the data measured by the pore pressure sensor during the B value test is the response of the base part, so the soil sample may not be completely saturated in the test. The decrease of saturation will significantly inhibit the development of excess pore pressure and make the soil show higher anti-liquefaction resistance [41]. Therefore, the results of unit tests may overestimate the cyclic strength of soil samples with higher density.

4.1.2. Effect of Particle Size on Cyclic Strength

The cyclic strength curves of silt and medium sand in the East Nan-ao area after consolidation under an effective confining pressure of 50 kPa are shown in Figure 7. Seed et al. [42] suggested that the CSR corresponding to 15 cycles of liquefaction should be taken as the anti-liquefaction resistance (CRR15) of sand under the earthquake of M7.5. It can be found from Figure 7 that the liquefaction resistance indexes, CRR15, of the two kinds of sand are similar under the same confining pressure and compactness. However, the cyclic strength curve of silt is higher than that of medium sand when CSR is small, but with the increase of CSR, the curve of medium sand tends to exceed that of silt.
The above trend can be explained by the deviatoric stress shear strain curves of two kinds of sands after cyclic loading recorded in Figure 8. At the beginning of the test, under the same confining pressure, the initial modulus of medium sand is larger and the damping is smaller (slope of the hysteresis loop is larger and the area is smaller). When the cyclic stress is relatively small, the area of silt hysteresis loops increases gradually, while that of medium sand increases faster, which indicates that the energy consumption process of the two is different. The gradation of silt in this site is good, but there is a lack of particle size in the middle sand layer in the range of 0.25–0.8 mm, so there are more contact points between particles when the load is small, which makes the grain fabric relatively stable and more difficult to liquefy than the medium sand. With the increase of deviatoric stress, the area of hysteresis loops of silty sand increases faster and the weakening rate of the soil is higher than that of medium sand. On the other hand, since the content of coarse particles in the medium sand sample is larger, and the void ratio e is smaller under the same compactness condition, the effect of coarse particles recombination and extrusion is more evident under larger load, so the anti-liquefaction ability is also improved.

4.1.3. Effect of Additional Pressure on Cyclic Strength

After the construction of the wind turbines, it causes significant additional pressure on the soil within a certain depth. In order to obtain the influence of different fan foundations on the liquefaction resistance of shallow sand layer, the soil samples with Dr = 45% and σm′ = 50 kPa (corresponding to the silt layer with a buried depth of 5 m in the site) are set as the control test group. According to the self-weight of the bucket foundation and gravity foundation of the offshore wind farm, two groups with different additional stress are set. The results show that the CSR-Nf curve moves downward after the fine sand layer is subjected to additional stress, indicating that the liquefaction resistance index decreases. However, Zhang et al. [33] and Ye et al. [27] use numerical simulation software to analyze the seismic response of offshore wind turbine foundation and reservoir respectively, and point out that due to the influence of the weight of the structure, the shear stress of the soil in a specific range below the foundation increases slightly relative to the free site at the initial stage of the earthquake. However, there is little difference between the time history of the shear stress and the soil outside the foundation during the whole earthquake process. Besides, in the past centrifugal tests on an offshore wind turbine with bucket foundation [43] or hybrid monopile foundation [44], it is found that the seismic acceleration response transmitted to the shallow soil layer below the foundation is similar to that of the free site. Therefore, in this section, the cyclic strength curve of different confining pressure is drawn based on the shear stress τd of samples during the test. The stress state of the unidirectional cyclic triaxial is shown in Figure 9, and the cyclic strength curve is arranged in Figure 10.
Figueroa et al. [45] proposed the energy per unit volume concept to define the liquefaction possibility, which can avoid the equivalent treatment of complex in-situ seismic load. In each cycle, the energy dissipation per unit volume (energy density) can be represented by the area of the corresponding hysteresis loop, and the solution is shown in Equation (4). Figure 11 shows the accumulated energy density for each cycle obtained from two sets of tests with the in-situ soil sample (σm′ = 50 kPa) and the sample with the additional pressure of 50 kPa (σm′ = 100 kPa). It can be seen that in the test of 50 kPa confining pressure, the number of cycles for the sample to reach liquefaction is less, and the energy dissipated by a single cycle increases with the number of cycles. For another, in the test of 100 kPa confining pressure, the energy per unit volume accumulation rate is faster in the first few cycles, then the growth rate decreases and tends to be stable, and suddenly increases near the liquefaction rate. The latter phenomenon indicates that the recombination speed of particles is fast at the initial stage of vibration and the structure tends to be stable in the middle of the cycle process because the particles are becoming denser. When it is near liquefaction, the damage and recombination of particles are apparent, which speeds up the energy dissipation rate and shows higher damping:
δ W = i = 1 n 1 1 2 ( τ i + τ i + 1 ) ( γ i γ i 1 )
where τi and γi are the shear stress and shear strain of the i-th recording point, respectively; n is the number of points recorded in one cycle.
The unit energy required to reach the first liquefaction point is obtained by adding up the energy consumed in each cycle, as shown in Table 7. It can be seen from the results in the table that the effect of confining pressure on unit energy is more significant than shear stress under the same initial compactness. Meanwhile, when the effective confining pressure of soil increases, the energy consumed to reach the liquefaction state increases, which indicates that the soil sample is not easy to liquefy. Under the same confining pressure, the increase of shear stress leads to the decrease of energy consumption in the process of soil liquefaction. This is due to the decrease in the number of cycles reaching the first liquefaction point after the shear stress increases, resulting in decreased particle recombination. Thus, the energy dissipated is less by intergranular surface grinding and particle breakage.

4.2. Pore Water Pressure Development Characteristics of Marine Sand

According to Seed’s simplified method for liquefaction triggering, the excess pore water pressure ratio, Ru, is used as a criterion to judge the liquefaction of specimens in cyclic triaxial tests. When the triaxial test is carried out, the pore water pressure in the sample may be unevenly distributed due to the existence of a shear rupture zone. However, the pore water is regarded as evenly distributed since this is an elementary test. Although this assumption will make the pore water pressure in the sample different from that in the actual site, it provides a convenient way to distinguish the liquefaction condition in the test, and therefore it is widely adopted:
R u = Δ u / σ m
where Δu is the excess pore water pressure, σm′ is the effective confining pressure.
In order to observe the development of pore water pressure during the cyclic process, the cyclic vibration times were normalized to find the relationship between Ru and the cyclic vibration ratio N/Nf. Seed et al. [46] proposed a pore pressure growth model shown in Equation (6):
R u = 1 2 + 1 π arcsin ( 2 × ( N / N f ) 1 / θ 1 )
where N is the number of cycles, Nf is the cyclic number when the soil reaches liquefaction, θ is the fitting parameter.
Figure 12 shows the relationship between the excess pore pressure ratio and cyclic vibration ratio of some sand samples tested in this test. It can be seen from Figure 12a,b that the Seed model cannot always simulate the test group of silty sand under 50 kPa confining pressure well. At this time, the CSR is large, and the sample will reach the liquefaction quickly. At the initial stage of the cyclic process and near liquefaction, the development of pore pressure is quite different from the measured results. Because of this, a pore pressure modified model based on the Seed model is proposed here, as shown in Equation (7).
R u = 1 2 + 1 π arcsin ( 2 × ( N / N f ) 1 / θ 1 ) + arctan ( a × ( N / N f ) )
where θ′ and a are the fitting parameters. The comparison between the predicted and measured values of excess pore pressure by the two models is shown in Figure 12
It can be seen from Figure 12 that in the middle of the cyclic loading process (N/Nf = 0.5), there is little difference between the two models and the measured results. However, the prediction ability of the modified model is better than that of the Seed model for pore pressure at the early stage of loading and near liquefaction. It can also be seen from Table 8 that the determinable coefficients of the modified model in each group of tests are higher than that of the seed model, and all are above 0.95, showing a high degree of credibility.
Also, the pore pressure development data from previous experimental studies were used to verify the model further. Wang et al. [47], Ghadr et al. [48], and Kumar et al. [49] have carried out undrained cyclic triaxial tests for Nanjing fine sand, Firoozkuh sand, and Brahmaptutra sand, respectively. The test results are fitted by using the pore pressure increment model proposed in this paper. The fitting parameters and effects are shown in Table 9 and Figure 13. It can be seen that the prediction results of the modified model are better than the original Seed model. It is worth mentioning that the pore pressure in a cyclic triaxial test cannot fully simulate the actual soil layer after the earthquake, but it still reflects the liquefaction process of soil samples to a certain extent. Therefore, the pore pressure model can show the liquefaction resistance of soil from the angle of the test.

5. Conclusions

In order to investigate the stiffness characteristics of marine soil and the liquefaction law of the sandy soil layer in the offshore wind farm, a series of the resonant column and cyclic triaxial tests were carried out on the silty sand and medium sand layers of the wind farm in the East Nan-ao area. The research results can be summarized as follows:
(1)
With the increase of soil depth, the effective confining pressure increases and the contact between soil particles becomes closer, resulting in the larger initial shear modulus and lower nonlinearity of soil samples. From the normalized curve of shear modulus, it can be seen that with the increase of confining pressure, the G/Gmax-γ curve tends to move up to the right, indicating that the nonlinearity of the soil sample is restrained.
(2)
A prediction model of the shear modulus of this site is proposed by combining the linear model and Davidenkov’s three-parameter model, and the error between the calculated value and experimental value is within ±10%. The model calculates the shear modulus of the soil layer through the effective confining pressure, which omits the complex calculation of the void ratio. In some seismic response analyses work, this model can help to obtain the dynamic parameters of soil more efficiently.
(3)
As the relative density of sand increases, the liquefaction resistance of sand increases significantly. Because of the good gradation of silty sand and less coarse particle content, silty samples are less liquefiable when CSR is small, while the strength is lower when CSR is large. Moreover, due to the additional stress of offshore structure, the anti-liquefaction resistance of the shallow liquefiable layer is improved, and the energy required to achieve liquefaction also increases with the increase of effective confining pressure.
(4)
Based on the Seed model, a modified model predicting pore pressure development is proposed, and the modified model can fit the excess pore pressure growth curve of soil samples in the test more accurately, especially at the initial stage of cyclic loading and near liquefaction.

Author Contributions

Conceptualization, F.L. and C.W.; methodology, Z.Z. and X.G.; validation, F.L. and C.W.; investigation, W.Y.; resources, Y.L.; data curation, Z.Z. and W.Y.; writing—original draft preparation, F.L. and Z.Z.; writing—review and editing, C.W. and X.G. All authors have read and agreed to the published version of the manuscript.

Funding

This research was funded by the Research Project of China Three Gorges Corporation (202003110), the National Natural Science Foundation of China (Grant No. 41772283, 51822809), and the National Key R&D Program of China (Grant No. 2016YFC0800200).

Institutional Review Board Statement

Not applicable.

Informed Consent Statement

Not applicable.

Acknowledgments

This work was supported by the Research Project of China Three Gorges Corporation (202003110), the National Natural Science Foundation of China (Grant No. 41772283, 51822809), and the National Key R&D Program of China (Grant No. 2016YFC0800200). Financial support from these organizations is gratefully acknowledged.

Conflicts of Interest

The authors declare no conflict of interest.

References

  1. Wang, X.F.; Zeng, X.W.; Li, J.L.; Yang, X.; Wang, H.J. A review on recent advancements of substructures for offshore wind turbines. Energy Convers. Manag. 2018, 158, 103–119. [Google Scholar] [CrossRef]
  2. Beijing Declaration on Wind Energy. Available online: https://finance.sina.com.cn/china/gncj/2020-10-14/doc-iiznezxr5868564.shtml (accessed on 17 April 2021).
  3. Li, X.Y.; Zeng, X.W.; Yu, X.; Wang, X.F. Seismic response of a novel hybrid foundation for offshore wind turbine by geotechnical centrifuge modeling. Renew. Energy 2021, 172, 1404–1416. [Google Scholar] [CrossRef]
  4. Gao, F.P.; Li, J.H.; Qi, W.G.; Hu, C. On the instability of offshore foundations: Theory and mechanism. Sci. China Phys. Mech. Astron. 2015, 58, 124701. [Google Scholar] [CrossRef] [Green Version]
  5. Liang, F.Y.; Liang, X.; Wang, C. Seismic response from centrifuge model tests of a scoured bridge with a pile-group foundation. J. Bridge Eng. 2020, 25, 04020054. [Google Scholar] [CrossRef]
  6. Clayton, C.R.I. Stiffness at small strain: Research and practice. Géotechnique 2011, 61, 5–37. [Google Scholar] [CrossRef] [Green Version]
  7. Chen, Y.M.; Ke, H.; Chen, R.P. Correlation of shear wave velocity with liquefaction resistance based on laboratory tests. Soil Dyn. Earthq. Eng. 2005, 25, 461–469. [Google Scholar]
  8. Oh, K.; Nam, W.; Ryu, M.S.; Kim, J.; Epureanu, B. A review of foundations of offshore wind energy convertors: Current status and future perspectives. Renew. Sustain. Energy Rev. 2018, 88, 16–36. [Google Scholar] [CrossRef]
  9. Patra, S.K.; Haldar, S. Long-term drained and post-liquefaction cyclic behaviour of offshore wind turbine in silty sand using element tests. Arab. J. Sci. Eng. 2021, 46, 4791–4810. [Google Scholar] [CrossRef]
  10. Wang, L.Z.; Zhou, W.J.; Guo, Z.; Rui, S.J. Frequency change and accumulated inclination of offshore wind turbine jacket structure with piles in sand under cyclic loadings. Ocean Eng. 2020, 217, 108045. [Google Scholar] [CrossRef]
  11. Kong, D.Q.; Wen, K.; Zhu, B.; Zhu, Z.J.; Chen, Y.M. Centrifuge modeling of cyclic lateral behaviors of a tetrapod piled jacket foundation for offshore wind turbines in sand. J. Geotech. Geoenviron. Eng. 2019, 145, 4019099. [Google Scholar] [CrossRef]
  12. Lopez-Querol, S.; Spyridis, M.; Moreta, P.J.M.; Arias-Trujillo, J. Simplified numerical models to simulate hollow monopile wind turbine foundations. J. Mar. Sci. Eng. 2020, 8, 837. [Google Scholar] [CrossRef]
  13. Hardin, B.O.; Drnevich, V.P. Shear modulus and damping in soils: Design equations and curves. J. Soil Mech. Found. Div. 1972, 98, 667–692. [Google Scholar] [CrossRef]
  14. Gu, X.Q.; Yang, J.; Huang, M.S.; Gao, G.Y. Bender element tests in dry and saturated sand: Signal interpretation and result comparison. Soil Found. 2015, 55, 951–962. [Google Scholar] [CrossRef] [Green Version]
  15. Yang, J.; Gu, X.Q. Dynamic shear modulus of dry sand: Effect of test method. In Proceedings of the 14th European Conference on Earthquake Engineering, Ohrid, Macedonia, 30 August–3 September 2010. [Google Scholar]
  16. Yang, J.; Gu, X.Q. Shear stiffness of granular material at small strain: Does it depend on grain size? Geotechnique 2013, 63, 165–179. [Google Scholar] [CrossRef] [Green Version]
  17. Gu, X.Q.; Zhang, J.C.; Huang, X. DEM analysis of monotonic and cyclic behaviors of sand based on critical state soil mechanics framework. Comput. Geotech. 2020, 128, 103787. [Google Scholar] [CrossRef]
  18. Sun, T.; Chen, G.X.; Zhou, E.Q.; Li, X.J. Experimental study on dynamic shear modulus ratio and damping ratio of marine soils in Qiongzhou Strait with depth less than 100 m. Chin. J. Geotech. Eng. 2013, 35, 375–382. [Google Scholar]
  19. Rao, D.K.; Raju, G.; Sowjanya, C.; Rao, J.P. Laboratory studies on the properties of stabilized marine clay from Kakinada Sea Coast, India. Int. J. Eng. Sci. Technol. 2011, 1, 421–428. [Google Scholar]
  20. Rui, S.J.; Guo, Z.; Si, T.L.; Li, Y.J. Effect of particle shape on the liquefaction resistance of calcareous sand. Soil Dyn. Earthq. Eng. 2020, 137, 106302. [Google Scholar] [CrossRef]
  21. Li, B.; Huang, M.S. Dynamic triaxial tests on liquefaction characteristics of rubber-sand mixture. Rock Soil Mech. 2017, 38, 1344–1349. [Google Scholar]
  22. Li, B.; Sun, F.X. Effects of sea water corrosion on long term dynamic behavior of cemented sand. Chin. J. Undergr. Space Eng. 2015, 11, 889–895. [Google Scholar]
  23. Li, B.; Wang, Y.; Jin, Q.B.; Chen, H. Liquefaction characteristics of recycled concrete aggregates. Soil Dyn. Earthq. Eng. 2019, 120, 85–96. [Google Scholar] [CrossRef]
  24. Lentini, V.; Castelli, F.; Cavallaro, A.; Grasso, S. A laboratory study for the dynamic characterization of sandy soil. In Proceedings of the 7th lnternational Conference on Earthquake Geotechnical Engineering (VII ICEGE), Rome, Italy, 17–20 June 2019. [Google Scholar]
  25. Lentini, V.; Castelli, F. Liquefaction Resistance of Sandy Soils from Undrained Cyclic Triaxial Tests. Geotech. Geol. Eng. J. 2019, 37, 201–216. [Google Scholar] [CrossRef]
  26. Grasso, S.; Castelli, F.; Massimino, M.R.; Lentini, V. In Situ Measurements for Evaluating Liquefaction Potential under Cyclic Loading. In Proceedings of the 1st IMEKO TC-4 International Workshop on Metrology for Geotechnics, Benevento, Italy, 17–18 March 2016. [Google Scholar]
  27. Bhatnagar, S.; Kumari, S.; Sawant, V.A. Numerical analysis of earth embankment resting on liquefiable soil and remedial measures. Int. J. Geomech. 2016, 16, 4015021–4015029. [Google Scholar] [CrossRef]
  28. Ye, B.; Xie, X.; Wang, X.W.; Liu, C.; Zhao, Q.H. Numerical analysis of the anti-liquefaction performance of a water reservoir dam under self-weight consolidation. Bull. Eng. Geol. Environ. 2019, 78, 5583–5597. [Google Scholar] [CrossRef]
  29. Huang, Y.; Yang, Y.; Wang, L. Evolution of anti-liquefaction performance of foundation soils after dam construction. Bull. Eng. Geol. Environ. 2019, 78, 641–651. [Google Scholar] [CrossRef]
  30. Ding, H.Y.; Xiong, K.P.; Zhang, P.Y. Seismic response of offshore wind structure supported by bucket foundation. Trans. Tianjin Univ. 2016, 22, 294–301. [Google Scholar] [CrossRef]
  31. Esfeh, P.K.; Kaynia, A.M. Earthquake response of monopiles and caissons for offshore wind turbines founded in liquefiable soil. Soil Dyn. Earthq. Eng. 2020, 136, 106211–106213. [Google Scholar] [CrossRef]
  32. Esfeh, P.K.; Kaynia, A.M. Numerical modeling of liquefaction and its impact on anchor piles for floating offshore structures. Soil Dyn. Earthq. Eng. 2019, 127, 105831–105839. [Google Scholar] [CrossRef]
  33. Zhang, P.Y.; Xiong, K.P.; Ding, H.Y.; Le, C.H. Anti-liquefaction characteristics of composite bucket foundations for offshore wind turbines. J. Renew. Sustain. Energy 2014, 6, 53101–53102. [Google Scholar] [CrossRef]
  34. Goudarzya, M.; Rahman, M.M.; Königa, D. Influence of non-plastic fines content on maximum shear modulus of granular materials. Soils Found. 2016, 56, 973–983. [Google Scholar] [CrossRef]
  35. Yang, J.; Liu, X. Shear wave velocity and stiffness of sand: The role of non-plastic fines. Géotechnique 2016, 66, 500–514. [Google Scholar] [CrossRef] [Green Version]
  36. Ruan, B.; Miao, Y.; Chen, K. Study on the small strain shear modulus of saturated sand-fines mixtures by bender element test. Eur. J. Environ. Civ. Eng. 2021, 25, 28–38. [Google Scholar] [CrossRef]
  37. Yang, W.B.; Wu, Q.; Chen, G.X. Dynamic shear modulus prediction method of undisturbed soil in the estuary of the Yangtze River. Rock Soil Mech. 2019, 40, 3889–3896. [Google Scholar]
  38. Rong, J.S.; Li, H.G.; Li, X.J.; Lv, Y.J.; Peng, Y.J.; Xiu, L.W. Applicability of Davidenkov model for soft soils in sea areas. Chin. J. Geotech. Eng. 2013, 35, 596–600. [Google Scholar]
  39. Castelli, F.; Cavallaro, A.; Grasso, S.; Lentini, V. Undrained Cyclic Laboratory Behavior of Sandy Soils. Geosciences 2019, 9, 512. [Google Scholar] [CrossRef] [Green Version]
  40. Molina-Gómez, F.; Fonseca, A.; Ferreira, C.; Camacho-Tauta, J. Dynamic properties of two historically liquefiable sands in the Lisbon area. Soil Dyn. Earthq. Eng. 2020, 132, 106101. [Google Scholar] [CrossRef]
  41. Mousavi, S.; Ghayoomi, M. Liquefaction Mitigation of Sands with nonplastic fines via microbial-induced partial saturation. J. Geotech. Geoenviron. Eng. 2021, 147, 4020156. [Google Scholar] [CrossRef]
  42. Seed, H.B.; Tokimatsu, K.; Harder, L.F.; Chung, R.M. Influence of SPT procedures in soil liquefaction resistance evaluations. J. Geotech. Eng. 1985, 111, 1425–1445. [Google Scholar] [CrossRef]
  43. Yu, H.; Zeng, X.W.; Li, B.; Lian, J.J. Centrifuge modeling of offshore wind foundations under earthquake loading. Soil Dyn. Earthq. Eng. 2015, 402–415. [Google Scholar] [CrossRef]
  44. Wang, X.F.; Zeng, X.W.; Li, X.Y.; Li, J.L. Liquefaction characteristics of offshore wind turbine with hybrid monopile foundation via centrifuge modelling. Renew. Energy 2020, 145, 2358–2372. [Google Scholar]
  45. Figueroa, J.L.; Saada, A.S.; Liang, L.Q.; Dashisaria, N.M. Evaluation of soil liquefaction by energy principles. J. Geotech. Eng. 1994, 4, 1554–1569. [Google Scholar] [CrossRef]
  46. Seed, H.B.; Martin, P.P.; Lysmer, J. Pore-water pressure changes during soil liquefaction. J. Geotech. Eng. 1976, 102, 323–346. [Google Scholar]
  47. Wang, B.; Chen, G.X. Pore water pressure increment model for saturated Nanjing fine sand subjected to cyclic loading. Chin. J. Geotech. Eng. 2011, 33, 188–194. [Google Scholar]
  48. Ghadr, S.; Samadzadeh, A.; Bahadori, H.; Assadi-Langroudi, A. Liquefaction resistance of fibre-reinforced silty sands under cyclic loading. Geotext. Geomembr. 2020, 48, 812–827. [Google Scholar] [CrossRef]
  49. Kumar, S.S.; Dey, A.; Krishna, A.M. Liquefaction Potential Assessment of Brahmaputra Sand Based on Regular and Irregular Excitations Using Stress-Controlled Cyclic Triaxial Test. KSCE J. Civ. Eng. 2020, 24, 1070–1082. [Google Scholar] [CrossRef]
Figure 1. Gradation curve of the silty sand and medium sand.
Jmse 09 00638 g001
Figure 2. The apparatus used in this test: (a) GDS resonant column device; (b) GDS cycle triaxial device.
Jmse 09 00638 g002
Figure 3. Variation of Gmax with σm′ of silty and medium sand.
Jmse 09 00638 g003
Figure 4. Variation of G/Gmax with γ of silty and medium sand: (a) G/Gmax-γ curve for silty sand; (b) G/Gmax-γ curve for medium sand.
Jmse 09 00638 g004
Figure 5. Predicted results of G using Equation (3) for (a) silty sand; (b) medium sand; (c) experimental data of G from the resonant column tests of Castelli et al. (2019); (d) experimental data of G from the resonant column tests of Molina-Gómez et al. (2020).
Jmse 09 00638 g005
Figure 6. Cyclic strength curve of silty sand with different relative density: (a) σm′ = 100 kPa; (b) σm′ = 180 kPa.
Jmse 09 00638 g006
Figure 7. Cyclic strength curve of silty and medium sand.
Jmse 09 00638 g007
Figure 8. Deviatoric stress-strain curves of different soil types and different CSR: (a) Silty sand, CSR = 0.17; (b) Silty sand, CSR = 0.20; (c) Medium sand, CSR = 0.17; (d) Medium sand, CSR = 0.20.
Jmse 09 00638 g008
Figure 9. Stress state of unidirectional cyclic triaxial test.
Jmse 09 00638 g009
Figure 10. Cyclic strength curve of silty with different confining pressure.
Jmse 09 00638 g010
Figure 11. Comparison of energy dissipations for silty sand under different σm′ and τd: (a) Silty sand, σm′ = 50 kPa; (b) Silty sand, σm′ = 100 kPa.
Jmse 09 00638 g011
Figure 12. Comparison between predicted and test results about excess pore pressure of marine sand in the East Nao-ao area: (a) Silty sand, σm′ = 50 kPa, CSR = 0.20; (b) Silty sand, σm′ = 50 kPa, CSR = 0.22; (c) Silty sand, σm′ = 100 kPa, CSR = 0.15; (d) Silty sand, σm′ = 180 kPa, CSR = 0.11; (e) Medium sand, σm′ = 50 kPa, CSR = 0.17; (f) Medium sand, σm′ = 50 kPa, CSR = 0.20.
Jmse 09 00638 g012aJmse 09 00638 g012b
Figure 13. Excess pore water pressure data from Wang et al. [47], ghadr et al. [48] and Kumar et al. [49] and fitting curves of the two models: (a) Nanjing fine sand, σm′ = 100 kPa, CSR = 0.18; (b) Nanjing fine sand, σm′ = 100 kPa, CSR = 0.20; (c) Firoozkuh sand, σm′ = 200 kPa, CSR = 0.15; (d) Brahmaptutra sand, σm′ = 100 kPa, CSR = 0.18.
Jmse 09 00638 g013
Table 1. Basic physical properties and resonant column test conditions of typical marine soil in the East Nan-ao area.
TestSoil
Classification
Borehole NumberDepth
(m)
Confining Pressure σm′ (kPa)Water Content w (%)Density
ρ (g/cm3)
A1Silty sandZK64.3–4.54520.91.94
A2Silty sandZK38.8–9.09022.81.94
A3Silty sandZK810.9–11.112023.11.88
A4Silty sandZK815.5–15.715027.81.95
A5Silty sandZK823.9–24.120030.51.90
B1Medium sandZK104.3–4.54521.21.96
B2Medium sandZK39.9–10.010022.51.93
B3Medium sandZK716.7–16.915032.31.99
B4Medium sandZK824.5–24.720030.41.96
Table 2. Physical parameters of the silty sand and medium sand.
Sampled10 (mm)d50 (mm)d60 (mm)CuCcMinimum Dry Density ρdmin (g/cm3)Maximum Dry Density ρdmax (g/cm3)Relative Density Dr (%)
Silty sand0.030.200.2811.202.061.402.0245
Medium sand0.080.580.8010.671.041.452.1145
Table 3. Cyclic triaxial test scheme of remolded soil in the East Nan-ao area.
TestSampleRelative Density Dr (%)Confining Pressure σm′ (kPa)Cyclic shear Stress Ratio
σd /2σm
C1–C3Silty sand45500.1710.1990.220
C4–C6Silty sand451000.1480.1850.231
C7–C9Silty sand451800.1120.1310.178
C10–C12Silty sand701000.1530.1960.256
C13–C15Silty sand701800.1390.2020.240
C16–C18Medium sand45500.1300.1740.196
Table 4. Fitting parameters of the empirical relationship between Gmax and effective pressure for silty and medium sand in the East Nan-ao area.
SampleAnR2
Silty sand17.6823.8020.9965
Medium sand23.9633.5160.9554
Table 5. Fitting parameters of the empirical relationship between G/Gmax and shear strain γ for silty and medium sand in the East Nao-ao area.
Sampleγ0βαR2
Silty sand7.56 × 10−40.42970.980.9738
Medium sand2.03 × 10−40.38771.550.9798
Table 6. Fitting parameters o for predicting shear modulus of liquefiable sand in Ritiro and Lisbon area.
SampleAnγ0βα
Ritiro silty sand30.6903.2573.62 × 10−40.42761.21
Lisbon sand39.4004.7700.79 × 10−40.29493.30
Table 7. Summary of unit energy (J/m3) required for liquefaction.
Relative Density Dr
(%)
Confining Pressure σm′ (kPa)Shear Stress τd
(kPa)
Unit Energy W
(J/m3)
45509.9104.2
11.0102.8
4510014.8310.2
18.5262.1
4518020.2804.8
23.6762.9
Table 8. Fitting parameters and determinable coefficients of seed model and modified model.
SampleConfining Pressure σ3
(kPa)
CSRSeed ModelModified Model
θR2θaR2
Silty sand500.202.33860.79381.34730.26780.9926
Silty sand500.221.87580.97071.64720.06150.9911
Silty sand1000.151.49410.98971.5076−0.00450.9898
Silty sand1000.181.02330.99400.99500.01420.9948
Silty sand1800.110.81370.89261.0614−0.12590.9714
Silty sand1800.130.75700.93720.8780−0.06940.9549
Medium sand500.171.50220.91951.10510.15460.9897
Medium sand500.201.28470.94130.99310.12770.9892
Table 9. Fitting parameters and effect of models based on the past test data.
SampleConfining Pressure σ3
(kPa)
CSRSeed ModelModified Model
θR2θaR2
Nanjing fine sand1000.181.39880.96331.17990.08460.9887
Nanjing fine sand1000.202.21040.89791.55450.16010.9960
Firoozkuh sand2000.151.46890.93781.17110.11650.9833
Brahmaptutra sand1000.181.13730.96801.2965−0.06540.9904
Publisher’s Note: MDPI stays neutral with regard to jurisdictional claims in published maps and institutional affiliations.

