Article

RADAR: Resilient Application for Dependable Aided Reporting

1
Consortium for the Technology Transfer C2T, 20122 Milan, Italy
2
Department of Management Engineering, Information and Production Engineering, University of Bergamo, 24129 Bergamo, Italy
*
Author to whom correspondence should be addressed.
Information 2021, 12(11), 463; https://doi.org/10.3390/info12110463
Submission received: 17 September 2021 / Revised: 27 October 2021 / Accepted: 3 November 2021 / Published: 9 November 2021
(This article belongs to the Special Issue Semantic Web and Information Systems)

Abstract

:
Many organizations must produce many reports for various reasons. Although this activity could appear simple to carry out, this fact is not at all true: indeed, generating reports requires the collection of possibly large and heterogeneous data sets. Furthermore, different professional figures are involved in the process, possibly with different skills (database technicians, domain experts, employees): the lack of common knowledge and of a unifying framework significantly obstructs the effective and efficient definition and continuous generation of reports. This paper presents a novel framework named RADAR, which is the acronym for “Resilient Application for Dependable Aided Reporting”: the framework has been devised to be a ”bridge” between data and employees in charge of generating reports. Specifically, it builds a common knowledge base in which database administrators and domain experts describe their knowledge about the application domain and the gathered data; this knowledge can be browsed by employees to find out the relevant data to aggregate and insert into reports, while designing report layouts; the framework assists the overall process from data definition to report generation. The paper presents the application scenario and the vision by means of a running example, defines the data model and presents the architecture of the framework.

1. Introduction

Organizations such as large companies, institutions or government bodies (e.g., central banks, regional and municipal authorities, credit institutions, and so on) have built powerful information systems to support their business processes and institutional missions. Very large volumes of data are stored and managed by these information systems, both internally generated and periodically uploaded from external sources: in fact, in many cases, external data flows feed the information systems with a certain regularity (e.g., daily, weekly and monthly). Thus, if from one side the underlying technology has been improved to deal with ever-increasing amounts of data, from the other side database administrators and system integrators have practically defined and implemented solutions to efficiently collect and manage these data flows, optimizing the upload processes as much as possible.
A very critical activity that many organizations must perform is “continuous reporting”, i.e., periodically generating reports: in fact, periodical reports are required by many governmental and regulatory authorities, to monitor the economic and social operators whose activity is subject to strong rules, to verify that they actually respect them. However, data gathering and management for generating reports present issues that are independent of the specific application domain; these issues can significantly reduce the efficiency of the processes to generate reports. (i) Typically, reports must provide aggregate data, but they often come from many data sources; consequently, data to aggregate are not defined based on a standard dictionary and common semantics; usually, this issue is addressed by manually writing queries that make data homogeneous. (ii) The previous issue can be solved only by a very small number of experts, who have both technical skills and domain knowledge: these are very rare people, difficult to find and enroll. (iii) The users who are in charge of preparing reports typically do not have complete knowledge about the meaning of fields in data sources; in contrast, they need a uniform and homogeneous view of data they must aggregate into reports, possibly with clear semantic annotations. (iv) Users in charge of generating reports are not database experts: they need a high-level tool that provides access to data in a transparent way with respect to technicalities of data management. (v) Terms and concepts often are informally defined by communities and their meaning often varies from one community to another; furthermore, specialists use a lot of complex interconnected concepts, including those defined by international standards, developed to provide global services. (vi) A common comprehension of terms and their semantics is essential to define reports effectively and efficiently; this issue could be solved by building a common dictionary of terms.
Different business areas experience these problems. This work considers the application contexts of the “financial market”. This is usually characterized by high volumes of data generated every day. Banks and financial institutions continuously exchange data flows describing financial transactions. These data flows, from different sources, constantly feed information systems and their databases. Unlike traditional activities, these data are essential for reporting activities, since reports are necessary not only for internal use (e.g., auditing and decision making). In fact, the European Central Bank (known as BCE) constantly monitors the financial status of banks; for example, BCE asks for periodical reports that summarize the performance of loans managed by banks.
The large amount of data to aggregate to produce summaries, as well as the repeated and possibly frequent generation of reports, overseen by employees who usually do not have technical competences in data management, are practical obstacles for organizations. Even though they are provided with powerful information systems that can deal with large volumes of data for operational activities, reporting activities are often not supported by software tools in an integrated way. This situation causes waste of time, delays, errors and high costs.
On the market, there are many systems that enable the analysis of large amounts of data, such as Microsoft Power BI, QlikView and Tableau. These tools are devised for the activity called ”business intelligence” and aim to retrieve, analyze, transform and report on dashboards data to enable easy and accurate analysis of data usually contained in data warehouses [1]. However, users involved in business-intelligence activities are analysts, unusually with good knowledge of the application domain; furthermore, reports are generated as the output of the analysis, usually performed in a one-shot way. Finally, a good preliminary knowledge about data to analyze is necessary, to effectively use these tools. In other words, BI tools are not suitable for “continuous reporting”, which is a regular business activity to be performed by employees.
The novel framework named RADAR (acronym for “Resilient Application for Dependable Aided Reporting”) aims to provide a “bridge” between data and employees who must generate reports. The acronym synthetically summarizes its goal: the framework is aimed to aid reporting activities, so that data put into reports are dependable; furthermore, the application should be resilient, meaning that it collects all the knowledge about data and application domain for a possibly-long period of time. Many different features characterize the RADAR Framework. (i) A knowledge base is managed, to collect all terms that characterize the application domain in a common dictionary. (ii) The framework applies the concept of ”Operational Data Store” (ODS) [2,3], i.e., a database able to provide an integrated but still operational view of data; this way, all data sources are integrated into one unique database (called RADAR DB), but they are not transformed towards a multidimensional representation. (iii) Data are modeled by means of the RADAR Data Model, i.e., a hybrid solution between an ontology of terms and concepts and the actual operational and relational schema of data sources; the resulting RADAR Schema gives a high-level view of the collected data, which are semantically characterized by ontological concepts. This way, data collected within the RADAR DB actually gives a ”concrete view” to ontological concepts. (iv) The RADAR Data Model also explicitly maintains mapping between data gathered from source databases and their representation within the framework; this way, the work of database administrators is simplified and the knowledge about mapping is explicitly maintained. (v) The RADAR Data Model encompasses the RADAR Rule Language, whose goal is to provide domain experts with a practical yet high-level formalism to encode how to complete properties that do not correspond to attributes in the source data. (vi) Employees in charge of generating reports are provided with a clear and high-level view of data; they can browse the knowledge base in general and the RADAR Schema in particular, to easily retrieve and aggregate data to put into reports, for which they define the layouts.
Notice that the features of the RADAR Framework are quite effective in addressing the above-mentioned issues regarding the activity of reporting: (i) database experts do not have to write low-level queries, and the mapping between source databases and the RADAR DB is clearly described and documented; (ii) domain experts provide their knowledge about the application domain in a high-level way through the RADAR Data Model, obtaining the RADAR Schema, which lasts over time and documents the knowledge; (iii) employees can easily browse the RADAR Schema by moving from ontological classes to retrieve data on a semantic basis; (iv) reports are directly tied to data in the form provided by the RADAR Schema, so as technicalities to retrieve data and generate reports are automatically dealt with by the RADAR Framework.
In comparison with our previous work [4], which for the first time gave a (still partial) presentation of the RADAR Framework, the present paper provides many contributions. (i) The application scenario is clearly described, by exploiting a running example. (ii) The RADAR Data Model is extensively and formally defined in all its aspects. (iii) A complete RADAR Schema is provided for the running example. (iv) The architecture of the RADAR Framework and its components are extensively presented, showing screenshots of the user interfaces to clarify the usage perspective of the framework.
The paper is organized as follows: Section 2 introduces relevant related works and technical background. Section 3.1 presents the running example that is considered in this work, while Section 3.2 describes, respectively, the problem and the approach we devised, together with the vision we identified to solve the problem. Section 3.3 presents the general architecture of the RADAR Framework. Section 4 introduces the RADAR Data Model. Then, Section 5.1 describes each component of the Knowledge Base, while Section 5.2 presents the Report Designer in details. Finally, concluding remarks are reported in Section 6.

2. Related Works

This section presents the main contributions published in the literature in the field of ontology-based generation of reports. In particular, Section 2.1 summarizes the fundamental concepts related to knowledge representation through ontologies, focusing on the paradigms that are specifically related to this work; Section 2.2 presents the works related to ontology-based generation of reports, in particular focusing on financial reporting.

2.1. Reporting and Knowledge Representation

Many organizations, presently, face the problem of extracting data from heterogeneous data sources. Reporting activities are performed by organizations of different sizes and often refer to large and heterogeneous collections of data, to aggregate in various manners. Of course, such collections of data may contain redundant or inconsistent information. Moreover, the fact that reports are required by authorities with regular frequency and rigid templates makes the reporting activity further complex and critical.
One possible solution to deal with the problem is the use of business intelligence (BI) tools. Already at the birth of computer science, IBM researchers, as shown in [5], tried to find a solution to support the management of a company in making decisions. Business intelligence systems are much more complex than what one would like to achieve, i.e., a tool to help domain experts produce reports. The work proposed by R. Rao in [6] is helpful to understand: it presents a system for labeling data (metadata) and extracting knowledge from unstructured data. In fact, BI does not only include report generation, but also statistical inference and probabilistic simulation, KPI optimization and so on. As explained in [7], BI supports managers to make important strategic decisions within a company; experienced analysts are necessarily involved. In contrast, this work focuses on the problem of continued report generation, performed in a routine manner by regular employees, not by analysts from possibly-heterogeneous data sources.
Reporting systems can exploit ontologies to characterize data. Ontologies are semantic data models that define a vocabulary of concepts, which characterize an application domain, together with the properties that can be used to describe those concepts. In fact, from a general point of view, an ontology denotes the attempt to formulate an exhaustive, rigorous and hierarchically structured conceptual scheme within a given domain, which can be used as the foundation of a knowledge base [8,9,10].
Conceptualizing a domain corresponds to model phenomena of the real world that characterize the domain of interest. Thus, a domain can be conceptualized by explicitly defining concepts, properties and constraints that concur to describe the phenomena of interest [11]. For example, in the financial domain, the concept of “financing” and the concept of “amortization plan” are characterized by precise properties.
An ontology is described by the following main components:
  • Concept/Class. It represents a category of (either physical or virtual) real-world objects. For example, it can be a task, a function, an action, a physical object, a notion or an idea, and so on. Concepts can be abstract or concrete, elementary or derived by aggregating other concepts.
  • Relationship. It represents a correlation among the concepts/classes.
  • Axioms. They are true statements about the domain described by the ontology. They are used to specify the semantics of concepts. They generally specify how the conceptual vocabulary can be used.
Moreover, an ontology can be classified according to the following categories, as presented in [12]:
  • Top-level (foundational) ontology. These are interdisciplinary ontologies, which constitute the basic bricks of multiple domains, i.e., different ontologies could derive from the same top-level ontology.
  • Domain ontology. It models specific portions of knowledge by identifying entities of interest and their relationships, which characterize a given domain. In principle, a domain ontology should specialize a top-level ontology.
  • Application ontology. It specializes a domain ontology with detailed concepts for very specific application domains.
In the literature, several ontology-based solutions are used to implement reporting systems applied in different domains. The approach (initially presented by Berners Lee in [13]) is based on the definition of a knowledge base only defined by considering concepts, neither data nor their management issues are considered. The main critical issue arising from such an approach is that these concepts do not correspond to a real scenario. For this reason, in our approach real data and their relationships contribute to define the concepts in the knowledge base.
In [14], Bontcheva et al. presented an approach for the automatic generation of reports from domain ontologies in the Semantic Web. In their project named MIAKT (acronym for Medical Imaging and Advanced Knowledge Technologies), they devised a “Natural-Language Generator” (NLG) to automatically generate reports from knowledge encoded in a domain ontology.
The literature also presents approaches in which ontologies are used for organizing and managing data sources and repositories (like data warehouses), to extract relevant information for reporting systems. In these cases, a report can be seen as a set of different pieces of information that are processed (e.g., aggregated) to extract knowledge from them. In [15], Romero et al. proposed the AMDO (acronym for Automating Multidimensional Design from Ontologies) method; it is a proposal for discovering multidimensional knowledge contained in data sources; specifically, the work introduced a user-centered approach to support elicitation of end-user requirements and the multidimensional design tasks of data warehouses.
An interesting approach was also proposed by Nebot et al. in [16], where they defined a Semantic Data Warehouse as a repository of ontologies and semantically annotated data resources. They developed an ontology-driven framework to design multidimensional analysis models for data warehouses. In details, they defined an integrated ontology, called MIO (acronym for Multidimensional Integrated Ontology), which includes the classes, relationships and instances representing the analyses developed over dimensions and measures.
Another way to tackle the problem is using the new paradigm called “Ontology-based data access” (whose acronym is OBDA). Within an information system, this paradigm superimposes a conceptual layer on the data layer. This conceptual layer allows users to have a conceptual view of the information in the system [17,18]. In the literature, this paradigm is also known as “Virtual Knowledge Graph” (whose acronym is VKG): instead of structuring the integration layer as a collection of rigid relational tables, the rigid structure is replaced by flexible graphs that are kept virtual, which embed domain knowledge. [19]. Our approach is very close to this view of the problem: the RADAR Data Model integrates both the ontological concepts and the actual data.
Underlying all the approaches above reported is the goal of “Ontology and Linked Data”. The main goals of an ontology concern the abstraction of the domain of interest in an information system, and the definition of a mapping to relate data to sources and instances of concepts and roles in the ontology itself. The mapping is performed in a simple way using “Linked Data”, as shown in the work by Poggi et al. [20].
From a general point of view, Linked Data allow for publishing data on the web in a way that is readable and interpretable by a machine. Their meaning is defined by a string of words and markers to build a data network belonging to a domain, which can be connected to other data sets related to other domains on the Web. This enables for defining a global data network, whose contents can be exchanged and interpreted by machines (this is the basis for the semantic Web [13,21]). Consequently, formats for representing ontologies play a critical role. In such a scenario, the RADAR Framework, which implements the notion of “Operational Data Store” (ODS), can be in the middle between an ontology of terms and concepts and the actual operational (and relational) schema of the source data. Moreover, it makes use of a data model by means of which it is possible to define a schema that gives a high-level view of the source data based on the concepts described in the ontology for the specific application domain.
As far as formats for representing ontologies are concerned, it is worth mentioning a W3C recommendation that specifies the JSON-LD format [22]. JSON-LD is a standard format for encoding Linked Data using JSON as the basic syntactic formalism [23]. Specifically, JSON-LD is designed around the concept of “context”: it links object properties in a JSON document to concepts in an ontology. To convert the JSON-LD format to RDF (the “Resource Description Framework” [24], the format originally used for the Semantic Web), JSON-LD allows values to be coerced to a specified type or to be tagged with a language. A context can be embedded directly in a JSON-LD document or put into a separate document and referenced by different documents.

2.2. Literature Concerning the Running Example

The literature also provides papers that are related to our running example, i.e., generating reports related to the financial application domain. Hereafter, some interesting works are presented.
In the financial market, the problem of producing reports requested by controlling institutions (such as central banks) is not new; however, the advent of computer science has changed the application scenario: in the past, the application context was much less dynamic than now; in particular, the number of requested reports was very limited and did not change in time; data to provide were simpler to obtain and the layout of reports was stable in time. The advent of computer science and the increasing dynamicity of the contemporary world have changed the paradigm. As reported by [25], the Bank for International Settlements (BIS) issued the Basel Committee on Banking Supervision directive (known as BCBS), which aims at forcing organizations to automate reporting processes, so as to reduce the dependency on manual input. However, the costs of introducing automated reporting processes caused the rising of significant obstacles in order to comply with the above-mentioned directive. Moreover, the correct definition of a reporting model is strongly related to the right interpretation of the different terminology used by such organizations. In such a scenario, ref. [26] presented how the Semantic Web may be seen as an effective way to present the data, by considering them into a linked database. In that work, the Semantic Web is formalized as a description of concepts, and corresponding terms, to describe data and information stored within a given database.
The approach presented in [27] explains how financial companies can handle their data and an associated vocabulary using semantic technologies. Their work examines the approach followed by experts, employees and analysts involved in financial reporting, to identify social and institutional mechanisms being applied to construct a common standard vocabulary, using ontology-based models. Indeed, a common and standardized ontology-based vocabulary will have to underpin the design of next-generation semantically-enabled information systems for financial companies. For this reason, the authors described an approach that uses and extends the “Financial Industry Business Ontology” (whose acronym is FIBO) [26,28]. FIBO specifies semantic linking between the financial concepts, as well as their descriptions.
FIBO is certainly a consolidated ontology for the financial domain; for this reason, it has been merged into the more recent ontology named “Schema.org” [29]. As reported in [30], Schema.org is a well-defined and large heterogeneous vocabulary that covers many domains. It has been thought to be applied for semantically annotating Linked Data; however, this goal is far away to be achieved, mainly due to the size of its vocabulary, as well as to the lack of guidance for the users to decide which classes and properties must be considered (this lack leads to inconsistent semantic annotations). To address this issue, some approaches were proposed to analyze the vocabulary in real-world applications [31], as well as to extend it for defining more precise and inconsistent annotations.
Another very important context in the field of reporting is the environmental sector. Although this context can appear very far away from the financial sector, it is very useful to understand the problem of continuous reporting, since it is facing the same issues faced in the context of the financial market. Indeed in recent years, environmental and ecological issues have become of particular interest from several points of view, particularly regarding the ability to acquire and manage heterogeneous data from measuring instruments such as sensors, for analysis purposes.
According to [32], ecology is a multidisciplinary science that involves physical, chemical and biological factors. The need to access such different data sources becomes particularly important in the analyses carried out to address ecological issues, such as studies on pollutants. Indeed, analysts and governments increasingly need integrated analyses to make decisions, to manage the environment in a sustainable way.
In this case, as reported by the literature, ontologies are useful as they represent a formal tool in the definition of concepts and relations, improving the interpretation and integration of information coming from heterogeneous sources and stored in different databases. For example, the work proposed by Madin et al. in [33] presented the problem caused by the lack of formalized concept definitions in ecological and environmental topics, and provided an interesting review of the positive efforts that could be obtained by developing ontologies for this context.
Similarly, the works proposed in [34,35,36,37], propose ontologies for the environmental sector, facilitating the extraction of data from information systems.
The problem of ontology-based generation of reports is not only of interest to the financial and environmental fields, but can be considered in many other areas. For example, in [38] the authors adopt the same approach for data mining in the oil field. In [39] examples of application of the ontology-based data-integration paradigm are presented, in particular, different approaches for extracting information from an industrial plant by mapping data through an ontology are presented. In [40], an example in the medical field is presented.
Further examples of applications can be found in all fields. This work is focused on the financial sector because it can be considered to be the most-interesting sector for developing innovative reporting applications.

3. Running Example, Approach and Architecture

This section is devoted to illustrate the practical problem, from which the idea of developing the RADAR Framework came out, the approach we followed to address it and the architecture of the RADAR Framework. The practical case is simplified into a running example that will be exploited throughout the remainder of the paper.

3.1. Running Example

Consider the case of a bank that operates on the market of loans. For various reasons, some banks sell their loans to other banks, which acquire them and become the real owners of sold loans. Let us suppose that the bank called MyBank buys loans from other banks. The contract by means of which loans are bought is called “Cession” and describes the acquired loan. Although MyBank is the owner of these loans, the interaction with the end customer is still performed by the original bank, so MyBank receives large data flows concerning the acquired loans from other banks: specific technical solutions are implemented by technicians to receive these data flows and store them into (usually relational) databases. Data flows usually update the list of paid installments and the amortization plan of each loan.
Depending on the economical capability of customers, i.e., their capability of regularly paying installments, loans are specifically classified: (i) a “Performing Loan” is a loan that has neither arrears nor unpaid installments; (ii) a “Defaulted Loan” is a loan that is either close to default or with many unpaid installments. (iii) A “Delinquent Loan” denotes a loan that has significant troubles but there is still the possibility that becomes again performing. Each type of loan is further subdivided according to other features, such as (a) “Mortgage Loan” (i.e., a loan that is secured by a mortgage), (b) “Guaranteed Loan” (i.e., a loan that is not secured by mortgages but by other guarantees, such as pledges), and, finally, (c) “Unguaranteed Loan” (i.e., loans that are not supported by any kind of guarantee).
National and international regulatory bodies, as well as financial-rating agencies (one of the most famous is Moodie’s) ask the bank to send them reports concerning its degree of reliability with respect to non-performing loans, to be informed if the financial situation of the bank is getting bad. Employees responsible for auditing and control of the financial state of the bank must prepare these reports. Some typical reports to prepare and send are the following ones.
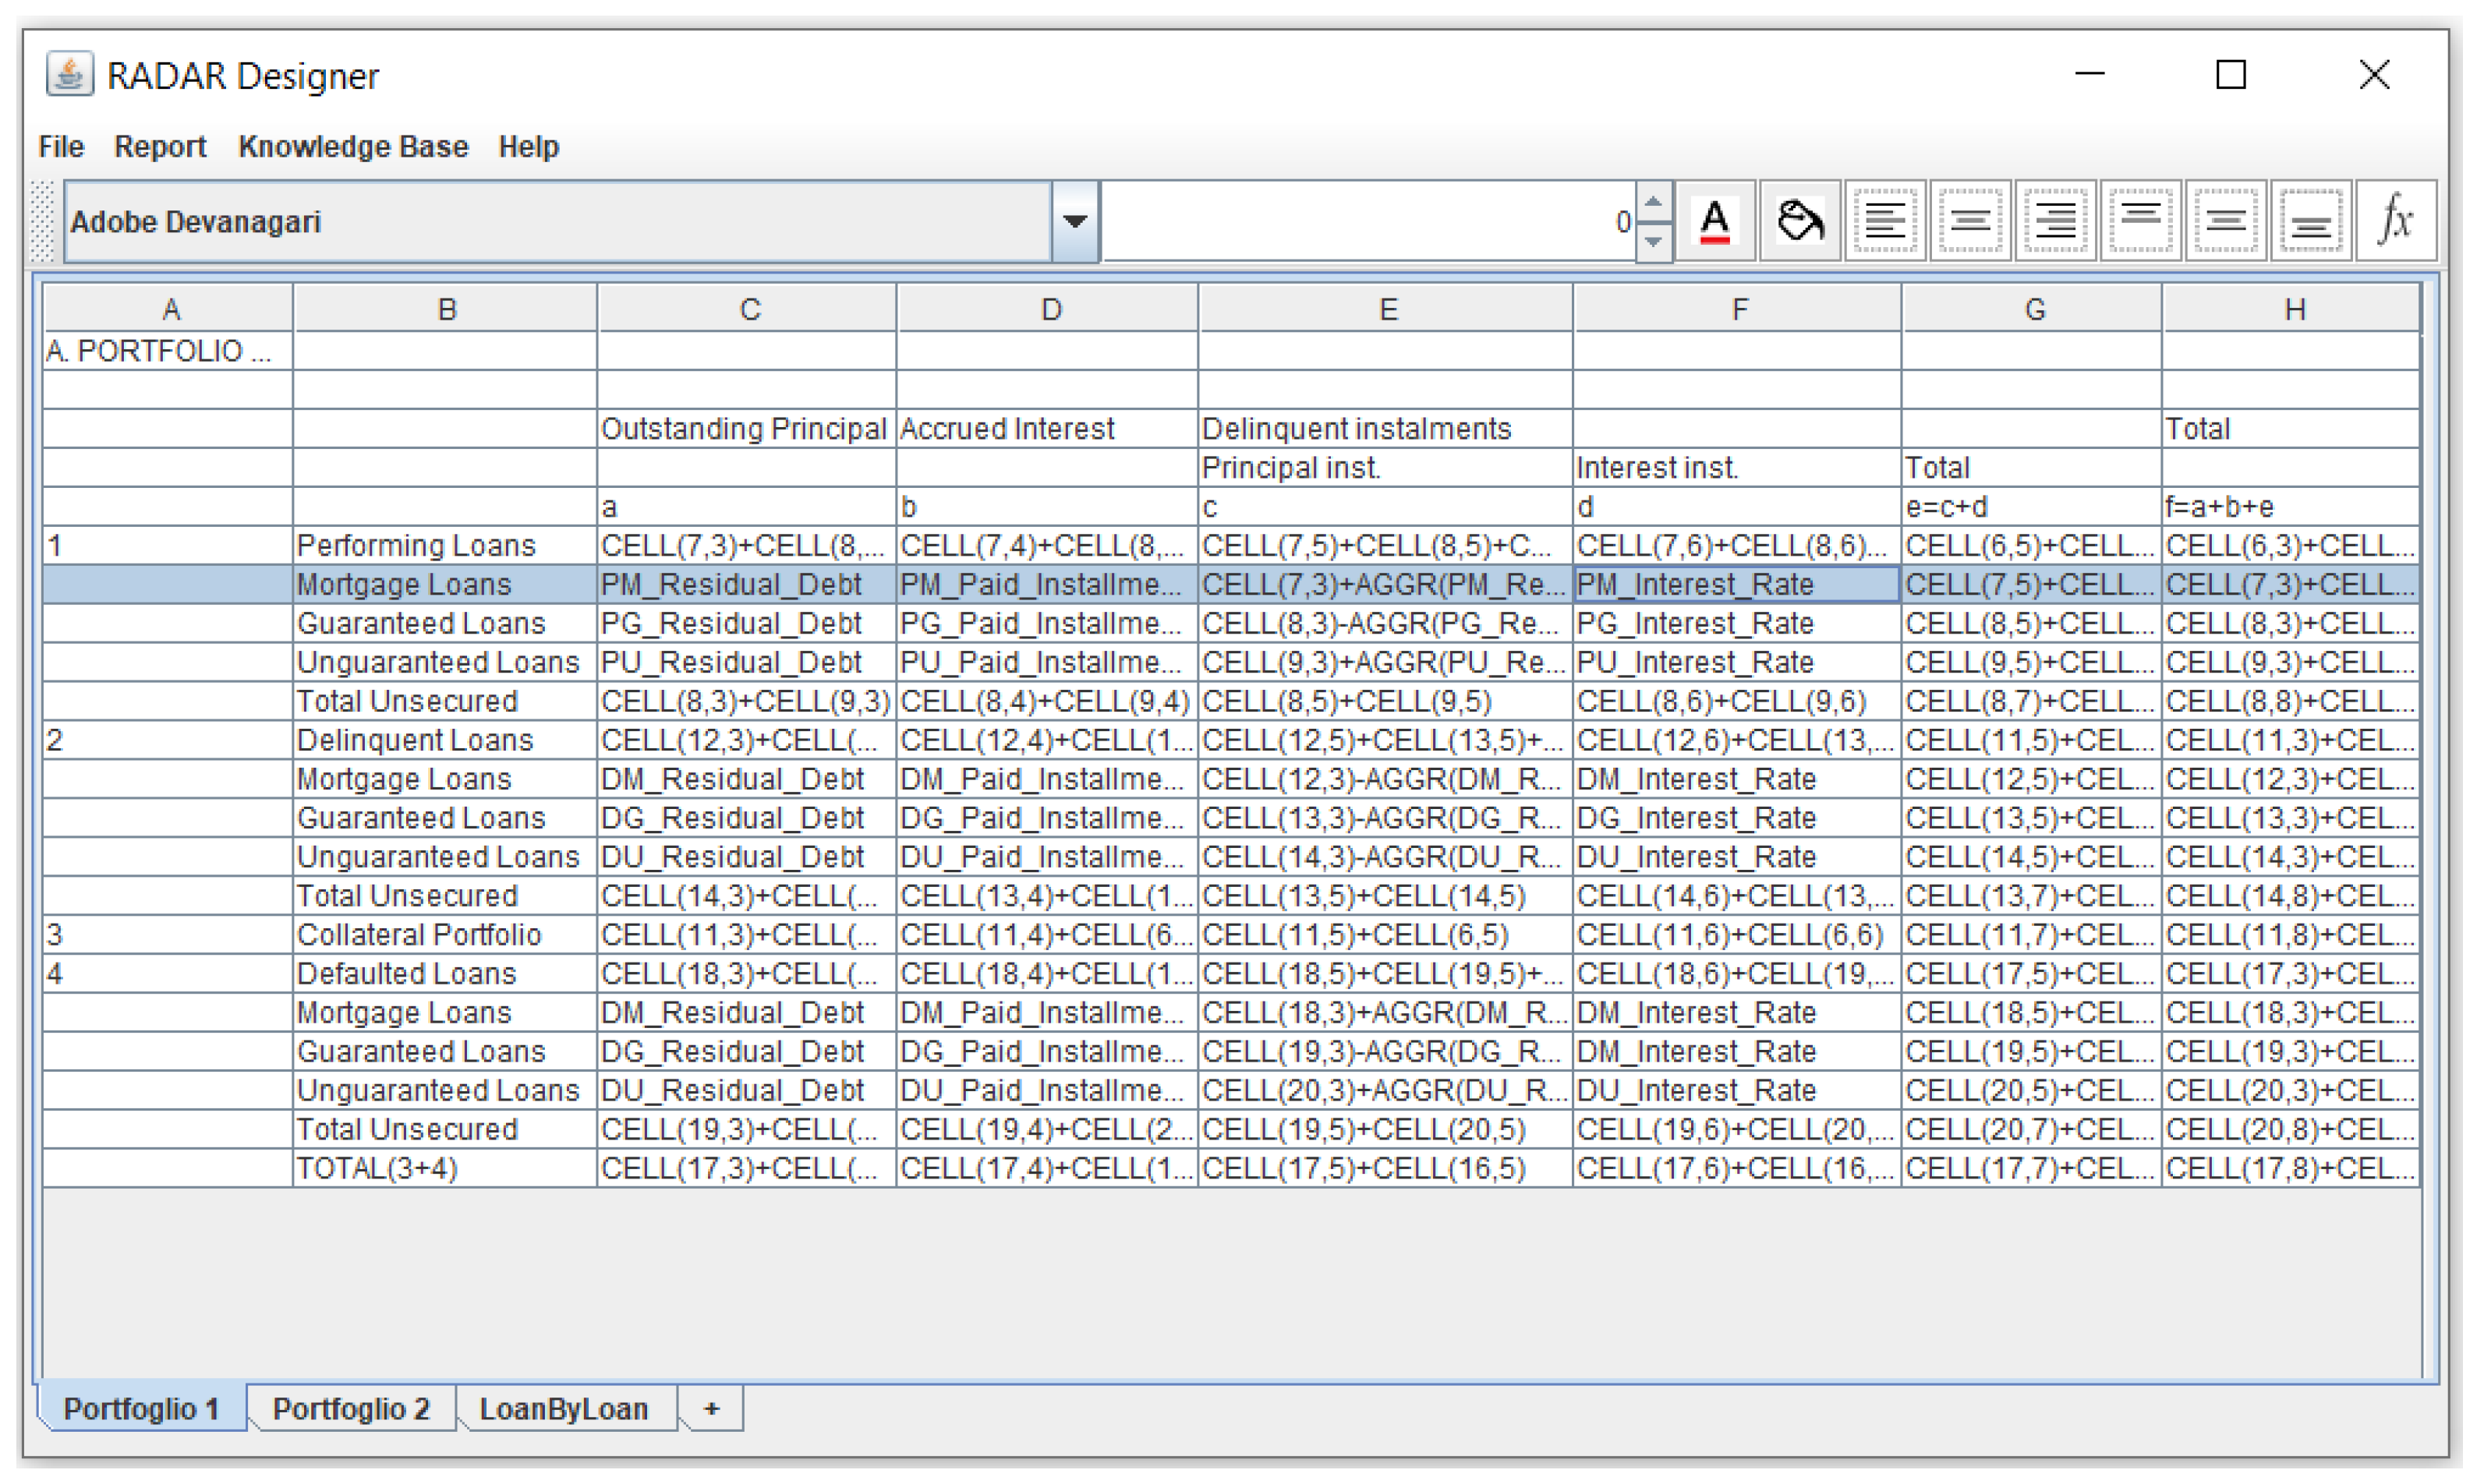
  • Portfolio 1. This report provides summary data based on a few categories: (i) “Outstanding Principal”, which summarizes the theoretical residual debt; (ii) “Accrued Interest”, which summarizes the accrued interest and delinquent installments; (iii) “Unpaid Outstanding Principal”, which summarizes the actual remaining debts. These aggregations are also disaggregated based on loan status (“Performing”, “Delinquent” and “Defaulted”) and related guarantees (“Mortgage”, “Guaranteed” and “Unguaranteed”).
  • Portfolio 2. This report provides aggregate data related to advance payments (closure of debts) during a given quarter, together with an immediately preceding quarter.
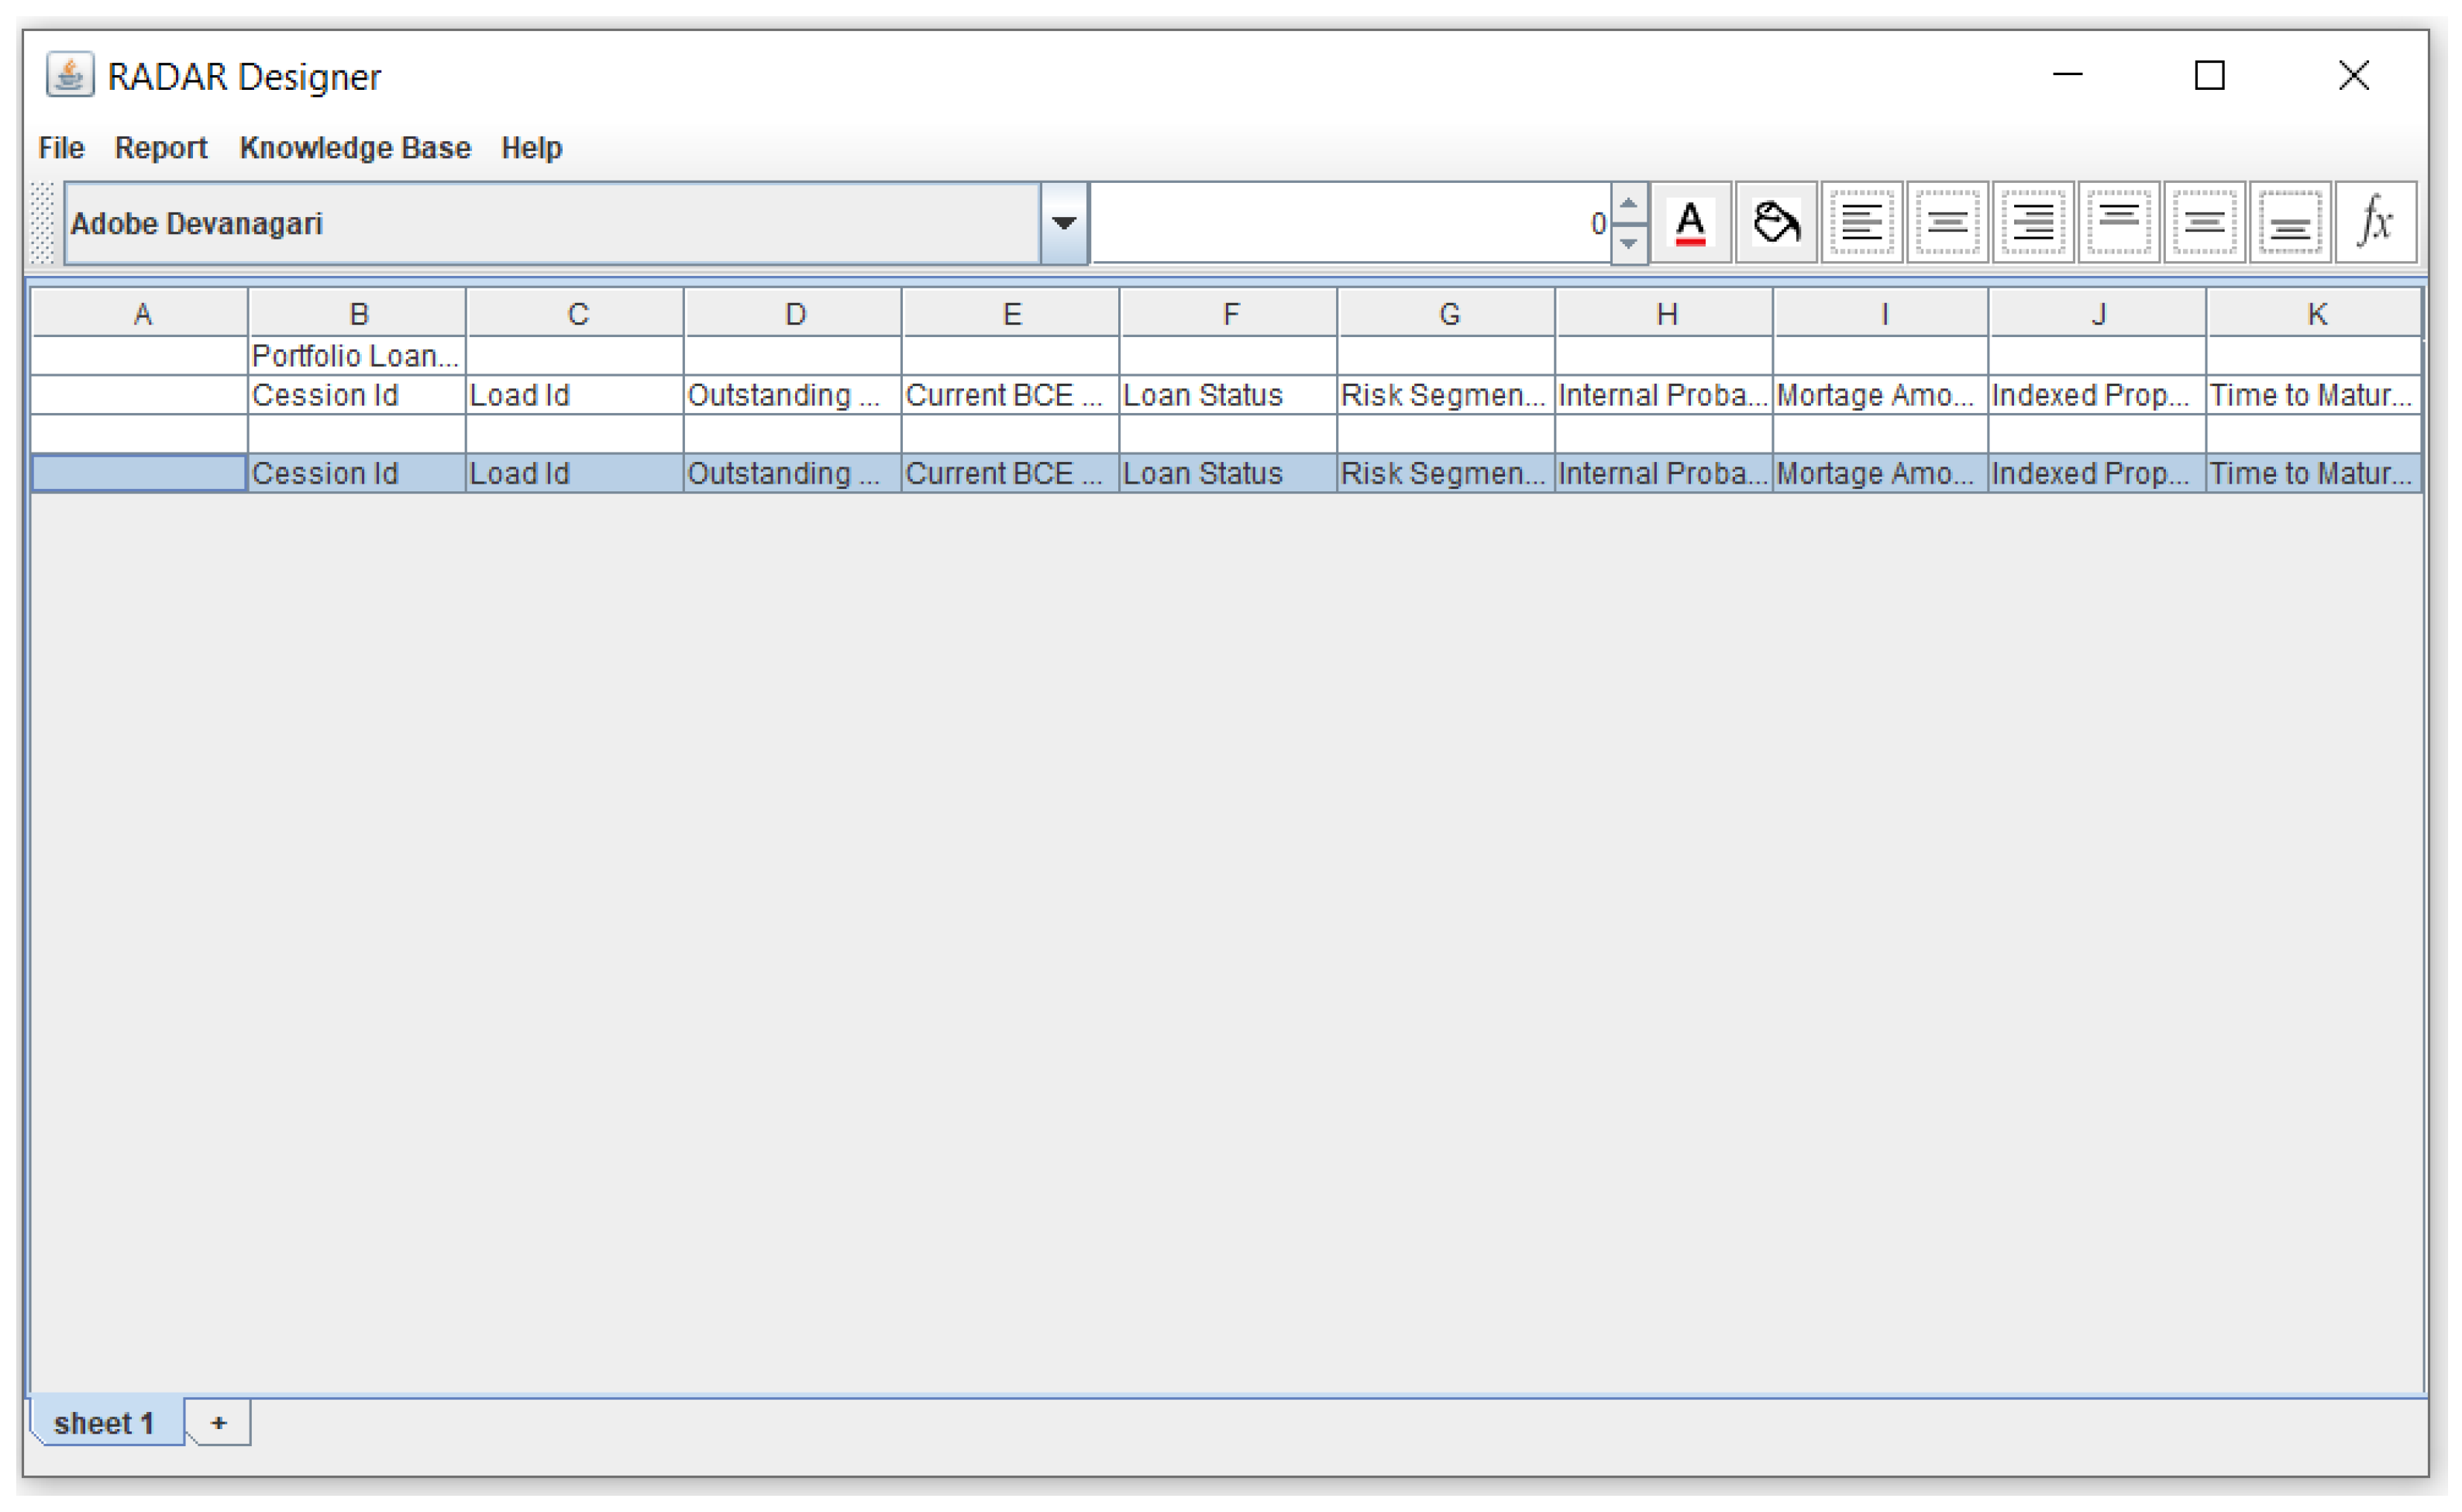
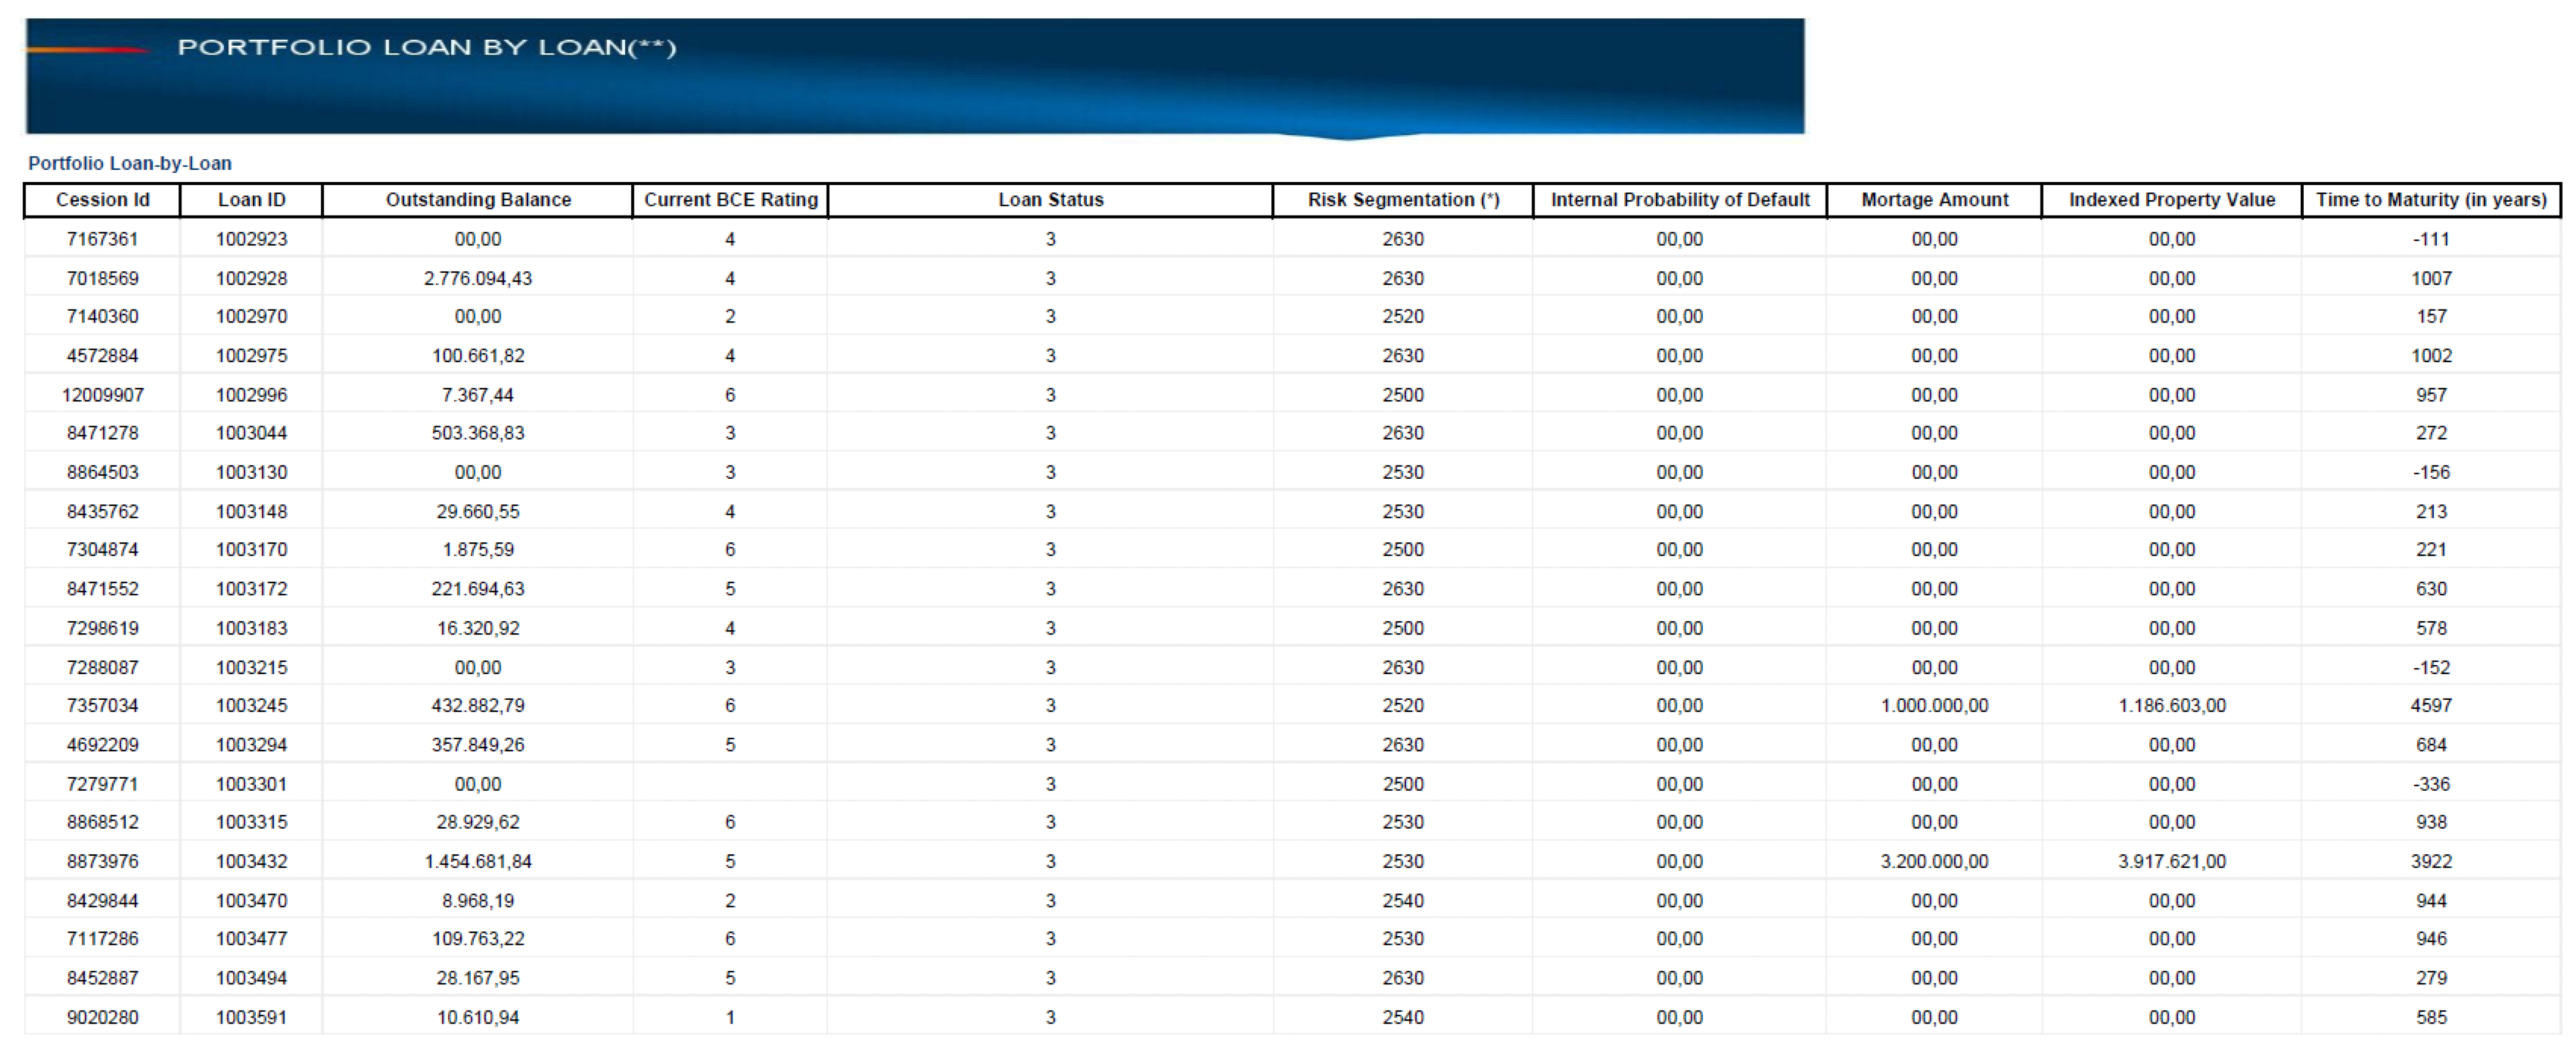
  • Loan by Loan. This report summarizes the status of each single loan. For each loan, apart from the usual identification data of the bank, the customer and the loan, the current status of the loan, the current rate, the amount of the loan secured by mortgage (and so on) are reported.
To produce the above-mentioned reports, employees must retrieve raw data previously received through the incoming data flows, aggregate them and put the aggregate values into specific report layouts. To effectively perform this task, they also need to know the semantics of data to aggregate, as well as the data structures of the database where data are stored. However, these competences are hardly owned by the same person. At least two different types of employees are involved: experts of the application domain (usually, economists) and computer technicians. This situation makes the process to generate a new report quite hard and long.
For this reason, the primary objective of the tool that we have developed was to allow employees without in-depth knowledge of the application domain to generate reports. An important feature of the reports is the possibility of generating different versions of the same report over time, as regulators such as the BCE require monthly, quarterly and annual reports.

3.2. Problem Description and Approach

The running example presented in Section 3.1 is a typical example of practical situations in which reporting is a crucial business task. Nevertheless, it also shows the complexity behind “continuous reporting”, which is a business activity to be regularly carried on by employees. Hereafter, the various types of complexity are discussed.
  • Technical Complexity. Gathering and processing the possibly-large amount of data to aggregate in reports asks for integrating many different technologies, such as APIs, streaming, relational databases, reporting tools, and so on. Specialized technicians are involved to deal with this kind of complexity.
  • Business Complexity. Many people perceive reporting as a simple task. However, this is not true, thinking about the complexity of the business activities for which reports must be produced. In fact, national and international regulations and regulatory bodies ask for specific reports with specific interpretations of concepts used to define what they want in reports. Domain experts must contribute with their domain knowledge.
  • Skill Complexity. Both technical and business complexity can be dealt with only by a wide variety of skills. However, these skills are hardly owned by the same person: the scenario asks for many people with different skills in various areas (e.g., technical skills, general and domain-specific business skills, and so on) in different times.
The above considerations can be used to identify the key issues behind reporting activities.
  • Transferring and Provisioning Domain Knowledge. Business complexity can be addressed only by transferring knowledge from domain experts to employees. However, these people rarely work together. Consequently, it is necessary to gather and formalize domain knowledge, possibly by associating it to data by exploiting ontologies.
  • Accessing Data. Employees in charge of generating reports must access the data to use to generate reports. However, data are usually stored within relational databases and, usually, employees are not familiar with this kind of tools (as the SQL language, in particular). A bridge between data-management systems and employees is necessary, possibly based on domain knowledge.
  • Easy Design of Reports. Once data are accessible and comprehensible (in relation to the application domain), high-level tools for generating reports by aggregating data are necessary, to assist employees in a non-tedious and efficient way.
To exemplify, we are thinking about a “bridge” between all the activities necessary to collect data, the domain knowledge and the employees that must design reports. In fact, often the lack of a standard vocabulary makes it hard to satisfy requirements for reports; this lack should be overcome by defining a set of concepts and terms that are typical of the application context, provided in advance by domain experts and later used by employees.
Let us consider another type of obstacle that characterizes reporting activities. Data coming from the source databases often present attributes whose names do not clearly denote their semantics. The meaning of these “non-descriptive names” is known by database administrators, but they are not comprehensible by employees: if they were provided with a high-level view of data, they could easily browse and understand data to aggregate. In other words, we are thinking about an environment where data, domain knowledge and skills are integrated, to make designing and generating reports from raw data effective and efficient, to provide a bridge between data and domain knowledge.
It becomes clear that a software framework able to assist report designers is necessary for organizations. The RADAR Framework has been designed to provide a solution to this problem; for the best of our knowledge, there is not another framework that is based on the same vision, by means of which at design time we identified the features that the framework had to provide.
  • Conceptual characterization. Semantics of data must be conceptually characterized by means of an ontology. In fact, an ontology can provide the conceptual framework to improve data comprehension.
  • Concrete and high-level view of data. A data model is introduced, able to relate real data to ontological concepts, as well as to provide a concrete vision of data. This model, which is called RADAR Data Model, is an object-oriented model in which classes and relationships are called Concrete Classes and Concrete Relationships (respectively). Report designers are provided with the RADAR Schema, which is an instance of the RADAR Data Model for the managed data. Data to put in reports are stored within an internal database called RADAR DB, whose schema is compliant with the RADAR Schema. This way, report designers will directly operate on the RADAR Schema and will be totally unaware of the structure of source data.
  • Mapping from RADAR Schema to Source Schema. The RADAR Schema must be mapped into the actual schema of source data, to automatically transfer data from the external sources to the RADAR DB; furthermore, this information will be precious for technicians who will have to maintain the gathering process.
  • Defining Update Rules. The RADAR Rule Language is a language defined to complete properties that do not correspond to attributes in the source data. These rules allow for defining how to derive properties that are missing in new data.
The general vision behind the RADAR Framework is to play a role similar to an “Operational Data Store” [2,3], able to provide a unified view of all the data necessary to produce reports, data that are managed by possibly different storage systems specifically designed to support traditional operational activities. Consequently, the RADAR Framework must rely on an internal database (the RADAR DB) and provide several tools for the various types of users.
The architecture of the RADAR Framework (presented in Section 3.3) is the result of the considerations made above.

3.3. Architecture

The architecture of the RADAR Framework is fully modular, to easily integrate it with existing information systems. In fact, it is highly probable that data to process are secured as much as possible within areas of the information system with limited access (this is necessary to protect highly-sensitive data from hacker attacks). Consequently, even though the RADAR DB is obviously separated from the databases of the information system, it cannot be outside the protected area. Therefore, the architecture is organized in two distinct layers, called Design Layer and Information-System Layer.
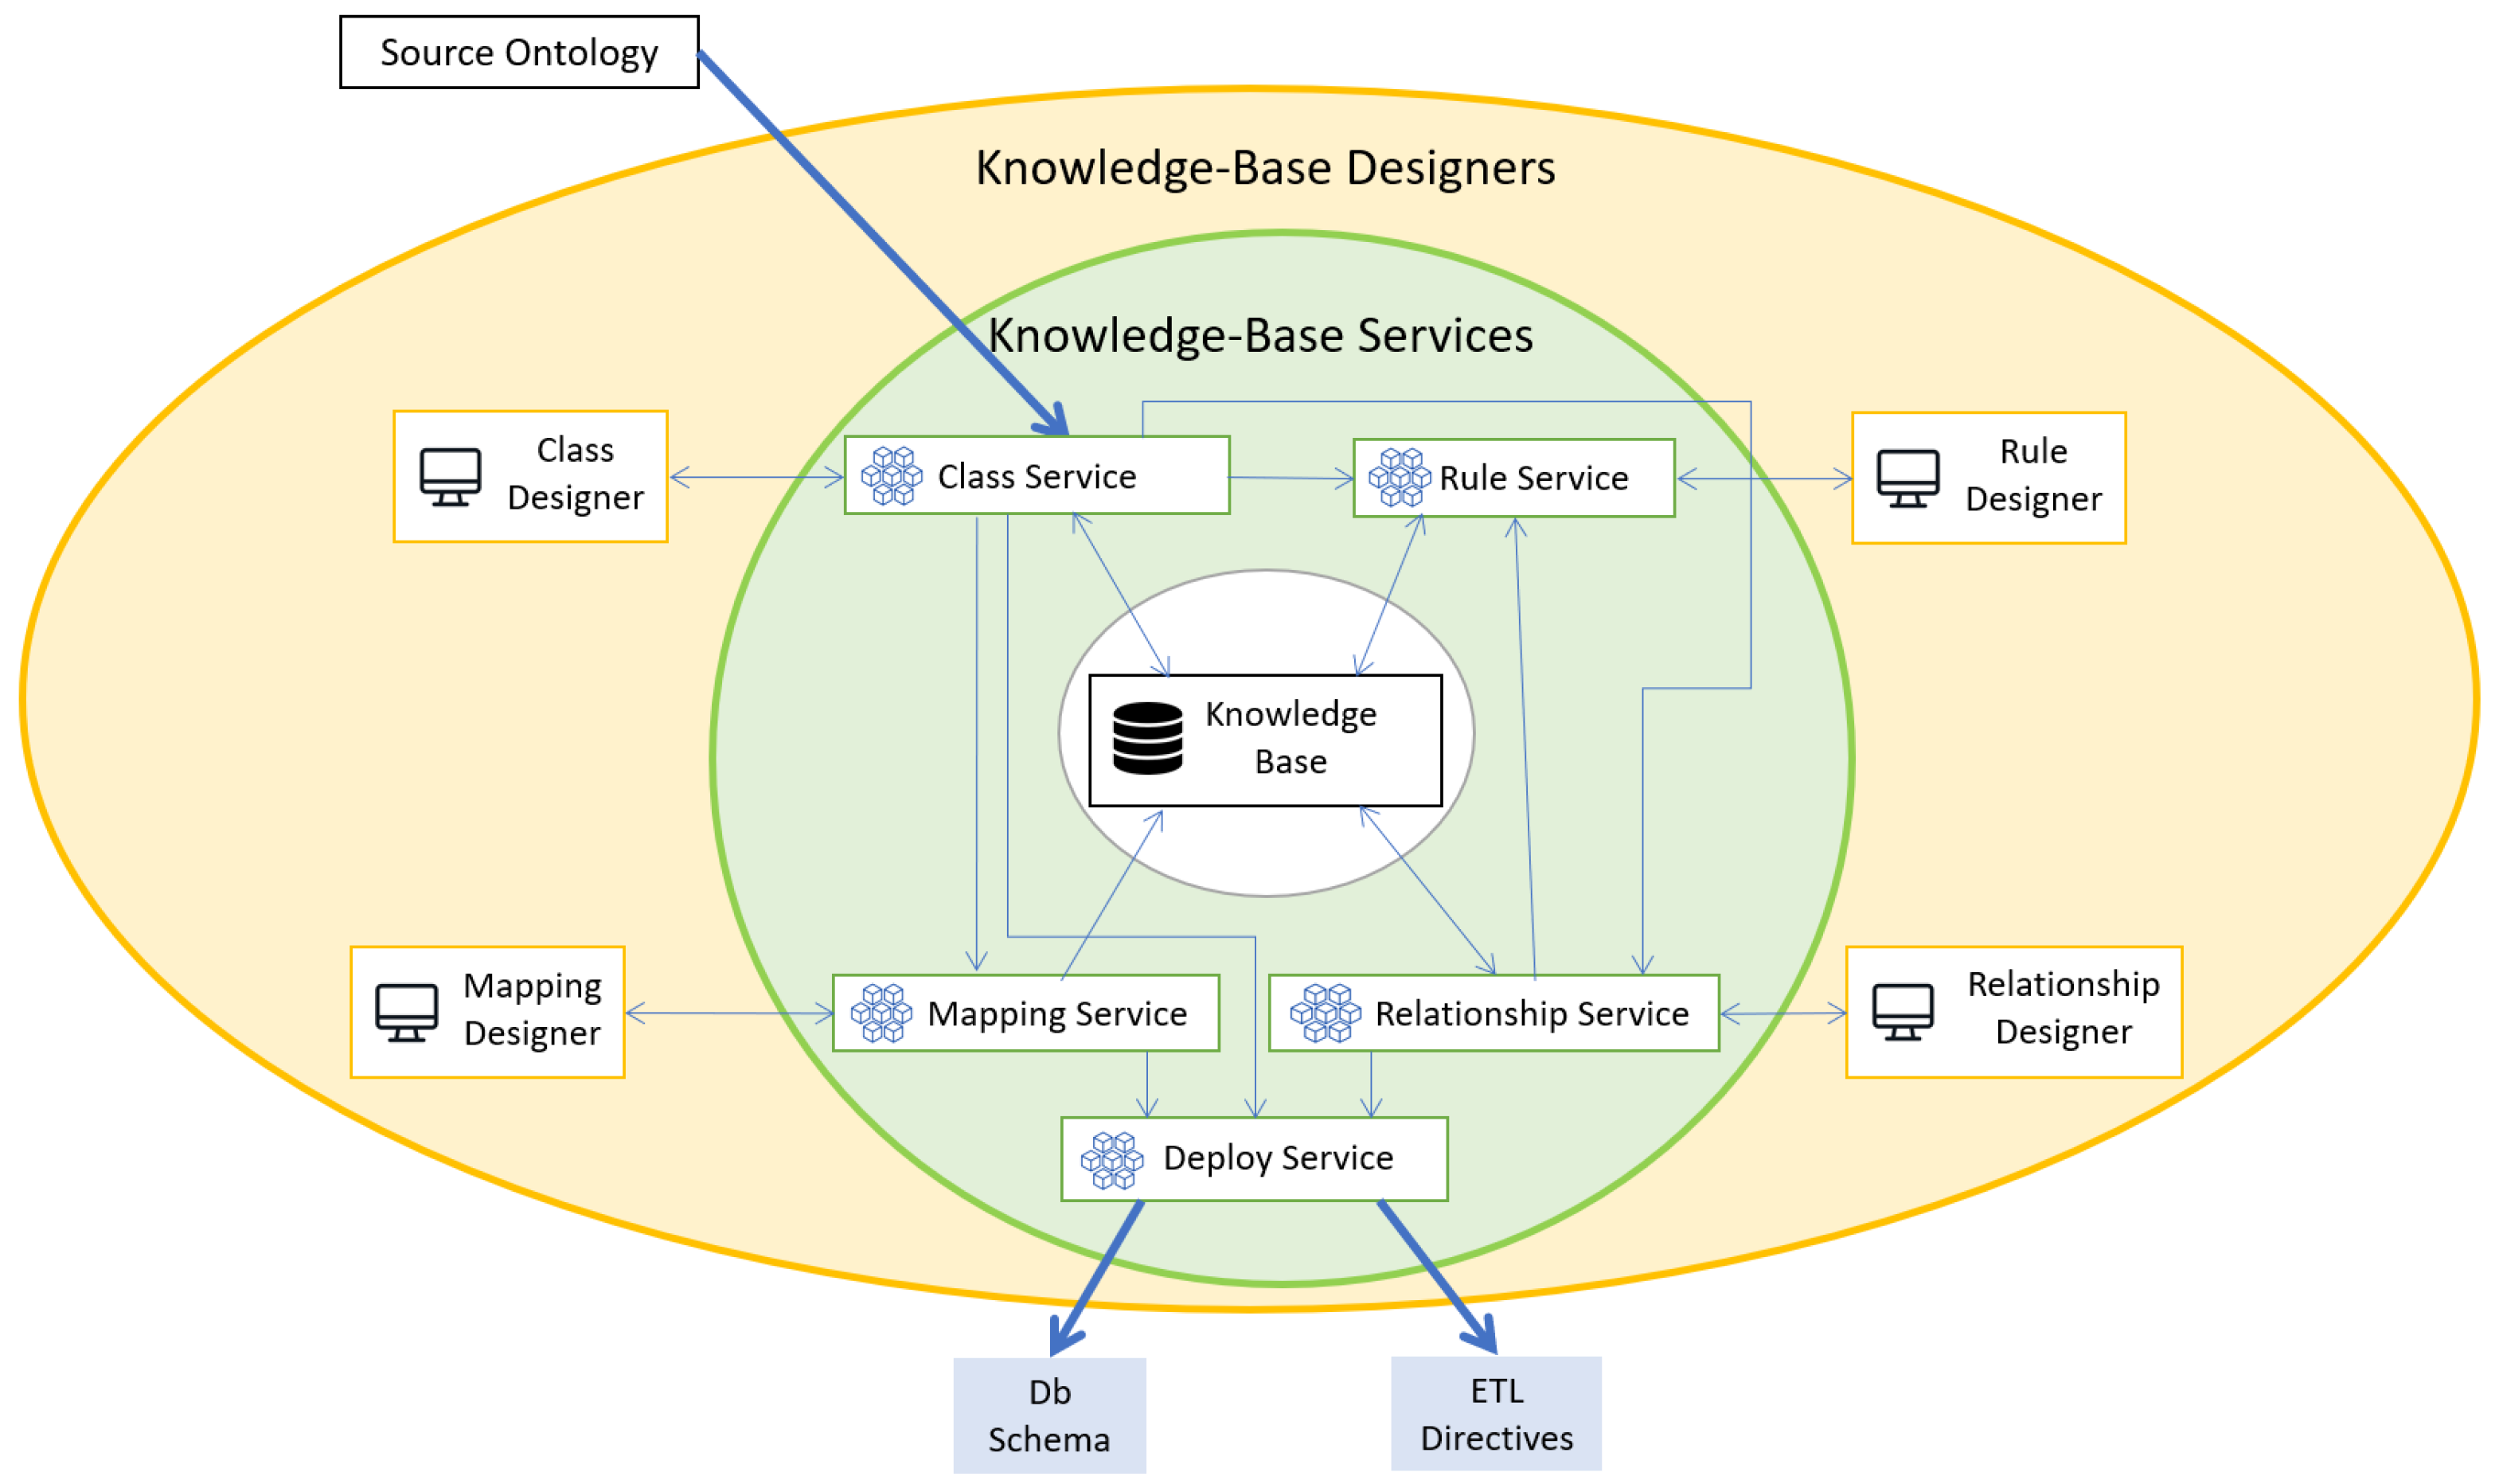
The overall architecture of the RADAR Framework is depicted in Figure 1. The Design Layer is above the dashed line, while the Information-System Layer is below the dashed line. In Section 3.3.1 and Section 3.3.2 an overview of their components is presented.
Before going on, it is worth explaining the graphical conventions adopted for Figure 1.
  • Rectangles with orange borders represent software tools that provide a kind of user interface;
  • Rectangles with green border represent software services;
  • Rectangles with black border represent storage and archives;
  • Blue arrows without labels represent synchronous communications between the connected software tools (the arrow represents the direction of the main data flow);
  • Rectangles with light-blue background represent documents or descriptions specifically generated and received by software tools;
  • Blue arrows labeled with documents or descriptions represent asynchronous communications between software tools, performed through the generation of documents and descriptions denoted by the label.
The architecture of the RADAR Framework relies on the concept of “micro-service” [41]. Even though there is not a formal definition of “micro-service architectures”, it is possible to describe their common characteristics. A “micro-service architecture” can be referred to as “an approach to develop a single application as a suite of small services, each running in its own process and communicating with the other components of the architecture, sharing input and output data” [42]. The choice for an architecture in which each micro-service is processed independently of the other micro-services allows the whole process to be decomposed into smaller and easier running processes through user interfaces. Micro-services are deployed independently and in a fully automated way; they are also capable of using different data storage technologies.

3.3.1. Design Layer

This layer (depicted in the upper part of Figure 1) provides tools for knowledge design and report design. The Design Layer encompasses a series of components that are detailed below.
  • The Knowledge Base persistently stores the overall RADAR Schema, which is the core description for the RADAR Framework. The name is motivated by the fact that the RADAR Framework manages an ontology, concrete classes, RADAR Rules and external tables (see Section 4), which are possibly semantically annotated; all of them constitute the knowledge necessary to actually collect data, interpret them, design and generate reports.
  • The Knowledge-Base Manager is a suite of micro-services that are responsible to create and manage the overall RADAR Schema, stored within the Knowledge Base. The module deploys various descriptions, which are used to set up the Information-System Layer. They are (i) the DB Schema, used to create the RADAR DB and (ii) ETL Directives, which pilot the ETL (Extract, Transform and Load ) process that transfers data from external sources into the RADAR DB. The Knowledge-Base Manager is presented in details in Section 5.1.
  • A Source Ontology (or Reference Ontology) is loaded by the Knowledge-Base Manager, and saved into the Knowledge Base, to constitute the basis for defining the RADAR Schema.
  • The Report Designer provides analysts with a user-friendly interface, able to browse the Knowledge Base so far built, define aggregations and design reports. The Report Designer generates Report Definitions and Aggregation Queries, which are stored within the Report Folder; through these documents, report layouts and aggregations necessary to obtain them are persistently saved.
The reader can notice that the Design Layer is not specifically tied to the actual information system; furthermore, the micro-service approach makes it independent of the executing platform.

3.3.2. Information-System Layer

This layer encompasses databases, applications, services and every computational resource that constitutes the information system of the company. As far as our framework is concerned, this layer presents the following components (see the lower part of Figure 1).
  • The Source DBs are storage systems, usually relational databases, which store and provide the External Tables in which data to integrate are stored. Notice that the way these tables are populated depends on the specific applications that provide source data: for example, in the case of the running example external tables store flows about cessions and payments received from external systems.
  • The RADAR DB is the database in which all data possibly involved in reporting are collected, when they are transferred from the Source DBs. The transfer is performed periodically by ETL (Extract-Transform-Load) tasks. The data in the RADAR DB will then be used to perform further aggregations, necessary as input for generating reports. The RADAR DB is actually managed by a relational DBMS; nevertheless, in order to be not tightly coupled with a specific DBMS, the Hibernate [43] bridge is adopted: this way, any relational DBMS can be used to manage the RADAR DB.
  • The ETL Service is the micro-service in charge of transferring data from the Source DBs to the RADAR DB, piloted by the ETL Directives provided by the Knowledge-Base Manager in the Design Layer.
  • The Rule-Execution Service is a micro-service that acquires the definitions of RADAR Rules (which are an integral part of the RADAR Data Model, see Section 4.3.2) from the Knowledge Base by synchronously calling the Knowledge-Base Manager, to execute them on the RADAR DB when new data are uploaded.
  • The Report-Generator Service is a micro-service whose goal is to actually generate reports in xlsx format, based on (i) the data stored in the RADAR DB, (ii) a Report Definition generated by the Report Designer and (iii) the Aggregation Queries necessary to compute the aggregate measures that must be inserted into the final report. Report Definitions and Aggregation Queries are retrieved by accessing directly the Report Folder, in which the Report Designer stores them: this way, changes in report layouts are seamlessly deployed to the Report-Generator Service.
The reader can notice the advantages of the separation of the architecture in two distinct layers: while the components of the Information-System Layer are deployed on the computational resources that actually support the Enterprise Information System (which is typically a protected environment subject to many restrictions), the Design Layer can be installed and used independently. This way, it is possible to obtain the highest possible level of decoupling of the two layers, with minimal impact on the actual information system.

4. RADAR Data Model

This section introduces the RADAR Data Model. Based on it, data managers and domain experts design the RADAR Schema, which will be provided to report designers to retrieve desired data and aggregate them to design reports.
The RADAR Data Model is structured in three different layers:
  • Ontological Layer. This layer defines the Reference Ontology that provides the conceptual framework for managed data.
  • Concrete Layer. This layer provides a high-level and uniform view of actual data, in a way suitable for report designers.
  • Mapping Layer. This layer maps classes defined in the Concrete Layer to source data, used to feed the RADAR DB, i.e., the internal database of the RADAR Framework.
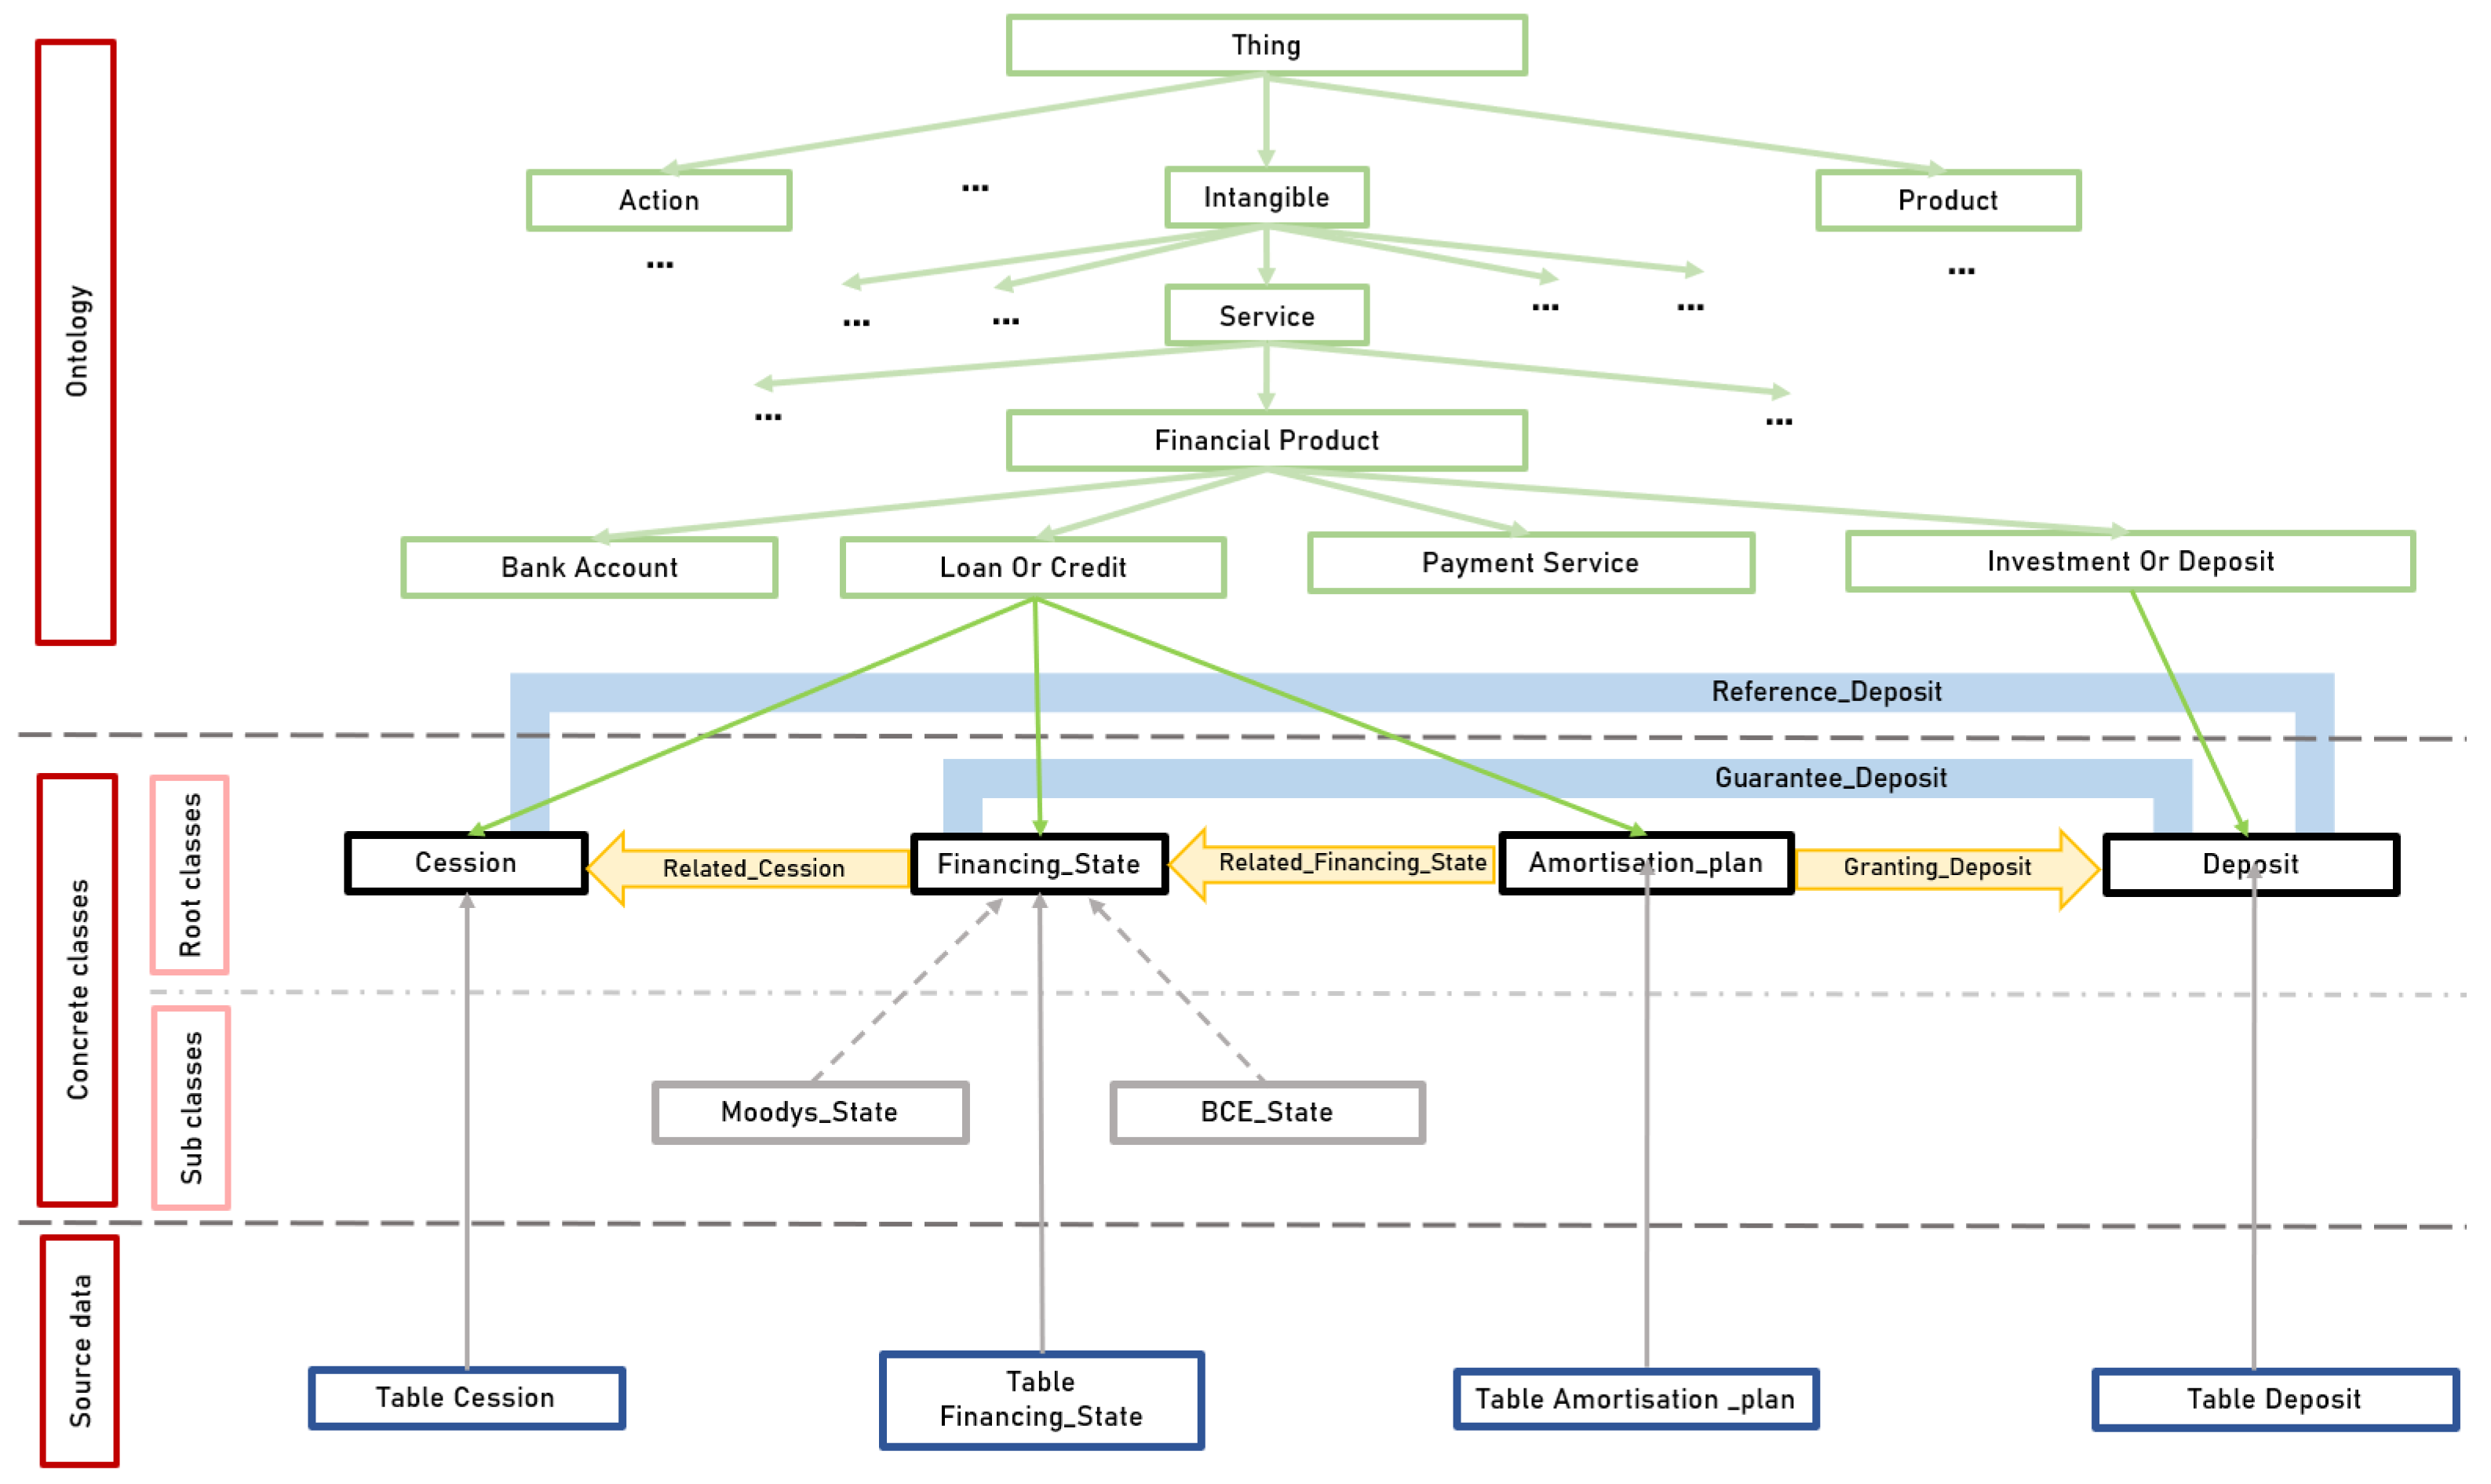
Figure 2 illustrates the overall RADAR Schema for the running example. Notice the three layers in which the model is subdivided. In the remainder of this section, we introduce all the components of the RADAR Data Model.

4.1. Ontological Layer

This layer describes the Reference Ontology, i.e., the ontology that provides basic and abstract concepts that are made concrete by the RADAR Data Model.
An ontology is defined by a graph that contains ontological classes and inheritance relationships between them. The following definition does not want to redefine the well-known concept of ontological class; its goal is to define how they are denoted in the RADAR Data Model and within the RADAR Framework.
Definition 1.
Ontological Class.An “Ontological class” (or “concept”) is defined by the tuple:
o c : n a m e , s u b c l a s s _ o f , L P , a n n o t a t i o n
where “ n a m e ” corresponds to the name of the ontological class (ontological classes are uniquely identified by their name), while “ s u b c l a s s _ o f ” is the name of the direct super-class that o c derives from (if n u l l , o c is the root of the ontology). Furthermore, “ L P ” (with L P = { o p d 1 , o p d 2 , } ) is the set of “local-property descriptors”. Finally, the “ a n n o t a t i o n ” field in o c is a textual message that explains the meaning of the class.
Each ontological-property descriptor o p d i = n a m e , d a t a _ t y p e , a n n o t a t i o n denotes a property of the class defined locally, i.e., not inherited from any super-class; a property is characterized by its “ n a m e ” and a “ d a t a _ t y p e ” (a string denoting the datatype, i.e.,“integer",“decimal",“boolean",“string",“date"); the “ a n n o t a t i o n ” field is a text message that explains the meaning of the property.
The full set of properties o c . P encompasses both local properties and inherited properties, i.e., o c . P = o c . L P o c . s u b c l a s s _ o f . P . This way, it is possible to define the following constraint, to avoid overriding of properties:
π ( n a m e ) o c . L P π ( n a m e ) o c . s u b c l a s s _ o f . P =
where the dot notation o c . s u b c l a s s _ o f . P denotes the list of properties inherited from the super-class; π ( n a m e ) S is the projection of a set of tuples S on the “ n a m e ” field (taken from Relational Algebra [44,45,46]).
Definition 1 is enough to define concepts admitted in the Ontological Layer. Further notice that the inheritance relationship induces a tree representation of ontological classes and their relationships.
Example 1.
The Ontological Layer is represented in Figure 3 (extracted from the upper part of Figure 2). Specifically, the Reference Ontology is theSchema.org[29], which has incorporated the FIBO standard [28]; in the figure, the fragment depicted in the figure is the one related to the rest of the schema. In fact, the adopted ontology contains the definition of a set of basic concepts and classes in various fields, including finance. Here, terms such as “Financial product”, “Bank Account”, “Loan Or Credit”, “Payment Service”, and so on are defined.

4.2. Concrete Layer (Core RADAR Data Model)

The core of the RADAR Data Model is the Concrete Layer, i.e., the layer where ontological classes are made concrete, to be able to fit real data.

4.2.1. Concrete Classes

Definition 2.
Concrete Class.A “Concrete Class” represents a specific concept or object described by data. It is defined as a tuple
c c : n a m e , P , K , a n n o t a t i o n
where “ n a m e ” uniquely identifies the concrete class, while “P” (with P = { p 1 , p 2 , } ) is the set of properties (property descriptors) p i = n a m e , (later defined in Definition 3) that denote the properties of the concrete class; “K” denotes the key (or set of key-property names), whose value uniquely identifies each single instance of the class. The “ a n n o t a t i o n ” field is a textual message that explains the meaning of the class.
To be valid, the set of property names π ( n a m e ) c c . P must include the set K of key-property names; this constraint is formally expressed as
π ( n a m e ) c c . P c c . K ,   w i t h   c c . K .
The notion of property (descriptor) for a concrete class is formalized by the following Definition 3.
Definition 3.
Property and Property Descriptor.A “Property” represents an aspect or feature or attribute that characterizes a class. It is defined by a “Property Descriptor”, which is the following tuple:
p : n a m e , p _ t y p e , d a t a _ t y p e , p r e d e f i n e d , a n n o t a t i o n
where “ n a m e ” is the unique name (within the class) of the property, while “ p _ t y p e ” denotes the type of property, i.e.,“categorical-closed"(the property is categorical and has a closed set of predefined values),“categorical-open"(the property is categorical and has an open set of values),“measure"(the property is numerical).
The “ d a t a _ t y p e ” field defines the data type of property values, i.e.,“integer",“decimal",“boolean",“string",“date". The ” p r e d e f i n e d ” field is the set of predefined values in the case that the property type p _ t y p e is“categorical-closed".
The final “ a n n o t a t i o n ” field is a textual message that explains the property and its values.
In the Concrete Layer, inheritance is considered as well. Definition 4 defines the concept of “subclass”.
Definition 4.
Concrete Subclass.A concrete class can be specialized into a “Concrete Subclass”, which is formally defined by the tuple:
s c : n a m e , L P , s u b c l a s s _ o f , a n n o t a t i o n
where “ n a m e ” uniquely identifies the subclass, “ L P ” is the set of “local properties” of the subclass (where a property is defined as in Definition 3), and “ s u b c l a s s _ o f ” is the name of the super- class that is specialized by s c . Finally, the “ a n n o t a t i o n ” field is a textual message that explains the meaning of the subclass.
A subclass inherits the properties and the key from its direct super-class. Thus, the full set of properties and the key of a concrete subclass are denoted as:
1. s c . P = s c . L P s c . s u b c l a s s _ o f . P
2. s c . K = s c . s u b c l a s s _ o f . K
To be valid, the subclass must respect the following constraint:
π ( n a m e ) s c . L P π ( n a m e ) s c . s u b c l a s s _ o f . P =
that is, no property names inherited from the super-class can be redefined.
Once defined the concepts of concrete class and subclass, the notion of “instance” must be defined.
Definition 5.
Instance.Consider a concrete class c c and the pool S C ( c c ) = { s c 1 , s c 2 , } of its subclasses. Let us denote with P ¯ ( c c ) = π ( n a m e ) ( c c . P ) s c S C ( c c ) π ( n a m e ) ( s c . L P ) the aggregated set of property names.
An “Instance” o of the concrete class c c is a key-value map o ( k i ) = v i , where k i P ¯ ( c c ) is a property name belonging either to the c c concrete class or to any of its subclasses. If a name k P ¯ ( c c ) is not defined in the o instance, it is assumed that o ( k ) = null, meaning that the value for k is missing.
Notice that one single instance o of the c c concrete class covers all the subclasses of c c . Depending on the specific data source the instance comes from, it could happen that some property is not defined; in this case, the property has the null value.
Furthermore, based on Definition 5, it is possible to say that the RADAR DB is a “container of instances”, in which all known instances of concrete classes and their subclasses are stored.
Example 2.
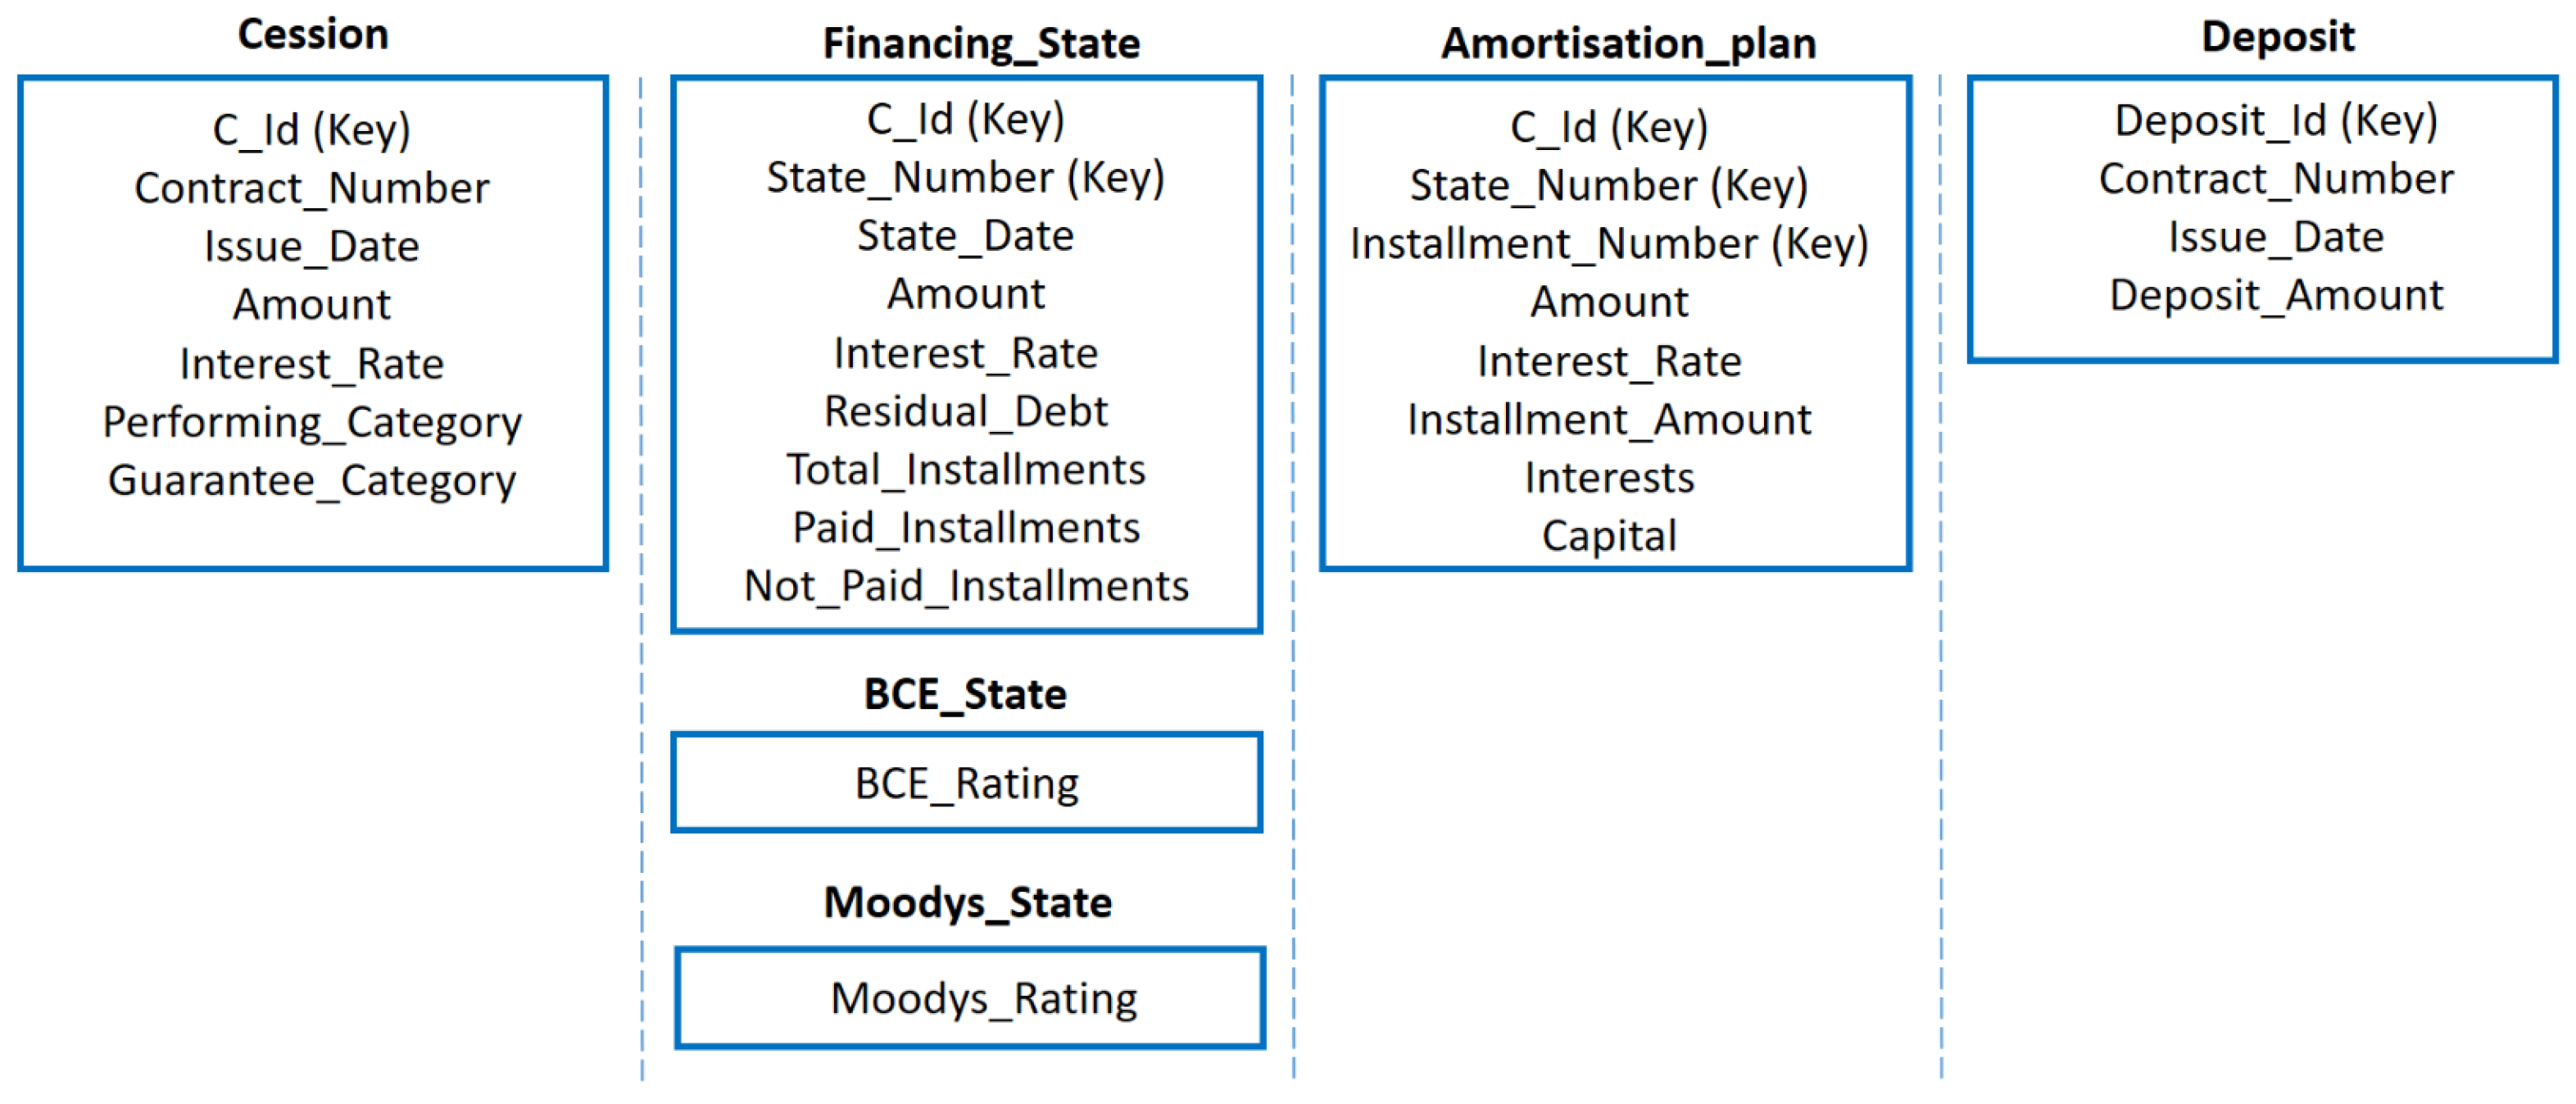
The concrete layer in the RADAR Schema for the running example is zoomed in Figure 4; Figure 5 depicts the properties for the concrete classes. Four concrete classes are in the layer, which are hereafter explained.
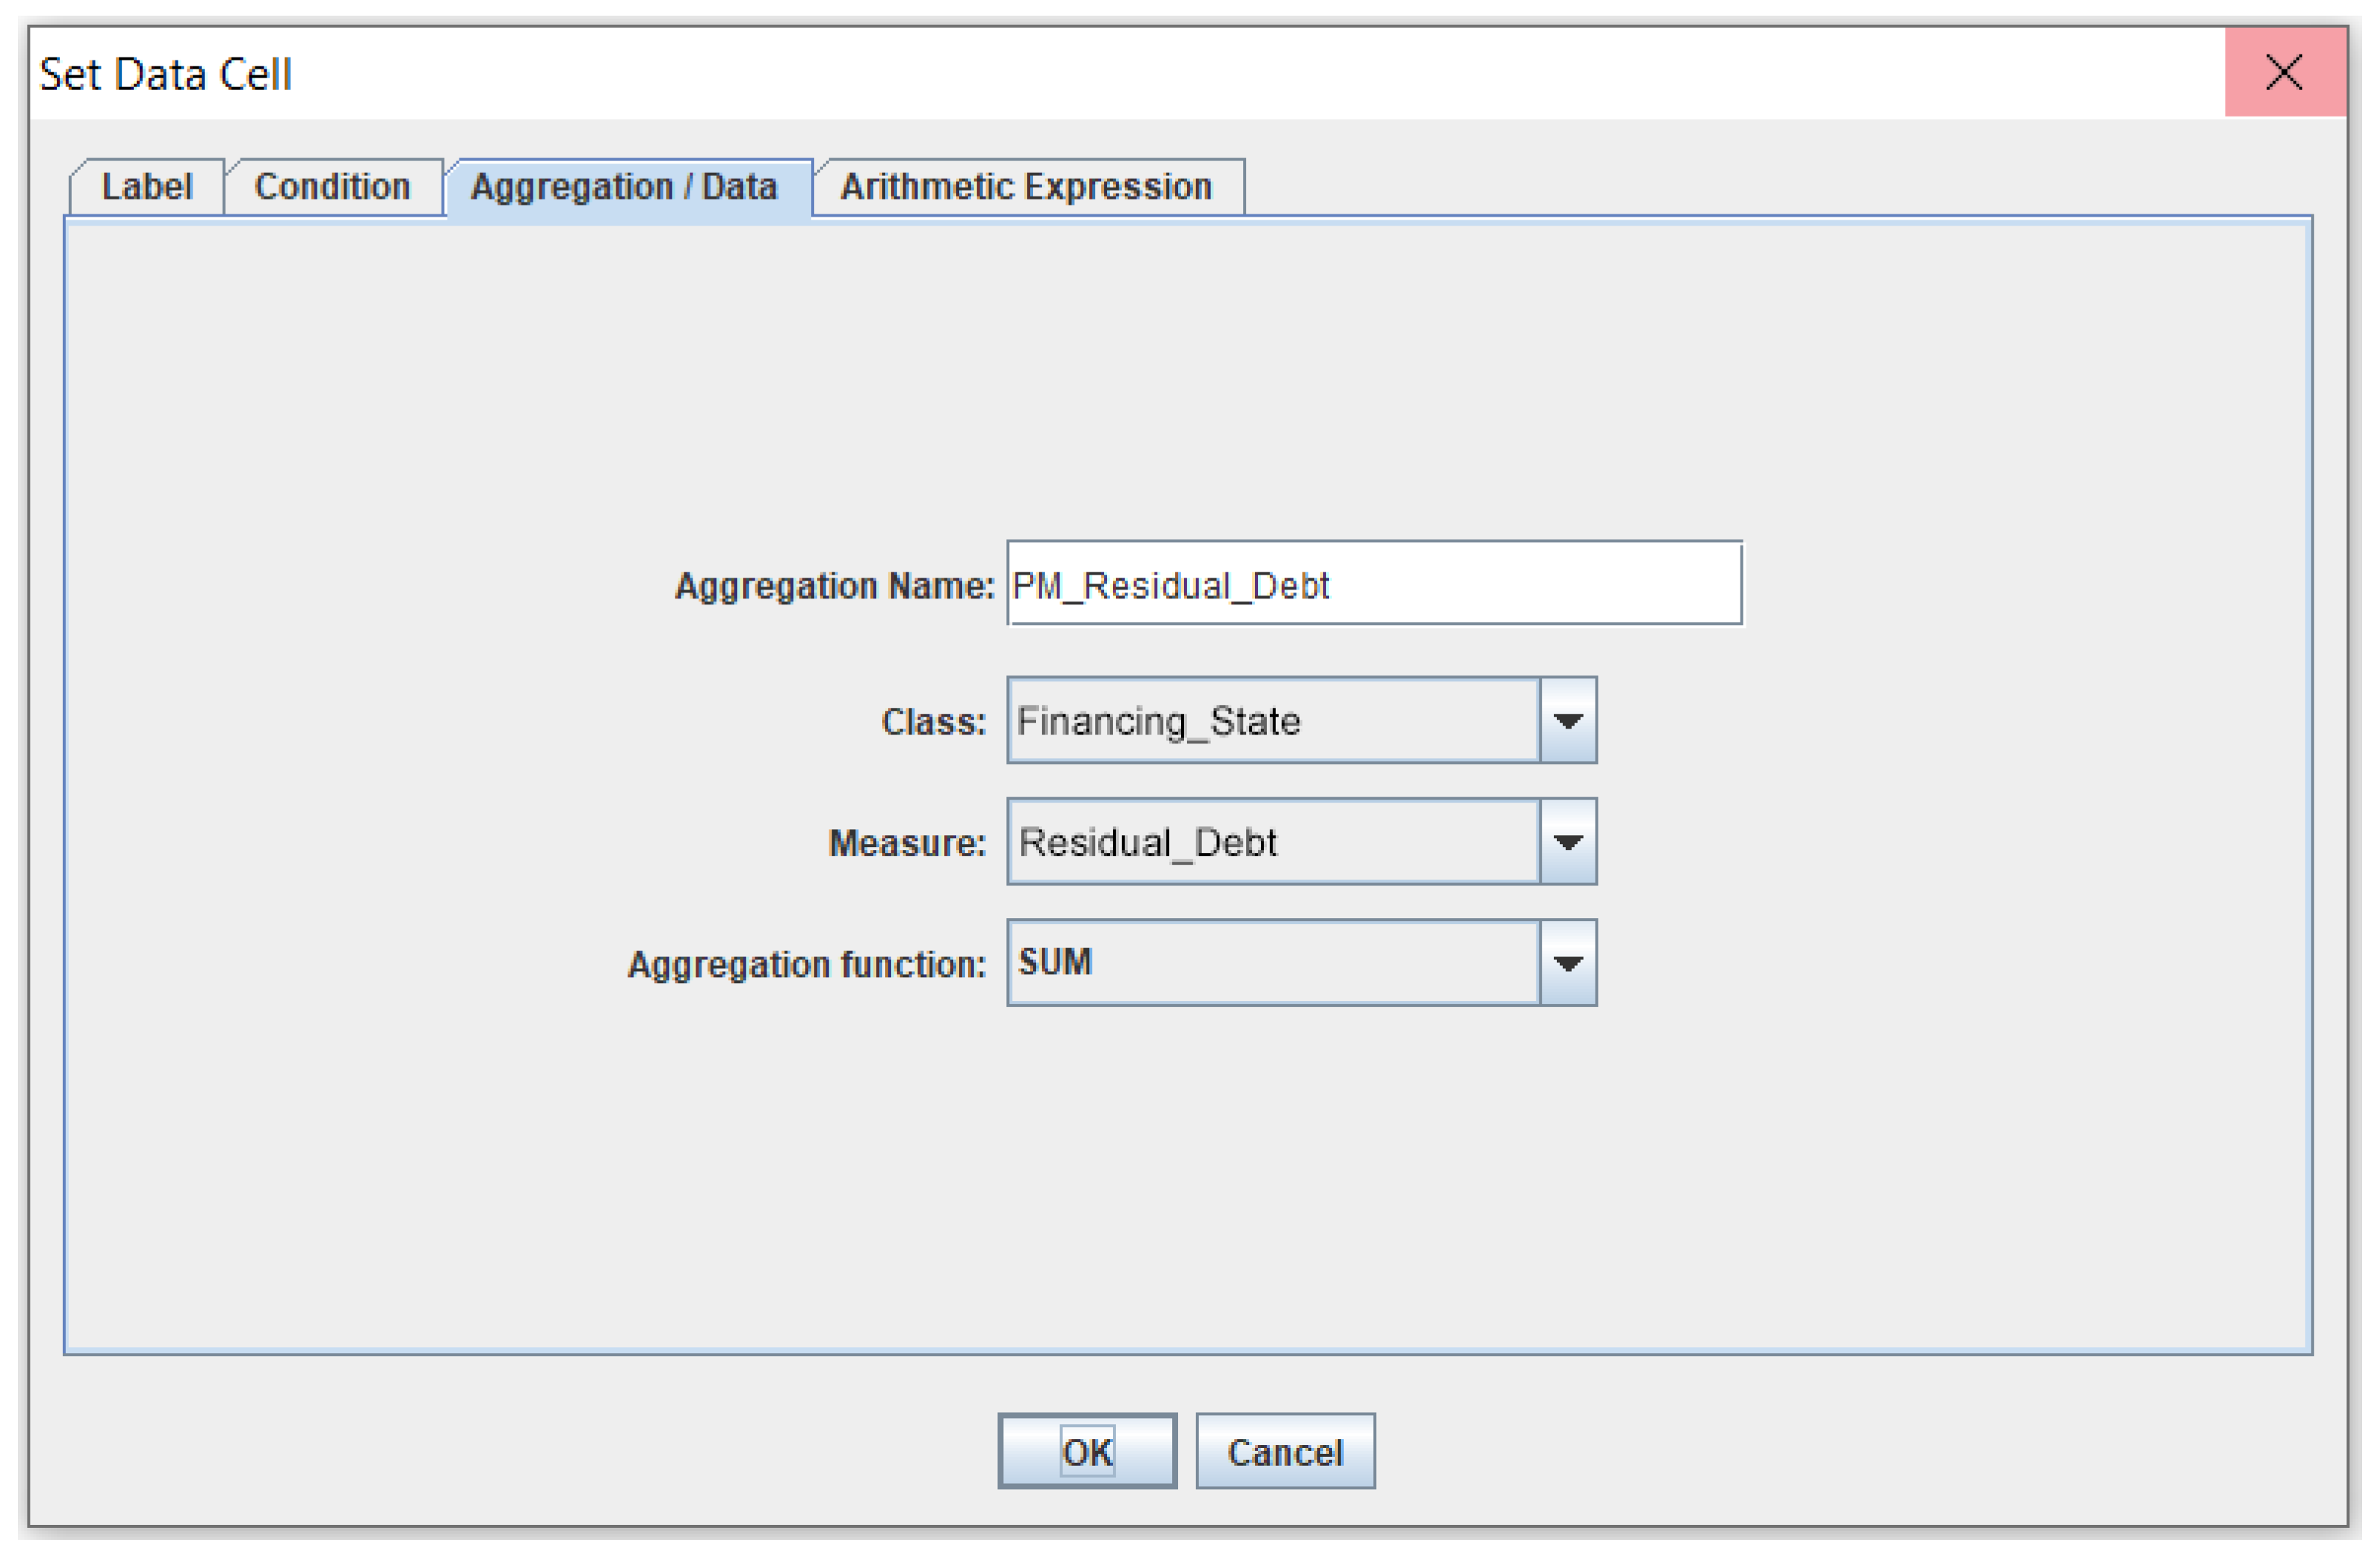
The Cession concrete class denotes the contract by means of which a loan has been bought by the bank; in practice, it denotes the loan itself. The Financing_State concrete class denotes the state of a loan at a given time (typically, a month). It reports the number of paid and unpaid installments, the residual debt and so on; there is an instance for each passed installments, to represent the overall history of the loan.
The Amortization_Plan concrete class reports the full amortization plan for each instance of the Financing_State concrete class; for example, if the loan has 120 installments, for each instance of the Financing_State concrete class there are 120 instances of the Amortization_Plan concrete class. Why this apparent redundancy? Because the amortization plan can change over time and flows coming from external banks report, for each new state of the loan, the full list of past and future installments.
Finally, the Deposit concrete class denotes deposits that guarantee the loan.
The Financing_State class has two subclasses, named Moodys_State and BCE_State, which describe how the state of a loan is evaluated based on Moody’s (one of the World’s most important private rating agencies) rules and BCE (the European Central Bank) rules, respectively.

4.2.2. Look-Up and Virtual Relationships

The RADAR Data Model provides the concept of “relationship”, declined in two different ways, i.e., Look-Up Relationship and Virtual Relationship.
Definition 6.
Look-Up Relationship.A “Look-Up Relationship” is defined by the tuple:
l r : n a m e , f r o m _ c c , t o _ c c ,
      r e f e r e n c e s : l i s t _ o f ( p p : r e f e r e n c i n g _ p r o p , t a r g e t _ p r o p ) ,
      a n n o t a t i o n
where “ n a m e ” uniquely identifies the relationship, “ f r o m _ c c ” is the “source concrete class”, while “ t o _ c c ” is the “target concrete class”; “ r e f e r e n c e s ” is the list ( p p 1 , p p 2 , ) of pairs p p i : r e f e r e n c i n g _ p r o p , t a r g e t _ p r o p of property names that are related through the Look-Up Relationship. The “ a n n o t a t i o n ” field is a textual message that explains the meaning of the relationship.
To be valid, l r must meet the following constraints:
1.  f r o m _ c c ( l r . f r o m _ c c = f r o m _ c c . n a m e
      p p = r e f e r e n c i n g _ p r o p , t a r g e t _ p r o p l r . r e f e r e n c e s
           ( p p . r e f e r e n c i n g _ p r o p f r o m _ c c . P ) )
2. t o _ c c ( l r . t o _ c c = t o _ c c . n a m e
      p p = r e f e r e n c i n g _ p r o p , t a r g e t _ p r o p l r . r e f e r e n c e s
           ( p p . t a r g e t _ p r o p t o _ c c . K ) ) ,
3. f r o m _ c c , t o _ c c ( l r . f r o m _ c c = f r o m _ c c . n a m e l r . t o _ c c = t o _ c c . n a m e
      p p = r e f e r e n c i n g _ p r o p , t a r g e t _ p r o p l r . r e f e r e n c e s
           ( r p , t p ( r p f r o m _ c c . P t p t o _ c c . P
                p p . r e f e r e n c i n g _ p r o p = r p . n a m e p p . t a r g e t _ p r o p = t p . n a m e
                r p . t y p e = t p . t y p e r p . d a t a _ t y p e = t p . d a t a _ t y p e ) ) )
4. t o _ c c ( l r . t o _ c c = t o _ c c . n a m e π ( n a m e ) t o _ c c . K = π ( t a r g e t _ p r o p ) l r . r e f e r e n c e s )
where f r o m _ c c and t o _ c c describe concrete classes (see Definition 2), while r p and t p describe properties (see Definition 3).
The constraints in the above definition have the following meaning:
  • Each referencing property must be a property in the full set of properties in the referencing class.
  • Each target property must be part of the key of the target class.
  • The type and the data type of the referencing property and of the target property must be the same.
  • All the properties in the key of the target class must be referenced.
By means of a Look-Up Relationship, instances of the referencing class can refer to instances of the target class. This ensures the referential integrity in the data, so as at query time it is possible to navigate relationships and reach properties of associated instances (instead of writing complex join operations, as in SQL).
Example 3.
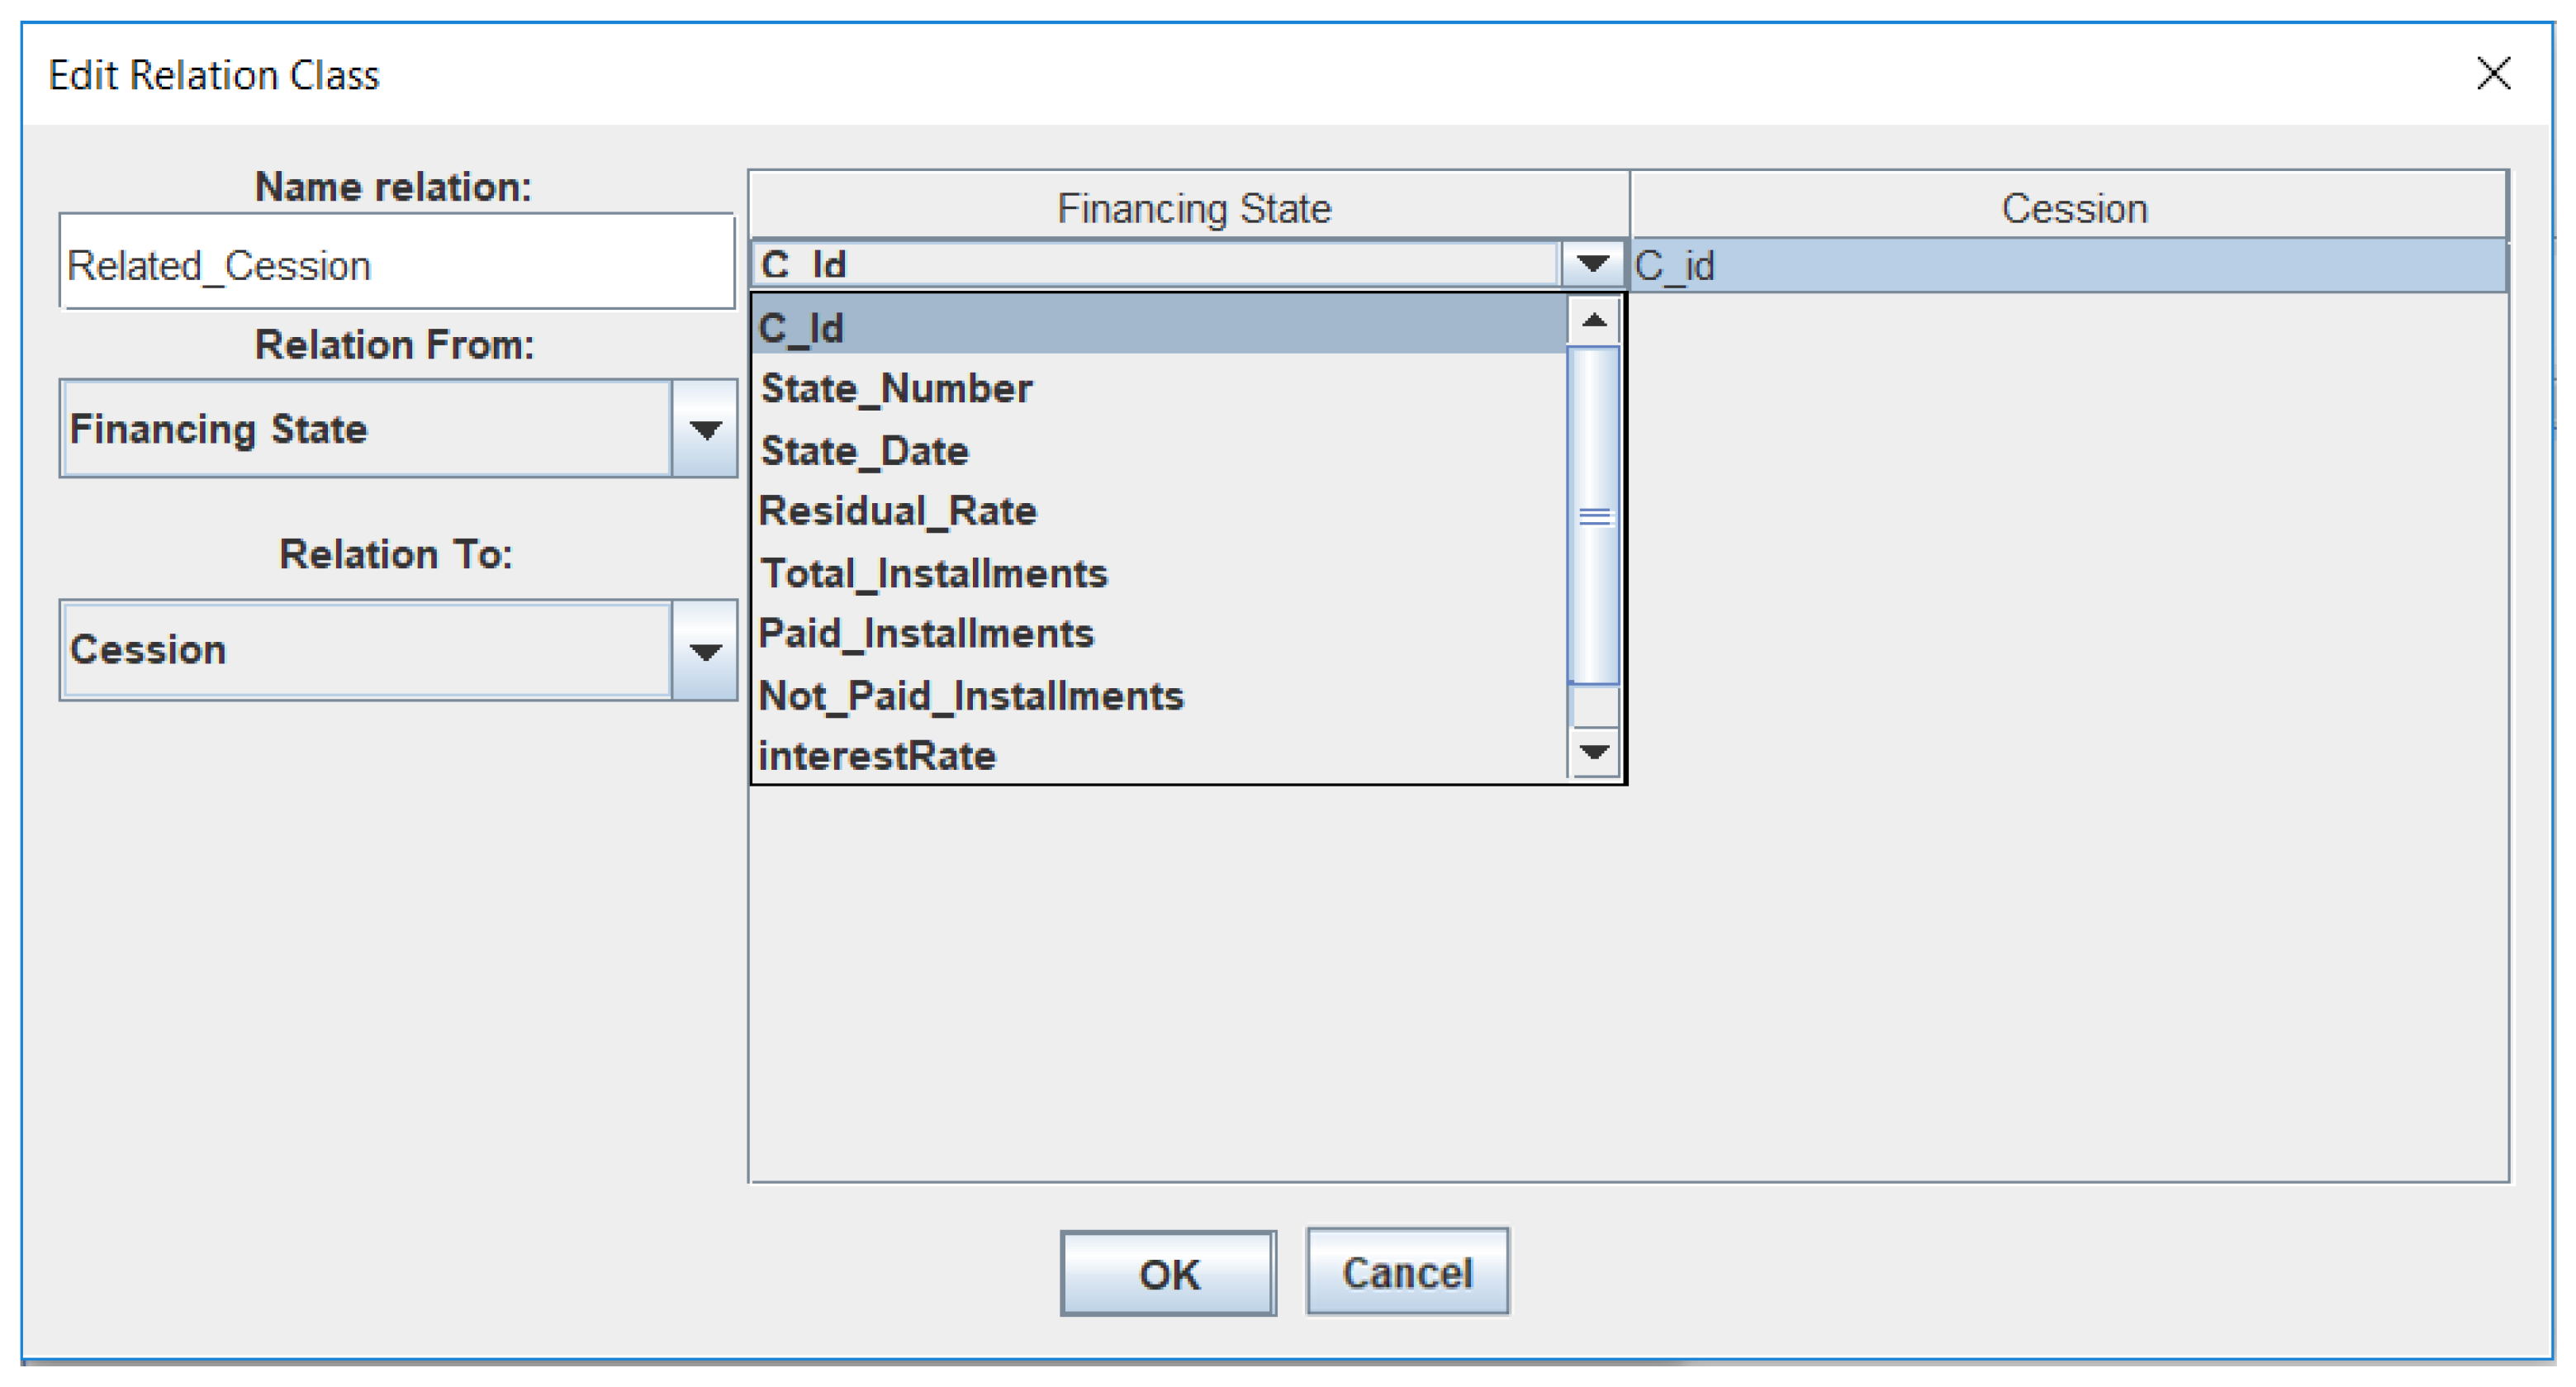
Figure 6 extends the Concrete Layer depicted in Figure 4 with Look-Up relationships. They are depicted as thick yellow arrows. Three look-up relationships are defined: theRelated_Cessionrelationship denotes that an instance of theFinancing_Stateclass refers to the related (instance of the)Cessionclass; theRelated_Financing_Staterelationship denotes that an instance of theAmortization_planclass refers to the related (instance of the)Financing_Stateclass; theGranting_Depositrelationship denotes that an instance of theAmortization_planclass also refers to the related (instance of the)Depositclass.
Virtual Relationships are abstract relationships, defined by a list of Look-Up Relationships, with the aim of semantically enriching the RADAR Schema. A Virtual Relationship is a view of a complex path that connects two concrete classes. This way, at query time the report designer is provided with clear semantic characterizations of indirect associations obtained by more than one Look-Up Relationship.
Definition 7.
Virtual Relationship.A “Virtual Relationship” is defined by the tuple:
v r : n a m e , s i d e _ 1 _ c c , s i d e _ 2 _ c c , p a t h : l i s t _ o f ( l r d : l r , l s i d e _ 1 _ c c , l s i d e _ 2 _ c c ) , a n n o t a t i o n
where “ n a m e ” uniquely identifies the relationship; “ s i d e _ 1 _ c c ” and “ s i d e _ 2 _ c c ” are the names of the associated concrete classes; “ p a t h ” is the list of the Look-Up relationships that associates classes “ s i d e _ 1 _ c c ” and “ s i d e _ 2 _ c c ”. To be precise, “ p a t h ” is a list of descriptors “ l r d ”, with l r d : l r , l s i d e _ 1 _ c c , l s i d e _ 2 _ c c , where “ l r ” is the name of the Look-Up relationship and “ l s i d e _ 1 _ c c ” and “ l s i d e _ 2 _ c c ” are the names of the two concrete class associated by the look-up relationship. The last “ a n n o t a t i o n ” field is a textual message that explains the relationship.
To be valid, the virtual relationship v r must meet the following constraints.
1. v r . s i d e _ 1 _ c c = v r . p a t h [ 1 ] . l s i d e _ 1 _ c c
2. v r . s i d e _ 2 _ c c = v r . p a t h [ | v r . p a t h | ] . l s i d e _ 2 _ c c
3. 1 i < | v r . p a t h | ( v r . p a t h [ i ] . l s i d e _ 2 _ c c = v r . p a t h [ i + 1 ] . l s i d e _ 1 _ c c )
4. l r d i v r . p a t h ( l r ( l r d i . l r = l r . n a m e
        ( ( l r d i . l s i d e _ 1 _ c c = l r . f r o m _ c c l s i d e _ 2 _ c c = l r d i . l r . t o _ c c )
        ( l r d i . l s i d e _ 1 _ c c = l r . t o _ c c l r d i . l s i d e _ 2 _ c c = l r . f r o m _ c c ) ) ) )
where l r describes a look-up relationship (see Definition 6).
The constraints in the above definition have the following meaning:
  • The first descriptor in v r . p a t h moves from the v r . s i d e _ 1 _ c c concrete class.
  • The last descriptor in v r . p a t h reaches the v r . s i d e _ 2 _ c c concrete class.
  • For each intermediate descriptor in v r . p a t h , its s i d e _ 2 _ c c concrete class coincides with the s i d e _ 1 _ c c concrete class of the next descriptor (the path is continuous).
  • For each descriptor in v r . p a t h , it denotes a look-up relationship that associates the l s i d e _ 1 _ c c and l s i d e _ 2 _ c c classes either in forward direction ( l s i d e _ 1 _ c c refers to l s i d e _ 2 _ c c ) or in backward direction ( l s i d e _ 2 _ c c refers to l s i d e _ 1 _ c c ).
In other words, a Virtual Relationship is a view of a path of Look-Up Relationships, in possibly mixed directions. Consequently, in its general form, it is a many-to-many relationship, while Look-Up Relationships are one-to-many relationships.
Example 4.
Figure 7 visually presents the virtual relationships defined in the Concrete Layer of the running example, by further extending Figure 6. Virtual relationships are defined to relate two concrete classes that have no direct connection; they are represented as thick light-blue lines. TheGuarantee_Depositrelationship provides information about the deposit associated with aFinancing_State. TheReference_Depositrelationship provides information about the deposit associated with aCession. Both relationships are many-to-many associations, obtained by combining look-up relationships.

4.2.3. Concreting Relationships

To connect the Concrete Layer to the Ontological Layer, because concrete classes give a concrete interpretation to ontological classes, the notion of Concreting Relationship is introduced.
Definition 8.
Concreting Relationship.A “Concreting Relationship” is an ordered relationship that associates an ontological class to a concrete class, to specify that the concrete class gives a concrete interpretation to the ontological class. It is defined by the following tuple:
c r : n a m e , f r o m _ o c , t o _ c c , P : s e t _ o f ( p r o p _ n a m e ) , a n n o t a t i o n
where “ n a m e ” uniquely identifies the relationship, “ f r o m _ o c ” is the ontological class from which the relationship starts, “ t o _ c c ” is the concrete class associated by the relationship to the ontological class; “P” is the set of property names inherited by the concrete class from the ontological class. Finally, “ a n n o t a t i o n ” is a textual message that explains the meaning of the relationship.
To be valid, a concreting relationship must meet the following constraints:
1. o c ( c r . f r o m _ o c = o c . n a m e c r . P π ( n a m e ) o c . P )
2. c c ( c c r . t o _ c c = c c . n a m e c r . P π ( n a m e ) c c . P )
3. o c , c c ( c r . f r o m _ o c = o c . n a m e c r . t o _ c c = c c . n a m e
          π ( n a m e , d a t a _ t y p e ) ( o c . P c r . P ) = π ( n a m e , d a t a _ t y p e ) ( c c . P c r . P )
where o c and c c describe, respectively, an ontological class (see Definition 1) and a concrete class (see Definition 2); ⋈ is the natural join operator from Relational Algebra [44,45,46], which produces all tuples with the same value for the common fields (in this case, the same property name).
The constraints in the above definition have the following meaning:
  • All properties inherited by the concrete class must be defined in the ontological class.
  • All inherited properties must have the same name in the concrete class.
  • Each inherited property must have the same data type in both the ontological class and the concrete class.
As the reader can see, many concrete classes can provide a concrete view to one ontological class, as well as a concrete class can give a concrete view to many ontological classes.
Example 5.
To illustrate, consider again the running example. The Ontological Layer and the Concrete Layer are connected through some concreting relationships, which are reported in Figure 8: they associate ontological classes to concrete classes; concreting relationships are depicted as green downward arrows (for the sake of simplicity, names of concreting relationships are not reported, though the model encompasses them). Notice that the three concrete classesCession,Financing_StateandAmortization_planall derive from the same “Loan or Credit” ontological class. This should not be surprising for the reader, because the concept of “Loan or Credit” is very generic and has many facets: it denotes either the contract (modeled by theCessionclass), or the current state of the loan (modeled by theFinancing_Stateclass) or the installments to pay (modeled by theAmortization_planclass). Likewise, the concrete class calledDepositdirectly derives from the “Investment or Deposit” ontological class, because it describes the deposit which the amortization plan of the loan is associated with. This schema should explain why we used the term “concrete class”: it gives a concrete interpretation of a generic concept in the ontology.
To conclude, consider again Figure 5, which reports the properties of concrete classes. Notice that the properties namedAmountandInterest_Rateare present in three classes, because they are inherited from the ontological class named “Loan or Credit”.

4.3. Mapping Layer

Actual sources for data to import into the RADAR DB and manage by means of concrete classes are external tables possibly stored in relational databases. Many different tables could provide instances of the same concrete class. The role of the Mapping Layer is to map external tables to concrete classes.
A preliminary definition is necessary.
Definition 9.
Attribute Descriptor.An “Attribute Descriptor” is defined by the tuple
a d : n a m e , d a t a _ t y p e , a n n o t a t i o n
where “ n a m e ” corresponds to the name of the attribute and “ d a t a _ t y p e ” corresponds to its data type (i.e.,“integer",“decimal",“boolean",“string"and“date"). The “ a n n o t a t i o n ” field is a textual message provided to explain the meaning of the attribute.
The attribute descriptor is used to define the schema of an external table.
Definition 10.
External Table.An “External Table” is described by the following tuple:
e t : n a m e , d a t a _ s o u r c e , A : l i s t _ o f ( a d ) , a n n o t a t i o n
where “ n a m e ” is the name of the table in the database denoted by “ d a t a _ s o u r c e ”, while ”A” is a list of attribute descriptors (see Definition 9) in the table (thus, “A” is the ”schema” of the table). Finally, “ a n n o t a t i o n ” is a textual message provided by technicians that import external tables.
By means of Definition 10, it is possible to define a generic external table that could be either stored within a relational database or stored as a CSV (Comma-Separated Value) file. In this regard, e t . d a t a _ s o u r c e is the connection string to the data source.

4.3.1. Mapping Relationships

To meet the actual goal of the Mapping Layer, i.e., associating concrete classes to input external-source tables, it is necessary to define the concept of ”Mapping Relationship”.
Definition 11.
Mapping Relationship.The goal of a “ Mapping Relationship” is to associate concrete classes to external tables. It is represented by the tuple:
m r : n a m e , f r o m _ e t , t o _ c c , M a p p i n g : l i s t _ o f ( p a : a t t r _ n a m e , p r o p _ n a m e ) , a n n o t a t i o n
where “ n a m e ” is the name of the relationship, while “ f r o m _ e t ” is the name of the external table that is mapped onto the concrete class whose name is denoted by t o _ c c ; “ M a p p i n g ” is a list of pairs p a : a t t r _ n a m e , p r o p _ n a m e , where each pair couples an attribute of the external table denoted by f r o m _ e t and a property “ p r o p _ n a m e ” in the concrete class that is denoted by ” t o _ c c . The “ a n n o t a t i o n ”field is a textual annotation provided by technicians that design the relationship.
The following constraints must be met by the mapping relationship.
1. e t ( m r . f r o m _ e t = e t . n a m e π ( a t t r _ n a m e ) m r . M a p p i n g π ( n a m e ) e t . A )
2. c c ( m r . t o _ c c = c c . n a m e π ( p r o p _ n a m e ) m r . M a p p i n g π ( n a m e ) c c . P )
3. e t , c c ( m r . f r o m _ e t = e t . n a m e m r . t o _ c c = c c . n a m e
        m r . M a p p i n g ρ ( n a m e ) ( p r o p _ n a m e ) ( π ( n a m e , d a t a _ t y p e ) ( o c . P ) ) =
            m r . M a p p i n g ρ ( n a m e ) ( a t t r _ n a m e ) ( π ( n a m e , d a t a _ t y p e ) ( e t . A ) )
where e t and c c are, respectively, an external table (see Definition 10) and a concrete class (see Definition 2); the ρ operator (taken from Relational Algebra [44,45,46]) renames the attributes specified in the left-hand side of the arrow into the names specified on the right-hand side of the arrow.
The three constraints in the above definition have the following meaning:
  • All the attribute names specified in the mapping must be in the schema of the ” f r o m _ e t ” external table.
  • All the property names specified in the mapping must be properties in the ” t o _ c c ” concrete class.
  • Associated properties and attributes must have the same data type.
Notice that mapping relationships are oriented from an external table to a concrete class. This way, each single concrete class can be mapped to more than one external table. The rationale is that instances of the concrete class can come from multiple external sources, and unified within one single concrete class.
Example 6.
The Mapping Layer of the running example is depicted in Figure 9. Rectangles represent external tables in the source database. Arrows connecting an external table to a concrete class depict Mapping Relationships (for the sake of simplicity, their names are not reported); they denote that the external table is mapped onto the concrete class and its rows are used to obtain the instances of the concrete class. Remember that not necessarily all the properties in the concrete class will have a value coming from the external table; consequently, some RADAR Rules will be necessary to derive property values (see Section 4.3.2).

4.3.2. RADAR Rule Language

The RADAR Data Model is completed by the RADAR Rule Language. In fact, not all the properties of a concrete class are necessarily mapped to attributes of external tables. To cope with this situation, the RADAR Rule Language was introduced: the goal of a RADAR Rule is to assign a value to properties without value, which, otherwise, would have the null value. These properties are called “derived properties”. Therefore, the RADAR Rule Language provides a non-procedural way to define the values of derived properties.
RADAR Rules are defined as “Condition-Action” (CA) rules [47] since their action is executed when their condition is true. By means of the following definitions, rules and their execution semantics are defined.
Definition 12.
Rule.A “RADAR Rule” is defined by the following tuple:
r r : n a m e , a p p l i c a t i o n _ c l a s s , c o n d i t i o n , a c t i o n : l i s t o f ( a s s i g n m e n t ) , a n n o t a t i o n
where “ n a m e ” uniquely identifies the rule, “ a p p l i c a t i o n _ c l a s s ” is the concrete class which the rule is applied to, “ c o n d i t i o n ” is a logical condition based on comparison predicates possibly composed by logical operators; finally, “ a c t i o n ” is a non-empty list of assignments based on the=operator, where the left-hand side is the name of a property p, while the right-hand side is an expression that possibly refers to properties. The “ a n n o t a t i o n ” field is a textual annotation provided by rule designers.
Both the condition and the assignment expressions can refer to properties of r r . a s s o c i a t e d _ c l a s s , as well as to properties in concrete classes reachable from r r . a s s o c i a t e d _ c l a s s by navigating either Look-Up Relationships or Virtual Relationships by means of thereachoperator (see Definition 13).
As reported in Definition 12, conditions and assignment expressions possibly must navigate the RADAR Schema by means of the Reach operator, defined in Definition 13.
Definition 13.
ReachOperator.The syntax of theReachoperator in the RADAR Rule Language  is
Reach(class(viarelationship)+)
where “ c l a s s ” is the concrete class to reach though the operator, by navigating both Look-Up Relationships and Virtual Relationships specified in the non-empty repetition of pairs “via r e l a t i o n s h i p ”.
The operator returns the instances of the target class reached by navigating the list of relationships reported in the parentheses; if the sequence of relationships does not reach the target class (broken sequence or wrong class) the operator returns no instance.
The dot notation can be applied after theReachoperator, to refer to properties in the instances returned by the operator application.
The reader can find examples of RADAR Rules in Listing 1, which will be discussed in the example below.
At this point, Definition 14 can define the execution semantics of RADAR Rules.
Definition 14.
Execution Semantics of Radar Rules.Consider a RADAR Rule r r and the set of instances of the r r . a p p l i c a t i o n _ c l a s s concrete class for which the rule is defined; these instances are known as the “Native Instances” and are denoted as N a t ( r r ) .
Each native instance n N a t ( r r ) is combined with the set R i of instances returned by applying the i-th occurrence of theReachoperator in r r , by moving from the n native instance; the set of “Compound Instances” C o m p ( n ) { n } × R 1 × × R k is obtained (where k is the number of occurrences of theReachoperator in the r r rule).
For each compound instance c C o m p ( n ) for which r r . c o n d i t i o n is true, the assignments in r r . a c t i o n are performed on the corresponding source instances (i.e., while c C o m p ( n ) is obtained by combining the images of the instances, the assignments are performed on instances actually stored in the RADAR DB).
The rationale behind the RADAR Rule Language is to provide the Mapping Layer with a tool to complete missing properties. In fact, properties in concrete classes are independent of the presence of a corresponding attribute in the input external tables; often, many properties must be derived or computed based on other properties. RADAR Rules provide the way to complete new instances of concrete classes.
Example 7.
The RADAR Schema of the running example is completed by RADAR Rules that are necessary to evaluate those properties in concrete classes that cannot be mapped onto attributes in external tables. Listing 1 reports three rules.
TheJunk_BCE_Ratingrule must evaluate the value for theBCE_Ratingproperty in theBCE_Stateconcrete class, which is a subclass of theFinancing_Stateclass (remember that a concrete class and its subclasses share the same instances, see Definition 5). Once a new instance is added to the class, the condition is evaluated; specifically, it is true when the number of non-paid installments is greater than the number of residual installments multiplied by 1.3. If the condition is true, the action assigns the string“Junk"to theBCE_Ratingproperty.
Listing 1. Three RADAR Rules for the running example.
Rule: Junk_BCE_Rating
Class: BCE_State
Condition: Not_Paid_Installments > Residual_Debt * 1.3
Action: BCE_Rating=“Junk"
Rule: Default_Moodys_Rating
Class: Moodys_State
Condition: BCE_Rating == “Junk" AND
    Reach(Cession via Related_Cession).PerformingCategory == “Default"
Action: Moodys_Rating=“D"
Rule: Performing_Cession
Class: Cession
Action: Performing_Category = “Performing"
Rule: Junk_BCE_Rating
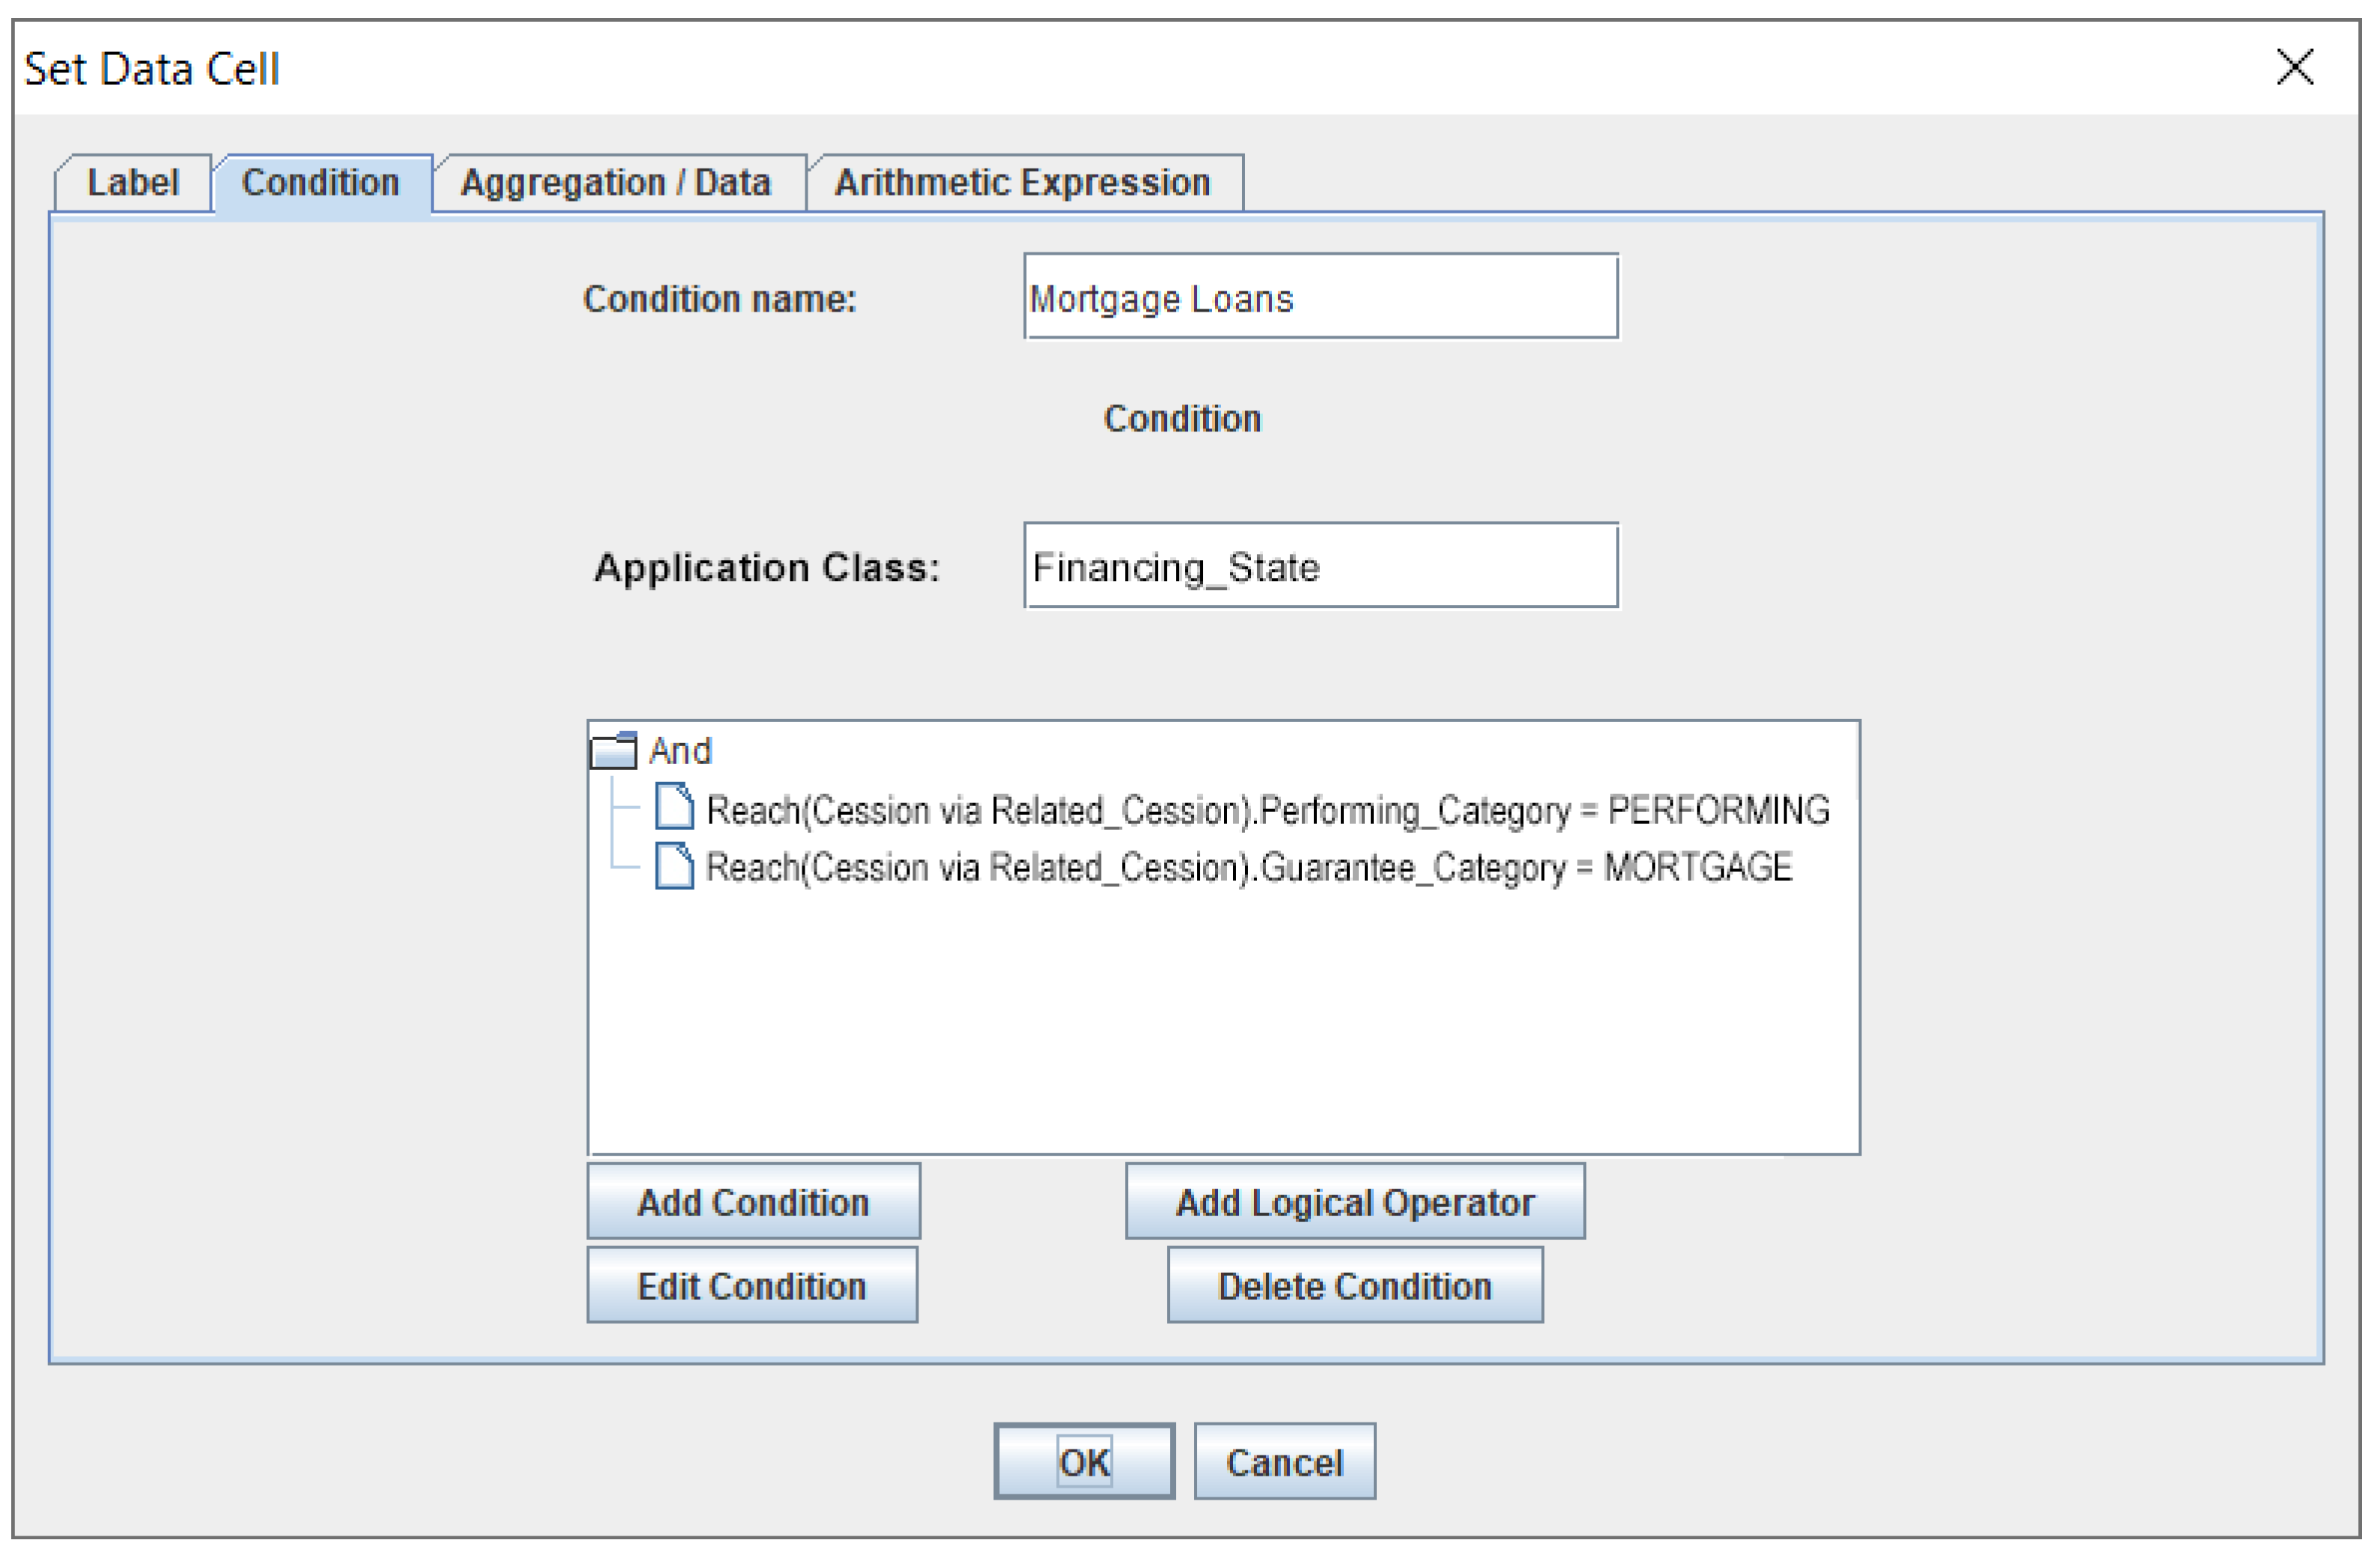
TheDefault_Moodys_Ratingrule behaves similarly. Its condition exploits theReachoperator (see Definition 13) to get the value of thePerforming_Categoryproperty in the related instance of theCessionconcrete class; it moves from the current concrete class (i.e.,Moodys_State, which is a subclass of theFinancing_Stateconcrete class) and via theRelated_Cessionlook-up relationship obtains the associated instance of theCessionconcrete class; the dot notation completes the reference to the desired property. Substantially, the rule behaves this way: it assigns the“D"value (that stands for “Default") to theMoodys_Ratingproperty of the evaluated instance of theMoodys_Stateconcrete class, which is a subclass of theFinancing_Stateconcrete class, if itsBCE_Ratingproperty is“Junk"and thePerforming_Stateproperty in the referred instance of theCessionconcrete class is“Default". Notice that theBCE_Ratingproperty is not within theMoodys_Statesubclass; however, theFinancing_Stateclass and its subclasses (BCE_StateandMoodys_State) share the same instances, so theBCE_Ratingproperty is visible to the rule.
Finally, thePerforming_Cessionrule is associated with theCessionconcrete class and has the goal of assigning the value"Performing"to thePerforming_Categoryproperty of the instance of theCessionconcrete class it is evaluated on. This time, the condition exploits theReachoperator (see Definition 13) to reach instances of theDepositconcrete class via theReference_Depositvirtual relationship; if there is at least one associated deposit whose value of theDeposit_Amountproperty is greater than the value of theAmountproperty of the cession that the rule is evaluating, the condition is true and the action is executed.

4.4. RADAR Schema

The previous sections defined all concepts that compose the RADAR Schema. Now, this concept can be formally defined.
Definition 15.
RADAR Schema.The overall ”RADAR Schema” is defined as the tuple:
R S : O C , C C , L R , V R , C R , E T , M R , R R
where:
  • O C = { o c 1 , o c 2 , } : is the set of ontological classes (see Definition 1);
  • C C = { c c 1 , c c 2 , } is the set of concrete classes (see Definition 2) and subclasses (see Definition 4);
  • L R = { l r 1 , l r 2 , } is the set of look-up relationships between concrete classes (see Definition 6);
  • V R = { v r 1 , v r 2 , } is the set of virtual relationships (on concrete classes) that give a semantic view of transitive relationships obtained by navigating look-up relationships (see Definition 7);
  • C R = { c r 1 , c r 2 , } is the set of concreting relationships between ontological classes in O C and concrete classes in C C (see Definition 8);
  • E T = { e t 1 , e t 2 , } is the set of external tables (see Definition 10);
  • M R = { m r 1 , m r 2 , } is the set of mapping relationships, which associate concrete classes in C C and external tables in E T ;
  • R R = { r r 1 , r r 2 , } is the set of RADAR Rules(see Definition 12).
The R S schema is ”correct” if and only if all constraints reported in Definitions 1–12 and the following ones are met.
1. o c O C such that o c . s u b c l a s s _ o f n u l l , o c ¯ O C such that o c ¯ . n a m e = o c . s u b c l a s s _ o f .
2. c c C C such that c c . s u b c l a s s _ o f n u l l , c c ¯ C C such that c c ¯ . n a m e = c c . s u b c l a s s _ o f .
3. l r L R , c c s , c c t C C such that c c s . n a m e = l r . f r o m _ c c and c c t . n a m e = l r . t o _ c c .
4. v r V R and l r d v r . p a t h , l r ¯ L R such that l r ¯ . n a m e = l r d . l r .
5. c r C R , o c O C , c c C C such that o c . n a m e = c r . f r o m _ o c and c c . n a m e = c r . t o _ c c .
6. m r M R , c c C C , e t E T such that c c . n a m e = m r . t o _ c c and e t . n a m e = m r . f r o m _ e t .
7. r r R R , c c C C such that c c . n a m e = r r . a p p l i c a t i o n _ c l a s s .
The constraints in the above definition can be described as follows.
  • The parent class of a non-root ontological class in O C must be defined in O C .
  • The parent class of a concrete subclass in C C must be defined in C C .
  • The concrete classes associated by a look-up relationship in L R must be defined in  C C .
  • The look-up relationships navigated by virtual relationships in V R must be defined in L R .
  • The ontological class and the concrete class associated by a concreting relationship in C R must be defined in O C and in C C , respectively.
  • The concrete class and the external table associated by a mapping relationship in M R must be defined in C C and in E T , respectively.
  • Each RADAR Rule must be applied to a concrete class defined in C C .
Although the three layers that constitute the RADAR Schema have been intuitively introduced, it is now possible to formally define them.
Definition 16.
Ontological Layer.In the RADAR Schema, the “Ontological Layer” is composed by the set O C of ontological classes only.
Definition 17.
Concrete Layer.In the RADAR Schema, the “ConcreteLlayer” is the sub-tuple
C L a y e r : C C , L R , V R , C R
i.e., the set C C of concrete classes, the set L R of look-up relationships, the set V R of virtual relationships and the set C R of concreting relationships.
Definition 18.
Mapping Layer.In the RADAR Schema, the “Mapping Layer” is the sub-tuple
M L a y e r : E T , M R , R R
i.e., the set E T of external tables, the set M R of mapping relationships and the set R R of RADAR Rules.
As a final remark concerning the concepts in the RADAR Data Model, recall the “ a n n o t a t i o n ” fields that occur in every tuple that defines an element of the RADAR Schema. An “ a n n o t a t i o n ” is a pure text message that gives a natural-language explanation. For example, the meaning of a concrete class, the meaning of a property and how to interpret its values, and so on. This way, knowledge about the application field is handed down by domain experts to other users.
Through the RADAR Data Model it is possible to define a unique schema for data, able to integrate a semantic and generic set of concepts (the Ontological Layer), the concrete concepts that give a unified view of actual data (the Concrete Layer) and the source data (the Mapping Layer). In particular, we designed the RADAR Data Model to be used by different users in various ways, as specified hereafter.
  • Domain experts provide the reference ontology and define the schema for the Concrete Layer. This way, they provide other users with the unifying and high-level schema for concrete concepts to use to represent data to aggregate into reports.
  • Technicians that deal with databases and data flows map concrete classes to external tables, to feed instances of concrete classes (they work on the Mapping Layer).
  • Users in charge of designing reports exploit ontological classes and semantic annotations in the Concrete Layer to find out the data to aggregate in reports. These users exploit the Ontological Layer and the Concrete Layer, while they have no access to the Mapping Layer.

4.5. Discussion

The RADAR Schemas for the running example should have clarified the rationale behind the RADAR Data Model; nevertheless, it is worth further discussing this issue, before concluding this section.
The RADAR Data Model gives a “unified view” of aspects that usually would be considered separately.
  • Ontological classes are necessary to give a clear semantics to data items, to assist during the evolution of the model and to help users in charge of designing reports.
  • On the opposite side, external tables describe the source data, as they come to the RADAR DB.
  • Concrete classes are the bridge between semantics and raw data: they provide a uniform view of data, because when data are imported from several external tables, they are translated into a homogeneous view with ontological classes that denote their meaning.
Looking at users involved in the process, many of them are considered within RADAR.
  • Domain experts who participate to the original design of the system are precious to define the Reference Ontology and to orient the design team to properly interpret rules and the application context.
  • Database administrators who deal with source data provide their knowledge about incoming data and contribute to map them into the concrete classes. Apart from the initial design activities, they are also precious to add novel data sources if the system is operational.
  • Users in charge of designing reports work directly on the concrete classes, because they do not have to take case about raw source data; in fact, they are not technicians. Furthermore, the availability of domain knowledge associated with concrete classes (the ontology and the annotations), provided by the domain expert(s) involved in the initial design phase, provides report designers with a valuable source of information to choose the concrete classes to query in relation to the data to be aggregated into the report to produce.
In other words, it could be said that the RADAR Schema plays the role of ”historical memory” of all the knowledge behind the design of the schema, contributed by many people with different skills in different times.
To help the reader to better understand the rationale behind the RADAR Data Model, it is worth reporting some more considerations.
  • The formal definition of the RADAR Data Model is given to provide the scientific community with a rigorous formalization of the model. Since the model encompasses concepts such as “ontological class” and “table”, the paper reports specific definitions for them, even though they are well known in the scientific community. The goal of these definitions is not to provide yet another definition; in contrast, their goal is to give a representational structure of them, to be effectively used within the RADAR Data Model. Indeed, Definitions 1 and 10 provides the way such concepts are represented and used in the specific model.
    Further notice that the adoption of MOF (acronym for ”Meta-Object Facility”) [48,49] might be evaluated as well to define the RADAR Data Model; it could be considered in the future, as an engineering approach, to build novel components of the framework and connectors. Nevertheless, the MOF approach can accompany the formal approach followed in this section, to support the practical exchange of models and data.
  • When the term “ontology” is used, many people think about RDF (acronym for “Resource Description Framework”) [50,51] and OWL (acronym for “Web Ontology Language” ) [52,53]. The reader could wonder why they are not mentioned before in the paper. The answer is that in the RADAR approach, they are possible formats to represent ontologies when the Source Ontology is loaded into the Knowledge-Base Manager. Currently, the framework relies on the JSON-LD format, adopted by the Schema.org ontology. JSON-LD is the most recent format for representing ontologies, and Schema.org is the most recent ontology (based on JSON-LD) that encompasses the financial domain. Nevertheless, if necessary, our framework could be easily extended to import both RDF and OWL ontologies.
  • The RADAR Data Model maintains a separation between ontological classes and concrete classes, i.e., concepts and data. This is due to various reasons. (i) The considered application context is characterized by huge volumes of raw data to deal with; while associating raw data (described by concrete classes) to concepts (described by ontological classes) should help retrieve the concrete class to query for aggregating raw data, it is not feasible to think to express queries on ontological classes, because there is not a certain correspondence with raw data (in the application context, raw data to aggregate in report must be certain, no imprecision is allowed). (ii) RDF and JSON-LD are thought for describing “Linked Data” over the Internet, i.e., documents (resources) are linked each other based on their content; queries on linked data can retrieve data with a certain degree of imprecision and efficiency is not a key issue; this is not true for the application context considered in this paper: queries must be done on certain data and efficiency is a key issue.
  • Based on the considerations reported in the previous item, it is clear why we had to define the RADAR Rule Language: already existing languages, in particular those that were thought to apply logical inference on the bases of OWL ontologies (to infer intensional data from extensional data) were not applicable. In fact, RADAR Rules ensures an efficient execution (they can be translated into SQL updates) and they are based only on the Concrete Layer, because ontological classes cannot be considered to manage and query raw data.

5. Creating the Knowledge Base and Designing Reports

It is now time to show the reader how the various types of user can exploit the Design Layer of the RADAR Framework to create knowledge (by defining the RADAR Schema) though the Knowledge-Base Manager (in Section 5.1), as well as to design reports through the Report Designer (in Section 5.2).

5.1. The Knowledge-Base Manager

The component called Knowledge-Base Manager is used to build the RADAR Schema and the full Knowledge Base. It is devoted to various types of user: (i) domain experts, which choose the Reference Ontology by means of which raw data are semantically annotated; (ii) domain experts and data managers design the Concrete Layer; (iii) database administrators define the Mapping Layer, to make automatic the ETL activities to load the RADAR DB.
From the technical point of view, the Knowledge-Base Manager is a suite of micro-services, as depicted in Figure 10. For many of them, the corresponding Designer is implemented, which provides users with the necessary graphical user interfaces.
  • The users in charge of uploading the Reference Ontology and designing concrete classes exploits the Class Service. Figure 11 reports a screenshot of the Class Designer, the user interface of the Class Service. Hereafter, the figure is briefly explained.
    -
    On the left-hand side of the figure, there is the Ontology Browser, which allows the user to select the ontological classes (concepts) which the new concrete class derives from. In the case that the Reference Ontology does not provide the ontological classes that are needed to define concrete classes, the Class Service allows for defining new ontological classes.
    -
    The dialog window for defining the schema of the new concrete class is depicted on the right-hand side of Figure 11. Specifically, it shows the definition of the Cession concrete class, whose properties are reported in Figure 5. The inherited properties do not appear, because they are shown in a preliminary stage, once the ontological classes are selected.
  • Once concrete classes have been created, the users exploit the Relationship Service to create look-up relationships and virtual relationships among the concrete classes. The user interface of the service is called Relationship Designer. Figure 12 shows a screenshot of the user interface: specifically, the figure shows the definition of the Related_Cession relationship; notice how properties in the referring class (i.e., Financing_State), on the left-had side, are associated with properties in the key of the referred class (i.e., Cession), on the right-hand side.
  • Data managers can populate the Mapping Layer to set up the correspondence between external tables and concrete classes; specifically, they exploit the Mapping Service to define mapping relationships between concrete classes and external tables (in the Source DBs). Users are provided with a graphical user interface, which is called Mapping Designer (for the sake of space, no screenshot is reported).
  • Data managers and domain experts can define RADAR Rules to complete missing properties in the instances of data. To this end, they exploit the Rule Service and its user interface called Rule Designer (for the sake of space, no screenshot is reported).
  • Finally, once the RADAR Schema is complete, the software architect in charge of managing the framework exploits the Deploy Service to actually generate and deploy the two descriptions necessary to set-up the Information-System Layer, i.e., the DB Schema and the ETL Directives.

5.2. The Report Designer

Consider the running example. Users in charge of designing reports, not necessarily domain experts, use the Report Designer tool to browse the Knowledge Base. In fact, this tool provides several functionalities to correctly interpret the data collected in the RADAR DB.
The tool is devised as a stand-alone application, which can call the micro-services that constitute the Knowledge-Base Manager. Through its graphical user interface, the user creates report layouts (in the form of Report Definitions and Aggregation Queries), which are stored within the Report Folder. Specifically, the user is provided with the following functionalities.
  • The user can browse the Knowledge Base and consult the RADAR Schema through the Knowledge Browser.
  • The user defines the layout of the reports and defines the aggregations she/he is interested in through the functionality named Report-Layout Designer.
  • The user stores in a persistent way, through the functionality named Archive Manager, the actual layout of the reports (Report Definitions) together with the queries that specify how to aggregate the data to put into the reports (Aggregation Queries).
The user defines report layouts and aggregations through the user interface of the Report Designer. It provides the user with the following model for reports.
  • A report consists of several “worksheets”, each of which contains one and only one “table”.
  • A “table” is the fundamental complex object in reports. In particular, the user can create two distinct types of tables: “stratification tables” and “detail tables” (also called “stratification reports” and “detail reports”, under the assumption that a table is the simplest form of report); specifically, a “stratification table” is useful to generate reports where instances of concrete classes are aggregated at different stratification levels, while ”detail tables” are filled in with detailed values coming from instances of concrete classes.
    Figure 13 shows an example of a table defined for a report in the running example: the report contains three distinct worksheets (see the bottom of the screenshot), where the shown worksheet is Portfolio1, which is an example of “stratification table”; Figure 14 shows the worksheet called LoanByLoan, which is an example of “detail table”.
  • A “cell” content is defined through the Knowledge Browser. It lets the user exploit the knowledge provided by the domain experts and and saved in the Knowledge Base. It also letd the user to define the “cell” type. The “cell” corresponds to the information unit in a table. Several cell types are available, with respect to the value they can report within:
    -
    Empty Cell: the cell has no value.
    -
    Label Cell: the value is a constant textual label.
    -
    Arithmetic-Expression Cell: the value of the cell is specified by an expression that can rely on numerical values and class properties, as well as aggregations and cells that were previously defined.
    -
    Condition Cell: this type of cell is used to specify selection conditions on the instances of the concrete class; the condition holds for the entire line that contains the cell, so as only instances of the concrete class that meet the condition will be used to compute aggregations and cell values. Figure 15 reports a screenshot of the user interface that allows users to define conditions: it refers again to the running example. Specifically, the condition is called Mortgage_Loans and selects those instances of the Financing_State concrete class that refer (through the Related_Cession relationship) to cessions whose Performing_State property has the "PERFOMRING" value and the Guarantee_Category property has the "MORTGAGE" value; notice the presence of the Reach operator (the same introduced for RADAR Rules) that navigates the Related_Cession relationship to reach the instances of the Cession concrete class. In the bottom part of Figure 15, the reader can notice the buttons that allow users to express complex conditions.
    -
    Aggregation Cell: this type of cell allows users to aggregate values in instances of concrete classes. A specific interface is provided: Figure 16 shows a screenshot, which refers to the running example. Specifically, values of the Paid_Installments property of the Financing_State class are summed, based on the SUM aggregation function. Notice that the aggregation is given a name, to be referred to by other cells. Usual aggregation functions are available, i.e., SUM, COUNT (instance counter), AVG (average), MIN (minimum) and MAX (maximum). If the line in which the aggregation is defined contains a condition cell, the aggregation implicitly works on the instances selected by the condition. Aggregations can be specified in “arithmetic-expression cells” too, by using the AGGR(n, c c , a f , p) operator, where n is the name of the aggregation, c c is the concrete class whose instances are aggregated, a f is the aggregation function and p is the property whose values are aggregated.
  • When the user defines a report, she/he also specifies all the queries that are required to generate the report (the so-called Aggregation Queries).
  • Given a report, the user can define some parameters called Report Parameters ( R P )). They receive external data to be used to select data to aggregate: for example, in the running example, the StartDate and EndDate parameters could be defined, to indicate the period of interest to consider; only the amortization plans referring to the specified time period are considered; to this end, when a new parameter is defined, the user interface forces the user to define a condition on this parameter, which selects instances further considered by tables in the report.
Apart from the model the user must follow to define reports, the novelty introduced by the RADAR Framework is the semantic characterization of data based on the Reference Ontology. The user who is in charge of designing a report is not an expert in databases: she/he is an employee, usually with economical knowledge, which received the official documentation from the regulatory body that asked for the report and must design it. At this point, the user must search for the right data in the RADAR DB; the Report Designer assists the user as follows.
  • The user searches for a reference to a key concept that characterizes the report to generate within the knowledge base. For example, since the running example is focused on loans, she/he looks for the word “loan”.
  • The result of the search is the ontological class “Loan or Credit”, which is made concrete by various concrete classes (see the RADAR Schema depicted in Figure 2). The user can also navigate the ontology: to this end, the user is provided with a browser similar to the one depicted in Figure 11.
    Furthermore, annotations associated with class definitions, property definitions and relationship definitions can be consulted, so as the user can fully comprehend how to use them. For example, what is exactly a “performing loan”? such an annotation, provided by the domain expert who designed the RADAR Schema, can accompany the definition of the Cession class; the user can consult it to learn about it and exploit this knowledge to prepare reports.
  • Once identified the concrete classes, the user is now ready to define the report layout, since concrete classes to work on have been identified.
Suppose that the user is in charge of designing the report named “Portfolio 1” introduced in Section 3.1. Figure 13 shows how the user interface allows for designing a report.
  • The user creates the worksheet and then inserts an “aggregation table”. This choice is based on the layout required by the regulatory body.
  • To comply with requirements, the user defines various groups of aggregate values; these groups are labeled as “1”, “2” and so on, on the A column. Specifically, group “1” summarizes ”Performing Loans” (see the label in cell B6), group “2” summarizes “Delinquent Loans” (see the label in cell B11), and so on.
  • For each line in a group, the user defines “condition cells”, because only specific instances of the concrete class must be considered for computing aggregations. For example, consider cells B7, B8 and B9: since they are “condition cells”, lines 7, 8 and 9 are derived by selecting those instances of the concrete classes that meet the condition. In the cells, notice the names given to the conditions: for example, cell B7 is associated with the condition called “Mortgage_Loans”; to define it, the user is provided with the dialog box shown in Figure 15. The effect of having defined cells B7 as a “condition cell” is that next cells on line 7 will be derived only from instances of the Cession concrete class (see Figure 15. ) that meet the condition (those instances such that the value of the Performing_Category property is "Delinquent" and the value of the Guarantee_Category property is "Unguaranteed").
  • After having defined the “condition cell” for a line, the user can define aggregations in the other cells of the same line. For example, considering again line 7 (that is the selected line in Figure 13), cell C7 is defined as an “aggregation cell”, whose name is PM_ResidualDebt: it indicates the sum of the residual debts of performing loans guaranteed by a mortgage. To define it, the user is provided with the dialog box shown in Figure 16: instances of the Financing_State class that are related to the instances of the Cession class selected by the B7 conditional cell are aggregated, to sum the values of the Residual_Debt property (since the condition in cell B7 selects only instances describing performing loans that are guaranteed by a mortgage, only these selected instances are aggregated by the specified aggregation, so this explains the name PM_Residual_Debt). Cells D7 and F7 are aggregation cells too.
  • The reference layout provided by the regulatory bodies asks to sum the values of “aggregation cells”; this is the case of cell C6. For this reason, the user defines it as an “arithmetic-expression cell”; it sums the values of the cells C7 (denoted as CELL(7,3)), C8 (denoted as CELL(8,3)) and C9 (denoted as CELL(9,3)).
  • In the case of cell E7 the user must define an aggregation within a mathematical expression. The Report Designer allows that in “arithmetic-expression cells”, by means of the AGGR operator.
    Consider the expression within the cell, which is CELL(7,3)+AGGR(PM_Residual_Debt, Financing_State, SUM, Residual_Debt). The AGGR operator sums values of the property named Residual_Debt of instances of the Financing_State class; the aggregation is given the PM_Residual_Debt name; then, the resulting aggregate value is summed to the C7 cell (denoted as CELL(7,3)).
The user continues to behave as illustrated for line 7. At the end, the report layout is ready for generating the actual report. Figure 17 shows an example of the final report generated by the layout reported in Figure 13.
The user could be in charge of designing reports in which detailed data must be reported; this is the case of the “Loan-By-Loan” report introduced in Section 3.1, in which each row describes the actual status of a specific loan. In this case, the user designs the report by inserting a “detail table” in the worksheet. Figure 14 shows the layout of type “detail table” created for the report called LoanByLoan. The number of lines generated in the final report is not fixed, as in the case of an “aggregation table”; in contrast, it is unpredictable, because it depends on the actual instances to show. Figure 18 shows an example of generated report. Hereafter, the layout is briefly explained.
  • The user is asked to define the heading of the report and the structure of each “detail line”, i.e., the line that is repeated as many times as the number of selected instances. In the heading (lines 1 and 2 in in Figure 14), only label cells can be used.
  • The user defines the line to be actually tied to instances of the selected concrete class. This is the selected line in Figure 14.
    For each cell, the user ties it to a property of the concrete class (in this case, the Financing_State concrete class): such cells are formally defined as “aggregation cells”, for which the aggregation function is not specified; this way, the basic model for cells is kept.
    For example, cell B4 is defined with name CessionId, as shown in the figure; the source class is the Financing_State class, and the considered property is CessionId.
    Consequently, all the cells on the line are automatically tied to the same concrete class, because the line is automatically bounded to an instance of the concrete class.
    If necessary, “arithmetic-expression cells” can be defined, to obtain values from other cells on the same line.
The resulting report is depicted in Figure 18. The reader can notice that the single line in Figure 14 generates as many lines as the instances of the Financing_State class found in the RADAR DB.

6. Conclusions

It is time to make some final remarks. First, Section 6.1 summarizes the contribution of the paper; then, Section 6.2 sketches possible future work.

6.1. Summary

The paper presents the RADAR Framework, a novel suite specifically designed to support reporting activities in an integrated way. Its distinctive features are resumed hereafter.
  • The RADAR Framework is designed to cover the overall process that leads to generate reports, from data gathering to final reports.
  • The Knowledge Base stores the knowledge about the application domain and data integrated within the framework.
  • The RADAR DB is the unique storage system where data are gathered from external sources; derived from the concept of “Operational Data Store”, it provides a unique and uniform view of data, although they are still modeled in an operational fashion.
  • The RADAR Data Model provides a high-level yet concrete view of data, which are semantically characterized by the adoption of the Reference Ontology: the Ontological Layer gives the basic semantic framework to data; the Concrete Layer models actual (operational and possibly massive) data by giving them a semantic characterization by means of the Reference Ontology; the Mapping Layer maintains knowledge about provenance of data.
  • The Report Designer is used to design the layout of reports and connect them to data stored within the RADAR DB; the user browses the Knowledge Base to retrieve data of interest and specify aggregations.
  • The rigid distinction between Design Layer and Information-System Layer allows for easily deploying the RADAR Framework within existing information systems: the computational resources necessary for actually processing data and generating reports are decoupled from those necessary for managing the Knowledge Base, designing the RADAR Schema and reports; this way, analysts and designers interfere with the information system as little as possible.
It is possible to summarize the RADAR Framework as follows: it is not just a tool for designing reports; it is a framework that assists the overall process of gathering data, providing a uniform data model to them, semantically characterizing data, gathering knowledge about the application domain, assisting users in the definition of layouts and data to put into reports, automatically processing data and generating reports. In other words, it is devised to provide a long-lasting support to many different users with different competences, skills and roles, to formalize and maintain the enterprise knowledge behind the enterprise business domain. For the best of our knowledge, this approach is unique in the panorama of currently available tools for business reporting.

6.2. Future Work

The RADAR Framework has been engineered into a practical and fully usable tool for enterprises. In fact, the running example presented in this paper derives directly from practical testbeds with customers.
Nevertheless, many future works can be pursued, to make the RADAR Framework increasingly attractive for customers. We present our ideas hereafter.
  • The adoption of the micro-service approach has been a good choice, which allows for decoupling engines and user interfaces. Following this direction, we are going to make a complete re-engineering of all the user interfaces towards a pure web-application approach (which is quite appreciated by users).
  • Currently, the RADAR Framework is designed to gather only relational data, both from relational databases and from CSV (acronym for Comma-Separated Values) and MS Excel files. However, NoSQL (which stands for Not Only SQL) databases [54] based on the JSON format [55] have become widely used, due to the ability of JSON to represent data with complex structures, also called ”Non-First Normal Form” (denoted as N F 2 ) [56,57]). Moving from previous work on the management of large JSON data sets [58,59,60,61], we plan to extend the Mapping Layer of the RADAR Data Model, to make the framework able to load JSON data sets from JSON stores and web sources.
  • Finally, we plan to extend the Report Designer with a wizard that should drive the user through knowledge browsing, aggregation definition and report-layout definition. This functionality will be added while re-engineering the user interface.

Author Contributions

Conceptualization, N.C. and G.P.; Investigation, N.C. and G.P.; Methodology, A.A. and G.P.; Software, N.C.; Supervision, A.A. and G.P.; Writing—original draft, A.A., N.C. and G.P. All authors have read and agreed to the published version of the manuscript.

Funding

This research received no external funding.

Data Availability Statement

Data sharing not applicable: no new data were created or analyzed in this study. Data sharing is not applicable to this article.

Conflicts of Interest

The authors declare no conflict of interest.

References

  1. Lim, E.P.; Chen, H.; Chen, G. Business intelligence and analytics: Research directions. Acm Trans. Manag. Inf. Syst. 2013, 3, 1–10. [Google Scholar] [CrossRef]
  2. Golfarelli, M.; Rizzi, S.; Cella, I. Beyond data warehousing: What’s next in business intelligence? In Proceedings of the 7th ACM International Workshop on Data Warehousing and OLAP, Washington, DC, USA, 12–13 November 2004; pp. 1–6. [Google Scholar]
  3. Sen, A.; Sinha, A.P. A comparison of data warehousing methodologies. Commun. ACM 2005, 48, 79–84. [Google Scholar] [CrossRef]
  4. Azzini, A.; Cortesi, N.; Topalovic, A.; Psaila, G. Radar, a framework for automated reporting. In Proceedings of the 16th International Conference on Applied Computing 2019, Cagliari, Italy, 7–9 November 2019; pp. 54–62. [Google Scholar]
  5. Luhn, H.P. A business intelligence system. IBM J. Res. Dev. 1958, 2, 314–319. [Google Scholar] [CrossRef]
  6. Rao, R. From unstructured data to actionable intelligence. IT Prof. 2003, 5, 29–35. [Google Scholar] [CrossRef]
  7. Elena, C. Business intelligence. J. Knowl. Manag. Econ. Inf. Technol. 2011, 1, 1–12. [Google Scholar]
  8. Neches, R.; Fikes, R.E.; Finin, T.; Gruber, T.; Patil, R.; Senator, T.; Swartout, W.R. Enabling technology for knowledge sharing. AI Mag. 1991, 12, 36. [Google Scholar]
  9. Gruber, T.R. A translation approach to portable ontology specifications. Knowl. Acquis. 1993, 5, 199–220. [Google Scholar] [CrossRef]
  10. Swartout, B.; Patil, R.; Knight, K.; Russ, T. Toward distributed use of large-scale ontology. In Proceedings of the Tenth Workshop on Knowledge Acquisition for Knowledge-Based Systems, Banff, AB, Canada, 9–11 November 1996; pp. 138–148. [Google Scholar]
  11. Şimşek, U.; Kärle, E.; Holzknecht, O.; Fensel, D. Domain specific semantic validation of schema. org annotations. In Proceedings of the International Andrei Ershov Memorial Conference on Perspectives of System Informatics, Moscow, Russia, 27–29 June 2017; pp. 417–429. [Google Scholar]
  12. Ye, J.; Stevenson, G.; Dobson, S. A top-level ontology for smart environments. Pervasive Mob. Comput. 2011, 7, 359–378. [Google Scholar] [CrossRef] [Green Version]
  13. Berners-Lee, T.; Hendler, J.; Lassila, O. The semantic web. Sci. Am. 2001, 284, 28–37. [Google Scholar] [CrossRef]
  14. Bontcheva, K.; Wilks, Y. Automatic Report Generation from Ontologies: The MIAKT Approach. In Proceedings of the International Conference on Application of Natural Language to Information Systems, Salford, UK, 23–25 June 2004; pp. 324–335. [Google Scholar]
  15. Romero, O.; Abelló, A. A framework for multidimensional design of data warehouses from ontologies. Data Knowl. Eng. 2010, 69, 1138–1157. [Google Scholar] [CrossRef] [Green Version]
  16. Nebot, V.; Berlanga, R.; Pérez, J.M.; Aramburu, M.J.; Pedersen, T.B. Multidimensional Integrated Ontologies: A Framework for Designing Semantic Data Warehouses; Springer: Berlin/Heidelberg, Germany, 2009; Volume 13, pp. 1–36. [Google Scholar]
  17. Calvanese, D.; De Giacomo, G.; Lembo, D.; Lenzerini, M.; Poggi, A.; Rosati, R. Ontology-based Database Access. In Proceedings of the Fifteenth Italian Symposium on Advanced Database Systems SEBD, Torre Canne di Fasano, Italy, 17–20 June 2007; pp. 324–331. [Google Scholar]
  18. Xiao, G.; Calvanese, D.; Kontchakov, R.; Lembo, D.; Poggi, A.; Rosati, R.; Zakharyaschev, M. Ontology-Based Data Access: A survey; IJCAI Organization: Sydney, Australia, 2018. [Google Scholar]
  19. Xiao, G.; Ding, L.; Cogrel, B.; Calvanese, D. Virtual Knowledge Graphs: An Overview of Systems and Use Cases. Data Intell. 2019, 1, 201–223. [Google Scholar] [CrossRef]
  20. Poggi, A.; Lembo, D.; Calvanese, D.; Giacomo, G.D.; Lenzerini, M.; Rosati, R. Linking Data to Ontologies; Springer: Berlin/Heidelberg, Germany, 2008; Volume 10, pp. 133–173. [Google Scholar]
  21. Guerrini, M.; Possemato, T. Linked data: Un nuovo alfabeto del web semantico. Bibl. Oggi Mens. Inf. Aggiorn. Dibatt. 2012, 30, 7–15. [Google Scholar]
  22. Sporny, M.; Longley, D.; Kellogg, G.; Lanthaler, M.; Lindström, N. JSON-LD 1.0. W3C Recomm. 2014, 16, 41. [Google Scholar]
  23. Sporny, M.; Kellogg, G.; Lanthaler, M.; Group, W.R.W. JSON-LD 1.0: A JSON-based serialization for linked data. W3C Recomm. 2014, 16, 127. [Google Scholar]
  24. Pan, J.Z. Resource Description Framework; Springer: Berlin/Heidelberg, Germany, 2009; pp. 71–90. [Google Scholar]
  25. Browne, O.; O’Reilly, P.; Hutchinson, M.; Krdzavac, N. Distributed Data and Ontologies: An Integrated Semantic Web Architecture Enabling More Efficient Data Management. J. Assoc. Inf. Sci. Technol. 2019, 70, 575–586. [Google Scholar] [CrossRef]
  26. Petrova, G.; Tuzovsky, A.; Aksenova, N. Application of the Financial Industry Business Ontology (FIBO) for development of a financial organization. In Conference Series of Journal of Physics, Proceedings of the International Conference on Information Technologies in Business and Industry, Bali, Indonesia, 30–31 January 2016; IOP Publishing: Bristol, UK, 2016. [Google Scholar]
  27. Butler, T.; Abi-Lahoud, E. A Mechanism-Based Explanation of the Institutionalization of Semantic Technologies in the Financial Industry. In Creating Value for All Through IT; Bergvall-Kåreborn, B., Nielsen, P.A., Eds.; Springer: Berlin/Heidelberg, Germany, 2014; pp. 277–294. [Google Scholar]
  28. Financial Industry Business Ontology. 2021. Available online: http://www.fibo.org/schema (accessed on 15 January 2021).
  29. The Schema.org Ontology. 2020. Available online: http://schema.org/ (accessed on 15 November 2020).
  30. Guha, R.V.; Brickley, D.; Macbeth, S. Schema.org: Evolution of structured data on the web. Commun. ACM 2016, 59, 44–51. [Google Scholar] [CrossRef]
  31. Kärle, E.; Fensel, A.; Toma, I.; Fensel, D. Why are there more hotels in tyrol than in austria? Analyzing schema. org usage in the hotel domain. In Information and Communication Technologies in Tourism 2016; Springer: New York, NY, USA, 2016; pp. 99–112. [Google Scholar]
  32. Michener, W.K.; Jones, M.B. Ecoinformatics: Supporting ecology as a data-intensive science. Trends Ecol. Evol. 2012, 27, 85–93. [Google Scholar] [CrossRef] [Green Version]
  33. Madin, J.S.; Bowers, S.; Schildhauer, M.; Krivov, S.; Pennington, D.; Villa, F. An ontology for describing and synthesizing ecological observation data. Ecol. Inform. 2007, 2, 279–296. [Google Scholar] [CrossRef]
  34. Madin, J.S.; Bowers, S.; Schildhauer, M.P.; Jones, M.B. Advancing ecological research with ontologies. Trends Ecol. Evol. 2008, 23, 159–168. [Google Scholar] [CrossRef]
  35. Science Environment for Ecological Knowledge. 2004. Available online: http://seek.ecoinformatics.org/ (accessed on 10 October 2020).
  36. Foundry, O. Environment Ontology ENVO. 2020. Available online: http://www.obofoundry.org/ontology/envo.html (accessed on 10 October 2020).
  37. Buttigieg, P.L.; Pafilis, E.; Lewis, S.E.; Schildhauer, M.P.; Walls, R.L.; Mungall, C.J. The environment ontology in 2016: Bridging domains with increased scope, semantic density, and interoperation. J. Biomed. Semant. 2016, 7, 57. [Google Scholar] [CrossRef] [Green Version]
  38. Kharlamov, E.; Hovland, D.; Skjæveland, M.G.; Bilidas, D.; Jiménez-Ruiz, E.; Xiao, G.; Soylu, A.; Lanti, D.; Rezk, M.; Zheleznyakov, D.; et al. Ontology based data access in Statoil. J. Web Semant. 2017, 44, 3–36. [Google Scholar] [CrossRef] [Green Version]
  39. Ekaputra, F.; Sabou, M.; Serral Asensio, E.; Kiesling, E.; Biffl, S. Ontology-based data integration in multi-disciplinary engineering environments: A review. Open J. Inf. Syst. 2017, 4, 1–26. [Google Scholar]
  40. Mate, S.; Köpcke, F.; Toddenroth, D.; Martin, M.; Prokosch, H.U.; Bürkle, T.; Ganslandt, T. Ontology-based data integration between clinical and research systems. PLoS ONE 2015, 10, e0116656. [Google Scholar] [CrossRef] [Green Version]
  41. Nadareishvili, I.; Mitra, R.; McLarty, M.; Amundsen, M. Microservice Architecture: Aligning Principles, Practices, and Culture; O’Reilly Media Inc.: Sebastopol, CA, USA, 2016. [Google Scholar]
  42. Newman, S. Building Microservices; O’Reilly Media Inc.: Sebastopol, CA, USA, 2015. [Google Scholar]
  43. Bauer, C.; King, G. Hibernate in Action; Manning: Greenwich, CT, USA, 2005; Volume 1. [Google Scholar]
  44. Date, C. Introduction To Database Systems, 8th ed.; Addison-Wesley: Ithaca, NY, USA, 2003; p. 1024. [Google Scholar]
  45. Elmasri, R.; Navathe, S.B. Database Systems; Pearson Education: Boston, MA, USA, 2011; Volume 9. [Google Scholar]
  46. de Almeida Cruz, J.; de Azevedo Silva, K. Relational Algebra Teaching Support Tool. J. Inf. Syst. Eng. Manag. 2017, 2, 8. [Google Scholar] [CrossRef] [Green Version]
  47. Zaniolo, C. A unified semantics for active and deductive databases. In Rules in Database Systems; Springer: New York, NY, USA, 1994; pp. 271–287. [Google Scholar]
  48. OMG Available Specification, Meta Object Facility (MOF) 2.0 Core Specification, 2006. Available online: https://www.omg.org/spec/MOF/2.0/PDF (accessed on 15 January 2021).
  49. Poernomo, I. The Meta-Object Facility typed. In Proceedings of the 2006 ACM Symposium on Applied Computing, Dijon, France, 23–27 April 2006; pp. 1845–1849. [Google Scholar]
  50. Miller, E. An introduction to the Resource Description Framework. Bull. Am. Soc. Inf. Sci. Technol. 1998, 25, 15–19. [Google Scholar] [CrossRef] [Green Version]
  51. Candan, K.S.; Liu, H.; Suvarna, R. Resource Description Framework: Metadata and its applications. ACM Sigkdd Explor. Newsl. 2001, 3, 6–19. [Google Scholar] [CrossRef]
  52. Heflin, J. An Introduction to the OWL Web Ontology Language; Lehigh University: Bethlehem, PA, USA; National Science Foundation (NSF): Arlington, VA, USA, 2007; p. 7. [Google Scholar]
  53. McGuinness, D.L.; Van Harmelen, F. OWL web ontology language overview. W3C Recomm. 2004, 10, 2004. [Google Scholar]
  54. Meier, A.; Kaufmann, M. SQL & NoSQL Databases; Springer: New York, NY, USA, 2019. [Google Scholar]
  55. Ihrig, C.J. Javascript object notation. In Pro Node.js for Developers; Springer: New York, NY, USA, 2013; pp. 263–270. [Google Scholar]
  56. Abiteboul, S.; Bidoit, N. Non first normal form relations: An algebra allowing data restructuring. J. Comput. Syst. Sci. 1986, 33, 361–393. [Google Scholar] [CrossRef] [Green Version]
  57. Papakonstantinou, Y. Semistructured Models, Queries and Algebras in the Big Data Era: Tutorial Summary. In Proceedings of the 2016 International Conference on Management of Data, San Francisco, CA, USA, 26 June–1 July 2016; pp. 2229–2233. [Google Scholar]
  58. Bordogna, G.; Capelli, S.; Ciriello, D.E.; Psaila, G. A cross-analysis framework for multi-source volunteered, crowdsourced, and authoritative geographic information: The case study of volunteered personal traces analysis against transport network data. Geo-Spat. Inf. Sci. 2018, 21, 257–271. [Google Scholar] [CrossRef]
  59. Marrara, S.; Pelucchi, M.; Psaila, G. Blind Queries Applied to JSON Document Stores. Information 2019, 10, 291. [Google Scholar] [CrossRef] [Green Version]
  60. Psaila, G.; Fosci, P. J-CO: A Platform-Independent Framework for Managing Geo-Referenced JSON Data Sets. Electronics 2021, 10, 621. [Google Scholar] [CrossRef]
  61. Fosci, P.; Psaila, G. Towards Flexible Retrieval, Integration and Analysis of JSON Data Sets through Fuzzy Sets: A Case Study. Information 2021, 12, 258. [Google Scholar] [CrossRef]
Figure 1. Architecture of the RADAR Framework.
Information 12 00463 g001
Figure 2. Graphical representation of the unified view of ontology (top), high-level logical model (middle) and source tables (bottom) for the running example.
Information 12 00463 g002
Figure 3. Excerpt of the Schema.org Reference Ontology imported within the RADAR Data Model for the running example.
Information 12 00463 g003
Figure 4. Concrete Layer for the running example.
Information 12 00463 g004
Figure 5. Properties of concrete classes in the RADAR Schema for the running example (depicted in Figure 2).
Information 12 00463 g005
Figure 6. Concrete Layer for the running example extended with Look-Up relationships.
Information 12 00463 g006
Figure 7. Graphical representation of the virtual relationships defined for the running example.
Information 12 00463 g007
Figure 8. Concreting Relationships defined for the running example.
Information 12 00463 g008
Figure 9. Mapping Layer and Mapping Relationships defined for the running example.
Information 12 00463 g009
Figure 10. Architecture of the Knowledge-Base Manager.
Information 12 00463 g010
Figure 11. RADAR Knowledge-Base Manager: screenshot of the Class Designer.
Information 12 00463 g011
Figure 12. RADAR Knowledge Designer: screenshot of the Relationship Designer.
Information 12 00463 g012
Figure 13. Report Designer: definition of a “aggregation table” in the worksheet called Portfolio1 within a report layout.
Information 12 00463 g013
Figure 14. Report Designer: definition of a “detail table” in the worksheet called LoanByLoan within a report layout.
Information 12 00463 g014
Figure 15. Report Designer: user interface for defining “Condition Cells”.
Information 12 00463 g015
Figure 16. Report Designer: user interface for defining “Aggregation Cells”.
Information 12 00463 g016
Figure 17. Example of “aggregation report”.
Information 12 00463 g017
Figure 18. Example of “detail report”.
Information 12 00463 g018
Publisher’s Note: MDPI stays neutral with regard to jurisdictional claims in published maps and institutional affiliations.