
A Generic Graph-Based Method for Flexible Aspect-Opinion Analysis of Complex Product Customer Feedback
by
 , , and
Michael Y. Kpiebaareh
1,* ,
,
Wei-Ping Wu
1,
Brighter Agyemang
2,
Charles R. Haruna
3 and
Tandoh Lawrence
1 1
School of Computer Science and Engineering, University of Electronic Science and Technology of China, Chengdu 610056, China
2
School of Computing and Information Technology (SCIT), University of Wollongong, Wollongong, NSW 2522, Australia
3
Department of Computer Science and Information Technology, University of Cape Coast, Cape Coast PMB TF0494, Ghana
*
Author to whom correspondence should be addressed.
Information 2022, 13(3), 118; https://doi.org/10.3390/info13030118
Submission received: 23 January 2022
/
Revised: 15 February 2022
/
Accepted: 21 February 2022
/
Published: 28 February 2022
(This article belongs to the Special Issue Text Mining: Classification, Clustering and Extraction Techniques)
Abstract
:Product design experts depend on online customer reviews as a source of insight to improve product design. Previous works used aspect-based sentiment analysis to extract insight from product reviews. However, their approaches for requirements elicitation are less flexible than traditional tools such as interviews and surveys. They require costly data labeling or pre-labeled datasets, lack domain knowledge integration, and focus more on sentiment classification than flexible aspect-opinion analysis. Related works lack effective mechanisms for probing the customer feedback of complex configurable products. This study proposes a generic graph-based opinion mining and analysis method for product design improvement. First, a customer feedback data preprocessing and annotation pipeline that can incorporate designer-specified domain knowledge is proposed. Second, an intuitive opinion-aware labeled property graph data model is designed to ingest preprocessed feedback data and perform ad hoc opinion analysis. Applying the generic model to a real-world dataset demonstrates superior functionality and flexibility compared to related works. A wider range of analyses is supported in a single model without repeating data preprocessing and modeling. Specifically, the proposed method supports regular and comparative aspect-opinion analysis, aspect satisfaction/influence ranking, opinion trend extraction, and targeted aspect-opinion summarization.
1. Introduction
Customer feedback is a vital source of insight for product design improvements. User-centric product designers improve products by adapting product features to meet the requirements inherent in customer feedback. The motivation of designers to satisfy customer requirements has never waned. They have relied on user-centric models such as the Kano [1], and QFD [2] for several decades to satisfy the Voice of Customer [3]. The process of product improvement increases in complexity if the product is configurable or multi-generational [4]. A component replacement or design change in such products affects related components. Choosing the correct features to improve helps manage risk and reduces the chance of product failure [5].
The benefits of adopting a user-centric approach include the ability to produce more efficient, effective, and safe products. Furthermore, the management of user expectations and satisfaction levels are handled more easily. Furthermore, products designed with user-centric methods demand less redesign and promote faster user adoption. Overall, the design process is enriched with more creative design solutions as compared to non-user-centric methods. Despite these advantages, care must be taken to avoid challenges posed by embracing user-centric approaches. For instance, there is a need to involve more stakeholders and additional team members. This results in a tendency of the approach to be more costly and time-consuming. Some challenges may also be faced in the collection and translation of data. Furthermore, the final product may be too specific to be attractive to a wider audience. The work by [6] discusses the subject in detail and provides recommendations to effectively balance the advantages and disadvantages of using user-centered methods.
The user-centric models use traditional tools, such as interviews and surveys, to gather vital customer feedback. These tools are flexible and intuitive because they offer direct interactive customer access. With traditional tools, designers take a question-first approach. They prepare questions to solicit responses for specific topics or intuitions they wish to investigate or verify. They use closed-ended questions to extract facts, while open-ended questions encourage people to dig deeper to disclose what they feel is essential. Open-ended questions can be explorative, affective, reflective, probing, analytical, or clarifying [7]. Designers have the opportunity to shape the type and quality of responses. However, they fall short in the face of phenomena such as globalization, shorter product life cycles, and the bourgeoning trend for individualization [8,9]. They require a high level of domain expertise, high cost, and time-consuming processes [10]. Furthermore, they are only suitable for gathering feedback from a small sample size of respondents. These limitations have significantly changed the product design and research community’s approach to managing customer feedback data. In addition to adapting product designs to customer needs, user-centric product experts must also adapt their data collection and analysis methods.
Ecommerce, social media, and other online platforms have grown as an alternative data source of customer feedback. They offer opportunities to circumvent the limitations of their traditional counterparts [11]. More data are sourced faster and more cost-effectively without limitations on time and location [12]. Furthermore, sources such as Online Product Reviews (OPR) enable the implementation of automated requirements engineering from user feedback [13,14]. Furthermore, it is workable to use OPR to support the development of competitive products [15]. They contain customers’ opinions, which help identify weak and robust performing features. Despite all these benefits, using alternative feedback sources such as OPR to generate insight for product design is challenging.
A data-first approach is essential to working with OPR. Probing a large corpus of product reviews for insight differs from interacting directly with customers. Designers need to process and analyze the data to ascertain whether or not they contain information that answers their questions. Product experts from different domains require unique insights to make informed decisions. Consequently, they have different objectives, questions, and interpretations of what makes a successful product. Product reviews contain people’s affective comments about a product. The answer to each question is related to a pattern hidden in the data. Design experts need to expose all the information within a corpus of customer reviews to flexible ad hoc analysis.
The flexibility to ask follow-up questions in an interview is unavailable when working with extensive textual feedback data. Each interaction with the corpus requires substantial effort to obtain results. Such a scenario requires the ability to efficiently link the answer of one question with the facts of the follow-up questions. It is also challenging for product designers to track customers’ opinions over time. The product deficiency that concerns customers most in summer may not be a significant concern during winter. In addition to time-oriented tracking, it is also challenging to determine how a customer perceives multiple product features collectively. This is important for understanding opinions on complex products whose components are bound by strict functional and design constraints. Even though it is easy to search for the occurrences of words in a text corpus, finding specific instances of a word (feature) with a particular sentiment orientation is non-trivial. A sentiment-oriented search is needed to identify and quantify customer opinions of specific product aspects.
1.1. Problem Statement
Product designers should have frameworks for flexible processing and analysis of online customer feedback to support product improvement. Such frameworks should support the analysis of the interrelationships among the aspect-opinions of complex products. Different kinds of analyses should be supported to answer a wider variety of questions. Where possible, the flexibility should be similar to that of traditional requirements elicitation tools. The use of online product reviews as a source of customer feedback has gained the attention of product design researchers. However, most of these works have skewed their focus on sentiment classification and simple sentiment summaries. The research on analyzing the resulting knowledge from techniques such as aspect-based sentiment analysis is limited.
Previous studies proposed ways to use sentiment analysis to augment user-centric models and design techniques [16,17,18,19]. The extraction of customer opinions to support product design has also gained considerable attention from researchers [10,20,21]. However, these studies lack mechanisms that give product experts the flexibility to pre-process and label data according to research objectives. They do not offer the product expert a mechanism to determine the direction of analyses processes. Furthermore, they do not permit analyzing the aspect-opinion results for ad hoc patterns. These works focus more on computing sentiment scores for product aspects and usually conclude by presenting simple sentiment summaries. The current trend is not suitable for complex product feedback analysis. Using unstructured textual data such as OPR implies sacrificing the flexibility and intuitiveness accompanying tools such as interviews and surveys. It also means doing without the convenient customer targeting and generalization that are value propositions associated with surveys [11].
Therefore, our research on a flexible aspect-opinion analysis framework is imperative for consolidating the benefits gotten from using online data. Product designers will benefit from the flexibility to process and label data according to research objectives. They will also benefit from filtering, matching, and extracting arbitrary patterns commensurate with questions that elicit affective responses in interviews and surveys. Without reprocessing data, these features improve the flexibility of analyses by permitting a more comprehensive range of analyses than related works. Specifically, our method performs regular and comparative aspect-opinion analysis, aspect satisfaction/influence ranking, opinion trend extraction, and targeted aspect-opinion summarization.
1.2. Objectives and Contributions
Our objective is to drive more flexibility into the analysis of product reviews for product improvement. We aim for a method that increases the convenience of processing and using the resulting data and knowledge from aspect-based sentiment analysis. We propose a novel labeled property graph model for aspect-opinion analysis of customer feedback. Our approach transforms the online customer reviews analysis challenge into a network analysis problem. With this approach, our solution can support ad hoc search, pattern matching, filtering, and the analysis of the interrelationships among customers’ opinions. We populate this graph model with a data processing pipeline that captures the essential details of the problem domain.
The details captured by our scheme include reviews, sentences in reviews, keywords in sentences, the position of keywords in sentences, part of speech of keywords, sentiment scores of keywords, and classes of keywords. We expose these details to expressive graph analytics by tying them with relationships in a labeled property graph model. However, before the graph is built, we employ data programming to help annotate the dataset according to domain expertise. This annotation method reduces the burden involved in annotating a large dataset. Furthermore, we propose an aspect-polarity prediction workflow that detects aspects and predicts their sentiment scores. The workflow is designed to output a dataset appropriate for populating the labeled property graph model. We also provide detailed examples of how the model answers questions beyond the simple opinion summaries prevalent in related works. In particular, our method performs regular and comparative aspect-opinion analysis, aspect satisfaction/influence ranking, opinion trend extraction, and targeted aspect-opinion summarization.
Our proposed method is essentially based on end-to-end lexicon processing. This limits its ability to capture and analyze implicit constructs. All analysis can therefore be done only by explicit keyword expressions. We recommend how this limitation could be resolved in the concluding part of this work.
We organize the rest of this paper as follows. In Section 2, a discussion is given of some related works in the application of opinion mining to product or service improvement. In the next Section 3, we present various preliminaries and salient concepts of our proposed method. These include aspect-based opinion mining, data programming, and weak supervision. We also discuss labeled property graphs and their accompanying graph traversal and filtering tools. We detail the application of the proposed framework to a real-world use case in Section 4. A discussion of the significant findings of the research is presented in Section 5. We conclude our work in Section 6.
2. Literature Review
2.1. Aspect-Based Opinion Mining
The main focus of sentiment analysis (also known as opinion mining) is opinions that indicate positive or negative sentiments. It is the field of study that “analyses people’s opinions, sentiments, evaluations, appraisals, attitudes, and emotions towards entities such as products, services, organizations, individuals, issues, events, topics, and their attributes” [22].
The key levels at which opinion mining is done are document, sentence, and entity/aspect. Entity and aspect level opinion mining is the only one deep enough to uncover the exact thing that people like or dislike. In other words, document and sentence level opinion mining fails to identify the targets of opinions or assign sentiments to such targets. Aspect level sentiment analyses employ a more fine-grained approach by focusing directly on the opinion itself rather than pieces of language constructs such as paragraphs, clauses, or phrases. It emphasizes the importance of the targets of the expressed opinion [23]. For instance, in the sentence, “the color of this laptop is terrible, but the backlit keyboard is perfect for me”, the opinions on “laptop” and “backlit keyboard” (keyboard) are negative and positive, respectively. The overall sentiment of the sentence, whatever it may be, has an ambiguous relevance for product design improvement.
There are two main ways to classify opinions [24]. First, depending on the number of aspects they convey sentiment on, they can be regarded as regular or comparative opinions. Comparative opinions compare several entities based on a shared aspect. In contrast, regular opinions express sentiment on a specific entity or property. Second, they are described as explicit or implicit depending on how they are expressed. The two main vital tasks for aspect-based sentiment analysis are extraction and aspect sentiment classification.
The techniques mentioned so far are based on the assumption that people express sincere opinions. However, studies have shown a discrepancy between people’s actual opinions and publicly expressed ones. This gap is often caused by people being influenced by the views of others or the need to withhold their real feelings. The need to bridge this divide is also an active area of research in aspect-based opinion mining [25,26].
2.2. Sentiment Analysis for Product Design
The formulation of closed-ended survey questions limits the usefulness of the insight in the responses. Primarily, the process assumes the customers care about the features mentioned in the survey [27]. There is more value in collecting customer feedback in an unguided manner. Thus, more open-ended questions are preferred since they encourage more sincere user input quickly and efficiently. This requirement motivates the heightened interest in analyzing data sources, such as social media and online reviews. Other motivating factors are the benefits gained from the faster and less expensive data acquisition processes these online data sources present. Researchers and industry experts need to surmount the challenges of analyzing unstructured and opinionated customer feedback data to access these benefits.
The literature on aspect-based sentiment analysis is quite extensive. This section focuses on studies that have proposed solutions for extracting insights from unstructured textual customer feedback to support the product or service design process. A fundamental task in enhancing product design is to extract user requirements from a corpus of customer statements. The general steps include applying various techniques to perform product aspect extraction, sentiment classification, and opinion summarization. Some research has focused on extracting user requirements to support the early stages of product design [28]. The frequency of features with positive sentiments is used to estimate and weigh the significance of customer requirements.
A semi-automated systematic approach to support designers in the decision-making process was proposed in [29]. First, the authors created a dataset by crawling 264 customer reviews from the web. Second, they subjected product review to Document-Level Sentiment Analysis (DLSA). The third processing step involved a round of Aspect-Based Sentiment Analysis (ABSA). A domain-specific lexicon was used with a user-defined dictionary for the ABSA task. The ABSA operator feeds on a generic opinion lexicon to detect sentiment words. Furthermore, the work focused more on finding the cause-effect of the pros and cons through Correspondence Analysis (CA). It is unclear how the solutions will perform over a larger corpus of several thousands of reviews. The results of the data-driven CA require further intervention by the design engineer. The proposed scheme does not give product designers a way to query patterns of their choice. Furthermore, they have no way of deciding the level of granularity for performing sentiment analysis.
The proposed work by [15] deals with revealing new insights to aid product design through a combination of online product reviews, design theory method, and data analytics. It uses a statistical approach for analyzing product reviews. The study extracts feature-sentiment pairs after a trained model predicts sentence sentiments. The authors identify correlation for feature-sentiment pairs on the assumption that the small size of sentence arrays gives better accuracy on average. In addition, the framework used the frequency of distinct feature pairs as a sign of their significance. However, a simple frequency count in information retrieval is not a good indicator of relevance or significance in large corpora. Overall, the framework performed the defined task without giving the designer enough control over the direction of data processing. Furthermore, it lacked variability in the analytics possible. A designer using this scheme has no way of probing further by asking questions or querying along multiple dimensions. This required flexibility is akin to using traditional surveys and focus groups. They limited the analysis to feature-sentiment pairs and touched little on the product aspect classes.
Although a product can be enhanced by improving its robust features, other works take different approaches. For instance, studies such as that in [30] try to use approaches such as topic modeling and sentiment analysis to reveal opportunities (new features) for design improvements. On the contrary, other works such as that of [31] focus on finding obsolete functions of products to improve the design. In [32], research takes on providing information about the weakness of the product. It proposed an opinion-aware analytical framework that uses a combination of sentiment analysis and network analysis to detect product weakness. It takes into consideration both comparative and non-comparative opinions. The work significantly leverages the comparative statements discussing two products to create a network where vertices are of the same type (products) and sentiment strength serves as weights for edges. The Page Rank algorithm is used to compute the authority of vertices. It relies mainly on the content of the reviews. Although it is related to product design, the results are more suitable for customers than designers. It provides limited options for engineers’ input and intelligent querying. The product improvement strategy in [33] relies on the combination of the conjoint analysis model and the traditional Kano method. It consumes each review as a stimulus perceived by the customer. It takes the sentiment of the text as the consumer’s utility. Three preference models (i.e., vector, ideal-point, and part-worth function models) are used in the conjoint analysis. The proposed attribute or product aspect identification and sentiment analysis methods do not incorporate the product research plan of the design expert. They depend mainly on the term frequencies and their inter-semantic relationships as Latent Dirichlet Allocation and Page Rank inputs. Moreover, extra effort from design experts was then used to scale down the discovered terms from 4105 to 1123. For design domain experts, it seems counterintuitive to visit the review corpora first for insight into product aspects or their keywords/synonyms. Their work also relied on the naïve summarization of simple tallies. This approach does not lend itself to expressive querying to glean insight into relationships between subcomponents of configurable electronic devices.
A framework was proposed in [34] to track the trends of customer requirements as well as make product comparisons for product design. Their framework employed Part of Speech tagging and WordNet lexicons to extract product features from reviews. The framework used frequent nouns as seed words to identify aspects. The identification of aspects is preceded by stopwords removal and stemming. These processing tasks are necessary for the semantic clustering of words that follows. They then used a pre-labeled dataset to train a Naïve Bayes classifier for predicting subjective and objective sentences. They combined the subjective representation of sentences and the WordNet lexicon to build a Naïve Bayes sentiment classifier to predict the sentiment polarities of product features. To analyze the dynamics of customer requirements over time, the authors proposed a Kalman filtering [35]. This approach relies heavily on prelabeled datasets such as the previously discussed literature. Furthermore, it presents only simple opinion summaries, which are inadequate for complex product design. The study in [36] built a structured preference model centered on sentiment orientation analysis to determine candidate features for improvement. The study constructed a re-design index and a target feature selection model to weigh the feature re-design priority and to identify candidate features in the presence of various factors. The shortlisting of candidate features was implemented whiles considering the factors of engineering cost, re-design lead time, and technical risk.
The application of fuzzy logic and theory has been helpful in some research studies for analyzing customer feedback for product design. The work in [37] proposed a method for investigating the preferences of consumers with a focus on product design. The approach combines sentiment analysis, fuzzy set theory and uses evidential reasoning as an optimization algorithm for analyzing user-generated content. It essentially shortens the time to review the content and summarizes the results according to the domain expert’s prescribed criteria. The criteria are a shortlist of extracted keywords from the user-generated content. Opinion summaries are valuable outputs of methods that process large volumes of opinionated text. However, it is necessary to further analyze the opinion-based interactions between product aspects when working with complex configurable products.
A dynamic evolving neural-fuzzy inference system was proposed and applied to extract customer preferences via opinion mining [38]. Their proposed scheme is an adaptive neuro-fuzzy inference system that processes product attribute values and the mined time series data. Similarly, [39] proposed an approach to dynamically mine user requirements the categories of user attributes, common attributes, and manufacturer attributes. Attribute weights are assigned by the Term Frequency-Inverse Document Frequency (TFIDF) method. In [40], the presented a fuzzy rough set time series method that combines the results of google trends with opinion mining of online reviews to forecast the importance of product attributes.
Information gathered from social media has also helped support New Product Development decision-making in an automotive industry use case [41]. Their suggested design process is assisted by applying a sensemaking approach. The authors used Fuzzy logic to perform mining and measurement of the variations of customer sentiments in all the stages of the new product development to identify sensemaking patterns. The automotive industry currently churns out highly complex and configurable products. The analysis in this proposed approach deals with individual aspects of the products in isolation. Automotive components are interrelated in function, position, or appearance. Therefore, experts gain less insight if they analyze user sentiment probing the emotions on specific aspects relative to others. Such an added analytics functionality will be beneficial in cases where the change in one feature may require a justified change in a related feature or component.
Social media platforms have also served as a data source for sentiment analysis for product design improvements. Sentiment analysis has been influential in the analysis of feedback for the design of Product Service Systems (PSS) [42,43]. Ref. [44] focuses on simplifying the information search process for designers by proposing a method to merge and present product design-related insights from social media. The method was applied to the re-design of PSS whiles considering user feedback from multiple sources. The study proposed an opinion extraction tool with a filtering functionality to enable PSS experts to filter information along several dimensions, such as gender, location, and final product.
The New Product Development (NPD) research domain has also benefited from the analysis of unstructured textual feedback provided by stakeholders. The popularity of product features among social media users was measured through sentiment analysis to aid in decision-making in (NPD) [45]. However, the proposed approach requires the intervention of domain experts to prune the list of commonly occurring aspects in a manual activity that produces the most common features. These features are then weighted against their frequency rates to measure their association with the proposed features.
Textual customer feedback is also applicable to evaluating user experience in the product design research space. Some researchers adopt metrics such as the rating score, number of stars, or sentiment score of a review to measure a customer’s satisfaction. Adopting such a holistic approach is valid for extracting the overall opinion on a product or comparing the general customer opinions on the design of similar products. However, its effectiveness is limited for supporting design decisions because it does not provide information about particular product aspects. In essence, there is a failure to determine the features customers like and dislike. To resolve these challenges, other researchers take an approach that breaks user experience down into evaluative constructs representing interaction with individual aspects. For instance, the work by [46] offers a way to extract essential elements that enable analysis and understanding of user experience from social media data. Once again, the results are a simple tally of feature sentiments. Their method does not allow related features to be analyzed concurrently interdependently. A critical task in using opinion mining for product design is in summarization, and sampling [10]. It is especially in this task that this paper identifies an opportunity for improvement. Both review summarization [47], and hierarchical organization [48,49,50], have a level of granularity such that they operate at the document level. Inherent relationships exist between specific product aspects. These relationships are imbibed in the way customers comment about them and how they interface in the product’s design. Therefore, a more granular approach with functionality to analyze this connectivity is needed. A typical pattern is apparent in recent related works where the eventual results of proposed schemes are based on simple opinion summaries. They cannot give the user the flexibility to perform investigations on product reviews along multiple dimensions of inquiry.
The study in [51] investigated and quantified the effects of product attributes on customer satisfaction by applying regression and sentiment analysis. Their regression model was based on customer satisfaction results from the sentiment analysis and product features. However, the regression analysis on customer satisfaction results was carried out at the sentence level. The authors judged the proportion of satisfied customers by the number of positive review sentences. The analysis was not done at the aspect level and hence does not give product designers direct access to what features customers liked. The framework proposed in [52] extracted information from online product reviews and verified its helpfulness to designers. Helpful reviews are classified as positive, while non-helpful reviews are classified as negative. The authors trained a prediction model on helpful/non-helpful reviews from amazon with a CNN on word2vec embeddings. The framework provides a way to perform sentiment prediction but only at the sentence level. The aspect extraction that followed is disjoint from the sentence sentiments. This makes it challenging to determine customers’ opinions at a fine-grained level.
3. Materials and Methods
3.1. Preliminaries
3.1.1. Flexible Analytics and Complex Products
According to the European trademark and design right laws and guidelines, a complex product means “a product which is composed of multiple components which can be replaced permitting disassembly and re-assembly of the product” https://ipright.eu/design-regulation/en/Article-3, accessed on 5 December 2021.
This work targets products with multiple components that accommodate alternatives to various components. With such products, replacing one component version with another creates a different product variant. This kind of complexity is prevalent in the mass customization and personalization domains. In such a case, customers’ requirements need to be reconciled with the structural and functional dependencies dictated by the product’s design. Although multiple stakeholders may give feedback on the same product, they may most likely refer to different product variants. An intuitive data modeling and corresponding analytics capability are required to handle the complexity of the product and the complex nature of unstructured text by which customers express themselves.
Flexible data analytics can easily and quickly use data analytics without pre-processing or redesigning data models to fit new lines of inquiry. It supports ad hoc reporting and insights into specific trends and reduces time loss. Such an approach can effectively enable experts to perform analysis and execute ad hoc queries based on the relationships inherent in the problem domain. This approach, however, should go beyond simple aspect-opinion tallies of negative/positive counts for a particular aspect. For instance, where two product aspects are related in design schematics, it implies a design change of one affects the other. A design expert may want to know how one aspect is perceived relative to the other. Previous works do not show a clear path to asking and answering these questions from unstructured text.
3.1.2. Data Programming
How an analytics framework deals with preparing data for consumption plays an important part in providing the needed flexibility to users. It is neither fast, easy, nor cheap to produce high-quality training sets in large volumes for machine learning. Hand-labeled training sets are susceptible to bias of human heuristic understanding and inconsistencies in accuracy and performance. Hence there is a risk in using labelers who may or may not be domain experts. As in most computer systems, the human factor is more often than not the weak link. Where the needs of applications change, new or modified training sets are often needed. Substantial effort has been made to automatically label data in various domains including topic models [53,54], cyber security [55], semantic roles, [56,57] and speech analysis [58].
A paradigm such as data programming can be applied [59] to reduce the risk and cost. Data programming enables the programmatic creation and modeling of training datasets whiles providing a unifying framework for weak supervision. Weak supervision is about “leveraging higher-level or noisier input from subject matter experts (SMEs)” [60]. It serves as an exemplar with which user-defined programs called labeling functions are written to provide labels for some respective subsets of the data. Labeling functions can be written to represent weak supervision approaches such as distant supervision [61] which depend on existing knowledge-bases [62]. Crowdsourcing labeling tasks that depend on the labels from many data labelers can also be expressed as labeling functions. Furthermore, a combination of domain-specific patterns and dictionaries can be captured conveniently as labeling functions. Collectively, these labeling functions generate large training labels. However, these training labels may be noisy, emanate from multiple sources or views, and potentially overlap. This implies the possibility of labeling functions conflicting on some data points and having varying error rates.
Learning the accuracy of labeling functions together with their correlations enables the automatic denoizing of the training sets [59]. A data programming framework achieves this by modeling labeling functions as a generative process [59,63,64]. Furthermore, a dependency graph can represent naturally occurring or deliberate user-induced dependencies among labeling functions. A label function dependency graph over the labeling functions is then formulated as a directed graph where each edge is connected to a dependency type. Solving the resulting problem can be done by leveraging a Gibbs sampling of the distributions used in gradient descent.
3.1.3. Labeled Property Graph
The main components that make up a property graph are a set of labeled edges for which both the edges and their constituent vertices have properties assigned. Formally, a set of vertices V, a set of directed edges E (i.e., with implying existence of multiple relations, a collection of edge labels (i.e., ) and a mapping (i.e., ) from elements to keys playing the role of properties, all together define the labeled Property Graph, . The resulting construct, a multi-relational property graph, presents enough flexibility to expediently model complex domains into efficient, searchable spaces [65,66,67].
3.1.4. Graph Traversals and Property Graph Filters
Based on a functional flow-based approach [68], single-step traversals can be defined over multiset domains and ranges. This approach allows for repeated element types along the navigation path [69]. Graphs traversals refer to the visitation of graph elements algorithmically. The power of set X is denoted by and is the set of all subsets of A (i.e., ). The incoming (i.e., ) or outgoing (i.e., ) edges of a given vertex can be found by traversing to them. Given an edge, it is possible traverse to its head (i.e., ) and tail (i.e., ) vertices as well using a similar single step traversal approach. The properties of an element (i.e., ) assigned to vertices or edges can be reached for key values .
Property graph modeling has been chosen for this work because of the flexibility and expressiveness it provides through filtering at varying levels of granularity. Filtering can be conveniently carried out on properties the key with . Furthermore, edge label , it can be allowed or filtered out (i.e., ). This can also allow or filter out a provided element by using an operation such as .
3.2. Graph-Based Opinion Mining and Analysis Framework
3.2.1. Problem Formulation
This work proposes a data management and analytics framework that enables product design experts to perform ad hoc analysis and reporting on unstructured textual customer feedback data.
A product is a collection of various functions desired by customers. The features or functions of a product constitute the central point of interaction between customers and product design engineers (shown in Figure 1). For these two groups of stakeholders, product features embody desire, communication, and design. One of the aims of design experts is to identify and adopt design solutions that satisfy customers’ desires. In the context of product improvement, the design process evolves the functionality of a product. It is the task of making bad features good and making good features great. However, before proposing design improvement solutions for multigenerational products, the opinions and desires of the customers concerning the current product lines must first be understood in great detail. Since these desires are expressed in massive bodies of text, they must first be extracted and analyzed to scrutinize the complex interrelationships among the various products. Another challenge is that textual data sources are unlabeled and not curated. Online data sources are challenging to use because there are unlabeled and not curated. A solution is needed to enable the design engineering team to generate training sets quickly, perform product aspect-based sentiment analytics, and provide decision support for product improvement. We leverage the domain expertise of designers and lexicon-based methods to extract insight in an end-to-end fashion.
In the rest of this section, we present a detailed description of the various parts of our proposed solution. We describe the inputs, the pre-processing tasks, and the expected outputs of the whole model. We then present the various processing modules for generating the desired outcomes.
3.2.2. Required Input
- Domain knowledge: There are a limited number of keywords used to describe a particular product and its components. These may include standard lexicon used by industry experts and jargon adopted by the user community. Domain experts are privy to such vocabulary and are empowered to compile the needed set of domain knowledge to describe a product and its components. The information is fed into modules B and C as ②. This activity provides the needed information for conducting a semi-supervised topic annotation. Fully unsupervised topics models such as LDA [70] fail to produce coherent results in domain-specific applications [71].Our approach avoids the incoherence induced by the non-uniform application of data labeling rules through human labeling. The challenge of devising methods to limit the resulting lexicon space to those related to the product domain is not applicable.With enough expert knowledge about a given product, the number of topics and the associated vocabulary and nuances are known in advance to a satisfactory level of detail. This is especially relevant if product designers need to study particular product features as part of their research goals.Therefore, we model the problem as one first requiring a solution to labeling user sentences according to a product designers’ preferred product aspect domains and research objectives. The basic concepts of the domain knowledge formulation approach are described as follows:
- −
- Product aspect classes: Aspect classes represent the various parts or components of a product whose customer opinions design engineers wish to collect. The selection of these aspect classes is specific to both the product and its domain. They represent a particular context or feature of the product.Since they represent candidate features for improvements, they could also be specifically targeted parts for analysis and insight generation. For instance, if engineers want to know what customers feel about the OPTICAL DRIVE on a laptop computer, it will be classified as an aspect class. The collection of q of such classes and their associated keywords forms the label space = .
- −
- Product aspect keywords/terms: These terms or keywords are domain-specific words used to describe the various components and functionality of a configurable multigenerational product. These are keywords that customers and industry experts use to describe the various aspects classes of the product. Each keyword is linked to a specific aspect class, and multiple keywords are often linked to a single aspect class. The combined list of keywords from all aspect classes directly translates into the search space. For instance, the associated keyword/term list for the OPTICAL_DRIVE could be OPTICAL_DRIVE=[“optical drive”, “optical drives”, “dvd”, “dvd drive”, “dvd/cd”, “cd_rom_drive”, “cd rom”, “videodisk”, “videodisc”, “superdrive”, “compact disk”, “compact disc”].
- −
- Rules or constraints: these are the rules used to govern how keywords relate to a specific aspect class. For instance, ‘windows’ could refer to a part of a building or an operating system in the laptop product domain.
- −
- Domain specific dataset: this type of data is representative of the product domain. It ideally contains the required lexicon for describing the product and its various component. This dataset can be a collection of product manuals and other documentation or a collection of pre-labeled review datasets of products in the same domain. The proposed framework will apply a domain knowledge-based automated data labeling process on this data to produce a label.
- Product review data: This dataset represents a collection of real customer reviews of a specific product and is fed into module A as ① according to Figure 2. Customers’ opinions and feedback are essential information required by design engineers to validate their products for a product. This feedback is required in the testing of product prototypes. However, it is also needed to improve existing products and services. Call center and CRM logs are some sources to obtain such data. In this framework, we rely on product review data. Such data are readily available and faster, easier, and cheaper to collect than surveys or questionnaires.
3.3. Processing Modules
This work proposes a modular approach to solving the formulated problem. Altogether, the proposed architecture has four (4) processing modules. The core task of each of the modules can be solved in various ways. We adopt a comprehensive end-to-end lexicon-based approach for all modules. We select and deploy methods that enable the modules to conveniently consume data from the preceding modules and pass on accurately formatted results to the next. This section gives a brief description of the goal of each module and its corresponding methods.
3.3.1. Module A: Data Pre-Processing
These are natural language processing pipelines that feed subsequent modules in the architecture with clean data. The expected input data to this module include review data and other forms of data that express opinion or sentiment about a product or service as described in Section 3.2.2.
- Sentence extraction: this stage breaks down the various statements or documents about a product into sentences. The raw segmented sentences shown as ③ in Figure 2 are sent to the model for automated labeling.
- Pre-processing pipeline for aspect-opinion polarity prediction: for this pipeline some extra steps involving Part Of Speech tagging followed by tag extraction is applied to each sentence. The list of tags according to the Stanford-POS tagger [72] https://stanfordnlp.github.io/CoreNLP/pos.html, accessed on 5 December 2021, is [‘NN’, ‘NNS’, ‘NNP’, ‘NNPS’, ‘RB’, ‘RBR’, ‘RBS’, ‘JJ’, ‘JJR’, ‘JJS’, ‘VB’, ‘VBD’, ‘VBG’, ‘VBN’, ‘VBP’, ‘VBZ’].
3.3.2. Module B: Automated Data Labeling
Design engineering experts need the ability to rapidly create training sets to create machine learning solutions that perform analytics on customer feedback. Instead of manual labeling, we opt for an automated approach through the use of a set of heuristic rules called labeling functions (LFs) [73]. This approach avoids the errors and inconsistencies prevalent in hand-labeled training examples with numerous data annotation rules.
Domain knowledge associated with various product features under investigation constitutes domain heuristics. Label functions are defined to encode these domain heuristics to provide (non-zero) labels to a subset of the unlabeled data points. The key is to construct high-accuracy and high-coverage labeling functions. Approaches applied in the definition of LFs include heuristic pattern matching, distant supervision, ensembling weak classifiers, low resource, medium resource, and high resource [73].
Each labeling function has some probability of labeling an object whiles the probability of assigning this label correctly is given by . The distribution of the model is given by Equation (1) where represents the output over m objects by a labeling function whiles is the predicted class. For a scenario where and are assumed to vary, Equation (1) specifies a family of generative models.
Equation (2) captures the essence of the problem to be solved when using maximum likelihood estimation to learn the parameters (, ) for a particular unlabeled training set S⊂. The is resolved by applying stochastic gradient descent (SGD). SGD is used to maximize the probability that the observed labels of the training set occur under the generative model expressed in Equation (2).
3.3.3. Module C: Aspect-Opinion-Polarity Prediction
As shown in Figure 2, this model takes as input the labeled sentences ④, the class labels, and the corresponding aspect keywords ② from the domain knowledge base.
The output is a sentiment score for each feature keyword found in each sentence. For each labeled class, the algorithm searches its aspect keyword space for the keywords within the sentence. It then applies the three steps below according to Algorithm 1 to determine the final polarity on each aspect within the sentence. We use the VADER lexicon-based semantic library (VADER (Valence Aware Dictionary and sEntiment Reasoner)-https://github.com/cjhutto/vaderSentiment, accessed on 5 December 2021) for our work. It performs well on online reviews and social media source corpora [74].
- Segmentation sentiment score function: this step segments sentences according to the comparison words found in them. Comparison words such as [but, however, albeit, although, in contrast, despite, though, on the one hand, on the other hand, then again, even so, unlike, while, conversely, nevertheless, nonetheless, notwithstanding, yet] are used as a point of reference to split sentences. Searching the resulting segments for aspect keywords reveals which segments contain aspect keywords. Once the right segments are identified for the aspect keyword in focus, the sentiment score is computed.
- Proximity sentiment score function: This algorithm uses a propagation variable to incrementally expand the word neighborhood of an aspect keyword found in a sentence. It works with the limits of the set propagation variable. It then adds up the sentiment of each neighborhood with decay as the neighborhood increases.
- Dependency sentiment score function: the dependency relationships between words in a sentence places adjectival words/phrases naturally close to the targets (nouns) they describe. Each word apart from the one designated as the root has a single parent. This results in a tree-like structure called the dependency tree from a process known as dependency parsing [75].This procedure is applied recursively based on the number of times a target word appears in a sentence. Words may be far apart in terms of their distance in the sentence, but they may be semantically close in terms of context. In this regard, the technique used to identify the relationship between two entities in a sentence is the use of the Shortest Distance Path computation (SDP) [76]. This approach resolves scenarios that proximity and segmentation sentiment score functions cannot handle, as it correctly associates nouns with adjectives.
- Aggregate sentiment score function: the main task of this function is to compute the average of scores obtained from the three functions. The final score represents the opinion on a particular aspect in a sentence. The steps are enumerated in Algorithm 2.
3.3.4. Module D: Flexible Opinion-Aware Analytics
To perform flexible analytics on the product research dataset, we model the network of relationships for sentences, aspects, opinions as a labeled property graph. In this model, each path (arbitrary step length paths) between a pair of vertex sets is regarded as a bipartite labeled property graph [77]. The example is illustrated in Figure 3 shows the connections between the set of sentences and the set of aspects/keywords. It represents a bipartite graph of a single step traversal extracted based on the proposed schema illustrated in Figure 4. Possible pairings could be Review-Sentence (single step length), Review-Keyword (2 step length), or Review-Class (3 step length).
| Algorithm 1: Algorithm for generating a dataset for a labeled Property Graph-based customer reviews analysis model. |
 |
| Algorithm 2: Sentiment Aggregation Algorithm. |
 |
The main reason for this graph-based approach is that graph databases and graph theory are well suited to modeling problems inherently characterized by many relationships. Graphs are a powerful modeling tool for product feature models and natural language. This phase aims to create a simple and flexible framework to answer a wide range of queries. The evaluation of our framework in Figure 4 is conducted to confirm its ability to analyze the interrelationships among the aspect-opinions efficiently. The analyses are based on customer feedback, product design constraints, and feature relationships.
The proposed model is designed to capture and harness the natural hierarchies and relationships that exist among the various entities which make up a review (listed in Table 1). Reviews are made up of sentences, and sentences are composed of a group of words. Some of these words are aspect keywords on which the sentences express opinions. Aspect keywords, in turn, belong to specific classes.Each entity, whether vertex or edge, may have some attributes. For instance, the review ID (“review_id”) and date of review (“date”) are extracted from the dataset. Furthermore, the aspect polarity is obtained through aspect-opinion polarity prediction, whiles the number of the reviews where classes are co-mentioned is derived through the counting of matching patterns.
3.4. Expected Output
- Aspect-opinion-polarity graph dataset: this dataset is the result obtained by applying modules A, B, and C from the proposed framework in Figure 2. Based on the predicted aspect classes of a review sentence, the algorithm extracts aspect keywords and predicts the sentiment as aspect-opinion-polarity. Polarity represents whether the sentiment on the aspect keyword is positive, neutral, or negative. The procedure involved in generating the complete graph dataset is given by Algorithm 1. The dataset captures the notion that reviews are composed of sentences, sentences express opinions on one or more keywords. It also considers that the keywords belonging to specific aspect classes have a polarity score based on the expressed opinion. Fundamentally, the application of the labeled property graph-based analytics model for customer reviews should answer the basic questions posited in Section 3.3.4.
- Analytics: the framework is expected to be capable of providing an analytical and querying mechanism to answer a wide range of questions. As the main access point to all functionality within the framework, it is expected to support the provision of solutions to the questions itemized in Section 3.2.1.
3.5. Dataset and System Setup
A real dataset made up of 5000 customer reviews of the Samsung Chromebook (Wi-Fi, 11.6-Inch) 2012 Model (ASIN: B009LL9VDG). Accessibility of data, sufficient product complexity, and the ubiquity of the product were the main considerations made before selecting to use data from the Samsung Chromebook. The laptop computer is a common device in daily life and hence presents a good opportunity to give our readers a fair chance to appreciate the application of our method. The complexity of how its various components fit together is not overly complex to the point that it may hinder the understanding of the intuition behind the method and the interpretation of results.
We used the Neo4j Graph database (https://neo4j.com/, accessed on 5 December 2021) for network data storage, and the Cypher Query Language [78] was used for modeling and graph pattern matching and traversals. The python-based client library and toolkit Py2Neo (http://py2neo.org/, accessed on 5 December 2021), which supports both Bolt (https://boltprotocol.org/, accessed on 5 December 2021) and HTTP were used to work with the graph database from within Python. The machine learning pipelines were achieved with the help of PySpark (http://spark.apache.org/docs/2.1.0/api/python/pyspark.html, accessed on 5 December 2021). The hardware system specifications are as follows: four NVidia GTX 1080Ti GPUs, one Xeon (R) e5-2686w v4 CPU, four 32 GB DDR4, one 1T SSD, and two 4T hard disks. Details on how to access the dataset can be found in the supplementary materials (Section 6).
A summary of the resulting database after data processing and graph modeling is shown in Table 2. Of the 193 aspect keywords, only 134 were referenced explicitly in the product’s customer reviews. The illustration in Figure 5 is a result of a subgraph extraction following the application of the dataset generated with Algorithm 1. It shows the various relationships captured as expected of the proposed data model schema in Figure 4. The proposed framework is tested in a use case of 5000 reviews distilled to 4325 after pre-processing. The final graph network contains 29,868 sentences, out of which 18,374 have explicit keyword mentions.
4. Results
This section applies our proposed framework to analyze regular and comparative opinions at the aspect level. Our approach allows designers to convert any question into a pattern and process it against the graph model to retrieve the results. We also deploy the framework to extract opinion trends and opinion-targeted phrase summaries. Network analysis is used to calculate the importance of apsect class under various sentiment contexts. These kinds of capabilities are vital for analyzing the customer feedback of complex products.
A customer review may contain opinions of the “brightness” (SCREEN class) and “battery life” (BATTERY class) of a laptop. By design and function, these two components are connected. One of the factors that affect the battery life is the configuration of the screen and its energy consumption. Before a change can be made, experts need to know the general opinion of all reviewers regarding these two components. It may also be necessary to investigate the comparative opinions of the battery and other features that affect its performance. The modular approach of our framework permits any aspect-opinion classification algorithm to be plugged into the aspect-opinion-polarity prediction Section 3.3.3 module of our framework. However, our proposed graph model leverages the underlying sentiment information for expressive ad hoc analysis instead of relying on only simple opinion summaries and feature tallying.
This section uses function composition to create graph traversals of arbitrary length. A function composition represents a formal description of a graph traversal made of multiple single step traversals explained earlier in Section 3.1.4. As a prelude to the traversals executed on the proposed model architecture, here (Equation (3)) is the composition for extracting the keywords mentioned in a specific sentence .
The function f traverses to the outgoing edges of the sentence vertex . It then filters to allow only edges with the label (This filtering shows what is possible but may not be necessary since only one edge type exists between sentence and keyword vertices in this model). It then traverses to the incoming vertices of those edges and finally returns the property of those vertices.
4.1. Regular Opinion Analysis
The use of regular opinion analysis helps to answer simple queries that are based on single aspects. A designer’s close-ended question could be framed as “Do you like feature X?" and accompanied with options that are interpreted as “POSITIVE”, “NEUTRAL”, and “NEGATIVE”. When the matched pattern is aggregated across the whole dataset or survey, it answers queries such as “How many customers like/dislike feature X?". This category of queries is necessary for the initial exploratory analysis of customer opinions. Having access to more information during the analysis improves the flexibility to support a broader range of questions and query refinement.
4.1.1. Aspect Keyword Analysis
The illustration in Figure 6 is typical example of the simple opinion summaries presented in related works. To extract the summary in Figure 6, first, the function of Equation (4) is applied to count the number of incoming (vertex in-degree) properties related to each of the 134 connected vertices. Second, a sort (A sort of the sum of all opinion polarities (positive, negative, and neutral) per keyword.) by descending order is applied to retrieve the top 20 keywords. Thirdly, these top 20 vertices are then fed through the traversal composition or if their in-degree counts from the previous computation is stored) which includes Equations (5) and (6) for positive and negative opinions, respectively.
4.1.2. Aspect Class Analysis
Figure 7 illustrates the class-opinion distribution summary of the entire dataset. To produce this result, the traversal composition based on Equations (7)–(9) was applied. Following the schema model, the traversal begins at the incoming edge of the selected aspect class vertex i. Through filtering (The edges are excluded.) operations, the traversal includes those edges labeled . The traversal then proceeds to the source vertices (These vertices denoted as in the traversal are the keyword vertices according to the LPG schema in Figure 4.) of those edges to access their incoming edges with label . The traversal ends by accessing the properties of the edges on that path. The property filtering is done at three levels of detail to capture essential information needed. The properties had values assigned during the operation of the aspect-opinion-polarity prediction module of Section 3.3.3. The function collects all properties without restriction while the functions and restrict the property by positive and negative ranges, respectively.
4.2. Comparative Opinion Analysis
Most network analysis techniques are developed for single relational graphs. For this reason, it is often necessary to go a step further to provide better insight when working with multi-relational graph models such as the one proposed in this work. This requires the exposure of multi-relational networks to single graph analysis techniques [67]. Here we do this through projections. Our model allows us to create bipartite graph projections (Review-to-Class) with all entities between the two sets making up the path. Furthermore, these paths are rich in properties and labels and permit the execution of filtering operations according to a wide range of criteria. These arbitrary criteria enable the creation of unique projections. As illustrated in Figure 8, data from four paths emanating from a single review shows the aspect classes mentioned in the sentences of the customer’s review. A path is valid if its classes and keywords are unique. Unipartite paths can then be formed by following valid paths from one aspect class to another.
Comparative aspect-opinion summaries are needed to analyze the opinions of a feature or set of features relative to others. The following are examples of typical question patterns.
- How many customers prefer feature X to feature Y?
- How many customers like feature X but not feature Y?
- How many customers like features [X, Y] but not Z?
- How many reviews have negative comments on at least two (2) features between month A and month B? (Identify critical reviews.)
Answering such questions requires tracking product aspects and sentiments in textual customer reviews. This cannot be achieved by manually reading a large number of customer reviews or performing a text-based search.
4.2.1. Comparative Aspect Keyword Analysis and Ranking
4.2.2. Comparative Aspect Class Analysis and Ranking
Given a pair of aspect classes , the traversal in Equation (10) finds the sentences S that have the relationship with their aspect keywords. Executing this traversal for all distinct aspect class pairs and sorting the results gives us the top 10 ten negative aspect pairs in Table 3. Flipping the signs of the polarity filters gives us the top 10 positive aspect pairs in Table 4.
We extract co-mention graphs similar to co-authorship graphs from the resulting bipartite graphs. Paths are valid for a pair of aspect classes if the same review references them. The path runs from the set of reviews through sentences and keywords to the aspect classes. The number reviews a pair of reviews has in common is used as the weight between the two aspect classes (Same analysis as in Table 3 and Table 4). These weights are used as input for the PageRank [79,80] algorithm. Figure 10 illustrates the results when total (positive, negative, neutral) polarity counts are used as weights for computing the rank scores. Since individuals write reviews, we assume the sentiment on each aspect expresses the level of satisfaction provided by the product aspect. In other words, the experiences provided by individual product features contribute to overall customer satisfaction.
Analyses such as the one conducted in [32] seek to find the weakness of a product through a definitive ranking of the aspects that have negative opinion polarity. Applying the appropriate pattern matching filtering (only negative opinions) operations can realize the insight shown in Figure 11. The reverse can also be produced for only positive opinions, as shown in Figure 12. This gives an indication of the most satisfactory product aspects to users. The analysis establishes that the most frequently mentioned product features are not necessarily the most influential.
4.3. Opinion Trends
As customer reviews are collected over time, it is beneficial to track the orientation of customer opinions during that period. The aspect-opinion information can be collected for visual trend analysis. In Figure 13, the negative comments count per month of the 2nd, 3rd, and 4th most influential aspect classes are illustrated. The data are obtained by filtering on the aspect class names and the negative opinion polarities of the aspect keywords. This gives the designers information on the most active periods and the quantity of attention the product attracted.
4.4. Targeted Aspect-Opinion Phrase Summaries
The ability to filter information under varying sentiment and aspect keywords context permits the extraction of specific sentences for further analysis. Figure 14 shows an aspect-opinion summary of sentences that had a negative sentiment on the charger class. In addition to the charger problems and wrong user manuals, reviewers were also concerned about their ability to watch youtube. They also lamented about dead battery problems. We chose to analyze data for the CHARGER class because of the significant difference in ranking between our networked-based result (Figure 11) and the simple frequency-based ranking (Figure 7).
5. Discussion and Limitations
We set out to drive more flexibility into customer feedback analysis tasks performed by product experts. This initiative involves supporting varying ad hoc queries and analysis without the need to repeat data pre-processing or data modeling. Our proposed framework enables design experts to automatically label and track relevant concepts according to product research objectives as part of data pre-processing. This is contrary to some related works which depend solely on pre-labeled datasets and do not consider expert input. Unlike [33] which requires experts to scale down the detected terms, our scheme enables inclusion or exclusion of terms and information based on the designer’s current line of inquiry. We also find the modular approach friendly to product experts with limited data science experience. The framework supports method substitution and graph model extension. Customer demographics, product sales, and engineering-specific data are viable candidates for graph model extension. Methods such as data labeling or aspect-based sentiment classification can be replaced with alternatives better known to design experts.
The framework considers aspect-opinion polarity prediction as a fundamental data pre-processing task. Related works focus on sentiment classification as the primary tool for online product reviews analysis. However, not all queries can be answered by only sentiment data. The proposed sentiment annotation module detects and tags designer-specified aspect keywords, aspect classes, and general nouns with sentiment polarity scores (negative, neutral, positive, and values). This module further integrates all the information constructs (Table 1) in a labeled property model for flexible analysis. The graph model exposes all the information constructs to search, filtering, pattern matching, and graph-theoretic analysis. This feature relieves product experts from dealing with large spreadsheets and copra of raw textual data.
Another upside of our approach is that, compared to related work, product design experts can use it to perform a broader range of analyses types.It supports analysis techniques such as comparative aspect-opinion analysis and aspect satisfaction/influence ranking that are required for complex products. This can verified from the comparison given in Table 5. Our method can also generate datasets to support other machine learning-based tasks. In our case, the aspect-specific sentiment trends extracted can be fed to times series models. In the product design space, related works use only regular aspect-opinion analysis as a standard way of presenting the results of sentiment classification techniques as well as recommendation for design changes.
The application of our work validates the efficacy of the network ranking approach for product features. Leveraging the flexibility of our graph model, we show it is trivial to support more expressive queries. By accessing common reviews between pairs of aspect classes, Table 3 and Table 4 are an illustration of simple counts of top 10 co-positive and top 10 co-negative aspect class mentions. This means that these aspect class pairs were mentioned concurrently in the same reviews with the same sentiment polarity. Based on this, it is realistic to envisage a similar result for cases where the pairs hold opposing sentiment polarity. This can be achieved by inverting the signs of the related property filters. Hence, our approach avoids relying on simple opinion tallies for ranking by leveraging a network analysis approach to measure the aspects’ influence in a specific query context.
Furthermore, our approach supports aspect-opinion trend extraction similar to related works [35,37,38] but differs in two ways. First, it goes further to allow this extraction over arbitrary domain property (time, sentiment, aspect keywords, and aspect class) filtering. Second, it does not go as far as the related work to predict future trends. However, extracting such arbitrary datasets makes it easy to try out multiple trend predictions based on the datasets.
A user can essentially query the resulting graph model for any patterns they desire. Such a feature is applicable where there is the need to reduce or avoid information overload, perform sentiment-based aspect search or analysis, and targeted sentence extraction. A wide variety of ad hoc queries ranging from individual aspect sentiment statistics to statistics based on their co-occurrence aspect-opinions is possible.
The application of the proposed framework in Section 4 commences by illustrating how it can be used to produce some metrics which are characteristic of those in related literature. Figure 7 shows the distribution of customer opinion-based interest intensity on the aspect classes. It is a simple summary of the aspects and their respective sentiment distribution across the positive, neutral, and negative sentiment classes. Designers can take this as a naive indication of the relevance of various aspect classes as far as the customer perception of the product design is concerned. We produce a similar summary for the top 20 most mentioned keywords in Figure 6. The appearance of keywords in the top 5 may be an initial indication of why the class has the topmost aspect class interest intensity in Figure 7. However, inconclusive as some mechanism for ranking needs to be applied to boost the confidence in such a hypothesis.
Salient points from the regular and comparative analysis are summarized in Table 6. The CHARGER aspect class which was ranked 16th according to frequency in Figure 7 is shown to be at the 2nd position when ranked overall opinion polarities (Figure 10). It serves as an influential source of frustration for users as it is the 3rd ranked under negative aspect-opinions. The FAN aspect class which was 12th overall reviews (Figure 7) is found at 2nd position when ranking is done for only negative sentiments (Figure 10). Although the laptop’s power is related to the CHARGER and BATTERY, the failures of the charger play a larger role in the problem. Overall, the BATTERY class has a better impression than the CHARGER class. The customers who have a problem with the battery are most likely affected because of charger problems. Targeted opinion summarization applied to the CHARGER class gives more clarity (Figure 14). The summary revealed that the instructions for charging are inadequate. The nontraditional port/hole was confusing for the users. The LAPTOP class is very general, appears at the top of most rankings, and is not a point of focus in our final analyses. The OS, CHARGER, and FAN classes present the best opportunity to improve the product. These three aspect classes are among the highest-ranked satisfactory aspects. They represent a point of division for the customers. Fixing issues related to documentation and user manuals could bring better satisfaction to customers and increase the overall rating of the laptop. The OS class should be given special attention since it is ranked consistently in the top 5 throughout. OS is the interfacing module for almost all operations on the laptop. Resolving user challenges in this class can improve general customer satisfaction. Frequent phrases with negative sentiment in sentences referencing the OS class include offline documents, internet connection, offline google, internet, low, very limited, limited functionality, offline apps, internet disappointing, very frustrating, os difficult, slower, offline windows, offline applications, very difficult chrome, disappointed windows, offline apps. Some background research on the Chromebook 12 laptop revealed that the operating system depends on internet connectivity to function fully. Based on these findings, solving the CONNECTIVITY challenges will positively affect the customer opinions of the OS class.
The lexicon-based techniques employed do not capture keyword and sentiment nuances adequately. For instance, our sentiment classification failed to annotate phrase ‘dead silent device’ as positive. Our approach’s inability to capture implicit product aspect expressions and sentiments excludes 11,494 sentences from the analyses.
6. Conclusions
With business models and service delivery continuously disrupted by digital transformation, customer engagement has become more digital and indirect. Businesses either have a global customer base or plan to build one for their products and services. Customers willingly express their opinions on products and services on a massive scale on online review platforms. Developing aspect-opinion analytics solutions is imperative to extract product and service improvement insight.
This paper proposes a generic graph-based method for aspect-opinion analysis of complex products customer feedback. The method processes online customer feedback for the task of product design improvement. It shows how fast domain expert-guided dataset labeling can be achieved to ease the difficulty of acquiring quality domain-specific labeled datasets for investigations. We demonstrated the operation of the framework through a real-world case study of analyzing the reviews on a Samsung Chromebook 2012 model. Compared to related work, our approach performs more types of analysis and, therefore more flexible. Specifically, our method performs regular and comparative aspect-opinion analysis, aspect satisfaction/influence ranking, opinion trend extraction, and targeted aspect-opinion summarization. The results show that simple summaries produced in previous related studies are inadequate to provide insight into service or design improvement. Primarily, our approach supports ad hoc aspect-opinion inquiries typical of real-world requirements analysis, giving experts the required expressivity.
Our generic graph-based method provides several piratical benefits for customer feedback analysis in the product design space. First, design experts can focus on the questions they want to ask rather than worrying about data preprocessing and data modeling. They are presented with functionality to match any ad hoc pattern and perform follow-up analyses on the results. They can also extend simple feature search into a sentence or review extraction operation to target a subset of customer content. Furthermore, the analyses can be stretched to accommodate filtering based on sentiment, time, and co-occurrence of other features.
For future work, we will investigate the possibility of extending this framework to build an opinion-aware knowledge graph by incorporating other pieces of information. Valuable data points for extending our graph model include customer ratings, customer IDs, location, questions and answers, review replies, and review votes. Second, we will investigate how conversational intelligence could transform the standard query formats from natural language to graph pattern matching and filtering queries. It is also necessary to improve our framework’s ability to handle implicit customer opinions.
Supplementary Materials
The following supporting information can be downloaded at: https://www.mdpi.com/article/10.3390/info13030118/s1.
Author Contributions
Conceptualization, M.Y.K.; methodology, M.Y.K.; software, M.Y.K.; validation, M.Y.K., B.A., C.R.H. and T.L.; formal analysis, M.Y.K.; investigation, M.Y.K.; original draft preparation, M.Y.K.; writing, review and editing, M.Y.K., B.A., C.R.H. and T.L.; visualization, M.Y.K.; supervision, W.-P.W. All authors have read and agreed to the published version of the manuscript.
Funding
This research received no external funding.
Institutional Review Board Statement
Not applicable.
Informed Consent Statement
Not applicable.
Data Availability Statement
The data presented in this study are available in the supplementary material.
Conflicts of Interest
The authors declare no conflict of interest.
References
- Tontini, G. Integrating the Kano model and QFD for designing new products. Total Qual. Manag. 2007, 18, 599–612. [Google Scholar] [CrossRef]
- Chan, L.K.; Wu, M.L. Quality function deployment: A literature review. Eur. J. Oper. Res. 2002, 143, 463–497. [Google Scholar] [CrossRef]
- Griffin, A.; Hauser, J.R. The voice of the customer. Mark. Sci. 1993, 12, 1–27. [Google Scholar] [CrossRef]
- Benabdellah, A.C.; Benghabrit, A.; Bouhaddou, I. Complexity drivers in engineering design: Toward a decision support system based on an organizational perspective. J. Eng. Des. Technol. 2020, 18, 1663–1690. [Google Scholar] [CrossRef]
- Baxter, M. Product Design; CRC Press: Boca Raton, FL, USA, 2018. [Google Scholar]
- Abras, C.; Maloney-Krichmar, D.; Preece, J.; Bainbridge, W. User-centered design. In Encyclopedia of Human–Computer Interaction; Sage Publications: Thousand Oaks, CA, USA, 2004; Volume 37, pp. 445–456. [Google Scholar]
- Marquardt, M.J. Leading with Questions: How Leaders Find the Right Solutions by Knowing What to Ask; John Wiley & Sons: Hoboken, NJ, USA, 2011; Volume 180. [Google Scholar]
- Zhang, H.; Qin, S.; Li, R.; Zou, Y.; Ding, G. Progressive modelling of feature-centred product family development. Int. J. Prod. Res. 2020, 12, 3701–3723. [Google Scholar] [CrossRef]
- Niu, X.; Wang, M.; Qin, S. Product design lifecycle information model (PDLIM). Int. J. Adv. Manuf. Technol. 2021, 118, 2311–2337. [Google Scholar] [CrossRef]
- Jin, J.; Liu, Y.; Ji, P.; Kwong, C.K. Review on recent advances in information mining from big consumer opinion data for product design. J. Comput. Inf. Sci. Eng. 2019, 19, 010801. [Google Scholar] [CrossRef]
- Miller, P.V. Is there a future for surveys? Public Opin. Q. 2017, 81, 205–212. [Google Scholar] [CrossRef] [Green Version]
- Berman, S.J. Digital transformation: Opportunities to create new business models. Strategy Leadersh. 2012, 40, 16–24. [Google Scholar] [CrossRef]
- Villela, K.; Hess, A.; Koch, M.; Falcao, R.; Groen, E.C.; Dörr, J.; Valero, C.N.; Ebert, A. Towards ubiquitous RE: A perspective on requirements engineering in the era of digital transformation. In Proceedings of the 2018 IEEE 26th international requirements engineering conference (RE), Banff, AB, Canada, 20–24 August 2014; pp. 205–216. [Google Scholar]
- Villela, K.; Groen, E.C.; Doerr, J. Ubiquitous requirements engineering: A paradigm shift that affects everyone. IEEE Softw. 2019, 36, 8–12. [Google Scholar] [CrossRef]
- Irel, R.; Liu, A. Application of data analytics for product design: Sentiment analysis of online product reviews. Cirp J. Manuf. Sci. Technol. 2018, 23, 128–144. [Google Scholar]
- Ali, S.; Wang, G.; Riaz, S. Aspect based sentiment analysis of ridesharing platform reviews for kansei engineering. IEEE Access 2020, 8, 173186–173196. [Google Scholar] [CrossRef]
- Zhang, J.; Zhang, A.; Liu, D.; Bian, Y. Customer preferences extraction for air purifiers based on fine-grained sentiment analysis of online reviews. Knowl. Based Syst. 2021, 228, 107259. [Google Scholar] [CrossRef]
- Han, Y.; Mohsen, M. Analysis of sentiment expressions for user-centered design. Expert Syst. Appl. 2021, 171, 114604. [Google Scholar] [CrossRef]
- Jin, J.; Jia, D.; Chen, K. Mining online reviews with a Kansei-integrated Kano model for innovative product design. Int. J. Prod. Res. 2021, 1–20. [Google Scholar] [CrossRef]
- Quan, H.; Li, S.; Zeng, C.; Wei, H.; Hu, J. Big Data driven Product Design: A Survey. arXiv 2021, arXiv:2109.11424. [Google Scholar]
- Hemmatian, F.; Sohrabi, M.K. A survey on classification techniques for opinion mining and sentiment analysis. Artif. Intell. Rev. 2019, 52, 1495–1545. [Google Scholar] [CrossRef]
- Liu, B. Sentiment analysis and opinion mining. Synth. Lect. Hum. Lang. Technol. 2012, 5, 1–67. [Google Scholar] [CrossRef] [Green Version]
- Liu, B.; Zhang, L. A survey of opinion mining and sentiment analysis. In Mining Text Data; Springer: Boston, MA, USA, 2012; pp. 415–463. [Google Scholar]
- Jindal, N.; Liu, B. Mining comparative sentences and relations. AAAI 2006, 22, 9. [Google Scholar]
- Ye, M.; Qin, Y.; Govaert, A.; Anderson, B.D.O.; Cao, M. An influence network model to study discrepancies in expressed and private opinions. Automatica 2019, 107, 371–381. [Google Scholar] [CrossRef] [Green Version]
- Shang, Y. Resilient consensus for expressed and private opinions. IEEE Trans. Cybern. 2019, 51, 318–331. [Google Scholar] [CrossRef] [PubMed]
- Tucker, C.; Kim, H. Predicting emerging product design trend by mining publicly available customer review data. In Proceedings of the 18th International Conference on Engineering Design (ICED 11), Impacting Society through Engineering Design, Lyngby/Copenhagen, Denmark, 15–19 August 2011. [Google Scholar]
- Li, N.; Jin, X.; Li, Y. Identification of key customer requirements based on online reviews. J. Intell. Fuzzy Syst. 2020, preprint. [Google Scholar] [CrossRef]
- Güneş, S. Extracting Online Product Review Patterns and Causes: A New Aspect/Cause Based Heuristic for Designers. Des. J. 2020, 23, 375–393. [Google Scholar] [CrossRef]
- Jeong, B.; Yoon, J.; Lee, J.M. Social media mining for product planning: A product opportunity mining approach based on topic modeling and sentiment analysis. Int. J. Inf. Manag. 2019, 48, 280–290. [Google Scholar] [CrossRef]
- Zhao, Z.; Li, Y.; Chu, X. Data-driven approach to identify obsolete functions of products for design improvements. J. Intell. Fuzzy Syst. 2021, preprint. [Google Scholar] [CrossRef]
- Wang, H.; Wang, W. Product weakness finder: An opinion-aware system through sentiment analysis. Ind. Manag. Data Syst. 2014, 114, 1301–1320. [Google Scholar] [CrossRef]
- Qi, J.; Zhang, Z.; Jeon, S.; Zhou, Y. Mining customer requirements from online reviews: A product improvement perspective. Inf. Manag. 2016, 53, 951–963. [Google Scholar] [CrossRef]
- Jin, J.; Liu, Y.; Ji, P.; Liu, H. Understanding big consumer opinion data for market-driven product design. Int. J. Prod. Res. 2016, 54, 3019–3041. [Google Scholar] [CrossRef]
- Maybeck, P.S. The Kalman filter: An introduction to concepts. In Autonomous Robot Vehicles; Springer: New York, NY, USA, 1990; pp. 194–204. [Google Scholar]
- Zhang, L.; Chu, X.; Xue, D. Identification of the to-be-improved product features based on online reviews for product redesign. Int. J. Prod. Res. 2019, 57, 2464–2479. [Google Scholar] [CrossRef]
- Ng, C.Y.; Law, K.M. Investigating consumer preferences on product designs by analyzing opinions from social networks using evidential reasoning. Comput. Ind. Eng. 2020, 139, 106180. [Google Scholar] [CrossRef]
- Jiang, H.; Kwong, C.K.; Kremer, G.E.O.; Park, W. Dynamic modelling of customer preferences for product design using DENFIS and opinion mining. Adv. Eng. Informat. 2019, 42, 100969. [Google Scholar] [CrossRef]
- Sun, H.; Guo, W.; Shao, H.; Rong, B. Dynamical mining of ever-changing user requirements: A product design and improvement perspective. Adv. Eng. Informat. 2020, 46, 101174. [Google Scholar] [CrossRef]
- Yakubu, H.; Kwong, C.K. Forecasting the importance of product attributes using online customer reviews and Google Trends. Technol. Forecast. Soc. Chang. 2021, 171, 120983. [Google Scholar] [CrossRef]
- Giannakis, M.; Dubey, R.; Yan, S.; Spanaki, K.; Papadopoulos, T. Social media and sensemaking patterns in new product development: Demystifying the customer sentiment. Ann. Oper. Res. 2020, 29, 1–31. [Google Scholar] [CrossRef]
- Mourtzis, D.; Fotia, S.; Vlachou, E. PSS design evaluation via KPIs and lean design assistance supported by context sensitivity tools. Procedia Cirp 2016, 56, 496–501. [Google Scholar] [CrossRef] [Green Version]
- Mourtzis, D.; Fotia, S.; Gamito, M.; Neves-Silva, R.; Correia, A.; Spindler, P.; Pezzotta, G.; Rossi, M. PSS design considering feedback from the entire product-service lifecycle and social media. Procedia Cirp 2016, 47, 156–161. [Google Scholar] [CrossRef] [Green Version]
- Pina, P.; Góis, G.; Mano, F.; Silva, F.; Neves-Silva, R. A sentiment analysis solution for the re-design of product-service systems. In Proceedings of the 2017 International Conference on Engineering, Technology and Innovation (ICE/ITMC), Madeira, Portugal, 27–29 June 2017; pp. 1300–1305. [Google Scholar]
- Mirtalaie, M.A.; Hussain, O.K.; Chang, E.; Hussain, F.K. Sentiment analysis of specific product’s features using product tree for application in new product development. In Proceedings of the InInternational Conference on Intelligent Networking and Collaborative Systems. INCoS 2017, Toronto, ON, Canada, 24–26 August 2017; pp. 82–95. [Google Scholar] [CrossRef]
- Yang, B.; Liu, Y.; Liang, Y.; Tang, M. Exploiting user experience from online customer reviews for product design. Int. J. Inf. Manag. 2019, 46, 173–186. [Google Scholar] [CrossRef]
- Li, F.; Han, C.; Huang, M.; Zhu, X.; Xia, Y.; Zhang, S.; Yu, H. Structure-aware review mining and summarization. In Proceedings of the 23rd International Conference on Computational Linguistics (Coling 2010), Beijing, China, 23–27 August 2010; pp. 653–661. [Google Scholar]
- Yu, J.; Zha, Z.J.; Chua, T.S. Answering opinion questions on products by exploiting hierarchical organization of consumer reviews. In Proceedings of the 2012 Joint Conference on Empirical Methods in Natural Language Processing and Computational Natural Language Learning, Jeju Island, Korea, 12–14 July 2012; pp. 391–401. [Google Scholar]
- Yu, J.; Zha, Z.J.; Wang, M.; Wang, K.; Chua, T.S. Domain-assisted product aspect hierarchy generation: Towards hierarchical organization of unstructured consumer reviews. In Proceedings of the 2011 Conference on Empirical Methods in Natural Language Processing, Edinburgh, UK, 27–31 July 2011; pp. 140–150. [Google Scholar]
- Zhai, Z.; Liu, B.; Xu, H.; Jia, P. Clustering product features for opinion mining. In Proceedings of the Fourth ACM International Conference on Web Search and Data Mining, Hong Kong, China, 9–12 February 2011; pp. 347–354. [Google Scholar]
- Wang, Y.; Lu, X.; Tan, Y. Impact of product attributes on customer satisfaction: An analysis of online reviews for washing machines. Electron. Commer. Res. Appl. 2018, 29, 1–11. [Google Scholar] [CrossRef]
- Anh, K.Q.; Nagai, Y.; Le Minh, N. Extracting user requirements from online reviews for product design: A supportive framework for designers. J. Intell. Fuzzy Syst. 2019, 37, 7441–7451. [Google Scholar] [CrossRef]
- Mei, Q.; Shen, X.; Zhai, C. Automatic labeling of multinomial topic models. In Proceedings of the 13th ACM SIGKDD International Conference on Knowledge Discovery and Data Mining, San Jose, CA, USA, 12–15 August 2007; pp. 490–499. [Google Scholar]
- Basave, A.E.; He, Y.; Xu, R. Automatic labelling of topic models learned from twitter by summarisation. In Proceedings of the 52nd Annual Meeting of the Association for Computational Linguistics, Baltimore, MD, USA, 22–27 June 2014; pp. 618–624. [Google Scholar]
- Bridges, R.A.; Jones, C.L.; Iannacone, M.D.; Testa, K.M.; Goodall, J.R. Automatic labeling for entity extraction in cyber security. arXiv 2013, arXiv:1308.4941. [Google Scholar]
- Gildea, D.; Jurafsky, D. Automatic labeling of semantic roles. Comput. Linguist. 2002, 28, 245–288. [Google Scholar] [CrossRef]
- Khan, A.; Salim, N.; Kumar, Y.J. A framework for multi-document abstractive summarization based on semantic role labelling. Appl. Soft Comput. 2015, 30, 737–747. [Google Scholar] [CrossRef]
- Brugnara, F.; Falavigna, D.; Omologo, M. Automatic segmentation and labeling of speech based on Hidden Markov Models. Speech Commun. 1993, 12, 357–370. [Google Scholar] [CrossRef]
- Ratner, A.J.; De Sa, C.M.; Wu, S.; Selsam, D.; Ré, C. Data programming: Creating large training sets, quickly. Adv. Neural Inf. Process. Syst. 2016, 29, 3567–3575. [Google Scholar]
- Ratner, A.; Bach, S.; Varma, P.; Ré, C. Weak Supervision: The New Programming Paradigm for Machine Learning. Hazy Research. Available online: https://dawn.cs.stanford.edu//2017/07/16/weak-supervision/ (accessed on 5 December 2021).
- Mintz, M.; Bills, S.; Snow, R.; Jurafsky, D. Distant supervision for relation extraction without labeled data. In Proceedings of the Joint Conference of the 47th Annual Meeting of the ACL and the 4th International Joint Conference on Natural Language Processing of the AFNLP, Suntec, Singapore, 2–7 August 2009; pp. 1003–1011. [Google Scholar]
- Hoffmann, R.; Zhang, C.; Ling, X.; Zettlemoyer, L.; Weld, D.S. Knowledge-based weak supervision for information extraction of overlapping relations. In Proceedings of the 49th Annual Meeting of the Association for Computational Linguistics: Human Language Technologies, Portland, OR, USA, 19–24 June 2011; pp. 541–550. [Google Scholar]
- Bach, S.H.; He, B.; Ratner, A.; Ré, C. Learning the structure of generative models without labeled data. In Proceedings of the International Conference on Machine Learning, Sydney, Australia, 6–11 August 2017; pp. 273–282. [Google Scholar]
- Ratner, A.; Bach, S.H.; Ehrenberg, H.; Fries, J.; Wu, S.; Ré, C. Snorkel: Rapid training data creation with weak supervision. VLdb J. 2020, 29, 709–730. [Google Scholar] [CrossRef] [Green Version]
- Rodriguez, M.A.; Neubauer, P. Constructions from dots and lines. Bull. Am. Soc. Inf. Sci. Technol. 2010, 36, 35–41. [Google Scholar] [CrossRef] [Green Version]
- Rodriguez, M.A.; Neubauer, P. The graph traversal pattern. In InGraph Data Management: Techniques and Applications; IGI Global: Hershey, PA, USA, 2012; pp. 29–46. [Google Scholar]
- Rodriguez, M.A.; Shinavier, J. Exposing multi-relational networks to single-relational network analysis algorithms. J. Inf. 2010, 4, 29–41. [Google Scholar] [CrossRef] [Green Version]
- Morrison, J.P. Flow-Based Programming: A New Approach to Application Development, 2nd ed.; CreateSpace: Scotts Valley, CA, USA, 2010. [Google Scholar]
- Monro, G.P. The concept of multiset. Math. Log. Q. 1987, 33, 171–178. [Google Scholar] [CrossRef]
- Blei, D.M.; Ng, A.Y.; Jordan, M.I. Latent dirichlet allocation. J. Mach. Learn. Res. 2003, 3, 993–1022. [Google Scholar]
- Chen, Z.; Mukherjee, A.; Liu, B.; Hsu, M.; Castellanos, M.; Ghosh, R. Exploiting domain knowledge in aspect extraction. In Proceedings of the 2013 Conference on Empirical Methods in Natural Language Processing, Seattle, WA, USA, 18–21 October 2013; pp. 1655–1667. [Google Scholar]
- Manning, C.D.; Surdeanu, M.; Bauer, J.; Finkel, J.R.; Bethard, S.; McClosky, D. The Stanford CoreNLP natural language processing toolkit. In Proceedings of the 52nd Annual Meeting of the Association for Computational Linguistics: System Demonstrations, Baltimore, MD, USA, 23–24 June 2014; pp. 55–60. [Google Scholar]
- Ratner, A.J.; Bach, S.H.; Ehrenberg, H.R.; Ré, C. Snorkel: Fast training set generation for information extraction. In Proceedings of the 2017 ACM International Conference on Management of Data, Chicago, IL, USA, 14–19 May 2017; pp. 1683–1686. [Google Scholar]
- Hutto, C.; Gilbert, E. Vader: A parsimonious rule-based model for sentiment analysis of social media text. In Proceedings of the International AAAI Conference on Web and Social Media, Ann Arbor, MI, USA, 1–4 June 2014. [Google Scholar]
- Kübler, S.; McDonald, R.; Nivre, J. Dependency parsing. Synth. Lect. Hum. Lang. Technol. 2009, 1, 1–27. [Google Scholar] [CrossRef] [Green Version]
- Bunescu, R.; Mooney, R. A shortest path dependency kernel for relation extraction. In Proceedings of the Human Language Technology Conference and Conference on Empirical Methods in Natural Language Processing, Vancouver, BC, Canada, 6–8 October 2005; pp. 724–731. [Google Scholar]
- Kpiebaareh, M.Y.; Wu, W.P.; Bayitaa, S.; Haruna, C.R.; Tandoh, L. User-connection behaviour analysis in service management using bipartite labelled property graph. In Proceedings of the 16th EAI International Conference on Mobile and Ubiquitous Systems: Computing, Networking and Services, Houston, TX, USA, 12–14 November 2019; pp. 318–327. [Google Scholar] [CrossRef] [Green Version]
- Francis, N.; Green, A.; Guagliardo, P.; Libkin, L.; Lindaaker, T.; Marsault, V.; Plantikow, S.; Rydberg, M.; Selmer, P.; Taylor, A. Cypher: An evolving query language for property graphs. In Proceedings of the 2018 International Conference on Management of Data, Houston, TX, USA, 10–15 June 2018; pp. 1433–1445. [Google Scholar] [CrossRef] [Green Version]
- Haveliwala, T. Efficient Computation of PageRank; Technical Report; Stanford InfoLab: Stanford, CA, USA, 1999; No. 1999-31. [Google Scholar]
- Xing, W.; Ghorbani, A. Weighted pagerank algorithm. In Proceedings of the Second Annual Conference on Communication Networks and Services Research, Fredericton, NB, Canada, 21 May 2004; pp. 305–314. [Google Scholar]
Figure 1.
Interaction Model of designers, customers and products.
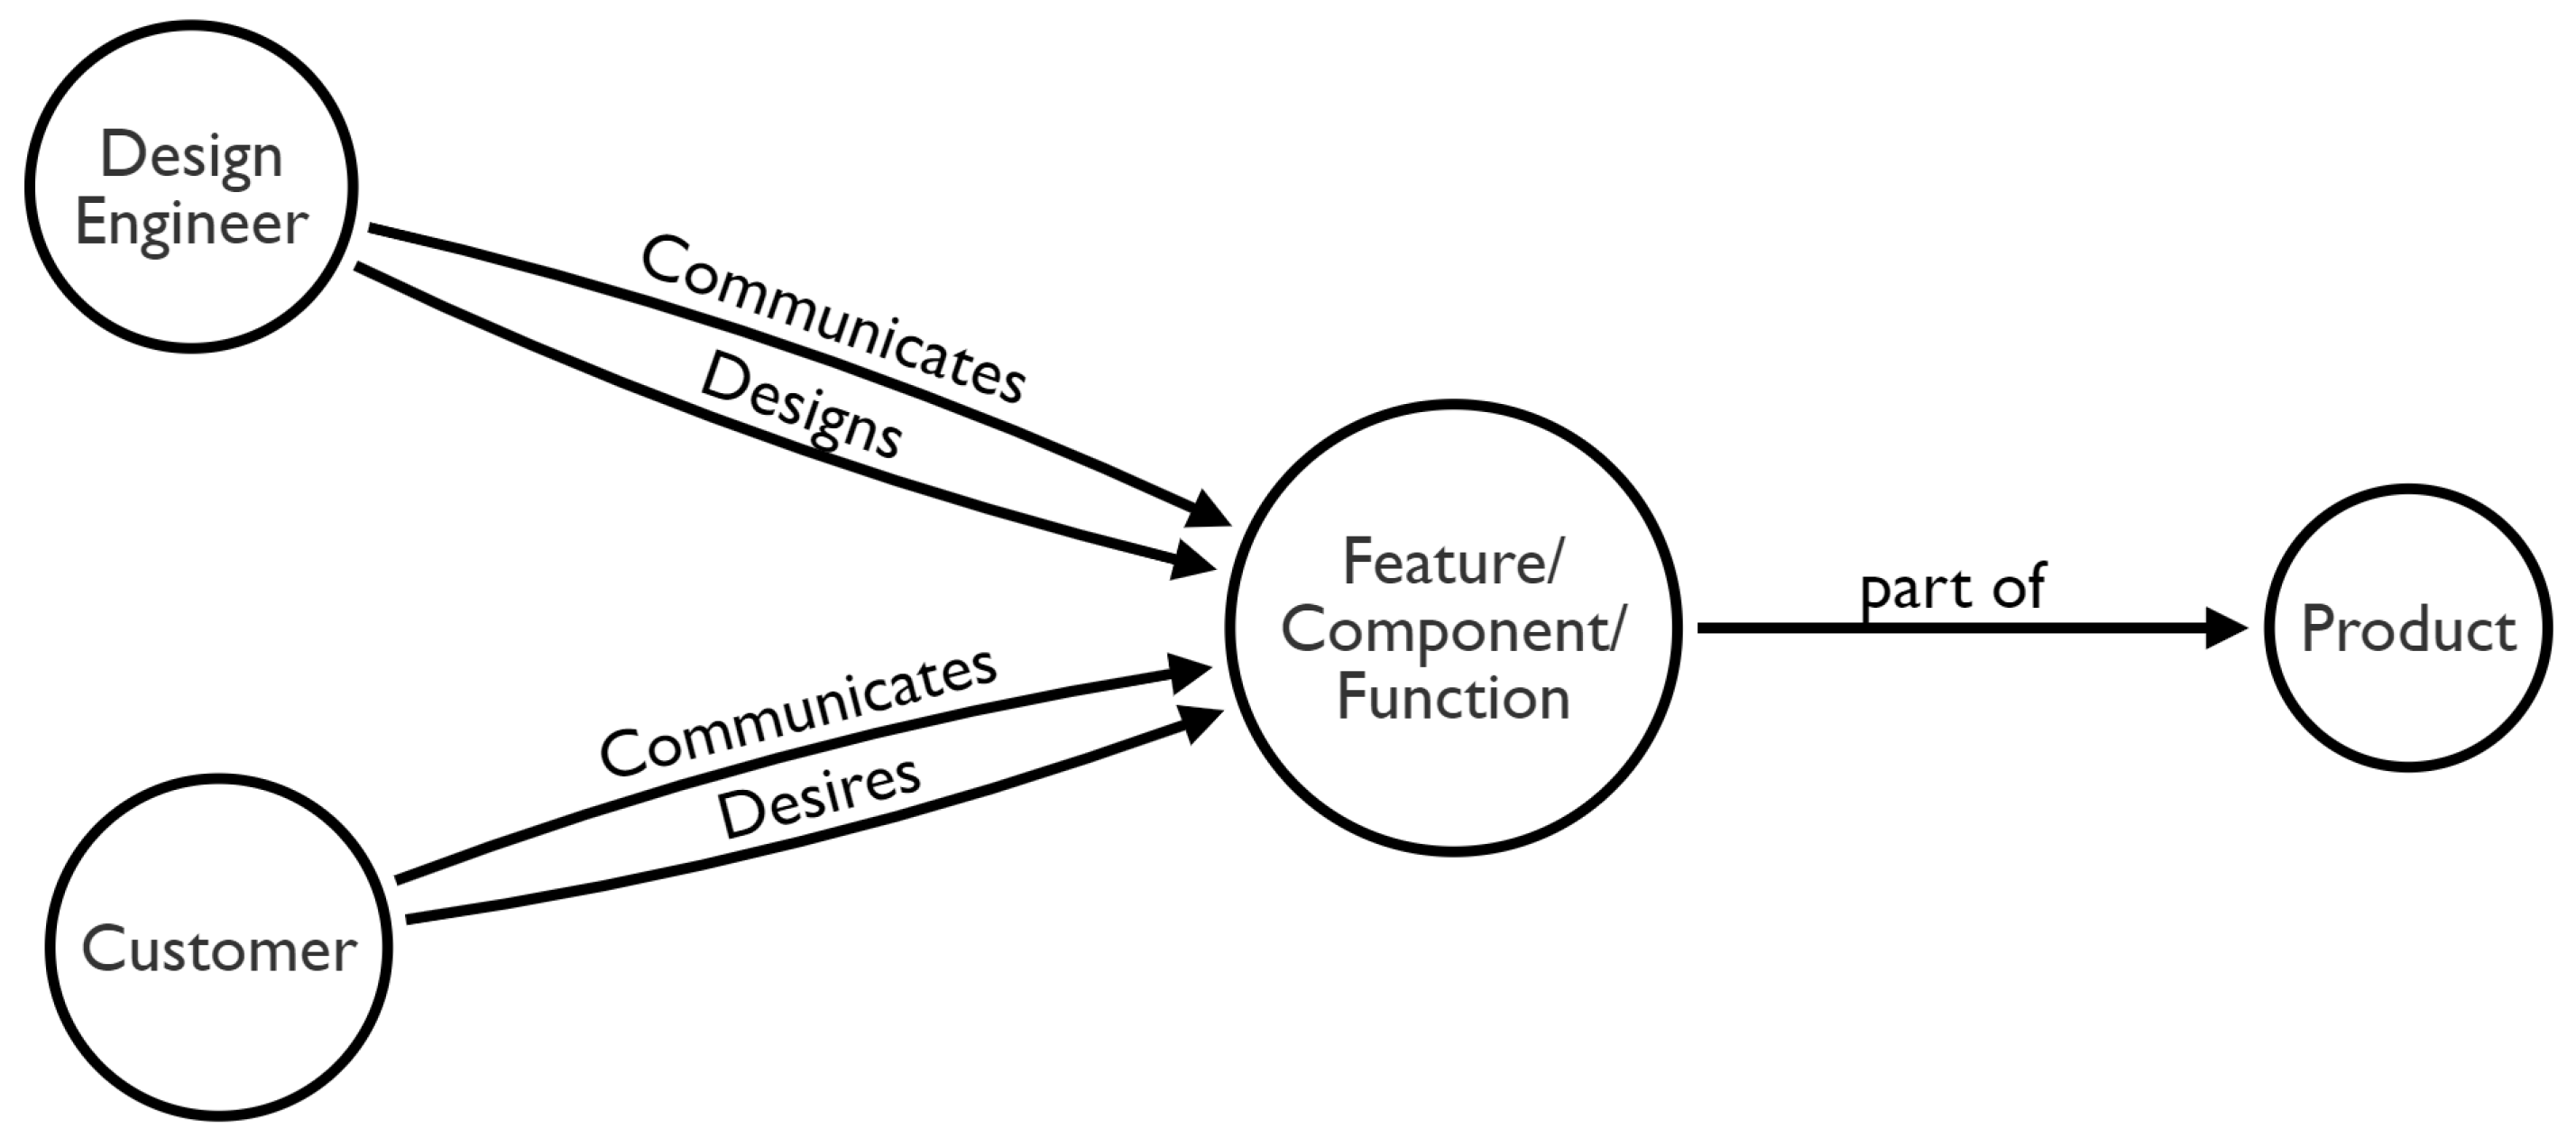
Figure 2.
The research design of the proposed graph-based opinion mining and analysis framework.

Figure 3.
Sentence-aspect bipartite labeled property graph.

Figure 4.
Schema of aspect-opinion labeled property graph.

Figure 5.
Sub-graph of review 2456 with two sentences, which opinions on three aspect keywords where keyword connect is mentioned in 103 other sentences.
Figure 5.
Sub-graph of review 2456 with two sentences, which opinions on three aspect keywords where keyword connect is mentioned in 103 other sentences.

Figure 6.
Distribution of opinion interest intensity on top 20 aspect keywords.

Figure 7.
Distribution of customer opinion interest intensity on the aspect classes.

Figure 8.
Illustration of data for four bipartite paths at the review level, from review to aspect class. Unipartite projections can then be extracted by extending the paths in two directions (through unique aspect keyword nodes). The individual paths formed can be seen in the table.
Figure 8.
Illustration of data for four bipartite paths at the review level, from review to aspect class. Unipartite projections can then be extracted by extending the paths in two directions (through unique aspect keyword nodes). The individual paths formed can be seen in the table.

Figure 9.
Distribution of opinion interest intensity on top 20 keyword pairs.

Figure 10.
Product aspect class ranking across all opinions.
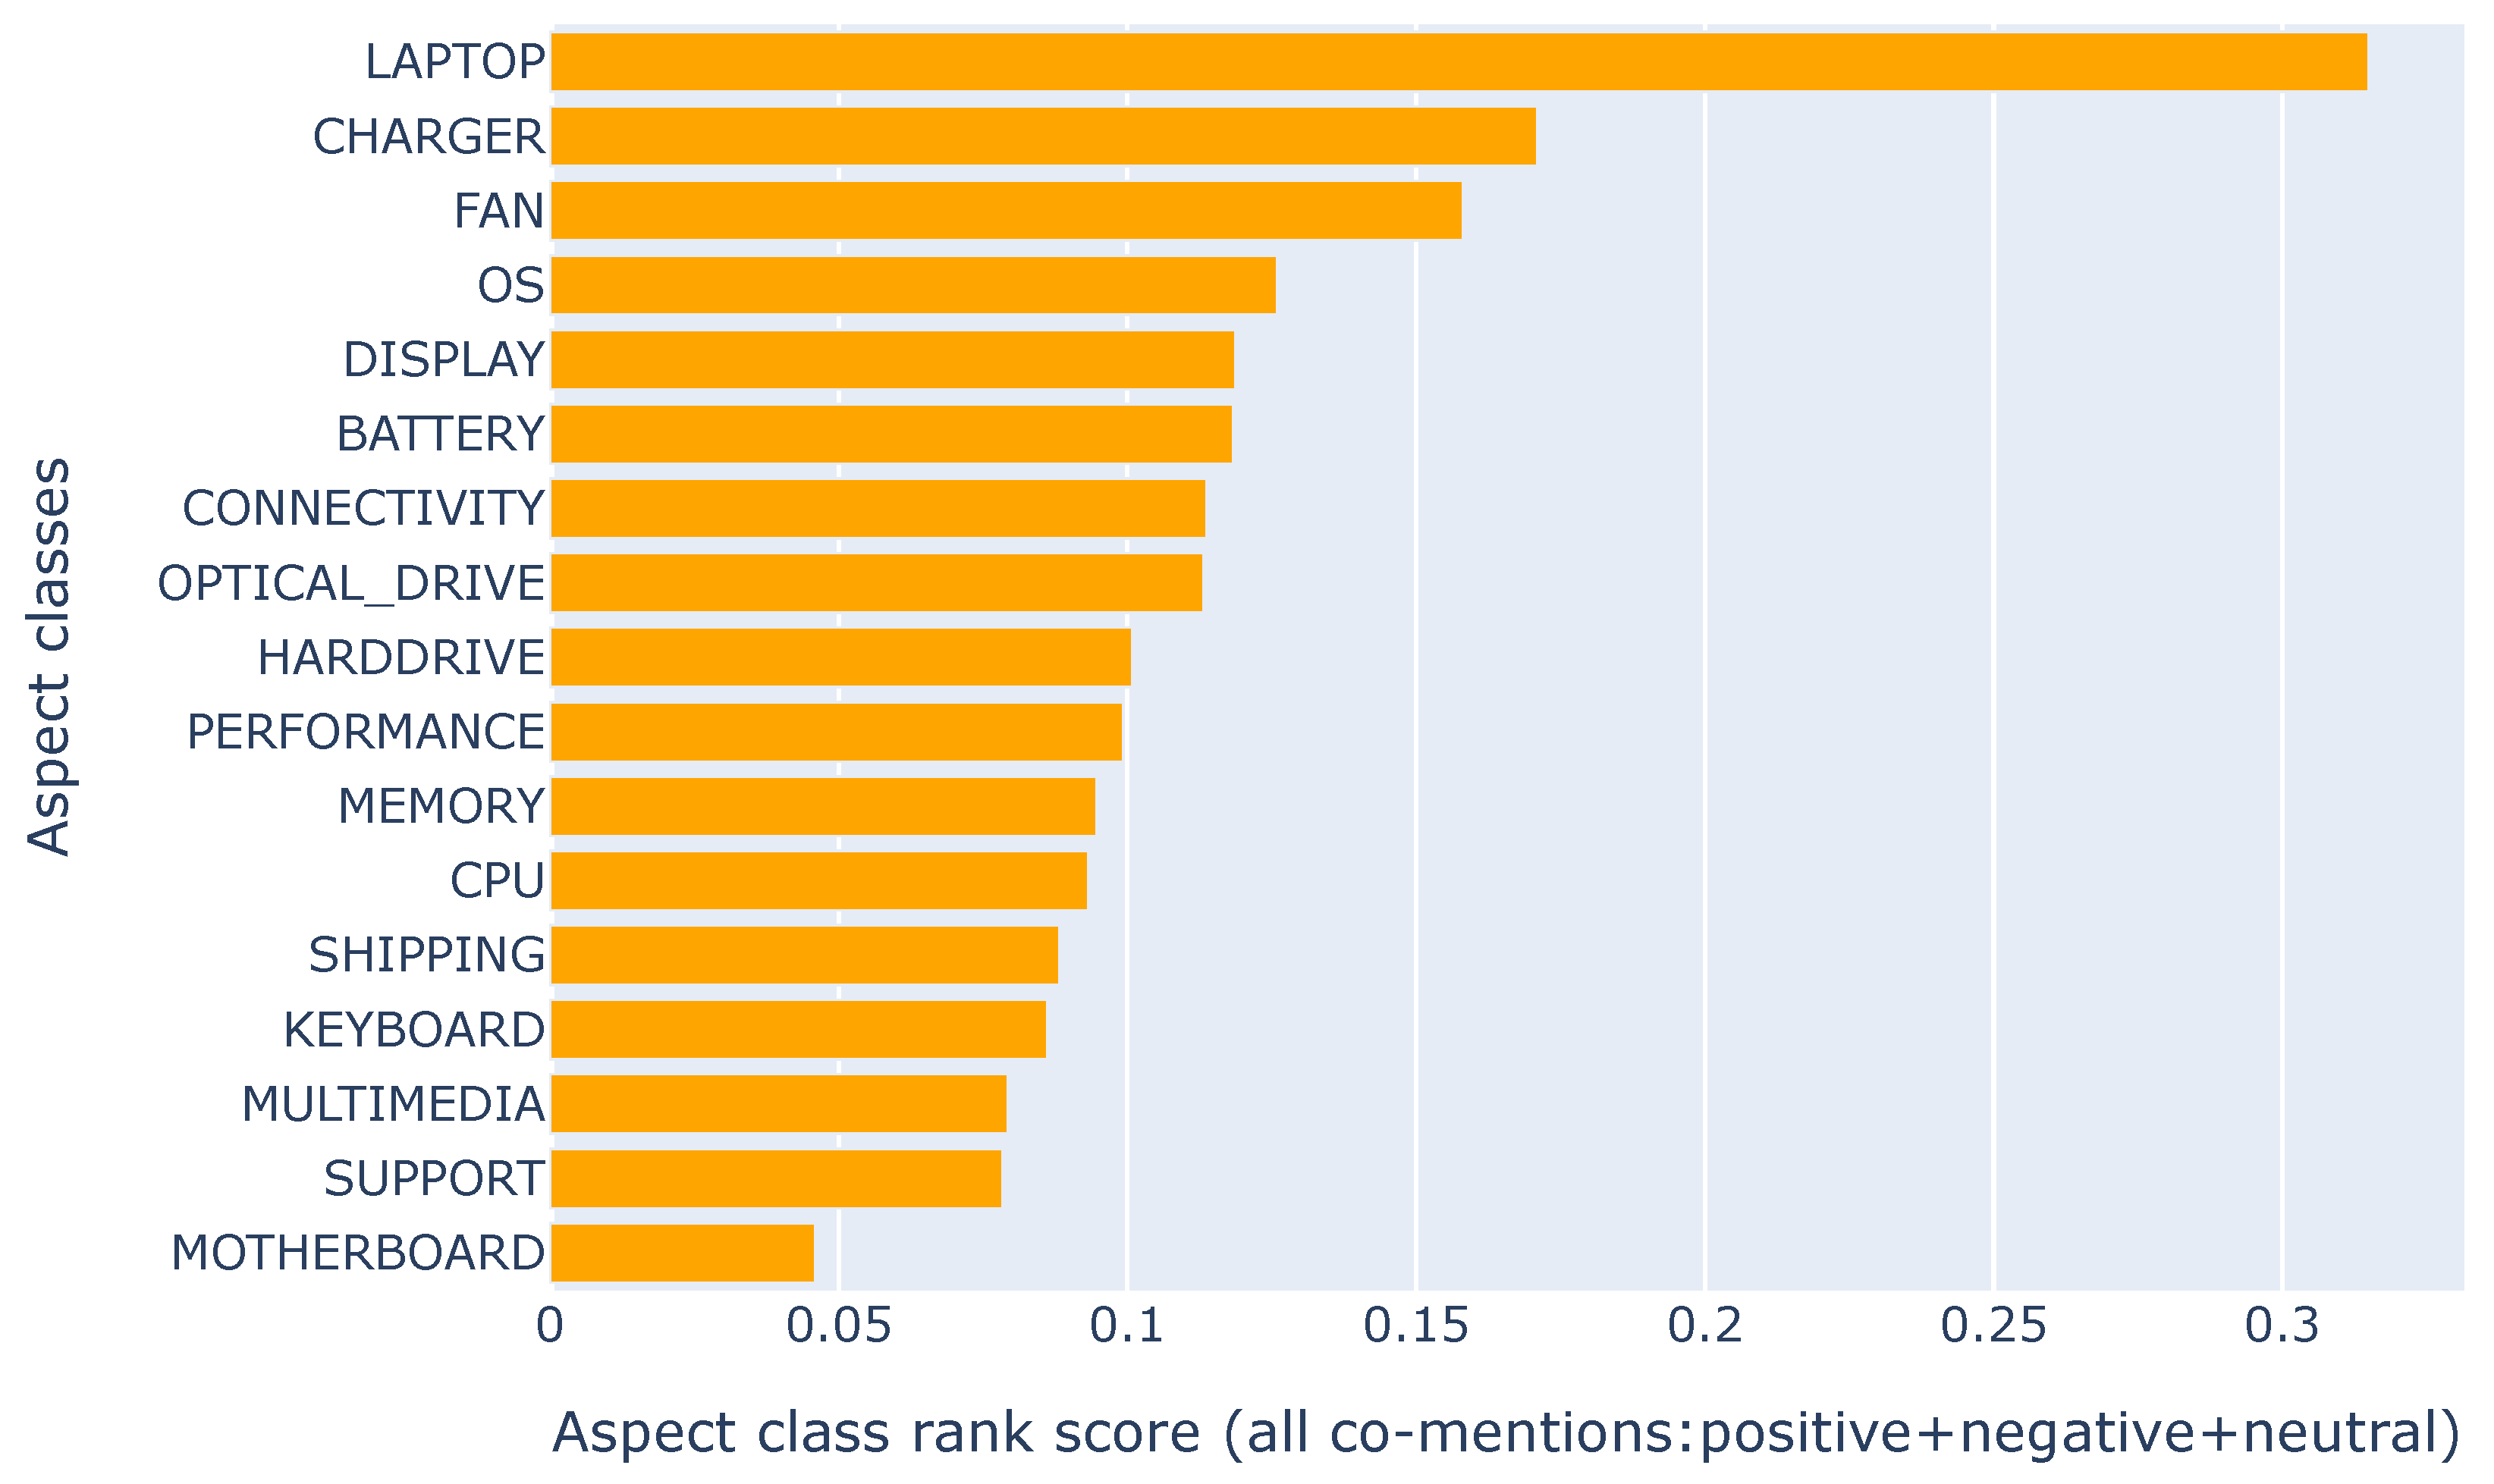
Figure 11.
Product aspect class ranking for negative opinions.

Figure 12.
Product aspect class ranking for positive opinions.

Figure 13.
Aspect negative mentions trend.

Figure 14.
Summary of aspect-opinions in sentences which had a negative sentiment on the charger class.
Figure 14.
Summary of aspect-opinions in sentences which had a negative sentiment on the charger class.


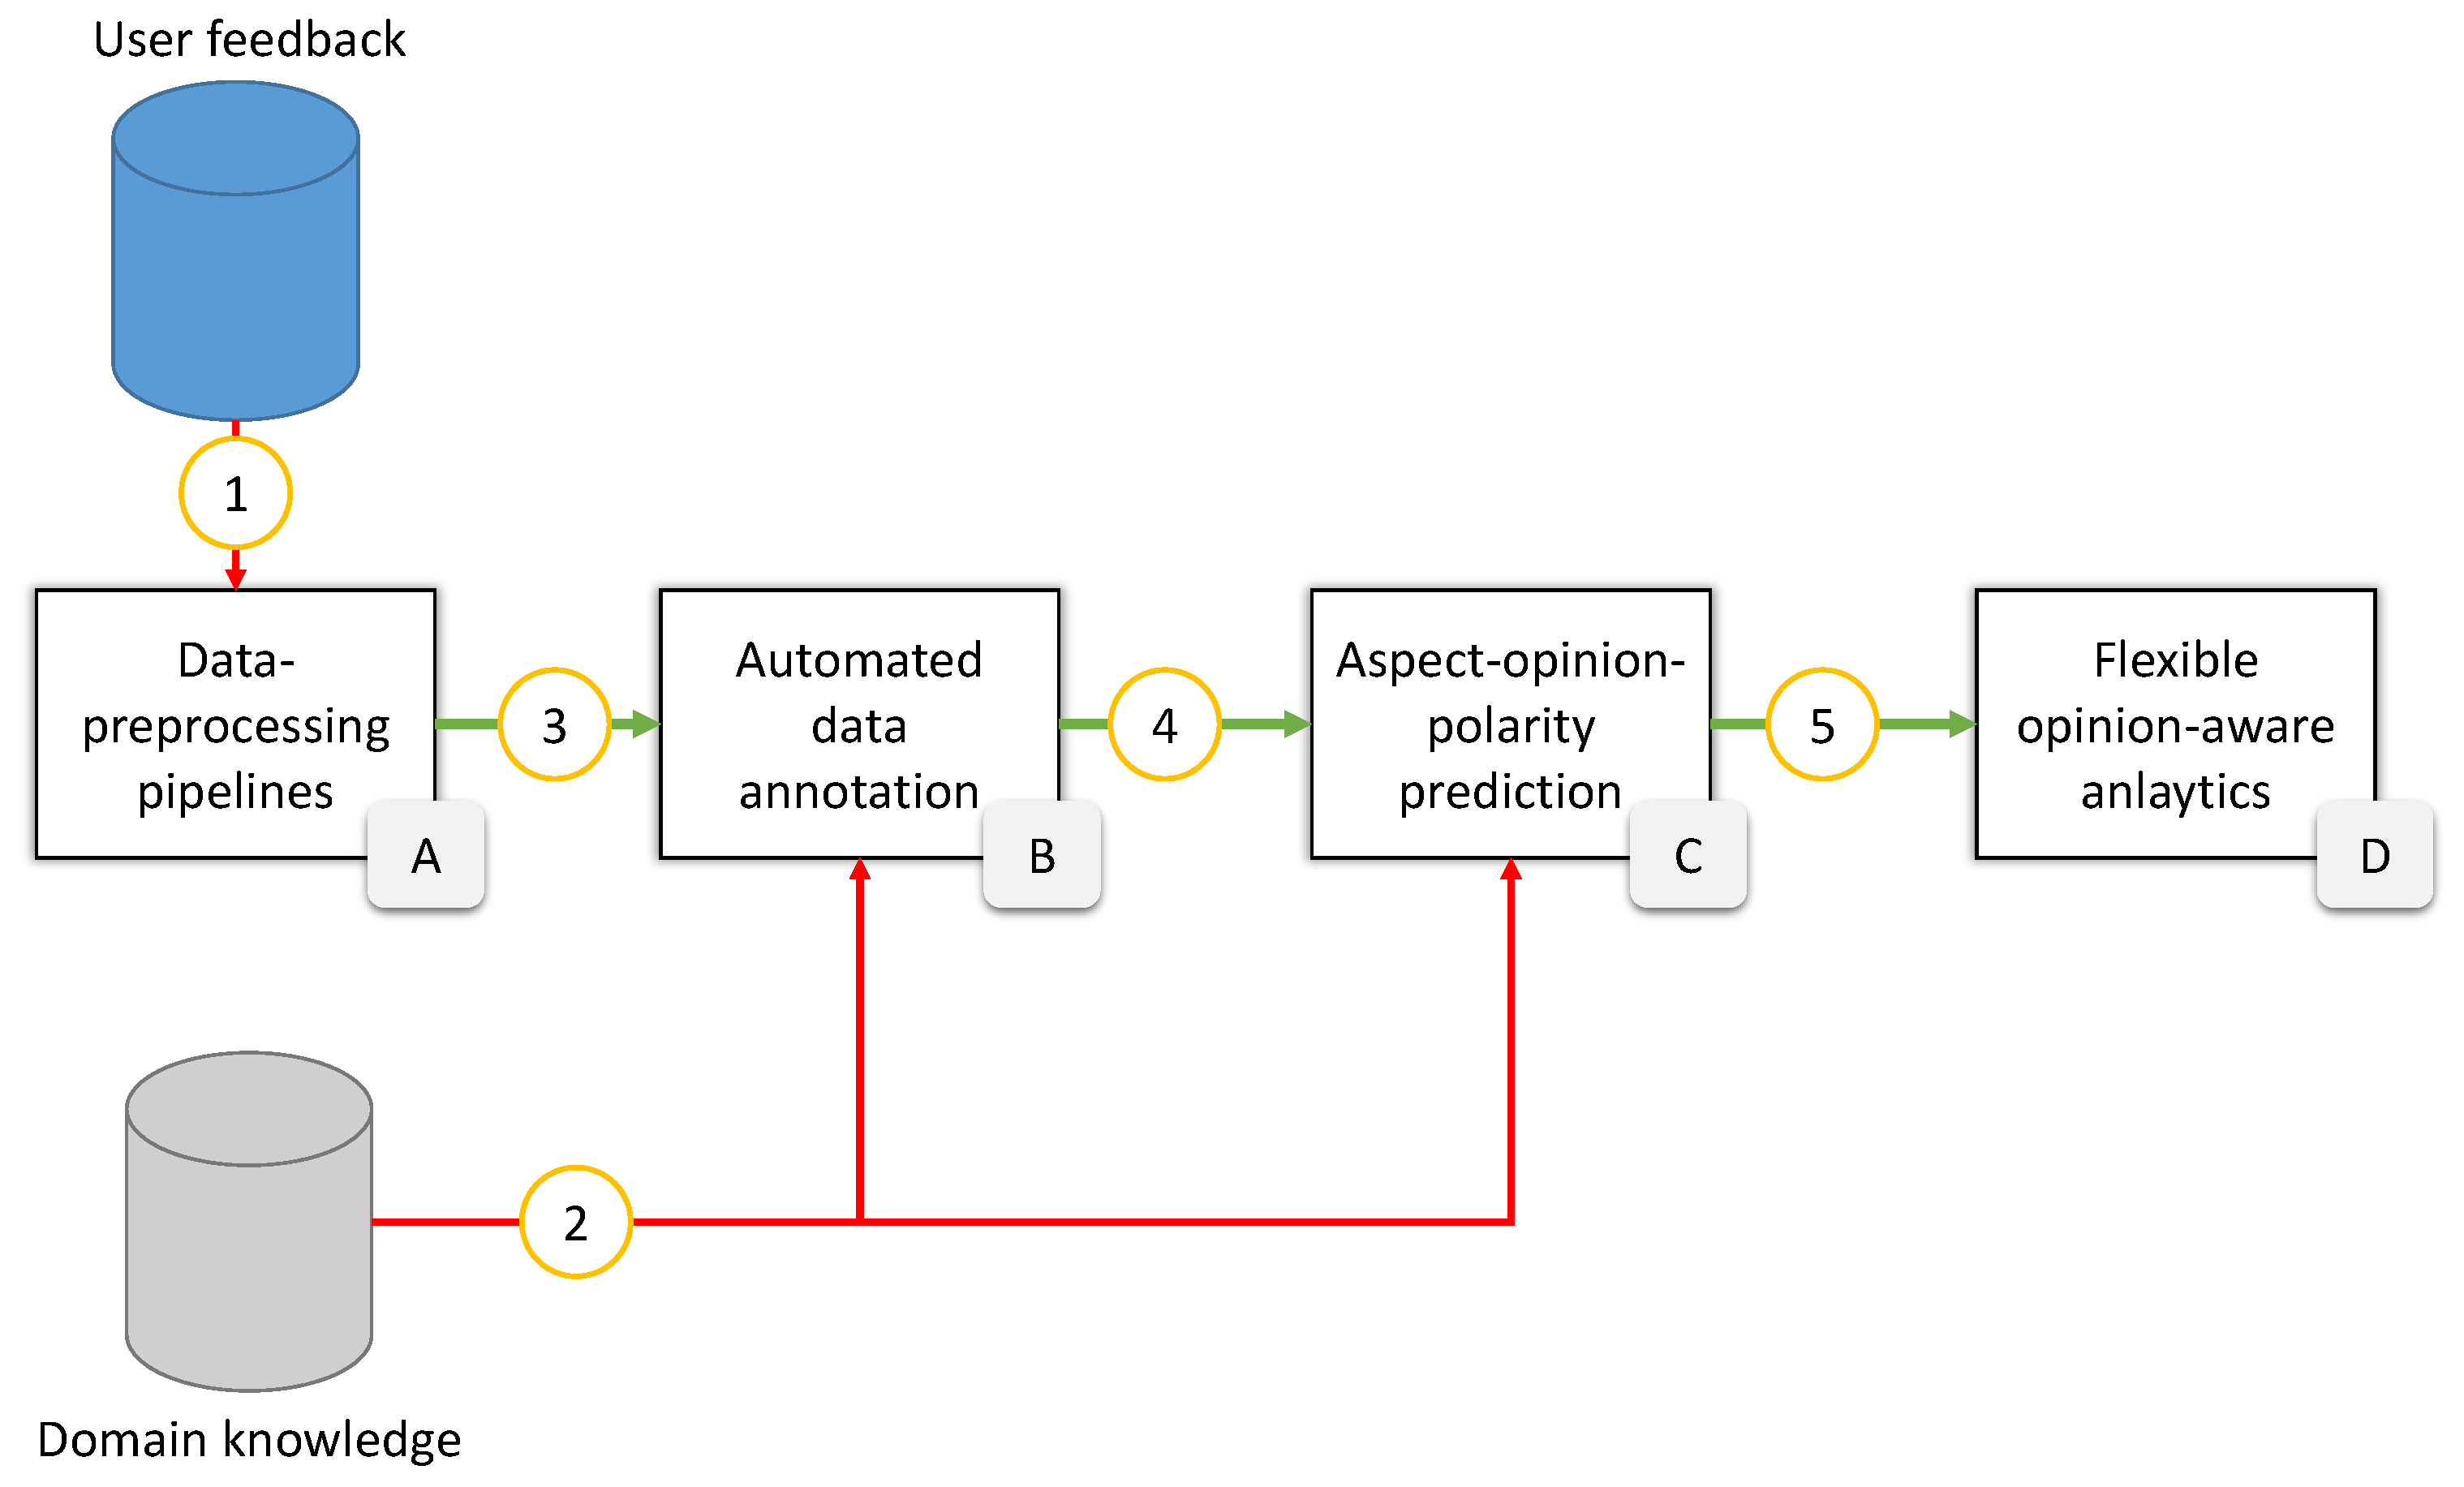
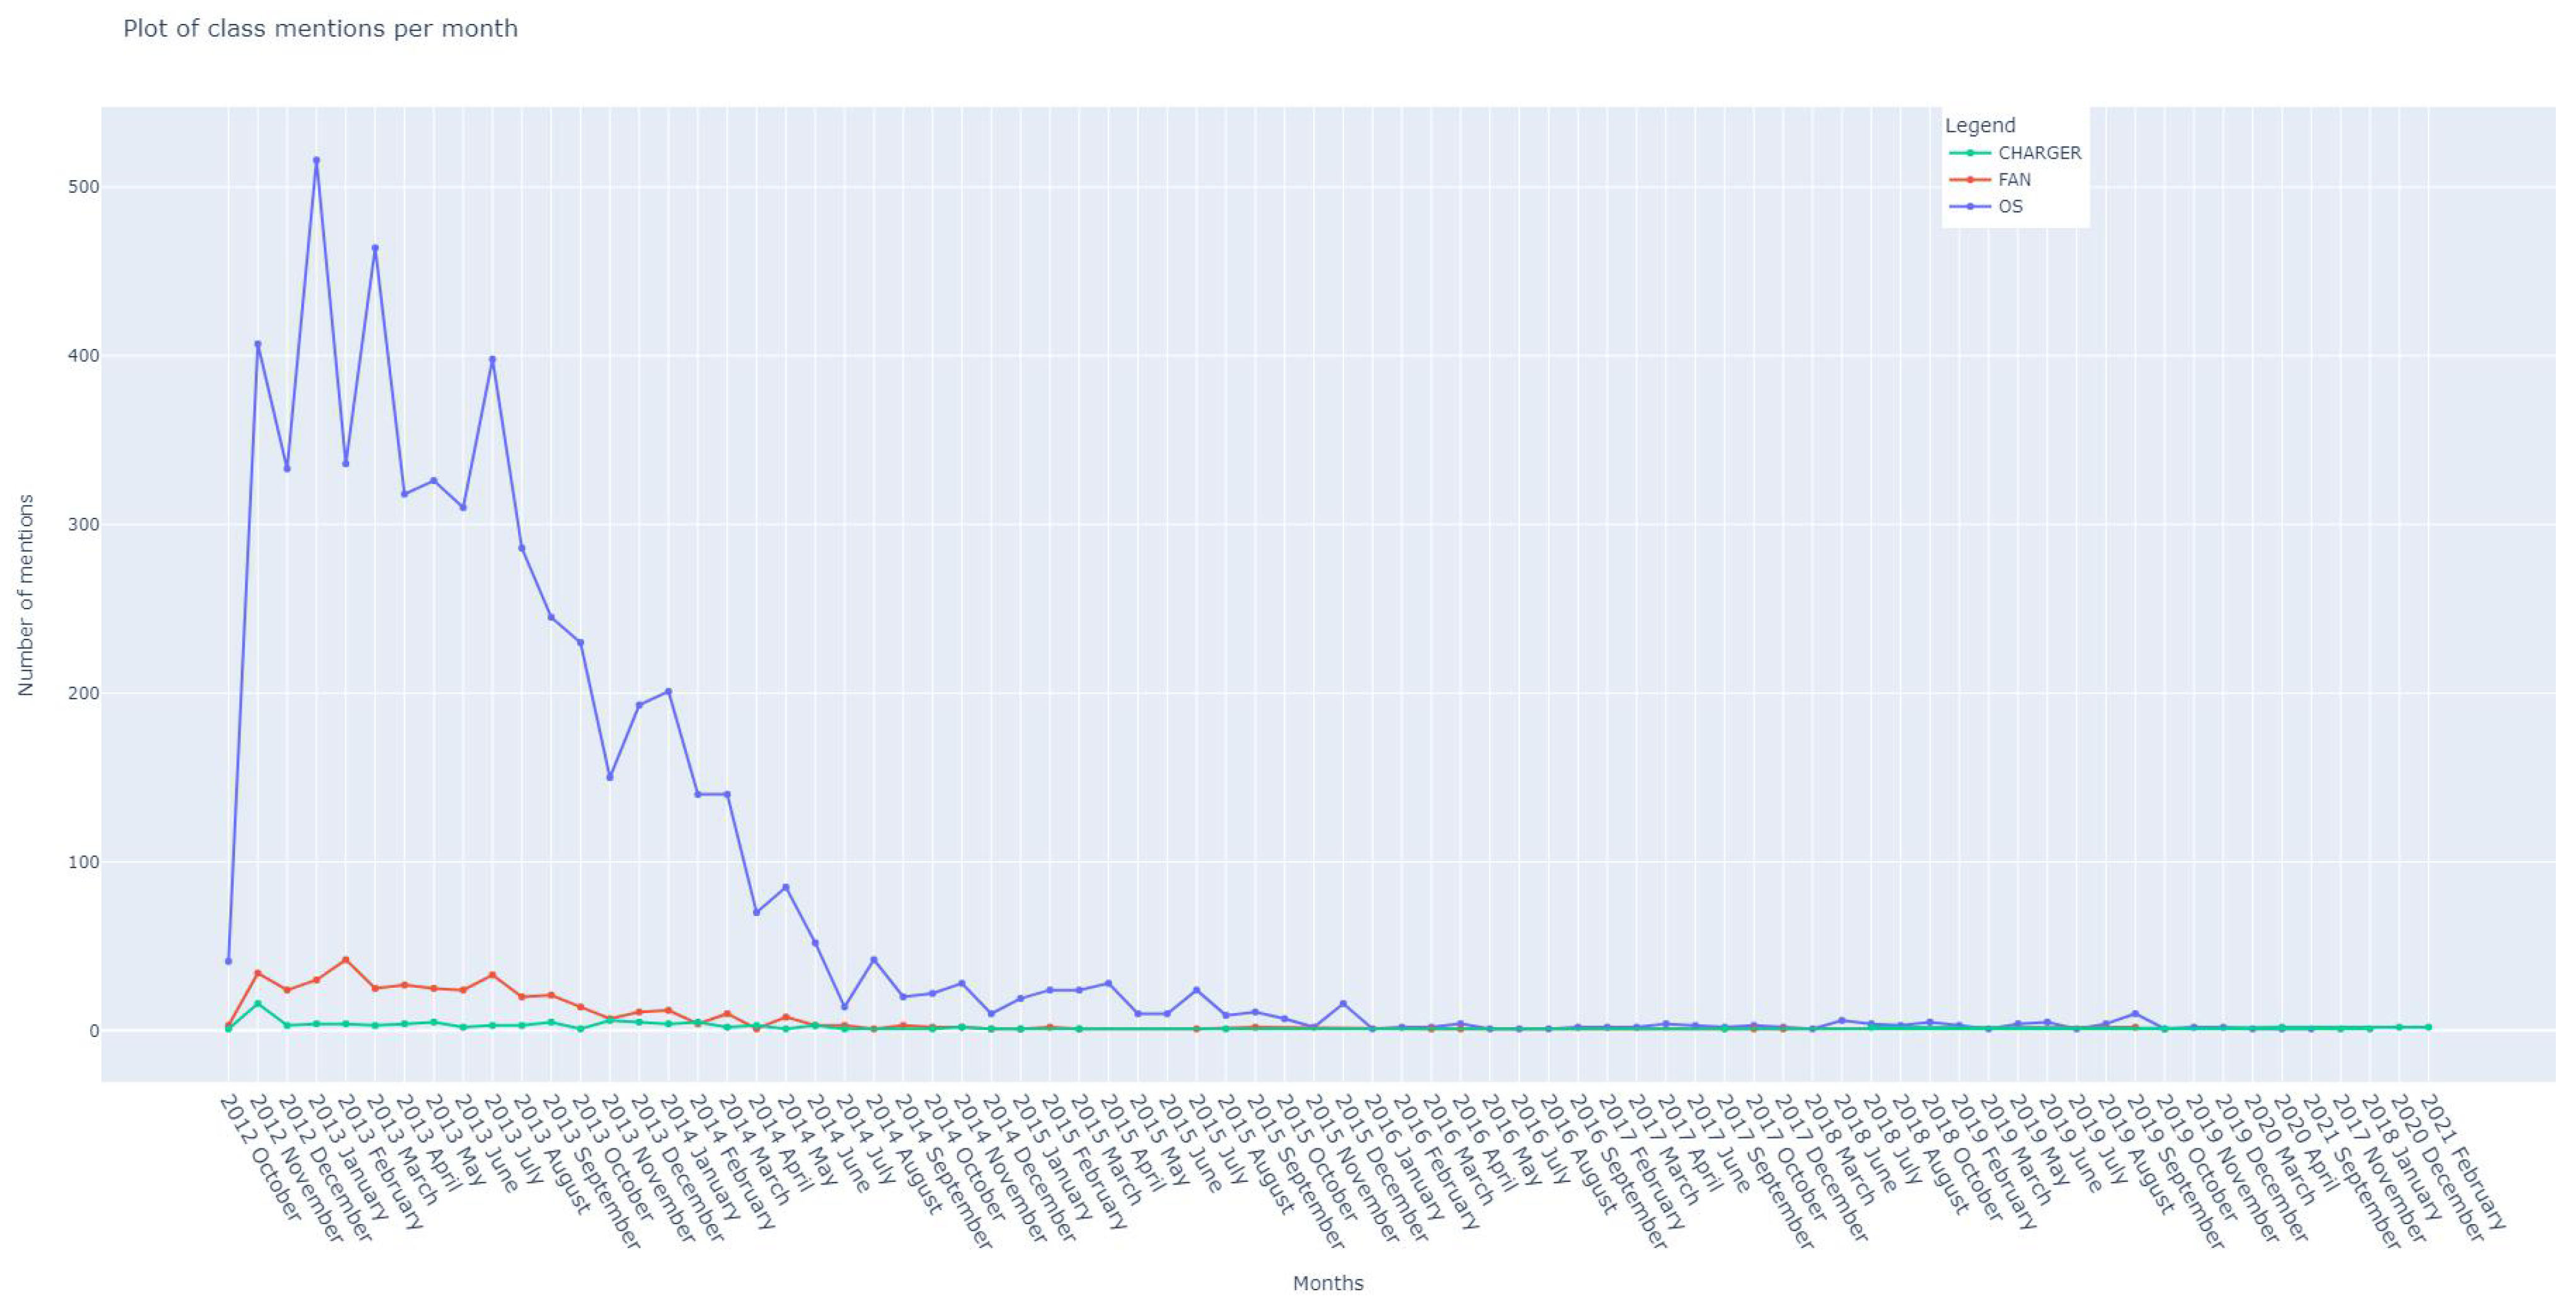
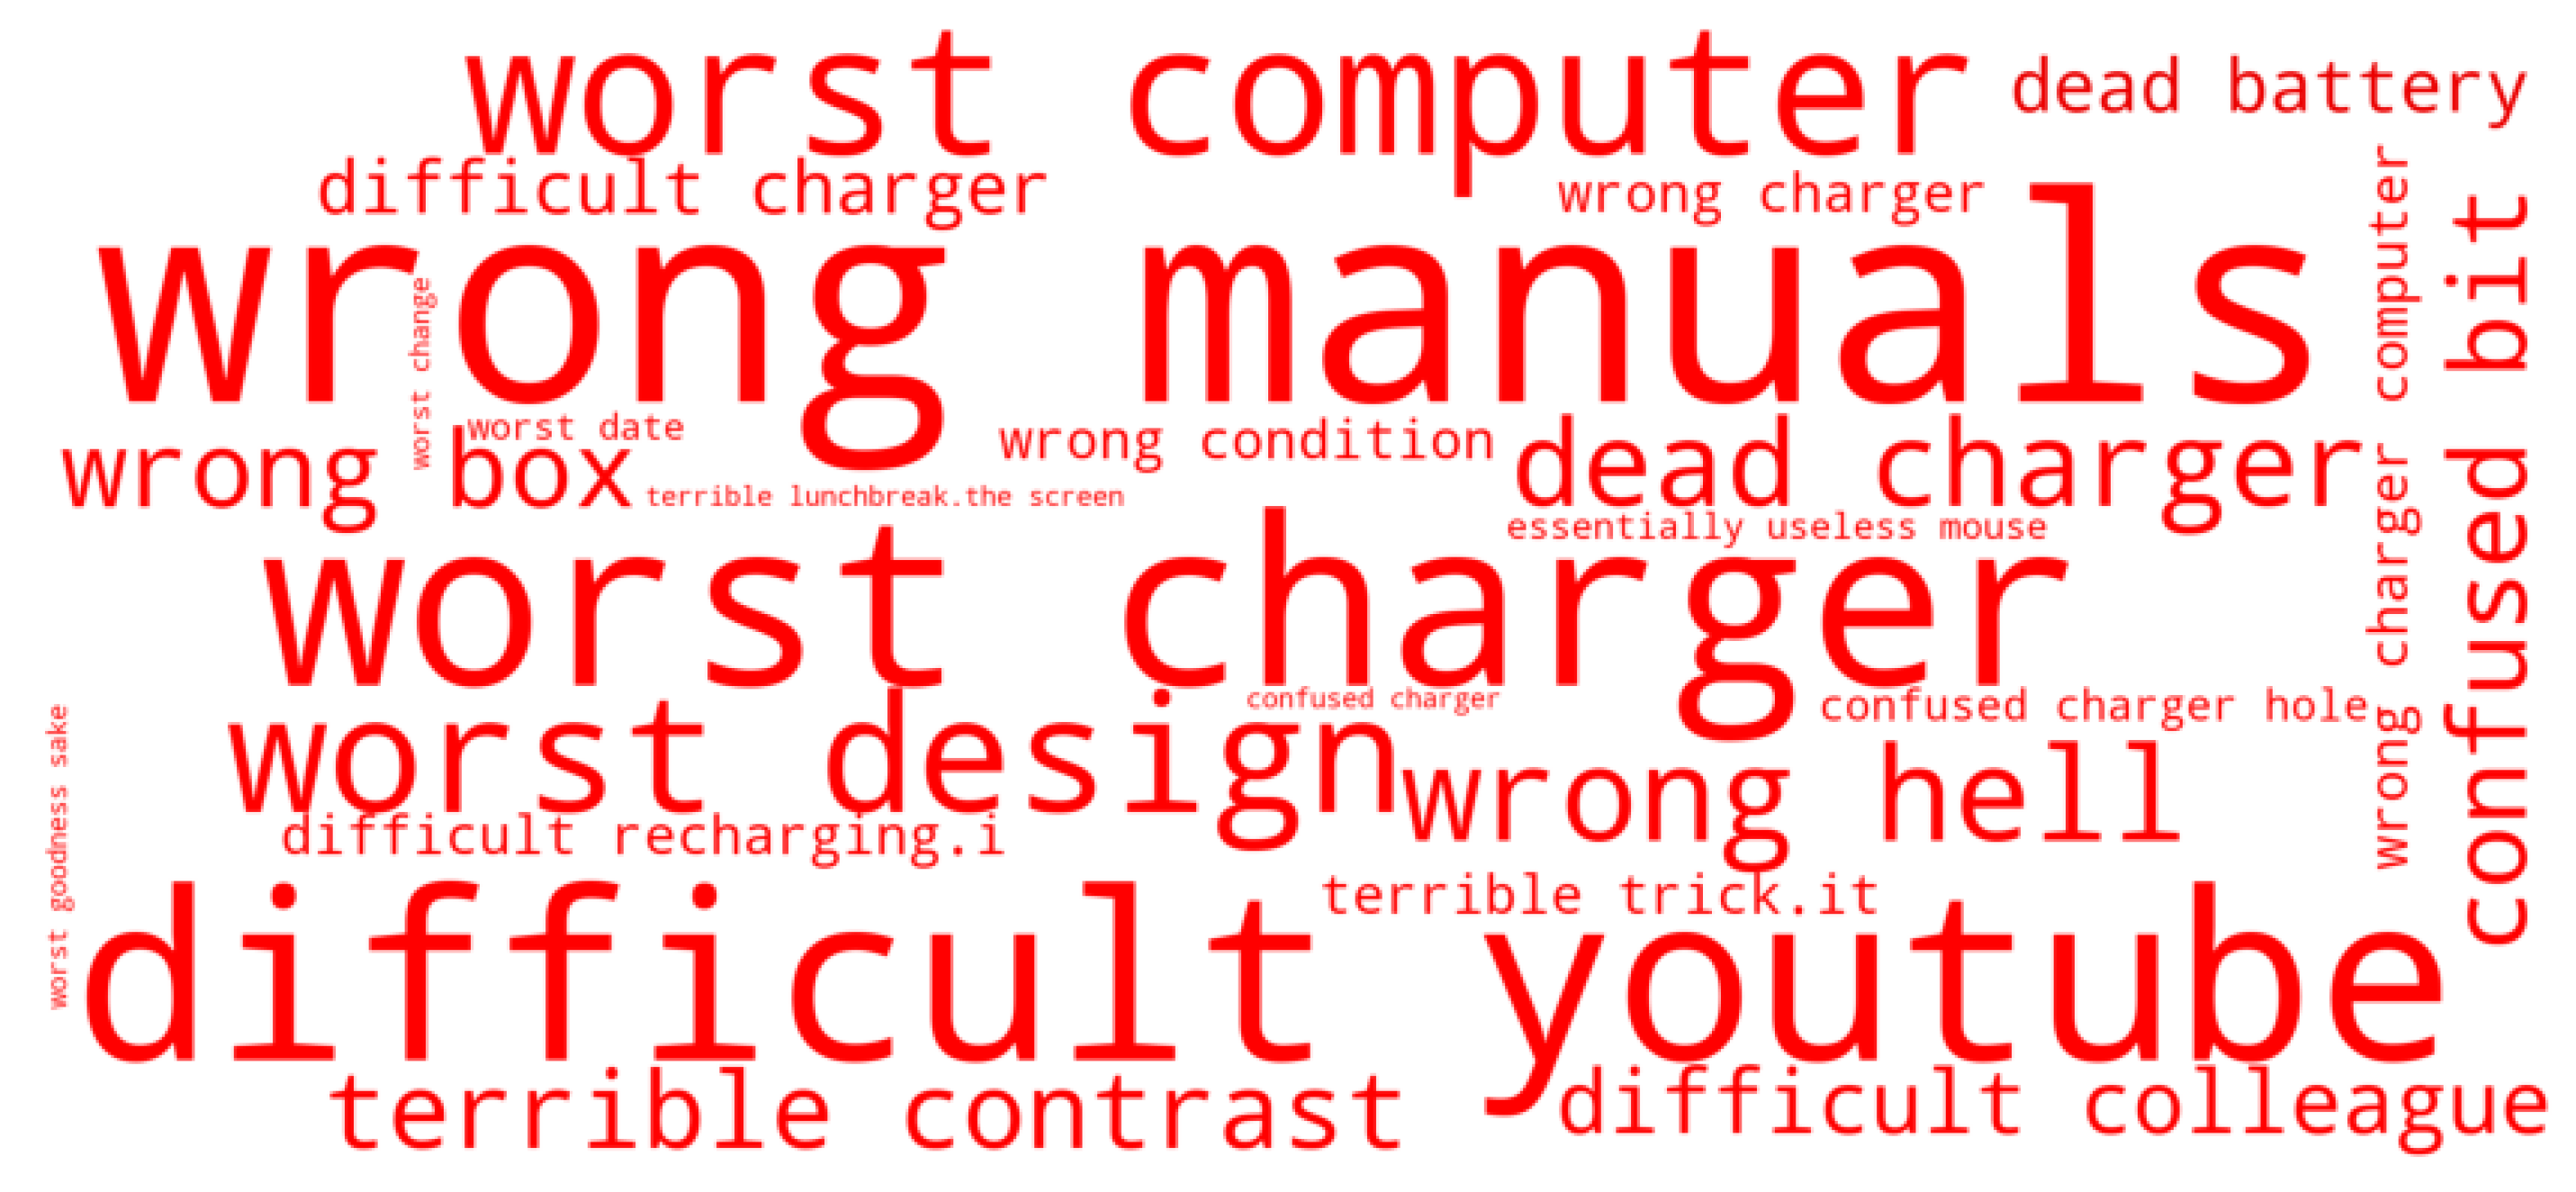
Table 1.
Details of model entities.
| Entity Type | Labels | Attributes |
|---|---|---|
| Vertex | Review | review_id, date |
| Vertex | Sentence | number, text |
| Vertex | Keyword | keyword |
| Vertex | Class | name |
| Edge | HAS_SENTENCE | – |
| Edge | HAS_OPINION_ON | polarity |
| Edge | BELONGS_TO | – |
| Edge | CO_OPINION | rev_intersect |
Table 2.
Graph database summary.
| ITEM | COUNT |
|---|---|
| Relationships | 52,505 |
| Nodes | 23,031 |
| Classes | 17 |
| Keywords | 193 |
| Reivews | 4325 |
| Sentences | 18,374 |
Table 3.
Top 10 positive co-mentioned aspect classes.
| CLASS1 | CLASS2 | COUNT |
|---|---|---|
| OS | LAPTOP | 817 |
| CONNECTIVITY | LAPTOP | 728 |
| DISPLAY | LAPTOP | 572 |
| KEYBOARD | LAPTOP | 531 |
| CONNECTIVITY | OS | 446 |
| PERFORMANCE | LAPTOP | 441 |
| BATTERY | LAPTOP | 430 |
| DISPLAY | OS | 381 |
| KEYBOARD | OS | 349 |
| CONNECTIVITY | DISPLAY | 332 |
Table 4.
Top 10 negative co-mentioned aspect classes.
| CLASS1 | CLASS2 | COUNT |
|---|---|---|
| OS | LAPTOP | 269 |
| CONNECTIVITY | LAPTOP | 218 |
| DISPLAY | LAPTOP | 174 |
| CONNECTIVITY | OS | 141 |
| DISPLAY | OS | 116 |
| KEYBOARD | LAPTOP | 97 |
| PERFORMANCE | LAPTOP | 95 |
| CONNECTIVITY | DISPLAY | 82 |
| MULTIMEDIA | LAPTOP | 82 |
| KEYBOARD | OS | 72 |
Table 5.
Comparison of the range of analyses types achievable in related works.
| Paper | Regular | Comparative | Ranking | Trend Extraction/Prediction | Targeted Phrase Summaries | Semantic/Implicit |
|---|---|---|---|---|---|---|
| Our work | ✓ | ✓ | ✓ | ✓ | ✓ | |
| [28] | ✓ | |||||
| [29] | ✓ | ✓ | ||||
| [30] | ✓ | ✓ | ||||
| [31] | ✓ | ✓ | ||||
| [32] | ✓ | ✓ | ||||
| [33] | ✓ | ✓ | ✓ | |||
| [34] | ✓ | ✓ | ||||
| [35] | ✓ | ✓ | ||||
| [36] | ✓ | |||||
| [37] | ✓ | ✓ | ||||
| [38] | ✓ | ✓ | ||||
| [39] | ✓ | ✓ | ||||
| [40] | ✓ | |||||
| [41] | ✓ | ✓ | ||||
| [42] | ✓ | ✓ | ||||
| [44] | ✓ | ✓ |
Publisher’s Note: MDPI stays neutral with regard to jurisdictional claims in published maps and institutional affiliations. |
© 2022 by the authors. Licensee MDPI, Basel, Switzerland. This article is an open access article distributed under the terms and conditions of the Creative Commons Attribution (CC BY) license (https://creativecommons.org/licenses/by/4.0/).
Share and Cite
MDPI and ACS Style
Kpiebaareh, M.Y.; Wu, W.-P.; Agyemang, B.; Haruna, C.R.; Lawrence, T. A Generic Graph-Based Method for Flexible Aspect-Opinion Analysis of Complex Product Customer Feedback. Information 2022, 13, 118. https://doi.org/10.3390/info13030118
AMA Style
Kpiebaareh MY, Wu W-P, Agyemang B, Haruna CR, Lawrence T. A Generic Graph-Based Method for Flexible Aspect-Opinion Analysis of Complex Product Customer Feedback. Information. 2022; 13(3):118. https://doi.org/10.3390/info13030118
Chicago/Turabian StyleKpiebaareh, Michael Y., Wei-Ping Wu, Brighter Agyemang, Charles R. Haruna, and Tandoh Lawrence. 2022. "A Generic Graph-Based Method for Flexible Aspect-Opinion Analysis of Complex Product Customer Feedback" Information 13, no. 3: 118. https://doi.org/10.3390/info13030118
Note that from the first issue of 2016, this journal uses article numbers instead of page numbers. See further details here.