Article

Design Demand Trend Acquisition Method Based on Short Text Mining of User Comments in Shopping Websites

1
School of Design, South China University of Technology, Guangzhou 510006, China
2
Guangzhou Code Camp Technology Co., Ltd., Guangzhou 510000, China
3
Department of Machine Learning, Mohamed bin Zayed University of Artificial Intelligence, Abu Dhabi 7909, United Arab Emirates
*
Authors to whom correspondence should be addressed.
These authors contributed equally to this work.
Information 2022, 13(3), 110; https://doi.org/10.3390/info13030110
Submission received: 3 January 2022 / Revised: 14 February 2022 / Accepted: 22 February 2022 / Published: 25 February 2022
(This article belongs to the Special Issue Text Mining: Classification, Clustering and Extraction Techniques)

Abstract

:
In order to facilitate designers to explore the market demand trend of laptops and to establish a better “network users-market feedback mechanism”, we propose a design and research method of a short text mining tool based on the K-means clustering algorithm and Kano mode. An improved short text clustering algorithm is used to extract the design elements of laptops. Based on the traditional questionnaire, we extract the user’s attention factors, score the emotional tendency, and analyze the user’s needs based on the Kano model. Then, we select 10 laptops, process them by the improved algorithm, cluster the evaluation words and quantify the emotional orientation matching. Based on the obtained data, we design a visual interaction logic and usability test. These prove that the proposed method is feasible and effective.

1. Introduction

With people’s increasing attention to industrial design and the innovation-driven industrial chain, the importance of design is becoming more and more obvious. Data show that online shopping has become the most common way to buy goods and most people prefer publishing their reviews after a period of use. As a result, users’ reviews play a critical role in the process of people’s purchases [1]. Most people tend to read user reviews before consumption. Many websites have developed a series of methods such as “product label” to make users’ reviews more accurate. Online review data have become the focus of manufacturers, and most manufacturers conduct large-scale network research on online review data. Since 2008, the scale of network research has been expanding. According to the statistics, 78% of market research companies have started network research projects, of which 81% use a third-party network research platform, and the number has increased exponentially over a long period of time [2]. However, there are some unavoidable problems in this traditional user survey design mode. For example, the research objects are disturbed by the problems set in advance, which will lead to the deviation of the function definition and user orientation.
User reviews on online shopping platforms have been a hot topic in the research of big online data for a long time. Although the online user reviews of products are extensive in scale, diverse in patterns, complex in content, and low in quality, we can still use “network data mining” to identify and summarize the real needs of users from a large number of reviews, find potential needs, quantify and visualize their results, and predict the future development of products. So we can build a better feedback mechanism between the market and designers. Based on the predicted product trend, we can also obtain effective suggestions according to the analysis of relevant data to enhance the user volume and attractiveness of the product. For instance, Bogdan et al. [3] designed a method to evaluate the profitability of the website and applied it to the Maria Zankovetska National Academic Ukrainian Drama Theater website (http://www.orchestra.lviv.ua/ accessed on 21 February 2022). Through analysis of the data over the past three years, they put forward some suggestions on attracting users in the COVID-19 crisis. At present, there are many methods that have been proposed for “network data mining”, such as latent Dirichlet allocation (LDA) model [4,5], long short-term memory (LSTM) [6,7], Biterm method for short text distance measurement (BDM) [8,9], targeted aspects oriented topic modeling (TATM) [10], swarm intelligence (SI) algorithms [11], natural language processing (NLP) [12,13,14,15], etc., but they all have their advantages and disadvantages [16,17,18,19,20,21].
Text mining is an important branch of data mining, which is to mine the data of text categories to obtain hidden data relationship information. Data mining uses relational tables and other storage structures to deal with the structured data in the database and discover knowledge. Because the data are semi-structured or unstructured, to the best of our knowledge, there is no suitable method to preprocess the text data. Finding an effective text data processing method is the challenge of text mining. However, most short text clustering research methods use Western languages, but the research on Chinese texts is at the initial stage. The key technologies, such as denoising and semantic expression, are different from those for English texts. Improving the research of specific text data mining based on Chinese to use the network text knowledge database effectively is also the focus of this field. The emotion analysis is another part of data mining [5,6,8,16,17,18,19,20]. How to use scientific methods to mine and match the emotional tendency of short text data is the crucial point. Most of the research uses English platforms, such as Twitter. There are also some text mining methods based on other languages, such as Arabic [22]. However, how to match the emotional tendency of Chinese text needs to be studied [5,23,24,25,26].
Mohammad et al. found that the data mining technology’s effectiveness is insufficient and still has excellent development potential [27]. Data clustering is often an initial procedure in the process of data analysis [28]. Data clustering is widely used in many fields today [24,27,28,29,30,31,32,33,34,35,36,37,38,39,40,41,42,43,44,45], but most research is concentrated in the biomedical field [29]. K-means has been developed for more than 60 years, and is mainly used in the clustering period of data mining technology. It has become the most traditional and efficient one in this area [30,31]. However, some old methods have many weaknesses, for example, the quantity of clusters is not accurate enough, and the original clustering center’s location may lead to the inaccuracy of results and a decrease in effectiveness [28]. Because of the above shortcomings, Yu et al. proposed two k-means algorithms to improve the accuracy of classification [32]. At the same time, short text clustering is prone to sparsity, so it is more challenging than long text. There are various algorithms for processing text data of Twitter, microblog, and shopping websites. Based on Twitter data, Stephan et al. analyzed and evaluated several mainstream document clustering and topic modeling technologies and demonstrated the improved cluster interpretation method and distance measurement method for the shortcomings of different methods [18]. Suganya et al. compared the performance of PSO, bat, GWO, and other algorithms, and found the algorithm suitable for finding the optimal solution based on the data set of BBC sports news [11]. Herman et al. used a Twitter data set to verify whether their method of calculating user interest is effective (DOI) [19]. The number of data mining experiments for Chinese text has been gradually increasing in recent years. Wu et al. improved the short text clustering algorithm based on title words, subject words and distance, and applied it to the discovery of microblog hot issues [9].
In this paper, based on online shopping and personal laptops, we propose a method of short text mining to quantify the user requirements and trend judgment of product design. The design of data visualization interaction is still carried out according to the experimental data. The innovations of this method are as follows:
  • After using the Jieba word segmentation tool (github.com/fxsjy/jieba) to segment Chinese text, we carried out a compact test and redundant pruning to deal with the large number of meaningless and repetitive words, and obtained a new frequent item set.
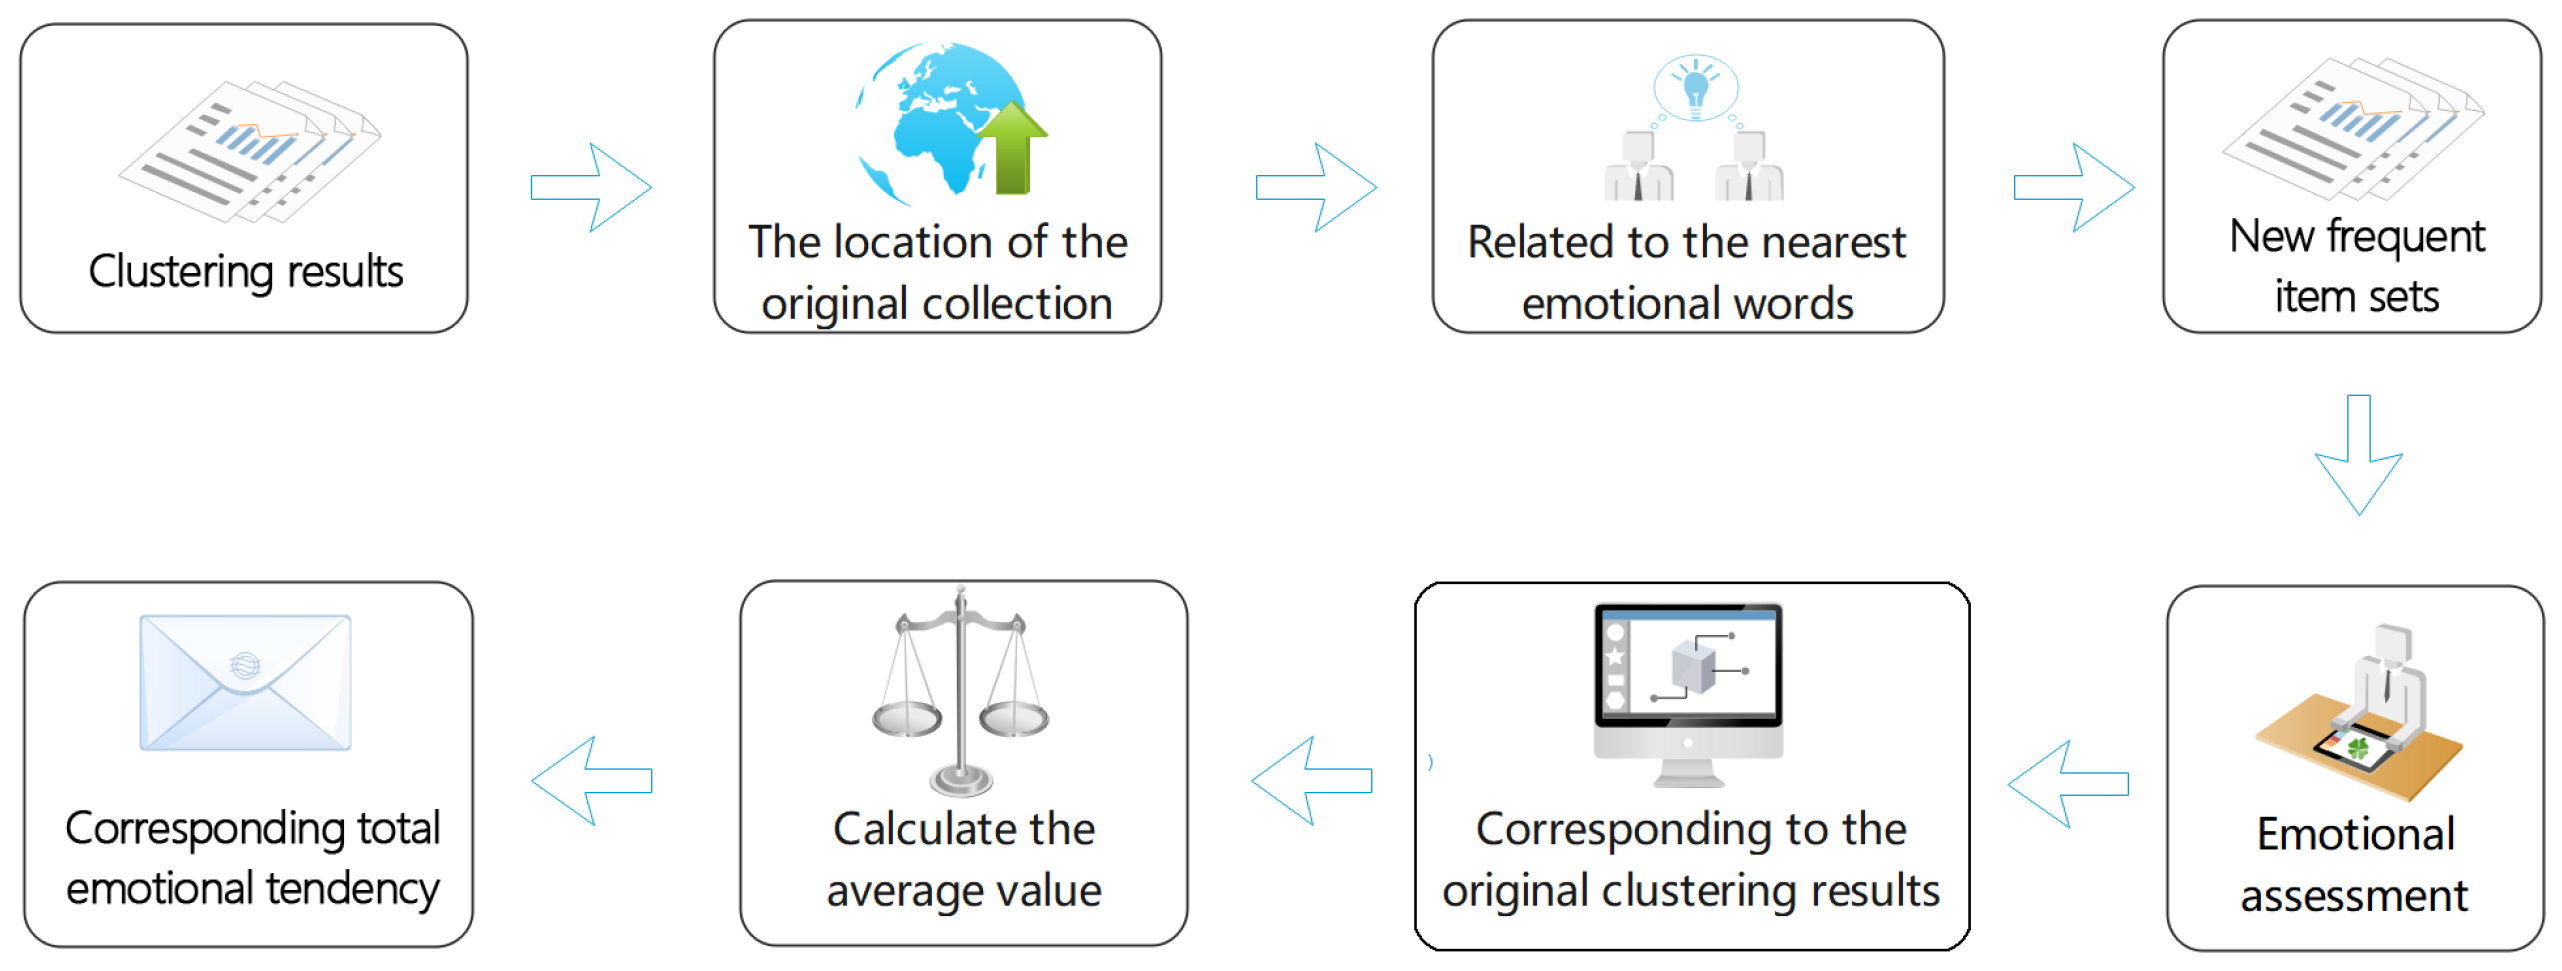
  • Based on Sogou input method’s Chinese emotional word class library and PFE algorithm, the number of product features and sentiment tendency expressions were obtained so as to test the feature support again and then eliminate more meaningless “noun adjective” combinations. Based on the get-score block of EmotionAnalysis and the Adjective emotion level setting, we assessed the emotional orientation.
  • We tried to solve the problems of quick comment, less information and ignoring the main body of the product by using a user-defined dictionary and the manual part of speech tagging. An experiment of designing and developing the element dictionary of oral online reviews was carried out because the complex item set lacks nouns or adjectives alone in the oral context of online reviews. Based on the experiments and the data obtained, this experiment attempted to put forward a specific quantitative definition of the network user demand degree and trend judgment of product design and development elements in order to make a general user demand and trend judgment.
  • The data visualization interaction solution was designed based on certain visualization theory and logic, and the usability evaluation test was carried out to verify the effectiveness of the solution.
Compared with previous works, this paper has the following main contributions:
  • A questionnaire was conducted on the user demand degree of laptop design elements, and extract design elements for mainstream laptops in the market. In addition to this, a method is proposed to quantify the users’ requirements, trend judgment when we design new goods.
  • The experimental definition is proposed to be scientific through further mining experiments and data summary. We also designed the data visualization interaction based on the experimental data and evaluated the prototype by usability test.
The rest of the paper is organized as follows: Section 2 discusses related works. Section 3 introduces the proposed method and process, and Section 4 analyzes and discusses the experimental data. Finally, Section 5 concludes the paper.

2. Related Works

2.1. Data Mining Technology

It has been more than 20 years since data mining was proposed, and a relatively perfect framework and methods have been formed in this field, with many researchers’ significant contributions. Ning et al. pointed out that text mining technology summarizes valuable information according to the results after using computer technology to analyze a large of text data [33]. Injadat et al. used 19 kinds of data mining technologies with social media data to study 9 different problems in 6 fields between 2003 and 2015 through analysis [27]. Wu et al. discussed the emotional tendency of Chinese residents toward the MSW classification policy and provided policymakers and practitioners with policy guidance for integrating current research fields into social development by analyzing the data of Sina Weibo users and their comments on relevant popular posts [34]. Therefore, we should spend more time and energy on the application of the data mining algorithm.
Nowadays, the accuracy of traditional text mining methods for short text data sets is reduced. Because of this, Rashid et al. proposed a new fuzzy topic modeling method to improve the sparsity of short text documents [35]. Anne et al. proposed a method that can analyze the research topics of online publications more accurately [46]. The existing data retrieval algorithm based on “Apriori” is not suitable for web text data mining. He et al. proposed an algorithm called the “Las Vegas strategy restart method” to solve such problems, which uses the Markov chain to predict the most startup period of each requested data item [36]. Zhang et al. further searched and excavated multi-dimensional objects based on multimodal data learning and proved the advancement and feasibility of the algorithm in later experiments based on the data provided by some official bodies [47]. Sérgio et al. experimented with testing how advertising on social networks works based on data from Facebook, and helped enterprises to evaluate whether to advertise on social networks [37]. Tuarob et al. designed an algorithm to find lead users automatically, then proved its effectiveness by an example [38]. However, the utilization rate of NLP has gradually increased in recent years. Prakash et al. summarized NLP and modern NLP, predicted the development direction of NLP, and briefly introduced its possible impact on the medical field [13]; although Cheng et al. proposed a combination method of selecting the NLP library to obtain more effective results [15], NLP still has some limitations. The selection of the NLP library has a great impact on the results’ effectiveness. How to select an effective toolkit is still challenging. Chris et al. summarized the latest development of three key components in the NLP library and proved their importance with examples. Their purpose is to provide an applicable and effective NLP vocabulary system [14]. Many scholars in various fields have been committed to promoting data mining for a long time. Layton [48,49], Khwaldeh [50] and many other researchers introduced data mining based on Python in detail in their works, and these demystify data mining [51,52,53].

2.2. Application of Data Mining

Now that “network data mining” is a hot topic, many scholars are constantly exploring its practical value. Suzen focused on the automatic scoring of short answer questions, and he applied data mining technology to measure whether students’ answers are similar to model answers to provide helpful feedback for students’ answers [39]. Chu et al. proposed a text expansion method based on short text data itself, making rich virtual documents consistent with the original documents in semantics, which are the short text clustering results’ effect [40]. Fidan et al. proposed a GRC model with high precision and stability in small data sets containing short texts and proved that it is an appropriate choice for short text clustering in small data sets through experiments [24]. Francesca introduced an application of ETM in brand management and proved that the whole process could reveal the characteristics of users in product preferences through the commercial application of a famous sportswear brand [41]. Finally, Hyder et al. proved that data mining on YouTube is an excellent method to understand the harvest patterns of different types of recreational fisheries [42].
An increasing number of scholars developed this technology in the area of product development and design. According to the numerical design structure matrix and genetic algorithm, Yang et al. conducted clustering research on a user’s emotional needs to facilitate designers to find users’ needs [43]. Vincent et al. studied the business incentive mechanism in fashion design, and used adaptive K-means to obtain the characteristics of successful products based on the purchase evaluation records [54]. Pajo et al. proposed a classification model to identify leading users and identify potential online users of candy products to evaluate this technology, which further reduces the cost of resources and time [44]. Chen proposed an unsupervised keyword mining method based on graph ranking, which is more effective than other methods of collecting CNKI literature abstracts and news corpora. They predicted that integrating domain knowledge into the model to improve the mining effect is a development direction [55]. However, the number of experimental samples is limited, and there is no further study on the potential needs of users. Nowadays, investigating and meeting users’ potential needs has become significant due to the product’s diversity.

2.3. Data Visualization

In today’s information explosion environment, how to show the association of data and knowledge context intuitively is also a big challenge. Many schools are now setting out to cultivate talent in the area of visual communication and application design. Based on the network data access platform. Moral et al. proposed an integrated modeling language to formulate the information visualization system’s conceptual model and gave several examples of information visualization [45]. According to data visualization and technology of IoT, Ceccarini et al. created and applied a test platform, which can enhance the sustainable development and security of the campus [56]. Keim proposed a classification of information visualization and visual data mining technology [57]. Valentin applied the GIS knowledge in information visualization, then expounded its promotion role in understanding [58]. Kamil et al. applied K-means to cluster the film reviews based on IMDB, mine the perceptual words, and display them with visualization methods, such as heat maps, which guides this study [59]. We find that improving the text mining algorithm for Chinese text, mining, and visualizing users’ potential needs more scientifically and accurately is a significant challenge for scholars.

3. Methodology

The research roadmap is shown in Figure 1. This figure summarizes the overall route of this research, and the specific route is shown in Section 3.1, Section 3.2, Section 3.3, Section 3.4 and Section 3.5. The route is divided into the objective data route on the left and the subjective data route on the right. The left route crawls the comment data of the shopping website and obtains the words and combinations guiding the product design trend through word segmentation and clustering, while the right route classifies the functional elements of the product by subjective means, such as subjective questionnaires and interviews. The results obtained on the left and right are compared and verified, and finally the results are visualized.

3.1. Research and Positioning of Laptop User Needs

The process in which people’s needs are expressed as beliefs, emotions, and behaviors in terms of cognition, emotion, and behavior is the generation and development of users’ potential demands for products. We then can express the association of the three attributes and users’ needs according to Kano.
We extract 17 design attributes of laptops, such as “keyboard”, “color”, “dissipate heat”, etc., and conduct an online questionnaire according to the attributes and online shopping habits (257 valid questionnaires). After observing the data, we can know the users’ age, price range’s proportion, and which website they like more. After observing the user demands proportion of the elements and the scoring questions, we obtain “design elements-user demands” classification, target users as ordinary buyers and laptop designers, and set the requirements.

3.2. Pre Experiment on Mining Short Comment Text of Shopping Website

The purpose of the pre-experiment is to conduct a data mining experiment based on a laptop on sale, establish a dictionary of design and development elements through data processing, and set the weight and match emotional tendency with relevant words. The emotional scores of design elements are used in a formal experiment. We can also verify the effectiveness of the experimental steps through the result of the pre-experiment. The pre-experiment is composed of seven steps.

3.2.1. User Comment Text Data Acquisition

Since 80.16% of users prefer to buy laptops through Jing dong, we conduct a pre-experiment on Jing dong. Lenovo Xiaoxin Chao 5000 (15.6-inch laptop, silver) is randomly selected to conduct the pre-experiment. Google browser is used as the data capture medium (Version number: 65.0.3325.181). Since we cannot capture text data automatically in the initial stage, we use static web pages to obtain comment data in advance. According to the steps shown in Figure 2, we crawl the comments page by page with the developed algorithm based on Python 2.7 and obtain the comments text data set of web users.

3.2.2. Stop Word Filtering, Word Segmentation and Word Frequency Statistics

Then, we use the “Jieba” word segmentation tool (version number: 0.39) to filter stop words in the captured text data set and get a new valid text set. Now that most of the data we obtain are sentences, we need to segment the text sets. This algorithm must cope with data quickly and cluster-changing online data in real time. We segment the valid text sets above (481 items) and count the word frequency with a word frequency statistical algorithm. Finally, we can obtain a high-frequency vocabulary statistics table.

3.2.3. Compact and Redundancy Check

However, there are still meaningless and repetitive words now; by observing the obtained text, we can see that the “noun–adjective” combination has a high frequency in users’ comments, for example, “the screen is good”, “the shape is nice”, “the startup is slow” and so on. Therefore, we use compact and redundant pruning based on this rule and obtain a new frequent itemset of the “noun–adjective” combination, such as “screen-good”, “shape-nice”, “startup-slow” F 1 .

3.2.4. Product Feature–User Sentiment Combination Extraction

We can find from the high-frequency word list that the feature words of user comments are the product’s features. Therefore, extracting feature words from comment texts to identify product features is necessary. Based on the Chinese emotional lexicon of “Sougou” and the PFE algorithm, we extract and count the emotional tendency of frequent itemset F 1 . We obtain the frequency of product features and emotional tendency expression to check the feature support and eliminate more meaningless “noun–adjective” combinations. Finally, we obtain a new simplified frequent itemset F 1 . We can also set the emotional level of adjectives based on the “get-score” of “Emotion Analysis” (optimized for Chinese) in the Python language class library and evaluate the emotional tendency accordingly.

3.2.5. Establish a Dictionary of Design and Development Elements

We also find that the frequency of the combination of “noun–adjective” occupies a leading position in the reviews, such as “The sound quality is very good”, where the noun is “sound quality” and the adjective is “good”, and the comments do not contain professional terms; this may be because users will default to comment on some aspects but ignore the main body. Therefore, based on the “noun–adjective” collocation, infrequent itemsets and the design elements of laptops obtained above, we try to establish a user-defined elements dictionary with the method of defining dictionaries and tagging parts of speech manually.

3.2.6. Clustering Effect Experiment

Clustering is an important algorithm of data mining. After establishing the dictionary of design elements, we conduct a weighted matching text clustering experiment on frequent itemset F 1 based on K means (where we set K = 17 ) and calculate the proportion of word frequency of design elements after clustering. Since the overlapping words among different design elements in the dictionary will affect the clustering result, a TF-IDF metric is used here and given a frequent itemset F 1 = d and an overlapping word t. Its TF-IDF score is defined as follows:
T F d , t = n d , t k n d , k ,
I D F t = 1 + log | D | d f t ,
T F I D F d , t = T F d , t I D F t ,
We observe the results before and after changing the corresponding weight of overlapping words. If the word frequency clustering results of related design elements change accordingly after we set the weight of a certain category of keywords, we can prove that it is feasible for us to extract the keywords from the complex word set based on online user reviews, match them with design elements, and cluster them by setting the keyword weight.

3.2.7. Emotional Orientation Matching

Based on the steps shown in Figure 3, we can match the emotion tendency of the clustering results’ emotion tendency based on the emotion evaluation experiment’s results and obtain the emotion evaluation data after weighted clustering.
If we want to find more specific requirements for some design elements, we must restore the initial evaluation to query, then trace the results based on the problem and decide if the above steps are reasonable.
Based on the pre-experiment and its data, we attempt to define the demand degree, development parts and quantify the product’s tendency judgment.
For product A, the user demand’s percentage of design factors is D k , (K: design factors, k 1 ).
For a single design element, the product of emotional assessment score P k and demand degree D k represents the design elements’ score S k ,
S k = P k · D k .
For product A, its factor’s score is S a , which represents its final comprehensive score.
We can further rank it with other similar products to obtain its design excellence in similar products. Moreover, since D k stands for the demand degree of the elements, the demand degree’s changing trend can be detected if we detect a change of D k ; different products’ user satisfaction can be compared by comparing S a to show the difference of design and then trace text to design details’ discrepancy to show users’ specific needs.

3.3. User Demand and Trend Mining Experiment of Laptop’s Design Elements

Based on the method and quantitative definition of pre-experiment, we randomly mine 10 laptops with different prices in the same life cycle according to the selection ratio of various price laptops in our questionnaire, summarizing the user’s needs and evolution tendency in the laptop area.
First, we can obtain the practical frequent itemsets after processing. Then, since the different laptops have a different number of frequent practical items, we use random functions to extract 500, 1000, 1500 items from each computer’s effective frequent itemsets to form new frequent itemsets F t 1 , F t 2 , and F t 3 (t stands for total). Then, we obtain three frequent item sets F t 1 , F t 2 , and F t 3 by matching elements dictionary, distributing overlapping word weight and clustering to obtain the three sets’ mining outcomes, compare the results with the “design elements–user demands” classification to prove whether or not the method of mining user comments is effective. After correcting the outcomes according to the statistical outcomes and the questionnaire’s survey results based on pleasure attribute, expectation attribute, essential attribute, we can obtain the hierarchical division of user demands based on F t 1 , F t 2 , F t 3 .
Based on 1500 valid texts selected before, we cluster the selected laptops and match their emotional tendency, then count the laptops’ experimental score based on the definition of the user’s demand of the laptop’s design element and compare them with Jing dong’s official praise to obtain a fair evaluation of each element of the selected laptop.

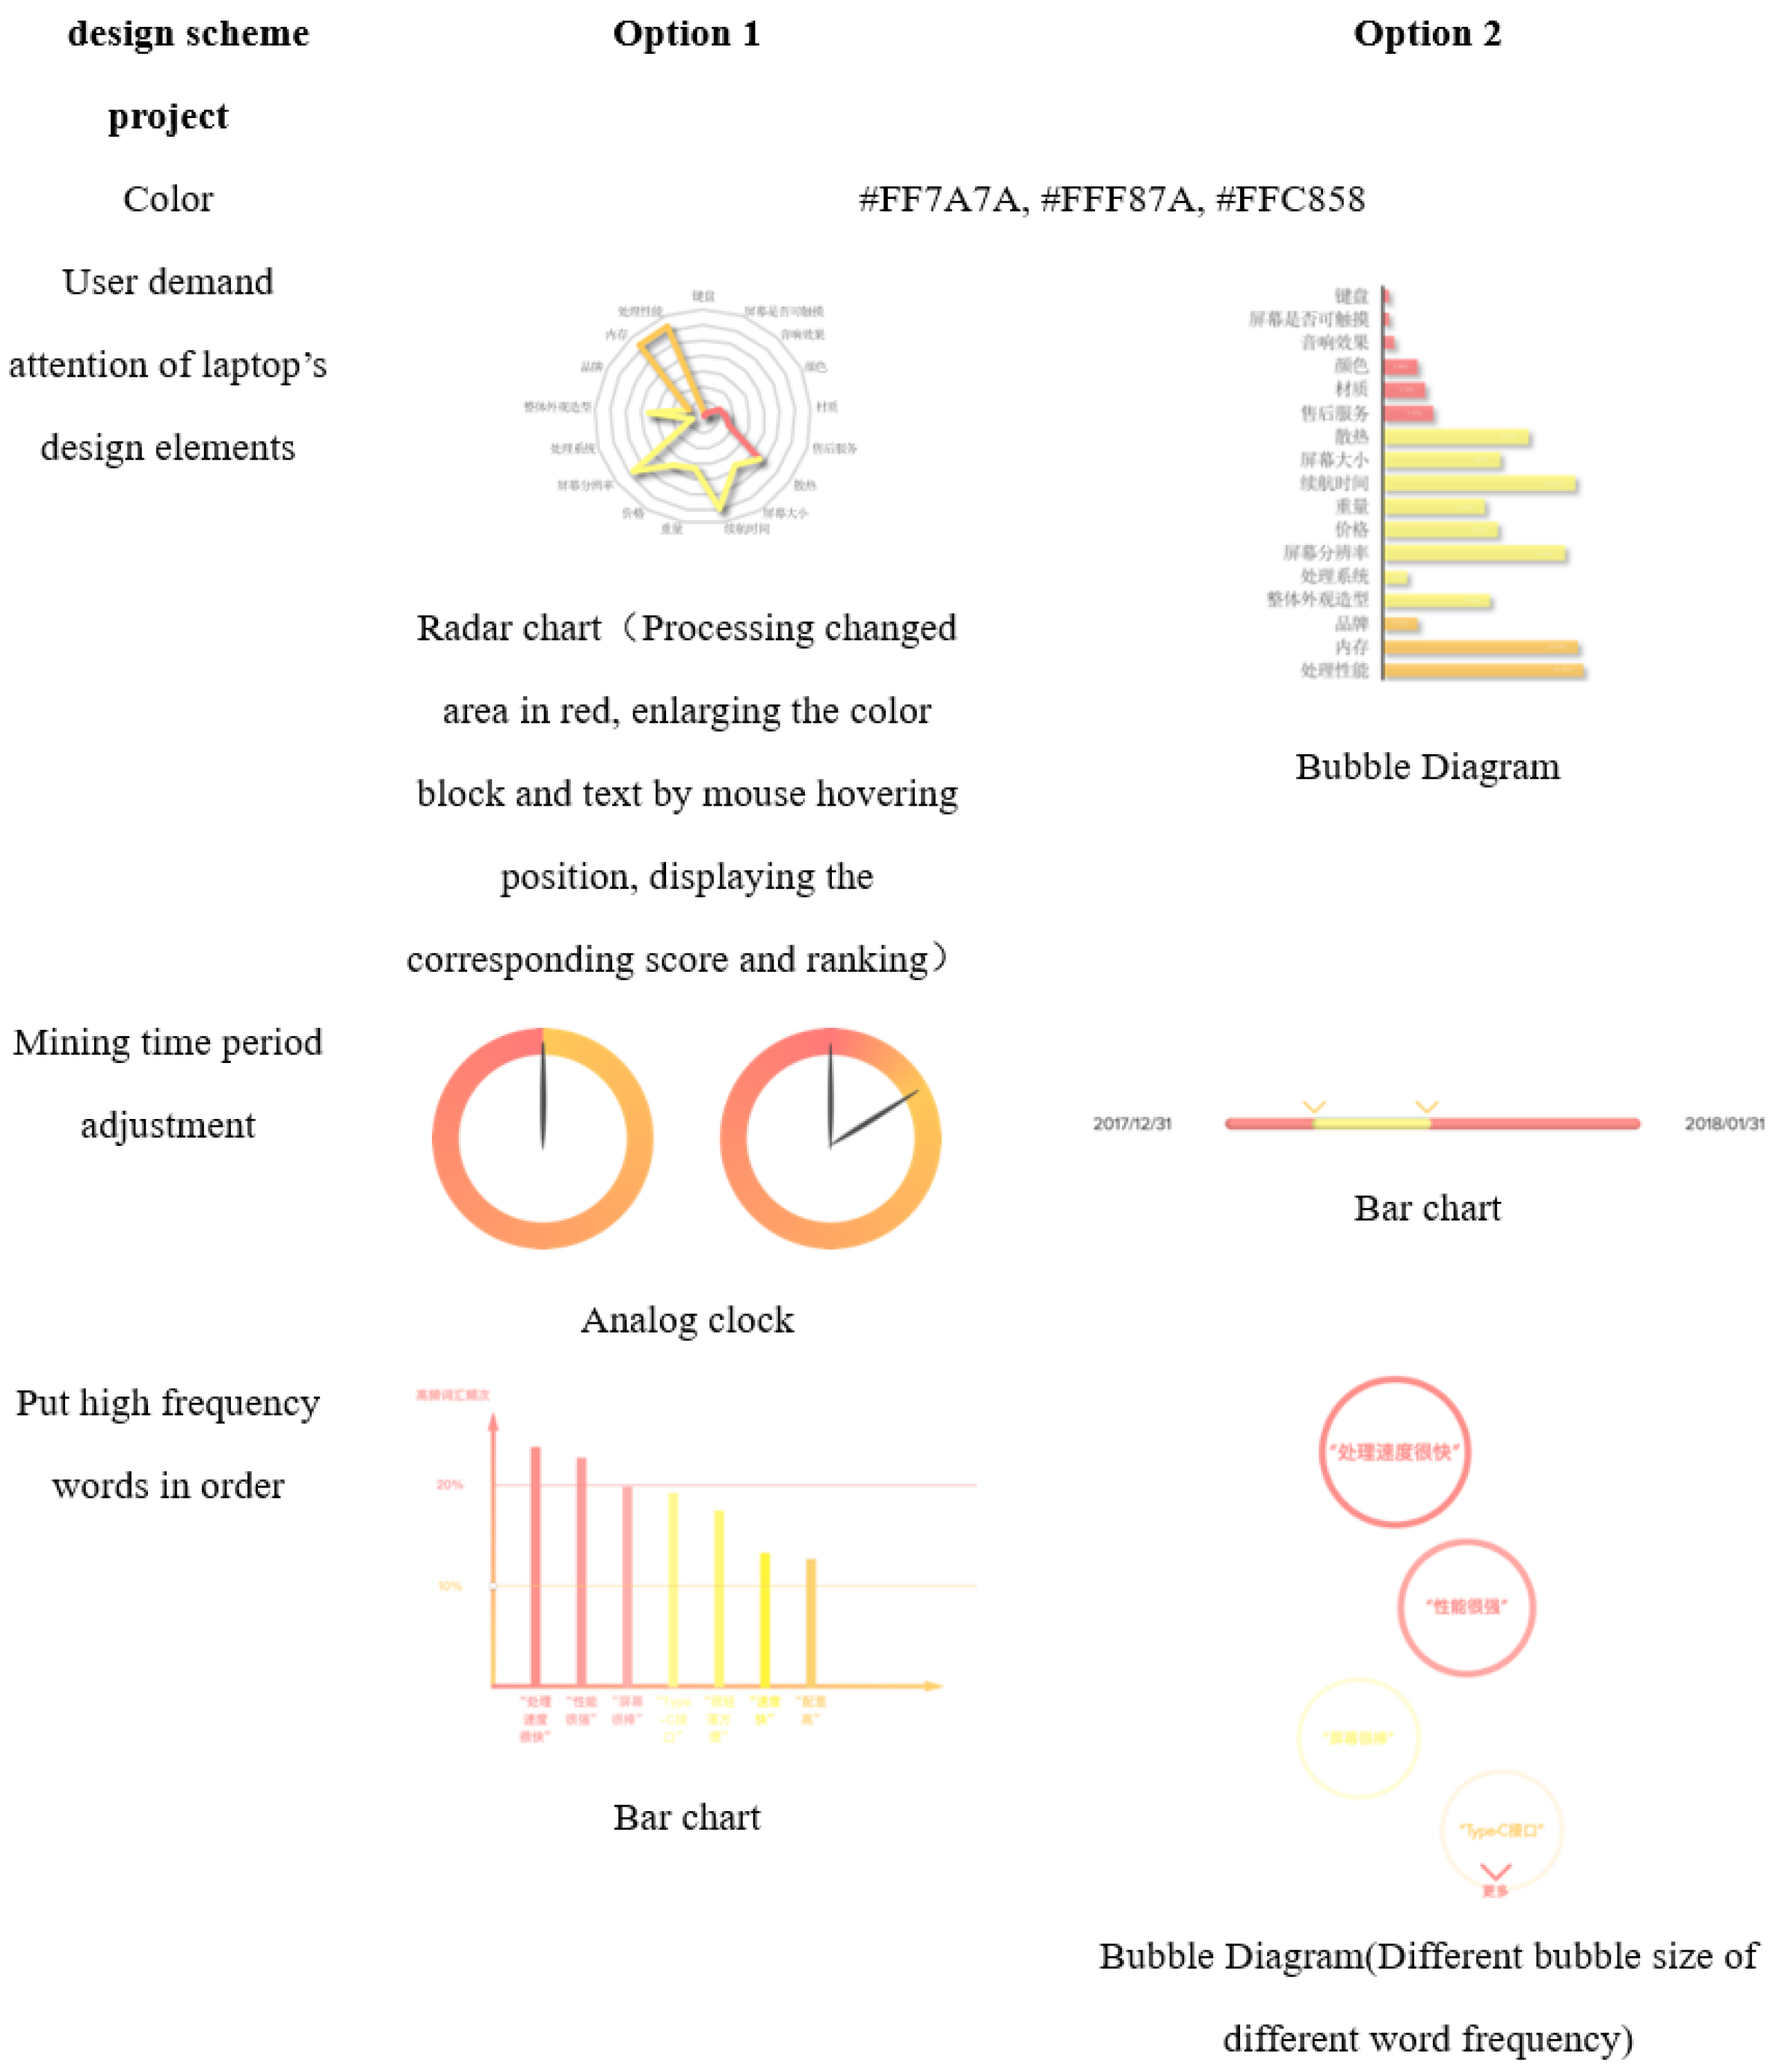
3.4. Data Visualization Design of Laptop’s User Demands

According to the theory of Professor Bertin [60], the design of the graph size, color, and many other aspects are all the means of data visualization based on associated data description principles, sorting, selection and quantity. Therefore, this paper’s final goal is to mine the user demands for the laptops’ design elements from shopping websites’ comments and make the result visual to obtain this data visualization tool’s interaction logic diagram (the diagram is shown in Figure 4).
Figure 4 shows the interaction logic diagram of the visualization tool. Based on the visualization tasks, this visualization task is mainly divided into two points:
  • Visual presentation of demand attention ratio, demand hierarchy classification, and sample extraction time of laptop’s design elements according to the comprehensive computer database.
  • Visual presentation of descending order of high-frequency words based on a whole computer database. Secondly, 10 users are selected to evaluate the scheme (this test includes four missions), and the availability of the visualization tool is judged according to the results.

3.5. Usability Test of Visualization Scheme

Based on the data visualization interaction solution proposed in this paper, we conduct an usability test, and the specific scheme is as follows.
A total of 30 users (15 male, 15 female, aged 24–53) participated in this assessment. Since there is no limitation of relevant experience and knowledge level, we did not ask the experimenters to accept the questionnaire survey before the experiment. The experimenters needed to completed the following four tasks:
  • The experimenters needed to compare and score the color sequence and composition (there are five levels: level 1 is very bad, level 2 is bad, level 3 is average, level 4 is like and level 5 is very like).
  • The experimenters needed to complete the chart observation of the user demand degree of laptop design elements within 10 s, and answer which design element accounts for the largest proportion immediately and calculate the correct rate.
  • The experimenters needed to complete the task of setting interception time on a MacBook provided by us as soon as possible, and record the complete time.
  • The experimenters needed to sort the high frequency word experiment within 20 s. After that, they sorted five high-frequency words in the questionnaire and collect the statistics of the accuracy.
According to the average score, time and accuracy of experimenters in usability test, we can evaluate the proposed visual interaction scheme.

4. Case Study, Result and Discussion

We can obtain the “design elements–user demands” classification (Table 1) according to the user demand proportion design elements and the scoring questions of a questionnaire.

4.1. Pre Experiment Result Analysis

We use the crawling algorithm based on Python 2.7 to grab the data of the design element. When we match emotional tendencies, the steps in Figure 4 are used based on the emotion analysis in Python. We can obtain the emotional evaluation data of the design elements by weighted clustering on “Jing dong” from 12 October 2017 to 30 November 2017, and obtain the web user comment text data set (793 valid comments). After filtering the stop words with the Jieba word segmentation tool, a practical text set (Table 2) is obtained.
We can obtain the following high-frequency word statistics (Table 3) after filtering the stop words and counting the word frequency.
After simplifying the frequent itemsets, we design a user-defined design element dictionary (Table 4) according to the “noun–adjective” collocation of new frequent itemsets and the design elements above.
In the clustering effect experiment, because there are overlapping words between different elements in the user-defined dictionary, the clustering effect of some elements is similar. We use the TF-IDF algorithm to carry out experimental weighted treatment according to the weight shown in Table 5. We can see that the result of the clustering experiment is good.
When matching emotional tendencies, as the steps shown in Figure 3, we can obtain the design elements’ emotional evaluation data of “Lenovo Xiaoxin chao5000” after weighted clustering by obtaining the score algorithm based on Python. As a result, the emotional evaluation data are listed in Table 6:
According to the data above, Lenovo Xiaoxin Chao5000 has a good reputation among users, but the emotional evaluation score of duration, screen resolution, and weight are low. Furthermore, through further backtracking of text data, we can find that users often comment on problems, so there are many negative words. Therefore, we should revise the weight of matching words more scientifically in the later stage.

4.2. User Demand and Trend Mining Experiment Result Analysis

According to the preference proportion of laptops at different prices in the questionnaire, we choose seven laptops between CNY 5000 and 10,000, two laptops above CNY 10,000, and one laptop between CNY 3000 and 5000, which are in the same life cycle to mine text data (31 December 2017–31 January 2018), according to the steps in the pre-experiment, and finally obtain the valid text set. Then, we mine the frequent itemsets F t 1 , F t 2 , and F t 3 composed of 500, 1000, and 1500 texts randomly selected using feature dictionary matching, overlapping word weight allocation, and clustering. Then, we compare the mining result with the demand degree of the design elements questionnaire results. We can see the similarity and credibility of F t 2 and F t 3 are higher and similar to the questionnaire results. It proves that the user demand data of laptops can be effectively obtained by mining the short comment text of network users after purchase. However, through further observation, we can find that since users will choose the system and brand before purchase, there are few comments on this aspect, which leads to the difference between the mining results and the questionnaire results. According to the results above and the questionnaire’s outcome, we can also obtain a hierarchy of network users’ demands based on frequent itemsets, and the result is listed in Table 7:
Then, we cluster the remaining five laptops based on the previous article, match the emotional orientation and finally calculate their total experimental score. The result is listed in Table 8.
According to the algorithm of Jing dong, the favorable ratings of the five laptops are 94%, 98%, 98%, 99%, and 99%, while the scores in this experiment are −0.0739, +0.1639, +0.1346, +0.1644, and +0.1467. The scores of Xiaomi Air (13.3 inches) and Apple MacBook Pro 2017 (13.3 inches) are quite different from the positive rating of Jing dong. Furthermore, through other text tracings, we can find that the memory of the Apple MacBook Pro 2017 (13.3 inches) is inconsistent with the price, and the cooling performance of Xiaomi Air (13.3 inches) is lacking, which all lead to a low comprehensive score.

4.3. Data Visualization Design of Laptop’s User Demands

Because the primary users are designers and design enthusiasts, they often use web pages to query information, so we design data visualization based on a 1920 × 1080 pixel screen size. We provide two solutions for the presentation of different design elements, and the two design schemes are shown in Figure 5.
After that, 30 users (15 men and 15 women) are selected for the usability test. We requested the subjects to fulfill four missions and complete the questionnaire after the test, and the result is shown in Table 9.
We can see that the subjects are delighted with the color. In the observation experiment of the proportion of user needs, the experimenters all received full marks. The results show that the radar chart and histogram can sufficiently express the proportion of user demand. In task 3, the interception results of the two-time interception schemes are different. The virtual clock scheme in scheme one does not conform to the user’s habit. The accuracy of the two test schemes in task 4 is similar, so high-frequency word sorting is good. Therefore, the two options are similar and can match the needs of users.

5. Conclusions and Future Works

In this paper, we take online shopping as the main starting point and propose an improved short text mining method based on user reviews of shopping websites. This method can quantify the user demand degree and trend of a laptop design element. First, we extract and preliminarily classify the design elements through the questionnaire. Then, we use the algorithm implemented by Python to grab the short text data of user comments and obtain the corresponding high-frequency vocabulary statistics table through the stop word filtering, word segmentation processing, and word frequency statistics. Thirdly, after the compactness and redundancy tests, we define the feature dictionary and use the TF-IDF algorithm to cluster based on the corresponding weight allocation. Finally, we carry out the emotional tendency matching and obtain the corresponding average score and total score based on the above results. A case study on 10 laptops of different prices is used to prove the rigor of the proposed method. The total evaluation score is calculated, and the experimental results are analyzed. The result indicates that our method can quantify the user’s demand and trend of laptop design elements well. The interaction logic of the data visualization tool is designed, and its usability is tested.
As for future work, we intend to improve the richness of the experimental samples and the scientificity of the weight. Now that the data mining of Chinese text lags behind the research of symbolic English text. Optimizing particular text data mining based on Chinese text is a challenge for more scholars.

Author Contributions

Conceptualization, Z.X. and Z.Y.; methodology, Z.X., Z.Y. and S.L.; software, Z.Y.; validation, Z.X., Z.Y., H.Y. and S.L.; formal analysis, Z.X., Z.Y. and S.L.; investigation, Z.Y. and H.Y.; resources, Z.X. and S.L.; data curation, Z.X. and S.L.; writing—original draft preparation, Z.Y.; writing—review and editing, Z.X. and S.L.; visualization, Z.Y.; supervision, Z.X.; project administration, Z.X. and S.L.; funding acquisition, Z.X. All authors have read and agreed to the published version of the manuscript.

Funding

The study was financed by the National Natural Science Foundation of China (No. 51105145).

Institutional Review Board Statement

Not applicable.

Informed Consent Statement

Informed consent was obtained from all subjects involved in the study.

Data Availability Statement

The data sets generated during and/or analyzed during the current study are available from the first or corresponding author on reasonable request.

Acknowledgments

The authors would like to thank Leng Shaowei for helping in the collection of experimental receipts.

Conflicts of Interest

The authors declare no conflict of interest.

References

  1. Hirsch, S.; Novgorodov, S.; Guy, I.; Nus, A. Generating Tips from Product Reviews. In Proceedings of the 14th ACM International Conference on Web Search and Data Mining, New York, NY, USA, 8–12 March 2021; pp. 310–318. [Google Scholar]
  2. Daria, J.; Kuss, M.D.G. Online Social Networking and Addiction-A Review of the Psychological Literature. Int. J. Environ. Res. Public Health 2011, 8, 3528–3552. [Google Scholar]
  3. Mochurad, B.; Fedushko, S.; Grytsay, O.; Todoshchuk, A.; Kovalchuk, U. Web Analytics, Legal Framework and Estimation of Profitability of the Theater Website. CEUR Workshop Proc. 2021, 2824, 65–76. [Google Scholar]
  4. Cao, N.; Ji, S.; Chiu, D.K.; He, M.; Sun, X. A deceptive review detection framework: Combination of coarse and fine-grained features. Expert Syst. Appl. 2020, 156, 1–11. [Google Scholar] [CrossRef]
  5. Alattar, F.; Shaalan, K. Using Artificial Intelligence to Understand What Causes Sentiment Changes on Social Media. IEEE Access 2021, 9, 61756–61767. [Google Scholar] [CrossRef]
  6. Ishaq, A.; Umer, M.; Mushtaq, M.F.; Medaglia, C.; Siddiqui, H.U.R.; Mehmood, A.; Choi, G.S. Extensive hotel reviews classification using long short term memory. J. Ambient. Intell. Humaniz. Comput. 2020, 12, 9375–9385. [Google Scholar] [CrossRef]
  7. Ali, F.; El-Sappagh, S.; Kwak, D. Fuzzy Ontology and LSTM-Based Text Mining: A Transportation Network Monitoring System for Assisting Travel. Sensors 2019, 19, 234. [Google Scholar] [CrossRef] [PubMed] [Green Version]
  8. Yang, S.; Huang, G.; Ofoghi, B.; Yearwood, J. Short text similarity measurement using context-aware weighted biterms. Neurocomputing 2020, 15, e5765. [Google Scholar] [CrossRef]
  9. Wu, D.; Zhang, M.; Shen, C.; Huang, Z.; Gu, M. BTM and GloVe Similarity Linear Fusion-Based Short Text Clustering Algorithm for Microblog Hot Topic Discovery. IEEE Access 2020, 8, 32215–32225. [Google Scholar] [CrossRef]
  10. He, J.; Li, L.; Wang, Y.; Wu, X. Targeted aspects oriented topic modeling for short texts. Appl. Intell. 2020, 50, 2384–2399. [Google Scholar] [CrossRef]
  11. Selvaraj, S.; Choi, E. Swarm Intelligence Algorithms in Text Document Clustering with Various Benchmarks. Sensors 2021, 21, 3196. [Google Scholar] [CrossRef]
  12. Baccouche, A.; Ahmed, S.; Sierra-Sosa, D.; Elmaghraby, A. Malicious Text Identification: Deep Learning from Public Comments and Emails. Information 2020, 11, 312. [Google Scholar] [CrossRef]
  13. Nadkarni, P.M.; Ohno-Machado, L.; Chapman, W.W. Natural language processing: An introduction. J. Am. Med. Inform. Assoc. Jamia 2011, 18, 544–551. [Google Scholar] [CrossRef] [PubMed] [Green Version]
  14. Lu, C.J.; Payne, A.; Mork, J.G. The Unified Medical Language System SPECIALIST Lexicon and Lexical Tools: Development and applications. J. Am. Med. Inform. Assoc. 2020, 27, 1600–1605. [Google Scholar] [CrossRef] [PubMed]
  15. Cheng, X.; Kong, X.; Liao, L.; Li, B. A Combined Method for Usage of NLP Libraries Towards Analyzing Software Documents. In Proceedings of the International Conference on Advanced Information Systems Engineering, Grenoble, France, 8–12 June 2020; pp. 515–529. [Google Scholar]
  16. Chen, J.; Gong, Z.; Liu, W. A Dirichlet process biterm-based mixture model for short text stream clustering. Appl. Intell. 2020, 50, 1609–1619. [Google Scholar] [CrossRef]
  17. Franzmann, D.; Eichner, A.; Holten, R. How Mobile App Design Overhauls Can Be Disastrous in Terms of User Perception: The Case of Snapchat. ACM Trans. Soc. Comput. 2020, 3, 1–21. [Google Scholar] [CrossRef]
  18. Curiskis, S.A.; Drake, B.; Osborn, T.R.; Kennedy, P.J. An evaluation of document clustering and topic modelling in two online social networks: Twitter and Reddit. Inf. Process. Manag. 2019, 57, 102034. [Google Scholar] [CrossRef]
  19. Wandabwa, H.M.; Naeem, M.A.; Mirza, F.; Pears, R. Topical affinity in short text microblogs. Inf. Syst. 2021, 96, 1–17. [Google Scholar] [CrossRef]
  20. Chen, J.; Yu, J.; Zhao, S.; Zhang, Y. User’s Review Habits Enhanced Hierarchical Neural Network for Document-Level Sentiment Classification. Neural Process. Lett. 2021, 53, 2095–2111. [Google Scholar] [CrossRef]
  21. Hu, J.; Peng, J.; Zhang, W.; Qi, L.; Hu, M.; Zhang, H. An Intention Multiple-representation Model with Expanded Information. Comput. Speech Lang. 2021, 68, 1–12. [Google Scholar] [CrossRef]
  22. Abdulateef, S.; Khan, N.A.; Chen, B.; Shang, X. Multidocument Arabic Text Summarization Based on Clustering and Word2Vec to Reduce Redundancy. Information 2020, 11, 59. [Google Scholar] [CrossRef] [Green Version]
  23. Ozyurt, B.; Akcayol, M.A. A new topic modeling based approach for aspect extraction in aspect based sentiment analysis: SS-LDA. Expert Syst. Appl. 2020, 168, 114231. [Google Scholar] [CrossRef]
  24. Fidan, H.; Yuksel, M.E. A Novel Short Text Clustering Model Based on Grey System Theory. Arab. J. Sci. Eng. 2020, 45, 2865–2882. [Google Scholar] [CrossRef]
  25. Oussous, A.; Benjelloun, F.Z.; Lahcen, A.A.; Belfkih, S. ASA: A framework for Arabic sentiment Analysis. J. Inf. Sci. 2020, 46, 544–559. [Google Scholar] [CrossRef]
  26. De Oliveira Júnior, G.A.; de Oliveira Albuquerque, R.; Borges de Andrade, C.A.; de Sousa, R.T.; Sandoval Orozco, A.L.; García Villalba, L.J. Anonymous Real-Time Analytics Monitoring Solution for Decision Making Supported by Sentiment Analysis. Sensors 2020, 20, 4557. [Google Scholar] [CrossRef]
  27. Injadat, M.; Salo, F.; Nassif, A.B. Data mining techniques in social media: A survey. Neurocomputing 2016, 214, 654–670. [Google Scholar] [CrossRef]
  28. Gan, G.; Ng, M.K.P. K-means clustering with outlier removal. Pattern Recognit. Lett. 2017, 90, 8–14. [Google Scholar] [CrossRef]
  29. Zhu, F.; Patumcharoenpol, P.; Zhang, C.; Yang, Y.; Chan, J.; Meechai, A.; Vongsangnak, W.; Shen, B. Biomedical text mining and its applications in cancer research. J. Biomed. Inform. 2013, 46, 200–211. [Google Scholar] [CrossRef] [Green Version]
  30. MacCuish, J.D.; MacCuish, N.E. Clustering in Bioinformatics and Drug Discovery; CRC Press: Boca Raton, FL, USA, 2010. [Google Scholar]
  31. Jain, A.K. Data clustering: 50 years beyond K-means. Pattern Recognit. Lett. 2010, 31, 651–666. [Google Scholar] [CrossRef]
  32. Yu, S.S.; Chu, S.W.; Wang, C.M.; Chan, Y.K.; Chang, T.C. Two improved k-means algorithms. Appl. Soft Comput. 2018, 68, 747–755. [Google Scholar] [CrossRef]
  33. Zhong, N.; Li, Y.; Wu, S.T. Effective pattern discovery for text mining. IEEE Trans. Knowl. Data Eng. 2010, 24, 30–44. [Google Scholar] [CrossRef] [Green Version]
  34. Wu, Z.; Zhang, Y.; Chen, Q.; Wang, H. Attitude of Chinese public towards municipal solid waste sorting policy: A text mining study. Sci. Total Environ. 2021, 756, 142674. [Google Scholar] [CrossRef] [PubMed]
  35. Rashid, J.; Shah, S.M.A.; Irtaza, A. Fuzzy topic modeling approach for text mining over short text. Inf. Process. Manag. 2019, 56, 102060. [Google Scholar] [CrossRef]
  36. He, P.; Luan, S. On-line data retrieval algorithm with restart strategy in wireless networks. J. Netw. 2014, 9, 3327. [Google Scholar] [CrossRef] [Green Version]
  37. Moro, S.; Rita, P.; Vala, B. Predicting social media performance metrics and evaluation of the impact on brand building: A data mining approach. J. Bus. Res. 2016, 69, 3341–3351. [Google Scholar] [CrossRef]
  38. Tuarob, S.; Tucker, C.S. Automated discovery of lead users and latent product features by mining large scale social media networks. J. Mech. Des. 2015, 137, 071402. [Google Scholar] [CrossRef]
  39. Süzen, N.; Gorban, A.N.; Levesley, J.; Mirkes, E.M. Automatic short answer grading and feedback using text mining methods. Procedia Comput. Sci. 2020, 169, 726–743. [Google Scholar] [CrossRef]
  40. Zheng, C.T.; Liu, C.; San Wong, H. Corpus-based topic diffusion for short text clustering. Neurocomputing 2018, 275, 2444–2458. [Google Scholar] [CrossRef]
  41. Greco, F.; Polli, A. Emotional Text Mining: Customer profiling in brand management. Int. J. Inf. Manag. 2020, 51, 101934. [Google Scholar] [CrossRef]
  42. Hyder, K.; Maravelias, C.D.; Kraan, M.; Radford, Z.; Prellezo, R. Marine recreational fisheries—Current state and future Opportunities. ICES J. Mar. Sci. 2020, 77, 2171–2180. [Google Scholar] [CrossRef]
  43. Yang, Y.P.; Chen, D.K.; Gu, R.; Gu, Y.F.; Yu, S.H. Consumers’ Kansei needs clustering method for product emotional design based on numerical design structure matrix and genetic algorithms. Comput. Intell. Neurosci. 2016, 2016, 5083213. [Google Scholar] [CrossRef] [Green Version]
  44. Pajo, S.; Vandevenne, D.; Duflou, J.R. Automated feature extraction from social media for systematic lead user identification. Technol. Anal. Strateg. Manag. 2017, 29, 642–654. [Google Scholar] [CrossRef] [Green Version]
  45. Moral, C.; de Antonio, A.; Ferre, X.; Ramirez, J. A proposed UML-based common model for information visualization systems. Multimed. Tools Appl. 2021, 80, 12541–12579. [Google Scholar] [CrossRef]
  46. Anne Parlina, K.R.; Murf, H. Theme Mapping and Bibliometrics Analysis of One Decade of Big Data Research in the Scopus Database. Information 2020, 11, 69. [Google Scholar] [CrossRef] [Green Version]
  47. Zhang, Y.; Yamamoto, T.; Dobashi, Y. Multi-scale object retrieval via learning on graph from multimodal data. Neurocomputing 2016, 207, 684–692. [Google Scholar] [CrossRef]
  48. Layton, R. Learning Data Mining with Python; Packt Publishing Ltd: Birmingham, UK, 2015. [Google Scholar]
  49. Raschka, S.; Mirjalili, V. Python Machine Learning: Machine Learning and Deep Learning with Python. In Scikit-Learn, and TensorFlow, 2nd ed.; Packt: Birmingham, UK, 2017. [Google Scholar]
  50. Khwaldeh, A.; Tahat, A.; Marti, J.; Tahat, M. Atomic data mining numerical methods, source code SQlite with Python. Procedia-Soc. Behav. Sci. 2013, 73, 232–239. [Google Scholar] [CrossRef]
  51. Stančin, I.; Jović, A. An overview and comparison of free Python libraries for data mining and big data analysis. In Proceedings of the 2019 42nd International Convention on Information and Communication Technology, Electronics and Microelectronics (MIPRO), Opatija, Croatia, 20–24 May 2019; pp. 977–982. [Google Scholar]
  52. Nie, J. Analysis of the Application of Python in Big Data Mining and Analysis. J. Guangxi Univ. Natl. 2018, 24, 76–79. [Google Scholar]
  53. Kane, F. Hands-on Data Science and Python Machine Learning; Packt Publishing Ltd.: Birmingham, UK, 2017. [Google Scholar]
  54. Vincent, O.; Makinde, A.; Salako, O.; Oluwafemi, O. A self-adaptive k-means classifier for business incentive in a fashion design environment. Appl. Comput. Inform. 2018, 14, 88–97. [Google Scholar] [CrossRef]
  55. Chen, W.; Yu, Z.; Xian, Y.; Wang, Z.; Wen, Y. Mining Keywords from Short Text Based on LDA-Based Hierarchical Semantic Graph Model. Int. J. Inf. Syst. Serv. Sect. (IJISSS) 2020, 12, 76–87. [Google Scholar] [CrossRef]
  56. Ceccarini, C.; Mirri, S.; Salomoni, P.; Prandi, C. On exploiting Data Visualization and IoT for Increasing Sustainability and Safety in a Smart Campus. Mob. Netw. Appl. 2021, 26, 2066–2075. [Google Scholar] [CrossRef]
  57. Keim, D.A. Information visualization and visual data mining. IEEE Trans. Vis. Comput. Graph. 2002, 8, 1–8. [Google Scholar] [CrossRef]
  58. Măzăreanu, V.P. Using geographical information systems as an information visualization tool. A case study. Ann. Alexandru Ioan Cuza Univ.-Econ. 2013, 60, 13–20. [Google Scholar] [CrossRef]
  59. Topal, K.; Ozsoyoglu, G. Emotional classification and visualization of movies based on their IMDb reviews. Inf. Discov. Deliv. 2017, 45, 149–158. [Google Scholar] [CrossRef]
  60. Kraak, M.J. Semiology of Graphics: Diagrams Networks Maps. Cartogr. J. 2011, 48, 153. [Google Scholar]
Figure 1. Design demand trend acquisition framework.
Information 13 00110 g001
Figure 2. Steps for review data acquisition.
Information 13 00110 g002
Figure 3. Specific process of matching emotional tendency.
Information 13 00110 g003
Figure 4. Interaction logic diagram of visualization tool.
Information 13 00110 g004
Figure 5. Two design schemes of data visualization.
Information 13 00110 g005
Table 1. Design elements-user demands classification.
Equipment AttributesLaptops’ Design Elements and It Proportion (%)
PleasureKeyboard (14.40%)Touch screen or not (14.79%)Sound effect (21.01%)
AttributeColor (33.85%)Material (34.63%)After-sale service (44.74%)
ExpectedDissipate heat (54.47%)Screen size (55.25%)Endurance (55.64%)
PropertiesWeight (62.65%)Price (69.65%)Screen resolution (72.37%)
Processing system (80.54%)Apperance (84.05%)
Basic attributesBrand (85.21%)Memory (87.55%)Processing performance (92.22%)
Table 2. Valid text set of Lenovo Xiaoxin chao 5000 (481 valid text).
NumberValid Text
1The service attitude of express brother is very good
2It’s good to buy this kind of thing for the first time
......
480Daily work is very good
481The computer is fast
Table 3. High-frequency vocabulary statistics (part).
WordFrequency of OccurrenceTotal Proportion
Fast67150.04%
Good screen22917.08%
Nice shape16812.53%
Slow startup735.44%
Good service attitude664.92%
Fine color614.55%
A little heavy473.50%
Table 4. User-defined design element dictionary.
Design ElementDictionaryDesign ElementDictionary
MaterialFeel, Touch, Metal, Plastic, Grade, High/Low gradeKeyboardKeyboard, Type, Knock, Feel
MemoryEnough, Hard disk, Mechanical hard disk, SSD, SaveTouch screenTouch
After-sale serviceExchange, Complain, Attitude, Contact time, Express speedSound effectSound effects, Sound quality
AppearanceColor, Style, Good-looking, Fashion, Grade, High/Low gradeColorStyle, Good-looking, Fashion
Screen resolutionScreen effects, Image quality, Clear, Fuzzy, Display, ShadowBrandLenovo, China-made, Brand
Endurance time WeightBattery, Power, Durable, Abiding, No powerDissipate heatBurn, Fan, Hot
WeightWeight, Light, Overweight, Heavy, Convenient, CarryScreen sizeSize to fit
Processing systemSystem, Microsoft, Software, Win10, Win7PriceHigh/Low price, Cost performance, Expensive, Cheap
Processing performanceFast/Low, Powerful, Starting-up, Lagging
Table 5. Weight distribution of overlapping words.
Overlapping WordsDesign ElementCorresponding Weight (Total Ratio: 1)
Style, Good-looking, Fashion, Grade, High/Low gradeOverall appearance0.6
Style, Good-looking, Fashion, Grade, High/Low gradeColor0.2
Feel, GradeMaterial0.12
FeelKeyboard0.08
Table 6. Design elements’ emotional evaluation data.
Design ElementAverage Score of Emotional
Assessment (−0.3∼+0.3)
Design ElementAverage Score of Emotional
Assessment (−0.3∼+0.3)
Keyboard+0.1267Weight−0.2037
Touch screen or not0Price+0.2230
Sound effect+0.1142Screen resolution−0.1875
Color+0.2133Processing system+0.0244
Material+0.1426Appearance+0.1587
After-sale service+0.1231Brand+0.2662
Dissipate heat−0.0189Memory+0.0055
Screen size+0.1877Processing performance+0.0102
Endurance time−0.1998
Table 7. User requirement hierarchy division of laptop’s design element attribute.
Element AttributePleasure AttributeExpected PropertiesBasic Attributes
keyboard, touch screendissipate heat, screenBrand, memory
Design elementor not, sound effect, color, material, after-sale servicesize, endurance time, weight, price, screen resolution, processing system, appearanceprocessing performance
Table 8. Comprehensive score of 5 laptops.
Model of LaptopComprehensive Score S_(a)
ASUS A456UR7200 (14 inch)−0.0739
ThinkPad Yi 480 (14 inch)+0.1639
Xiaomi Air (13.3 inch)+0.1346
Surface Laptop+0.1644
Apple MacBook Pro 2017 (13.3 inch)+0.1467
Table 9. Statistical table of test results.
Option 1Option 2
Task NumberAverage ScoreAverage Time/sAverage AccuracyAverage ScoreAverage Time/sAverage Accuracy
14.54.1
2100%100%
314.510.3
446%51%
Publisher’s Note: MDPI stays neutral with regard to jurisdictional claims in published maps and institutional affiliations.

