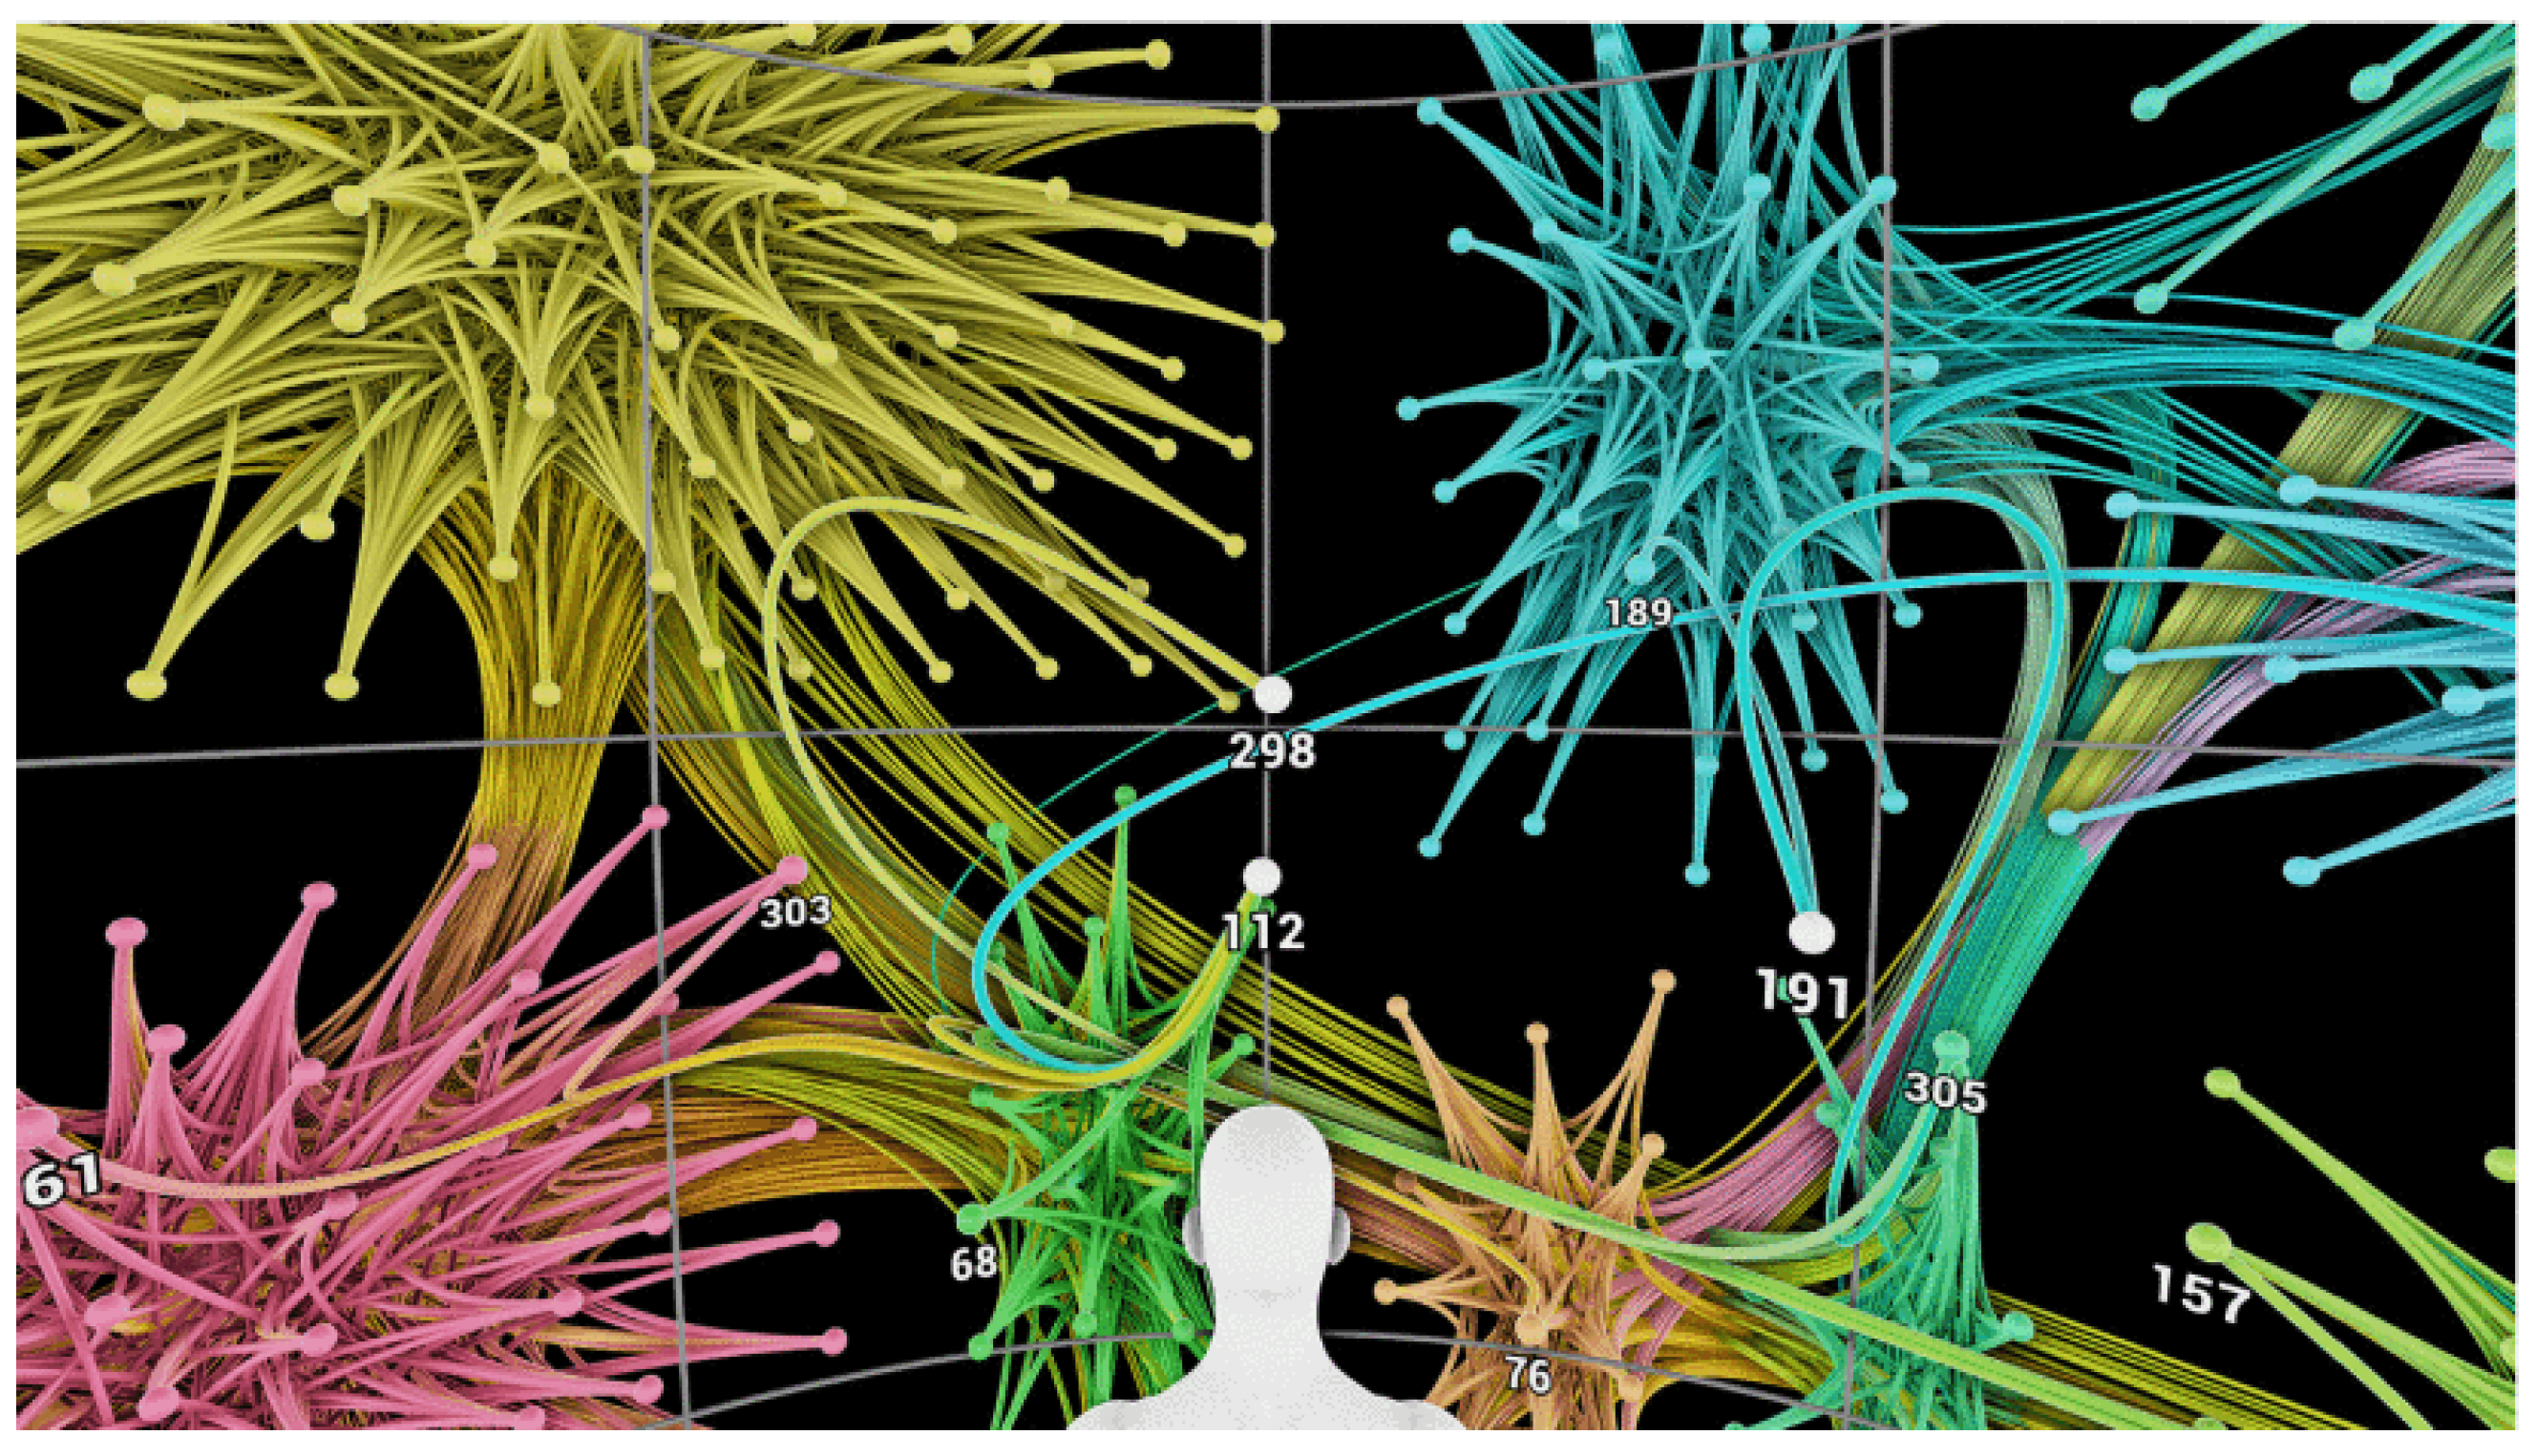
The Spherical Retractable Bubble Space: An Egocentric Graph Visualization throughout a Retractable Visualization Space
Abstract
:1. Introduction
2. The State of the Art of Egocentric Visualization
3. The Spherical Retractable Bubble Space Metaphor
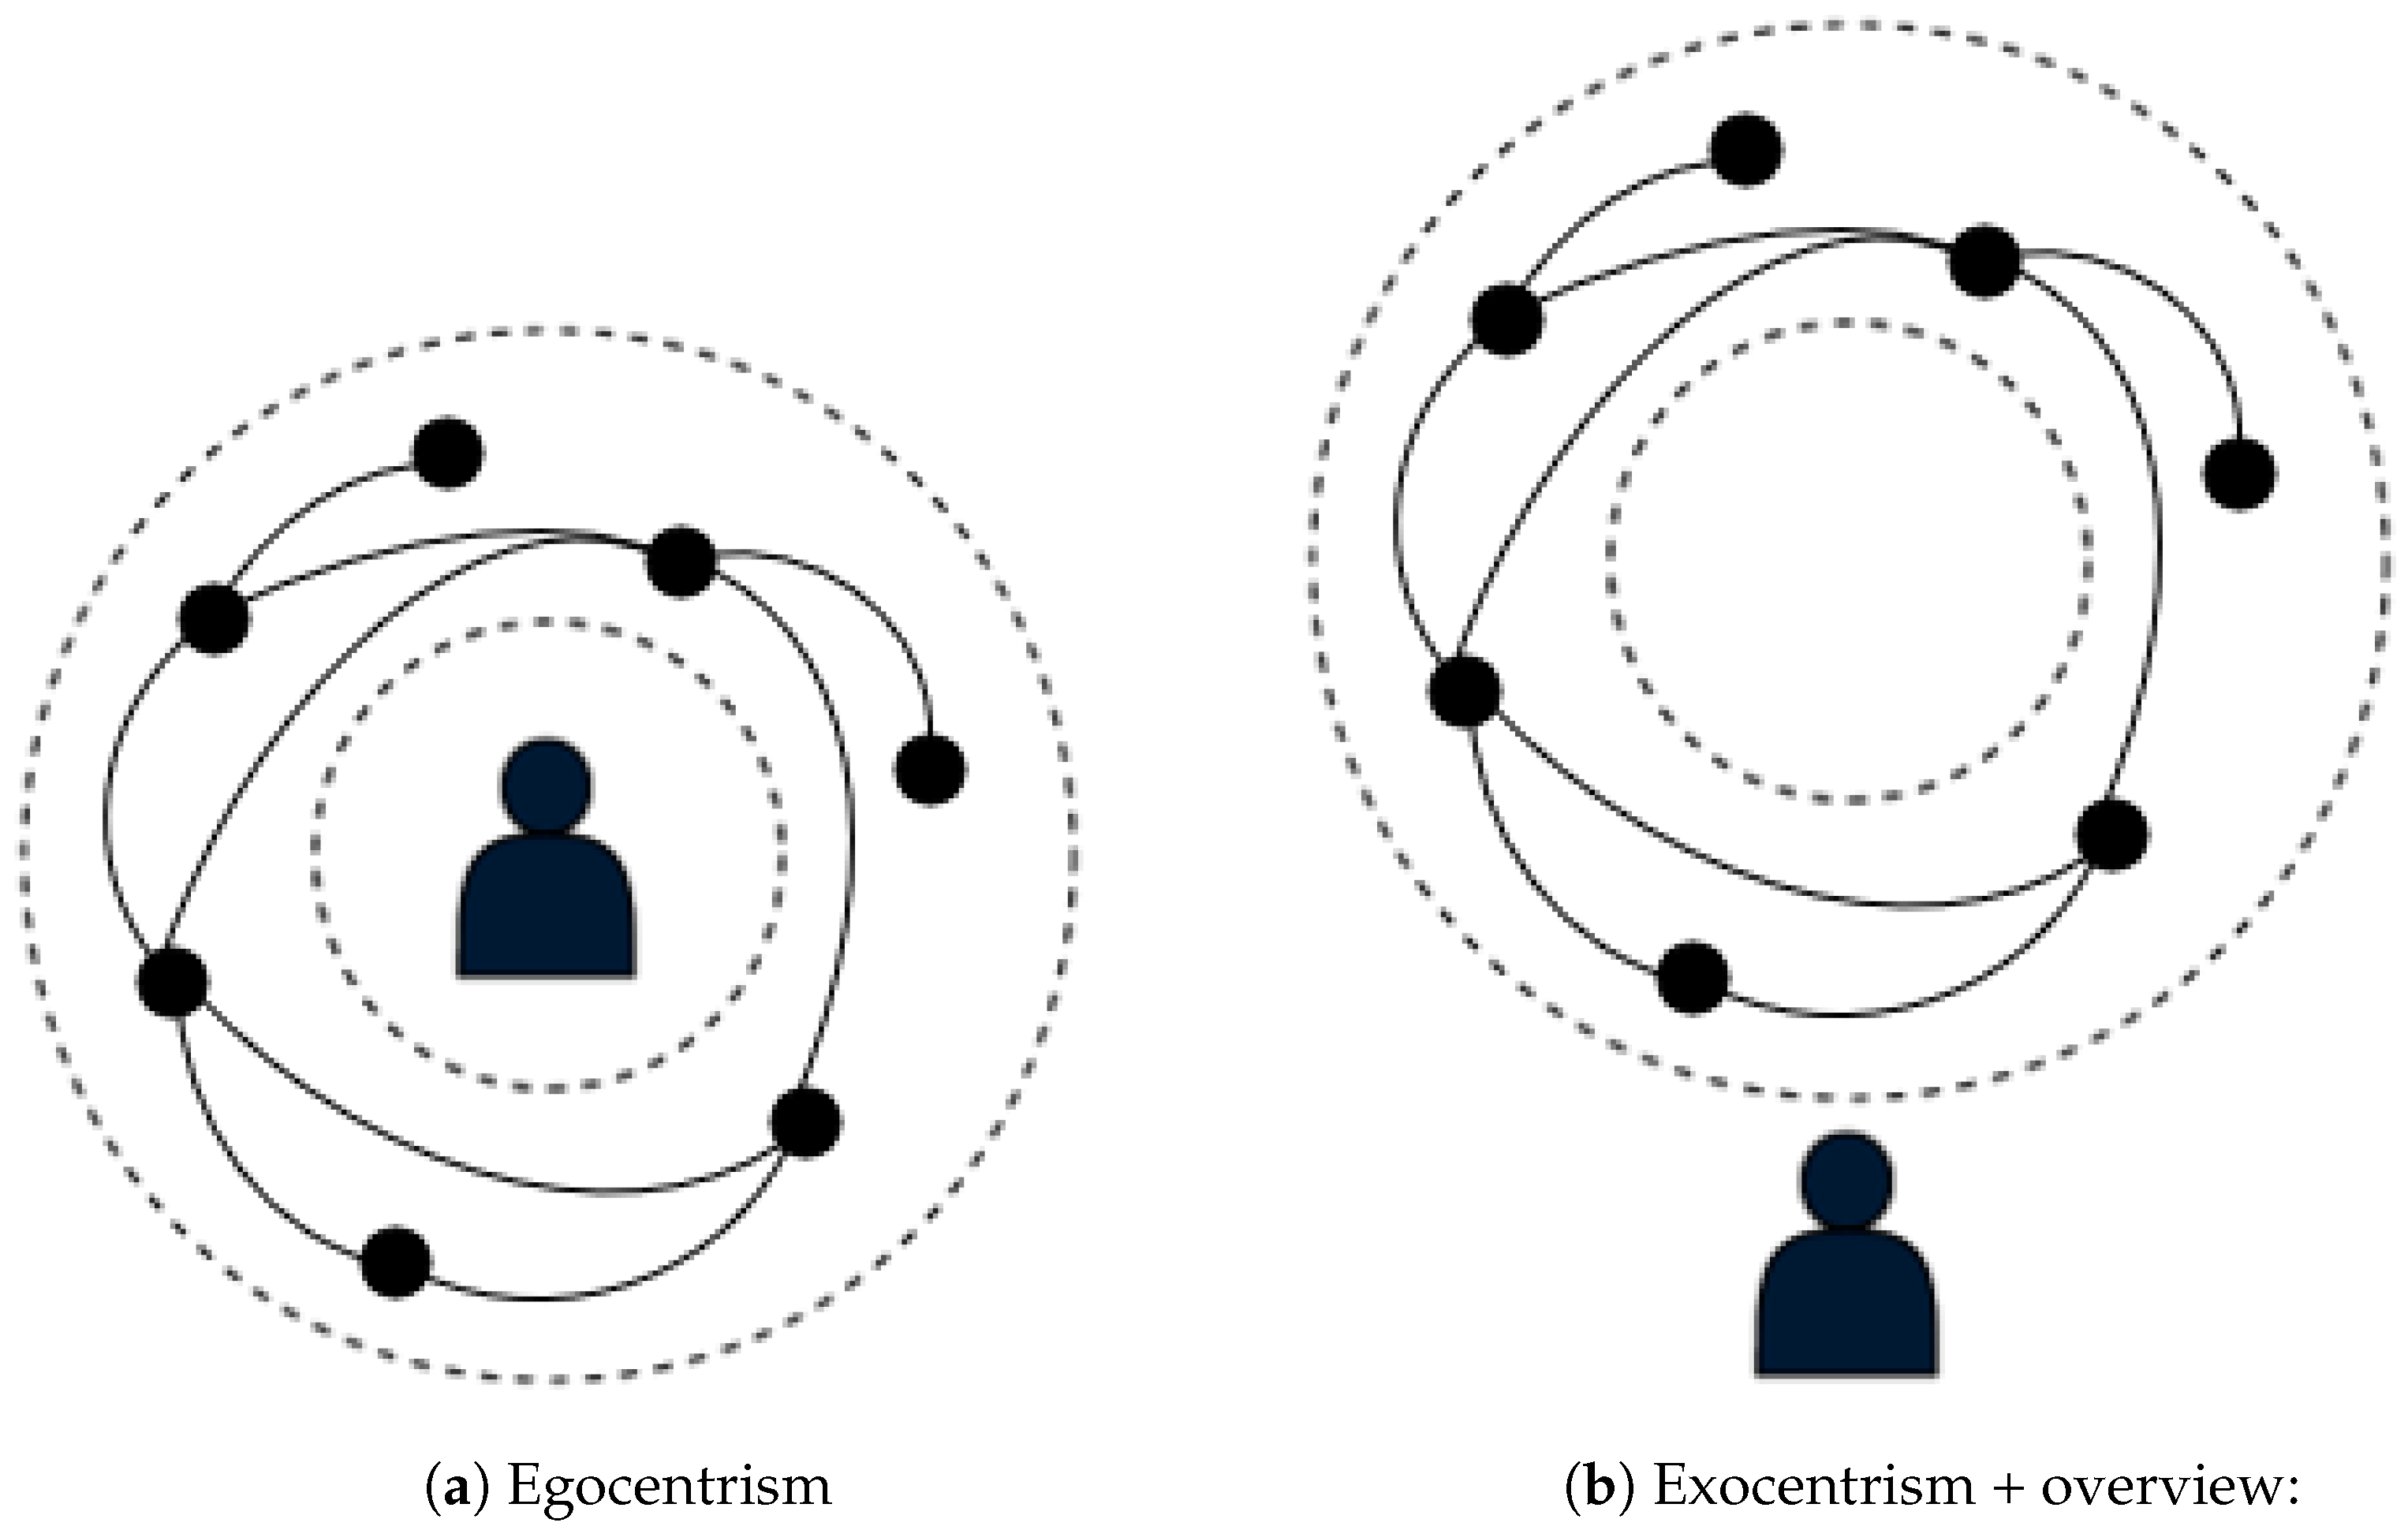
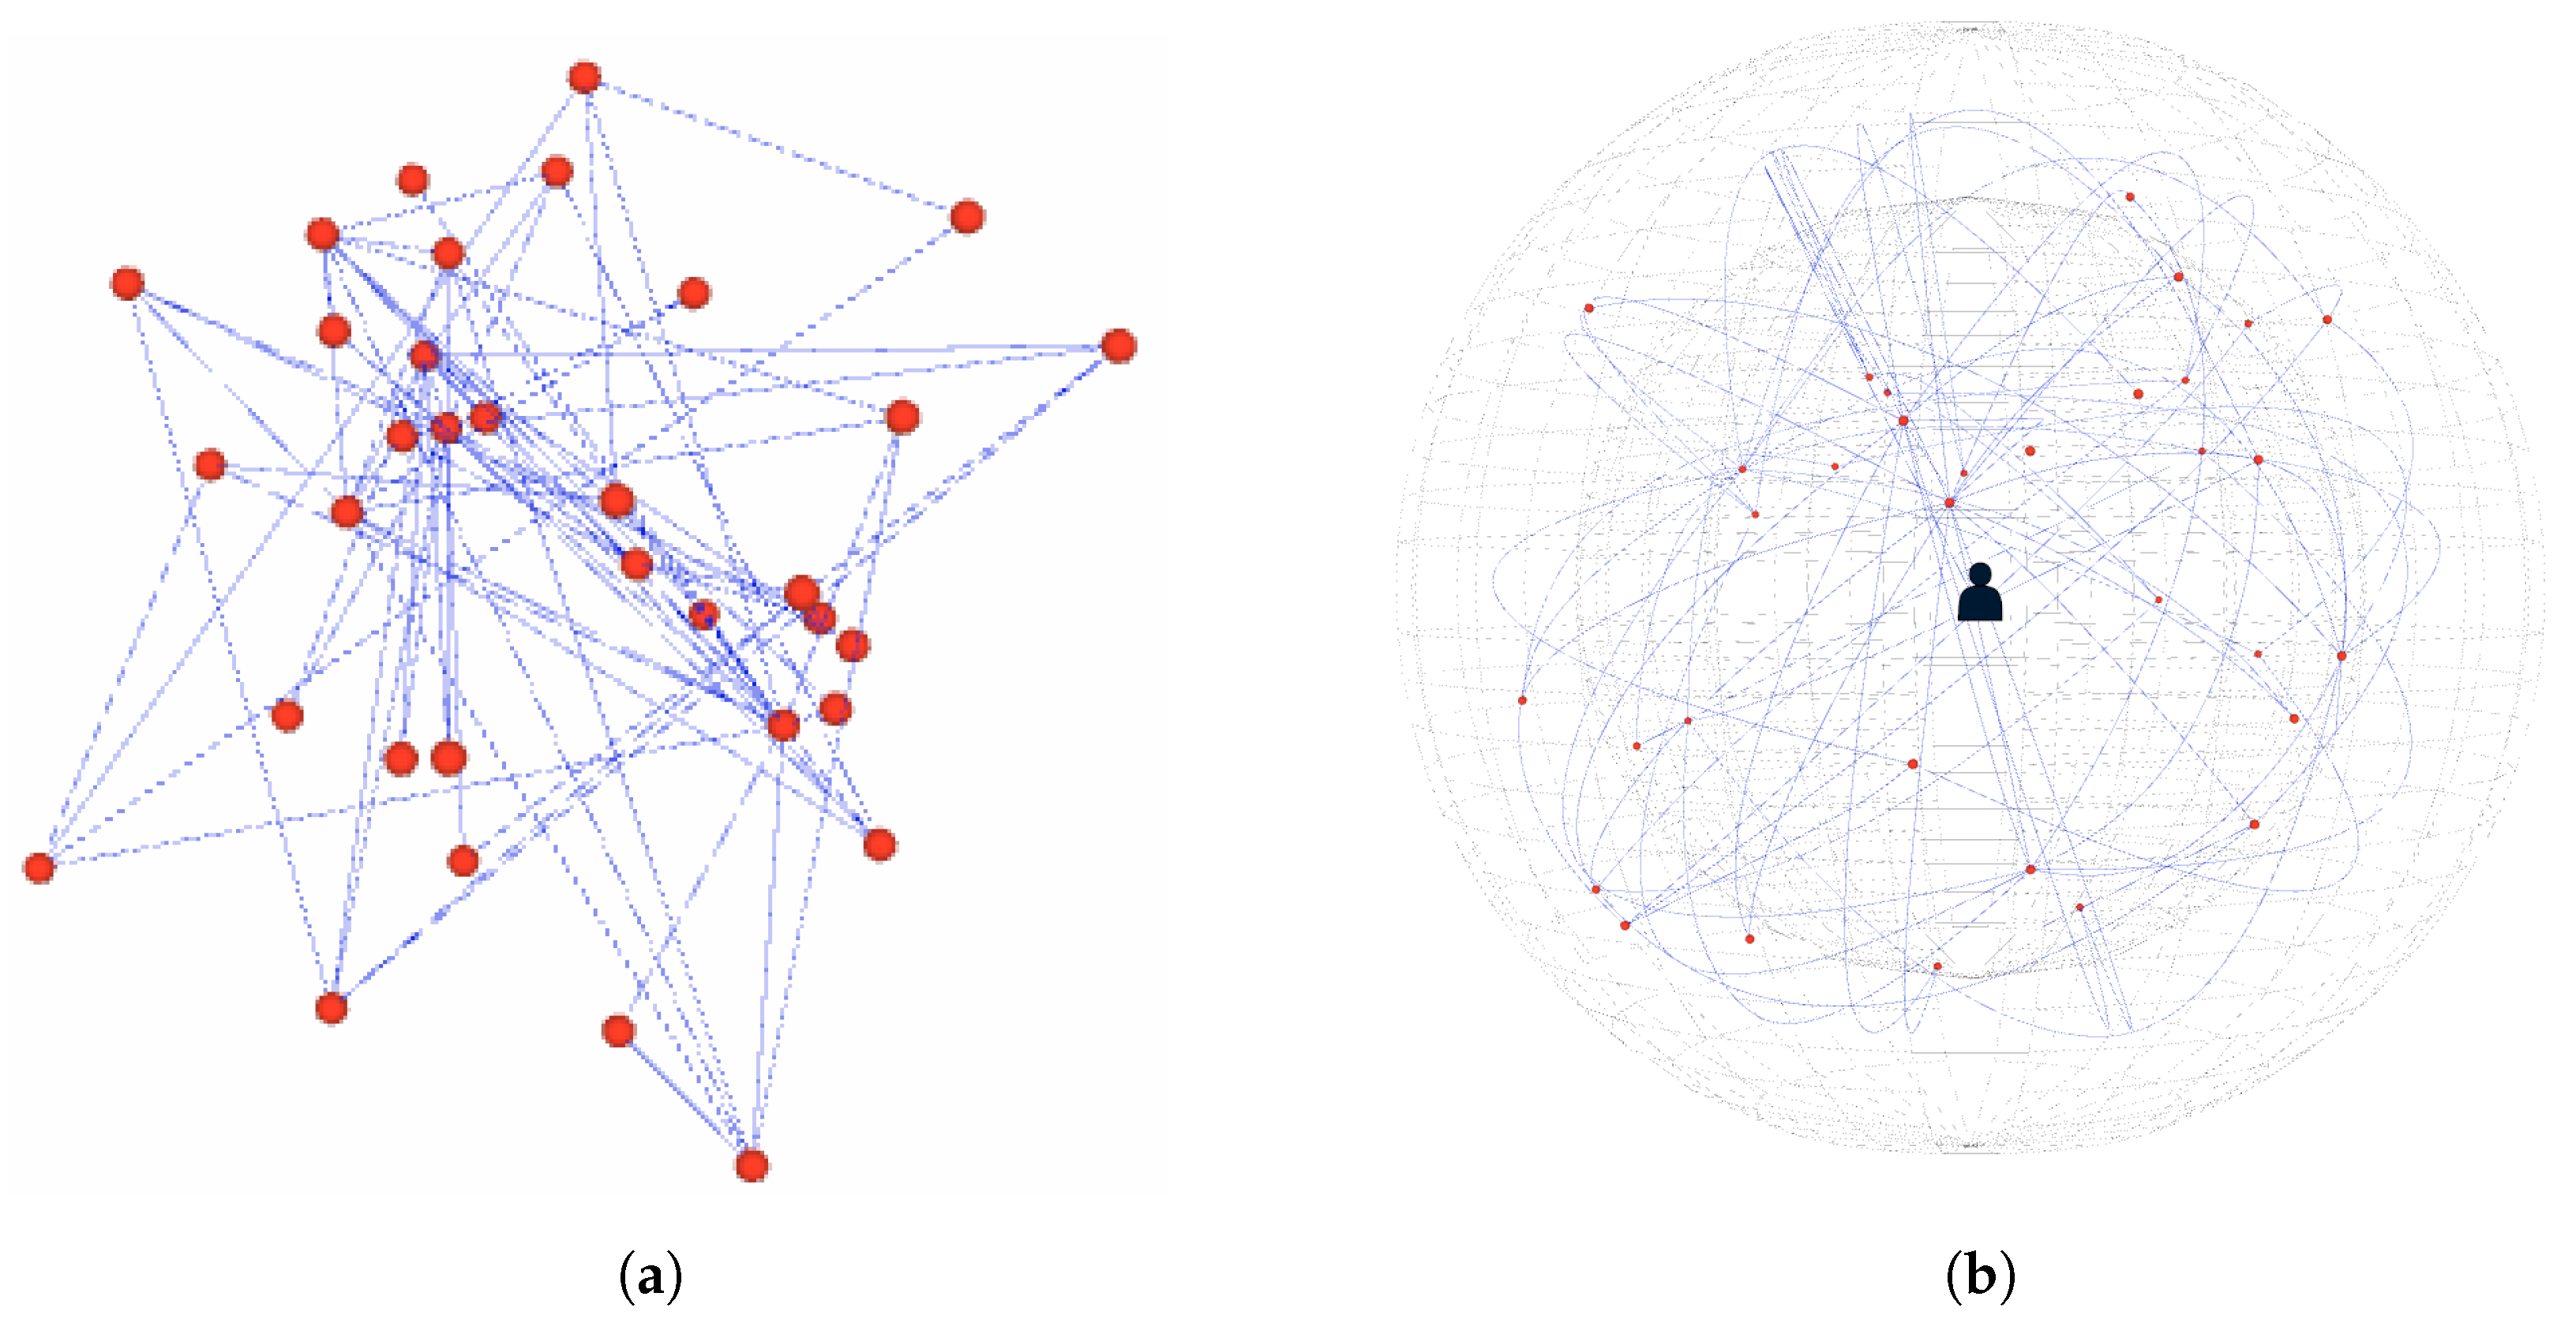
3.1. The Spherical Bubble Space Concept
- •
- is the position of node i using a 3D spatialization algorithm;
- •
- is the position of node i between the spheres;
- •
- is the new distance between a node i and the center, and is the distance between a most distant node and the center.
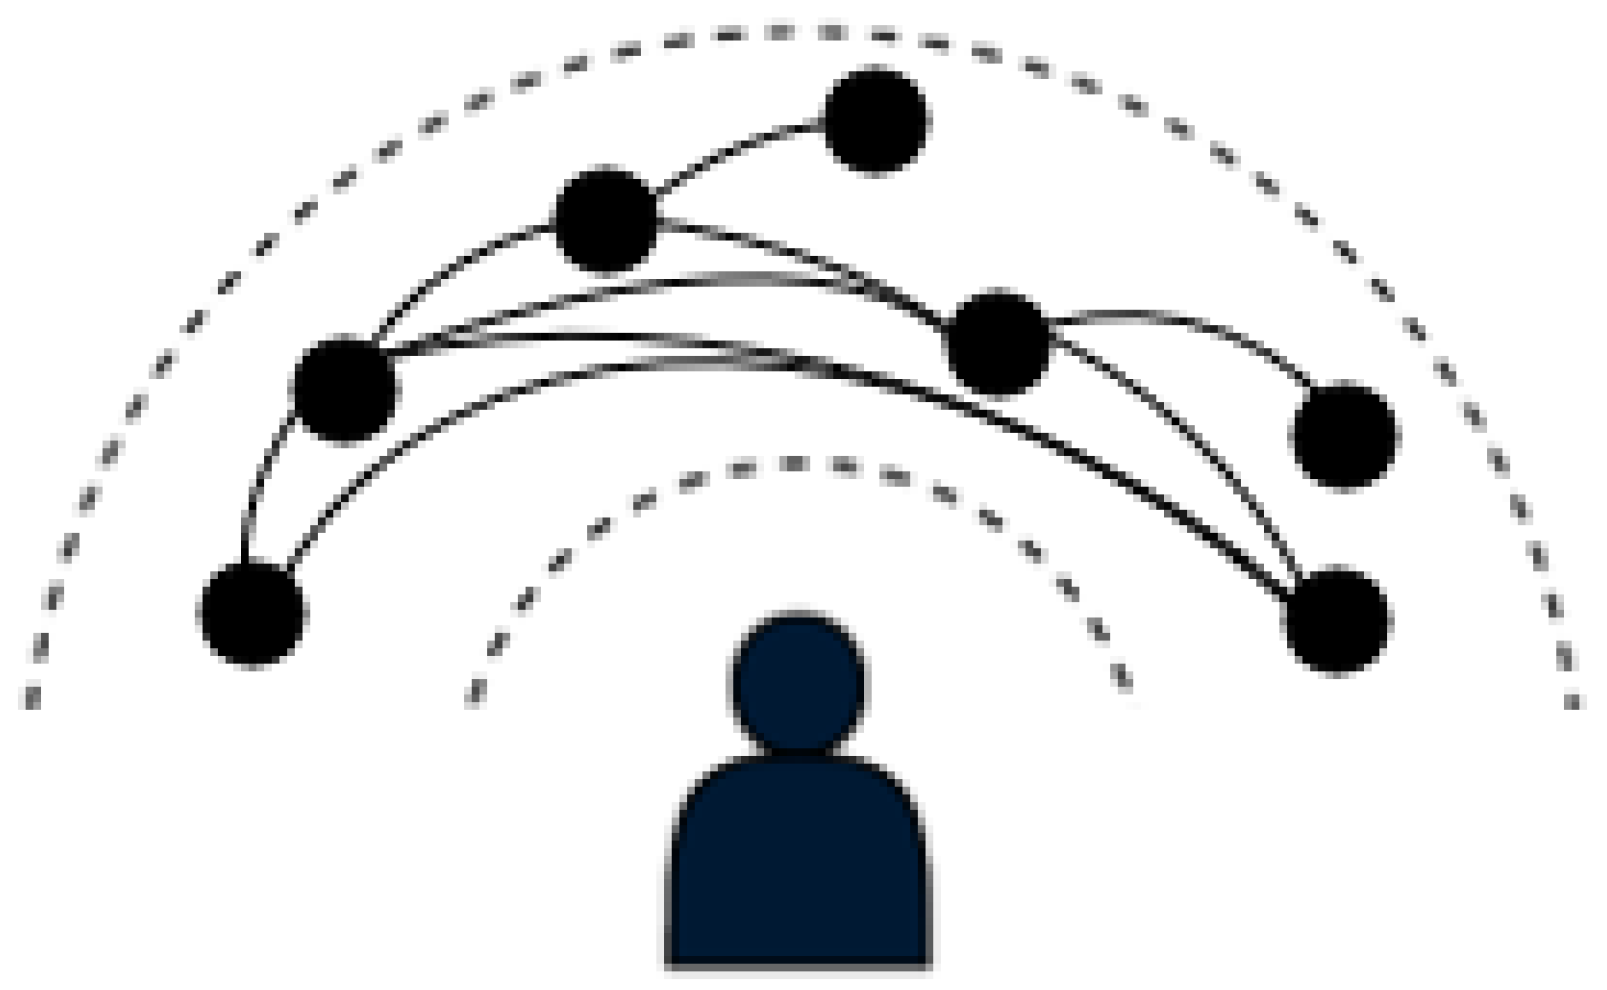
3.2. Contraction of the Spherical Bubble Space
- Projection onto the first plane defined by the vertical axis:
- We first project the direction of the camera onto the plane. According to the Equation (2), corresponds to the forward vector of the camera and corresponds to the vector pointing upwards relative to the camera’s orientation.
- We then find the initial position’s projection within the plane. In the above Equation (2), corresponds to , the initial position of the node i and is the upwards vector relative to the camera’s orientation.
- We calculate the signed angle between the projected direction and the projected initial position around the vertical axis. We then scale it based on the current horizontal axis slider value (see Equation (3)).where is the signed angle between the projected direction and the projected initial position of the node i, and is the current value of the horizontal axis slider.
- We then update the projected initial position by applying the calculated angle-based rotations to it (see Equation (4)).where and are, respectively, the rotation by and about -axis.
- We finally normalize the projected initial position to lie on the retracted surface (see Equation (5)). Let be the normalized position.
- Projection onto the second plane defined by the horizontal axis:
- We project the normalized position from the Equation (5) onto the second plane defined by the right vector of the camera’s view. As previously mentioned, the right vector corresponds to the -axis in world space. Let be the result of the projected position. In the Equation (2), corresponds to and corresponds to the right vector of the camera’s view.
- We then calculate the signed angle between the projected direction (at item 1) and around the horizontal axis. We scale it based on the current vertical axis slider value (see Equation (6)).where is the signed angle between the projected direction and (see Equation (5)), and is the current value of the vertical axis slider.
- We update the final projected position by applying the determined angle-based rotations to it (see Equation (7)) and finally normalize it to lie on the retracted surface (see Equation (8)). Let be the result of the applied rotations, and be the final position of the node i on the retracted surface.where and are, respectively, the rotation by and about -axis.
3.3. Discussion
4. Conclusions
Author Contributions
Funding
Data Availability Statement
Acknowledgments
Conflicts of Interest
References
- Fruchterman, T.M.J.; Reingold, E.M. Graph drawing by force-directed placement. Software Pract. Exp. 1991, 21, 1129–1164. [Google Scholar] [CrossRef]
- Kamada, T.; Kawai, S. An algorithm for drawing general undirected graphs. Inf. Process. Lett. 1989, 31, 7–15. [Google Scholar] [CrossRef]
- Walshaw, C. A Multilevel Algorithm for Force-Directed Graph Drawing. J. Graph Algorithms Appl. 2003, 7, 253–285. [Google Scholar] [CrossRef]
- Jacomy, M.; Venturini, T.; Heymann, S.; Bastian, M. ForceAtlas2, a Continuous Graph Layout Algorithm for Handy Network Visualization Designed for the Gephi Software. PLoS ONE 2014, 9, e98679. [Google Scholar] [CrossRef] [PubMed]
- Hachul, S.; Jünger, M. Large-Graph Layout with The Fast Multipole Multilevel Method; Universität zu Köln: Cologne, Germany, 2005. [Google Scholar]
- Zellmann, S.; Weier, M.; Wald, I. Accelerating Force-Directed Graph Drawing with RT Cores. In Proceedings of the 2020 IEEE Visualization Conference (VIS), Salt Lake City, UT, USA, 25–30 October 2020; pp. 96–100. [Google Scholar] [CrossRef]
- Brandes, U.; Pich, C. An experimental study on distance-based graph drawing. In Proceedings of the Graph Drawing; Number 5417 in Lecture Notes in Computer Science; Tollis, I.G., Patrignani, M., Eds.; Springer: Berlin/Heidelberg, Germany, 2009; pp. 218–229. [Google Scholar] [CrossRef]
- Brandes, U.; Pich, C. Eigensolver Methods for Progressive Multidimensional Scaling of Large Data. In Proceedings of the Graph Drawing, 14th International Symposium, GD 2006, Karlsruhe, Germany, 18–20 September 2006; Revised Papers, Lecture Notes in Computer Science; Kaufmann, M., Wagner, D., Eds.; Springer: Berlin/Heidelberg, Germany, 2006; Volume 4372, pp. 42–53. [Google Scholar] [CrossRef]
- Erdos, P.; Pach, J.; Pollack, R.; Tuza, Z. Radius, diameter, and minimum degree. J. Comb. Theory Ser. B 1989, 47, 73–79. [Google Scholar] [CrossRef]
- Ersoy, O.; Hurter, C.; Paulovich, F.; Cantareiro, G.; Telea, A. Skeleton-Based Edge Bundling for Graph Visualization. IEEE Trans. Vis. Comput. Graph. 2011, 17, 2364–2373. [Google Scholar] [CrossRef] [PubMed]
- Hurter, C.; Ersoy, O.; Telea, A. Graph Bundling by Kernel Density Estimation. Comput. Graph. Forum 2012, 31, 865–874. [Google Scholar] [CrossRef]
- Ware, C.; Mitchell, P. Visualizing OctGraphs in Three Dimensions. ACM Trans. Appl. Percept. 2008, 5, 1279642. [Google Scholar] [CrossRef]
- Lu, J.; Si, Y.W. Clustering-based force-directed algorithms for 3D graph visualization. J. Supercomput. 2020, 76, 1–62. [Google Scholar] [CrossRef]
- Zacks, J.; Levy, E.; Tversky, B.; Schiano, D. Reading Bar Graphs: Effects of Extraneous Depth Cues and Graphical Context. J. Exp. Psychol. Appl. 1998, 4, 119–138. [Google Scholar] [CrossRef]
- Greffard, N.; Picarougne, F.; Kuntz, P. Beyond the classical monoscopic 3D in graph analytics: An experimental study of the impact of stereoscopy. In Proceedings of the 2014 IEEE VIS International Workshop on 3DVis (3DVis), Paris, France, 9 November 2014; pp. 19–24. [Google Scholar] [CrossRef]
- Cliquet, G.; Perreira, M.; Picarougne, F.; Prié, Y.; Vigier, T. Towards HMD-based Immersive Analytics. In Proceedings of the Immersive Analytics Workshop of IEEE VIS 2017, Phoenix, AZ, USA, 1 October 2017. [Google Scholar]
- Kwon, O.H.; Muelder, C.; Lee, K.; Ma, K.L. Spherical layout and rendering methods for immersive graph visualization. In Proceedings of the 2015 IEEE Pacific Visualization Symposium (PacificVis), Hangzhou, China, 14–17 April 2015; pp. 63–67. [Google Scholar] [CrossRef]
- Kwon, O.H.; Muelder, C.; Lee, K.; Ma, K.L. A Study of Layout, Rendering, and Interaction Methods for Immersive Graph Visualization. IEEE Trans. Vis. Comput. Graph. 2016, 22, 1802–1815. [Google Scholar] [CrossRef] [PubMed]
- Brisson, L.; Duval, T.; Sahl, R. Visualisation Immersive de Graphes en 3D pour explorer des graphes de communautés. EGC-VIF 2018, 1, 01759070. [Google Scholar]
- Marriott, K.; Chen, J.; Hlawatsch, M.; Itoh, T.; Nacenta, M.A.; Reina, G.; Stuerzlinger, W. Immersive Analytics: Time to Reconsider the Value of 3D for Information Visualisation. In Immersive Analytics; Springer: Berlin/Heidelberg, Germany, 2018; pp. 25–55. [Google Scholar] [CrossRef]
- Sorger, J.; Arleo, A.; Kán, P.; Knecht, W.; Waldner, M. Egocentric Network Exploration for Immersive Analytics. Comput. Graph. Forum 2021, 40, 241–252. [Google Scholar] [CrossRef]
- Yang, Y.; Jenny, B.; Dwyer, T.; Marriott, K.; Chen, H.; Cordeil, M. Maps and Globes in Virtual Reality. Comput. Graph. Forum 2018, 37, 427–438. [Google Scholar] [CrossRef]
- Sadana, R.; Setlur, V.; Stasko, J. Redefining a Contribution for Immersive Visualization Research. In Proceedings of the 2016 ACM Companion on Interactive Surfaces and Spaces, Association for Computing Machinery, 2016, ISS’16 Companion, Niagara Falls, ON, Canada, 6–9 November; 2016; pp. 41–45. [Google Scholar] [CrossRef]
- Zachary, W.W. An Information Flow Model for Conflict and Fission in Small Groups. J. Anthropol. Res. 1977, 33, 452–473. [Google Scholar] [CrossRef]
- Clergeaud, D.; Guitton, P. Pano: Design and evaluation of a 360° through-the-lens technique. In Proceedings of the 2017 IEEE Symposium on 3D User Interfaces (3DUI), Los Angeles, CA, USA, 18–19 March 2017; pp. 2–11. [Google Scholar] [CrossRef]
- Sassa, H.; Itoh, T.; Yoshida, M. 3D Visualization of Network Including Nodes with Labels. In Proceedings of the 23rd International Conference Information Visualisation (IV), Paris, France, 2–5 July 2019; pp. 19–24. [Google Scholar] [CrossRef]
- So, R.H.Y.; Ho, A.; Lo, W.T. A Metric to Quantify Virtual Scene Movement for the Study of Cybersickness: Definition, Implementation, and Verification. Presence Teleoperators Virtual Environ. 2001, 10, 193–215. [Google Scholar] [CrossRef]
- So, R.H.Y.; Lo, W.T.; Ho, A.T.K. Effects of Navigation Speed on Motion Sickness Caused by an Immersive Virtual Environment. Hum. Factors 2001, 43, 452–461. [Google Scholar] [CrossRef] [PubMed]
- Fleury, C.; Chauffaut, A.; Duval, T.; Gouranton, V.; Arnaldi, B. A Generic Model for Embedding Users’ Physical Workspaces into Multi-Scale Collaborative Virtual Environments. In Proceedings of the ICAT 2010 20th International Conference on Artificial Reality and Telexistence, Adelaide, Australia, 1–3 December 2010. [Google Scholar]
- Dominjon, L.; Lecuyer, A.; Burkhardt, J.M.; Andrade-Barroso, G.; Richir, S. The “Bubble” technique: Interacting with large virtual environments using haptic devices with limited workspace. In Proceedings of the First Joint Eurohaptics Conference and Symposium on Haptic Interfaces for Virtual Environment and Teleoperator Systems. World Haptics Conference, Pisa, Italy, 18–20 March 2005; pp. 639–640. [Google Scholar] [CrossRef]
- Cirio, G.; Marchal, M.; Regia-Corte, T.; Lécuyer, A. The Magic Barrier Tape: A Novel Metaphor for Infinite Navigation in Virtual Worlds with a Restricted Walking Workspace. In Proceedings of the 16th ACM Symposium on Virtual Reality Software and Technology; Association for Computing Machinery, New York, NY, USA, 18–20 November 2009; pp. 155–162. [Google Scholar] [CrossRef]


Disclaimer/Publisher’s Note: The statements, opinions and data contained in all publications are solely those of the individual author(s) and contributor(s) and not of MDPI and/or the editor(s). MDPI and/or the editor(s) disclaim responsibility for any injury to people or property resulting from any ideas, methods, instructions or products referred to in the content. |
© 2023 by the authors. Licensee MDPI, Basel, Switzerland. This article is an open access article distributed under the terms and conditions of the Creative Commons Attribution (CC BY) license (https://creativecommons.org/licenses/by/4.0/).
Share and Cite
Kobina, P.; Duval, T.; Brisson, L. The Spherical Retractable Bubble Space: An Egocentric Graph Visualization throughout a Retractable Visualization Space. Information 2023, 14, 531. https://doi.org/10.3390/info14100531
Kobina P, Duval T, Brisson L. The Spherical Retractable Bubble Space: An Egocentric Graph Visualization throughout a Retractable Visualization Space. Information. 2023; 14(10):531. https://doi.org/10.3390/info14100531
Chicago/Turabian StyleKobina, Piriziwè, Thierry Duval, and Laurent Brisson. 2023. "The Spherical Retractable Bubble Space: An Egocentric Graph Visualization throughout a Retractable Visualization Space" Information 14, no. 10: 531. https://doi.org/10.3390/info14100531
APA StyleKobina, P., Duval, T., & Brisson, L. (2023). The Spherical Retractable Bubble Space: An Egocentric Graph Visualization throughout a Retractable Visualization Space. Information, 14(10), 531. https://doi.org/10.3390/info14100531


