Abstract
Scientometrics is a quantitative and statistical approach that analyzes research on certain themes. It originated from information/library science but has been applied in various disciplines, including information science, library science, natural science, technology, engineering, medical sciences, and social sciences and humanities. Numerous scientometric studies have been carried out, but no study has attempted to investigate the overall research status of scientometrics. The objective of this study was to investigate the research status of scientometrics based on 16,225 publications archived in the Web of Science Core Collection between 1992 and 2020. The results show that there has been a marked increase in publications on scientometric studies over the past decades, with “Information Science Library Science” being the predominant discipline publishing scientometric studies, but scientometrics has been widely adopted in a variety of other disciplines (240 of 254 Web of Science categories). It was found that Web of Science, Vosviewer, and Scientometrics are the most utilized database, software, and journal for scientometric studies, respectively. The most productive author (Lutz Bornmann from the Max Planck Society, Germany), organization (University of Granada, Spain), and country (USA) are also identified. In addition, high-impact scientometric studies and the research landscape are analyzed through citation networks and the co-occurrence of keywords method.
Keywords:
big data; bibliometric analysis; scientometrics; science mapping; VOSviewer; Web of Science; review 1. Introduction
Scientometrics is a quantitative and statistical approach that reveals the processes of development in science and technology. It serves scientific decision making and management using information that is generally from scientific publications [1,2,3,4,5]. The terminology “scientometrics” (“naukometriya”) was coined in 1969 [6] and obtained broad acceptance; it has grown in popularity as the journal Scientometrics was established in 1978 [5,7]. Scientometrics is commonly synonymously referred to as informetrics, bibliometry, bibliometrics, bibliometric analysis, science mapping, or knowledge structure in the literature, although these terms are essentially recognized as separate fields [7]. Scientometrics originated in information and library science, but it has evolved over time and has been widely applied in a variety of other disciplines in order to identify research landscapes (e.g., growth, structure, interrelationship, and productivity) or map historical footprints, emerging hotspots, or scholarly fields [8,9]. In addition, it is also a useful practice and tool for training and familiarizing researchers with a new topic or discipline.
Scientometrics is essentially the analysis of big publication data from various sources, such as a certain journal(s), topic(s), or databases (e.g., Web of Science, Scopus, Medline, and Google Scholar). Numerous studies have compared the coverage of databases used for scientometric analysis [10,11,12,13], developed new tools or methods [14,15,16,17], or focused on its applications in various disciplines [18,19,20,21,22,23,24,25,26,27,28,29]. However, there is a lack of research on the scientometric analysis of scientometric studies. The objective of this study was therefore to provide both novices and experts with a scientometric overview and visualization of scientometrics based on the Web of Science database over the period from 1992 to 2020.
2. Materials and Methods
The Science Citation Index Expanded (SCI-EXPANDED) and Social Sciences Citation Index (SSCI) of the Web of Science Core Collection (WoSCC) is a complete literature database commonly used for scientometric analysis [11,30]. The data between January 1992 and December 2020 were downloaded from the WoSCC on 10 January 2021 for analysis. A later search shows that only a small number of publications (32) of 2020 were not indexed as of the search date because of the delay in the inclusion of the previous year’s publications by the WoSCC. Although this time period does not cover the entire publication history, it would reflect the general trend of scientometric research as the majority of widely used scientometric applications/software were developed after the 1990s. There is no need to include all data from all time periods to reflect the research trend. Therefore, query sets including the key element of scientometric studies, such as synonyms for the names of scientometrics, often-used software tools, and visualization forms, can ensure that the majority of scientometric studies are included in this study.
The query sets used for the literature search are as follows: TS = (“scientometric*” OR “bibliometric*” OR “science mapping” OR “Knowledge structure” OR “co-citation network” OR “co-occurrence analysis” OR “co-authorship analysis” ORn “publication trend” OR “Citespace” OR “VOSviewer” OR “Histcite*” OR “Thomson Data Analyzer” OR “NetDraw” OR “UCINET” OR “BibExcel” OR “CitNetExplorer” OR “Leydesdorff Toolkit” OR “Gephi” OR “Pajek” OR “Notepad++” OR “Sublimetext” OR “Bicomb” OR “Cocites-co-citation tool” OR “Carrot2” OR “Citenetexplorer” OR “CRExplorer” OR “GPS Visualizer” OR “Nails-HAMMER” OR “Jigsaw” OR “KnowledgeMatrix Plus” OR “MapEquation” OR “NodeXL Basic” OR “Open Knowledge Maps” OR “Publish or Perish” OR “BiblioTods” OR “MetaKnowledge” OR “RPYS” OR “reference publication year spectroscopy” OR “Bibliometrix” OR “CITAN” OR “Social Network Visualizer” OR “SATI” OR “Scholarometer” OR “SATI” OR “Scholarometer” OR “ScienceScape” OR “Visone” OR “Voyant Tools” OR “Voyant Tools” OR “WoS2 Pajek” OR “WoS Network Tool” OR “Webometric Analyst”). “TS” is a search term that is short for “topics” in the Web of Science.
The search results were then saved as a text file containing “full record and citation data” for scientometric analysis with Vosviewer 1.6.15 [15] (The Centre for Science and Technology Studies, The Netherlands). The co-authorship networks of authors, organizations, and countries; citation networks of highly cited publications; and density visualizations of keyword co-occurrence were analyzed. For the co-authorship network and citation network, the software only analyzes publications with a maximum of 25 authors per publication by default.
3. Results and Discussion
3.1. Annual Publication Trend and the Distribution of Disciplines
The query sets in Section 2 returned 16,225 scientometric publications between 1992 and 2020. Figure 1 shows that the number of publications increased rapidly from 53 in 1992 to 1455 in 2018. The increasing trend has soared significantly in recent years, with 2005 publications in 2019 and 2517 publications in 2020. It is expected that more scientometric publications will appear in the coming years. This is verified by a later search in Nov. 2023 where years 2021–2023 experienced annual publications of over 4000.
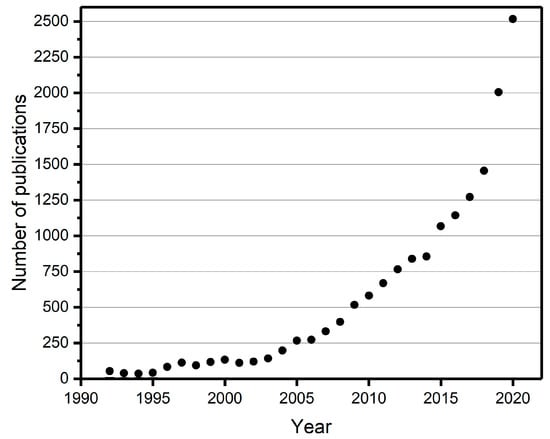
Figure 1.
Annual trend of scientometric publications based on the Web of Science Core Collection (WoSCC) databases between 1992 and 2020.
In addition, the majority of these scientometric publications were written in English (N = 15,243, 93.95%; N indicates the number of publications) and published as journal articles (N = 12,777, 78.75%). The 16,225 publications mainly come from SCI-expanded (SCIE) with 12,296 publications, and there is some overlap with the SSCI database that consists of 10,125 scientometric publications. These 16,225 publications cover 240 out of 254 Web of Science categories, and the top three categories are Information Science Library Science (N = 4461), Computer Science Interdisciplinary Applications (N = 2896), and Computer Science Information Systems (N = 1080). These publications can be divided into 148 Web of Science research areas, in which six areas published over 1000 papers: Information Science Library Science (N = 4461), Computer Science (N = 4402), Environmental Sciences Ecology (N = 1315), Business Economics (N = 1296), Science Technology Other Topics (N = 1274), and Engineering (N = 1114). This indicates that scientometric publications predominately comprise traditional computer science or information/library science topics, but it has also been widely applied in a variety of other disciplines to analyze research statuses [18,19,20].
3.2. Commonly Used Databases, Software, and Journals
Figure 2a shows that Web of Science (WoS), Scopus, and Google Scholar are the routinely used citation databases for scientometric analysis. WoS ranked first, which may be attributed to the fact that WoS is the only practical database to retrieve citation counts up until 2004 when Scopus and Google Scholar were introduced [12]. These databases differ in management, selection criteria, and coverage [31]. For example, WoS and Scopus are curated databases that document inclusion or index publications (e.g., journals, books, and conference proceedings) based on a set of source selection criteria, but they have limited coverage in non-English publications and social science and humanities [10,31]. While Google Scholar adopts an inclusive, unsupervised, and automated approach with robot crawlers to index any scholarly document on academic websites, this results in technical errors, including duplicate entries, incorrect or incomplete bibliographic information, and the inclusion of non-scholarly materials [32]. Pubmed, MEDLINE, Dimensions, and EMBASE, for example, mainly consist of publications pertaining to medical science. Microsoft Academic was first launched in 2019 and has a tool similar to Google Scholar [33,34], and CNKI (Chinese National Knowledge Infrastructure) mainly includes journal papers published in Chinese.
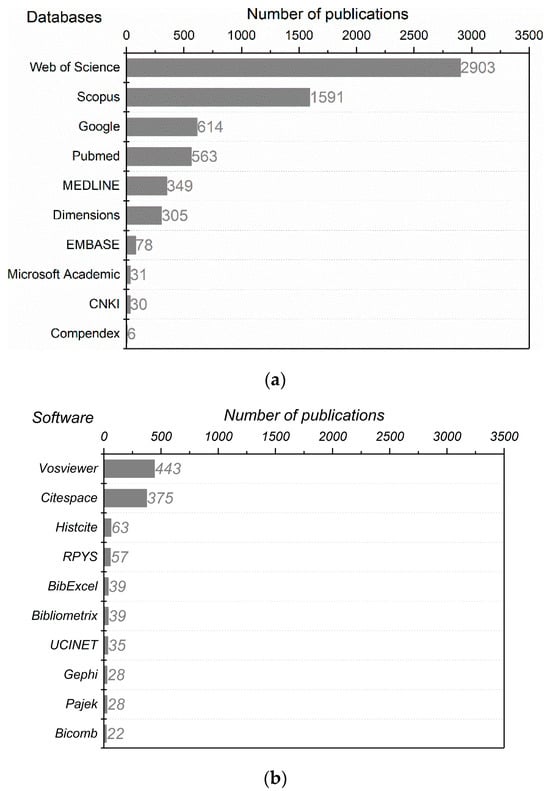
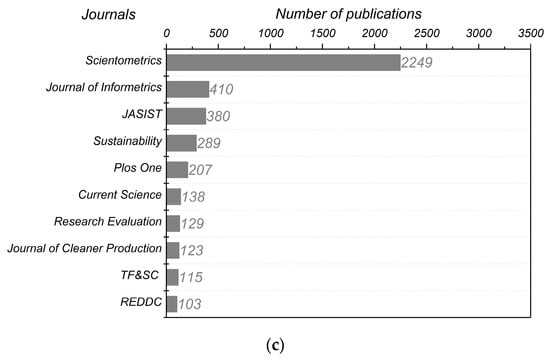
Figure 2.
The top 10 databases (a), software (b), and journals (c) for scientometric publications. The search results returned were based on query sets and included the database (e.g., TS = “Web of Science”) in combination with the query set used in Section 2. The abbreviations in (c) are as follows: TF&SC and REDDC are short for Technological Forecasting and Social Change and Revista Espanola De Documentacion Cientifica, respectively. Note: Journal of the American Society for Information Science and Technology (JASIST) was renamed to Journal of the Association for Information Science and Technology (JASIS&T or JASIST) in 2013; they were combined and the name JASIST was used.
A great number of computer programs/applications/software listed in the query set in Section 2 has been developed to assist scientometric analysis. These software tools differ in functions, user friendliness, and capability of computations or graphs, and no single tool can be considered to be the best or complete [14]. The top three most utilized software for scientometric analysis are Vosviewer [15], Citespace [16], and Histcite [17] (Figure 2b). All three software programs are freely available, but they differ in ease of use and functions. The Vosviewer is a cluster-based program and is user friendly, but there is no way to capitalize the words or terms (e.g., names, journals, or countries), and similar keywords cannot be merged for analysis [18,19]. Citespace is written in Java and characterized by many functions, but it is more complex to use. Hiscite was developed for analyzing WOS data, but it is out of service, and a modified version provided by a researcher from Chinese Academy of Science is available for use (HistCite Pro, https://zhuanlan.zhihu.com/p/20902898, accessed on 12 May 2020). The number of application cases for other software is low. It should be noted that the number of scientometric applications in Figure 2b may be underestimated as the search results are only based on the keywords in the title, abstract, and author-provided keyword lists. No full texts were checked for validation as it is challenging to access full texts of over 16,000 publications for this purpose, but the number should reflect the general trend of software preference. In addition, researchers may use citation managers (e.g., Endnote, Mendeley, Refman, Zotero, and bibfilex), Microsoft Excel, Python, or R package to carry out analyses, but these are beyond the scope of this study.
It is not surprising to see that Scientometrics is the most utilized journal for publishing scientometric studies (Figure 2c). Many other popular journals, e.g., the Journal of Informetrics and the Journal of the Association for Information Science and Technology (was Journal of the American Society for Information Science and Technology), are from the discipline of information. The open access journals of Sustainability and PLoS ONE are also often used, with over 200 scientometric publications between 1992 and 2020. The Journal of Cleaner Production is the only disciplinary journal that published over 100 scientometric studies. It is noteworthy that 4237 journals published 16,225 scientometric papers, which indicates that scientometrics is integral to research in various disciplines. Figure 2 could also give hints on choosing the right database, software, and journals for future scientometric studies.
3.3. Co-Authorship of Authors, Organizations, and Countries
There are 270 out of 37,871 authors who meet the standards of a minimum of 10 scientometric publications (Figure 3). They consist of 87 clusters of groups of close collaborators, with 127 authors in the largest cluster. The top 10 authors/organizations/countries contributing to scientometric publications are tabulated (Table 1). Dr. Lutz Bornmann from the Max Planck Society, Germany, is the most productive researcher, publishing over 160 papers. There are three other researchers (i.e., Yuh-Shan Ho, Giovanni Abramo, and Ciriaco Andrea D’angelo) who published over 100 papers. The cluster comprising Gangan Prathap from APJ Abdul Kalam Technological University, Thiruvananthapuram, and the Vidya Academy of Science in Figure 3 is far away from the other authors, indicating a weak relatedness. This weak connection among authors in scientometrics is different from the scientometric studies of a certain discipline [18,19,20,21,22,23,24,25,26,27,28,29], where collaborations between researchers are more common. However, it is understandable that scientometric publications in this study generally focus on topics of different disciplines, and few such studies focus on inter- or cross-disciplinary work.
Figure 3.
Co-authorship network map of authors meeting the threshold of 10 publications per author (produced with the Vosviewer).

Table 1.
Top 10 authors, organizations, and countries on scientometric publications. N, C, and TLS indicate the number of publications, citations, and total link strength, respectively. Values of TLS change with the number of items included in Vosviewer for analysis, and TLS in the table was calculated when all items were included.
In addition, there are 652, 307, 178, and 77 out of 9,040 organizations publishing a minimum of 10, 20, 30, and 50 scientometric papers, respectively. Among the top 10 contributing organizations, there are three organizations from Spain (i.e., University of Granada, University of Valencia, and Consejo Superior de Investigaciones Cientificas CSIC) and four universities or institutes from China (i.e., Chinese Academy of Science, Asia University, Wuhan University, and Peking University), as indicated in Table 1. The Chinese Academy of Science ranked third in total publication volume but ranked first for TLS, which indicates that they have stronger collaborations with other organizations. It should be noted that the top ten organizations are different from the Web of Science records, where Consejo Superior de Investigaciones Cientificas (CSIC) ranked first, followed by the University of Granada, Chinese Academy of Sciences, University of London, Leiden University, Max Planck Society, University of California System, University of Valencia, University System of Georgia, and KU Leuven. The publication volume of each organization is higher in the Web of Science as well. However, the data of Vosviewer were kept because the citations and total link strength are provided.
Furthermore, there are 148 countries that published scientometric studies, with 91, 75, 63, 55, 49, 25, and 12 countries meeting the threshold of 5, 10, 20, 30, 50, 200, and 500 papers, respectively. Five countries (i.e., USA, China, Spain, UK, and Germany) contributed over 1000 scientometric papers in total (Table 1). Compared to other countries, the USA, China, and the UK had a greater TLS, which indicates more international collaborations.
3.4. The Highly Impacted Studies
There are 1171 publications that meet the threshold of a minimum of 50 citations, with 309 clusters or groups of closely related publications. The largest cluster consists of 850 papers, which is shown at the center of Figure 4. Among them, the publication by Rodriguez and Laio [35], who developed cluster analysis to classify items into categories based on their similarity, is the most highly cited paper (the biggest circle), with C = 1745 citations until 10 January 2021, as recorded by the WoS. However, it is noted that this paper was seldom cited by scientometric studies as most generally use the scientometric software program that already incorporates this function. The studies that introduce the popular scientometric software programs, Vosviewer [15] and Citespace [16], are also highly cited at C = 1734 and 1094, respectively. Cobo et al. [14], who evaluated nine scientometric software programs, were also highly cited (C = 479). Study [36], which compared the coverage of databases such as WoS, Scopus, and Google Scholar, was also frequently referenced. The papers on the outer circle of Figure 4 generally focus on the research analysis of a certain research field or theme [37,38,39,40,41]. They are grayed out as there is an insufficient number of colors in the software to differentiate them. It is noteworthy that the majority ofscientometric studies were cited less than 50 times. The exclusion of these studies does not necessary mean that they are not important, but because they were published more recently, there is only a small research community, or the topic is not an emerging theme with attractions, etc.
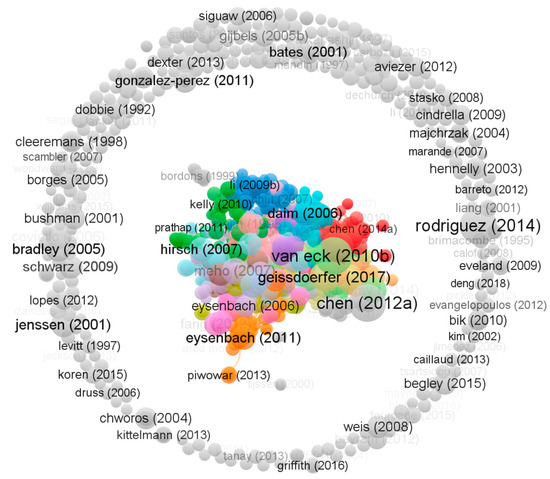
Figure 4.
Citation network of publications with a minimum of 50 citations.
3.5. Co-Occurrence Analysis of Keywords from the Title, Abstract, and Author-Provided Keywords
Vosviewer extracted 42,206 keywords from the title, abstract, and author-provided keywords. There are 827 meeting the minimum of 20 keyword occurrences, and they consist of five clusters (Figure 5a). Each cluster represents a group of related research studies. For instance, the red-colored cluster focuses on analyzing research trends based on “Web of Science” (“SCI-expanded”) or “Pubmed” using “Citespace” or similar tools. Most research is from medical science, as indicated by keywords including “medicine”, “cancer”, “diagnosis”, “gene”, “pain”, and “acupuncture”. The blue-colored cluster focuses on the analysis of “research impact”, as indicated by keywords such as “citations”, “h-index”, “Google scholar”, “indicators”, etc. The top 50 keywords with the highest occurrences can be found in Table 2. There are 286 keywords in the author-provided keyword list that meet a minimum of 20 occurrences, and they comprise nine clusters/colors (Figure 5b). “Bibliometric(s)”, “bibliometric analysis”, and “scientometrics” are the most commonly appearing keywords (Figure 5b and Table 2). The scientometric method was used to carry out “citation analysis”, “social network analysis”, “co-word analysis”, and “co-authorship” or “collaboration” or “scientific collaboration” and analyze “research trends”, “scientific production”, “research productivity”, “impact”, and “innovation” for example. Scientometrics are always performed with “systematic review” or “review”, similarly to the findings in Section 3.2 or Figure 2.
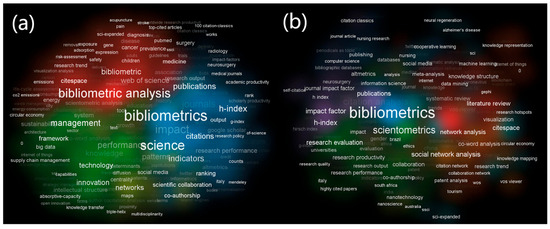
Figure 5.
Cluster density visualization for the co-occurrences of keywords in the title, abstract, and author-provided keyword list (a); author-provided keywords only (b) with a minimum of 20 occurrences. The number of co-occurrences of n keywords indicates the number of publications in which all n keywords occur together. Font size and density (background color) of keywords are used to represent the total link strength (TLS). Greater font size indicates greater TLS, while the distance between each keyword indicates the relatedness of these research topics.
Table 2.
Top 50 keywords with greatest occurrences in 16,225 scientometric publications. OC and TLS indicate the number of occurrences and total link strength, respectively. Values of TLS change with the number of items included in Vosviewer for analysis, and TLS in the table was calculated when all items were included.
Table 2 illustrates that “Web of Science” and “Scopus” are the two commonly used databases, while “Citespace” and “Vosviewer” are the two most utilized scientometric software programs. It also echoes Table 1 in that “USA”, “China”, and “Spain” are the main contributors to scientometric studies. Moreover, the software may sometimes have difficulty extracting the right and meaningful keywords, such as “web”, “science”, “system”, and “model” in “all keywords” of Table 2 as there is no specific format or punctuation to separate keywords.
4. Conclusions and Perspectives
This study investigated the research status of scientometric studies based on 16,225 publications archived in the Web of Science Core Collection between 1992 and 2020. The results show that there is an increasing publication trend with respect to scientometric studies over the period investigated: from ~50 papers in 1992 to over 2500 papers in 2020. This shows that the “Information Science Library Science”, “Computer Science Interdisciplinary Applications”, and “Computer Science Information Systems” categories of the Web of Science are the predominant disciplines publishing scientometric studies. However, it is noteworthy that scientometrics has been widely adopted in various other disciplines as the 16,225 publications cover 240 out of 254 Web of Science categories. This may also indicate that scientometricians may publish in multiple different fields, and there are professionals and organizations whose main duties are scientometric analysis in some countries. It was found that Web of Science, Vosviewer, and Scientometrics are the most utilized database, software, and journal for scientometric studies, respectively. The most productive author (Lutz Bornmann from the Max Planck Society, Germany), organization (University of Granada, Spain), and country (USA) were also identified. The citation network and co-occurrence of keywords were used to analyze high-impact scientometric studies and the landscape of research fields.
None of the most commonly used bibliographic databases (e.g., Web of Science, Scopus, Google Scholar, Microsoft Academic, and Dimensions) could cover complete scientific publications pertaining to a topic of interest [10,11,31,36], and these databases differ from each other in many aspects (e.g., coverage, format, and content). Therefore, the majority of scientometric studies were generally based on one database and may lose or misuse information (e.g., the use of initials for the first name in Scopus may be conflated with authors who have the same initials, which is especially apparent for Asian researchers). However, this issue cannot be solved until protocols between databases are established or specified software is developed. In addition, the preprocessing of downloaded files (e.g., removal of duplicates and the adjustment of full names or short names of authors and organizations) from citation databases is a critical step for any scientometric software programs [14]. Moreover, most databases (e.g., Web of Science and Engineering Village) only allow users to download a certain number of bibliographic references at a time (e.g., it was 500 for Web of Science and now up to 1000 for Web of Science and 2000 for Scopus for each download), which increases the workload of users. At present, there is no single software application that can be used to carry out a complete scientometric analysis [14], nor is it possible that multiple databases can be combined to carry out analyses together. A combination of multiple software tools or separate database-dependent analysis is feasible at the moment [18,42]. The future development of more powerful and user friendly scientometric software tools is therefore recommended. With an increase in the adoption of artificial intelligence—AI (e.g., ChatGPT, GPT4, LLaMA series, ChatGLM series, PaLM series, Gemini, AlphaGo, and Inflection, Falcon)—it is expected that the production of scientometric analysis and writing will be automated.
It is noteworthy that scientometrics would be a good tool or practice for obtaining a picture of a specific research topic or discipline, but this is less likely accepted by disciplinary journals that have strict demands with respect to novelty and scientific contributions. For disciplines other than “Information Science Library Science”, “Computer Science Interdisciplinary Applications”, and “Computer Science Information Systems”, combining scientometric analysis with literature reviews, systematic reviews, or meta-analysis rather than only performing scientometric study is recommended [43]. In addition, scientometrics should play an increasingly more important role in quantifying scientific research personnel and achievements or in decision making as part of research excellence frameworks in countries, including the UK and China [4], because it accounts for references beyond journal articles. Evaluation panels are explicitly forbidden to consider impact factors, index lists, rankings, or the perceived standing of journal publishers in which publications appear, although publications are still a key part of assessing the quality of research outputs. However, a protocol or standardized procedure should still be established for the analysis.
Author Contributions
Conceptualization, H.H.; methodology, software, validation, formal analysis, investigation, resources, data curation, writing—original draft preparation, writing—review and editing, and visualization, H.H. and Y.L. All authors have read and agreed to the published version of the manuscript.
Funding
This research received no external funding.
Data Availability Statement
Data are available upon request or are downloadable from the Web of Science.
Conflicts of Interest
The authors declare no conflict of interest. The mention of trademarks and names not necessarily mean a warranty of them.
References
- Hess, D. Science studies: An advanced introduction. Contemp. Sociol. 1997, 28, 315–316. [Google Scholar] [CrossRef]
- Qiu, J.; Zhao, R.; Yang, S.; Dong, K. Informetrics: Theory, Methods and Applications; Springer: Singapore, 2017; pp. 1–438. Available online: https://link.springer.com/book/10.1007/978-981-10-4032-0 (accessed on 24 August 2023).
- Egghe, L. Editorial: Expansion of the field of informetrics: Origins and consequences. Inf. Process. Manag. Int. J. 2005, 41, 1311–1316. [Google Scholar] [CrossRef]
- Baynes, G. Key issue—Scientometrics, bibliometrics, altmetrics: Some introductory advice for the lost and bemused. Insights 2012, 25, 311–315. [Google Scholar] [CrossRef]
- Hood, W.W.; Wilson, C.S. The literature of bibliometrics, scientometrics, and informetrics. Scientometrics 2001, 52, 291. [Google Scholar] [CrossRef]
- Nalimov, V.; Mulchenko, Z. Measurement of Science. Study of the Development of Science as an Information Process; Foreign Technology Division, Air Force Systems Command, US Air Force: Fairborn, OH, USA, 1971; AD735634; FTD-MT-24-8 35-71; pp. 1–192. Available online: https://ntrl.ntis.gov/NTRL/dashboard/searchResults/titleDetail/AD735634.xhtml (accessed on 24 August 2023).
- Yang, S.; Yuan, Q. Are Scientometrics, Informetrics, and Bibliometrics Different? In Proceedings of the 16th International Conference on Scientometrics & Informetrics (ISSI2017), Wuhan, China, 16–20 October 2017; Available online: https://www.researchgate.net/publication/318940072_Are_Scientometrics_Informetrics_and_Bibliometrics_different (accessed on 24 August 2023).
- Kim, M.C.; Zhu, Y. Scientometrics of Scientometrics: Mapping Historical Footprint and Emerging Technologies in Scientometrics; Jibu, M., Osabe, Y., Eds.; IntechOpen: London, UK, 2018. [Google Scholar] [CrossRef]
- Rotolo, D.; Rafols, I.; Hopkins, M.; Leydesdorff, L. Scientometric mapping as a strategic intelligence tool for the governance of emerging technologies. SSRN Electron. J. 2013, 2742125. [Google Scholar] [CrossRef]
- Martín-Martín, A.; Thelwall, M.; Orduna-Malea, E.; Delgado López-Cózar, E. Google scholar, microsoft academic, scopus, dimensions, web of science, and opencitations’ coci: A multidisciplinary comparison of coverage via citations. Scientometrics 2020, 126, 871–906. [Google Scholar] [CrossRef]
- Archambault, É.; Campbell, D.; Gingras, Y.; Larivière, V. Comparing bibliometric statistics obtained from the web of science and scopus. J. Assoc. Inf. Sci. Technol. 2009, 60, 1320–1326. [Google Scholar] [CrossRef]
- Kulkarni, A.V.; Aziz, B.; Shams, I.; Busse, J.W. Comparisons of citations in web of science, scopus, and google scholar for articles published in general medical journals. JAMA 2009, 302, 1092–1096. [Google Scholar] [CrossRef]
- Bakkalbasi, N.; Bauer, K.; Glover, J.; Wang, L. Three options for citation tracking: Google scholar, scopus and web of science. Biomed. Digit. Libr. 2006, 3, 7. [Google Scholar] [CrossRef]
- Cobo, M.J.; Lopez-Herrera, A.G.; Herrera-Viedma, E.; Herrera, F. Science mapping software tools: Review, analysis, and cooperative study among tools. JASIS 2011, 62, 1382–1402. [Google Scholar] [CrossRef]
- van Eck, N.J.; Waltman, L. Software survey: Vosviewer, a computer program for bibliometric mapping. Scientometrics 2010, 84, 523–538. [Google Scholar] [CrossRef]
- Chen, C.M. Citespace ii: Detecting and visualizing emerging trends and transient patterns in scientific literature. JASIS 2006, 57, 359–377. [Google Scholar] [CrossRef]
- Garfield, E.; Paris, S.W.; Stock, W.G. Histcite™: A software tool for informetric analysis of citation linkage. Inf. Wiss. Und Prax. 2006, 57, 391. [Google Scholar]
- He, H.; Dyck, M.; Lv, J. The heat pulse method for soil physical measurements: A bibliometric analysis. Appl. Sci. 2020, 10, 6171. [Google Scholar] [CrossRef]
- He, D.; Bristow, K.; Filipović, V.; Lv, J.; He, H. Microplastics in terrestrial ecosystems: A scientometric analysis. Sustainability 2020, 12, 8739. [Google Scholar] [CrossRef]
- ElHawary, H.; Salimi, A.; Diab, N.; Smith, L. Bibliometric analysis of early covid-19 research: The top 50 cited papers. Infect. Dis. Res. Treat. 2020, 13, 1178633720962935. [Google Scholar] [CrossRef]
- Hicks, D.; Wouters, P.; Waltman, L.; Rijcke, S.d.; Rafols, I. Bibliometrics: The leiden manifesto for research metrics. Nature 2015, 520, 429–431. [Google Scholar] [CrossRef]
- Chen, J.; Liu, L.; Dyck, M.; Lv, J.; He, H. Mapping the scientific research on natural landscape change with rephotography. Ecol. Inform. 2021, 64, 101387. [Google Scholar] [CrossRef]
- Feng, S.; Zhang, H.; Lv, J.; Dyck, M.; Wu, Q.; He, H. A scientometric review of research status on unfrozen soil water. Water 2021, 13, 708. [Google Scholar] [CrossRef]
- Lv, W.; Zhao, X.; Wu, P.; Lv, J.; He, H. A scientometric analysis of worldwide intercropping research based on web of science database between 1992 and 2020. Sustainability 2021, 13, 2430. [Google Scholar] [CrossRef]
- Pan, X.; Lv, J.; Dyck, M.; He, H. Bibliometric analysis of soil nutrient research between 1992 and 2020. Agriculture 2021, 11, 223. [Google Scholar] [CrossRef]
- Zhang, D.; Dyck, M.; Filipović, L.; Filipović, V.; Lv, J.; He, H. Hyperaccumulators for potentially toxic elements: A scientometric analysis. Agronomy 2021, 11, 1729. [Google Scholar] [CrossRef]
- Yang, J.; Wu, G.; Jiao, J.; Dyck, M.; He, H. Freeze-thaw induced landslides on grasslands in cold regions. CATENA 2022, 219, 106650. [Google Scholar] [CrossRef]
- Wang, J.; Turner, N.C.; Feng, H.; Dyck, M.; He, H. Heat tracer-based sap flow methods for tree transpiration measurements: A mini review and bibliometric analysis. J. Exp. Bot. 2023, 74, 723–742. [Google Scholar] [CrossRef]
- Wang, X.; Yang, Y.; Lv, J.; He, H. Past, present and future of the applications of machine learning in soil science and hydrology. Soil Water Res. 2023, 18, 67–80. [Google Scholar] [CrossRef]
- Meho, L.I.; Yang, K. Impact of data sources on citation counts and rankings of lis faculty: Web of science versus scopus and google scholar. J. Assoc. Inf. Sci. Technol. 2007, 58, 2105–2125. [Google Scholar] [CrossRef]
- Martín-Martín, A.; Orduna-Malea, E.; Thelwall, M.; Delgado López-Cózar, E. Google scholar, web of science, and scopus: A systematic comparison of citations in 252 subject categories. J. Informetr. 2018, 12, 1160–1177. [Google Scholar] [CrossRef]
- Van Noorden, R. Google scholar pioneer on search engine’s future. Nature 2014, 16269. [Google Scholar] [CrossRef]
- Wang, K.; Shen, Z.; Huang, C.; Wu, C.-H.; Dong, Y.; Kanakia, A. Microsoft academic graph: When experts are not enough. Quant. Sci. Stud. 2020, 1, 396–413. [Google Scholar] [CrossRef]
- Orduña-Malea, E.; Martín-Martín, A.; Juan, M.A.; Delgado López-Cózar, E. The silent fading of an academic search engine: The case of microsoft academic search. Online Inf. Rev. 2014, 38, 936–953. [Google Scholar] [CrossRef]
- Rodriguez, A.; Laio, A. Clustering by fast search and find of density peaks. Science 2014, 344, 1492–1496. [Google Scholar] [CrossRef]
- Mongeon, P.; Paul-Hus, A. The journal coverage of web of science and scopus: A comparative analysis. Scientometrics 2016, 106, 213–228. [Google Scholar] [CrossRef]
- Fahimnia, B.; Sarkis, J.; Davarzani, H. Green supply chain management: A review and bibliometric analysis. Int. J. Prod. Econ. 2015, 162, 101–114. [Google Scholar] [CrossRef]
- Zupic, I.; Cater, T. Bibliometric methods in management and organization. Organ. Res. Methods 2015, 18, 429–472. [Google Scholar] [CrossRef]
- Raan, A.F.J.v. Fatal attraction: Conceptual and methodological problems in the ranking of universities by bibliometric methods. Scientometrics 2005, 62, 133–143. [Google Scholar] [CrossRef]
- Nederhof, A.J. Bibliometric monitoring of research performance in the social sciences and the humanities: A review. Scientometrics 2006, 66, 81–100. [Google Scholar] [CrossRef]
- Jenssen, T.K.; Laegreid, A.; Komorowski, J.; Hovig, E. A literature network of human genes for high-throughput analysis of gene expression. Nat. Genet. 2001, 28, 21–28. [Google Scholar] [CrossRef]
- Zhang, H.; Liu, X.; Yi, J.; Yang, X.; Wu, T.; He, Y.; Duan, H.; Liu, M.; Tian, P. Bibliometric analysis of research on soil water from 1934 to 2019. Water 2020, 12, 1631. [Google Scholar] [CrossRef]
- Hou, L.-X.; Liu, R.; Liu, H.-C.; Jiang, S. Two decades on human reliability analysis: A bibliometric analysis and literature review. Ann. Nucl. Energy 2021, 151, 107969. [Google Scholar] [CrossRef]
Disclaimer/Publisher’s Note: The statements, opinions and data contained in all publications are solely those of the individual author(s) and contributor(s) and not of MDPI and/or the editor(s). MDPI and/or the editor(s) disclaim responsibility for any injury to people or property resulting from any ideas, methods, instructions or products referred to in the content. |
© 2023 by the authors. Licensee MDPI, Basel, Switzerland. This article is an open access article distributed under the terms and conditions of the Creative Commons Attribution (CC BY) license (https://creativecommons.org/licenses/by/4.0/).