Article

Reef-Insight: A Framework for Reef Habitat Mapping with Clustering Methods Using Remote Sensing

1
Department of Computer Science and Engineering, Manipal Institute of Technology, Manipal 576104, India
2
Geocoastal Research Group, School of Geosciences, University of Sydney, Sydney 2006, Australia
3
Transitional Artificial Intelligence Research Group, School of Mathematics and Statistics, UNSW Sydney, Sydney 2052, Australia
*
Author to whom correspondence should be addressed.
Information 2023, 14(7), 373; https://doi.org/10.3390/info14070373
Submission received: 12 April 2023 / Revised: 13 June 2023 / Accepted: 20 June 2023 / Published: 30 June 2023
(This article belongs to the Special Issue Application of Artificial Intelligence for Sustainable Development)

Abstract

:
Environmental damage has been of much concern, particularly in coastal areas and the oceans, given climate change and the drastic effects of pollution and extreme climate events. Our present-day analytical capabilities, along with advancements in information acquisition techniques such as remote sensing, can be utilised for the management and study of coral reef ecosystems. In this paper, we present Reef-Insight, an unsupervised machine learning framework that features advanced clustering methods and remote sensing for reef habitat mapping. Our framework compares different clustering methods for reef habitat mapping using remote sensing data. We evaluate four major clustering approaches based on qualitative and visual assessments which include k-means, hierarchical clustering, Gaussian mixture model, and density-based clustering. We utilise remote sensing data featuring the One Tree Island reef in Australia’s Southern Great Barrier Reef. Our results indicate that clustering methods using remote sensing data can well identify benthic and geomorphic clusters in reefs when compared with other studies. Our results indicate that Reef-Insight can generate detailed reef habitat maps outlining distinct reef habitats and has the potential to enable further insights for reef restoration projects.

1. Introduction

Remote sensing provides the methodology that enables aerial data to be retrieved using advanced satellites and aerial vehicles [1,2]. In recent decades, remote sensing has been prominent in a number of applications, which include tropical forest environmental monitoring [3], environmental monitoring [4], mining environmental monitoring [5], coral reef monitoring [6], agriculture [7], surface moisture and soil monitoring [8], and space research [9]. Remote sensing data with machine learning methods have been increasingly used [10,11,12] in diverse applications, such as mineral exploration [13], environmental monitoring, and agriculture [14].
Coral reef mapping [15,16] provides valuable information about reef characteristics, such as the structure of the reef, geomorphic and benthic zones, and coral distribution, which can help in reef restoration projects [17,18]. Some of the related studies that used remote sensing are discussed as follows: Kennedy et al. [19] proposed a coral classification system that combines satellite data and local knowledge for identifying different geomorphic regions in a coral reef. Among various analytical techniques used on remote sensing data, Phinn et al. [20] assessed the quality of benthic and geomorphic community maps of coral reefs produced with multi-scale image analysis. Other map-processing approaches commonly used are supervised classification [21] and manual delineation of classes using images as a backdrop. Phinn et al. [22] evaluated eight commonly used benthic cover mapping techniques based on the two processing approaches stated above. Eight techniques were assessed on the basis of cost, accuracy, time, and relevance, where the preferred mapping approach was supervised learning using the classification of satellite data using basic field knowledge. Nguyen et al. [23] provided a review of coral reef mapping with multispectral satellite image correction, and pre-processing techniques and classification algorithms. Machine learning enables valuable information to be extracted from remotely sensed data with clustering [24], dimensionality reduction [25], and classification methods [11]. Machine learning methods are slowly becoming prominent for climate change problems [26]. These methods can also be used to understand and reconstruct data for climate and vegetation millions of years back in time [27]. Clustering [28] is an unsupervised machine learning method that is useful for remote sensing when labelled data are unavailable. The clusters produced using clustering techniques can be further improved using specific spatial information from the data or by applying basic domain knowledge [29,30]. Clustering techniques can be used for image segmentation tasks [31], where pixels are grouped into distinct regions (clusters) on the basis of given similarity measures. There are several clustering techniques that serve this purpose, such as the k-means clustering algorithm [32], agglomerative hierarchical clustering [33], density-based spatial clustering (DBSCAN) [34], and Gaussian mixture model (GMM) [35].
Our choice of clustering methods is based on their properties for the segmentation of image-based data. Our literature review indicates that the selected methods have strengths and limitations in various applications; however, our study evaluates them to segment reef community mapping based on satellite-based image data.
In the case of hyperspectral and multispectral data that feature multiple bands and thus feature a large number of data, dimensional reduction methods, such as principal component analysis (PCA) [36], can reduce the number of bands in order to make the data applicable for clustering methods. They have been used in remote sensing applications, such as mineral exploration with satellite data [25]. Existing work conducted in creating reef maps using supervised learning techniques can be utilised for qualitative comparisons with clustering results and for labelling the regions. The success of clustering techniques in mapping regions and in the field of geosciences inspires the use of the technique for the benthic [37] and geomorphic mapping [38] of coral reefs. Although remote sensing data (multispectral and hyperspectral) have been used for coral reef mapping [6,39,40,41,42,43], not much has been conducted using clustering techniques, particularly using open source software frameworks. There are proprietary remote sensing software suits [44,45] that have inbuilt features for reef mapping, but these are not easily available. This is a problem not just for reproducible research, but for the application of such methods in developing countries, where such software suites are not economically viable for research purposes, and this slows down research and development in the area of reef monitoring, which is a major focus of climate change-related research. The main problem in reef community mapping is to automatically detect different communities of coral systems, which is challenging with limited, noisy and sparse datasets.
In this paper, we present an unsupervised machine learning framework using novel clustering methods for the detection and mapping of coral reef habitats with remote sensing. We present Reef-Insight, a framework for reef community mapping using remote sensing with which we compared four major clustering approaches in order to determine which method is the most suitable based on qualitative and visual assessments. The clustering methods include k-means, GMM, agglomerative clustering, and DBSCAN. We utilise a remote sensing dataset from One Tree Island in the Southern Great Barrier Reef in Australia. Our framework provides the detection and generation of detailed maps that highlight distinct reef habitats that can guide scientists and policymakers in reef restoration projects. Our key innovation is in the development of a framework that can take different forms of data (benthic and geomorphic maps) and evaluate prominent clustering methods for reef community mapping.
The rest of the paper is organised as follows: In Section 2, we present the proposed methodology, followed by experiments and results in Section 3. Section 4 provides a discussion, and Section 5 provides the conclusion with directions for future work.

2. Methodology

2.1. Study Area

One Tree Island (located at 23°30′30″ S, 152°05′30″ E) is a coral reef in the southern Great Barrier Reef. It is a part of the Capricorn–Bunker group about 90 km east of Port Gladstone in Queensland, Australia. The University of Sydney maintains the research station on the island, and as such, the One Tree Island reef has been the subject of detailed biological and geological investigation over the past four decades (see [46,47,48]), including studies using remote sensing [49]. Hence, the reef habitats and geomorphic zones characterising the One Tree Island reef have been well studied. Our study area (Figure 1) is located at the eastern end of a coral reef that spans about 5.5 km in length and 3.5 km in width.

2.2. Data

We utilise the PlanetScope satellite imagery which is available on the Allen Coral Atlas website. The PlanetScope (Dove) (https://earth.esa.int/eogateway/missions/planetscope, accessed on 1 June 2023) image-based data feature 3 spectral bands (red, green, and blue) at 8-bit radiometric resolution. The raw images are processed for atmosphere radiance, sensor and radiometric calibration, flatfield correction, debayering, orthorectification, and surface reflectance. Furthermore, mosaic-based processing is done to utilise the “best scene on top” technique to create the final mosaic. The mosaic process is taken from the implementation in the Allen Coral Atlas [51] (Figure 2). We create bathymetric image data using 10 m resolution with the Sentinel-2 surface reflectance dataset using Google Earth Engine (GEE) (https://developers.google.com/earth-engine/datasets/catalog/sentinel-2, accessed on 1 June 2023). Finally, we create a single mosaic (16-bit integer) by aggregating the median value of the input data over a period of 12 months. We utilise this bathymetric information for creating geomorphic maps.

2.3. Benthic and Geomorphic Regions in Reef

The benthic [37] mapping of coral reefs refers to the use of aerial imagery, underwater photos, acoustic surveys, and data from sediment samples. The benthic zone refers to an ecological region with a low level of water, such as an ocean and coral reef community, that includes the sediment surface. Geomorphology refers to the evolution of topographic and bathymetric features through physical, chemical, and biological processes on the Earth’s surface [52]. Geomorphic coral reef mapping [38] refers to topographic and bathymetric features of reef habitats [53].

2.4. Clustering Techniques

2.4.1. K-Means Clustering

K-means clustering is an algorithm that divides data into a set of clusters (k) based upon a distance metric [32,54]. Given a d-dimensional vector for a dataset of samples ( x 1 , x 2 , , x N ) of size N, the algorithm partitions (groups) the data into k (≤N) sets C = C 1 , C 2 , , C k . The aim of the algorithm is to minimize the error given by the within-cluster sum of squares (WCSS), which is given as the sum of squared Euclidean distances between the data samples and the corresponding centroid in the original algorithm [55].
W ( C k ) = x i ϵ C k 1 ( x i μ k ) 2
where x i is a data sample belonging to cluster C k and μ k is the mean of the samples in cluster C k . We assign each data sample to a given cluster such that the WCSS error to their assigned cluster centres, μ k , is minimised. The total WCSS error is given as follows:
W C S S = k = 1 k W ( C k ) = k = 1 k x i ϵ C k 1 ( x i μ k ) 2
Although k-means clustering has been prominent in tabular data, it can also be used on image and remote sensing data for segmentation, which is also the focus of this paper. There have been applications of k-means clustering for remote sensing-based image segmentation, change detection, and land cover classification. Theiler et al. [56] proposed a variation of the k-means algorithm to utilise both the spectral and spatial properties of satellite imagery for image segmentation. Lv et al. [57] integrated k-means clustering with an adaptive majority voting model for land cover change detection. Celik [58] used dimensional reduction with PCA and k-means clustering for the task of change detection. Abbas et al. [59] utilised k-means and ISODATA [60] (which is an extension of k-means clustering) for land cover classification using remote sensing data. These applications motivate the use of k-means clustering in our proposed framework.

2.4.2. GMM

A GMM is based on a probabilistic model that assumes that data are generated from a mixture of Gaussian distributions with parameters that are adjusted by training. A GMM is useful for clustering, anomaly detection, and density estimation [61]. It consists of three parameters, which include mean ( μ ), which defines the centre of each of the Gaussian distributions; covariance ( Σ ), which represents the spread; and mixing probability ( Π ), defining the weight of the respective Gaussian distribution. The mixing coefficients for each cluster (k) are themselves probabilities ( π k ), and must have a sum of 1 as shown below.
k = 1 k π k = 1
In comparison to GMMs, k-means clustering places a circle (a hypersphere in the case of higher dimensions) at the centre of each cluster. We can define a radius with the most distant point in the cluster; however, GMMs can also handle oblong and ellipsoidal forms of clusters. The applications of GMMs in remote sensing data processing include image clustering, segmentation, and synthetic data generation. Bei et al. [62] presented an improvised GMM that takes into account spatial information to improve image clustering. Yin et al. [63] combined the fuzzy region competition method with a GMM for image segmentation. Davari et al. [64] utilised a GMM for hyperspectral remote sensing that featured the challenge of large dimensions (features) with fewer training data points. Neagoe et al. [65] presented a cascade of k-means clustering and a GMM for semi-supervised classification.

2.4.3. Agglomerative Clustering

Agglomerative hierarchical clustering, also known as agglomerative nesting (AGNES), is the most common type of hierarchical clustering used to group data samples in clusters based on their similarity [33,66,67]. The algorithm begins by treating each data instance as a singleton cluster, and pairs of clusters are merged until all clusters have been merged into a large cluster featuring all the data. This produces a dendrogram, which is a tree-based representation of the data samples. It produces a flexible and informative cluster tree instead of forcing users to choose a particular number of clusters, such as determining k in the k-means algorithm. Goncalves et al. [68] proposed an unsupervised clustering method combining self-organising maps (SOMs) with AGNES for the classification of remotely sensed data. Liu et al. [69] used hierarchical clustering for the image segmentation of high-resolution remote sensing images.

2.4.4. DBSCAN

DBSCAN [34] uses local density estimation to identify clusters of arbitrary shapes, which is not easily possible with traditional methods, such as k-means clustering. In DBSCAN, the data samples are seen as core points (density), reachable points, and outliers. The algorithm counts how many samples are located within a small distance from each core point and marks a region called the neighbourhood. The data samples in the neighbourhood of a core sample belong to the same cluster. This neighbourhood may include other core instances; therefore, a long sequence of neighbouring core instances forms a single cluster. Any sample that is not a core sample and does not have one in its neighbourhood is considered an anomaly. DBSCAN clustering has been prominent in a number of applications with tabular data [70] and has been used for remote sensing data. Wang et al. [71] presented an improved DBSCAN method for Lidar data, and the results showed that it could segment different types of point clouds with higher accuracy in a robust manner. Liang Zhang et al. [72] utilised DBSCAN clustering in their adaptive superpixel generation algorithm for synthetic-aperture radar (SAR) imagery. Liujun Zhu et al. [73] used DBSCAN for vegetation change detection using multi-temporal analysis.

2.5. Framework

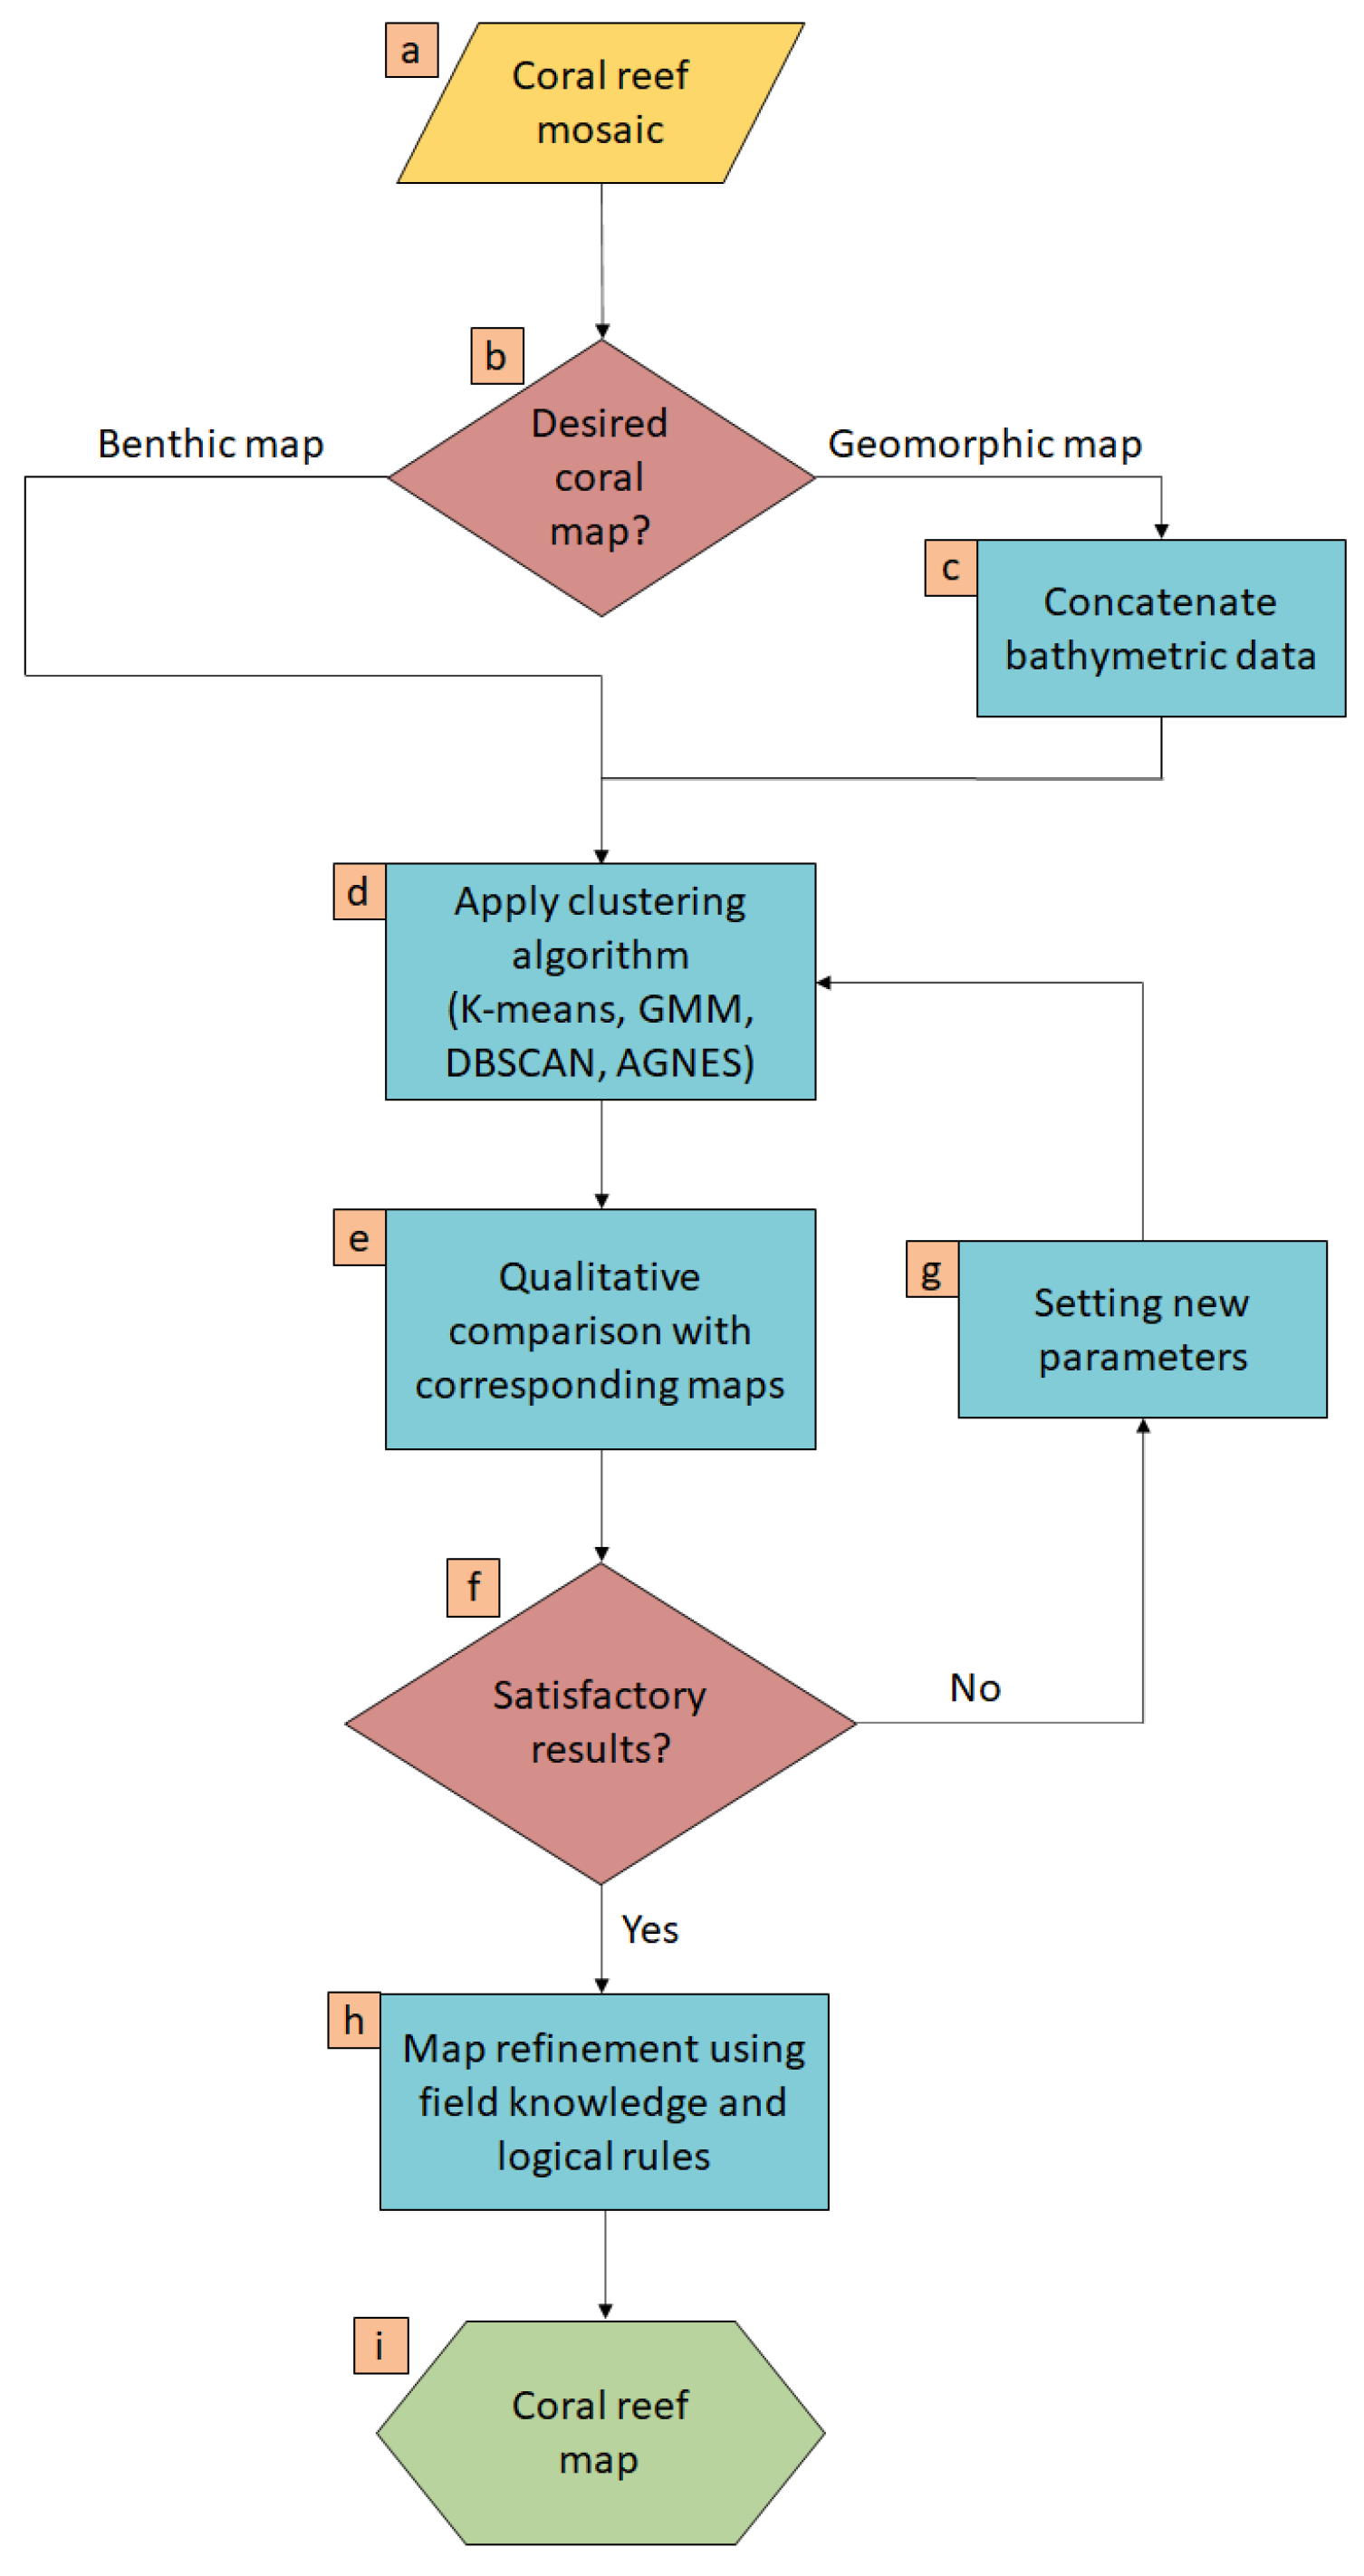
Next, we present the framework that incorporates the different clustering algorithms, i.e., k-means, GMM, agglomerative clustering, and DBSCAN, for the segmentation of two different types of satellite imagery to create coral reef maps (Figure 3). The initial step is to acquire remote sensing-based imagery of the coral region of interest (Figure 3—Step a). The coral reef mosaic data taken from the Allen Coral Atlas [51] utilise sensor and radiometric calibration for image processing. Moreover, they employ the “best scene on top” (BOT) technique in the mosaicking process of PlanetScope imagery [51]. In Step b, we check what type of reef community mapping is desired by the user, i.e., benthic or geomorphic mapping. We then create a geomorphic map of the region, where the bathymetric data (Step c) are concatenated with the imagery obtained in the previous step. Next, we evaluate the clustering algorithms (Figure 3—Step d) to create clustering regions (segments). We need to evaluate the results and thus need a way to ensure that the acquired segments are meaningful. Hence, we apply qualitative analysis, where we assign each cluster a colour according to the map used for comparison; then, we compare the maps qualitatively (visually), side by side (Figure 3—Step e). This helps in assigning the labels to the clusters based on the visual similarities to the existing maps. If the results obtained are unsatisfactory, the clustering algorithm is again applied to the data with new parameters (Step g). The final step incorporates map refinement and clean-up (Step h), wherein we merge the extra clusters with the closest region of interest [51] to generate the coral reef map of interest (Step i).
Map refinement by logical rules (Step h) remaps the smaller, excess clusters to the major cluster of a given label surrounding them. This ensures that the smaller clusters are merged to obtain a refined map with only the regions having labels of interest.

3. Results

3.1. K-Means and GMM Clustering

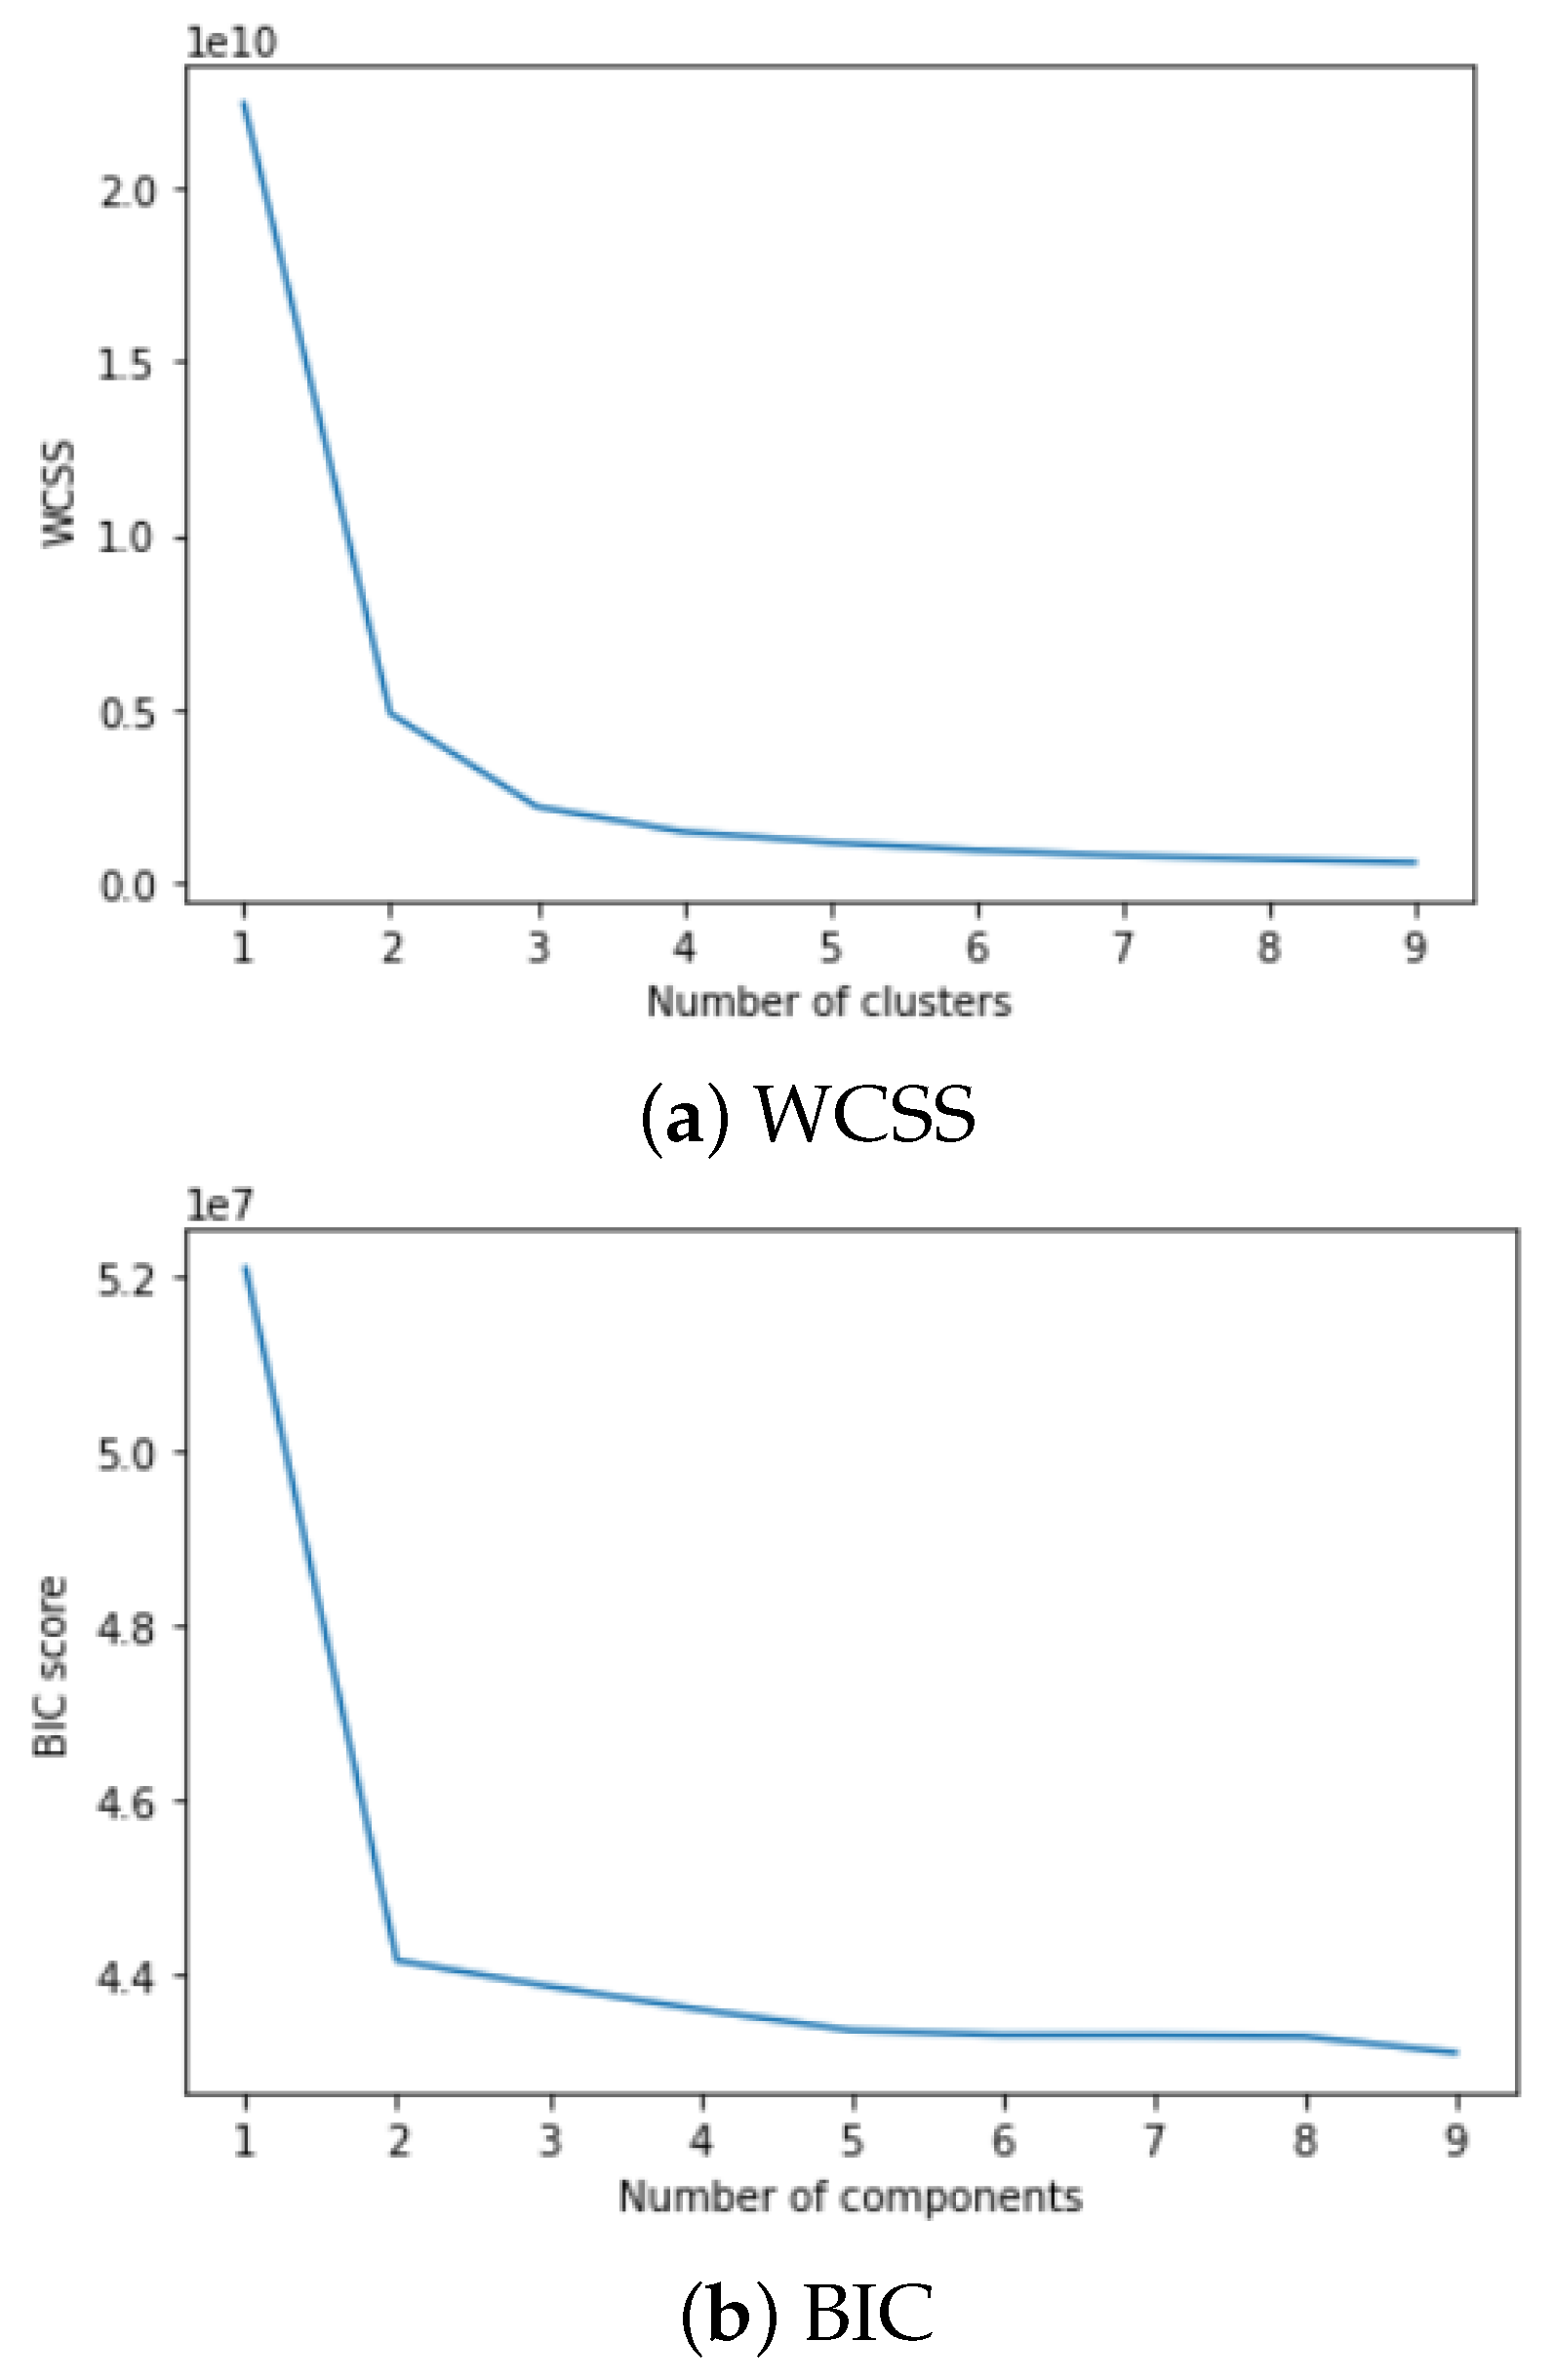
We begin by finding the optimal number of clusters for our framework’s respective clustering methods, i.e., k-means and GMM. In the case of k-means clustering, we use the elbow method, which plots the sum of the square distance to find the number of optimal clusters (k value) by calculating the distance between a data point and the cluster (WCSS). The point where the curve starts to flatten and resembles the elbow of the curve is chosen as the k value. In Figure 4, an elbow can be seen at k = 3 . In the case of GMM, we use the Bayesian information criterion (BIC) to find the value of k. The gradient of the BIC score curve, much similar to finding the elbow of the curve, is used to estimate the optimal number of clusters for the data. A lower score indicates that the model better fits the data. However, in order to avoid over-fitting, this technique penalises the methods with a large number of clusters. In Figure 4, we select the point that reflects the major change in the gradient which can be seen at k = 2 .
In our case, we provide a visual comparison to evaluate the methods, i.e., qualitative comparison of the clustered maps of the reef and the Allen Coral Atlas. Hence, while keeping the elbow method and BIC score in mind, we review the results obtained using the clustering methods and choose k based on maximum resemblance to the regions of interest in the coral maps (e.g., Figure 5b).

3.2. Comparison of Selected Clustering Results

Figure 6 and Figure 7 represent the benthic and geomorphic maps generated with the four clustering methods considered in our framework. Agglomerative clustering is computationally exhaustive; hence, we down-scaled the data to 20% of the original size, which led to the loss of finer details of the areas of interest (Figure 6d and Figure 7d). DBSCAN gave an adequate result, especially for the geomorphic map (Figure 6c) of the region, by removing the bathymetric noise and focusing on the reef area. However, a large number of small clusters are not ideal for the map refinement step ahead for visual comparison with existing maps. The k-means results are given in Figure 6a and Figure 7a. The GMM results given in Figure 6b and Figure 7b are satisfactory results in both benthic and geomorphic mapping compared with DBSCAN and AGNES.

3.3. Comparison with Allen Coral Atlas

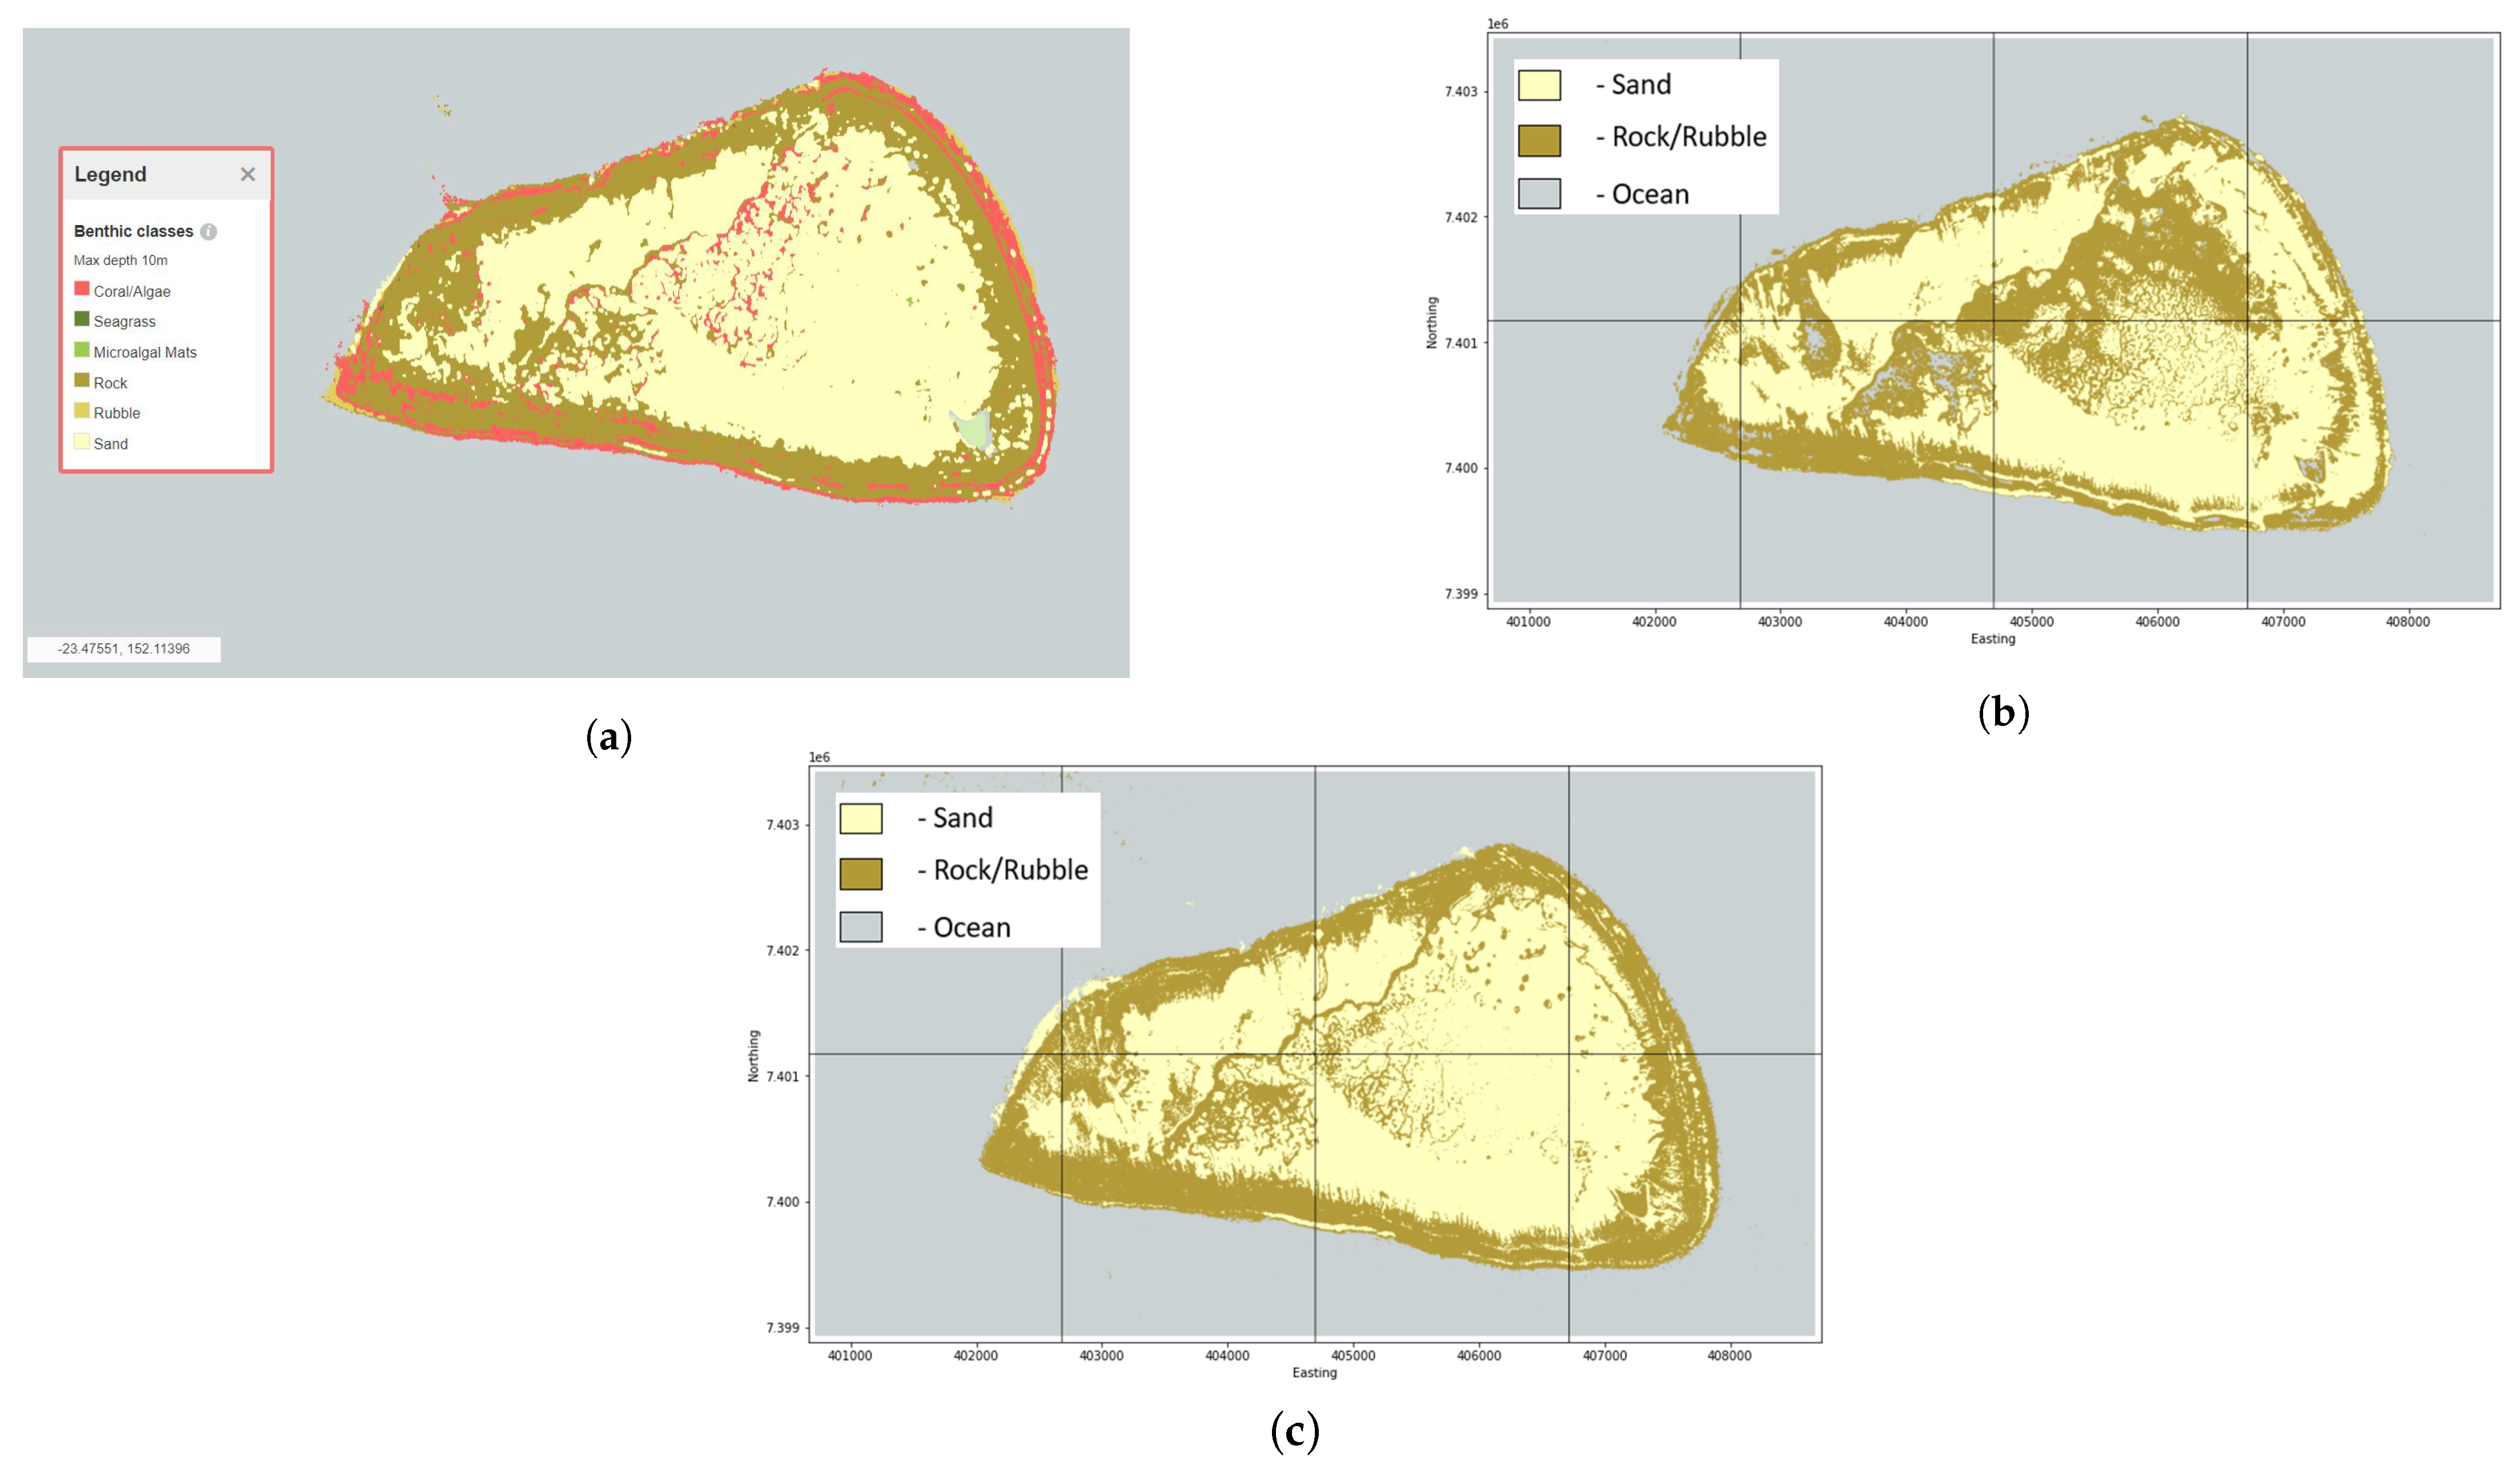
Next, we execute k-means and GMM clustering methods with a selected number of clusters ( k = 4 ) that gives maximum resemblance to actual data. In the GMM, we set the covariance type parameter set to full to ensure that each component of the GMM had its own general covariance matrix. The preliminary results obtained (Figure 8a) represent the four clusters. We observe that the GMM clustering method has well extracted the flat sand region represented by the black cluster. We then combine the clustered region and the sand region to obtain the final result. The clustering results of generating benthic coral maps obtained with k-means (Figure 9b) and the GMM (Figure 9c) showcase three clusters, namely, ocean, sand, and rock/rubble. Upon visual comparison with the benthic map from the Allen Coral Atlas (Figure 9a), we can see that GMM provides clusters with higher similarity than k-means clustering. Figure 8 shows the results of the logical rules (Figure 3—Step h) used to create the benthic map generated using GMM. Figure 8b has a black cluster that got remapped to a sand (yellow) cluster in the map refinement stage (Figure 9c).
In the case of the geomorphic map, we set the number of clusters ( k 7 ) for both methods, i.e., k-means and GMM. The preliminary results obtained using the GMM (Figure 8b) provide extra clusters in the ocean region by making a distinction in water bathymetry. We combine the clusters in the ocean region by visually comparing them with the Allen Coral Atlas geomorphic map.
We observe that the final geomorphic maps generated using k-means (Figure 10b) and GMM (Figure 10c) generate four clusters: reef flat, lagoon/plateau, reef slope, and ocean. The reef flat and the lagoon/plateau region created with the GMM had a greater resemblance to the original geomorphic map given by the Allen Coral Atlas (Figure 10a). A general limitation in clustering methods for reef habitat mapping is the classification of local regions which is due to a lack of labelled data. Nevertheless, this approach can be useful for gathering a basic overview of reef habitats without the need for manual labelling, which is a labour-intensive task.

4. Discussion

In this study, we presented a framework that processes remote sensing data and compared four clustering methods (k-means, GMM, AGNES, and DBSCAN) for generating reef habitat maps using remote sensing data of the One Tree Island reef. We utilised the Allen Coral Atlas mosaic of the region to generate benthic maps using clustering methods and incorporated bathymetric data for understanding the geomorphic habitats of the region. We selected the appropriate clustering method based on visual comparative analysis to ensure that the clustered regions took into account the local field knowledge and geology. Thus, we generated a three-class benthic map distinguishing among sand, rock/rubble, and ocean, and a four-class geomorphic map identifying reef flat, reef slope, lagoon, and ocean regions on the map. The quality of segmentation depended on parameter tuning and the choice of the clustering method.
The coral maps obtained with the proposed framework can be considered preliminary maps for understanding the geomorphology of the region of interest. Our framework can provide additional support to the supervised methods that are mainly used for reef mapping, such as the one used in the Allen Coral Atlas. In future studies, our framework can be used to understand more about surface geology in coral reefs, given the sea-level rise for thousands of years. Since there are drilled reef-core data of the site that give insights into the evolution of coral reef structures for thousands of years, this can help extend software such as BayesReef [74], which uses Bayesian inferences for stimulating one-dimensional reef cores into three-dimensional reef evolution simulations.
In terms of the limitations of the framework, we note that there is a lengthy process of taking into account the visual comparison to find the optimal parameters for reef mapping. Moreover, it is also difficult to assess the accuracy of clusters on their own, and field knowledge and labelled maps to allocate labels to each clustering region are required. However, the study has revealed certain combinations of hyper-parameters (k value) that are useful for reef areas, and the same can be used in future studies in which the framework is applied to other regions. Furthermore, the current study considered a relatively small area, and it can be a challenge if clustering methods are used on a large area, such as the entire GBR region. The framework would then need to be extended using a distributed/parallel computing infrastructure so that the method can work with smaller regions, i.e., large regions can be divided using a grid and the results can be combined.
We note that we did not consider data with temporal dimension, as they were not available in our dataset. In the future, given the availability of temporal satellite data, our framework could be extended to evaluate decadal changes in reef habitat mapping that can capture extreme climate events, such as cyclones, and other events, such as tsunamis, which have devastating impacts on coral reef systems [75]. In such a study, the need for parameter tuning and the evaluation of clustering methods can be eliminated using the results from this study. Temporal data can also be used to study short-term seasonal changes in reef habitats. The quality of segmentation depends on parameter tuning and the choice of the clustering method. Our paper evaluates different clustering algorithms and recommends the best for this problem. The method is replicable and readability available with the results of the study and the availability of code and data.

5. Conclusions and Future Work

In this study, we presented a framework to compare different clustering methods for the task of reef habitat mapping using unlabelled remote sensing data. We used One Tree Island of the GBR to demonstrate the effectiveness of the framework. The framework transformed the raw clusters into a reef habitat map using field knowledge and map refinement operations based on logical rules that were gathered from expert knowledge. The results show that the k-means and GMM clustering methods are the most suitable for benthic and geomorphic reef mapping, as these methods created the maps that were the most visually similar to the maps obtained using related methods (Coral Atlas).
In future work, our framework can be used for reef change detection, especially when field inspection cannot be easily conducted; e.g., in case of natural disasters such as tsunamis, storms, and cyclones. The framework can help assess the impact of extreme climate events (cyclones and storms) on reef habitats, which can play a crucial role in reef restoration projects. Furthermore, the framework can also be utilised for generating maps using remote sensing data of the regions for which labelled data are unavailable, such as remote sensing data obtained from Mars and Moon exploration projects. Our framework is a way to address the challenges faced by reef scientists that involve finding labelled data for analysis and the need for manually labelling reef regions, especially in large regions. It can be considered a low-cost and robust approach to working with raw data during the exploration stage of a research study. In future work, our framework can be extended with other clustering methods and further validated using regions with labelled reef data.

Author Contributions

S.B. contributed to programming, experiments, and writing. J.M.W. provided data and contributed to analyses and writing. R.C. conceptualised and supervised the project and contributed to writing and analyses. All authors have read and agreed to the published version of the manuscript.

Funding

This research received no external funding.

Data Availability Statement

We provide open source code and data for our proposed framework at GitHub repository https://github.com/DARE-ML/reefhabitat-mapping (accessed on 1 June 2023).

Conflicts of Interest

The authors declare no conflict of interest.

References

  1. Navalgund, R.R.; Jayaraman, V.; Roy, P. Remote sensing applications: An overview. Curr. Sci. 2007, 93, 1747–1766. [Google Scholar]
  2. Pajares, G. Overview and current status of remote sensing applications based on unmanned aerial vehicles (UAVs). Photogramm. Eng. Remote Sens. 2015, 81, 281–330. [Google Scholar] [CrossRef] [Green Version]
  3. Foody, G.M. Remote sensing of tropical forest environments: Towards the monitoring of environmental resources for sustainable development. Int. J. Remote Sens. 2003, 24, 4035–4046. [Google Scholar] [CrossRef]
  4. Li, J.; Pei, Y.; Zhao, S.; Xiao, R.; Sang, X.; Zhang, C. A review of remote sensing for environmental monitoring in China. Remote Sens. 2020, 12, 1130. [Google Scholar] [CrossRef] [Green Version]
  5. Padmanaban, R.; Bhowmik, A.K.; Cabral, P. A remote sensing approach to environmental monitoring in a reclaimed mine area. ISPRS Int. J. Geo-Inf. 2017, 6, 401. [Google Scholar] [CrossRef] [Green Version]
  6. Hedley, J.D.; Roelfsema, C.M.; Chollett, I.; Harborne, A.R.; Heron, S.F.; Weeks, S.; Skirving, W.J.; Strong, A.E.; Eakin, C.M.; Christensen, T.R.; et al. Remote sensing of coral reefs for monitoring and management: A review. Remote Sens. 2016, 8, 118. [Google Scholar] [CrossRef] [Green Version]
  7. Seelan, S.K.; Laguette, S.; Casady, G.M.; Seielstad, G.A. Remote sensing applications for precision agriculture: A learning community approach. Remote Sens. Environ. 2003, 88, 157–169. [Google Scholar] [CrossRef]
  8. Wang, L.; Qu, J.J. Satellite remote sensing applications for surface soil moisture monitoring: A review. Front. Earth Sci. China 2009, 3, 237–247. [Google Scholar] [CrossRef]
  9. Elachi, C. Spaceborne Radar Remote Sensing: Applications and Techniques; IEEE Press: New York, NY, USA, 1988. [Google Scholar]
  10. Lary, D.J.; Alavi, A.H.; Gandomi, A.H.; Walker, A.L. Machine learning in geosciences and remote sensing. Geosci. Front. 2016, 7, 3–10. [Google Scholar] [CrossRef] [Green Version]
  11. Maxwell, A.E.; Warner, T.A.; Fang, F. Implementation of machine-learning classification in remote sensing: An applied review. Int. J. Remote Sens. 2018, 39, 2784–2817. [Google Scholar] [CrossRef] [Green Version]
  12. Ali, I.; Greifeneder, F.; Stamenkovic, J.; Neumann, M.; Notarnicola, C. Review of machine learning approaches for biomass and soil moisture retrievals from remote sensing data. Remote Sens. 2015, 7, 16398–16421. [Google Scholar] [CrossRef] [Green Version]
  13. Shirmard, H.; Farahbakhsh, E.; Müller, R.D.; Chandra, R. A review of machine learning in processing remote sensing data for mineral exploration. Remote Sens. Environ. 2022, 268, 112750. [Google Scholar] [CrossRef]
  14. Holloway, J.; Mengersen, K. Statistical machine learning methods and remote sensing for sustainable development goals: A review. Remote Sens. 2018, 10, 1365. [Google Scholar] [CrossRef] [Green Version]
  15. Mumby, P.; Green, E.; Edwards, A.; Clark, C. Coral reef habitat mapping: How much detail can remote sensing provide? Mar. Biol. 1997, 130, 193–202. [Google Scholar] [CrossRef]
  16. Hamylton, S.M. Mapping coral reef environments: A review of historical methods, recent advances and future opportunities. Prog. Phys. Geogr. 2017, 41, 803–833. [Google Scholar] [CrossRef] [Green Version]
  17. Bayraktarov, E.; Stewart-Sinclair, P.J.; Brisbane, S.; Boström-Einarsson, L.; Saunders, M.I.; Lovelock, C.E.; Possingham, H.P.; Mumby, P.J.; Wilson, K.A. Motivations, success, and cost of coral reef restoration. Restor. Ecol. 2019, 27, 981–991. [Google Scholar] [CrossRef]
  18. Jaap, W.C. Coral reef restoration. Ecol. Eng. 2000, 15, 345–364. [Google Scholar] [CrossRef]
  19. Kennedy, E.; Roelfsema, C.; Lyons, M.; Kovacs, E.; Borrego Acevedo, R.; Roe, M.; Phinn, S.; Larsen, K.; Murray, N.; Yuwono, D.; et al. Reef Cover, a coral reef classification for global habitat mapping from remote sensing. Sci. Data 2021, 8, 196. [Google Scholar] [CrossRef]
  20. Phinn, S.; Roelfsema, C.; Mumby, P. Multi-scale, object-based image analysis for mapping geomorphic and ecological zones on coral reefs. Int. J. Remote Sens. 2012, 33, 3768–3797. [Google Scholar] [CrossRef]
  21. White, E.; Mohseni, F.; Amani, M. Coral Reef Mapping Using Remote Sensing Techniques and a Supervised Classification Algorithm. Adv. Environ. Res. 2021, 2, 12. [Google Scholar] [CrossRef]
  22. Roelfsema, C.; Phinn, S. Evaluating eight field and remote sensing approaches for mapping the benthos of three different coral reef environments in Fiji. Proc. SPIE-Int. Soc. Opt. Eng. 2009, 7150, 71500F. [Google Scholar] [CrossRef] [Green Version]
  23. Nguyen, T.; Liquet, B.; Mengersen, K.; Sous, D. Mapping of Coral Reefs with Multispectral Satellites: A Review of Recent Papers. Remote Sens. 2021, 13, 4470. [Google Scholar] [CrossRef]
  24. Zhang, H.; Zhai, H.; Zhang, L.; Li, P. Spectral—Spatial sparse subspace clustering for hyperspectral remote sensing images. IEEE Trans. Geosci. Remote Sens. 2016, 54, 3672–3684. [Google Scholar] [CrossRef]
  25. Shirmard, H.; Farahbakhsh, E.; Beiranvand Pour, A.; Muslim, A.M.; Müller, R.D.; Chandra, R. Integration of selective dimensionality reduction techniques for mineral exploration using ASTER satellite data. Remote Sens. 2020, 12, 1261. [Google Scholar] [CrossRef] [Green Version]
  26. Rolnick, D.; Donti, P.L.; Kaack, L.H.; Kochanski, K.; Lacoste, A.; Sankaran, K.; Ross, A.S.; Milojevic-Dupont, N.; Jaques, N.; Waldman-Brown, A.; et al. Tackling climate change with machine learning. ACM Comput. Surv. (CSUR) 2022, 55, 1–96. [Google Scholar] [CrossRef]
  27. Chandra, R.; Cripps, S.; Butterworth, N.; Muller, R.D. Precipitation reconstruction from climate-sensitive lithologies using Bayesian machine learning. Environ. Model. Softw. 2021, 139, 105002. [Google Scholar] [CrossRef]
  28. Bandyopadhyay, S.; Maulik, U.; Mukhopadhyay, A. Multiobjective genetic clustering for pixel classification in remote sensing imagery. IEEE Trans. Geosci. Remote Sens. 2007, 45, 1506–1511. [Google Scholar] [CrossRef]
  29. Venkateswaran, K.; Kasthuri, N.; Balakrishnan, K.; Prakash, K. Performance Analysis of K-Means Clustering For Remotely Sensed Images. Int. J. Comput. Appl. 2013, 84, 23–27. [Google Scholar] [CrossRef]
  30. Chakraborty, D. Clustering Techniques for Land Use Land Cover Classification of Remotely Sensed Images. In Geographic Information Systems in Geospatial Intelligence; Rustamov, R.B., Ed.; IntechOpen: Rijeka, Croatia, 2020; Chapter 6. [Google Scholar] [CrossRef] [Green Version]
  31. Naik, D.; Shah, P. A review on image segmentation clustering algorithms. Int. J. Comput. Sci. Inf. Technol. 2014, 5, 3289–3293. [Google Scholar]
  32. Macqueen, J. Some methods for classification and analysis of multivariate observations. In Proceedings of the 5-th Berkeley Symposium on Mathematical Statistics and Probability, University of California, Los Angeles, CA, USA, 21 June–18 July 1967; pp. 281–297. [Google Scholar]
  33. Johnson, S. Hierarchical clustering schemes. Psychometrika 1967, 32, 241–254. [Google Scholar] [CrossRef]
  34. Ester, M.; Kriegel, H.P.; Sander, J.; Xu, X. A density-based algorithm for discovering clusters in large spatial databases with noise. In Proceedings of the Kdd, Portland, OR, USA, 2–4 August 1996; Volume 96, pp. 226–231. [Google Scholar]
  35. Biernacki, C.; Celeux, G.; Govaert, G. Assessing a mixture model for clustering with the integrated completed likelihood. IEEE Trans. Pattern Anal. Mach. Intell. 2000, 22, 719–725. [Google Scholar] [CrossRef]
  36. Zabalza, J.; Ren, J.; Yang, M.; Zhang, Y.; Wang, J.; Marshall, S.; Han, J. Novel folded-PCA for improved feature extraction and data reduction with hyperspectral imaging and SAR in remote sensing. ISPRS J. Photogramm. Remote Sens. 2014, 93, 112–122. [Google Scholar] [CrossRef] [Green Version]
  37. Hochberg, E.J.; Atkinson, M. Spectral discrimination of coral reef benthic communities. Coral Reefs 2000, 19, 164–171. [Google Scholar] [CrossRef]
  38. Locker, S.; Armstrong, R.; Battista, T.; Rooney, J.; Sherman, C.; Zawada, D. Geomorphology of mesophotic coral ecosystems: Current perspectives on morphology, distribution, and mapping strategies. Coral Reefs 2010, 29, 329–345. [Google Scholar] [CrossRef]
  39. Holden, H.; LeDrew, E. Hyperspectral identification of coral reef features. Int. J. Remote Sens. 1999, 20, 2545–2563. [Google Scholar] [CrossRef]
  40. Lesser, M.; Mobley, C. Bathymetry, water optical properties, and benthic classification of coral reefs using hyperspectral remote sensing imagery. Coral Reefs 2007, 26, 819–829. [Google Scholar] [CrossRef]
  41. Philipson, P.; Lindell, T. Can coral reefs be monitored from space? AMBIO A J. Hum. Environ. 2003, 32, 586–593. [Google Scholar] [CrossRef]
  42. Goodman, J.A.; Purkis, S.J.; Phinn, S.R. Coral reef remote sensing. In A Guide for Mapping, Monitoring and Management; Springer: Berlin/Heidelberg, Germany, 2013; 436p. [Google Scholar]
  43. Zhang, C. Applying data fusion techniques for benthic habitat mapping and monitoring in a coral reef ecosystem. ISPRS J. Photogramm. Remote Sens. 2015, 104, 213–223. [Google Scholar] [CrossRef]
  44. Zuo, X.; Su, F.; Zhang, J.; Wu, W. Using Landsat Data to Detect Change in Live to Recently (<6 Months) Dead Coral Cover in the Western Xisha Islands, South China Sea. Sustainability 2020, 12, 5237. [Google Scholar] [CrossRef]
  45. Selgrath, J.; Roelfsema, C.; Gergel, S.; Vincent, A. Mapping for coral reef conservation: Comparing the value of participatory and remote sensing approaches. Ecosphere 2016, 7, e01325. [Google Scholar] [CrossRef] [Green Version]
  46. Doo, S.S.; Hamylton, S.; Finfer, J.; Byrne, M. Spatial and temporal variation in reef-scale carbonate storage of large benthic foraminifera: A case study on One Tree Reef. Coral Reefs 2017, 36, 293–303. [Google Scholar] [CrossRef]
  47. Barrett, S.J.; Webster, J.M. Reef Sedimentary Accretion Model (ReefSAM): Understanding coral reef evolution on Holocene time scales using 3D stratigraphic forward modelling. Mar. Geol. 2017, 391, 108–126. [Google Scholar] [CrossRef] [Green Version]
  48. Sanborn, K.L.; Webster, J.M.; Webb, G.E.; Braga, J.C.; Humblet, M.; Nothdurft, L.; Patterson, M.A.; Dechnik, B.; Warner, S.; Graham, T.; et al. A new model of Holocene reef initiation and growth in response to sea-level rise on the Southern Great Barrier Reef. Sediment. Geol. 2020, 397, 105556. [Google Scholar] [CrossRef]
  49. Shannon, A.M.; Power, H.E.; Webster, J.M.; Vila-Concejo, A. Evolution of coral rubble deposits on a reef platform as detected by remote sensing. Remote Sens. 2012, 5, 1–18. [Google Scholar] [CrossRef] [Green Version]
  50. Hamylton, S.; Silverman, J.; Shaw, E. The use of remote sensing to scale up measures of carbonate production on reef systems: A comparison of hydrochemical and census-based estimation methods. Int. J. Remote Sens. 2013, 34, 6451–6465. [Google Scholar] [CrossRef]
  51. Lyons, M.; Roelfsema, C.; Kennedy, E.; Kovacs, E.; Borrego Acevedo, R.; Markey, K.; Roe, M.; Yuwono, D.; Harris, D.; Phinn, S.; et al. Mapping the world’s coral reefs using a global multiscale earth observation framework. Remote Sens. Ecol. Conserv. 2020, 6, 557–568. [Google Scholar] [CrossRef] [Green Version]
  52. Summerfield, M.A. Global Geomorphology; Routledge: Oxfordshire, UK, 2014. [Google Scholar]
  53. Zawada, D.G.; Brock, J.C. A multiscale analysis of coral reef topographic complexity using lidar-derived bathymetry. J. Coast. Res. 2009, 10053, 6–15. [Google Scholar] [CrossRef]
  54. Kaufman, L.; Rousseeuw, P. Finding Groups in Data: An Introduction to Cluster Analysis; John Wiley & Sons: Hoboken, NJ, USA, 1990. [Google Scholar] [CrossRef]
  55. Hartigan, J.A.; Wong, M.A. Algorithm AS 136: A k-means clustering algorithm. J. R. Stat. Society. Ser. C Appl. Stat. 1979, 28, 100–108. [Google Scholar] [CrossRef]
  56. Theiler, J.P.; Gisler, G. Contiguity-enhanced k-means clustering algorithm for unsupervised multispectral image segmentation. In Proceedings of the Algorithms, Devices, and Systems for Optical Information Processing, San Diego, CA, USA, 28–29 July 1997; Volume 3159, pp. 108–118. [Google Scholar] [CrossRef] [Green Version]
  57. Lv, Z.; Liu, T.; Shi, C.; Benediktsson, J.A.; Du, H. Novel land cover change detection method based on K-means clustering and adaptive majority voting using bitemporal remote sensing images. IEEE Access 2019, 7, 34425–34437. [Google Scholar] [CrossRef]
  58. Celik, T. Unsupervised Change Detection in Satellite Images Using Principal Component Analysis and k-Means Clustering. IEEE Geosci. Remote Sens. Lett. 2009, 6, 772–776. [Google Scholar] [CrossRef]
  59. Abbas, A.; Minallh, N.; Ahmad, N.; Abid, S.A.R.; Khan, M.A.A. K-Means and ISODATA Clustering Algorithms for Landcover Classification Using Remote Sensing. Sindh Univ. Res. J. 2016, 48, 315–318. [Google Scholar]
  60. Ball, G.H.; Hall, D.J. ISODATA, a Novel Method of Data Analysis and Pattern Classification; Technical Report; Stanford Research Institute: Menlo Park, CA, USA, 1965. [Google Scholar]
  61. Baid, U.; Talbar, S.; Talbar, S. Comparative Study of K-means, Gaussian Mixture Model, Fuzzy C-means algorithms for Brain Tumor Segmentation. In Proceedings of the International Conference on Communication and Signal Processing 2016 (ICCASP 2016), Lonere, India, 26–27 December 2016; pp. 583–588. [Google Scholar] [CrossRef] [Green Version]
  62. Zhao, B.; Zhong, Y.; Ma, A.; Zhang, L. A Spatial Gaussian Mixture Model for Optical Remote Sensing Image Clustering. IEEE J. Sel. Top. Appl. Earth Obs. Remote Sens. 2016, 9, 5748–5759. [Google Scholar] [CrossRef]
  63. Yin, S.; Zhang, Y.; Karim, S. Large Scale Remote Sensing Image Segmentation Based on Fuzzy Region Competition and Gaussian Mixture Model. IEEE Access 2018, 6, 26069–26080. [Google Scholar] [CrossRef]
  64. Davari, A.; Aptoula, E.; Yanikoglu, B.; Maier, A.; Riess, C. GMM-Based Synthetic Samples for Classification of Hyperspectral Images with Limited Training Data. IEEE Geosci. Remote Sens. Lett. 2018, 15, 942–946. [Google Scholar] [CrossRef] [Green Version]
  65. Neagoe, V.E.; Chirila-Berbentea, V. A novel approach for semi-supervised classification of remote sensing images using a clustering-based selection of training data according to their GMM responsibilities. In Proceedings of the 2017 IEEE International Geoscience and Remote Sensing Symposium (IGARSS), Fort Worth, TX, USA, 23–28 July 2017; pp. 4730–4733. [Google Scholar] [CrossRef]
  66. Rohlf, F.J. Adaptive hierarchical clustering schemes. Syst. Biol. 1970, 19, 58–82. [Google Scholar] [CrossRef]
  67. Milligan, G.W. Ultrametric hierarchical clustering algorithms. Psychometrika 1979, 44, 343–346. [Google Scholar] [CrossRef]
  68. Gonçalves, M.L.; Netto, M.L.A.; Costa, J.A.F.; Júnior, J.Z. An unsupervised method of classifying remotely sensed images using Kohonen self-organizing maps and agglomerative hierarchical clustering methods. Int. J. Remote Sens. 2008, 29, 3171–3207. [Google Scholar] [CrossRef]
  69. Rongjie, L.; Jie, Z.; Pingjian, S.; Fengjing, S.; Guanfeng, L. An Agglomerative Hierarchical Clustering Based High-Resolution Remote Sensing Image Segmentation Algorithm. In Proceedings of the 2008 International Conference on Computer Science and Software Engineering, Washington, DC, USA, 12–14 December 2008; Volume 4, pp. 403–406. [Google Scholar] [CrossRef]
  70. Khan, K.; Rehman, S.U.; Aziz, K.; Fong, S.; Sarasvady, S. DBSCAN: Past, present and future. In Proceedings of the fifth international conference on the applications of digital information and web technologies (ICADIWT 2014), Chennai, India, 17–19 February 2014; pp. 232–238. [Google Scholar]
  71. Wang, C.; Ji, M.; Wang, J.; Wen, W.; Li, T.; Sun, Y. An improved DBSCAN method for LiDAR data segmentation with automatic Eps estimation. Sensors 2019, 19, 172. [Google Scholar] [CrossRef] [Green Version]
  72. Zhang, L.; Lu, S.; Hu, C.; Xiang, D.; Liu, T.; Su, Y. Superpixel Generation for SAR Imagery Based on Fast DBSCAN Clustering With Edge Penalty. IEEE J. Sel. Top. Appl. Earth Obs. Remote Sens. 2022, 15, 804–819. [Google Scholar] [CrossRef]
  73. Zhu, L.; Walker, J.P.; Ye, N.; Rüdiger, C. Roughness and vegetation change detection: A pre-processing for soil moisture retrieval from multi-temporal SAR imagery. Remote Sens. Environ. 2019, 225, 93–106. [Google Scholar] [CrossRef]
  74. Pall, J.; Chandra, R.; Azam, D.; Salles, T.; Webster, J.M.; Cripps, S. Bayesreef: A Bayesian inference framework for modelling reef growth in response to environmental change and biological dynamics. Environ. Model. Softw. 2020, 94, 103700. [Google Scholar] [CrossRef] [Green Version]
  75. Sublime, J.; Kalinicheva, E. Automatic post-disaster damage mapping using deep-learning techniques for change detection: Case study of the Tohoku tsunami. Remote Sens. 2019, 11, 1123. [Google Scholar] [CrossRef] [Green Version]
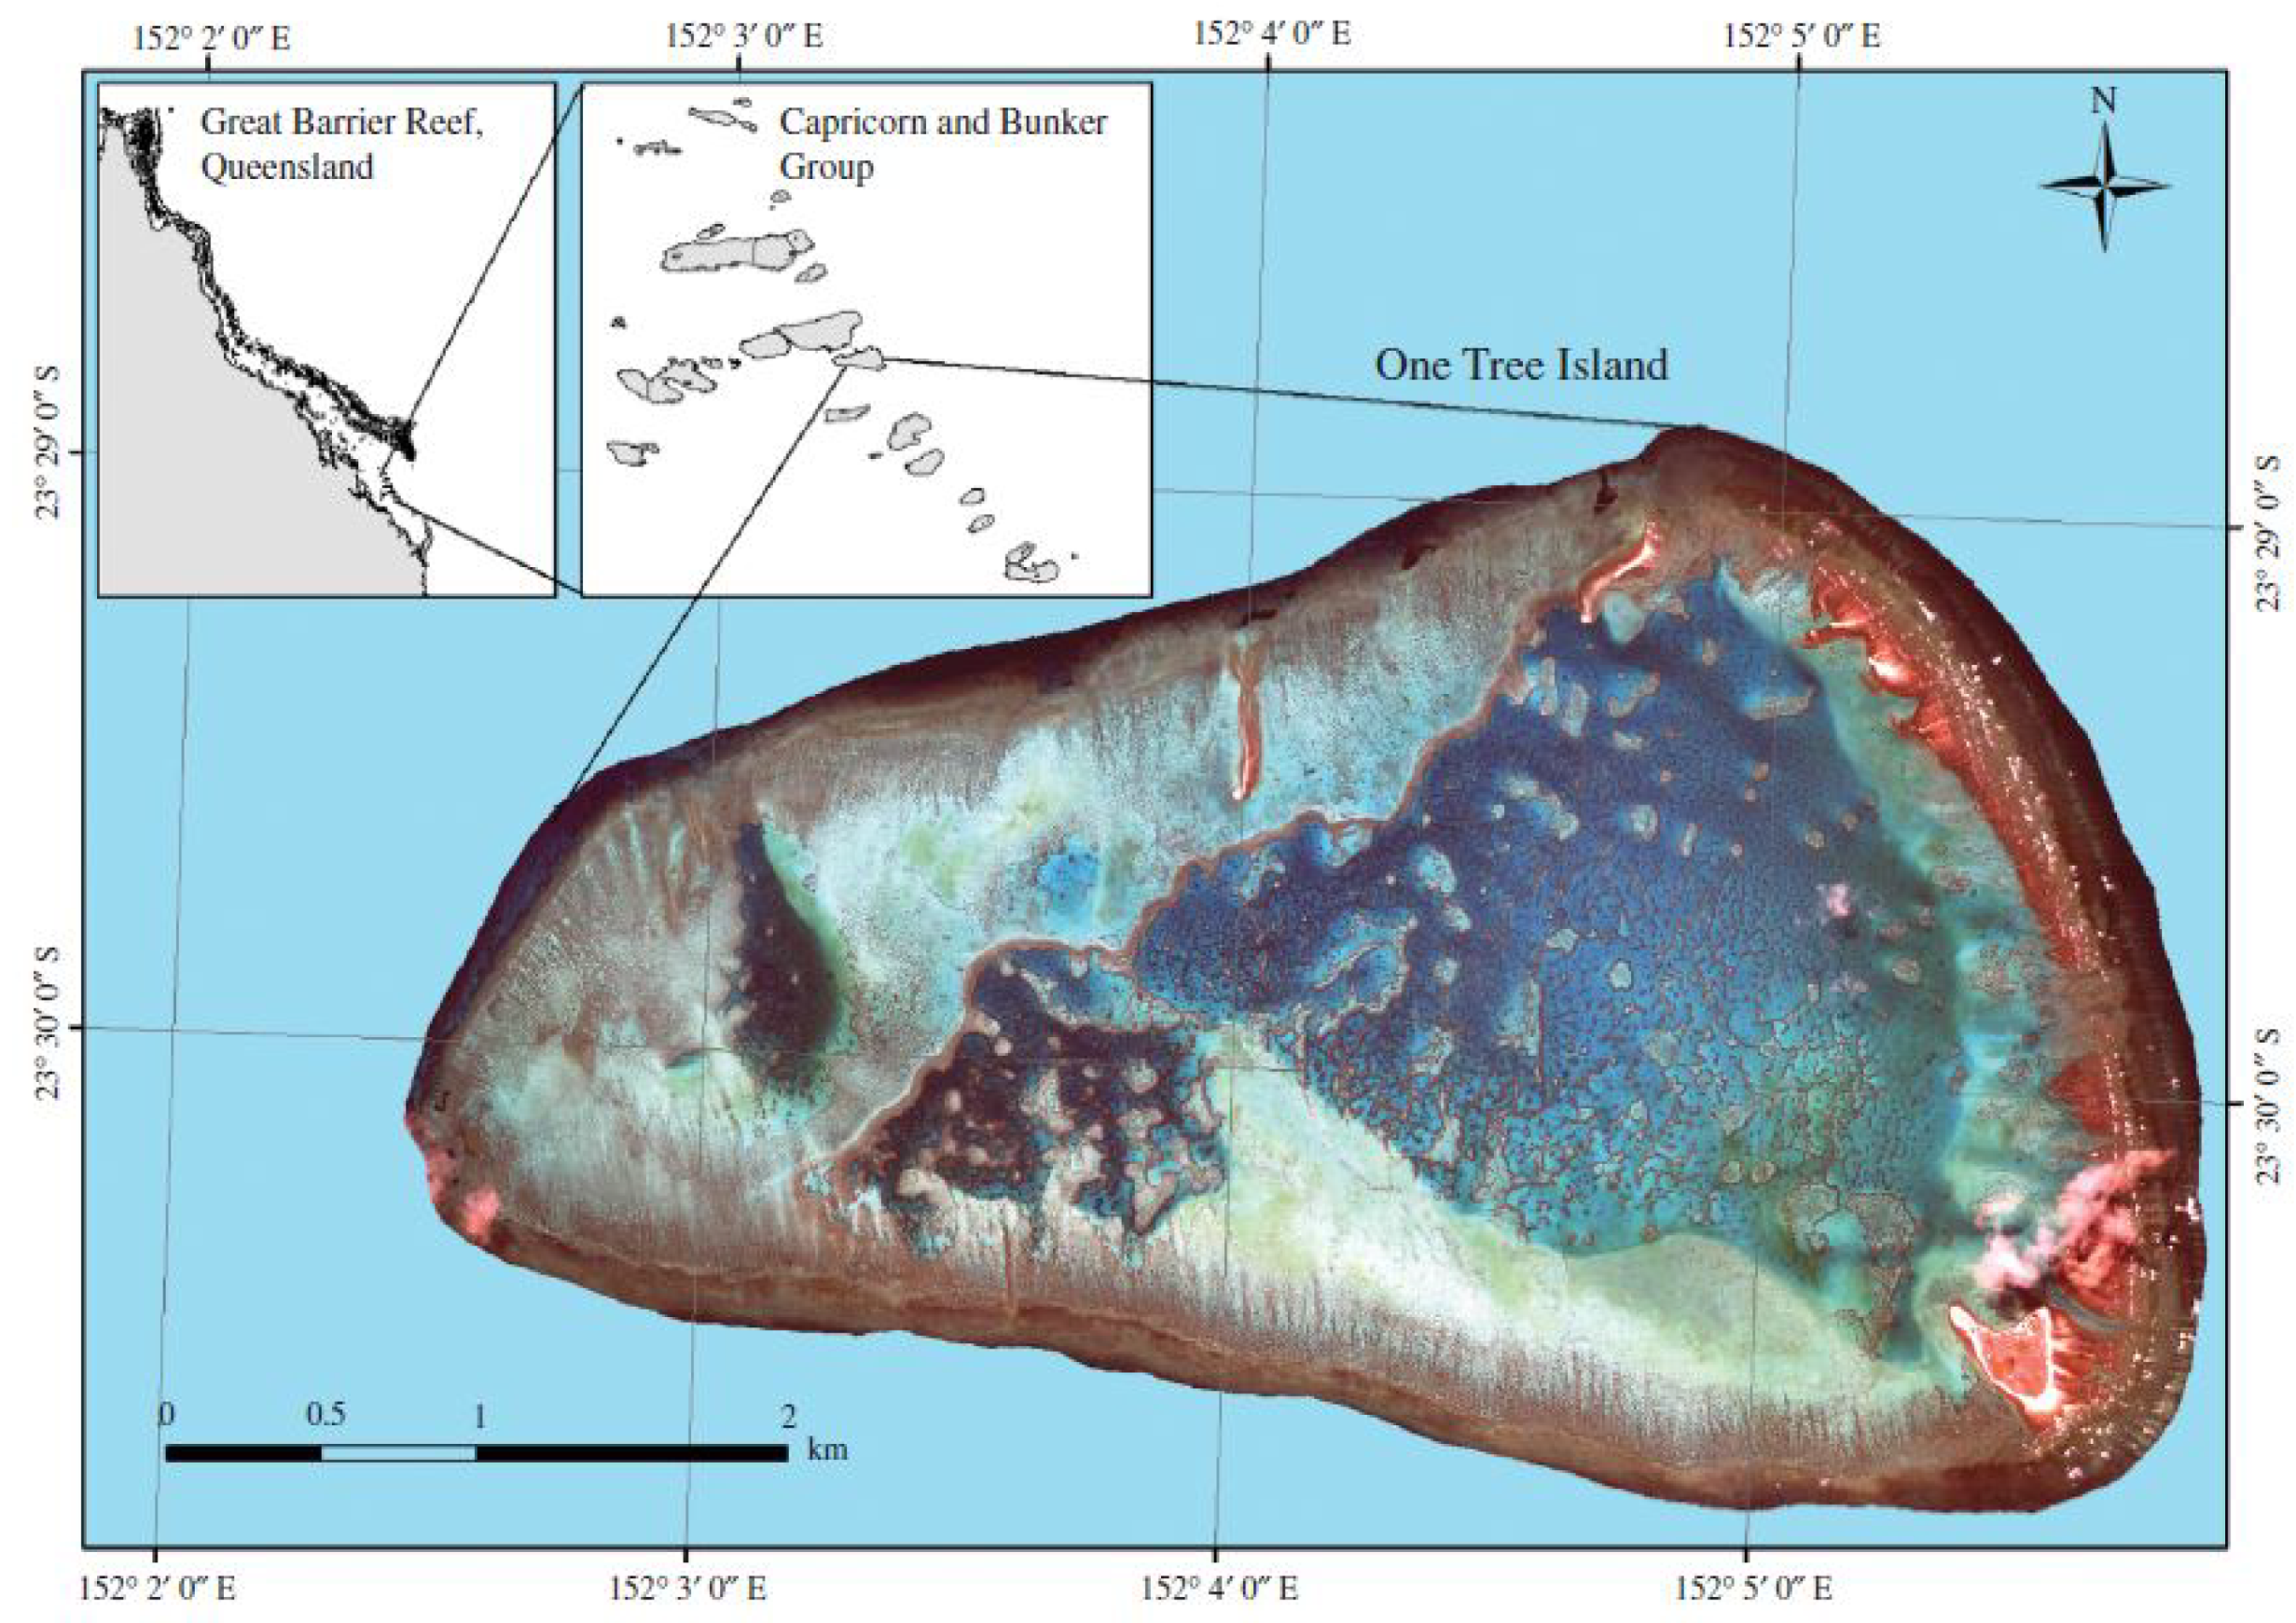
Figure 1. One Tree Island reef (located at 23°30′30″ S, 152°05′30″ E) in the Capricorn–Bunker group in relation to the Queensland coastline (taken from [50]).
Information 14 00373 g001
Figure 2. Mosaic of One Tree Island reef taken from the Allen Coral Atlas [51].
Information 14 00373 g002
Figure 3. Proposed framework for applying clustering methods (k-means, GMM, AGNES, and DBSCAN) to remote sensing data for coral reef mapping.
Information 14 00373 g003
Figure 4. The elbow method to evaluate the number of clusters (components) for k-means using WCSS and BIC, respectively.
Information 14 00373 g004
Figure 5. Evaluating k in k-means clustering.
Information 14 00373 g005
Figure 6. Benthic maps produced with the four different clustering methods.
Information 14 00373 g006
Figure 7. Geomorphic maps produced with the four different clustering methods.
Information 14 00373 g007
Figure 8. Preliminary coral map results—GMM. (a) Benthic map preliminary result overlay; (b) benthic map preliminary result; (c) geomorphic map preliminary result overlay; (d) geomorphic map preliminary result overlay.
Information 14 00373 g008
Figure 9. Benthic map results—Allen Coral Atlas. (a) Benthic map from the Allen Coral Atlas [51]; (b) k-means benthic map; (c) GMM benthic map.
Information 14 00373 g009
Figure 10. Geomorphic map results—Allen Coral Atlas. (a) Geomorphic map from Allen Coral Atlas [51]; (b) k-means geomorphic map; (c) GMM geomorphic map.
Information 14 00373 g010
Disclaimer/Publisher’s Note: The statements, opinions and data contained in all publications are solely those of the individual author(s) and contributor(s) and not of MDPI and/or the editor(s). MDPI and/or the editor(s) disclaim responsibility for any injury to people or property resulting from any ideas, methods, instructions or products referred to in the content.