
Analyzing Social Media Data Using Sentiment Mining and Bigram Analysis for the Recommendation of YouTube Videos


Abstract
1. Introduction
2. Related Work
2.1. Recommender Systems
2.2. Sentiment Analysis
2.3. Graph Theory
3. Data
3.1. Reddit Data
3.2. YouTube Data
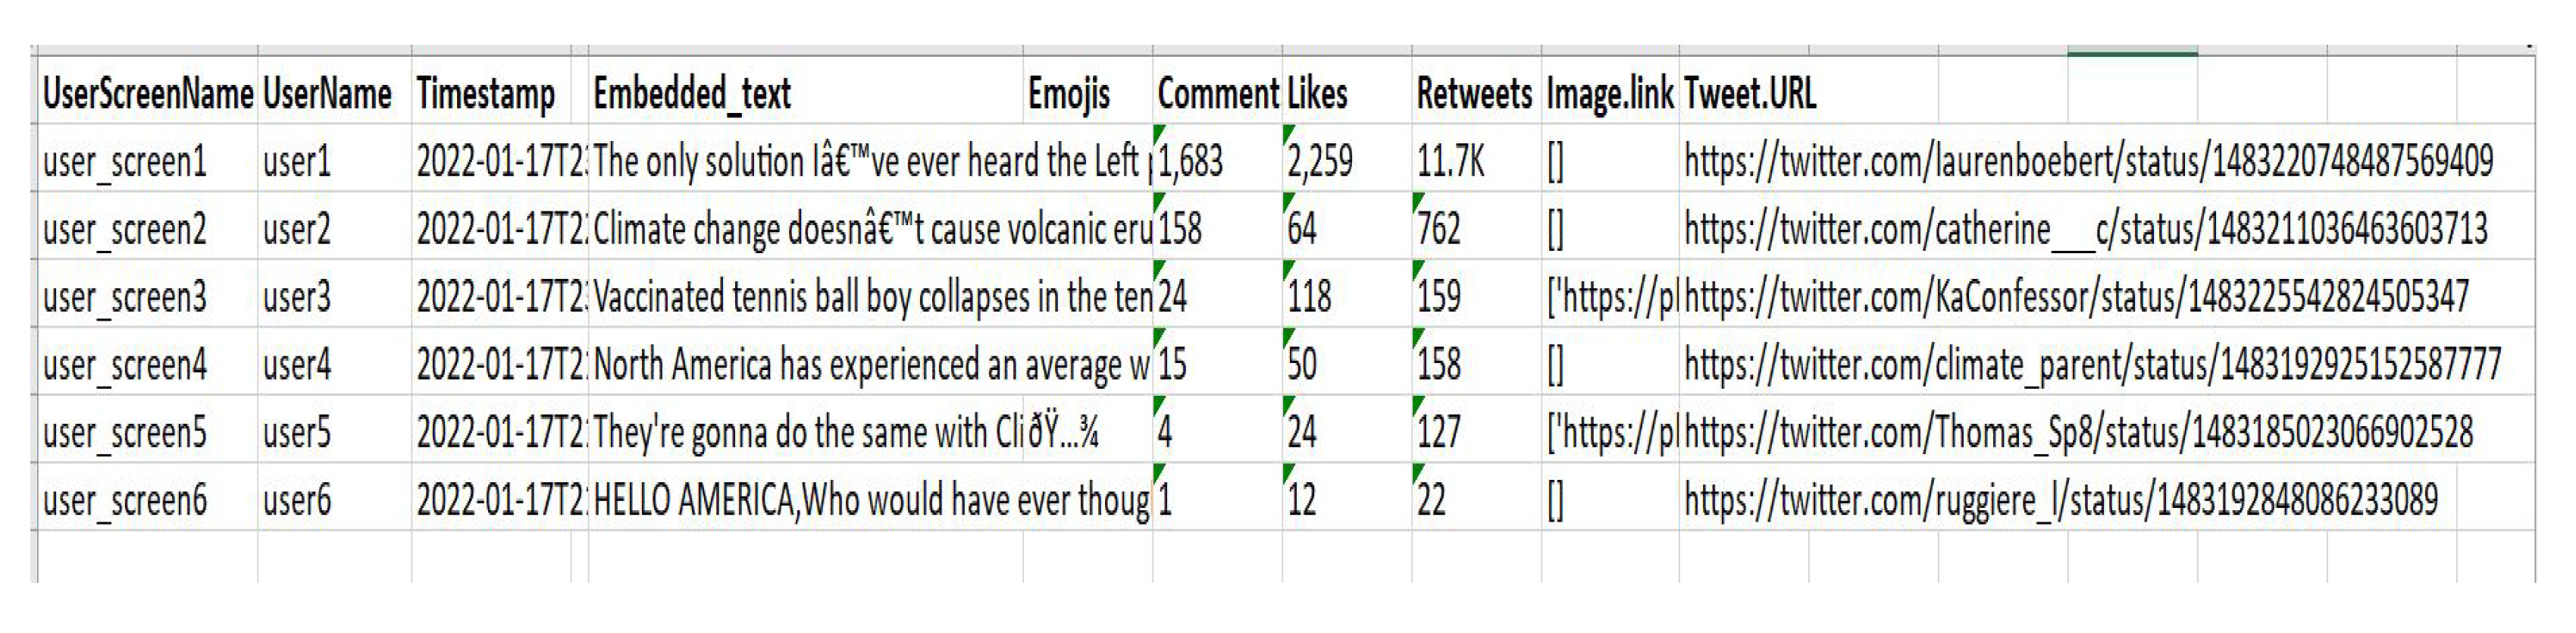
3.3. Twitter Data
4. Methods
| Algorithm 1 Data transformation for text mining |
| Input: Raw text for twitter , reddit , youtube: ; Output: Corpus for twitter , reddit , youtube ; Topic Maps for each Corpus ; ; ; optimum number of topic maps ; ;
|
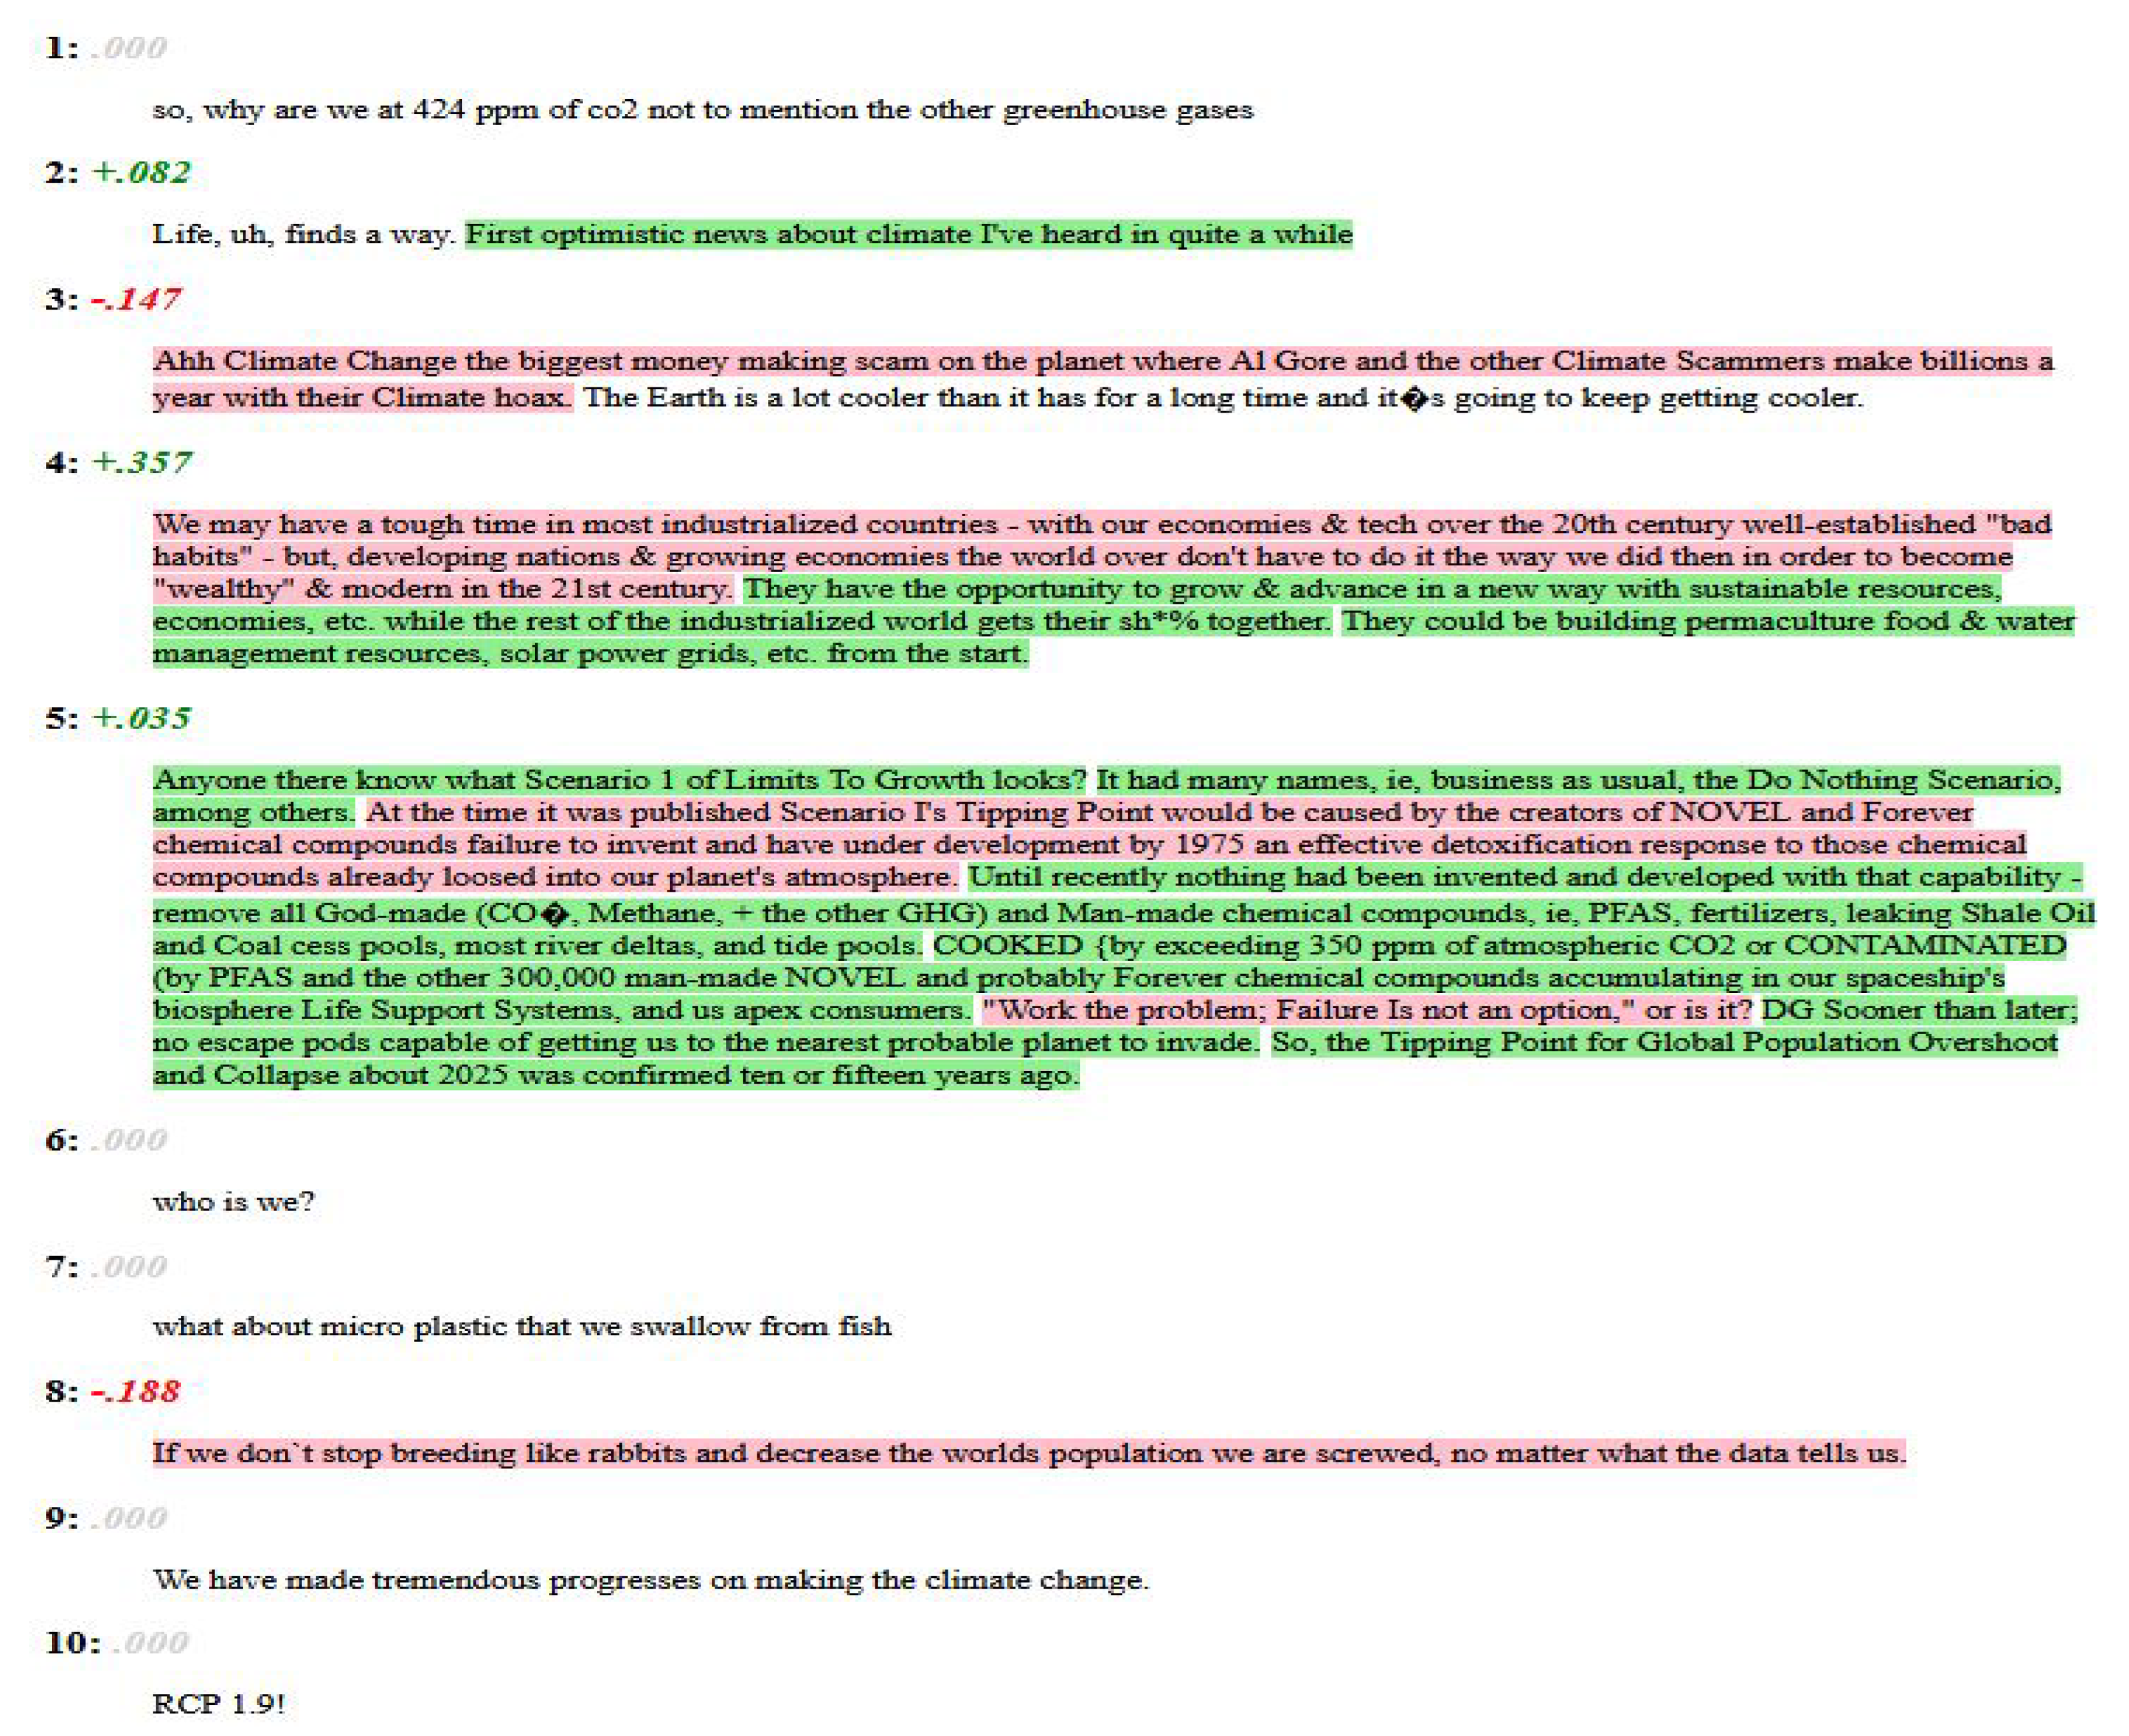
4.1. Sentiment Mining
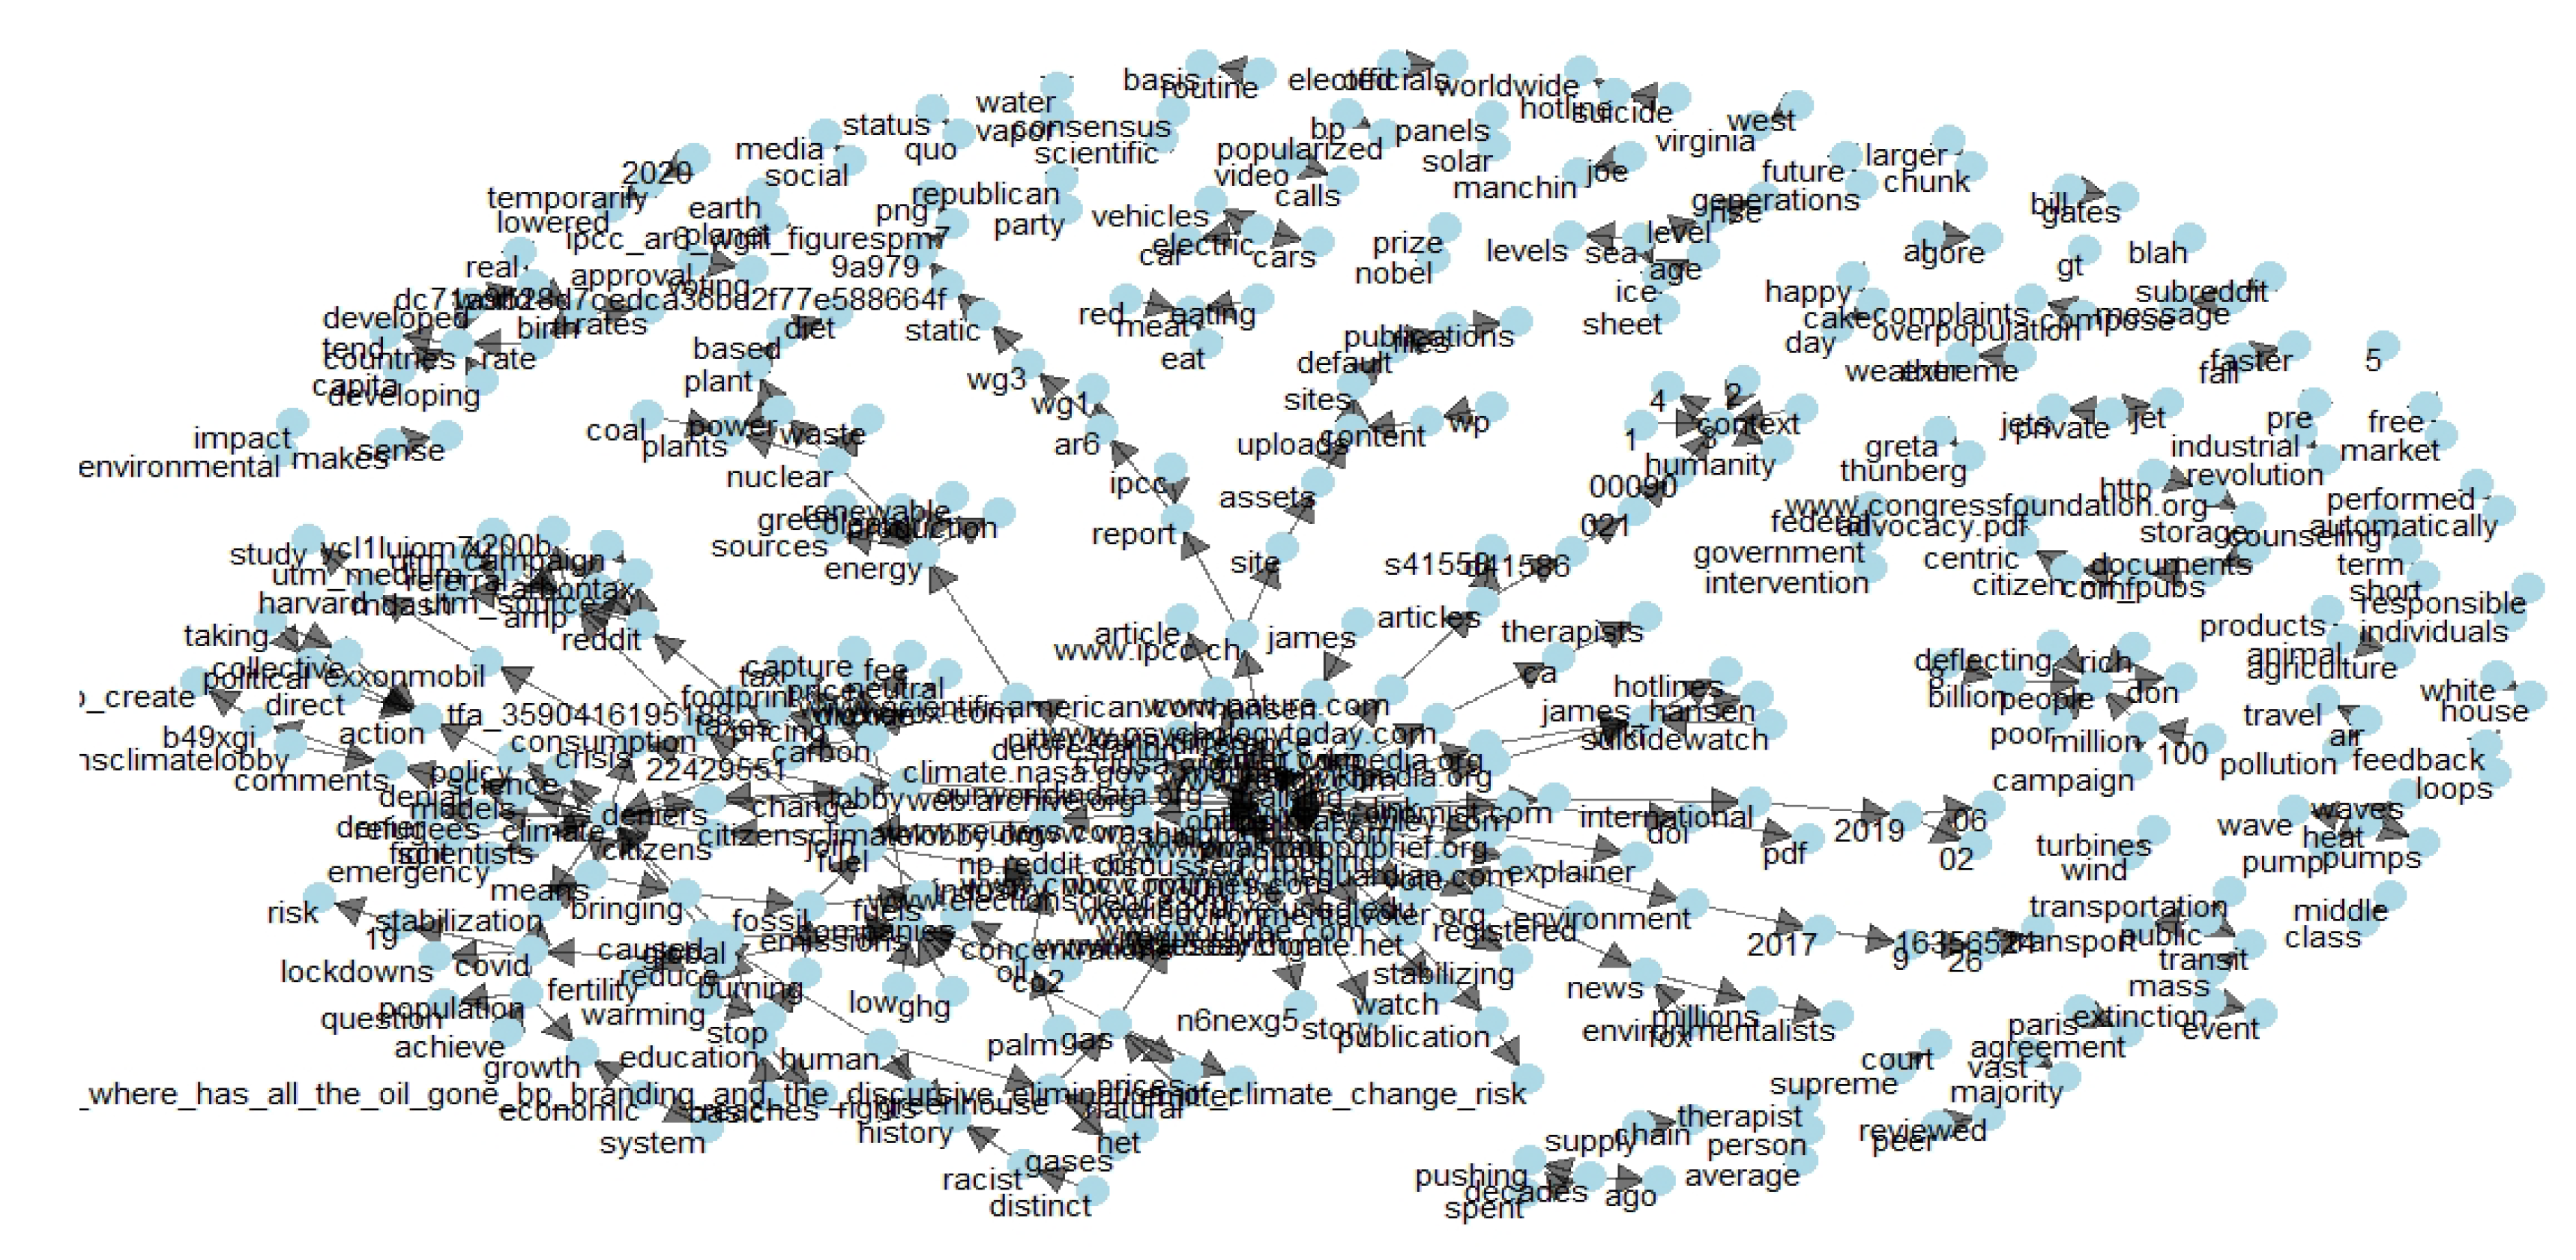
4.2. Graph Modeling
4.3. Generating the Topic Models
4.4. Recommendation System
5. Results
6. Conclusions and Future Work
Author Contributions
Funding
Institutional Review Board Statement
Informed Consent Statement
Data Availability Statement
Acknowledgments
Conflicts of Interest
References
- Spiliotopoulos, D.; Margaris, D.; Vassilakis, C. On Exploiting Rating Prediction Accuracy Features in Dense Collaborative Filtering Datasets. Information 2022, 13, 428. [Google Scholar] [CrossRef]
- Bai, Y.; Li, Y.; Wang, L. A Joint Summarization and Pre-Trained Model for Review-Based Recommendation. Information 2021, 12, 223. [Google Scholar] [CrossRef]
- Kaur, P.; Goel, S. Shilling attack models in recommender system. In Proceedings of the 2016 International Conference on Inventive Computation Technologies (ICICT), Coimbatore, India, 26–27 August 2016; Volume 2, pp. 1–5. [Google Scholar] [CrossRef]
- Lam, S.K.; Riedl, J. Shilling Recommender Systems for Fun and Profit. In Proceedings of the Proceedings of the 13th International Conference on World Wide Web, New York, NY, USA, 17–20 May 2004; Association for Computing Machinery: New York, NY, USA, 2004; pp. 393–402. [Google Scholar] [CrossRef]
- Sharma, R.; Gopalani, D.; Meena, Y. An anatomization of research paper recommender system: Overview, approaches and challenges. Eng. Appl. Artif. Intell. 2023, 118, 105641. [Google Scholar] [CrossRef]
- Halim, Z.; Hussain, S.; Hashim Ali, R. Identifying content unaware features influencing popularity of videos on YouTube: A study based on seven regions. Expert Syst. Appl. 2022, 206, 117836. [Google Scholar] [CrossRef]
- Zappin, A.; Malik, H.; Shakshuki, E.M.; Dampier, D.A. YouTube Monetization and Censorship by Proxy: A Machine Learning Prospective. Procedia Comput. Sci. 2022, 198, 23–32. [Google Scholar] [CrossRef]
- Grün, B.; Hornik, K. Topicmodels: An R Package for Fitting Topic Models. J. Stat. Softw. 2011, 40, 1–30. [Google Scholar] [CrossRef]
- Smith, B.; Linden, G. Two Decades of Recommender Systems at Amazon.com. IEEE Internet Comput. 2017, 21, 12–18. [Google Scholar] [CrossRef]
- Covington, P.; Adams, J.; Sargin, E. Deep Neural Networks for YouTube Recommendations. In Proceedings of the Proceedings of the 10th ACM Conference on Recommender Systems, Boston, MA, USA, 15–19 September 2016; Association for Computing Machinery: New York, NY, USA, 2016; pp. 191–198. [Google Scholar] [CrossRef]
- Abul-Fottouh, D.; Song, M.Y.; Gruzd, A. Examining algorithmic biases in YouTube’s recommendations of vaccine videos. Int. J. Med. Inform. 2020, 140, 104175. [Google Scholar] [CrossRef]
- Chung, C.Y.; Hsu, P.Y.; Huang, S.H. βP: A novel approach to filter out malicious rating profiles from recommender systems. Decis. Support Syst. 2013, 55, 314–325. [Google Scholar] [CrossRef]
- Kim, Y.; Shim, K. TWILITE: A recommendation system for Twitter using a probabilistic model based on latent Dirichlet allocation. Inf. Syst. 2014, 42, 59–77. [Google Scholar] [CrossRef]
- Abolghasemi, R.; Engelstad, P.; Herrera-Viedma, E.; Yazidi, A. A personality-aware group recommendation system based on pairwise preferences. Inf. Sci. 2022, 595, 1–17. [Google Scholar] [CrossRef]
- Leng, Y.; Yu, L.; Niu, X. Dynamically aggregating individuals’ social influence and interest evolution for group recommendations. Inf. Sci. 2022, 614, 223–239. [Google Scholar] [CrossRef]
- Wu, B.; Ye, Y. BSPR: Basket-sensitive personalized ranking for product recommendation. Inf. Sci. 2020, 541, 185–206. [Google Scholar] [CrossRef]
- Wang, R.; Zhou, D.; Jiang, M.; Si, J.; Yang, Y. A Survey on Opinion Mining: From Stance to Product Aspect. IEEE Access 2019, 7, 41101–41124. [Google Scholar] [CrossRef]
- Singh, N.; Tomar, D.; Sangaiah, A. Sentiment analysis: A review and comparative analysis over social media. J. Ambient. Intell. Humaniz. Comput. 2020, 11, 97–117. [Google Scholar] [CrossRef]
- Birjali, M.; Kasri, M.; Beni-Hssane, A. A comprehensive survey on sentiment analysis: Approaches, challenges and trends. Knowl.-Based Syst. 2021, 226, 107134. [Google Scholar] [CrossRef]
- Phand, S.A.; Phand, J.A. Twitter sentiment classification using stanford NLP. In Proceedings of the 2017 1st International Conference on Intelligent Systems and Information Management (ICISIM), Aurangabad, India, 5–6 October 2017; pp. 1–5. [Google Scholar] [CrossRef]
- Kim, R.Y. Using Online Reviews for Customer Sentiment Analysis. IEEE Eng. Manag. Rev. 2021, 49, 162–168. [Google Scholar] [CrossRef]
- Taboada, M.; Brooke, J.; Tofiloski, M.; Voll, K.; Stede, M. Lexicon-Based Methods for Sentiment Analysis. Comput. Linguist. 2011, 37, 267–307. [Google Scholar] [CrossRef]
- Ding, Y.; Li, B.; Zhao, Y.; Cheng, C. Scoring tourist attractions based on sentiment lexicon. In Proceedings of the 2017 IEEE 2nd Advanced Information Technology, Electronic and Automation Control Conference (IAEAC), Chongqing, China, 25–26 March 2017; pp. 1990–1993. [Google Scholar] [CrossRef]
- Mishev, K.; Gjorgjevikj, A.; Vodenska, I.; Chitkushev, L.T.; Trajanov, D. Evaluation of Sentiment Analysis in Finance: From Lexicons to Transformers. IEEE Access 2020, 8, 131662–131682. [Google Scholar] [CrossRef]
- Crone, S.F.; Koeppel, C. Predicting exchange rates with sentiment indicators: An empirical evaluation using text mining and multilayer perceptrons. In Proceedings of the 2014 IEEE Conference on Computational Intelligence for Financial Engineering and Economics (CIFEr), London, UK, 27–28 March 2014; pp. 114–121. [Google Scholar] [CrossRef]
- Romero, C.; Ventura, S. Educational data mining: A review of the state of the art. IEEE Trans. Syst. Man Cybern. Part C Appl. Rev. 2010, 40, 601–618. [Google Scholar] [CrossRef]
- Kumar, A.; Jai, R. Sentiment analysis and feedback evaluation. In Proceedings of the in 2015 IEEE 3rd International Conference on MOOCs, Innovation and Technology in Education (MITE), Amritsar, India, 1–2 October 2015; pp. 433–436. [Google Scholar]
- Missikoff, M.; Velardi, P.; Fabriani, P. Text mining techniques to automatically enrich a domain ontology. Appl. Intell. 2003, 18, 323–340. [Google Scholar] [CrossRef]
- McGarry, K.; McDonald, S. Computational methods for text mining user posts on a popular gaming forum for identifying user experience issues. In Proceedings of the The 2017 British Human Computer Interaction Conference—Make Believe, Sunderland, UK, 3–6 July 2017. [Google Scholar] [CrossRef]
- Bose, S. RSentiment: A Tool to Extract Meaningful Insights from Textual Reviews. In Proceedings of the 5th International Conference on Frontiers in Intelligent Computing: Theory and Applications: FICTA 2016; Springer: Singapore, 2017; Volume 2, pp. 259–268. [Google Scholar] [CrossRef]
- Seetharamulu, B.; Reddy, B.N.K.; Naidu, K.B. Deep Learning for Sentiment Analysis Based on Customer Reviews. In Proceedings of the 2020 11th International Conference on Computing, Communication and Networking Technologies (ICCCNT), Kharagpur, India, 1–3 July 2020; pp. 1–5. [Google Scholar] [CrossRef]
- Thakur, N. Sentiment Analysis and Text Analysis of the Public Discourse on Twitter about COVID-19 and MPox. Big Data Cogn. Comput. 2023, 7, 116. [Google Scholar] [CrossRef]
- Fellnhofer, K. Positivity and higher alertness levels facilitate discovery: Longitudinal sentiment analysis of emotions on Twitter. Technovation 2023, 122, 102666. [Google Scholar] [CrossRef]
- Di Cara, N.H.; Maggio, V.; Davis, O.S.P.; Haworth, C.M.A. Methodologies for Monitoring Mental Health on Twitter: Systematic Review. J. Med. Internet Res. 2023, 25, e42734. [Google Scholar] [CrossRef]
- Kavitha, K.; Shetty, A.; Abreo, B.; D’Souza, A.; Kondana, A. Analysis and Classification of User Comments on YouTube Videos. Procedia Comput. Sci. 2020, 177, 593–598. [Google Scholar] [CrossRef]
- Alhabash, S.; Jong Hwan, B.; Cunningham, C.; Hagerstrom, A. To comment or not to comment?: How virality, arousal level, and commenting behavior on YouTube videos affect civic behavioral intentions. Comput. Hum. Behav. 2015, 51, 520–531. [Google Scholar] [CrossRef]
- Shiryaeva, T.A.; Arakelova, A.A.; Tikhonova, E.V.; Mekeko, N.M. Anti-, Non-, and Dis-: The linguistics of negative meanings about youtube. Heliyon 2020, 6, e05763. [Google Scholar] [CrossRef]
- Albert, R.; Barabasi, A. Statistical mechanics of complex networks. Rev. Mod. Phys. 2002, 74, 450–461. [Google Scholar] [CrossRef]
- Barabasi, A. Network Science, 1st ed.; Cambridge University Press: Cambridge, UK, 2016. [Google Scholar]
- McGarry, K.; McDonald, S. Complex network theory for the identification and assessment of candidate protein targets. Comput. Biol. Med. 2018, 97, 113–123. [Google Scholar] [CrossRef]
- Ward, K. Social networks, the 2016 US presidential election, and Kantian ethics: Applying the categorical imperative to Cambridge Analytica’s behavioral microtargeting. J. Media Ethics 2018, 33, 133–148. [Google Scholar] [CrossRef]
- Kolaczyk, E. Statistical Research in Networks - Looking Forward. In Encyclopedia of Social Network Analysis and Mining; Springer: New York, NY, USA, 2014; pp. 2056–2062. [Google Scholar] [CrossRef]
- Cai, H.; Zhang, F. Detecting shilling attacks in recommender systems based on analysis of user rating behavior. Knowl.-Based Syst. 2019, 177, 22–43. [Google Scholar] [CrossRef]
- Cruickshank, I.; Carley, K. Characterizing communities of hashtag usage on twitter during the 2020 COVID-19 pandemic by multi-view clustering. Appl. Netw. Sci. 2020, 5, 66. [Google Scholar] [CrossRef]
- Ahmad, U.; Zahid, A.; Shoaib, M.; AlAmri, A. HarVis: An integrated social media content analysis framework for YouTube platform. Inf. Syst. 2017, 69, 25–39. [Google Scholar] [CrossRef]
- Wang, S.; Zhang, P.; Wang, H.; Yu, H.; Zhang, F. Detecting shilling groups in online recommender systems based on graph convolutional network. Inf. Process. Manag. 2022, 59, 103031. [Google Scholar] [CrossRef]
- Keramatfar, A.; Amirkhani, H.; Bidgoly, A.J. Multi-thread hierarchical deep model for context-aware sentiment analysis. J. Inf. Sci. 2023, 49, 133–144. [Google Scholar] [CrossRef]
- Keramatfar, A.; Rafaee, M.; Amirkhani, H. Graph Neural Networks: A bibliometrics overview. Mach. Learn. Appl. 2022, 10, 100401. [Google Scholar] [CrossRef]
- Nilashi, M.; Ali Abumalloh, R.; Samad, S.; Minaei-Bidgoli, B.; Hang Thi, H.; Alghamdi, O.; Yousoof Ismail, M.; Ahmadi, H. The impact of multi-criteria ratings in social networking sites on the performance of online recommendation agents. Telemat. Inform. 2023, 76, 101919. [Google Scholar] [CrossRef]
- Heidari, M.; Jones, J.H.J.; Uzuner, O. An Empirical Study of Machine learning Algorithms for Social Media Bot Detection. In Proceedings of the 2021 IEEE International IOT, Electronics and Mechatronics Conference (IEMTRONICS), Toronto, ON, Canada, 21–24 April 2021; pp. 1–5. [Google Scholar] [CrossRef]
- Heidari, M.; Jones, J.H.; Uzuner, O. Deep Contextualized Word Embedding for Text-based Online User Profiling to Detect Social Bots on Twitter. In Proceedings of the 2020 International Conference on Data Mining Workshops (ICDMW), Sorrento, Italy, 17–20 November 2020; pp. 480–487. [Google Scholar] [CrossRef]
- K, H.; S, S.; M, M. Social media bot detection with deep learning methods: A systematic review. Neural Comput. Appl. 2023, 35, 8903–8918. [Google Scholar] [CrossRef]
- Schneider, L.; Scholten, J.; Sándor, B. Charting closed-loop collective cultural decisions: From book best sellers and music downloads to Twitter hashtags and Reddit comments. Eur. Phys. J. B 2021, 94. [Google Scholar] [CrossRef]
- Madsen, M.A.; Madsen, D.O. Communication between Parents and Teachers of Special Education Students: A Small Exploratory Study of Reddit Posts. Soc. Sci. 2022, 11, 518. [Google Scholar] [CrossRef]
- Harel, T.L. Archives in the making: Documenting the January 6 capitol riot on Reddit. Internet Hist. 2022, 6, 391–411. [Google Scholar] [CrossRef]
- SemRush-Inc. Reddit Statistics. Available online: https://www.semrush.com/website/reddit.com/overview/, (accessed on 4 February 2023).
- Chew, R.F.; Kery, C.; Baum, L.; Bukowski, T.; Kim, A.; Navarro, M.A. Predicting Age Groups of Reddit Users Based on Posting Behavior and Metadata: Classification Model Development and Validation. JMIR Public Health Surveill. 2021, 7, e25807. [Google Scholar] [CrossRef]
- Barker, J.; Rohde, J. Topic Clustering of E-Cigarette Submissions Among Reddit Communities: A Network Perspective. Health Educ. Behav. 2019, 46. [Google Scholar] [CrossRef] [PubMed]
- Gaffney, D.; Matias, J. Caveat emptor, computational social science: Large-scale missing data in a widely-published Reddit corpus. PLoS ONE 2018, 13, e0200162. [Google Scholar] [CrossRef] [PubMed]
- Jhaver, S.; Appling, D.S.; Gilbert, E.; Bruckman, A. “Did You Suspect the Post Would Be Removed?”: Understanding User Reactions to Content Removals on Reddit. Proc. ACM Hum.-Comput. Interact. 2019, 3, 1–33. [Google Scholar] [CrossRef]
- Baumgartner, J.; Zannettou, S.; Keegan, B.; Squire, M.; Blackburn, J. The Pushshift Reddit Dataset. Proc. Int. AAAI Conf. Web Soc. Media 2020, 14, 830–839. [Google Scholar] [CrossRef]
- Rivera, I. Reddit Data Extraction Toolkit. 2023. Available online: https://cran.r-project.org/web/packages/RedditExtractoR/index.html (accessed on 29 June 2023).
- Gertzel, B.; Ackland, R.; Graham, T.; Borquez, F. VosonSML: Collecting Social Media Data and Generating Networks for Analysis. 2022. Available online: https://cran.r-project.org/web/packages/vosonSML/index.html (accessed on 29 June 2023).
- Bauchi, C. Twitter Climate Change Sentiment Dataset. 2018. Available online: https://www.kaggle.com/datasets/edqian/twitter-climate-change-sentiment-dataset (accessed on 29 June 2023).
- Rinker, T.W. Sentimentr: Calculate Text Polarity Sentiment; Buffalo, NY, USA. 2021. Available online: github.com/trinker/sentimentr (accessed on 30 May 2023).
- Feinerer, I.; Hornik, K.; Meyer, D. Text Mining Infrastructure in R. J. Stat. Softw. 2008, 25, 1–54. [Google Scholar] [CrossRef]
- Feinerer, I.; Hornik, K. tm: Text Mining Package; R package version 0.7-11; The R Project for Statistical Computing: Vienna, Austria, 2023. Available online: https://CRAN.R-project.org/package=tm (accessed on 30 May 2023).
- Chen, Y.L.; Chang, C.L.; Yeh, C.S. Emotion classification of YouTube videos. Decis. Support Syst. 2017, 101, 40–50. [Google Scholar] [CrossRef]
- Chang, W.L.; Chen, L.M.; Verkholantsev, A. Revisiting Online Video Popularity: A Sentimental Analysis. Cybern. Syst. 2019, 50, 563–577. [Google Scholar] [CrossRef]
- Gandhi, A.; Adhvaryu, K.; Poria, S.; Cambria, E.; Hussain, A. Multimodal sentiment analysis: A systematic review of history, datasets, multimodal fusion methods, applications, challenges and future directions. Inf. Fusion 2023, 91, 424–444. [Google Scholar] [CrossRef]
- Rouhani, S.; Mozaffari, F. Sentiment analysis researches story narrated by topic modeling approach. Soc. Sci. Humanit. Open 2022, 6, 100309. [Google Scholar] [CrossRef]
- Csardi, G.; Nepusz, T. The igraph software package for complex network research. Interjournal Complex Syst. 2006, 1695, 1–9. [Google Scholar]
- Li, J.; Wang, Y.; Tao, Z. A Rating Prediction Recommendation Model Combined with the Optimizing Allocation for Information Granularity of Attributes. Information 2022, 13, 21. [Google Scholar] [CrossRef]
- Blei, D.M.; Ng, A.Y.; Jordan, M.I. Latent dirichlet allocation. J. Mach. Learn. Res. 2003, 3, 993–1022. [Google Scholar]
- Grün, B.; Hornik, K. R Package Topicmodels. Available online: https://cran.r-project.org/web/packages/topicmodels/index.html (accessed on 12 June 2023).
- Chang, J.; Gerrish, S.; Wang, C.; Boyd-graber, J.; Blei, D. Reading Tea Leaves: How Humans Interpret Topic Models. In Proceedings of the Advances in Neural Information Processing Systems; Bengio, Y., Schuurmans, D., Lafferty, J., Williams, C., Culotta, A., Eds.; Curran Associates, Inc.: New York, NY, USA, 2009; Volume 22. [Google Scholar]
- Griffiths, T.; Steyvers, M. Finding scientific topics. Proc. Natl. Acad. Sci. USA 2004, 101, 5228–5235. [Google Scholar] [CrossRef]
- Gaujoux, R.; Seoighe, C. A flexible R package for nonnegative matrix factorization. BMC Bioinform. 2010, 11, 367. [Google Scholar] [CrossRef]
- Greene, D.; Cunningham, P. A Matrix Factorization Approach for Integrating Multiple Data Views. In Proceedings of the Machine Learning and Knowledge Discovery in Databases; Buntine, W., Grobelnik, M., Eds.; Springer: Berlin/Heidelberg, Germany, 2009; pp. 423–438. [Google Scholar]
- Vlachos, M.; Dunner, C.; Heckle, R.; Vassiliadis, A.; Parnell, T.; Atasu, K. Addressing interpretability and cold-start in matrix factorization for recommender systems. IEEE Trans. Knowl. Data Eng. 2019, 31, 1253–1266. [Google Scholar] [CrossRef]
- Hahsler, M. Recommenderlab: An R Framework for Developing and Testing Recommendation Algorithms. arXiv 2022, arXiv:cs.IR/2205.12371. [Google Scholar]
- McGarry, K.; Graham, Y.; McDonald, S.; Rashid, A. RESKO: Repositioning drugs by using side effects and knowledge from ontologies. Knowl. Based Syst. 2018, 160, 34–48. [Google Scholar] [CrossRef]
- Wang, J.; Fan, Z.; Cheng, Y. Drug disease association and drug repositioning predictions in complex diseases using causal inference probabilistic matrix factorization. J. Chem. Inf. Model. 2014, 54, 2562–2569. [Google Scholar]
- Li, W.; Xie, J.; Mo, J. An overlapping network community partition algorithm based on semi-supervised matrix factorization and random walk. Expert Syst. Appl. 2018, 91, 277–285. [Google Scholar] [CrossRef]


| Author | System Name | Date | Methods | Social Media |
|---|---|---|---|---|
| McGarry | Graph theory, sentiment analysis, bigrams, profiling | Twitter, YouTube, reddit | ||
| Keramatfar [47] | MHLSTM | 2021 | LSTM, profiling, sentiment analysis | |
| Cruickshank [44] | MVMC | 2020 | Hash-tags, sentiment analysis | |
| Ahmad [45] | HarVis | 2017 | Graph theory | YouTube |
| Kavitha [35] | 2020 | Bag of Words, NLP | YouTube | |
| Kim [13] | TWLITE | 2014 | LDA, probability | |
| Nilashi [49] | 2023 | LDA, EM, clustering | TripAdvisor |
| Data | Source | Date | No Records |
|---|---|---|---|
| API | January 2020 to March 2020 | 2K | |
| Kaggle | April 2015 to February 2018 | 44K | |
| API | December 2022 to February 2023 | 100K | |
| YouTube | API | December 2022 to February 2023 | 26K |
| User | Mod | Path | Nedges | Nverts | Transit | Degree | Diam | Connect | Close | Between | Density | Hubness |
|---|---|---|---|---|---|---|---|---|---|---|---|---|
| UC9Di-3Y41sreUEtKD9MuZEQ | 0.69 | 1.06 | 128.00 | 109 | 0.00 | 2.35 | 2.00 | FALSE | 0.30 | 19.00 | 0.01 | 0.00 |
| UCjjVjhAEzLNAvpr-7pDpd8g | 0.69 | 1.06 | 128.00 | 109 | 0.00 | 2.35 | 2.00 | FALSE | 0.20 | 15.00 | 0.01 | 0.00 |
| UCrsD7Oq3yjZu0GYLhquHpVQ | 0.69 | 1.06 | 128.00 | 109 | 0.00 | 2.35 | 2.00 | FALSE | 0.20 | 14.00 | 0.01 | 0.00 |
| UCUB6baFW4kvLsLzlZ-kp5Ug | 0.69 | 1.06 | 128.00 | 109 | 0.00 | 2.35 | 2.00 | FALSE | 0.50 | 5.00 | 0.01 | 0.00 |
| UCjrCf7x7Dgo4VKplUgWKIdg | 0.69 | 1.06 | 128.00 | 109 | 0.00 | 2.35 | 2.00 | FALSE | 0.50 | 5.00 | 0.01 | 0.00 |
| vid_id | title | num_comments | likes | zero_likes | num_posters | overall_sentiment | neg_sent_count | pos_sent_count | neut_sent_count | |
|---|---|---|---|---|---|---|---|---|---|---|
| 1 | oJAbATJCugs | VID1 | 500 | 3311 | 412 | 57 | 7.81 | 501 | 581 | 437 |
| 2 | n-Z0eG1pKhA | VID2 | 602 | 1947 | 364 | 525 | -5.64 | 528 | 514 | 427 |
| 3 | vFDnknU0h0s | VID3 | 628 | 219 | 536 | 477 | 16.88 | 912 | 999 | 669 |
| 4 | 2CQvBGSiDvw | VID4 | 1114 | 3399 | 789 | 587 | 0.7 | 1038 | 1103 | 1004 |
| 5 | ga-RBuhcJ7w | VID5 | 689 | 158 | 627 | 468 | -15.71 | 911 | 873 | 756 |
| 6 | eDWq7-eP5sE | VID6 | 680 | 1185 | 428 | 481 | 30.13 | 943 | 1085 | 714 |
| 7 | DticpNH3a2Q | VID7 | 587 | 72 | 536 | 458 | -90.32 | 642 | 457 | 371 |
| 8 | rwdxffEzQ9I | VID8 | 708 | 877 | 561 | 502 | 63.59 | 549 | 701 | 565 |
| 9 | uynhvHZUOOo | VID9 | 769 | 300 | 616 | 520 | -17.37 | 636 | 674 | 651 |
| 10 | dcBXmj1nMTQ | VID10 | 625 | 155 | 529 | 488 | 45.01 | 594 | 732 | 502 |
| 11 | tMwFNMfjFuU | VID11 | 98 | 1289 | 3 | 95 | 14 | 40 | 76 | 43 |
| 12 | 48zAWYkrBIw | VID12 | 305 | 1238 | 162 | 201 | -9.6 | 288 | 259 | 252 |
| 13 | eDWq7-eP5sE | VID13 | 679 | 1185 | 427 | 481 | 29.54 | 942 | 1082 | 713 |
| 14 | DYWrehjaMFQ | VID14 | 737 | 303 | 585 | 424 | 33.96 | 860 | 964 | 565 |
| 15 | I2OHAuvoUkQ | VID15 | 374 | 575 | 269 | 196 | 10.42 | 367 | 411 | 314 |
| 16 | rweblFwt-BM | VID16 | 731 | 1103 | 512 | 522 | 35.25 | 750 | 881 | 659 |
| 17 | pl1Rnz4zNkg | VID17 | 628 | 772 | 446 | 534 | -35.53 | 515 | 454 | 362 |
| 18 | qXLqoFHGmv0 | VID18 | 763 | 1283 | 503 | 335 | -17.99 | 811 | 740 | 708 |
| 19 | m3hHi4sylxE | VID19 | 653 | 155 | 536 | 481 | -48.9 | 773 | 710 | 760 |
| vid1 | vid2 | vid3 | vid4 | vid5 | vid6 | vid7 | vid8 | vid9 | vid10 | vid11 | vid12 | vid13 | vid14 | vid15 | vid16 | vid17 | vid18 | |
|---|---|---|---|---|---|---|---|---|---|---|---|---|---|---|---|---|---|---|
| usr1 | −0.24 | 1.18 | 0.88 | −1.17 | 0.88 | 0.06 | −0.89 | 0.25 | −0.88 | −1.34 | −0.52 | 1.67 | 0.55 | 1.36 | −1.75 | −0.21 | 0.79 | 0.72 |
| usr2 | 0.49 | −1.38 | −0.22 | −0.63 | −1.34 | 1.12 | 0.55 | 0.00 | −1.34 | −0.52 | 0.06 | 0.18 | 0.49 | 1.17 | −0.84 | −1.06 | ||
| usr3 | 0.30 | −0.56 | 0.59 | −1.17 | −0.25 | −1.18 | −0.34 | 0.44 | 0.94 | −1.15 | 0.06 | −1.65 | −0.97 | −0.08 | −1.16 | |||
| usr4 | −0.50 | 0.49 | 0.59 | −0.22 | −1.01 | 1.47 | 0.83 | −2.11 | −0.88 | 0.62 | 1.67 | −0.90 | 0.55 | −0.10 | 0.33 | 0.42 | −0.79 | −0.92 |
| usr5 | 1.63 | −1.25 | 0.88 | −0.54 | 0.34 | −0.03 | −1.77 | −0.04 | 1.35 | 1.35 | −1.28 | −0.92 | 1.37 | 1.06 | −0.92 |
| RMSE | MSE | MAE | |
|---|---|---|---|
| UBCF | 5.860 | 34.344 | 5.279 |
| IBCF | 6.216 | 38.637 | 5.573 |
| TP | FP | FN | TN | N | Precision | Recall | TPR | FPR | n | |
|---|---|---|---|---|---|---|---|---|---|---|
| 1 | 1.00 | 0.00 | 10.80 | 5.20 | 17.00 | 1.00 | 0.09 | 0.09 | 0.00 | 1.00 |
| 2 | 2.20 | 0.80 | 9.60 | 4.40 | 17.00 | 0.73 | 0.18 | 0.18 | 0.15 | 3.00 |
| 3 | 3.40 | 1.60 | 8.40 | 3.60 | 17.00 | 0.68 | 0.28 | 0.28 | 0.29 | 5.00 |
| 4 | 7.20 | 2.80 | 4.60 | 2.40 | 17.00 | 0.72 | 0.61 | 0.61 | 0.52 | 10.00 |
| 5 | 10.80 | 4.20 | 1.00 | 1.00 | 17.00 | 0.72 | 0.91 | 0.91 | 0.80 | 15.00 |
| 6 | 11.80 | 5.20 | 0.00 | 0.00 | 17.00 | 0.69 | 1.00 | 1.00 | 1.00 | 20.00 |
| ID | User | Youtube ID | Video Title | Views | Score |
|---|---|---|---|---|---|
| 1 | 1 | Fleeing climate change—the real environmental disaster | 2M | 1.0 | |
| 2 | 1 | Climate change: Europe’s melting glaciers | DW Documentary | 5.7M | 1.0 | |
| 3 | 1 | Friendly Guide to Climate Change—and what you can do to help | 319K | 1.0 | |
| 4 | 1 | This tool will help us get to zero emissions (Bill Gates) | 4.5M | 1.0 | |
| 5 | 2 | See what three degrees of global warming looks like | 3M | 1.0 | |
| 6 | 2 | Why NITIN GADKARI is pushing GREEN HYDROGEN | 2.4M | 1.0 | |
| 7 | 2 | Bill Gates Talks About How To Avoid A Climate Disaster | 1.4M | 1.0 | |
| 8 | 2 | How long before all the ice melts?—BBC World Service | 89K | 1.0 | |
| 9 | 3 | El Niño 2023 could be a monster! | 1.2M | 1.0 | |
| 10 | 3 | The melting ice of the Arctic (1/2) | DW Documentary | 2.5M | 1.0 | |
| 11 | 4 | Hydrogen Will Not Save Us. Here’s Why. | 1.6M | 1.0 | |
| 12 | 4 | Why renewables can’t save the planet | Michael Shellenberger | TED | 5.2M | 1.0 | |
| 13 | 4 | SCIENTISTS JUST MADE HYDROGEN OUT OF NOTHING BUT AIR!!! | 104K | 1.0 | |
| 14 | 4 | Donald Trump Believes Climate Change Is A Hoax | MSNBC | 307K | 1.0 | |
| 15 | 5 | Global warming: why you should not worry | 773K | 1.0 | |
| 16 | 5 | The Truth About Climate Change | 2.1M | 1.0 | |
| 17 | 5 | There is no climate crisis: Tom Harris | 1M | 1.0 | |
| 18 | 5 | “There’s no emergency”—dissident climatologist Dr Judith Curry | 657K | 0.9 | |
| 19 | 5 | The Models Are OK, the Predictions Are Wrong | 876K | 0.9 | |
| 20 | 5 | Global Warming: Fact or Fiction? Featuring Physicists Soon and Bloom | 1M | 0.9 |
Disclaimer/Publisher’s Note: The statements, opinions and data contained in all publications are solely those of the individual author(s) and contributor(s) and not of MDPI and/or the editor(s). MDPI and/or the editor(s) disclaim responsibility for any injury to people or property resulting from any ideas, methods, instructions or products referred to in the content. |
© 2023 by the author. Licensee MDPI, Basel, Switzerland. This article is an open access article distributed under the terms and conditions of the Creative Commons Attribution (CC BY) license (https://creativecommons.org/licenses/by/4.0/).
Share and Cite
McGarry, K. Analyzing Social Media Data Using Sentiment Mining and Bigram Analysis for the Recommendation of YouTube Videos. Information 2023, 14, 408. https://doi.org/10.3390/info14070408
McGarry K. Analyzing Social Media Data Using Sentiment Mining and Bigram Analysis for the Recommendation of YouTube Videos. Information. 2023; 14(7):408. https://doi.org/10.3390/info14070408
Chicago/Turabian StyleMcGarry, Ken. 2023. "Analyzing Social Media Data Using Sentiment Mining and Bigram Analysis for the Recommendation of YouTube Videos" Information 14, no. 7: 408. https://doi.org/10.3390/info14070408
APA StyleMcGarry, K. (2023). Analyzing Social Media Data Using Sentiment Mining and Bigram Analysis for the Recommendation of YouTube Videos. Information, 14(7), 408. https://doi.org/10.3390/info14070408