Article

Influence Analysis of Real Exchange Rate Fluctuations on Trade Balance Data Using Feature Important Evaluation Methods

1
Department of Distribution Marketing, Catholic University of Pusan, Busan 46265, Republic of Korea
2
Blockchain Research Center, Pusan National University, Busan 607935, Republic of Korea
3
Faculty of Information Technology, Hung Yen University of Technology and Education, Hung Yen 160000, Vietnam
*
Author to whom correspondence should be addressed.
Information 2024, 15(3), 156; https://doi.org/10.3390/info15030156
Submission received: 23 January 2024 / Revised: 8 March 2024 / Accepted: 8 March 2024 / Published: 10 March 2024
(This article belongs to the Special Issue Artificial Intelligence (AI) for Economics and Business Management)

Abstract

:
This study delves into the intricate relationship between fluctuations in the real exchange rate and the trade balance, situated within the framework of a ‘two-country’ trade theory model. Despite a wealth of prior research on the impact of exchange rates on international trade, the precise extent of this influence remains a contentious issue. To bridge this gap, our research adopts a pioneering approach, employing three distinct artificial intelligence-based influence measurement methods: Mean Decrease Impurity (MDI), Permutation Importance Measurement (PIM), and Shapley Additive Explanation (SHAP). These sophisticated techniques provide a nuanced and differentiated perspective, enabling specific and quantitative measurements of the real exchange rate’s impact on the trade balance. The outcomes derived from the application of these innovative methods shed light on the substantial contribution of the real exchange rate to the trade balance. Notably, the real exchange rate (RER) emerges as the second most influential factor within the ‘two-country’ trade model. This empirical evidence, drawn from a panel dataset of 78 nations over the period 1992–2021, addresses crucial gaps in the existing literature, offering a finer-grained understanding of how real exchange rates shape international trade dynamics. Importantly, our study implies that policymakers should recognize the pivotal role of the real exchange rate as a key determinant of trade flow.

1. Introduction

Exchange rates, functioning as a crucial barometer for assessing a country’s economic health, wield substantial influence across various dimensions [1]. Their pivotal role extends to shaping patterns of trade volume between nations [2]. Since the dismantling of the Bretton Woods system in 1973, extensive scholarly inquiry has delved into the examination of exchange rates—both their levels and volatility—and their impact on trade flows in diverse economies.
Fluctuations in exchange rates, influenced by factors such as changes in interest rates, inflation rates, and economic efficiency [3,4,5], can have profound consequences on trade dynamics. These fluctuations may elevate transaction costs, potentially eroding the benefits derived from international trade [6,7,8]. Moreover, they may lead to resource misallocation, prompting companies to adjust production and investment based on short-term exchange rate fluctuations rather than long-term fundamentals, thereby hampering productivity and economic growth [9]. Despite studies suggesting positive effects under specific conditions [10,11,12,13], others have faced challenges in identifying clear effects [14,15,16,17,18,19].
The impact of exchange rate fluctuations on trade flows can manifest as symmetric or asymmetric [9,20,21], with the latter being more reasonable in practice due to divergent expectations and reactions among traders to currency appreciation and depreciation [22,23,24,25]. These effects exhibit variations across industries and over time [26,27,28,29,30], reflecting the complexity of the relationship between exchange rate fluctuations and international trade, which varies widely across countries and over time. To explore both the symmetric and asymmetric impacts of exchange rates on trade flows, various methods have been employed in studies. For instance, to analyze symmetric impacts, studies like refs. [17,31,32,33,34,35,36,37] have utilized the autoregressive distributed lag (ARDL) method. Others, such as refs. [38,39] have employed the dynamic ordinary least squares (DOLS) method, and ref. [16] used the OLS method. Additionally, studies like refs. [40,41] have utilized the panel co-integration method. Further, studies like refs. [42,43] have applied the Johansen co-integration method, while ref. [44] used the fully modified OLS (FMOLS) and DOLS approaches. Ref. [15] utilized the error correction model (ECM) method, ref. [18] employed the instrumental variable–generalized method of moments (IV-GMM) method, and ref. [19] used the fixed effect (FE) and random effect (RE) methods. Conversely, to investigate asymmetric effects, studies such as refs. [22,45,46,47,48] have utilized the NARDL method. Despite these diverse estimation methods, some studies are still unable to establish a clear relationship between exchange rates and trade flows. This raises the question: does the exchange rate truly impact the trade balance? To comprehensively address this question, we employ three novel approaches: Mean Decrease Impurity (MDI), Permutation Importance Measurement (PIM), and Shapley Additive Explanation (SHAP). These methods offer deeper insights into the magnitude of exchange rate effects, representing a significant methodological contribution.
The era of increasing globalization and free trade underscores the necessity for a nuanced understanding of this relationship. Exchange rates not only serve as a vital tool in short-term trade policy adjustments, but also play a crucial role in long-term export promotion strategies for sustained economic growth and development [2].
The novelty of our approach lies in the application of advanced artificial intelligence-based methods—MDI, PIM, and SHAP value measurement. These methods, which are not commonly employed in traditional economic analyses, allow for a more sophisticated and nuanced evaluation of the impact of real exchange rates on trade balances. This innovation enhances the precision and depth of our study compared to conventional methodologies. The main contributions of this paper include the following:
  • Advanced Methodology: The study pioneers the use of the MDI, PIM, and SHAP value measurement methods within an artificial intelligence framework. This innovative approach allows for detailed and nuanced quantification of the impact of real exchange rates on the trade balance, providing a more comprehensive understanding compared to traditional linear or non-linear approaches.
  • Detailed Empirical Insight: Unlike previous studies that often categorize the impact of exchange rates as negative or positive, our research delves into the nuanced impact of real exchange rates on the trade balance. By offering a more granular examination, we contribute a fresh perspective to the existing literature.
  • Methodological and Empirical Synthesis: The study seamlessly integrates methodological innovation with empirical evidence, providing a holistic analysis of the intricate relationship between exchange rates and trade balances. This synthesis enhances the robustness of our findings and contributes to a more comprehensive understanding of the subject.
This study endeavors to gauge the impact rate of real exchange rates on the trade balance, utilizing a panel dataset covering 78 countries from 1992 to 2021: Albania; Armenia; Australia; Azerbaijan; Benin; Bangladesh; Bulgaria; Belarus; Bolivia; Brazil; Brunei Darussalam; Botswana; Canada; Switzerland; Chile; China; Cote d’Ivoire; Cameroon; Congo, Rep.; Colombia; Costa Rica; Czechia; Denmark; Dominican Republic; Algeria; Egypt; Arab Rep.; Fiji; United Kingdom; Ghana; Gambia, The; Guatemala; Hong Kong SAR, China; Honduras; Haiti; Hungary; Indonesia; India; Iceland; Jamaica; Japan; Kazakhstan; Kenya; Korea, Rep.; Macao SAR, China; Morocco; Madagascar; Mexico; Mali; Mongolia; Mauritius; Malaysia; Niger; Nigeria; Norway; New Zealand; Pakistan; Peru; Philippines; Paraguay; Romania; Russian Federation; Sudan; Singapore; Solomon Islands; Sweden; Eswatini; Seychelles; Togo; Thailand; Tonga; Tunisia; Turkiye; Tanzania; Uganda; Ukraine; Uruguay; Vanuatu; South Africa. By doing so, we complement existing studies facing challenges in deciphering how exchange rates truly affect the trade balance. The implications of this study are profound, providing policymakers with a more detailed understanding of the pivotal role played by exchange rates in influencing trade scales. This, in turn, facilitates the development of sound exchange rate management policies.

2. Literature

2.1. Real Exchange Rate Fluctuations and Trade Balance

The relationship between real exchange rate fluctuations and trade balance has been a focal point of extensive research in the field of international economics. Previous studies have investigated the impact of exchange rate movements, both in terms of levels and volatility, on the trade flows of various economies. Ref. [1] emphasizes the crucial role of exchange rates as indicators of a country’s economic health, influencing trade dynamics significantly. Ref. [2] provides insights into how exchange rates play a pivotal role in determining patterns of trade volume between countries. Since the shift away from the Bretton Woods system in 1973, a wealth of literature has examined the influence of exchange rates on trade flows, exploring factors such as interest rates, inflation rates, and economic efficiency as sources of exchange rate fluctuations [3,4,5].
Research on exchange rate fluctuations underscores the multifaceted nature of these dynamics, with various factors identified in the literature as significant contributors. These factors not only shape the movement of exchange rates, but also exert profound effects on international trade patterns. (1) Interest Rates: Changes in interest rates have been widely recognized as a pivotal factor influencing exchange rate movements. Alshubiri et al. [3] highlight the impact of interest rate changes on exchange rates, emphasizing the intricate relationship between these two economic variables. The rationale behind this association lies in the fact that interest rate differentials affect capital flows and investment attractiveness, thereby influencing the demand for a currency and, consequently, its exchange rate. (2) Inflation Rates: Inflation rates also play a crucial role in shaping exchange rate fluctuations. Hall et al. [4] provide insights into how inflation differentials among countries can impact their respective exchange rates. Currencies in countries with lower inflation rates are often perceived as more stable and, therefore, more attractive to investors. (3) Economic Efficiency: The efficiency of an economy is another determinant of exchange rate movements. Liu et al. [5] explore the relationship between economic efficiency and exchange rates, underlining the importance of economic performance in influencing currency values. A more efficient and productive economy is likely to attract foreign investment, impacting the demand for its currency.
The repercussions of exchange rate fluctuations extend beyond the currency market, significantly influencing international trade and economic activities. (1) Transaction Costs: Exchange rate fluctuations have been associated with an increase in transaction costs, potentially diminishing the benefits derived from international trade [6]. Refs. [7,8] emphasize the broader economic impact of these costs on internationalization efforts. Higher transaction costs can erode the advantages of engaging in cross-border trade, affecting businesses and economies involved. (2) Resource Misallocation: A notable consequence highlighted in the literature is the potential for resource misallocation. Lal et al. [9] argue that short-term exchange rate fluctuations can lead companies to adjust production and investment decisions based on immediate currency movements rather than long-term economic fundamentals. This misallocation can result in suboptimal resource utilization, hindering overall productivity and economic growth. (3) Diverse Effects and Challenges: While the literature suggests negative consequences [49,50], positive effects have also been identified under specific conditions. Studies such as [10,11,12,13,51,52,53] highlight instances where exchange rate fluctuations can have positive impacts on trade. These positive effects may be observed in scenarios where currency movements align with the economic interests and strategies of involved parties. Some other studies, such as those conducted by the authors of [54,55,56], support the J curve effect, indicating that changes in exchange rates can harm the trade balance in the short term but tend to improve it in the long term.
However, the literature also acknowledges challenges in identifying clear and consistent effects of exchange rate fluctuations on international trade. The studies [14,15,16,17,18,19,57,58] reveal the complexity of this relationship, with varying results across different contexts and periods.
Moreover, research has delved into the varied impacts of exchange rate fluctuations across different trade flow levels. For instance, ref. [31] investigated the effects of exchange rates using aggregate trade data, while refs. [38,40,41,42,43,44,46,47] employed bilateral-level trade data to explore the relationship between these variables. In contrast, refs. [32,33,34,35,36,37,39,45,48] conducted analyses at the industry or item level. These discrepancies highlight the need for nuanced analyses that consider the specific conditions and contexts under which exchange rate fluctuations occur.

2.2. Feature Importance Evaluation Methods in Economic Analysis

A notable trend in recent economic analysis involves the incorporation of advanced methods, particularly feature importance evaluation techniques, to unravel complex relationships. These methods aim to identify the most influential factors contributing to observed outcomes. In the context of exchange rates and trade balance, studies have started adopting feature importance evaluation methods to gain a more nuanced understanding of the underlying dynamics.
The Mean Decrease Impurity (MDI), Permutation Importance Measurement (PIM), and Shapley Additive Explanation (SHAP) methods are increasingly employed in economic analyses. These approaches, rooted in artificial intelligence, offer a differentiated perspective, allowing for specific and quantitative measurements of the impact of real exchange rates on trade balance. Strobl et al. [59] demonstrate the application of the MDI method in evaluating variable importance in random forests. These advanced techniques present an innovative way to dissect the intricate relationship between exchange rates and trade balance.

2.3. Gaps in the Literature and Rationale for the Current Study

Despite the wealth of research on the topic, gaps persist in the literature, particularly in quantifying the detailed influence of exchange rates on trade balance. Many studies have traditionally categorized the impact as negative or positive, lacking the granularity to provide a nuanced understanding. Our research seeks to address this gap by introducing the SHAP value measurement method within an artificial intelligence framework. This methodological innovation allows for a detailed and differentiated approach, providing specific quantitative measurements of the real exchange rate’s impact on the trade balance.
Furthermore, existing studies often focus on assessing whether exchange rate depreciation or appreciation leads to trade volume changes without empirically measuring the detailed influence. The current study aims to fill this void by employing the MDI, PIM, and SHAP value measurement methods to quantify the detailed impact of exchange rates on the trade balance. This methodological contribution, coupled with the empirical evidence generated, presents a new dimension to the existing literature on the relationship between real exchange rates and trade balances.

3. Materials and Methods

In this section, we present a detailed account of the materials and methods. The first aspect covered is the analytical model, followed by an exploration of measurement approaches.
(1) Analytical Model: The analytical framework of this study is grounded in the export and import function approach within the ‘two-country’ trade model. In this model, the export volume ( X V ) from country i to country j is contingent on the relative prices of exports and the demand from the citizens of country j. Similarly, the import volume ( M V ) from country j to the country i hinges on the relative import prices and the demand from citizens of country i. The export and import functions are represented by Equations (1) and (2):
X V = f ( R P , Y * )
M V = f ( R P * , Y )
Here, R P and R P * denote the relative prices of exported and imported goods, respectively, while Y and Y * represent the commodity demand of country i and country j, respectively.
Utilizing panel data, the trade balance model for a country about the rest of the world is expressed by Equation (3):
T B = f ( Y D , Y W , R E R )
In this equation, T B (trade balance) is the output, measured as the natural logarithm of the export value divided by the import value. Y D represents domestic real income, measured as the natural logarithm of the gross domestic product per capita ( g d p p c ) of country i. Y W represents foreign real income, measured as the natural logarithm of the gross domestic product per capita of the world ( g d p p c w ), and R E R represents the real exchange rate.
Furthermore, the study introduces several variables— T B , Y D , Y W , R E R :
T B = l o g ( X V ) l o g ( M V )
Y D = l o g ( g d p p c )
Y W = l o g ( p d p p c w )
R E R = l o g ( E × P * / P )
where E represents the nominal exchange rate between the domestic currency of the country, i, and the US dollar. P * represents the US consumer price index, and P represents the domestic consumer price index.
(2) Measurement Approaches: The study employs three distinct approaches to gauge the impact of five features, namely R E R , Y D , Y W . The analysis utilizes annual data from 78 countries spanning the period from 1992 to 2021. Nominal exchange rate and CPI consumer price index (2010 = 100) data are sourced from the World Bank (WB), while export and import data are collected from the WB and the International Monetary Fund (IMF) for specific countries. GDP per capita data for countries and the world are obtained from the WB and Country Economy (CE) for selected countries.

3.1. Feature Importance Evaluation Methods

To unravel the intricate relationship between real exchange rate fluctuations and trade balance, we employed advanced feature importance evaluation methods rooted in artificial intelligence. These methods offer a nuanced understanding of the contribution of different features to the observed outcomes. The three key methods utilized in our study are as follows:
(1) Feature importance measurement with Mean Decrease Impurity (MDI).
Measuring feature importance with Mean Decrease Impurity (MDI) is a technique commonly used in decision tree-based machine learning models, such as random forests. It assesses the contribution of each feature ( R E R , Y D , Y W ) to the overall predictive power of the model by evaluating how much each feature reduces the impurity in the decision tree nodes. The impurity reduction signifies how well a feature splits the data into more homogenous subsets, thus providing insight into its importance for predicting the output (TB).
Below is a general overview of the method and the mathematical formula used for MDI with specific features:
  • Random Forest Training: First, a random forest model, which consists of multiple decision trees, is trained on the dataset. Each tree is trained on a bootstrapped sample of the data with a random subset of features ( R E R , Y D , Y W ) considered at each node split.
  • Impurity Measure: The impurity measure, often referred to as Gini impurity or entropy, is calculated for each node during the tree-building process. The reduction in impurity due to a feature (e.g., R E R ) is measured as follows:
    (1) G i n i Impurity: The Gini impurity for a node is calculated as follows:
    G i n i ( D ) = 1 ( p i 2 )
    where p i is the proportion of instances of class i in the node.
    (2) Impurity Reduction: To measure the impurity reduction due to a feature (e.g., R E R ), we calculate a weighted average of impurity reductions over all the nodes where the feature is used for splitting. It is defined as
    M D I ( R E R ) = ( w j [ I m p u r i t y ( n o d e j ) w l e f t I m p u r i t y ( l e f t c h i l d j ) w r i g h t I m p u r i t y ( r i g h t c h i l d j ) ] )
    where j iterates over all nodes where the feature ( R E R ) is used for splitting. w j is the weighted fraction of data points in n o d e j . w l e f t and w r i g h t are the weighted fractions of data points in the left and right child nodes after splitting, respectively. Impurity( n o d e j ), Impurity( l e f t c h i l d j ), and Impurity ( r i g h t c h i l d j ) are the Gini impurity values for n o d e j , the left child, and the right child.
  • Ranking Features: Finally, the features ( R E R , Y D , Y W ) are ranked based on the total impurity reduction they provide. The higher the MDI value, the more important the feature is in making decisions within the random forest model for predicting the output ( T B ).
(2) Permutation importance measurement. This method assesses the importance of each feature by evaluating how much the predictive accuracy of a machine learning model decreases when the values of a particular feature are randomly shuffled.
  • Model Training: To use the Permutation Importance method, first, we need to train your machine learning model on your dataset with features ( R E R , Y D , Y W ) to predict the output ( T B ).
  • Initial Accuracy: Measure the initial accuracy or performance metric of our model (e.g., accuracy, mean squared error, etc.) using the test dataset. This initial performance serves as a baseline for feature importance evaluation.
  • Feature Shuffling: For each feature ( R E R , Y D , Y W ), we randomly shuffle the values of that feature while keeping all other features and the output constant.
  • Performance Evaluation: After shuffling the feature, re-evaluate the model’s performance using the same performance metric as in step 2. The drop in performance (accuracy or other metrics) is indicative of the importance of that feature. The idea is that if the feature were important for predictions, shuffling it would lead to a significant drop in performance.
  • Repeat for All Features: Repeat steps 3 and 4 for each feature individually. This will provide a measure of importance for each feature based on the reduction in model performance.
  • Rank Features: Rank the features based on the drop in model performance. Features that, when shuffled, cause the largest drop in performance are considered more important for prediction.
The importance of permutation can be expressed mathematically as follows. Permutation Importance ( P I ) for a feature, e.g., R E R :
P I ( R E R ) = I n i t i a l P e r f o r m a n c e S h u f f l e d P e r f o r m a n c e
where I n i t i a l P e r f o r m a n c e is the performance metric (e.g., accuracy) of our model on the test dataset before shuffling the feature. S h u f f l e d P e r f o r m a n c e is the performance metric of our model on the test dataset after shuffling the values of the R E R feature. Higher P I values indicate that the feature (e.g., R E R ) is more important for our model’s predictions. Features with a significant drop in performance when shuffled are considered more crucial for predicting the output ( T B ). We can apply the Permutation Importance method to assess the importance of each of our features ( R E R , Y D , Y W ) in predicting the output ( T B ) in our study.
(3) SHAP value measurement with bar plot. Measuring feature importance using SHAP (Shapley Additive Explanations) values with bar plots is a powerful and interpretable method for understanding how each feature (e.g., R E R , Y D , Y W ) contributes to the prediction of our output ( T B ). SHAP values provide a unified measure of feature importance, and the bar plot visualization helps you easily grasp the impact of each feature.
  • Model Training: To use the SHAP value measurement method, we first need to train our machine learning model on our dataset with the features ( R E R , Y D , Y W ) to predict the output ( T B ).
  • SHAP Values’ Calculation: Calculate the SHAP values for each data point in our test dataset. SHAP values explain the difference between the model prediction and the expected value of the prediction for each feature.
  • Summary Statistics: Calculate the summary statistics (e.g., mean or absolute mean) of the SHAP values for each feature. These summary statistics provide a measure of the average contribution of each feature across the entire dataset.
  • Bar Plot Visualization: Create a bar plot where each bar represents a feature, and the height of the bar corresponds to the summary statistic of the SHAP values for that feature. Positive values indicate features that push predictions higher, while negative values suggest features that push predictions lower.
The mathematical formula for calculating SHAP values can be quite complex and is typically computed using various techniques, such as SHAP values from cooperative game theory, and may involve intricate mathematics. However, we provide a simplified representation for a single feature, e.g., R E R :
  • Calculate the model’s output (prediction) for a specific data point: f ( x ) , where x is a data point.
  • Calculate the expected value of the model’s output across all data points: E ( f ( x ) ) .
  • The SHAP value for feature R E R for a specific data point x can be represented as
    S H A P ( R E R ) = f ( x ) E ( f ( x ) )
  • To compute the summary statistic (e.g., mean or absolute mean) for the SHAP values of R E R , we would calculate this statistic across all data points.
To compute the summary statistic (e.g., mean or absolute mean) for the SHAP values of R E R , we would calculate this statistic across all data points. The bar plot visualization will show these summary statistics for each feature, making it clear which features have a more substantial impact on the model’s predictions.
Higher SHAP values (either positive or negative) indicate a more significant influence of the feature on the prediction. Positive values imply that the feature contributes to increasing the prediction, while negative values suggest that the feature contributes to decreasing the prediction.

3.2. Dataset Description

The dataset utilized in our study encompasses information from 78 countries, spanning the period from 1992 to 2021. The variables incorporated into the dataset include real exchange rates and trade balance, but are not limited to the following:
  • Real Exchange Rates: Capturing the relative value of a country’s currency against a basket of other currencies, thereby providing a measure of competitiveness in international trade.
  • Trade Balance: Reflecting the difference between a country’s exports and imports, a key indicator of its economic relationship with the rest of the world.
These variables form the core components of our analysis, enabling a comprehensive exploration of the impact of real exchange rates on trade balances across diverse economies.

3.3. Data Collection and Preprocessing

The data collection process involved aggregating information from reputable sources, such as central banks, international trade databases, and economic research institutions. Special attention was given to ensure consistency and accuracy across the entire dataset.
Preprocessing of the data aimed to enhance its suitability for the feature importance evaluation methods. This involved handling missing values, standardizing units, and normalizing data distributions. Furthermore, temporal trends and seasonality were addressed to create a robust foundation for the subsequent analysis.
The rigorous data preprocessing phase is crucial to ensure the reliability and validity of our findings. By mitigating potential biases and standardizing the data, we aimed to provide a solid basis for the application of feature importance evaluation methods and the subsequent interpretation of results.

4. Experimental Results

In this section, we present two experiments focusing on distinct cases. In the first case, our model undergoes evaluation using data from a single country, including Bulgaria and Australia, to visualize the result randomly. Next, we assess its performance in two groups of countries: 17 nations within the OECD group and 61 countries outside the OECD, named Non-OECD. In the final case, our model undergoes evaluation using panel data from 78 countries. The detail of each case study is shown in Table 1.

4.1. The Effectiveness of the Proposed Method on Single Country and Group Country Data

We randomly selected two countries, Bulgaria and Australia, to assess the effectiveness of our proposed method. The corresponding results are illustrated in Figure 1 for the Bulgarian dataset and Figure 2 for the Australian dataset.
From the results depicted in these figures, it is observed that the relative exchange rate ( R E R ) exhibits the highest impact on trade balance ( T B ) in the MDI method, while it shows the lowest impact in the PIM method. Meanwhile, in the SHAP method, it ranks as the second most influential factor affecting trade balance ( T B ).
Subsequently, we assess our method’s performance on two country groups: OECD and Non-OECD. The evaluation results are depicted in Figure 3 for OECD and Figure 4 for Non-OECD.
Based on the results depicted in these figures, it is evident that Y D exerts the most significant influence on T B in both datasets. Following closely, R E R emerges as the second most impactful factor on T B in both group datasets.

4.2. The Effectiveness of the Proposed Method on Panel Countries Data
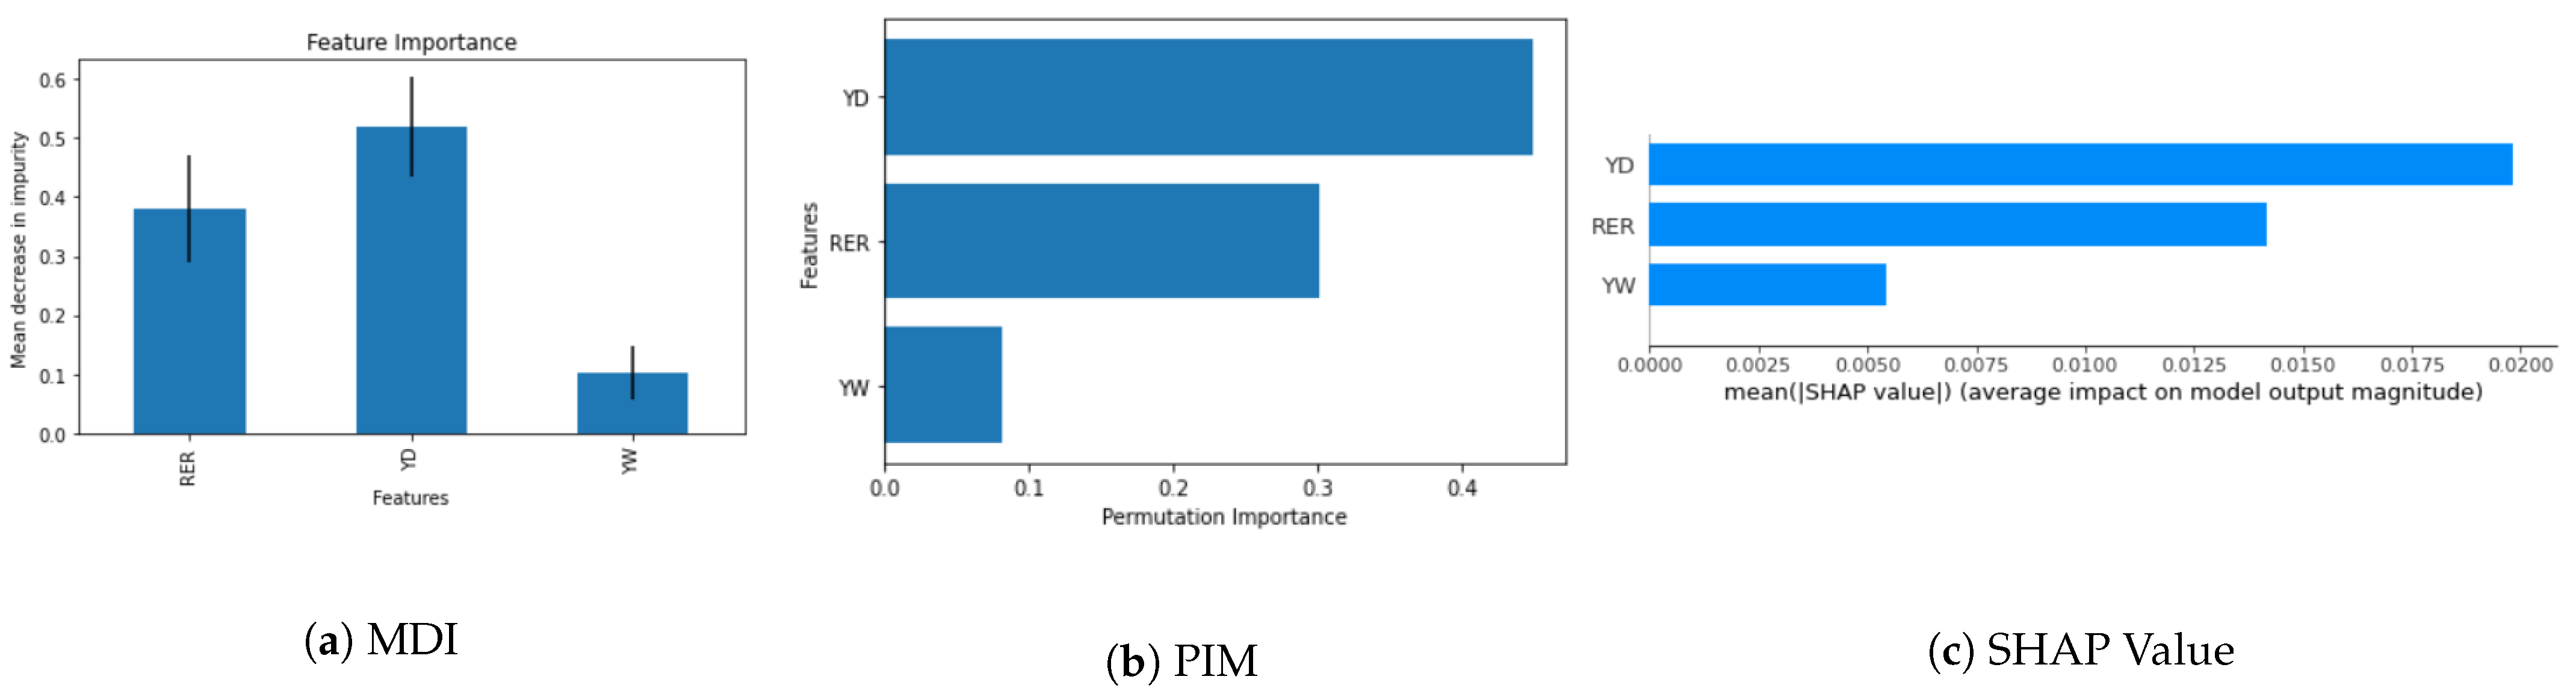
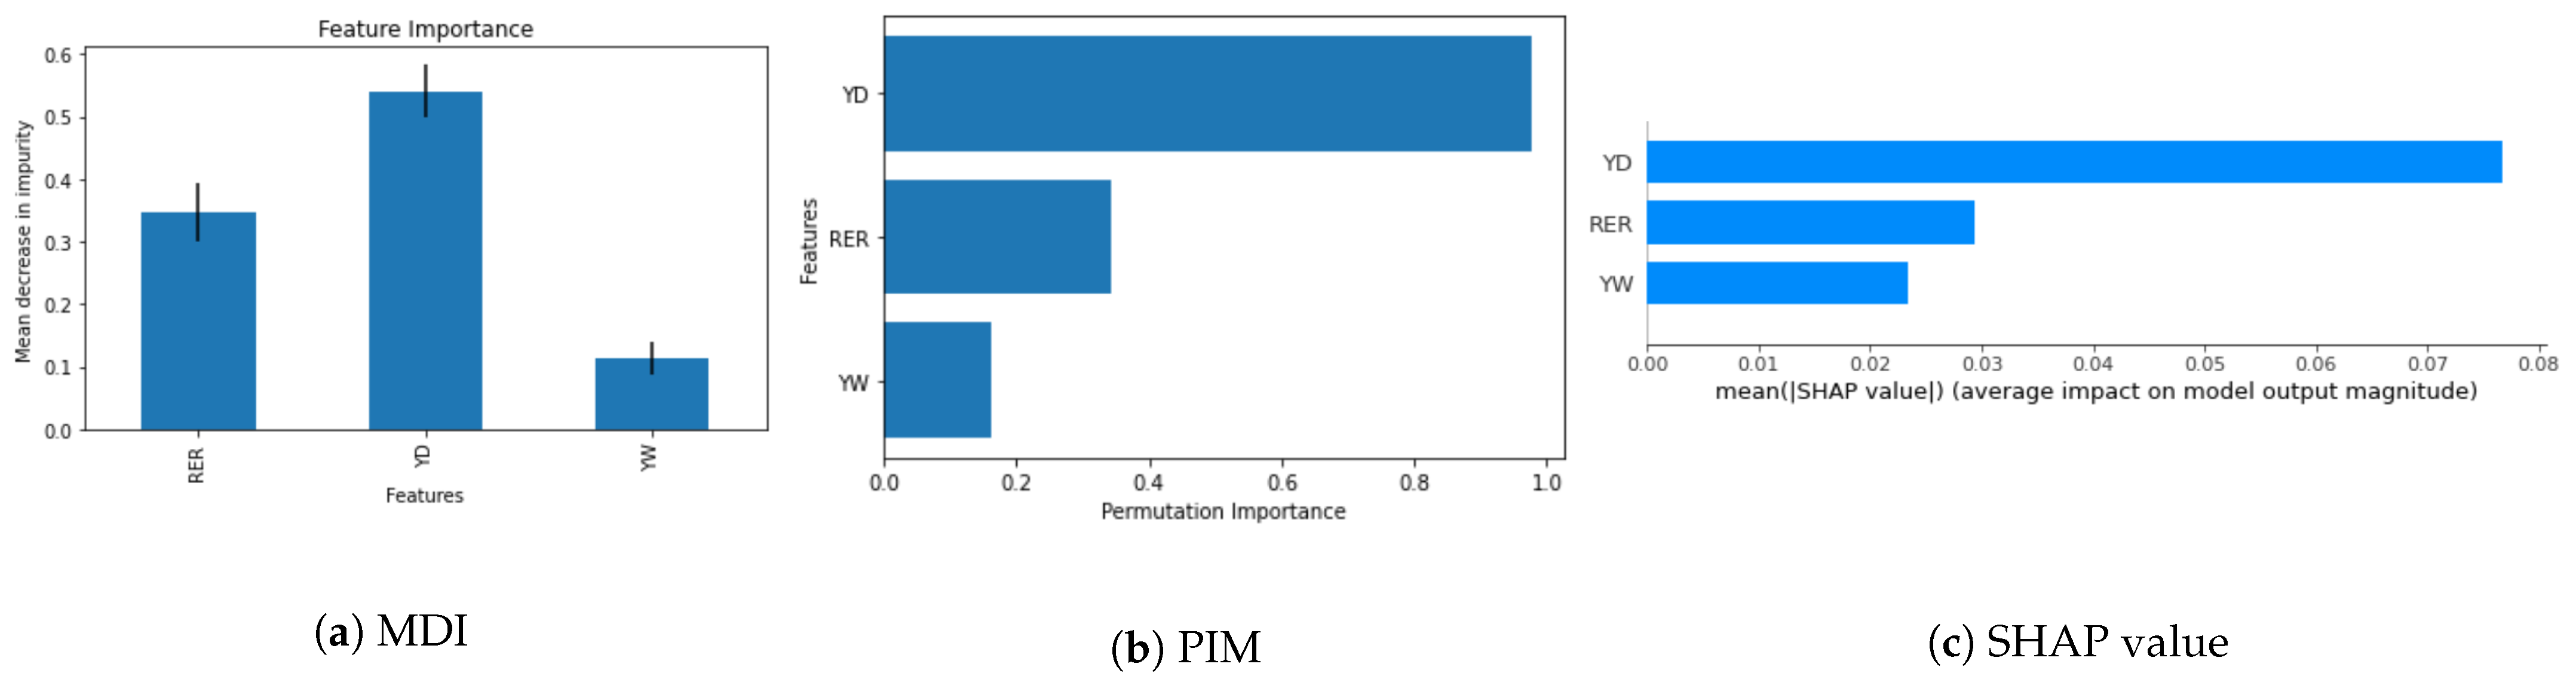
This section unravels the experimental results, offering crucial insights into the effectiveness of five features ( R E R , Y D , Y W ) in influencing T B . The visual representation in Figure 5 illustrates the impact of these features as assessed by three distinct methods.
The unanimous agreement among the three methods regarding the relative importance of the features leads to noteworthy observations:
  • Y D (Domestic Real Income): Evidently, Y D consistently emerges as the most influential feature affecting T B across all three methods, underscoring its considerable impact on trade balance outcomes.
  • R E R (Real Exchange Rate): R E R follows closely, identified as a substantial factor affecting T B , albeit with slightly less of an impact than Y D .
  • Y W (Foreign Real Income): Conversely, Y W exhibits a relatively minor influence on T B as per the results obtained from the three methods.
In summary, the experimental findings indicate that R E R holds the highest influence on T B , followed by Y D , while Y W plays comparatively minor roles in shaping T B outcomes.
The results presented in Figure 5 indicate that, in the ‘two-country’ trade model, the efficacy of the real exchange rate is significantly secondarily influencing the trade balance. Importantly, our study does not aim to discern the impact of negative or positive real exchange rates. Instead, our focus is on quantitative measurement to determine what percentage of its impact on trade is accounted for in the theoretical model. In other words, we measure the impact of strong or weak real exchange rate changes on the trade balance.

5. Discussion

The substantial influence of real exchange rates, evident in this study, contributes significantly to addressing findings in prior studies that failed to establish a clear relationship between exchange rates and international trade. For instance, the studies [12,14,16,18] reported no significant impact of exchange rates on trade in various contexts. This indicates a fundamental unresolved ambiguity in these studies. Theoretically, researchers have developed various models demonstrating that exchange rate fluctuations can have either a positive or negative impact on trade flows. However, determining the superiority of one model over another is not immediate [60]. Conversely, studies like [10,11,12,13,51,52,53] identified a significant positive effect of the exchange rate on the trade balance, while other studies [6,7,8,9,49,50,61] found a significant negative relationship between exchange rates and trade balance. Furthermore, according to [62], the level and variability of trade flows were negatively affected by differential microstructural shocks to the exchange rate process. However, the divergence of exchange rate fundamentals and the disturbance of future policy innovation signals had both positive and negative impacts on variation, but the extent of trade flows was unclear. Ref. [63] argues that exchange rate volatility has a negative impact on trade but will depend on several factors, including the existence of risk prevention tools, production structure, and the level of economic integration between countries. Meanwhile, exchange rate differentials are expected to have a short-term impact on models with price rigidity. Overall, a growing body of research shows that exchange rate fluctuations impact trade flows differently in different markets and over different periods.
The study’s findings carry substantial policy implications, unveiling a nuanced understanding of the detailed impact of exchange rates on the trade balance. Contrary to traditional linear or non-linear models, our advanced evaluation methods, including Mean Decrease Impurity (MDI), Permutation Importance Measurement (PIM), and Shapley Additive Explanation (SHAP), provide a more comprehensive perspective. Specifically, the impact of features like R E R on the trade balance is highlighted, demonstrating that their influence can be more accurately measured using innovative methodologies.
In light of these findings, policymakers are urged to consider the nuanced influence of features such as R E R when formulating strategies for managing exchange rates. Traditional approaches may overlook significant factors, and our research suggests that tailored and targeted policies can be more effective in promoting sustainable trade balances. Incorporating advanced evaluation methods into policy frameworks can enhance the precision of policy decisions, fostering more favorable trade outcomes.
While our study makes significant contributions in methodology and empirical evidence, certain limitations should be acknowledged. Firstly, the use of panel data, though providing a holistic view, may encounter challenges related to the ‘aggregation bias problem’ as discussed by Baek (2014) [37]. Secondly, our focus on the symmetric and direct impact of R E R overlooks potential asymmetric or indirect effects. Future research should explore these aspects to provide a more comprehensive understanding of the multifaceted impact of real exchange rates on international trade. Additionally, a more extensive dataset could further enhance the robustness and generalizability of our findings.

6. Conclusions

This study employs advanced artificial intelligence-based methodologies, including Mean Decrease Impurity (MDI), Permutation Importance Measurement (PIM), and Shapley Additive Explanation (SHAP), for a meticulous examination of the real exchange rate’s impact on the trade balance within a ‘two-country’ trade model. Utilizing panel data from 78 countries, encompassing both developed and developing nations, during the period 1992 to 2021, we have uncovered a significant influence of the real exchange rate, positioning it as the second most impactful factor affecting the trade balance. This novel finding illuminates the crucial role played by exchange rate dynamics in shaping international trade patterns.
The policy implications derived from our research underscore the vital role of the real exchange rate in steering trade flows. Policymakers are urged to recognize the importance of exchange rates when formulating effective exchange rate management policies. These insights are particularly valuable for export-oriented businesses, providing them with the necessary understanding to tailor responses in accordance with identified changes in scale.
While our study has made substantial contributions in terms of methodology and empirical evidence, it is essential to acknowledge certain limitations. Firstly, the use of panel data may encounter constraints related to the ‘aggregation bias problem’, as discussed by Baek [37]. In specific contexts, empirical evidence has demonstrated diverse impacts of exchange rates. This suggests that using aggregate trade data may lead to inaccurate inferences regarding the relationship between exchange rates and trade balance. Empirical researchers should, therefore, aim to analyze country-specific or item-specific disaggregated data.
Furthermore, our study predominantly focused on the symmetrical and direct impact of the real exchange rate, overlooking potential asymmetrical or indirect effects. The real exchange rate can exert diverse indirect influences on the trade balance through channels such as foreign direct investment and fluctuations in import and export prices. Future research endeavors should address these limitations, providing a more nuanced understanding of the multifaceted impact of real exchange rates on international trade. In doing so, we anticipate further refinement of policies and strategies aimed at fostering sustainable and balanced trade relations in an increasingly interconnected global economy.

Author Contributions

Conceptualization, M.-J.K.; methodology, M.-J.K. and T.-T.-H.L.; software, T.-T.-H.L.; validation, M.-J.K. and T.-T.-H.L.; formal analysis, M.-J.K. and T.-T.-H.L.; data curation, M.-J.K.; writing—original draft preparation, M.-J.K. and T.-T.-H.L.; writing—review and editing, M.-J.K. and T.-T.-H.L.; visualization, M.-J.K. and T.-T.-H.L.; supervision, T.-T.-H.L. All authors have read and agreed to the published version of the manuscript.

Funding

This research received no external funding.

Institutional Review Board Statement

Not applicable.

Informed Consent Statement

Not applicable.

Data Availability Statement

Data can be provided upon receiving a suitable request.

Acknowledgments

We thank the reviewers for reviewing this manuscript.

Conflicts of Interest

The authors declare no conflicts of interest.

Abbreviations

The following abbreviations are used in this manuscript:
YDDomestic Real Income
TBTrade Balance
RERReal Exchange Rate
YWForeign Real Income
WBWorld Bank
IMFInternational Momentary Fund
CECountry Economy
MDIMean Decrease Impurity
PIMPermutation Importance Measurement
SHAPSHapley Additive exPlanation

References

  1. Edwards, S.; Cabezas, L. Exchange Rate Pass-through, Monetary Policy, and Real Exchange Rates: Iceland and the 2008 Crisis. Open Econ. Rev. 2022, 33, 197–230. [Google Scholar] [CrossRef]
  2. Bahmani-Oskooee, M.; Aftab, M. Asymmetric effects of exchange rate changes on the Malaysia-EU trade: Evidence from industry data. Empirica 2016, 2, 339–365. [Google Scholar] [CrossRef]
  3. Alshubiri, F. The impact of the real interest rate, the exchange rate and political stability on foreign direct investment inflows: A comparative analysis of G7 and GCC Countries. Asia-Pac. Financ. Mark. 2022, 29, 569–603. [Google Scholar] [CrossRef]
  4. Hall, S.G.; Hondroyiannis, G.; Kenjegaliev, A.; Swamy, P.; Tavlas, G.S. Is the relationship between prices and exchange rates homogeneous? J. Int. Money Financ. 2013, 37, 411–438. [Google Scholar] [CrossRef]
  5. Liu, T.Y.; Lee, C.C. Exchange rate fluctuations and interest rate policy. Int. J. Financ. Econ. 2022, 27, 3531–3549. [Google Scholar] [CrossRef]
  6. Lim, W.M.; Mandrinos, S. A general theory of de-internationalization. Glob. Bus. Organ. Excell. 2023, 42, 9–15. [Google Scholar] [CrossRef]
  7. Mandrinos, S.; Lim, W.M. De-internationalization: An organizational institutionalism perspective. Glob. Bus. Organ. Excell. 2023, 42, 58–73. [Google Scholar] [CrossRef]
  8. Mandrinos, S.; Lim, W.M.; Liew, C.S.L. De-internationalization through the lens of intellectual property rights. Thunderbird Int. Bus. Rev. 2022, 64, 13–24. [Google Scholar] [CrossRef]
  9. Lal, M.; Kumar, S.; Pandey, D.K.; Rai, V.K.; Lim, W.M. Exchange rate volatility and international trade. J. Bus. Res. 2023, 167, 114156. [Google Scholar] [CrossRef]
  10. Asseery, A.; Peel, D.A. The effects of exchange rate volatility on exports: Some new estimates. Econ. Lett. 1991, 37, 173–177. [Google Scholar] [CrossRef]
  11. Arize, A.C. The long-run relationship between import flows and real exchange-rate volatility: The experience of eight European economies. Int. Rev. Econ. Financ. 1998, 7, 417–435. [Google Scholar] [CrossRef]
  12. Arora, S.; Bahmani-Oskooee, M.; Goswami, G. Bilateral J-curve between India and her trading partners. Appl. Econ. 2003, 35, 1037–1041. [Google Scholar] [CrossRef]
  13. Hall, S.; Hondroyiannis, G.; Swamy, P.; Tavlas, G.; Ulan, M. Exchange-rate volatility and export performance: Do emerging market economies resemble industrial countries or other developing countries? Econ. Model. 2010, 27, 1514–1521. [Google Scholar] [CrossRef]
  14. Rose, A.K.; Yellen, J.L. Is there a J-curve? J. Monet. Econ. 1989, 24, 53–68. [Google Scholar] [CrossRef]
  15. Rahman, M.; Mustafa, M.; Burckel, D.V. Dynamics of the yen-dollar real exchange rate and the US-Japan real trade balance. Appl. Econ. 1997, 29, 661–664. [Google Scholar] [CrossRef]
  16. Nyeadi, J.D.; Atiga, O.; Atogenzoya, C.A. The impact of exchange rate movement on export: Empirical evidence from Ghana. Int. J. Acad. Res. Account. Financ. Manag. Sci. 2014, 4, 41–48. [Google Scholar] [CrossRef] [PubMed]
  17. Asteriou, D.; Masatci, K.; Pılbeam, K. Exchange rate volatility and international trade: International evidence from the MINT countries. Econ. Model. 2016, 58, 133–140. [Google Scholar] [CrossRef]
  18. Khachatryan, G.A.; Grigoryan, A. Export growth dynamics and real exchange rate: Evidence from Armenia. Int. Econ. J. 2020, 34, 493–509. [Google Scholar] [CrossRef]
  19. Nguyen, H.M.; Quan, B.Q.M.; Le, H.V.; Tran, T.V. Determinants of intra-industry trade between vietnam and countries in tpp. J. Asian Financ. Econ. Bus. 2020, 7, 123–129. [Google Scholar] [CrossRef]
  20. Rose, A.K. The role of exchange rates in a popular model of international trade. J. Int. Econ. 1991, 30, 301–316. [Google Scholar] [CrossRef]
  21. Cheung, Y.-W.; Chinn, M.D.; Qian, X. Are Chinese trade flows different? J. Int. Money Financ. 2012, 31, 2127–2146. [Google Scholar] [CrossRef]
  22. Bahmani-Oskooee, M.; Aftab, M. On the asymmetric effects of exchange rate volatility on trade flows: New evidence from US-Malaysia trade at the industry level. Econ. Model. 2017, 63, 86–103. [Google Scholar] [CrossRef]
  23. Bampi, R.E.; Colombo, J.A. Heterogeneous effects of foreign exchange appreciation on industrial output: Evidence from disaggregated manufacturing data. Q. Rev. Econ. Financ. 2021, 80, 431–451. [Google Scholar] [CrossRef]
  24. Marquez, J.; Schindler, J. Exchange-rate effects on China’s trade. Rev. Int. Econ. 2007, 15, 837–853. [Google Scholar] [CrossRef]
  25. Baek, J.; Nam, S. The South Korea–China trade and the bilateral real exchange rate: Asymmetric evidence from 33 industries. Econ. Anal. Policy 2021, 71, 463–475. [Google Scholar] [CrossRef]
  26. Bahmani-Oskooee, M.; Harvey, H. Exchange rate volatility and commodity trade between United States and Australia: An asymmetric analysis. World Econ. 2021, 44, 1509–1700. [Google Scholar] [CrossRef]
  27. Bahmani-Oskooee, M.; Karamelikli, H. Exchange rate volatility and commodity trade between UK and China: An asymmetric analysis. Chin. Econ. 2022, 55, 41–65. [Google Scholar] [CrossRef]
  28. Hashmi, S.M.; Chang, B.H.; Shahbaz, M. Asymmetric effect of exchange rate volatility on India’s cross-border trade: Evidence from global financial crisis and multiple threshold nonlinear autoregressive distributed lag model. Aust. Econ. Pap. 2021, 60, 64–97. [Google Scholar] [CrossRef]
  29. Senadza, B.; Diaba, D.D. Effect of exchange rate volatility on trade in Sub-Saharan Africa. J. Afr. Trade 2017, 4, 20–36. [Google Scholar] [CrossRef]
  30. Yazgan, M.E.; Ozturk, S.S. Real exchange rates and the balance of trade: Does the J-curve effect really hold? Open Econ. Rev. 2019, 30, 343–373. [Google Scholar] [CrossRef]
  31. Bahmani-Oskooee, M.; Kara, O. Income and price elasticities of trade: Some new estimates. Int. Trade J. 2005, 19, 165–178. [Google Scholar] [CrossRef]
  32. Ky Chang, B. Changes in Effects of Exchange Rate on Trade Balance according to Industrial Structure Change. J. Korea Trade (JKT) 2005, 9, 5–23. [Google Scholar]
  33. Bahmani-Oskooee, M.; Ardalani, Z. Exchange rate sensitivity of US trade flows: Evidence from industry data. South. Econ. J. 2006, 72, 542–559. [Google Scholar]
  34. Baek, J.; Koo, W.W. How sensitive is US agricultural trade to the bilateral exchange rate? Evidence from bulk, intermediate, and consumer-oriented products. Agric. Econ. 2011, 42, 387–403. [Google Scholar] [CrossRef]
  35. Baek, J. Exchange rate sensitivity of Korea-US bilateral trade: Evidence from industrial trade data. J. Korea Trade 2012, 16, 1–21. [Google Scholar]
  36. Baek, J. Does the exchange rate matter to bilateral trade between Korea and Japan? Evidence from commodity trade data. Econ. Model. 2013, 30, 856–862. [Google Scholar] [CrossRef]
  37. Baek, J. Exchange rate effects on Korea–US bilateral trade: A new look. Res. Econ. 2014, 68, 214–221. [Google Scholar] [CrossRef]
  38. Jiranyakul, K.; Brahmasrene, T. An analysis of the determinants of Thailand’s exports and imports with major trading partners. Southwest. Econ. Rev. 2002, 29, 111–121. [Google Scholar]
  39. Thorbecke, W.; Zhang, H. The effect of exchange rate changes on China’s labour-intensive manufacturing exports. Pac. Econ. Rev. 2009, 14, 398–409. [Google Scholar] [CrossRef]
  40. Hatemi-J, A.; Irandoust, M. Bilateral trade elasticities: Sweden versus her major trading partners. Am. Rev. Political Econ. 2005, 3, 38–50. [Google Scholar] [CrossRef]
  41. Irandoust, M.; Ekblad, K.; Parmler, J. Bilateral trade flows and exchange rate sensitivity: Evidence from likelihood-based panel cointegration. Econ. Syst. 2006, 30, 170–183. [Google Scholar] [CrossRef]
  42. Mohsen, B.-O.; Brooks, T.J. Cointegration approach to estimating bilateral trade elasticities between US and her trading partners. Int. Econ. J. 1999, 13, 119–128. [Google Scholar] [CrossRef]
  43. Kim, A. An empirical analysis of Korea’s trade imbalances with the US and Japan. J. Asia Pac. Econ. 2009, 14, 211–226. [Google Scholar] [CrossRef]
  44. Chang, B.-K. Korean bilateral trade balances and exchange rate sensitivity: Evidence from the panel approach. J. Korea Trade (JKT) 2009, 13, 1–19. [Google Scholar]
  45. Bahmani-Oskooee, M.; Fariditavana, H. Nonlinear ARDL approach and the J-curve phenomenon. Open Econ. Rev. 2016, 27, 51–70. [Google Scholar] [CrossRef]
  46. Bahmani-Oskooee, M.; Harvey, H. Do inpayments and outpayments respond to exchange rate changes asymmetrically: Evidence from Malaysia. Int. Trade J. 2018, 32, 317–342. [Google Scholar] [CrossRef]
  47. Bahmani-Oskooee, M.; Fariditavana, H. How sensitive are the US inpayments and outpayments to real exchange rate changes: An asymmetry analysis. Int. Econ. Econ. Policy 2019, 16, 619–647. [Google Scholar] [CrossRef]
  48. Bahmani-Oskooee, M.; Kanitpong, T. Thailand-China commodity trade and exchange rate uncertainty: Asymmetric evidence from 45 industries. J. Econ. Asymmetries 2019, 20, e00130. [Google Scholar] [CrossRef]
  49. Phan, T.H.; Jeong, J.Y. Vietnam trade balance and exchange rate: Evidence from panel data analysis. J. Appl. Econ. Bus. Res. 2015, 5, 220–232. [Google Scholar]
  50. Kofoworade, A. Effect of Real Exchange Rate on Trade Balance and Economic Growth in Nigeria. 2018. Available online: https://doi.org/10.2139/ssrn.4560722 (accessed on 13 February 2024).
  51. Phong, L.H.; Bao, H.H.G.; Van, D.T.B. Application of nonlinear autoregressive distributed lag (NARDL) model for analysis of the asymmetric effects of real exchange rate volatility on Vietnam’s trade balance. J. Eng. Appl. Sci. 2019, 14, 4317–4322. [Google Scholar] [CrossRef]
  52. Durmaz, N. Industry level J-curve in Turkey. J. Econ. Stud. 2015, 42, 689–706. [Google Scholar] [CrossRef]
  53. Akbostanci, E. Dynamics of the trade balance: The Turkish J-curve. Emerg. Mark. Financ. Trade 2004, 40, 57–73. [Google Scholar] [CrossRef]
  54. Iyke, B.N.; Ho, S.-Y. The real exchange rate, the Ghanaian trade balance, and the J-curve. J. Afr. Bus. 2017, 18, 380–392. [Google Scholar] [CrossRef]
  55. Iyke, B.N.; Ho, S.-Y. Nonlinear effects of exchange rate changes on the South African bilateral trade balance. J. Int. Trade Econ. Dev. 2018, 27, 350–363. [Google Scholar] [CrossRef]
  56. Bahmani-Oskooee, M.; Usman, A.; Ullah, S. Asymmetric J-curve in the commodity trade between Pakistan and United States: Evidence from 41 industries. Eurasian Econ. Rev. 2020, 10, 163–188. [Google Scholar] [CrossRef]
  57. Kyophilavong, P.; Shahbaz, M.; Uddin, G.S. Does J-curve phenomenon exist in case of Laos? An ARDL approach. Econ. Model. 2013, 35, 833–839. [Google Scholar] [CrossRef]
  58. Baek, J.; Yoon, J.H. The Korea-Vietnam trade and the bilateral exchange rate: Asymmetric evidence from commodity trade data. Aust. Econ. Pap. 2023, 62, 124–148. [Google Scholar] [CrossRef]
  59. Strobl, C.; Boulesteix, A.L.; Kneib, T.; Augustin, T.; Zeileis, A. Conditional variable importance for random forests. BMC Bioinform. 2008, 9, 307. [Google Scholar] [CrossRef]
  60. McKenzie, M.D. The impact of exchange rate volatility on international trade flows. J. Econ. Surv. 1999, 13, 71–106. [Google Scholar] [CrossRef]
  61. Nicita, A. Exchange rates, international trade and trade policies. Int. Econ. 2013, 135, 47–61. [Google Scholar] [CrossRef]
  62. Barkoulas, J.T.; Baum, C.F.; Caglayan, M. Exchange rate effects on the volume and variability of trade flows. J. Int. Money Financ. 2002, 21, 481–496. [Google Scholar] [CrossRef]
  63. Auboin, M.; Ruta, M. The relationship between exchange rates and international trade: A literature review. World Trade Rev. 2013, 12, 577–605. [Google Scholar] [CrossRef]
Figure 1. Distribution of the impact of three features on the trade balance ( T B ) in Bulgaria, analyzed through three different methods.
Information 15 00156 g001
Figure 2. Distribution of the effectiveness of three features on the trade balance ( T B ) in Australia, examined through three distinct methods.
Information 15 00156 g002
Figure 3. Effectiveness distribution of three features on trade balance ( T B ) of OECD group country using three methods.
Information 15 00156 g003
Figure 4. Effectiveness distribution of three features on trade balance ( T B ) of Non-OECD group countries using three methods.
Information 15 00156 g004
Figure 5. Effectiveness distribution of three features on trade balance ( T B ) using three methods.
Information 15 00156 g005
Table 1. Case study for the experiments of the proposed method’s evaluation.
No.Case StudyNumber of CountriesCountry Name
1Single country2Bulgaria and Australia are randomly selected
for visualization results
2OECD group17Australia, Canada, Switzerland, Chile, Colombia, Costa Rica,
Czech Republic, Denmark, United Kingdom, Hungary, Iceland,
Japan, Korea, Rep., Mexico, Norway, New Zealand, Sweden
3Non-OECD group61Albania, Armenia, Azerbaijan, Benin, Bangladesh, Bulgaria,
Belarus, Bolivia, Brazil, Brunei Darussalam, Botswana, China,
Cote d’Ivoire, Cameroon, Congo, Rep., Dominican Republic,
Algeria, Egypt, Arab Rep., Fiji, Ghana, Gambia, The, Guatemala,
Hong Kong SAR, China, Honduras, Haiti, Indonesia, India,
Jamaica, Kazakhstan, Kenya, Macao SAR, China, Morocco,
Madagascar, Mali, Mongolia, Mauritius, Malaysia, Niger,
Nigeria, Pakistan, Peru, Philippines, Paraguay, Romania,
Russian Federation, Sudan, Singapore, Solomon Islands,
Eswatini, Seychelles, Togo, Thailand, Tonga, Tunisia, Turkiye,
Tanzania, Uganda, Ukraine, Uruguay, Vanuatu, South Africa
4Panel country data78Albania; Armenia; Australia; Azerbaijan; Benin; Bangladesh;
Bulgaria; Belarus; Bolivia; Brazil; Brunei Darussalam; Botswana;
Canada; Switzerland; Chile; China; Cote d’Ivoire; Cameroon;
Congo, Rep.; Colombia; Costa Rica; Czechia; Denmark;
Dominican Republic; Algeria; Egypt; Arab Rep.; Fiji;
United Kingdom; Ghana; Gambia, The; Guatemala;
Hong Kong SAR China; Honduras; Haiti; Hungary; Indonesia;
India; Iceland; Jamaica; Japan; Kazakhstan; Kenya;
Korea, Rep.; Macao SAR, China; Morocco; Madagascar; Mexico;
Mali; Mongolia; Mauritius; Malaysia; Niger; Nigeria; Norway;
New Zealand; Pakistan; Peru; Philippines; Paraguay; Romania;
Russian Federation; Sudan; Singapore; Solomon Islands; Sweden;
Eswatini; Seychelles; Togo; Thailand; Tonga; Tunisia; Turkiye;
Tanzania; Uganda; Ukraine; Uruguay; Vanuatu; South Africa
Disclaimer/Publisher’s Note: The statements, opinions and data contained in all publications are solely those of the individual author(s) and contributor(s) and not of MDPI and/or the editor(s). MDPI and/or the editor(s) disclaim responsibility for any injury to people or property resulting from any ideas, methods, instructions or products referred to in the content.

