Article

Economic Scheduling Model of an Active Distribution Network Based on Chaotic Particle Swarm Optimization

1
Hebei Key Laboratory of Industrial Intelligent Perception, North China University of Science and Technology, Tangshan 063210, China
2
Research Academy for Rural Revitalization of Zhejiang Province, Zhejiang A&F University, Hangzhou 311300, China
3
College of Mathematics and Computer Science, Zhejiang A&F University, Hangzhou 311300, China
*
Authors to whom correspondence should be addressed.
Information 2024, 15(4), 225; https://doi.org/10.3390/info15040225
Submission received: 27 March 2024 / Revised: 13 April 2024 / Accepted: 15 April 2024 / Published: 17 April 2024
(This article belongs to the Special Issue Optimization Algorithms for Engineering Applications)

Abstract

:
With the continuous increase in global energy demand and growing environmental awareness, the utilization of renewable energy has become a worldwide consensus. In order to address the challenges posed by the intermittent and unpredictable nature of renewable energy in distributed power distribution networks, as well as to improve the economic and operational stability of distribution systems, this paper proposes the establishment of an active distribution network capable of accommodating renewable energy. The objective is to enhance the efficiency of new energy utilization. This study investigates optimal scheduling models for energy storage technologies and economic-operation dispatching techniques in distributed power distribution networks. Additionally, it develops a comprehensive demand response model, with real-time pricing and incentive policies aiming to minimize load peak–valley differentials. The control mechanism incorporates time-of-use pricing and integrates a chaos particle swarm algorithm for a holistic approach to solution finding. By coordinating and optimizing the control of distributed power sources, energy storage systems, and flexible loads, the active distribution network achieves minimal operational costs while meeting demand-side power requirements, striving to smooth out load curves as much as possible. Case studies demonstrate significant enhancements during off-peak periods, with an approximately 60% increase in the load power overall elevation of load factors during regular periods, as well as a reduction in grid loads during evening peak hours, with a maximum decrease of nearly 65 kW. This approach mitigates grid operational pressures and user expense, effectively enhancing the stability and economic efficiency in distribution network operations.

1. Introduction

There is a continuous transition of the energy consumption structure from non-renewable sources such as fossil fuels to renewable energy sources. The major objectives of the global energy revolution include the extensive development and utilization of renewable energy sources, increasing the effective utilization rate of renewable energy, ensuring the supply and security of renewable energy, and reducing environmental pollution.
At present, renewable energy is progressively emerging as a vital energy source in active distribution grids [1]. The generation methods of distributed generation systems utilizing renewable energy sources mainly consist of photovoltaic (PV) and wind power generation. Both are significantly influenced by weather conditions and seasonal factors. Moreover, their generation periods differ. Wind power generation exhibits anti-peak characteristics with greater distribution fluctuations, mainly during the nighttime, while photovoltaic generation [2] predominantly occurs during daylight hours, complementing the temporal characteristics of wind power generation. At present, active distribution grids can manage power flow through the network topology and actively control local distributed energy resources. This enhances the distribution grid’s capacity to accommodate renewable energy sources and ensure power quality and supply reliability. However, due to the randomness and volatility of renewable energy sources, which contribute to increased peak-to-valley disparities in the distribution system, there are greater peak load pressures, resulting in the phenomenon of “curtailment of solar power and wind power.” Demand-side management plays an important role in enhancing the stability of the power grid system when integrating renewable energy sources. It achieves this by improving end-user electricity efficiency, altering consumption patterns, and alleviating electricity demand pressures. The economic dispatch of distributed power grids is a significant research area, involving a coordinated economic scheduling and management between distributed energy resources (such as solar, wind, and energy storage systems) and conventional power systems. The platform for power quality management in distributed power grids [3,4] has emerged as a significant technology for harnessing renewable energy, offering vast developmental potential and wide-ranging applications. In the current context of power market liberalization, a comprehensive demand response, as a nascent business model in the optimization scheduling of distributed power grids [5], holds a vast potential for development. The optimal and efficient dispatch of demand-side resources in distributed power grids has become a focal point of research for experts and scholars, both domestically and internationally. Further research is needed to investigate the comprehensive and optimal algorithms for multi-objective coordination optimization in active distribution networks [6], as well as for a deeper investigation into the cost reduction aspects of distributed storage and optimization strategies for demand response mechanisms under a distributed power source integration.
The primary focus of the current research is on the degree of demand-side response and the integration of renewable energy sources with unique characteristics, such as wind and solar energy—on the one hand, actively adjusting the flexibility of the demand side to enhance user satisfaction, while establishing an economic scheduling model to policy-direct the comprehensive demand response capability on the user side; on the other hand, leveraging the advantages of scheduling mechanisms to complement the active grid and improve the utilization of renewable energy sources. The current research places significant emphasis on optimization strategies that are based on demand response mechanisms. There is an excessive focus on the responsiveness of the demand side, using adjustment strategies or user satisfaction as the main means, without considering economic scheduling advantages. Additionally, it overlooks the output characteristics and limitations of renewable energy sources, which can lead to excessive dissipation and impact the overall smooth operation of the grid.
Based on the above, in order to establish a more coherent, intelligent, and interactive “source-grid-load-storage-charge” paradigm in the new distribution system, it is necessary to integrate power market mechanisms and thoroughly explore the comprehensive demand response potential on the user side, for optimal economic optimization scheduling [7]. In this paper, an economic scheduling model based on a real-time electricity price response mechanism, based on a price and incentive policy, is established. This model utilizes time-of-use electricity pricing as a control measure, with the objective of minimizing load peak–valley differentials within a comprehensive demand response framework. To enhance the stability and economic efficiency of distribution network operations, the integration of a chaotic particle swarm optimization algorithm is introduced for a holistic approach to solution finding, thereby further reducing the operational costs of distributed power grids and improving the utilization of clean energy.

2. Related Literature

The literature related to this research topic can be broadly divided into four main areas. The first area is the study of active distribution networks. The active distribution network is a new solution for the flexible use of distributed energy, such as renewable energy, controllable loads, energy storage systems, etc. It can not only stabilize the safety of the overall power grid operation but also ensure the rapid deployment of various energy dispatches. It is a new distribution network, in line with the current development trend of renewable energy and accompanied by intelligent solutions, such as timely deployment. The power grid can also offer an integrated deployment according to multiple optimization objectives. An advanced active network management aims to coordinate power generation and network and load optimization, while achieving an appropriate balance between operational expenditure (OPEX) and capital expenditure (CAPEX) [8]. The second area is the study of economic scheduling. Economic scheduling aims to optimize the economy of a system by synthesizing the operating costs and profits of multiple pieces of equipment. Generally, reducing the operating costs and profits is the main scheduling goal. The third area is the study of chaotic particle swarm optimization. Compared with classical particle swarm optimization, chaotic particle swarm optimization adds chaotic mapping to facilitate a global solution. After comparing the solution targets, the optimal solution can be implemented, and an overall optimization can be achieved. The fourth area is research on demand response, extending customer participation to the field of the power system and analyzing the paradigm shift of the power system from a unidirectional operation to an interactive operation due to the progress of smart grid technology [9]. In the expected development trend, the demand side will be an important means of maintaining the stability of the power grid and adjusting the operation situation.

2.1. Research Status of Active Distribution Networks

Recent advancements in active distribution networks underscore the paradigm shift towards integrated, dynamic grid management systems, incorporating distributed generation (DG) optimization, substation reinforcement, and line expansion.
Koutsoukis et al. [10] proposed an innovative and comprehensive planning framework that utilizes active distributed generation (DG) management to identify optimal deployment strategies, encompassing location selection, capacity determination, and investment timing within the planning horizon. Xiang et al. [8] conducted a thorough analysis of conventional planning methodologies, highlighting their limitations and suggesting a multidimensional approach to enhance active distribution network planning. This framework effectively addresses the technological challenges and outlines the evolutionary trajectory of network development. Yi et al. [11] emphasized the critical role of active distribution networks in facilitating renewable energy integration, presenting strategies to manage the uncertainty of renewable sources, while maximizing their utility. Koutsoukis et al. [12] improved the planning method to incorporate uncertainties in load and renewable generation forecasts, using an opportunity-constrained programming model to optimize network investments. Wan et al. [13] proposed a mixed-integer second-order cone programming approach to optimizing active distribution networks, by considering a collaboration among distributed flexible resources and conducting a case analysis, resulting in a significant reduction of 47.9% in the daily operating costs and 75.2% in carbon emissions for ADNs. Jiang et al. [14] proposed a robust optimization model for regional network planning, by incorporating economic indicators to evaluate the benefits of new energy subsidies and operational efficiency, while also summarizing the physical constraints of various devices in regional active distribution networks. Kong et al. [15] proposed an optimal strategy for targeting active management costs related to source–network–load, investigated cost optimization strategies in active management, with a focus on load response and pricing incentives, and developed an opportunity-constrained optimization model that incorporates Monte Carlo simulations to address uncertainties. Wang et al. [16] proposed a post-fault network reconstruction strategy, aiming to optimize the selection strategy for segmented switches and grid-connected switches following distribution network faults. This model enhances the utilization of distributed energy, maximizes the potential for power recovery in distribution networks, and minimizes outage times for production–consumption groups.
With the continuous development of the power grid and renewable energy, the controllable resources of the distribution network are increasing. Traditional one-way, passive distribution networks are gradually evolving into bidirectional, dynamically coordinated networks. However, the inherent randomness and variability of renewable energy pose a significant challenge to the safe and stable operation of distribution networks. Energy storage systems can provide additional energy storage and release capacity in the distribution network, meeting the priority conditions of economic scheduling and taking economic cost as the first priority. The economic dispatching of active distribution networks mainly relies on demand-side response as the economic dispatching mechanism to achieve the best economic dispatching goal. In order to strengthen the economic benefits of dispatches, experts and scholars at home and abroad have carried out the following studies.

2.2. Current Situation of Economic Dispatch Research

Li et al. [17] explored the interrelationship between economic scheduling and reactive power scheduling and proposed a cooperative optimization strategy for dynamic power grid scheduling, with two optimization methods. They also improved the multi-objective hybrid Bat algorithm by using an unbalanced distribution method, which is suitable for dynamic power grid scheduling problems. At the same time, they investigated the influence of wind power integration on power grid dispatching and demonstrated the effectiveness of their strategy through real-time calculations. Jian et al. [18] provided a comprehensive description of distributed economic scheduling methods for power systems and discussed the system structure, performance requirements, and solution process. Additionally, they presented examples of the advantages and disadvantages of the existing economic scheduling algorithms, adding directional suggestions. Krishnamurthy et al. [19] emphasized that the core of the power generation economic scheduling problem lies in scheduling the output of the generator to meet the required load demand, while including equality and inequality constraints; adding multi-criteria scheduling methods will extend the single area and multi-area optimization of power system scheduling problems. Yalcino et al. [20] utilized the novel Hopfield neural network structure for unconstrained economic scheduling, considering transmission capacity constraints and other multi-economic scheduling problems. They realized multiple quadratic programming problems with equality and inequality constraints and tested them on different types of generator sets.
Compared with different economic dispatching schemes, multi-directional economic dispatching schemes based on the environmental benefit, energy loss, power efficiency, and other aspects are worth learning about. However, this paper focuses on the economic direction of economic dispatch—that is, when the response ability of the demand-side response is enhanced, the total income of the grid is increased, and the user’s daily electricity purchase cost decreases to achieve a win–win policy, which is the main trend of economic dispatch. At the same time, compared with simple economic scheduling based on the feedback of a fixed electricity price at a previous time, this paper emphasizes a real-time economic scheduling model, with strong feedback on the rise and fall of the electricity price; of course, the economic scheduling model needs to be paired with corresponding learning algorithms, such as the optimized particle swarm optimization algorithm mentioned in this paper, which can realize the real-time learning of economic scheduling, so as to facilitate accurate economic scheduling.

2.3. Research Status of Chaotic Particle Swarm Optimization

Cai et al. [21] discussed the application of a chaotic particle swarm optimization algorithm based on a logistic equation and Tent equation for solving economic scheduling problems under generator constraint. At the same time, they applied this algorithm to two power system working conditions. Compared with the traditional particle swarm optimization algorithm, the chaotic particle swarm optimization algorithm reduces the number of convergent iterations and the cost of solution generation, thereby potentially yielding significant economic benefits. Liu et al. [22] further solidified the link between a decentralized power supply and active distribution networks. They tackled the challenge of managing the computational load across multiple scenarios by creating a comprehensive time series model encompassing wind, photovoltaic, and load power dynamics. Their primary aim was to mitigate network losses and voltage fluctuations. At the same time, they introduced an enhanced simulated annealing particle swarm optimization algorithm. This algorithm initializes the population’s position and velocity based on ecological fitness, incorporates chaotic disturbance for inertia weight, and accelerates local search through dynamic parameter learning. Through practical simulation examples, they demonstrated the effectiveness and practicality of their approach. Huang [23] introduced a novel hybrid model that integrates vector regression chaotic mapping with the particle swarm optimization algorithm, to address a potential constraint inherent in the traditional particle swarm optimization method. It was observed that this constraint could lead to stagnation and reduced dynamism during the exploration of local optima, thereby adversely affecting prediction accuracy. The introduced approach seeks to bolster prediction efficacy, striving for a heightened precision in forecast outcomes. Peng et al. [24] proposed a chaotic particle swarm algorithm with a dual fitness value for handling equality constraints, aiming to address premature convergence and constraint-processing issues in particle swarm algorithms. By incorporating a particle mutation process based on chaos mapping and utilizing parametric equations to solve equality constraints, as well as considering inequality constraints through the use of dual fitness values, the algorithm enhances its global search capability for engineering models. Kuru et al. [25] emphasized that the chaotic particle swarm algorithm utilizes logistic mapping and Henon mapping as chaotic mappings to regulate the parameter values in the velocity update formula, facilitating the identification of critical voltage stability thresholds. Subsequently, the chaotic particle swarm algorithm has been further developed for the more efficient resolution of boundary value problems. Cai et al. [26] investigated the economic scheduling problem of the valve effect in power systems and proposed algorithms based on chaotic particle swarm optimization and sequential quadratic programming technology. The main optimization was achieved using chaotic particle swarm optimization, while the fine-tuning and improvement of results were carried out using quadratic programming. Finally, the study discusses the economic impact, solution quality, convergence, and computational efficiency of the proposed method, verifying its applicability and effectiveness in practical economic scheduling problems. Qin et al. [27] investigated a comparison between the L1 norm support vector machine and L2 norm support vector machine, and proposed a comprehensively improved double-positive norm support vector machine, which is suitable for analyzing data sets with small samples in each variable but a high dimensionality and correlation. However, the accuracy of the final experiment can be easily affected when selecting the training parameters of the model. Therefore, the chaotic particle swarm optimization algorithm is utilized to select the model parameters and assist in analyzing the data set, using the double-positive norm support vector machine. The experiment demonstrates that the improvement effect is significant.
The existing economic scheduling model proposes that the chaotic particle swarm optimization algorithm can effectively solve the economic scheduling problem, even when the optimization objectives are not identical. It is capable of achieving global solutions. Specifically, compared to the particle swarm algorithm, the addition of chaotic mapping enables the particle swarm algorithm to break free from fixed global solutions and integrate multi-directional constraints for global optimization. Chaotic mapping also facilitates global searching, thereby increasing the calculation speed and accuracy, while reducing costs. Therefore, in the economic scheduling model, chaotic particle swarm optimization demonstrates strong adaptability. Additionally, the chaotic particle swarm simplifies the user load demand-side response and uses evolutionary learning to simulate different load types’ responses to real-time electricity prices, in order to achieve optimal economic dispatch—maximizing grid benefits and minimizing user power purchase costs.

2.4. Demand Response Research Status

The realm of demand response (DR) has garnered considerable attention as a strategic component of grid management, aiming to bridge the gap between supply and demand through consumer engagement and technological integration.
Kwag et al. [9] utilized customer information as registration and engagement data for the demand response (DR), assessing customer response metrics and employing modeled information to manipulate and express certain DR constraints, accompanied by various status indicators. They proposed an optimal dispatch, integrating power generation and disaster recovery by minimizing system operating costs (including generation and disaster recovery costs) and adhering to generation and disaster recovery constraints. Yang et al. [28] established a peak–valley periodization model based on fuzzy clustering and iterative techniques, with the objective of maximizing the silhouette coefficient. They introduced a multi-objective electricity time–price optimization model considering the interests of both the supply and demand sides, employing a third-order Hermite interpolation algorithm to fit the Pareto front curve of the dual-objective function. They utilized a backpropagation neural network algorithm to derive the time–price corresponding to reliability demands, and validated the proposed model and algorithm using the RBTS system, demonstrating their method’s rationality and effectiveness. Yu et al. [29] developed a dynamic economic model combining Event-Driven Response Programs (EDRPs) with time-of-use (TOU) schemes. Considering concepts of customer utility functions and demand elasticity, they devised various DRP alternative schemes, allowing independent system operators to select the optimal DRP reflecting their perspectives. Multiple Attribute Decision Making (MADM) was identified as an effective method for enhancing customer satisfaction and load curve characteristics. Lynch et al. [30] designed a novel approach to estimate the contribution of load transfer demand response resources to system adequacy. They employed a mixed complementary model to simulate the electricity market, determining the impact of demand response participation in the capacity market on market outcomes. Their findings suggested that demand response participation in capacity markets could alleviate some market challenges associated with renewable energy integration, particularly the “missing money” issue. Won et al. [31] analyzed the electricity demand reduction effects exhibited by demand response plans in the smart grid environment. Their analysis encompassed target demand response systems, including incentive-based load control systems and price-based demand response systems currently implemented in South Korea. Samimi et al. [32] proposed a real-time interactive pricing scheme, utilizing a dual decomposition based on Lagrangian relaxation to separate the social welfare optimization problem from numerous consumer sub-problems into a retailer problem. They employed a gradient projection method for solving it, aiming to maximize the social welfare of participants in real-time demand response schemes in smart grids. Wang et al. [33] presented a multi-objective optimal scheduling strategy for residential load resources, with objectives including enhancing user comfort, user income, and load aggregator revenue. Considering various disaster resilience potentials and residential user participation willingness, they constructed a comprehensive evaluation system for user DR potentials. They conducted a simulation analysis using real regional residential load data, demonstrating that their optimization model could effectively enhance user satisfaction, while ensuring load aggregator and user benefits.
Based on the above research, considering the user’s expectation of the reliable operation of active distribution networks, the economic scheduling optimization of the active distribution network is carried out, the demand-side response is used as the response method, and the chaotic particle swarm optimization algorithm is used for overall learning to achieve the economic optimal goal.

3. Method

3.1. Chaotic Particle Swarm Optimization

Chaotic particle swarm optimization (CPSO) is the enhanced version of the traditional particle swarm optimization (PSO) algorithm, which uses the principles of chaos theory to explore space and avoid local optimality. CPSO achieves this by integrating nonlinear chaotic mapping functions into the velocity-updating equations of particles. These chaotic functions exhibit nonlinearity, unpredictability, and sensitivity to initial conditions, enabling CPSO to explore the search space more dynamically. The velocity update equation for CPSO can be expressed as follows:
v i j t + 1 = w v i j t + c 1 r 1 p b e s t i j x i j t + c 2 r 2 g b e s t j x i j t + α f ( u v i j t )
where v i j t represents the velocity of particle i in time t of dimension j , and x i j t represents the position of particle i in time t of dimension j . p b e s t i j represents the best position visited by particle i in the j dimension, and g b e s t j represents the best position visited by any particle in the j dimension. Of course, in the whole calculation process, the representative particles are mainly the response parameters on the demand side. w is the inertia weight, c 1 c 2 is the acceleration constant, and r 1 r 2 is a random number from 0 to 1. α is the scale coefficient. f is the chaotic mapping function, just like q t above, that is, the real-time electricity price in the t period. The chaotic mapping function is the optimization core of chaotic particle swarms, and the mapping form is as follows:
q t + 1 = α q ( t ) ( 1 q t )
When α = 4 , the system enters a chaotic state, and the chaos variable traverses all states between [0, 1]. Therefore, in the process of traversal, it will have more advantages than a random search for obtaining the local optimal solution in a comprehensive manner. Of course, the constraint conditions need to be addressed later.

3.2. Economic Dispatching Design of Distribution Networks

First, establish a comprehensive demand response model under a real-time electricity pricing mechanism. The load at time period t can be classified into three categories: easily shiftable load, substitutable load, and rigid load. Then, mathematically model each type of load based on its characteristics to obtain the response load model under real-time electricity pricing. Next, develop an economic dispatch model for hybrid AC/DC distribution networks with the objective of maximizing revenue. The constraints include a power balance constraint, bidirectional converter power limit, interruption load capacity limit, real-time electricity pricing constraint, remaining available capacity constraint, constraints on the output limits of distributed energy resources energy storage systems, and constraints on controllable unit ramp rates, among others. Finally, solve the model using the chaotic particle swarm optimization algorithm to obtain the corresponding results. The optimization process of the particle swarm optimization algorithm is shown in Figure 1.

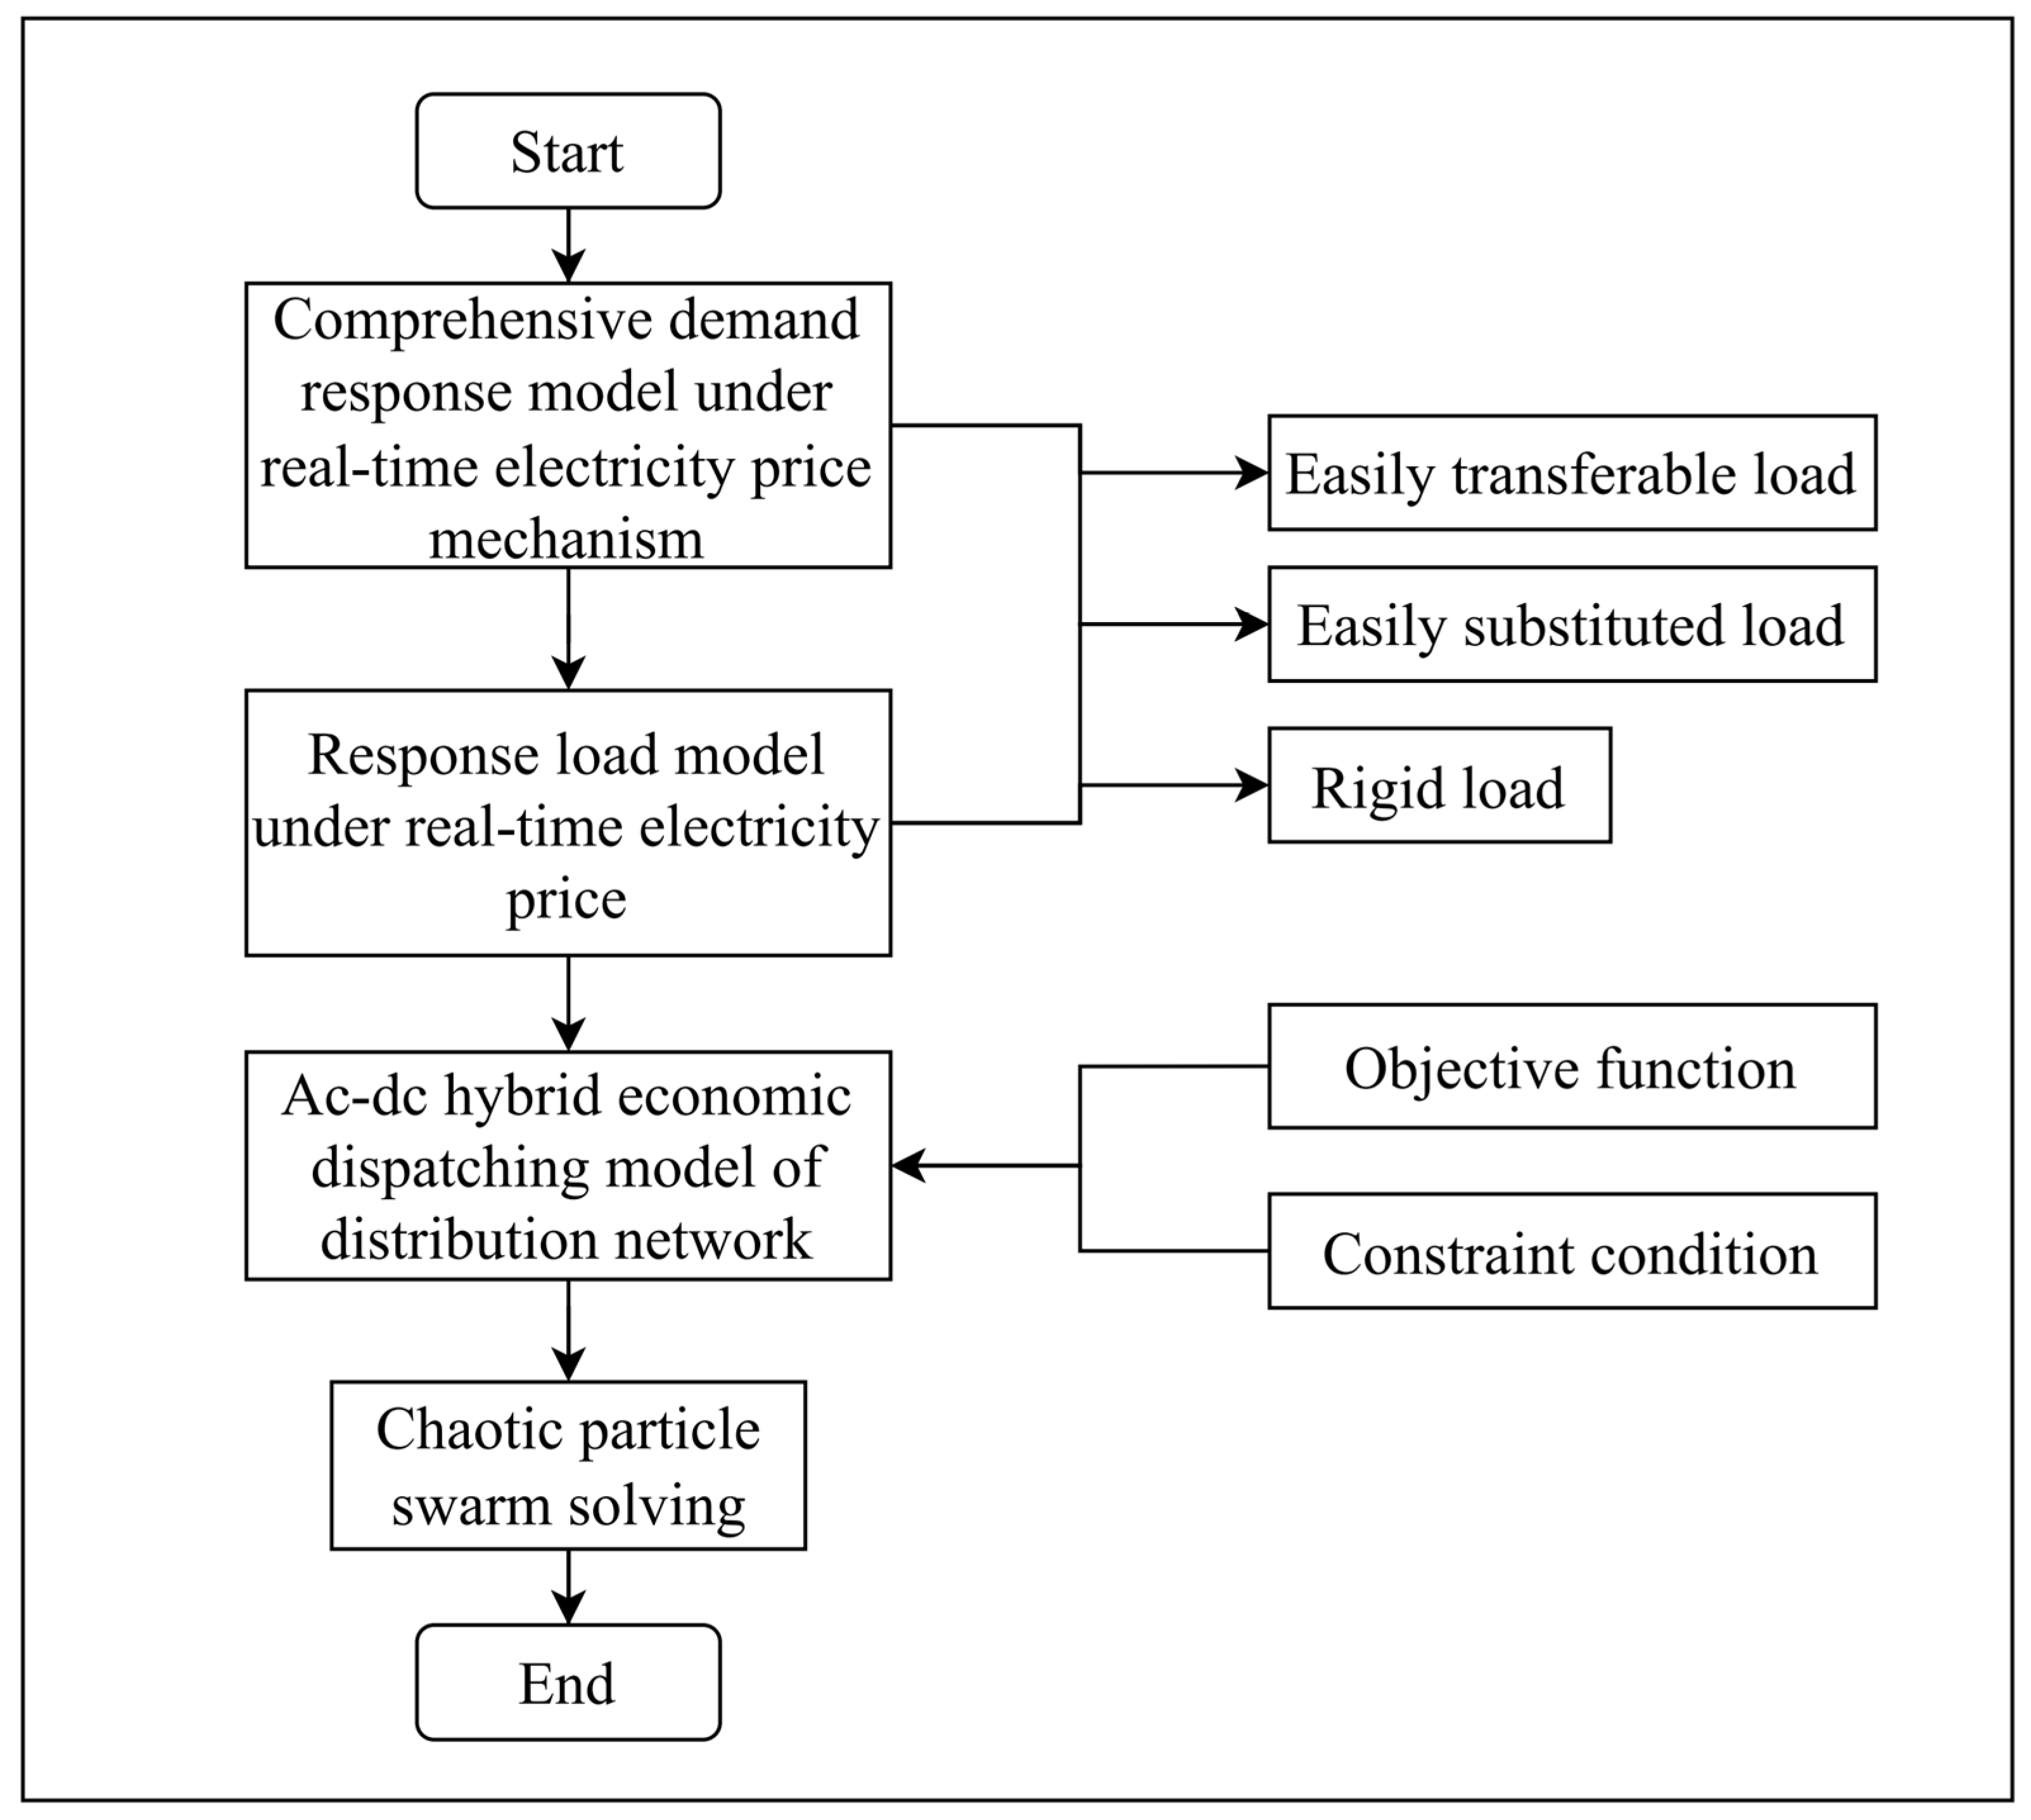
3.3. Optimal Scheduling Model of Demand-Side Response Active Distribution Network

First, establish the response model of load to price. The load P L ( t ) of the distribution network at time period ( t ) under time-of-use pricing is divided into the following three categories. As shown in the equation below:
P L ( t ) = P L I ( t ) + P L I I ( t ) + P L I I I ( t )
The equation above categorizes the load ( P L ( t ) ) into three types: the first type is the easily transferable load, denoted as a type I load ( P L I ( t ) ), where user response to changes in electricity price typically involves shifting a portion of the load between different time periods, and thus a load transfer rate model can be applied; the second type is the easily substitutable load, denoted as a type II load ( P L I I ( t ) ), meaning user response to changes in electricity price often involves conserving energy or substituting part of the load with other sources; the third type is the rigid load, denoted as a type III load ( P L I I I ( t ) ), where the impact of price changes on this portion of the load can be neglected.
Type I load:
To begin with, the day is divided into T time periods, where I = i 1 , i 2 , , i m represents the periods when real-time electricity prices exceed the original prices (with m being the number of such periods). Similarly, J = j 1 , j 2 , , j n denotes the periods when real-time electricity prices fall below the original prices (with n representing the number of such periods). According to this arrangement, there is an increase in real-time electricity prices during time period t 1 and a decrease during time period t 3 . The transfer out and the absorption of charges can be mathematically expressed as follows.
Δ P L t 1 , t 2 = f Δ p t 1 Δ p t 2 P L t 1 / k J   | Δ p ( k ) | Δ P L t 4 , t 3 = f Δ p t 3 Δ p t 4 P L t 3 / k I   | Δ p ( k ) |
where t 1 , t 4 I , t 2 , t 3 J . ( Δ p ( t ) ) represents the difference between the real-time electricity price set for time period ( t ) and the original base price. ( Δ P L i , j ) represents the transfer of load from time period ( i ) to time period ( j ). ( f Δ p ) denotes the load transfer rate function. The equation below describes the relationship between the load transfer rate in each time period and the change in electricity price, categorizing the reflection of load transfer rates on electricity prices into a dead zone, linear zone, and saturation zone.
f Δ p =    0   , 0 Δ p a K Δ p a , a Δ p f m a x K + a    f m a x , Δ p f m a x / K + a
where ( Δ p ) represents the absolute value of the change in electricity price. ( f m a x ) is the maximum load transfer rate in the protection zone. a is the dead zone threshold. ( f m a x / K + a ) denotes the inflection point in the saturation zone, where ( K ) is the slope of the linear zone transfer rate curve.
Based on the real-time electricity price, compute the load transfer distribution for each time period to determine the load response level for the type I load. Equation (4) is used for the calculation when the price at time ( t ) is higher than the original price, while Equation (5) is utilized when the real-time electricity price in time period ( t ) is lower than the original price.
P L I λ ( t ) = P L I t k J   Δ P L I t , k     t I
P L I λ ( t ) =   P L I t + k I   Δ P L I t , k     t J
where ( P L I λ ( t ) ) represents the level of the type I load after responding to time-of-use electricity prices for time period ( t ).
Type II load:
This load category approximates the demand response to price changes in time period ( t ) using the price elasticity coefficient ( e s t ). Define the elasticity matrix ( E ) as shown in the following equation:
E = e s t   T T
e s t = ( Δ P L ( s ) / P L ( s ) ) / ( Δ p ( t ) / p ( t ) )
where ( P L ( s ) ) represents the original load power of the type II load in time period ( s ) , while ( Δ P L ( s ) ) denotes the change in load power response to time-of-use electricity prices in time period ( s ). The diagonal elements of the elasticity matrix are all negative, representing self-elasticity coefficients, while the remaining elements are positive, indicating cross-elasticity coefficients. ( p ( t ) ) represents the original level of time-of-use electricity prices.
For a type II load, after implementing the real-time electricity price, the variation in load level for each time period is set, along with the responsive load ( P L I I λ ( t ) ), under the real-time electricity price. It can be expressed as follows:
Δ P L I I t P L I I t = t = 1 n   e s t Δ p ( t ) / p ( t )
P L I I λ t = Δ P L I I t + P L I I t    t = 1 , 2 , , T
Type III load:
The type III load is essentially defined as being inflexible, assuming that its load demand is not influenced by the implementation of real-time electricity prices. The responsive load under the real-time electricity price can be formulated as follows:
P L I I I λ t = P L I I I ( t )
In summary, the comprehensive real-time price demand response model for the three types of loads can be represented by the responsive load ( P L λ t ) as shown in the following equation:
P L λ t = P L I λ t + P L I I λ t + P L I I I λ t
Building upon this, a demand-side response model based on the real-time electricity price mechanism is proposed to solve for the responsive load.

3.3.1. Objective Function

Then, the objective function is defined as the maximum profit of the efficient operation of the distribution network within a day, as shown in the following equation:
max F = R C t o t a l
where R represents the daily revenue of the active distribution network and C t o t a l represents the total operating cost of the distribution network within a day.
t = 1 T [ γ   q t P L t , λ + 1 γ α q t P L t , λ ]
where T represents the number of time periods within a day. ( P L t , λ ) represents the responsive load in time period t , which is determined by the real-time electricity price in the network. γ represents the proportion of interruptible load, and α represents the compensation price coefficient for the interruptible load. It is assumed that the proportion of the interruptible load remains stable. ( q t ) represents the real-time electricity price within time period t .
C t o t a l = t = 1 T [   f M T P M T t + f F C P F C t + i = 1 M   f O M i P i t + P g r i d t q g r i d t + β q t P c u t t + q t k = 1 l 1   P k t 2 + Q k t 2 u k t 2 R k + m = 1 l 2   P m t 2 u m t 2 R m ]
where ( f M T P M T t ) represents the fuel cost function of internal combustion engines. ( P M T t ) denotes the output of internal combustion engines in time period t . ( f F C P F C t ), on the other hand, represents the fuel cost function of fuel cells, while ( P F C t ) represents the output of fuel cells in time period t . ( f O M i ) represents the operating and maintenance cost function of the i-th device, where M represents the total number of devices. ( P i t ) represents the output of the i-th device in time period t , for which maintenance costs are incurred. ( P g r i d t ) represents the power exchange between the distribution network and the external grid in time period t , while ( q g r i d t ) represents the time-based electricity price of the external grid in time period t . β represents the interruption compensation coefficient, where the compensation price is calculated as a multiple of the specified price. ( P c u t t ) represents the total interrupted load in time period t . ( l 1 ) represents the total number of AC branches, while ( l 2 ) represents the total number of DC branches. P k t , Q k t denote the active power and reactive power transmitted on the k-th AC branch in time period t , respectively. u k t , u m t represent the effective voltage values of the k-th AC branch and the m-th DC branch, respectively. ( R m ) represents the resistance of the m-th DC branch.

3.3.2. Constraint Condition

Power balance constraint:
This paper establishes power balance constraints for the distribution network model. In the distribution network, the power balance constraints include both AC and DC power balance constraints, as shown in the following equations:
P g r i d t + P M T t + P W T t + P c u t , A C t = P I L C t + P L A C t , λ + P B A C t
P B A C t P g r i d t + P M T t + P c u t , A C t = 0
P g r i d t + P P V t + P S B t + P F C t + P c u t , D C t = P L D C t , λ + P B D C t
P B D C t P F C t + P S B t + P c u t , D C t = 0
where ( P L A C t , λ ) represents the load responsive to real-time electricity prices on the AC side in time period t . ( P L D C t , λ ) represents the load responsive to real-time electricity prices on the DC side in time period t . ( P S B t ) represents the output of the battery on the DC side in time period t , where positive and negative values indicate charging and discharging, respectively. ( P c u t , A C t ) represents the power of the interrupted load on the AC side in time period t , and ( P c u t , D C t ) represents the power of the interrupted load on the DC side in time period t . When formulating real-time electricity prices in highly penetrated distribution networks, if the output of controllable sources is uncertain but can meet the operational requirements independently, the controllable source output will be stored. In this case, the imbalance power on both the AC and DC sides is greater than or equal to 0. However, if the output of controllable sources is uncertain but cannot meet the operational requirements, the controllable source output will be used, and electricity will be purchased from the external grid. In this situation, the imbalance power on both the AC and DC sides is equal to 0. The imbalance power should also satisfy the following constraints:
P B A C t 0 , P B D C t 0
Upper limit constraint on interrupted load capacity:
P c u t , A C t P c u t , A C m a x , P c u t , D C t P c u t , D C m a x
where P c u t , A C m a x   a n d   P c u t , D C m a x represent the interruptible load capacities that users have signed for, for the AC and DC sides, respectively.
Real-time electricity price formulation constraint:
t = 1 T P L A C t , λ + P L D C t , λ q t t = 1 T P L A C t , λ + P L D C t , λ t = 1 T P L A C t , λ + P L D C t , λ q g r i d t t = 1 T P L A C t , λ + P L D C t , λ
In the aforementioned formulas, it is demonstrated that, under the real-time electricity price mechanism, the average purchase price of electricity for users is lower than the price of purchasing electricity from the external grid.
Constraint on remaining available power capacity:
The above formulas demonstrate that, under the real-time electricity price mechanism, it is proven that the average electricity purchase price for users is lower than the price of purchasing electricity from the external grid.
Constraint on remaining available power capacity:
P c u t , A C t P g r i d m a x + P M T m a x P g r i d t P M T t = 0
P c u t , D C t P F C m a x + P S B m a x P F C t P S B T   = 0
where ( P g r i d m a x ) represents the upper limit of the power exchange between the AC side and the external grid. ( P F C m a x ), ( P S B m a x ), and ( P M T m a x ) are the discharge power limits for fuel cells, batteries, and internal combustion engines, respectively.
Constraint on node voltage:
U i   m i n U i U i   m a x
where ( U i   m i n ) and ( U i   m a x ) represent the lower and upper limits, respectively, of the nodal voltage.
Branch current constraints:
I j I j   m a x
In the above equations, ( I j   m a x ) represents the maximum current value that can flow through branch ( j ).
Constraints on controllable DG (distributed generation) output:
The ramp rate constraint for controllable DG is as follows:
P D G , i ( t 1 ) P D G , i ( t ) D D G , i   P D G , i ( t ) P D G , i ( t 1 ) U D G , i
In the above equations, ( P D G , i ( t ) ) and ( P D G , i ( t 1 ) ) represent the power of controllable DG ( i ) at time ( t ) and ( t 1 ) respectively. ( U D G , i ) and ( D D G , i ) represent the upper and lower limits of the ramp rate for DG ( i ).
Constraints on energy storage operation:
Charge and discharge power constraints:
P E S S c h , i ( t ) P E S S c h , m a x   P E S S d i s , i ( t ) P E S S d i s , m a x
In the above equations, ( P E S S c h , i ( t ) ) and ( P E S S d i s , i ( t ) ) represent the maximum charging and discharging power of the energy storage system (ESS) during time period ( t ).
Constraints on state of charge (SOC) upper and lower limits:
S O C i   m i n S O C i ( t ) S O C i   m a x
In the above equations, ( S O C i ( t ) ) represents the state of charge (SOC) of the energy storage system (ESS) at time (t), while ( S O C i   m i n ) and ( S O C i   m a x ) represent the minimum and maximum SOC values for the i-th energy storage device. Additionally, it is required that the initial and final SOC of the energy storage battery should be equal when the energy storage is completed.

4. Experiments

4.1. Solving the Optimization and Scheduling Model for Active Distribution Network with Demand Response Referred

4.1.1. Constraint Processing

In order to prevent the controllable distributed generation (DG) from exceeding the upper and lower limits of its output, constraints on the ramp rate of the controllable DG are applied.
P D G , i t = max min P D G , i t , P D G , i t 1 + U D G , i P D G , i t 1 D D G , i
If the output of the controllable P D G , i t > P D G , i t 1 + U D G , i then the upper limit value is taken as P D G , i t 1 + U D G , i . On the other hand, if P D G , i t < P D G , i t 1 U D G , i then the lower limit value is taken as P D G , i t 1 U D G , i . This is done to prevent the excessive charging or discharging of energy storage systems.
These adjustments are made to ensure that the controllable DG operates within specified limits and avoid the overcharging or discharging of energy storage.
Additionally, if the state of charge (SOC) of the energy storage system, S O C i ( t + 1 )  >  S O C i   m a x then the upper limit value, S O C i   m a x is taken:
P E S S , i t = E e s s , i S O C i t S O C i   m a x η C , i
If the state of charge (SOC) of the energy storage system, S O C i ( t + 1 ) < S O C i   m i n then the lower limit value, S O C i   m i n is taken:
P E S S , i t = E e s s , i S O C i t S O C i   m a x η d , i

4.1.2. Solution Step

Step 1: Input the relevant parameters of the active distribution network, including the structural parameters of the distribution network, wind and solar power generation output data, and response parameters. The model employs a hybrid particle swarm optimization algorithm with 200 iterations, a learning speed reduction factor of 0.8, and incorporates 30 iterations of chaotic search.
Step 2: Initialize the demand response population by considering real-time electricity prices as the control target and randomizing both velocity and position to represent particles in demand response.
Step 3: Update the particle velocity and position using chaotic particle swarm optimization to optimize the peak-to-valley difference in load as an objective function.
Step 4: Verify if the demand response criteria are met. If the maximum iteration count is reached, obtain the optimal solution—which is represented by the load curve for the next day as output—while calculating cost based on electricity price. Otherwise, continue the computation.
Step 5: Initialize the population for optimization and scheduling. The controllable objects include controllable DGs, energy storage, and loads. Randomize the velocity and position of the optimization and scheduling population, and calculate the fitness of particles based on the objective function.
Step 6: Update the particle velocity and position, using the objective of minimizing the operating cost of the distribution network, to continue solving the scheduling model.
Step 7: Check if the conditions are met. If yes, output the optimal solution. Otherwise, continue the calculation.
For the load response model based on real-time electricity prices, a simulation and emulation of the power output are necessary to validate the capability of load response.

4.2. Example Simulation and Result Analysis

4.2.1. Simulation System and Parameter Setting

This study utilizes a model of a distribution network for residential load supply, where the lines in the network exhibit an impedance per unit of 0.642 + j0.101 Ω/km. The operational constraints encompass both wind and solar power generation systems, with an installed capacity of 1 MW each.
An energy storage system is also present, possessing technical parameters and a charging/discharging efficiency of 0.4 MW/(2 MW⋅h) and 0.96, respectively. The energy storage unit’s state-of-charge (SOC) range spans from 0.2 to 0.9, while the cost per unit electricity stored is set at 0.12 CNY/kWh. The reference electricity price varies throughout different pricing periods: from midnight until 7:00 a.m., it decreases to 0.48 CNY/kWh. From 9:00 a.m. to 11:00 a.m., it increases to 1.35 CNY/kWh. Throughout the afternoon hours (12:00 p.m.–18:00 p.m.), the electricity price is 0.9 CNY/kWh.

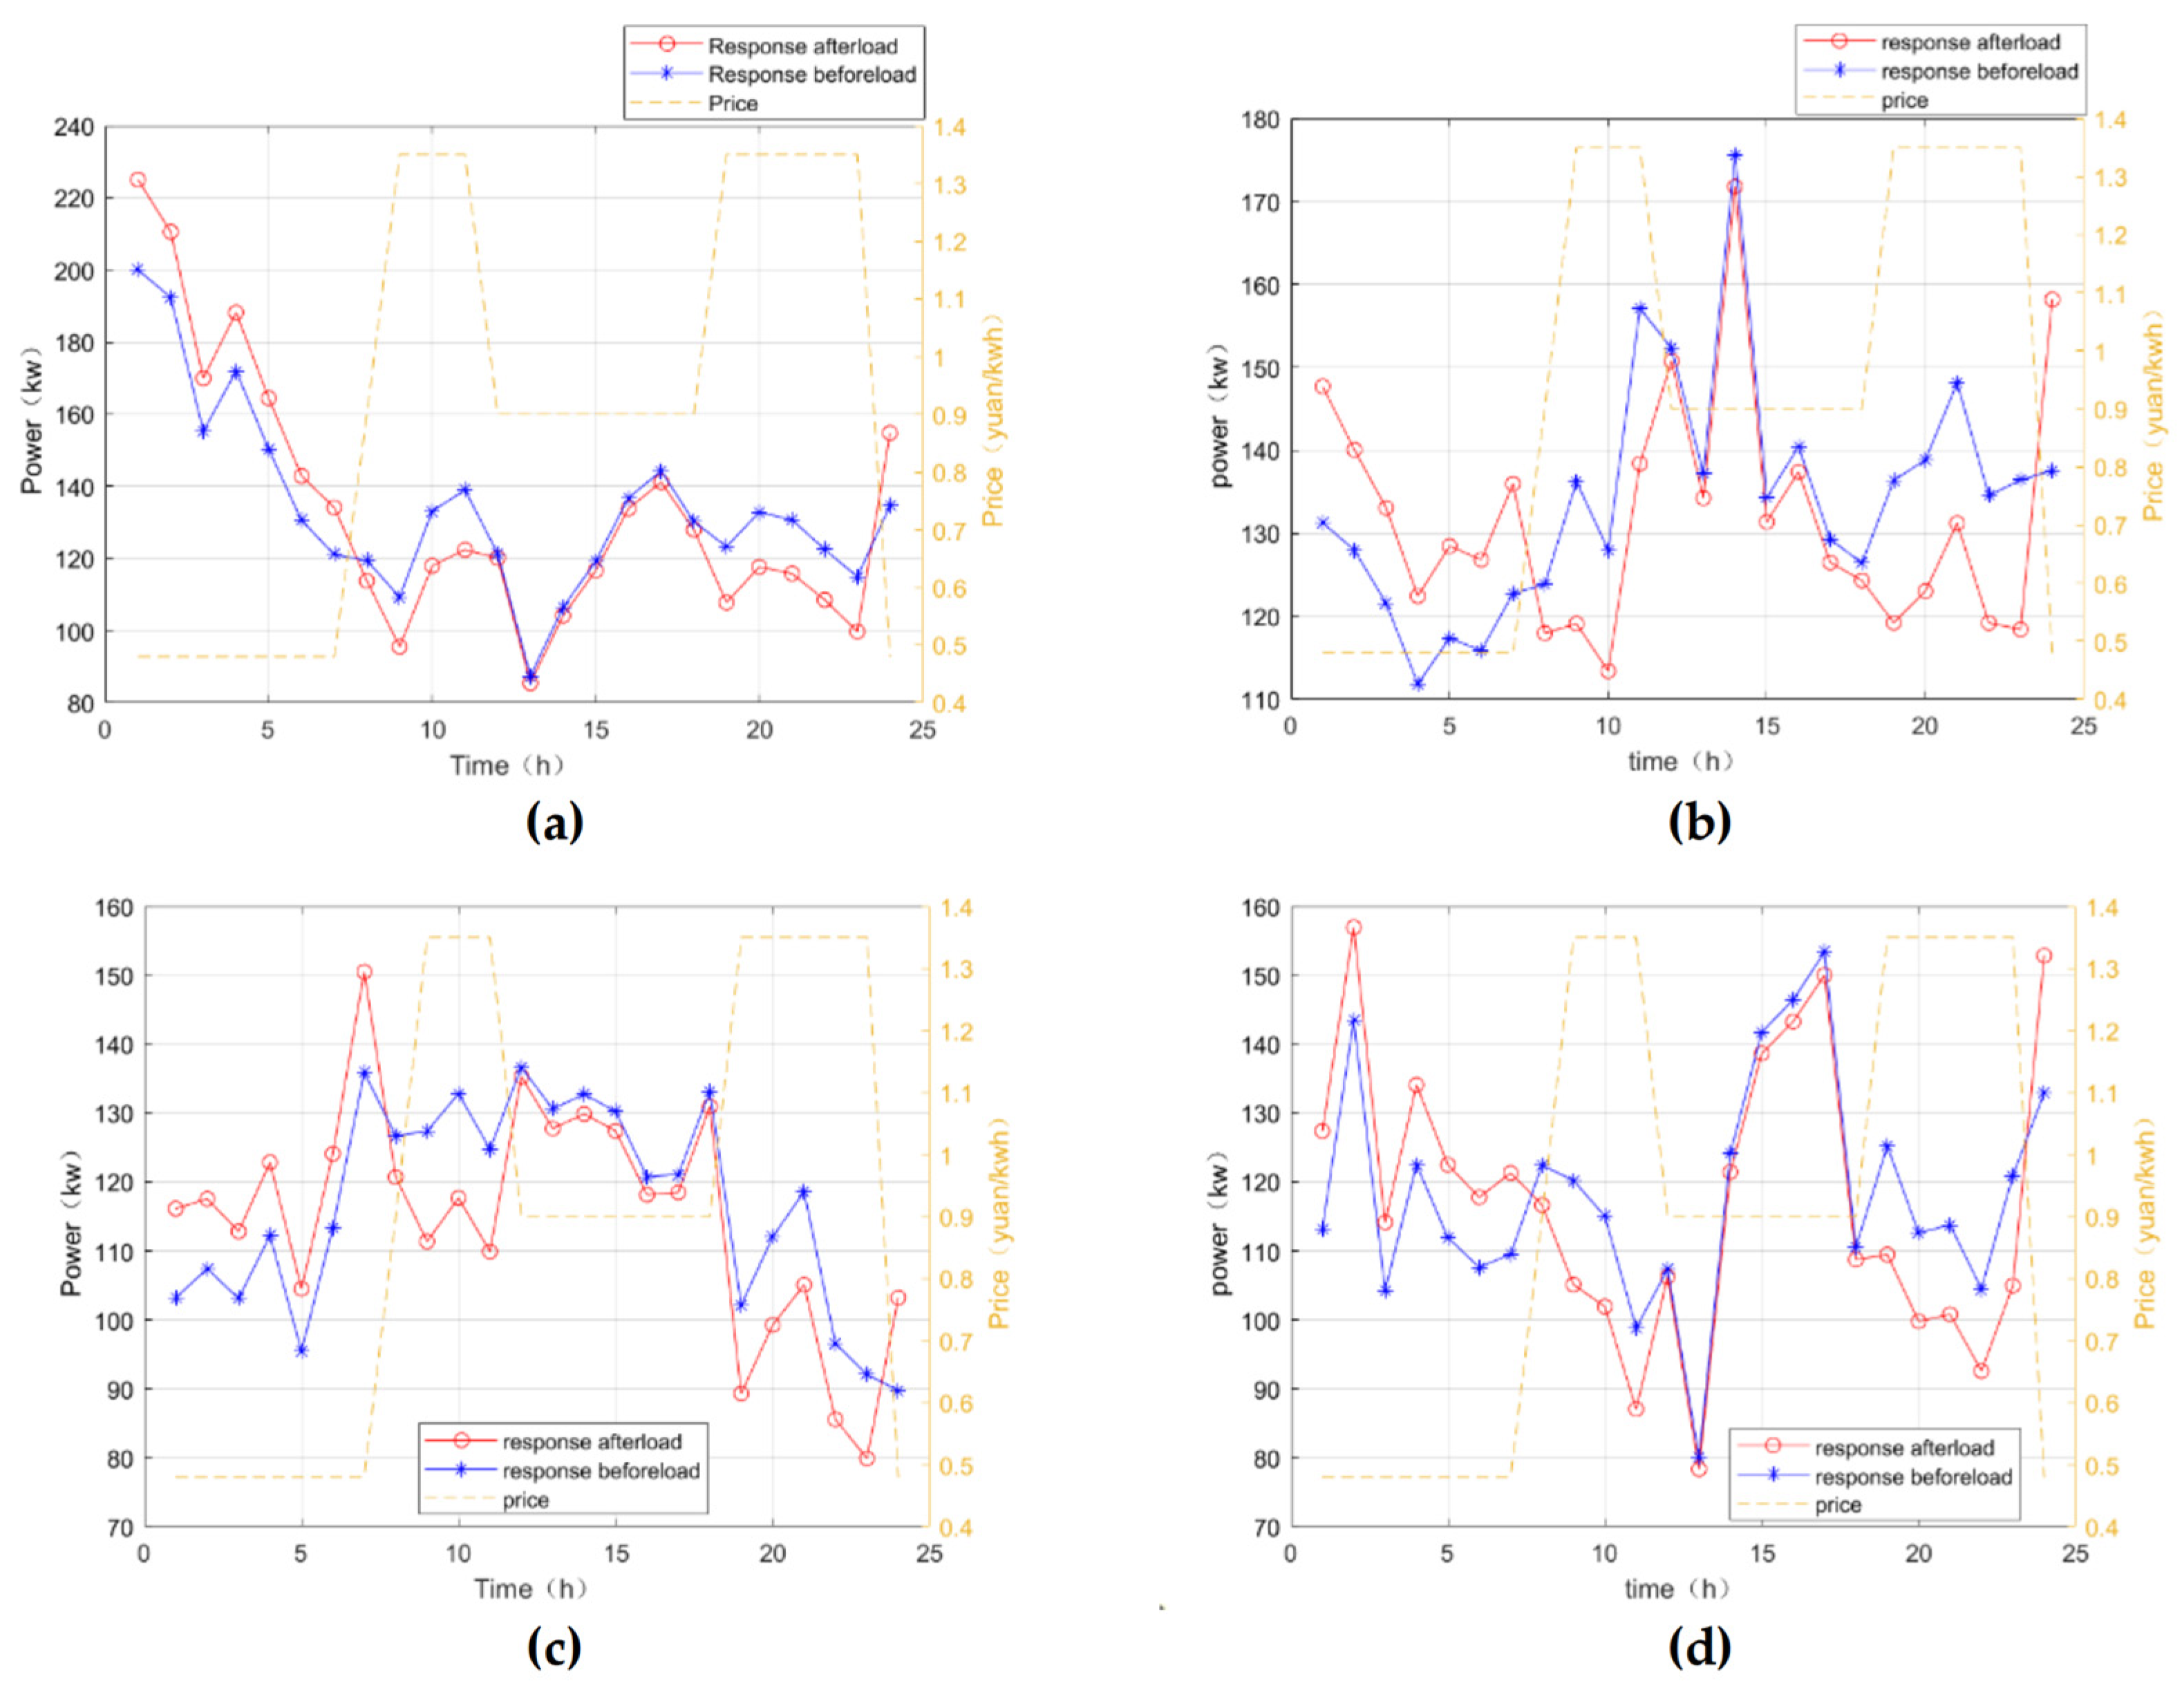
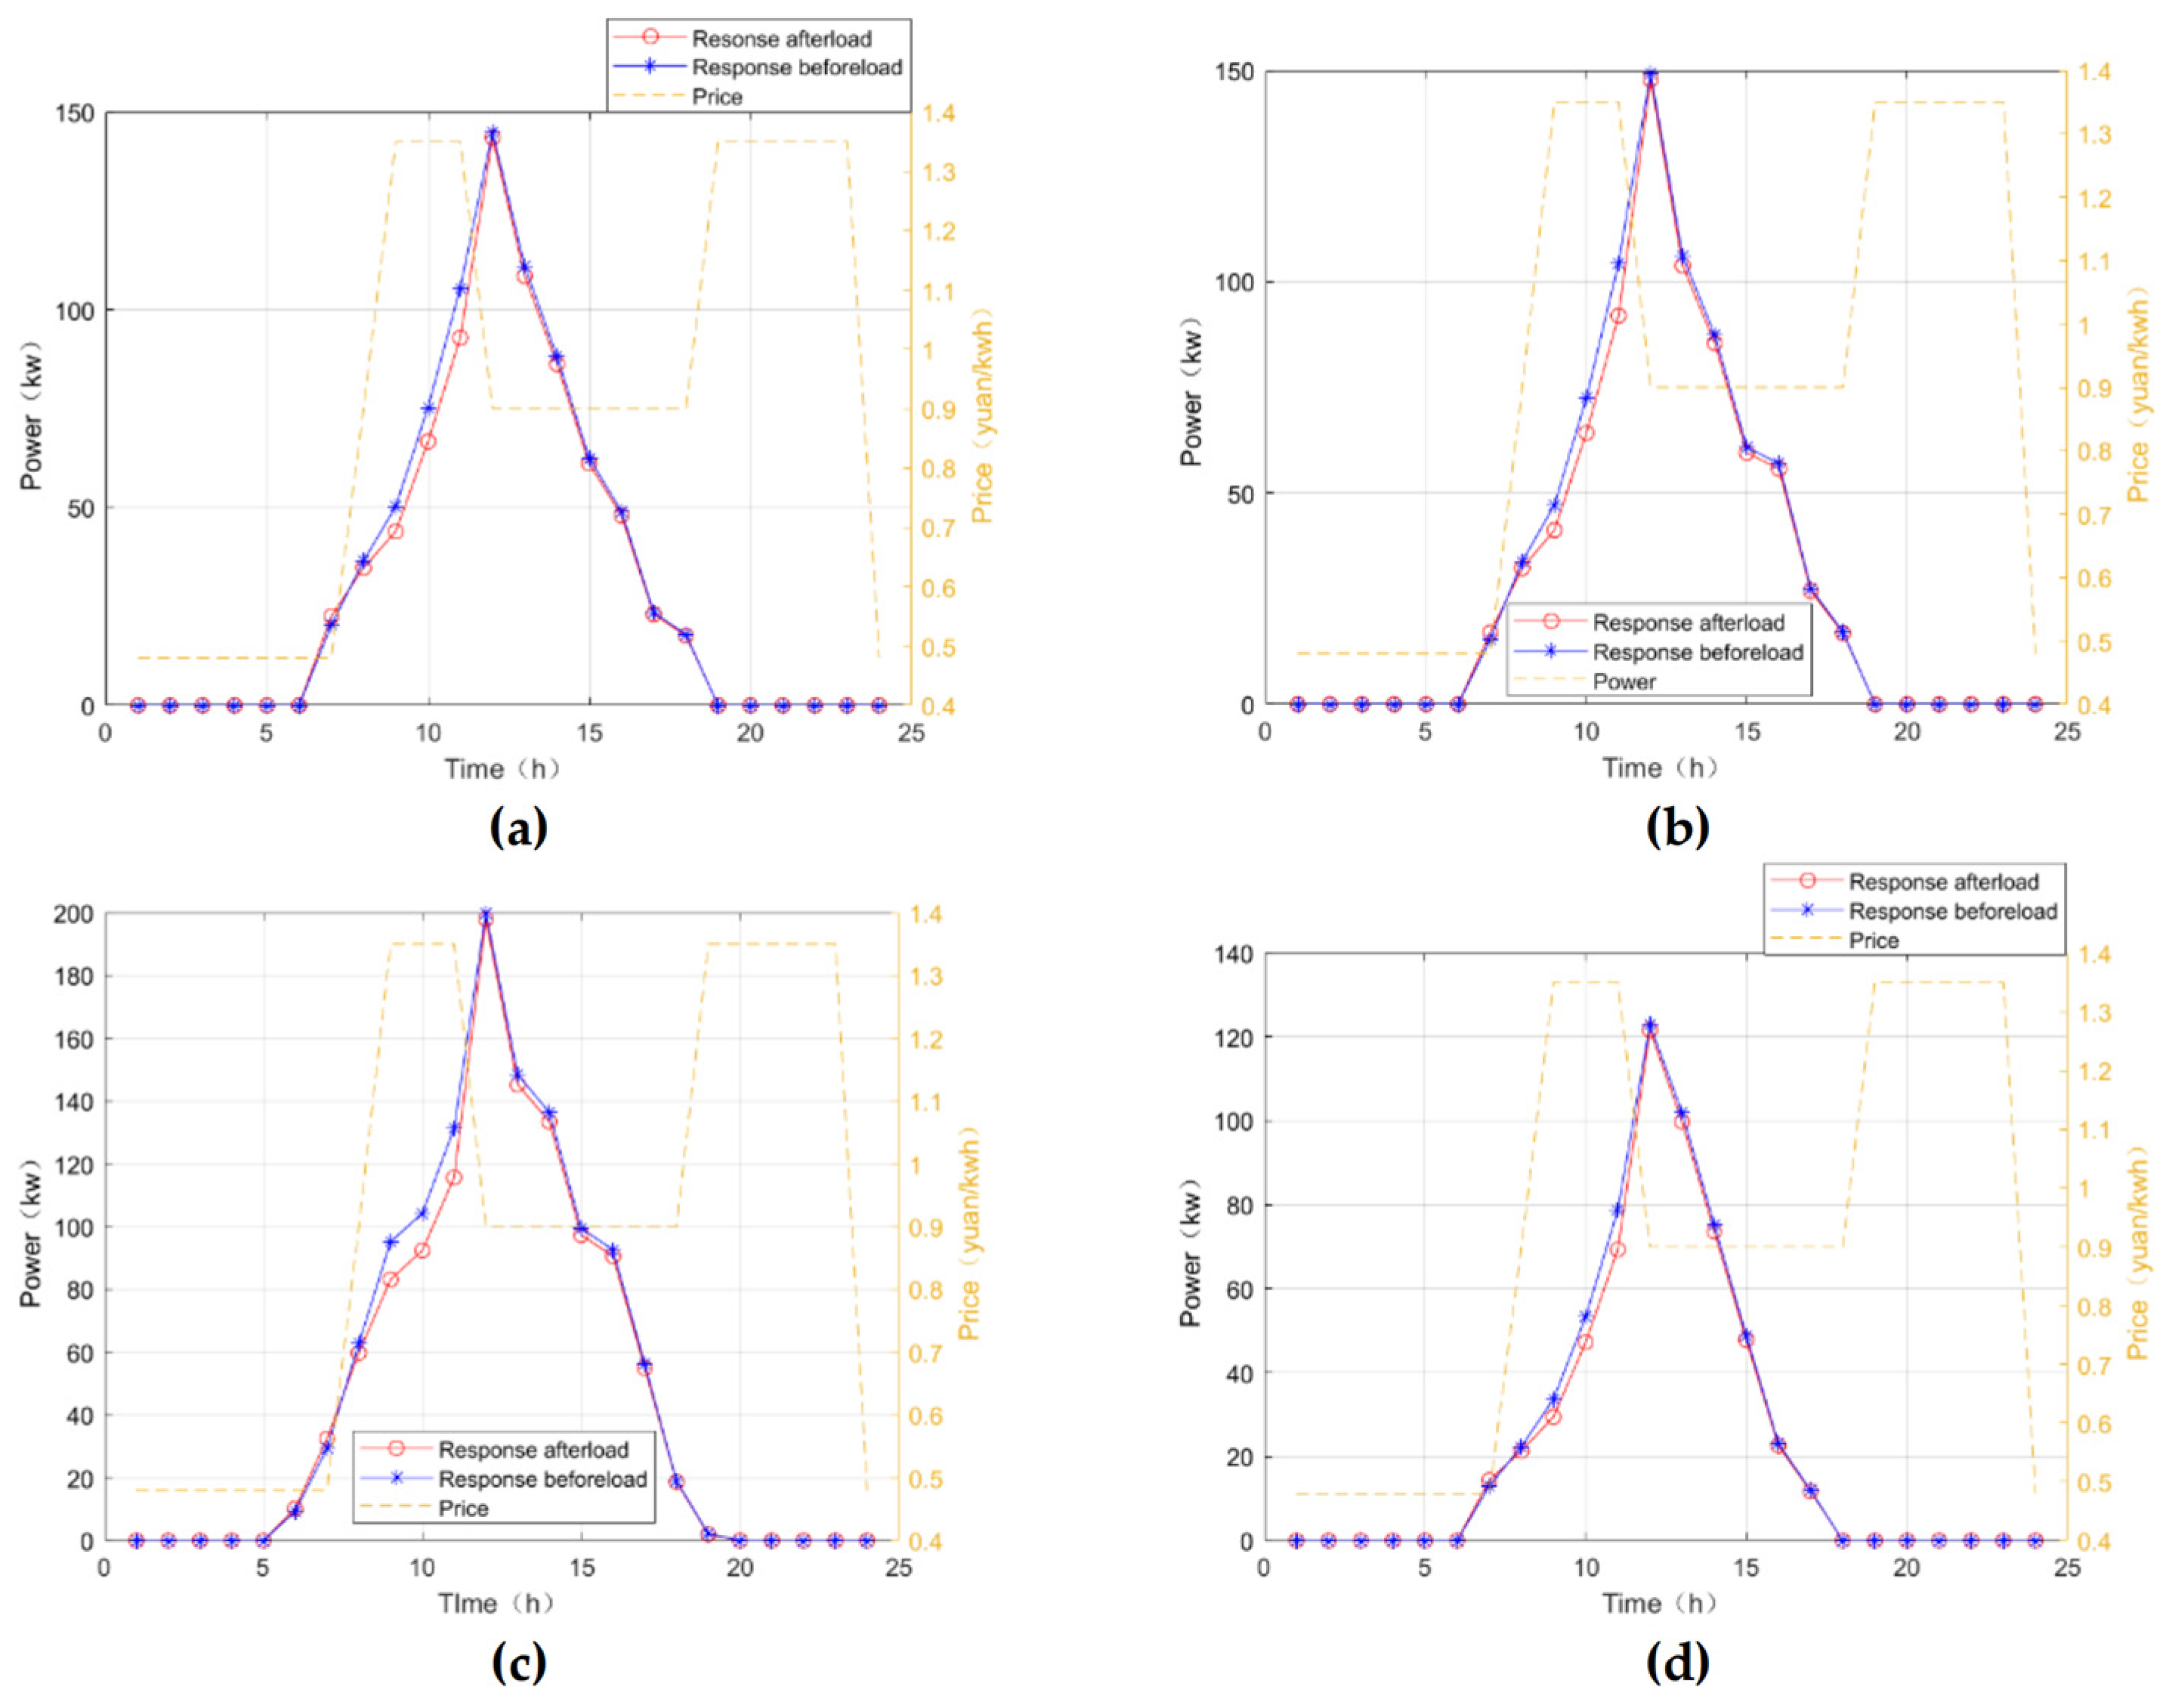
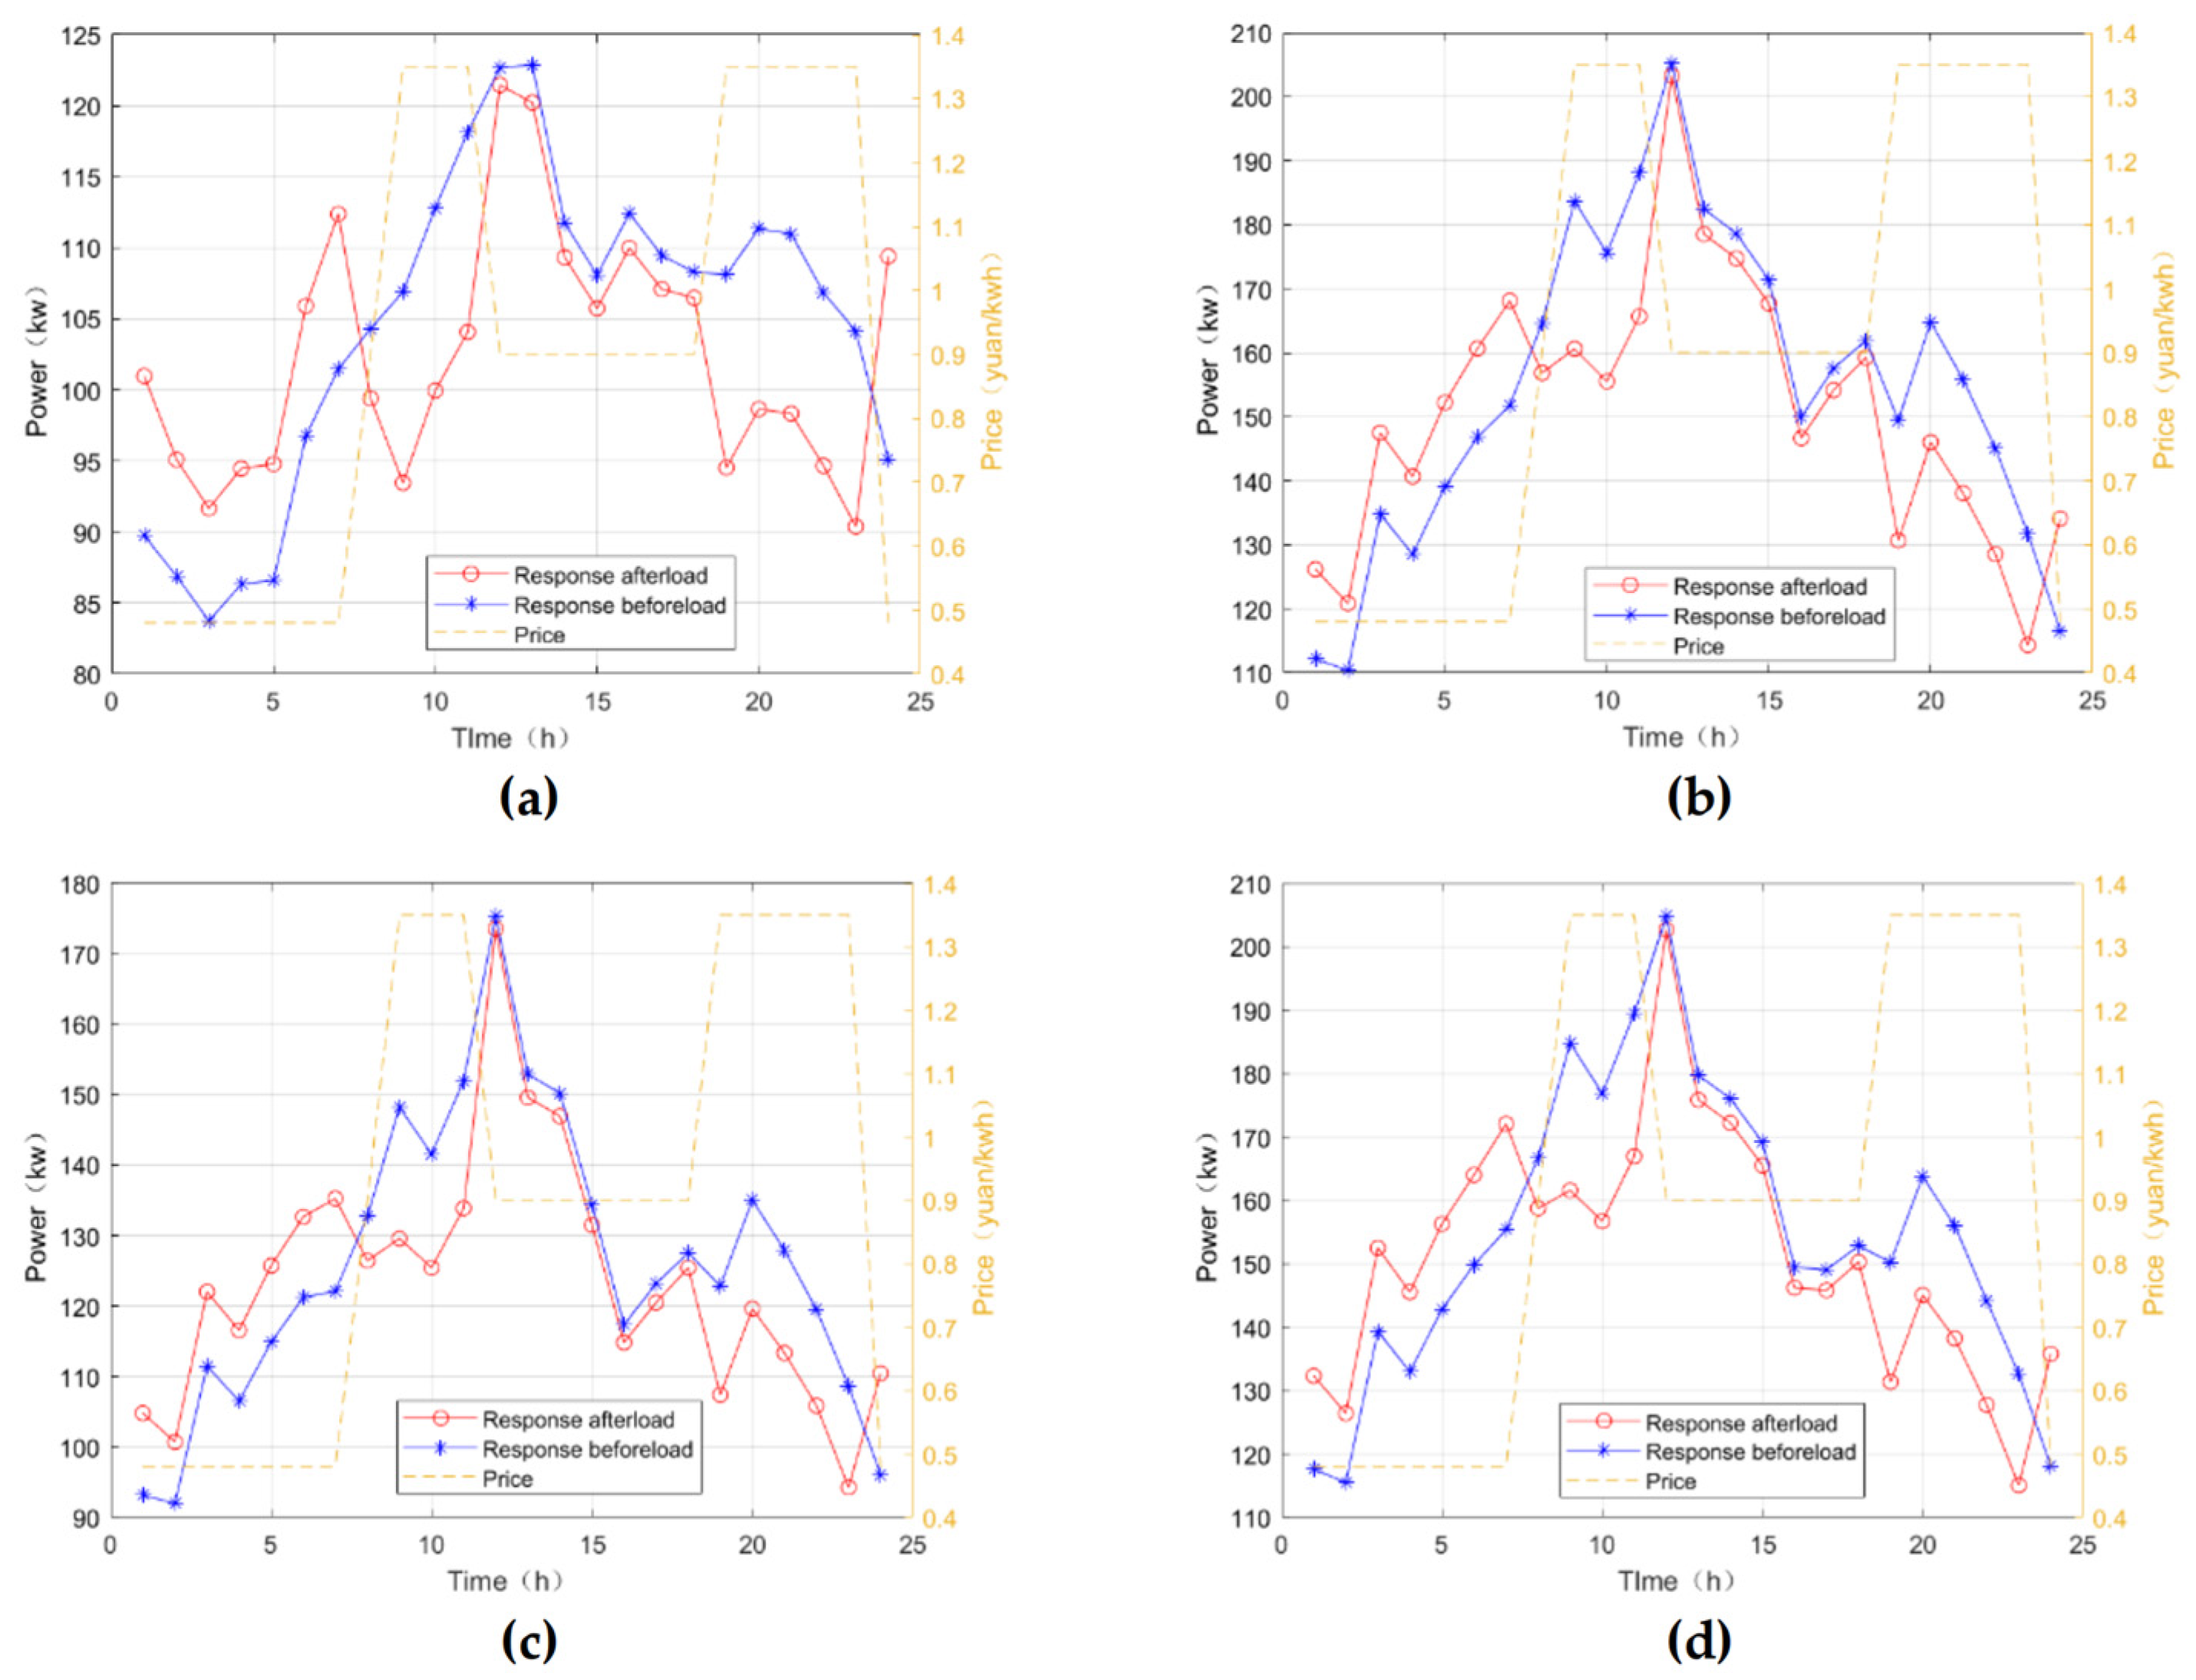
4.2.2. Simulation Result Analysis

The simulation scenarios in this paper are divided into cases based on annual and daily units. In the unit of years, the average load response and average price of each time point in each season of spring, summer, autumn, and winter is selected as the research representative, and three operation scenarios are devised:
Scenario 1: Seasonal load response model based on wind power generation.
Scenario 2: Seasonal load response model based on solar power generation.
Scenario 3: Seasonal load response model based on controllable load.
Scenario 1 investigates the seasonal load response model by considering wind power generation and real-time electricity prices. Wind power generation plays a crucial role in influencing the power grid, without relying on energy storage systems or demand-side resource scheduling. This implies that a significant portion of the transferable load is shifted from the demand side through the distribution network to regulate the overall demand. Such an approach becomes essential to address the integration challenges associated with wind power generation. Without implementing measures for load adjustment, it would lead to operational difficulties for the distribution network, resulting in substantial economic losses and jeopardizing the secure operation of the power grid. The simulation results are shown in Figure 2.
Compared to Scenario 1, Scenario 2 highlights the distinct impact of solar power generation on the distribution network. It showcases specific characteristics, such as its ability to generate power intermittently during certain periods, particularly at night when demand is high. As a result, the inherent nature of solar power limits the real-time perception of electricity prices by the demand-side load. However, there is a moderate reduction in the demand-side load during the peak morning usage period due to the availability of solar power generation. The simulation results are shown in Figure 3.
Scenario 3 leverages the controllable load that remains to achieve real-time responsiveness to price fluctuations on the demand side. Additionally, the controllable load closely aligns with the optimization model of traditional distribution networks. However, it falls short in terms of achieving a sufficient capability for shifting loads. Relying solely on optimizing the existing load schedule means that there is no possibility of altering the overall electricity supply. As a result, while some valley-filling requirements can be met, the level of optimization remains inadequate. The simulation results are shown in Figure 4.
After conducting an extensive analysis of the four seasons and optimizing the real-time price load response for wind power, solar power, and controllable load, we have determined that relying solely on the existing controllable load for the demand-side load response can only meet the requirement of an increasing transferable load during low-priced periods and by reducing the load during high-priced periods. However, it still does not address the issue of high demand during peak load periods. Wind power generation can contribute to load reduction. However, in certain low-priced periods, if the load is not increased, it cannot fully absorb fluctuations in wind power generation output. Solar power generation exhibits time-dependent characteristics and cannot meet electricity demand at higher prices in the evening. Therefore, it is crucial to consider overall distributed energy resources to effectively manage demand-side response requirements.
In order to understand the optimization effect of the result more clearly, this paper analyzes the optimization effect of the economic scheduling of wind power generation within a day, changes the proportion of the three types of load for residential users and industrial users, calculates the single day cost, and use the classical particle swarm optimization algorithm to make a comparison.
As shown in Figure 5, the current distribution of the three types of loads is 0.7:0.2:0.1 for the transferable load, substitutable load, and inflexible load, respectively. This allocation is suitable for residential users, due to their higher reliance on transferable loads and a smaller proportion of inflexible loads. However, in the case of the demand-side response for industrial users, there exists a greater presence of inflexible loads and a reduced proportion of transferable and substitutable loads. Consequently, the distribution of the three types of loads is adjusted to 0.35:0.2:0.45 for transferable load, substitutable load, and inflexible load. The simulation results are shown in Figure 6.
Following the adjustment of the load proportions, the results of the load response indicate a significant increase in power consumption during low-priced periods compared to the pre-response load, and a slight reduction in load power during high-priced periods. This confirms the ability to categorize users based on variations in load proportions.
After optimization by the chaotic particle swarm optimization algorithm, it can be found that, when the demand side of the distribution network adopted the real-time electricity price mechanism for residential users, the daily electricity purchase cost decreased by CNY 133.71. When the demand side was for industrial users, the cost of purchasing electricity per day fell by CNY 154.75. At the same time, the daily load income of the distribution network increased by nearly CNY 1588.8.
In order to validate the efficacy of the algorithm optimization, this paper uses the classical particle swarm optimization algorithm for comparison. For residential users, when the ratio of transferable load/substitutable load/rigid load is set to 0.7:0.2:0.1, the optimization results using the classical particle swarm optimization algorithm are shown in Figure 7. For industrial users, when the ratio of transferable load/substitutable load/rigid load is set to 0.35:0.2:0.45, the optimization results using the classical particle swarm optimization algorithm are shown in Figure 8.
After optimization using the classical particle swarm algorithm, the simulation results are shown in Figure 7 and Figure 8. In response to the afterload, the peak of the afterload is 1–4 h, the response to the afterload continues to decline from 1 to 8 h, and the load trough is formed from 8 to 9 h. During the period from 9 to 18 h, the response to the afterload is generally rising, and then the response to the afterload decreases in the period 18–23 h, rises to 300 kw in the period 23–24 h, and then reaches the peak load again. In response to the preload, the response to the preload continues to be 200 kw during the period of 1–4 h, and then in the period of 4–8 h, the response to the preload continues, and the load trough becomes 8–9 h. During the period of 9–18 h, the load fluctuation rises and recovers to 200 kw, and then peaks at 18–24 h and maintains 200 kw unchanged. Through calculation, it can be found that, when the demand side of the distribution network adopts the real-time electricity price mechanism for residential users, the daily electricity purchase cost decreases by CNY 89.28. When the demand side is for industrial users, the cost of purchasing electricity per day drops by CNY 103.33. At the same time, the daily load income of the distribution network increased by nearly CNY 1096.7.
The optimization effects of the chaotic particle swarm optimization algorithm and the particle swarm optimization algorithm can be obtained not only from the comparison of the optimization results, but also from the trends in response to real-time electricity prices. Compared with the chaotic particle swarm optimization algorithm, the optimization efficiency of the classical particle swarm optimization algorithm is reduced by 49.7%. At the same time, the daily revenue comparison of the distribution network falls by nearly 45%. In the stable price range of 19–23 h, the classical particle swarm optimization algorithm lacks the comprehension of a global solution and is limited to the minimum optimization in this period, ignoring the overall optimization effect. Additionally, in the two nodes of 9 h and 24 h, where the price changes rapidly, the classical particle swarm optimization algorithm does not respond quickly enough. Instead, it computes by extending the comprehensive price from the previous time interval, rather than mapping the price for that specific timeframe.
Compared with chaotic particle swarm optimization, classical particle swarm optimization is weaker in calculation accuracy and reaction speed. Therefore, chaotic particle swarm optimization has a clear advantage in economic scheduling.

5. Conclusions

The management of operational costs in a decentralized power grid is a complex task, due to uncertainties arising from the response of distributed energy users. Moreover, the integration of renewable energy sources into the grid can have negative impacts, posing challenges to both the stability and economic feasibility of decentralized power grid operations. Therefore, it has become crucial to prioritize research efforts towards enhancing the stability and economic viability of these operations. While ongoing studies are exploring potential solutions for these issues, there remains a need to investigate efficient methods that effectively balance economic considerations with reliable scheduling techniques. Given the influence of real-time electricity pricing and distributed energy storage on the decentralized power grid, we propose an integrated demand response model, incorporating chaotic particle swarm optimization as an optimization and scheduling approach.
Initially, the power grid’s economic dispatch design is introduced. Subsequently, a chaotic particle swarm optimization algorithm is applied to multi-energy cooperative control. Ultimately, a calculation of the real-time electricity price response aims to achieve a balance between economic and reliable dispatching methods. The integrated demand response model under the real-time electricity price mechanism is solved using the chaotic particle swarm optimization algorithm. By efficiently coordinating and optimizing the management of distributed power sources, energy storage systems, and flexible loads, the active power grid operates at its maximum efficiency, while meeting electricity demand on the consumer side. The primary goal is to achieve a smooth load curve. During off-peak periods, there is an approximate 60% increase in load power, resulting in an overall balancing effect during regular periods. In peak evening hours, user responses contribute significantly to reducing the grid load by up to 65 kW. Compared with the classical particle swarm optimization algorithm, the prediction accuracy and efficiency are greatly improved. The total cost is reduced by nearly 48.7%. This not only relieves pressure on grid operations but also lowers electricity costs for users. Moreover, it motivates users to adjust their consumption patterns, alleviates strain on the transmission system, enhances power supply reliability, reduces greenhouse gas emissions effectively, and promotes renewable energy development.
The findings and analysis of the graphical representations demonstrate the possibility and effectiveness of this optimization technique. When formulating strategies for optimizing and scheduling distributed power grids, taking into consideration factors such as time-of-use pricing and distributed energy storage can result in a reduction in peak loads, an improvement in load curves, and decreased operational costs for the grid. Ultimately, this enhances the stability and economic viability of operating distributed power grids. This method introduces a fresh approach to achieving a cost-effective dispatch in distributed power grids.

Author Contributions

Conceptualization, Z.J. and C.D.; methodology, Z.L. and Y.X.; validation, Y.X., Z.C. and J.L.; formal analysis, Z.J.; investigation, X.Z. and Y.X.; resources, Z.J. and C.D.; data curation, J.L.; writing—original draft preparation, Y.X. and Z.L.; writing—review and editing, C.D. and X.Z.; supervision, Z.J. and J.L.; project administration, C.D. All authors have read and agreed to the published version of the manuscript.

Funding

This publication has emanated from research conducted with the financial support of the National Key Research and Development Program of China under Grant No. 2017YFE0135700.

Institutional Review Board Statement

Not applicable.

Informed Consent Statement

Informed consent was obtained from all subjects involved in the study.

Data Availability Statement

No new data were created or analyzed in this study. Data sharing does not apply to this article.

Conflicts of Interest

The authors declare no conflicts of interest.

References

  1. Li, Z.N.; Su, S.; Zhao, Y.M.; Jin, X.L.; Chen, H.H.; Li, Y.J.; Zhang, R.Z. Energy management strategy of active distribution network with integrated distributed wind power and smart buildings. IET Renew. Power Gener. 2020, 14, 2255–2267. [Google Scholar] [CrossRef]
  2. Yuan, W.Q.; Yuan, X.; Xu, L.W.; Zhang, C.; Ma, X.S. Harmonic Loss Analysis of Low-Voltage Distribution Network Integrated with Distributed Photovoltaic. Sustainability 2023, 15, 4334. [Google Scholar] [CrossRef]
  3. Wang, Y.; Xu, Y.; Tang, Y.; Syed, M.H.; Guillo-Sansano, E.; Burt, G.M. Decentralised-distributed hybrid voltage regulation of power distribution networks based on power inverters. IET Gener. Transm. Distrib. 2019, 13, 444–451. [Google Scholar] [CrossRef]
  4. Piumetto, M.; Pucheta, J.A.; Targarona, J.C.G. Dynamic Programming for the Control of Power Quality in Inbalanced Medium Voltage Networks with Distributed Generation. IEEE Lat. Am. Trans. 2014, 12, 1221–1227. [Google Scholar] [CrossRef]
  5. Benalcázar, P.; Samper, M.E.; Vargas, A. Short-term economic dispatch of smart distribution grids considering the active role of plug-in electric vehicles. Electr. Power Syst. Res. 2019, 177, 105932. [Google Scholar] [CrossRef]
  6. Cheng, T.L.; Yang, Z.L.; Dong, B.B.; Li, B.; Zhang, Y.Y.; Zeng, L.Q.; Huang, W.L. Dynamic Multiobjective Optimal Dispatch of Distribution Network Considering Time of Use-Based Demand Response. J. Energy Eng. 2022, 148, 04021068. [Google Scholar] [CrossRef]
  7. Zhang, X.; Wang, Z.; Zhou, Z.Y.; Liao, H.J.; Ma, X.F.; Yin, X.Y.; Lv, G.Y.; Wang, Z.Y.; Lu, Z.X.; Liu, Y.Z. Optimal Dispatch of Multiple Photovoltaic Integrated 5G Base Stations for Active Distribution Network Demand Response. Front. Energy Res. 2022, 10, 919197. [Google Scholar] [CrossRef]
  8. Xiang, Y.; Liu, J.Y.; Li, F.R.; Liu, Y.; Liu, Y.B.; Xu, R.; Su, Y.C.; Ding, L. Optimal Active Distribution Network Planning: A Review. Electr. Power Compon. Syst. 2016, 44, 1075–1094. [Google Scholar] [CrossRef]
  9. Kwag, H.G.; Kim, J.O. Optimal combined scheduling of generation and demand response with demand resource constraints. Appl. Energy 2012, 96, 161–170. [Google Scholar] [CrossRef]
  10. Koutsoukis, N.C.; Georgilakis, P.S.; Hatziargyriou, N.D. Multistage Coordinated Planning of Active Distribution Networks. IEEE Trans. Power Syst. 2018, 33, 32–44. [Google Scholar] [CrossRef]
  11. Yi, Y.; Liu, D.; Yu, N.H.; Pan, F.; Chen, F. Research on Solutions for Implement of Active Distribution Network. Prz. Elektrotech. 2012, 88, 238–242. [Google Scholar]
  12. Koutsoukis, N.; Georgilakis, P. A Chance-Constrained Multistage Planning Method for Active Distribution Networks. Energies 2019, 12, 4154. [Google Scholar] [CrossRef]
  13. Wan, D.; Zhao, M.; Yi, Z.M.; Jiang, F.; Guo, Q.; Zhou, Q.F. Mixed-integer second-order cone programming method for active distribution network. Front. Energy Res. 2023, 11, 1259445. [Google Scholar] [CrossRef]
  14. Jiang, Z.C.; Yu, Q.G.; Xiong, Y.F.; Li, L.; Liu, Y.M. Regional active distribution network planning study based on robust optimization. Energy Rep. 2021, 7, 314–319. [Google Scholar] [CrossRef]
  15. Kong, X.Y.; Yong, C.S.; Wang, C.S.; Chen, Y.; Yu, L. Optimal Strategy of Active Distribution Network Considering Source-Network-Load. IET Gener. Transm. Distrib. 2019, 13, 5586–5596. [Google Scholar] [CrossRef]
  16. Wang, X.Q.; Sheng, X.D.; Qiu, W.X.; He, W.L.; Xu, J.; Xin, Y.; Jv, J.B. Fault Reconfiguration Strategies of Active Distribution Network With Uncertain Factors for Maximum Supply Capacity Enhancement. IEEE Access 2022, 10, 72373–72380. [Google Scholar] [CrossRef]
  17. Liu, J.X.; Liu, Y.G.; Liang, H.J.; Man, Y.C.; Li, F.Z.; Li, W.J. Collaborative optimization of dynamic grid dispatch with wind power. Int. J. Electr. Power Energy Syst. 2021, 133, 107196. [Google Scholar] [CrossRef]
  18. Jian, L.; Qian, Z.; Zhao, L.G.; You, M.K. Distributed economic dispatch method for power system based on consensus. IET Renew. Power Gener. 2020, 14, 1424–1432. [Google Scholar] [CrossRef]
  19. Krishnamurthy, S.; Tzoneva, R. Investigation of the Methods for Single Area and Multi Area Optimization of a Power System Dispatch Problem. Int. Rev. Electr. Eng. IREE 2012, 7, 3600–3627. [Google Scholar]
  20. Yalcinoz, T.; Cory, B.J.; Short, M.J. Hopfield neural network approaches to economic dispatch problems. Int. J. Electr. Power Energy Syst. 2001, 23, 435–442. [Google Scholar] [CrossRef]
  21. Cai, J.J.; Ma, X.Q.; Li, L.X.; Peng, H.P. Chaotic particle swarm optimization for economic dispatch considering the generator constraints. Energy Convers. Manag. 2007, 48, 645–653. [Google Scholar] [CrossRef]
  22. Liu, H.B.; Liu, S.C.; Gai, X.Y.; Liu, Y.F.; Yan, Y.T.; Sun, L. Optimal Allocation of Distributed Generators in Active Distribution Network considering TOU Price. Int. J. Antennas Propag. 2023, 2023, 7471214. [Google Scholar] [CrossRef]
  23. Huang, M.L. Hybridization of Chaotic Quantum Particle Swarm Optimization with SVR in Electric Demand Forecasting. Energies 2016, 9, 426. [Google Scholar] [CrossRef]
  24. Peng, F.X.; Hu, S.B.; Gao, Z.N.; Zhou, W.; Sun, H.; Yu, P. Chaotic particle swarm optimization algorithm with constraint handling and its application in combined bidding model. Comput. Electr. Eng. 2021, 95, 107407. [Google Scholar] [CrossRef]
  25. Kuru, L.; Ozturk, A.; Kuru, E.; Kandara, O. Determination of voltage stability boundary values in electrical power systems by using the Chaotic Particle Swarm Optimization algorithm. Int. J. Electr. Power Energy Syst. 2015, 64, 873–879. [Google Scholar] [CrossRef]
  26. Cai, J.J.; Li, Q.; Li, L.X.; Peng, H.P.; Yang, Y.X. A hybrid CPSO-SQP method for economic dispatch considering the valve-point effects. Energy Convers. Manag. 2012, 53, 175–181. [Google Scholar] [CrossRef]
  27. Qin, C.D.; Xue, Z.X.; Feng, Q.X.; Huang, X.Y. Selecting Parameters of an Improved Doubly Regularized Support Vector Machine based on Chaotic Particle Swarm Optimization Algorithm. J. Univers. Comput. Sci. 2017, 23, 603–618. [Google Scholar]
  28. Yang, H.J.; Zhang, X.Y.; Chu, Y.X.; Ma, Y.H.; Zhang, D.B.; Guerrero, J.M. Multi-objective based demand response strategy optimization considering differential demand on reliability of power system. Int. J. Electr. Power Energy Syst. 2023, 152, 109202. [Google Scholar] [CrossRef]
  29. Yu, D.M.; Xu, X.Y.; Dong, M.Y.; Nojavan, S.; Jermsittiparsert, K.; Abdollahi, A.; Aalami, H.A.; Pashaei-Didani, H. Modeling and prioritizing dynamic demand response programs in the electricity markets. Sustain. Cities Soc. 2020, 53, 101921. [Google Scholar] [CrossRef]
  30. Lynch, M.A.; Nolan, S.; Devine, M.T.; O’Malley, M. The impacts of demand response participation in capacity markets. Appl. Energy 2019, 250, 444–451. [Google Scholar] [CrossRef]
  31. Won, J.R.; Song, K.B. An Analysis on Power Demand Reduction Effects of Demand Response Systems in the Smart Grid Environment in Korea. J. Electr. Eng. Technol. 2013, 8, 1296–1304. [Google Scholar] [CrossRef]
  32. Samimi, A.; Nikzad, M.; Mohammadi, M. Real-time electricity pricing of a comprehensive demand response model in smart grids. Int. Trans. Electr. Energy Syst. 2017, 27, e2256. [Google Scholar] [CrossRef]
  33. Wang, T.H.; Wang, J.; Zhao, Y.M.; Shu, J.; Chen, J.C. Multi-objective residential load dispatch based on comprehensive demand response potential and multi-dimensional user comfort. Electr. Power Syst. Res. 2023, 220, 109331. [Google Scholar] [CrossRef]
Figure 1. Flow chart of particle swarm optimization.
Information 15 00225 g001
Figure 2. Real-time electricity price load response results for average load response and average electricity price for each time point in each season of spring, summer, autumn, and winter, based on wind power generation ((a)—spring, (b)—summer, (c)—autumn, (d)—winter).
Information 15 00225 g002
Figure 3. Real-time electricity price load response results for average load response and average electricity price for each time point in each season of spring, summer, autumn, and winter, based on photovoltaic power generation ((a)—spring, (b)—summer, (c)—autumn, (d)—winter).
Information 15 00225 g003
Figure 4. Real-time electricity price load response results for average load response and average electricity price for each time point in each season of spring, summer, autumn, and winter based on controllable load generation ((a)—spring, (b)—summer, (c)—autumn, (d)—winter).
Information 15 00225 g004
Figure 5. One-day real-time tariff load response based on wind power generation (residential users).
Information 15 00225 g005
Figure 6. One-day real-time tariff load response based on wind power generation (industrial users).
Information 15 00225 g006
Figure 7. One-day real-time tariff load response based on wind power generation (residential users).
Information 15 00225 g007
Figure 8. One-day real-time tariff load response based on wind power generation (industrial users).
Information 15 00225 g008
Disclaimer/Publisher’s Note: The statements, opinions and data contained in all publications are solely those of the individual author(s) and contributor(s) and not of MDPI and/or the editor(s). MDPI and/or the editor(s) disclaim responsibility for any injury to people or property resulting from any ideas, methods, instructions or products referred to in the content.

