Abstract
Music emotion recognition has garnered significant interest in recent years, as the emotions expressed through music can profoundly enhance our understanding of its deeper meanings. The violin, with its distinctive emotional expressiveness, has become a focal point in this field of research. To address the scarcity of specialized data, we developed a dataset specifically for violin music emotion recognition named VioMusic. This dataset offers a precise and comprehensive platform for the analysis of emotional expressions in violin music, featuring specialized samples and evaluations. Moreover, we implemented the CNN–BiGRU–Attention (CBA) model to establish a baseline system for music emotion recognition. Our experimental findings show that the CBA model effectively captures the emotional nuances in violin music, achieving mean absolute errors (MAE) of 0.124 and 0.129. The VioMusic dataset proves to be highly practical for advancing the study of emotion recognition in violin music, providing valuable insights and a robust framework for future research.
1. Introduction
As the economy grows and people’s material standards improve, there is an increasing pursuit of spiritual enrichment through music, art, literature, and live performances. Music, in particular, serves as a powerful form of expression, conveying emotions through sound vibrations, melodies, and rhythms, and holds a vital place in our daily lives. Music Emotion Recognition (MER) involves the use of computer technology to automatically identify the emotional states expressed in music, bridging the gap between the technical and the emotional aspects of musical experience. According to the China Music Industry Development Report 2022, the scale of China’s digital music industry reached CNY 79.068 billion in 2021, a year-on-year growth of 10.3% [1]. Despite the challenges of the post-epidemic landscape and intense competition in the market, the digital music industry continues to experience robust growth, demonstrating its vibrant vitality. This surge in digital music data, coupled with an increasing demand for music information retrieval, highlights the industry’s dynamic evolution. Research indicates that emotion-related vocabulary ranks among the most common terms used in music searches and descriptions. Consequently, there is a growing need for music retrieval systems that can categorize and recommend music based on its emotional attributes. The technology of music emotion recognition involves multiple fields such as musicology, psychology, music acoustics, audio signal processing, natural language processing, deep learning, etc. [2,3]. It is a multi-disciplinary, interdisciplinary research field [4].
Most researchers undertaking MER research use supervised machine learning methods to achieve music emotion recognition. Yang [5] proposed a CNN-based emotion recognition method. By converting the original data into a spectral graph, and then inputting the spectral graph into the CNN for emotion recognition. Liu and others [6] use the spectral graph computed by the short-time Fourier transform of the audio signal as input. Each music’s spectral graph undergoes convolutional layers, pooling layers, and hidden layers, and finally, it goes through SoftMax for prediction. Coutinho et al. [7] added psycho-acoustic features on top of the ComPareE feature set, using LSTM–RNN to achieve information modeling on longer contexts, capturing the time-varying emotional features of music for music emotion identification. In consideration of the high contextual relevance between music feature sequences and the advantages of Bi-Directional Long Short-Term Memory (BLSTM) in capturing sequence information, Li and others [8] proposed a multi-scale regression model based on deep BLSTM and a fusion of Extreme Learning Machines (ELM). Hizlisoy et al. [9] proposed a music emotion recognition method based on Convolutional Long Short-Term Memory Deep Neural Network (CLDNN) architecture, which provides the features obtained by the logarithmic Mel filter group energy and the Mel Frequency Cepstral Coefficients (MFCC), which are then passed to a convolutional neural network (CNN) layer. Subsequently, LSTM + DNN is used as a classifier to deal with problems such as the difficulty of neural network model selection and model overfitting. Zheng Yan and others [10] proposed a CGRU model that combined Convolutional Neural Networks (CNN) and Gated Recurrent Units (GRU). After extracting low-level and high-level emotional features from MFCC features, random forests were used to select features from them. Xie and others [11] proposed a new method that combines frame-level speech features and attention-based LSTM recurrent neural networks to maximize the emotional saturation difference between time frames. In order to speed up the model training speed, Wang Jingjing and others [12] combined Long Short-Term Memory networks (LSTM) with Broad Learning Systems (BLS), used LSTM as the feature mapping node of BLS, and built a new wide and deep learning network LSTM–BLS. Considering the effectiveness of deep audio embedding methods in capturing high-dimensional features into compact representations, Koh and others [13] used L3-Net and VGGish deep audio embedding methods to prove that deep audio embedding can be used for music emotion recognition. Huang [14] used only log Mel spectrum as input, using the modified VGGNet as the Spatial Feature Learning Module (SFLM) to obtain spatial features of different levels, inputting the spatial features into the Time Feature Learning Module (TFLM), based on Squeeze and Excite (SE) attention, to obtain Multiple Level Emotion Spatiotemporal Features (MLESTF). In order to reduce Long Distance Dependency in Long Short-Term Memory Neural Networks in Music Emotion Recognition, Zhong Zhipeng [15] proposed a new network model, CBSA (CNN BiLSTM Self Attention).
Given the complexity and challenge of obtaining substantial, valid emotional feedback in controlled experiments, there is a notable shortage of music datasets featuring emotional annotations, especially for musical instruments. This scarcity is particularly acute in the field of musical emotion recognition for instruments like the violin. To address this gap, we have developed the VioMusic dataset, a specialized collection of violin solo audio recordings with emotional annotations. This dataset aims to facilitate the development and evaluation of Music Emotion Recognition (MER) models. Furthermore, we have introduced a CNN–BiGRU–Attention (CBA) network specifically tailored to mimic human perception of violin music emotions. This model utilizes CNNs to capture the deep emotional features inherent in the music, employs BiGRUs to decode the contextual relationships among musical emotions, and incorporates an Attention mechanism to focus on the most emotionally expressive elements of the music. The experimental results validate the effectiveness of the VioMusic dataset and confirm the accuracy and utility of the CBA model for emotion recognition in violin music.
In the next few sections, we will demonstrate the validity of the dataset related to the domain of music emotion recognition, the present data collection process and emotion annotation process, as well as several experimental scenarios in detail, and analyze the performance of state-of-the-art music emotion recognition methods on this dataset.
2. Related Work
Datasets are the basis of music information retrieval research. Rich databases can improve the accuracy of algorithms in the field of music information retrieval, which is of great significance for algorithm improvement [16]. Since people started to pay attention to MER, many datasets have been designed for it. Here is a brief overview of several common public music emotion datasets (Table 1).

Table 1.
Summary of public music emotion datasets.
The CAL500 dataset consists of 500 music tracks covering a variety of musical styles, including rock, pop, jazz, classical, and more. This dataset is characterized by a label-based approach that categorizes each music track into multiple facets and assigns values to each facet. The CAL500 contains over 17,000 annotations in total.
The DEAP dataset contains physiological responses and subjective emotional reactions of volunteers to music and video stimuli. It includes data such as EEG, ECG, and skin conductance, as well as self-reported emotional states, making it valuable for emotion recognition and affective computing research.
The emoMusic dataset is specifically designed for emotion recognition in music. It consists of audio samples labeled with emotional categories such as happy, sad, angry, and relaxed.
The DEAM dataset is a multimodal music sentiment categorization dataset containing 120 songs covering a wide range of music genres such as rock, pop, and classical. The dataset contains not only audio and textual information but also multiple emotion raw data from physiological signals and psychological questionnaires.
MagnaTagATune is a large-scale dataset of annotated music clips collected from the Magnatune online music store. It includes audio samples labeled with a wide range of descriptive tags, covering genres, instruments, moods, and more. This dataset is often used for tasks such as music tagging, recommendation, and genre classification.
The AMG1608 dataset is a subset of the Million Song Dataset, focusing on genre classification. It contains audio samples labeled with genre categories, allowing researchers to train and evaluate models for automatic genre recognition in music.
The FMA is a collection of freely available music tracks with associated metadata, including genre labels, artist information, and track features. It is a popular resource for researchers and music enthusiasts interested in exploring and analyzing a diverse range of music styles and characteristics.
Emotify is a dataset designed for emotion recognition in music, similar to emoMusic. It consists of audio samples labeled with emotional categories, providing a resource for training and evaluating emotion detection algorithms in music.
The PMEmo dataset contains physiological signals and self-reported emotion annotations collected from participants listening to music excerpts. It is used for research in affective computing and emotion recognition, providing data for analyzing the relationship between physiological responses and perceived emotions in music.
3. Data Collection
The VioMusic dataset was carefully recorded by three violin players. The dataset contains 264 unaccompanied violin solo works, 1926 music clips cut according to the score, the emotional score based on the VA model associated with each track, and a series of feature data designed for emotional recognition, with a total size of 1.1 GB, about 7.5 h of playing time. The selected music works cover a wide range of emotional pedigree, including Chinese and Western classical music, folk melodies, and contemporary pop music. It has been publicly released and is available for free download at https://github.com/mm9947/VioMusicv (accessed on 24 March 2024).
3.1. Player Recruitment
This dataset recruited three performers to record the music data. The first performer has a doctorate in Violin Performance obtained in 2022; the second is a graduate student at the Central Conservatory of Music; the third is the author of this paper, with 16 years of violin study. To cover a wide range of emotional expressions, the dataset includes classical music from China and abroad, folk songs, and pop music. Recordings from each performer were collected over a period of 20 to 50 days.
3.2. Recording Settings
The recorded pieces all come from violin textbooks. Performers recorded the music in a quiet environment using a smartphone or professional equipment based on the emotions marked on the scores (Figure 1). The audio file formats used by each singer are .m4a, .wav, and .mp3. The sampling rate of the recordings typically ranges between 44.1 kHz and 48 kHz.

Figure 1.
Example of musical notation annotation.
3.3. Emotional Evaluation
The emotional assessment was annotated by students who have studied music in our school. These students had extensive knowledge of music theory. At the same time, the authors conducted a training session with the students prior to the annotation of the emotion assessment. In this process, 10 music clips representing extreme emotions (extreme values of valance and arousal, respectively) are played to ensure that the students understand and are familiar with the criteria for categorizing emotions and that they can perform emotional annotation on a musical dataset without bias. The emotional model is the Valence–Arousal (VA) continuous emotional model [26] proposed by Russell, as shown in Figure 2. In the VA model, the emotional state is a point that is distributed in the two-dimensional space containing the valence state and arousal. The vertical axis represents arousal, and the horizontal axis represents the valence state.
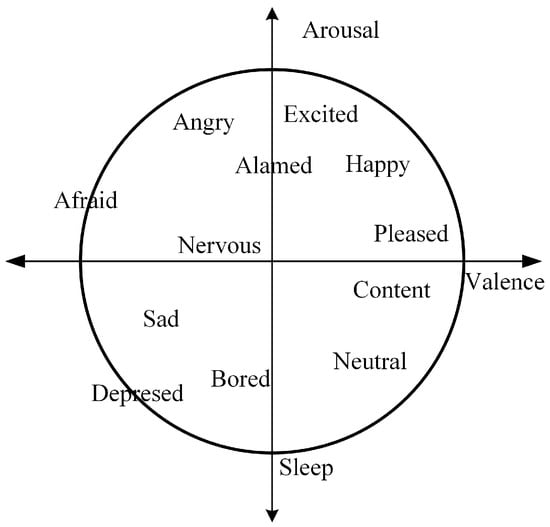
Figure 2.
Russell’s Circumplex Model of Emotion.
When using the potency arousal model, the potency score range is 1–5, where 1 is unhappy, and 5 is extremely happy. The arousal score ranges from 1 to 5, with 1 indicating very low arousal (loss) and 5 indicating very high arousal (excitement). It can be seen from Figure 3 that the annotations of most music clips fall in the second and fourth quadrants. In addition, Figure 4 lists the VA emotion change curves of three randomly selected music clips from the VioMusic dataset, indicating the significant difference in emotion between songs and the trend of relative stability of the same song.
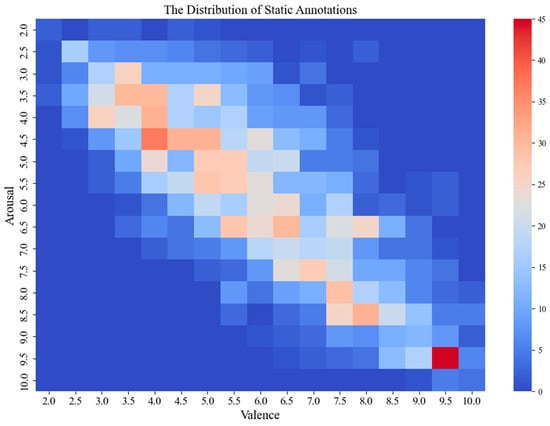
Figure 3.
Distribution chart of music fragment annotations.
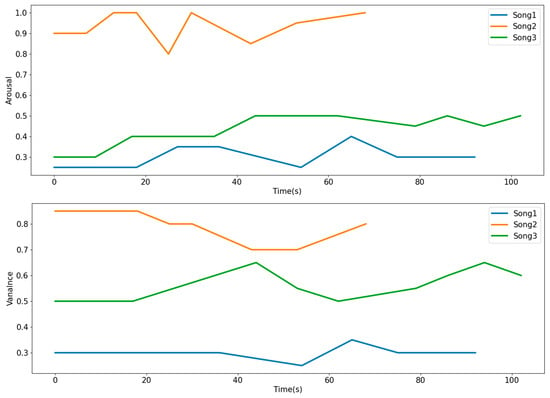
Figure 4.
Emotion change curve for different songs.
For evaluation results, this article uses “Cronbach’s α” [27] to evaluate annotation consistency. “Cronbach’s α” is often used in psychometric tests to estimate the reliability, which represents the degree to which a group of items measure a single one-dimensional potential construct. Generally, when “Cronbach’s α” is higher than 0.7, it can be considered that the measuring tool has good internal consistency, and the formula is as follows:
α represents Cronbach’s coefficient; k is the number of measurement items; σ2ᵢ represents the variance of each measurement item; σ2ₜ represents the variance of the population.
The average and standard deviation of “Cronbach’s α” for sentiment annotations in the VioMusic dataset are presented in Table 2. The results indicate high internal consistency for both valence and arousal annotations, demonstrating the quality of the annotations in this dataset.

Table 2.
Cronbach’s alpha statistic for the sentiment dimension.
4. Methods
This model uses the Mel spectrogram of each music segment as input and the output of the CNN as the music feature. It employs the BiGRU layer and the Attention layer to capture temporal dependencies and important characteristics in the music features. It sends the processed feature information to the fully-connected layer. Finally, the fully connected layer serves as a classifier, making the final regression prediction for the music segments based on the extracted features (Figure 5).

Figure 5.
The overall structure of CNN–BiGRU–Attention.
4.1. CNN–BiGRU Model
We leveraged the Convolution Neural Network (CNN) model to extract feature matrices . The convolutional layer part of the CNN model was used as a feature extractor, making the output of this model the feature maps extracted by the convolutional layer rather than the classification result. The convolution layer part of the CNN model inputs the music emotion feature matrix into a two-dimensional convolution layer, which uses filters of size 3 × 3. Then, Batch Normalization (BatchNorm2d) is used to perform data normalization processing on the output of the convolutional layer. Next, the normalized data is passed into a Rectified Linear Unit (ReLU) activation function. Finally, the dimensionality of the matrix is reduced through a MaxPooling operation, retaining key information in the music emotion features to obtain the local key music emotion feature matrix (Figure 6).
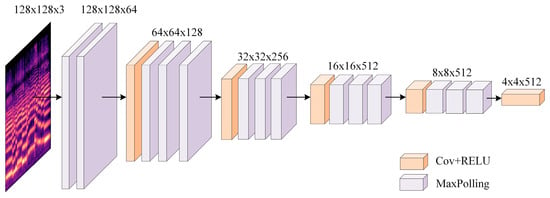
Figure 6.
Structure diagram of CNN.
Next, we feed the music emotion matrix into the BiGRU model for training to obtain the serialized music emotion feature matrix . Since violin music is a temporal art form, we use a deep neural network with a bidirectional gated recurrent unit (BiGRU) to capture past and future musical information.
A Gated Recurrent Unit (GRU) can solve the problem of gradient disappearance or gradient explosion that occurs when traditional RNNs process long sequences of data and has a simple structure and lower computational cost. GRU controls the information flow by introducing a “Gating Mechanism” (Gating Mechanism), which captures the long-distance dependencies more efficiently in each time step of the sequence.
The GRU contains two gating units (update gate and reset gate ), which are capable of preserving information in long-term sequences and are not purged over time or removed because they are not relevant to the prediction. The GRU gating structure is shown below (Figure 7).
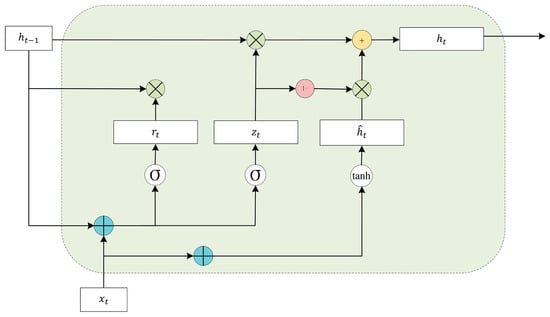
Figure 7.
Structure diagram of the GRU cycle unit.
Let the external state at moment be . is the music emotion feature vector at the current moment is the external state at the previous moment, and they both undergo a linear transformation. The update gate compresses these two pieces of information to between 0 and 1 by means of a Sigmoid activation function (1). and undergo a linear transformation and are then summed and put into a Sigmoid activation function to output the activation value (2). The product of the corresponding elements of and is calculated to determine the information to be retained versus forgotten (3). During the computation of the final memory, the update gate determines the current memory content and the information to be collected in the previous time step . The Hadamard product of the activation result of the update gate and represents the information retained in the previous time step to the final memory, which, together with the information retained in the current memory to the final memory, equals the final gated loop unit output (4). The gated loop unit retains only the relevant information and passes it on to the next unit, so it avoids the gradient vanishing problem by utilizing all the information.
The BiGRU model’s hidden state representation of each point in time in a musical sequence combines information from the future and the past to better capture and integrate such emotional dynamics, thus allowing the model to play a better role in such complex emotional judgments (Figure 8).
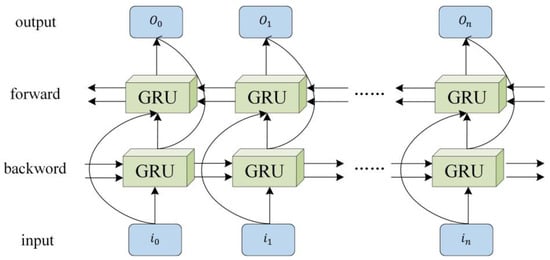
Figure 8.
Structure diagram of the GRU cycle unit.
4.2. Attention Mechanism
In order to enable the model to pay more attention to information related to emotion, we also integrate the Attention mechanism on the basis of the BiGRU model. The Attention layer will calculate the weight of the hidden layer output at the last time according to the characteristics (6) of all time steps and the corresponding Attention weight (7) and then calculate a new music feature representation (8). This music feature will be transferred to the subsequent full connection layer. The input of the Attention layer is the hidden layer state , passing through two layers of BiGRU. Its model structure and Attention weight calculation formula are as follows (Figure 9):
where and represents the Attention score and weight corresponding to the music feature at time , and represents the weighted hiding state of the Attention layer at time .
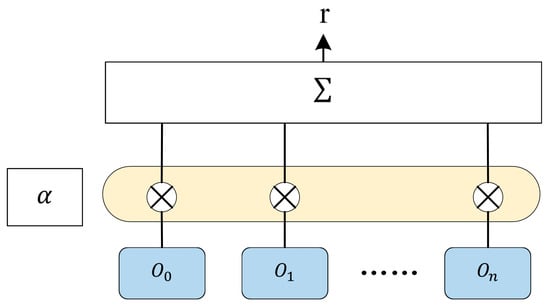
Figure 9.
Attention mechanism model.
The input of the full connection layer is the output of the Attention mechanism. Sigmoid is selected as the activation function to predict the VA value of the music clip. The prediction formula is as follows:
where represents the VA value of the first music clip t, is the weight matrix, and is the offset term.
4.3. Metrics
This article calculates the Pearson correlation coefficient (r) and mean absolute error (MAE) as evaluation metrics for valence and arousal. The MAE is a common method for measuring the magnitude of error and can be used to assess the gap between predicted and actual values. The Pearson correlation coefficient is a statistical measure for quantifying the linear relationship between two variables. Its values range from −1 to 1, where 0 < r < 1 indicates a positive correlation, and −1 < r < 0 indicates a negative correlation.
In the given context, refers to the number of music segments, represents the true values of the emotional content of the music segments, and represents the predicted values of the emotional content of the music segments. and represent the pairs of observed values in the sample data, while and represent the mean of and , respectively.
4.4. Feature Fusion
Low-Level Descriptors (LLDs) provide basic descriptions and features for audio data, serving as important data foundations for audio signal processing and music information retrieval. In this experiment, we utilized the Librosa [28] library to extract LLDs, which include timbre, pitch, rhythm, and vibrato, among others.
Vibrato is a unique technique in string instrument playing, where the musician rapidly oscillates the finger on the string. Vibrato can enhance the impact of the music and lend individuality to the performer [29]. For example, in a sorrowful piece of music, vibrato can make a particular note more prominently express the emotion of sadness. Figure 10 displays the vibrato amplitude variations in two music excerpts from the VioMusic dataset.
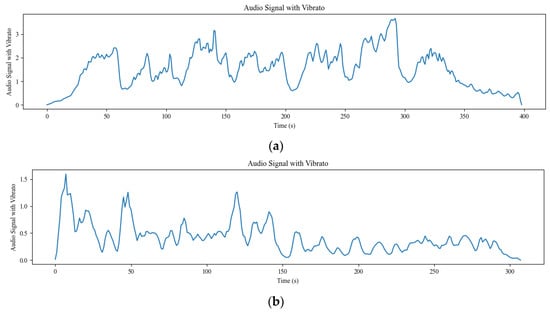
Figure 10.
Vibrato amplitude variation curve for different songs. (a) More emotionally powerful music clips. (b) Music clips with low mood swings.
5. Experiment and Results
5.1. Experimental Setup
5.1.1. Loss Function
To train our model, we utilized mean absolute error (MAE) as the loss function, which calculates the mean absolute difference between the target values and the predicted values. The violin has a wide dynamic range during performance, allowing for seamless transitions from very soft to very loud sounds. Therefore, the model needs to accurately predict complex emotional variations that arise from this extensive dynamic range and consistent timbre changes.
The MAE provides a uniform weight to all prediction errors, meaning it does not overly react to outliers. This helps to reduce interference from outlier predictions and aligns with our expectation of the model not penalizing prediction errors too harshly based on their magnitude. The formula for calculating MAE is as follows:
where represents the target value, represents the predicted value, and is the total number of samples.
5.1.2. Model Settings
The training set and test set are divided in the ratio of 8:2. The CNN layer has a filter size of 3 × 3, and the input image size is (128, 128) with 3 channels. We employ the Adam optimizer for the BiGRU layer with an initial learning rate of . The model comprises a total of 3 BiGRU layers, trained over 30 epochs with a batch size of 64. In the Attention layer, the weight matrix W is initialized with a ‘normal’ distribution, while the bias vector b is initialized with ‘zeros’. In the fully connected layer (FC), we use the Sigmoid function as the activation function. The model uses root mean square error (RMSE) as the evaluation metric for accuracy. Additionally, we have implemented the EarlyStopping callback, which stops training if the performance does not improve within 10 epochs and restores the weights to the best-performing ones.
5.2. Result
5.2.1. Comparison of Emotion Recognition under Different Models
We compared the performance of CNN–Attention, CNN–BiGRU, and CNN–BiGRU–Attention models in predicting arousal and valence in terms of their performance.
We compared the performance of the different models with CNN–BiGRU–Attention on the tasks of predicting emotional arousal (arousal) and validity (valence).
From the results in Table 3, the CBA model scored the highest Pearson correlation coefficient for both valance and arousal values, with 0.524 and 0.576, respectively, while in terms of the mean absolute error (MAE), the CBA model significantly outperforms the CA model and the CB model, with an MAE of 0.124 and 0.129, respectively. The experimental results confirm the effectiveness of the BiGRU and Attention mechanisms.

Table 3.
Evaluation metrics results for different models.
In the task of violin music emotion recognition, we not only hope that the model can capture the overall trend of emotion change but also hope that the model can accurately predict the specific emotion values. The CBA model succeeds in achieving a better balance between the two metrics by combining the local feature extraction ability of the CNN, the long-range dependency capture ability of the GRU network, and the information filtering ability of the Attention mechanism. This also reflects the importance of considering local information, long-range dependencies, and key information in music to improve the accuracy of continuous music emotion recognition.
Through Figure 11, we can visualize that the predicted and actual data have a high degree of matching, which clearly proves that arousal and valence can be calculated for fitting.
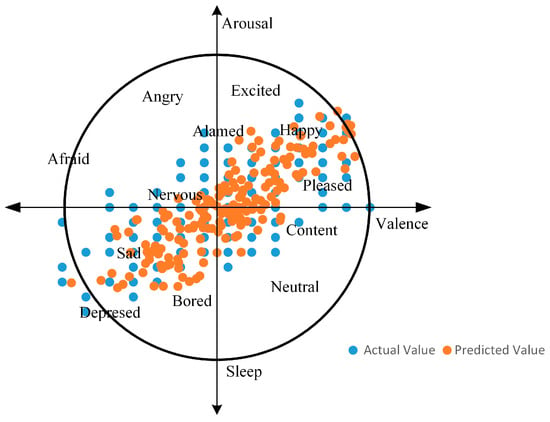
Figure 11.
The trend of actual versus predicted values.
Table 4 demonstrates the performance evaluation metrics of CBA models after extracting deep music emotion features using different deep learning models. There are differences in the performance of different deep learning models in the arousal and valence dimensions. For example, DenseNet121, DenseNet169, and DenseNet201 all achieve high levels of correlation coefficients in the arousal dimension and perform relatively well in the valence dimension. ResNet152 and DenseNet169 perform better in emotion recognition, only in the valence dimension. The DenseNet family of models showed better performance in most cases because each layer was connected to all previous layers, enhancing the transfer of deep musical features in each layer and improving efficiency while reducing the number of parameters. The Xception model performed more generally in both the arousal and valence dimensions because of the dataset used for the experiments. The small amount of data, coupled with the complexity of the Xception model, may lead to an increased risk of overfitting, reducing the model’s ability to generalize and leading to poor performance on unseen data.

Table 4.
CBA model performance after extracting deep music emotion features using different deep learning models.
As can be seen from Table 5, we compared three music emotion recognition models. Based on the MAE index, the model designed in this experiment has a better utility in this field of music emotion recognition.

Table 5.
A comparison table of state-of-the-art methods.
Table 6 shows the effect of different data processing methods on the model performance in the emotion recognition task. Training and testing the model using the raw data yielded correlation coefficients of 0.459 and 0.442 and mean absolute errors of 0.147 and 0.139. The correlation coefficients improved slightly after image enhancement was applied to the data. After standardizing the data, the correlation coefficients were further improved, and the mean absolute errors were reduced, indicating that data standardization can improve the correlation and accuracy of the model. This is because data standardization can reduce the correlation between deep music emotion features and improve the model’s ability to generalize the data. Normalized data makes it easier for the model to learn the true distribution of the data rather than being influenced by the scale and range of features. Combining the two methods of image enhancement and data normalization gave the best results with correlation coefficients of 0.612 and 0.120 and mean absolute errors of 0.599 and 0.123. Both correlation coefficients and mean absolute errors have been significantly improved and reduced, suggesting that the combination of the two methods has a positive impact on model performance. By combining different data processing methods, we can better improve the generalization ability of the model and reduce the risk of overfitting.

Table 6.
Impact of different data processing methods on model performance.
In the task of recognizing emotional content in violin music, we not only aim for the model to capture the overall trend of emotion changes but also to accurately predict specific emotional values. Looking at Figure 12, the CBA model successfully achieved a good balance between both metrics by combining the local feature extraction ability of CNN, the long-term dependency capturing ability of the GRU network, and the information filtering ability of the Attention mechanism. This also highlights the importance of considering local information, long-term dependencies, and key information in music for improving the accuracy of continuous music emotion recognition.
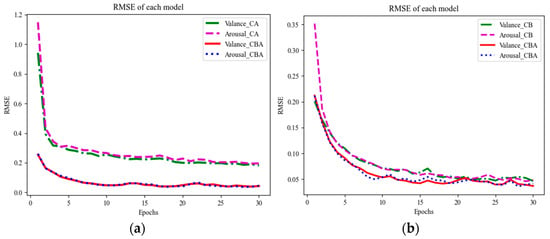
Figure 12.
Comparison of RMSE for different models. (a) Comparison between CA and CBA. (b) Comparison between CB and CBA.
5.2.2. Feature Fusion Experiment
In the comparative experiments of feature fusion, for each audio sample, we add silent segments to make the length of each audio sample 60 s. When extracting the vibrato rubbing string feature, we set the vibrato frequency range from 196 Hz to 3520 Hz based on the reference range of the violin’s pitch (Table 7).

Table 7.
Evaluation metrics results for different feature fusion methods.
During the feature fusion experiments, we found that using LLDs (Low-Level Descriptors) achieved better results compared to using only Mel spectrogram features or only fusing MFCC features. The MAE (mean absolute error) decreased by 0.018 and 0.021 when using LLDs compared to using only Mel spectrogram features. Furthermore, it decreased by 0.008 and 0.010 compared to only fusing MFCC features. The Pearson correlation coefficients also improved by 0.149, 0.134, and 0.022, 0.054, respectively.
This indicates that for the VioMusic dataset, LLDs contain more essential information regarding the trend of music emotion changes, enabling better capture of subtle variations and dynamic features in the music. Therefore, fusing LLDs with deep features allows for a more comprehensive representation of music characteristics, leading to improved accuracy in predicting emotional trends.
5.2.3. Comparison of Different Loss Functions
In the CBA model development, we used two different loss functions, MAE (mean absolute error) and MSE (mean squared error), for training the model. To assess the overall performance of the model, RMSE (root mean square error) was used as an evaluation metric. Figure 13 illustrates the experimental results using different loss functions, demonstrating that the model trained with the MAE loss function outperforms the one trained with the MSE loss function in terms of recognition accuracy.
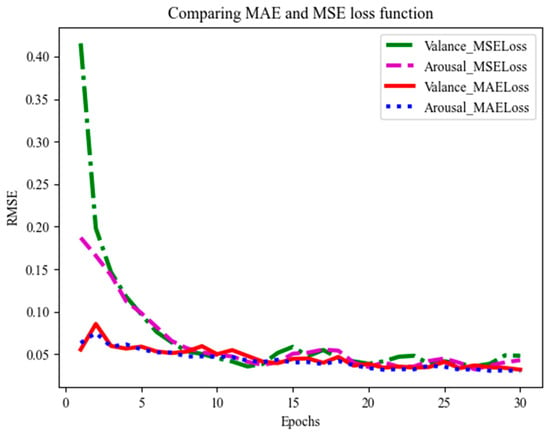
Figure 13.
Comparison of MSE and MAE loss functions.
In the VioMusic dataset, emotions conveyed by violin music are continuous and dynamic. The MAE (mean absolute error) loss function is particularly effective in this context as it robustly handles outliers in music features and accurately captures the overarching trends of emotional fluctuations. This ensures that the model consistently performs well, adeptly adapting to a wide range of emotional transitions, from the subtlest shifts to the most intense variations.
6. Conclusions
We have developed the first violin solo audio dataset, VioMusic, which comprises solo performances from three different artists and offers insights into emotional recognition. This dataset marks a significant milestone in music emotion recognition, filling a notable void where violin solos were previously unrepresented. Our experimental results show that integrating shallow acoustic features into the music emotion recognition model substantially boosts the recognition rate. This enhancement suggests that violin solo audio data possess a rich array of features, such as timbre and pitch, which significantly contribute to the improved performance of the model. However, it is crucial to acknowledge certain potential biases and limitations that arose during the sample collection process. These primarily stem from the limited equipment and the varying levels of technical expertise of the recording personnel. As a result, the sound quality of these recordings may not always reach the high standards of professional studio recordings and might include instances of noise and background interference. Additionally, variations in the quality of the instruments and the expertise of the recording personnel could affect the overall quality of the dataset. Another important limitation to consider is related to the CNN–BiGRU–Attention model used in this experiment. This model depends heavily on a substantial amount of labeled data for effective training and performance. Acquiring enough labeled data for specific domains or tasks can be challenging, which may impact the model’s effectiveness. Despite these challenges, the creation of VioMusic and the insights gained from integrating shallow acoustic features have opened exciting new avenues for future research in music emotion recognition. These developments pave the way for enhanced model performance and a deeper understanding of the field. Moving forward, we plan to continue exploring additional musical features for violin music emotion recognition to further our research and applications in this innovative area.
Author Contributions
Conceptualization, R.Z.; methodology, S.M. and R.Z.; formal analysis, S.M. and R.Z.; investigation, S.M. and R.Z.; resources, S.M. and R.Z.; data curation, S.M.; writing—original draft preparation, S.M.; writing—review and editing, S.M. and R.Z. All authors have read and agreed to the published version of the manuscript.
Funding
This research received no external funding.
Institutional Review Board Statement
Not applicable.
Informed Consent Statement
Informed consent was obtained from all subjects involved in the study.
Data Availability Statement
Data is available at https://github.com/mm9947/VioMusicv (accessed on 24 March 2024).
Acknowledgments
The authors express their gratitude to the generous volunteers who contributed to the VioMusic dataset. Without their involvement, creating this audio dataset would not have been possible. The authors sincerely appreciate their participation and support.
Conflicts of Interest
The authors declare no conflicts of interest.
References
- Sun, H. China’s Music Industry to Total over 378.7 Billion Yuan by 2021; China Press, Publication, Radio and Television News: Beijing, China, 2023. [Google Scholar] [CrossRef]
- Daneshfar, F.; Kabudian, S.J.; Neekabadi, A. Speech emotion recognition using hybrid spectral-prosodic features of speech signal/glottal waveform, metaheuristic-based dimensionality reduction, and Gaussian elliptical basis function network classifier. Appl. Acoust. 2020, 166, 107360. [Google Scholar] [CrossRef]
- Matsunaga, M.; Kikusui, T.; Mogi, K.; Nagasawa, M.; Myowa, M. Breastfeeding dynamically changes endogenous oxytocin levels and emotion recognition in mothers. Biol. Lett. 2020, 16, 20200139. [Google Scholar] [CrossRef] [PubMed]
- Zhao, H.; Ning, Y.E.; Wang, R. Improving cross-corpus speech emotion recognition using deep local domain adaptation. Chin. J. Electron. 2022, 32, 640–646. [Google Scholar]
- Yang, P.T.; Kuang, S.M.; Wu, C.C.; Hsu, J.L. Predicting music emotion by using convolutional neural network. In Proceedings of the 22nd HCI International Conference, Copenhagen, Denmark, 19–24 July 2020; pp. 266–275. [Google Scholar]
- Liu, X.; Chen, Q.; Wu, X.; Liu, Y.; Liu, Y. CNN based music emotion classification. arXiv 2017, arXiv:1704.05665. [Google Scholar] [CrossRef]
- Coutinho, E.; Weninger, F.; Schuller, B.; Scherer, K.R. The munich LSTM-RNN approach to the MediaEval 2014” Emotion in Music” Task. In Proceedings of the CEUR Workshop Proceedings, Crete, Greece, 27 May 2014; p. 1263. [Google Scholar]
- Li, X.; Xianyu, H.; Tian, J.; Chen, W. A deep bidirectional long short-term memory based multi-scale approach for music dynamic emotion prediction. In Proceedings of the 2016 IEEE International Conference on Acoustics, Speech and Signal Processing (ICASSP), Shanghai, China, 20–25 March 2016; pp. 544–548. [Google Scholar]
- Hizlisoy, S.; Yildirim, S.; Tufekci, Z. Music emotion recognition using convolutional long short term memory deep neural networks. Engineering Science and Technology. Eng. Sci. Technol. Int. J. 2021, 24, 760–767. [Google Scholar]
- Yan, Z.; Jianan, C.; Fan, W.; Bin, F. Research and Implementation of Speech Emotion Recognition Based on CGRU Model. J. Northeast. Univ. (Nat. Sci. Ed.) 2020, 41, 1680–1685. [Google Scholar]
- Xie, Y.; Liang, R.; Liang, Z.; Huang, C.; Zou, C.; Schuller, B. Speech emotion classification using attention-based LSTM. IEEE/ACM Trans. Audio Speech Lang. Process. 2019, 27, 1675–1685. [Google Scholar] [CrossRef]
- Jingjing, W.; Ru, H. Music Emotion Recognition Based on Wide and Deep Learning Network. J. East China Univ. Sci. Technol. (Nat. Sci. Ed.) 2022, 48, 373–380. [Google Scholar] [CrossRef]
- Koh, E.; Dubnov, S. Comparison and analysis of deep audio embeddings for music emotion recognition. arXiv 2021, arXiv:2104.06517. [Google Scholar]
- Huang, Z.; Ji, S.; Hu, Z.; Cai, C.; Luo, J.; Yang, X. ADFF: Attention Based Deep Feature Fusion Approach for Music Emotion Recognition. arXiv 2022, arXiv:2204.05649. [Google Scholar]
- Zhong, Z.; Wang, H.; Su, G. Music emotion recognition fusion on CNN-BilSTM and Self-Attention Model. Comput. Eng. Appl. 2023, 59, 94–103. [Google Scholar]
- Li, Z.; Yu, S.; Xiao, C. CCMusic: Construction of Chinese Music Database for MIR Research. J. Fudan Univ. (Nat. Sci. Ed.) 2019, 58, 351–357. [Google Scholar] [CrossRef]
- Turnbull, D.; Barrington, L.; Torres, D.; Lanckriet, G. Semantic annotation and retrieval of music and sound effects. IEEE Trans. Audio Speech Lang. Process. 2008, 16, 467–476. [Google Scholar] [CrossRef]
- Koelstra, S.; Muhl, C.; Soleymani, M.; Lee, J.-S. Deap: A database for emotion analysis; using physiological signals. IEEE Trans. Affect. Comput. 2011, 3, 18–31. [Google Scholar] [CrossRef]
- Baum, D. Emomusic-Classifying music according to emotion. In Proceedings of the 7th Workshop on Data Analysis (WDA2006), Kosice, Slovakia, 1–3 July 2006. [Google Scholar]
- Aljanaki, A.; Yang, Y.H.; Soleymani, M. Developing a benchmark for emotional analysis of music. PLoS ONE 2017, 12, e0173392. [Google Scholar] [CrossRef]
- Wolff, D.; Weyde, T. Adapting similarity on the MagnaTagATune database: Effects of model and feature choices. In Proceedings of the International Conference on World Wide Web, Lyon, France, 16–20 April 2012. [Google Scholar] [CrossRef]
- Chen, Y.A.; Yang, Y.H.; Wang, J.C.; Chen, H. The AMG1608 dataset for music emotion recognition. In Proceedings of the 2015 IEEE International Conference on Acoustics, Speech and Signal Processing (ICASSP), South Brisbane, QLD, Australia, 19–24 April 2015; pp. 693–697. [Google Scholar]
- Defferrard, M.; Benzi, K.; Vandergheynst, P.; Bresson, X. FMA: A dataset for music analysis. arXiv 2016, arXiv:1612.01840. [Google Scholar]
- Eerola, T.; Vuoskoski, J.K. A comparison of the discrete and dimensional models of emotion in music. Psychol. Music 2011, 39, 18–49. [Google Scholar] [CrossRef]
- Zentner, M.; Grandjean, D.; Scherer, K.R. Emotions evoked by the sound of music: Characterization, classification, and measurement. Emotion 2008, 8, 494. [Google Scholar] [CrossRef] [PubMed]
- Russell, J.A. A circumplex model of affect. J. Personal. Soc. Psychol. 1980, 39, 1161. [Google Scholar] [CrossRef]
- Reynaldo, J.; Santos, A. Cronbach’s alpha: A tool for assessing the reliabilityof scales. J. Ext. 1999, 37, 1–5. [Google Scholar]
- McFee, B.; Raffel, C.; Liang, D.; Ellis, D. librosa: Audio and music signal analysis in python. In Proceedings of the 14th Python in Science Conference, Austin, TX, USA, 6–12 July 2015; Volume 8, pp. 18–25. [Google Scholar]
- Fletcher, N.H. Vibrato in music–physics and psychophysics. In Proceedings of the International Symposium on Music Acoustics, Sydney, Australia, 30–31 August 2010; pp. 1–4. [Google Scholar]
- Grekow, J. Music emotion recognition using recurrent neural networks and pretrained models. J. Intell. Inf. Syst. 2021, 57, 531–546. [Google Scholar] [CrossRef]
- Arandjelovic, R.; Zisserman, A. Look, listen and learn. In Proceedings of the IEEE International Conference on Computer Vision (ICCV), Venice, Italy, 22–29 October 2017; pp. 609–617. [Google Scholar]
- Verma, G.; Dhekane, E.G.; Guha, T. Learning affective correspondence between music and image. In Proceedings of the IEEE International Conference on Acoustics, Speech and Signal Processing, Brighton, UK, 12–17 May 2019; pp. 3975–3979. [Google Scholar]
Disclaimer/Publisher’s Note: The statements, opinions and data contained in all publications are solely those of the individual author(s) and contributor(s) and not of MDPI and/or the editor(s). MDPI and/or the editor(s) disclaim responsibility for any injury to people or property resulting from any ideas, methods, instructions or products referred to in the content. |
© 2024 by the authors. Licensee MDPI, Basel, Switzerland. This article is an open access article distributed under the terms and conditions of the Creative Commons Attribution (CC BY) license (https://creativecommons.org/licenses/by/4.0/).