Article

Measuring Potential People’s Acceptance of Mobility as a Service: Evidence from Pilot Surveys

Dipartimento di Ingegneria dell’Informazione, delle Infrastrutture e dell’Energia Sostenibile, DIIES, Università degli Studi Mediterranea di Reggio Calabria, 89122 Reggio Calabria, Italy
*
Author to whom correspondence should be addressed.
Information 2024, 15(6), 333; https://doi.org/10.3390/info15060333
Submission received: 7 May 2024 / Revised: 21 May 2024 / Accepted: 30 May 2024 / Published: 6 June 2024

Abstract

:
Sustainable mobility is one of the main challenges on a global level. In this context, the emerging Mobility as a Service (MaaS) plays an important role in the mobility of people. This paper investigates the main enabling factors for implementing the MaaS paradigm, with a specific focus on the level of acceptance of this new technology. To achieve this objective, the proposed methodology for measuring the potential MaaS acceptance is based on a set of pilot surveys. The methodology integrates motivational surveys with Stated and Revealed Preference (SP, RP) and Technology Acceptance Models (TAM). The collected data are processed to obtain indicators that measure the potential level of MaaS acceptance. The main results of the two pilot experiments are illustrated by referring to urban and extra-urban mobility with or without physical barriers. The results obtained show that the level of MaaS acceptance grows with the increase in generalized transport costs perceived by the users.

1. Introduction

Mobility as a Service (MaaS) is a new paradigm that is useful for approaching people’s mobility. Information and Communication Technologies (ICTs), together with Transport System Models (TSMs), enable new functions to integrate information and transport services by new operators and digital platforms. MaaS has three characterizing elements [1]: the centrality of user needs on which the design of the transport supply and information services and infrastructures must be based; the integration of ICTs and TSMs; and the achievement of objectives related to sustainability. The main peculiarity of MaaS, therefore, concerns the planning, design, and implementation of integrated services based on the concept of shared and connected mobility, understood as a combination of services to be used as “unicum”, depending on the user’s need [2,3]. With the application of the MaaS concept, the user is provided with a portfolio/bundle of integrated intermodal mobility and information services, which are the product of an integrated design [4].
The improvement of the transport system contributes transversally to the achievement of sustainability objectives and goals in all its components (social, economic, and environmental), in accordance with the 2030 Agenda signed on an international scale by 193 United Nations (UN) countries [5]. In this context, the evolution of the transport system towards the MaaS paradigm accelerates the trend towards achieving the set of sustainable goals and relative quantitative targets. It is necessary to distinguish the demand component connected to the mobility of people, the subject of this report, from that connected to the mobility of goods, for which similar concepts are available [6]. Regarding passenger mobility, the transport system is moving from the integration of services and fares to MaaS. A similar situation is active in the mobility of goods. The system is moving from SOL, Self-Organized Logistics, to LaaS, Logistics as a Services, and FaaS, Freight as a Service. Figure 1 synthetically shows the issue and components and their integration. Transport systems enable people to carry out their daily activities and move goods to achieve sustainable goals.
In recent years, the MaaS concept has been defined and implemented in several contexts [7]. The literature reviews the different specifications of this paradigm [8] and different real implementations. The main factors contributing to a successful MaaS implementation emerge from the analysis of existing applications [9]. Among these, users’ needs in terms of information on travel and payment options constitute the essential requirements that must be investigated. The “user-centric” approach is common to the MaaS definitions. The concept is evolving towards the possibility of achieving sustainability goals [10]. By focusing on people’s mobility, the achievement of the goals depends on the possibility of changing the travel user’s habits towards more sustainable transport modes. Advancements in Information and Communication Technology (ICT) must be accompanied by advancements in understanding users’ behaviors in a MaaS context. According to Hensher and Hietanen [11], another possible evolution concerns the extension from MaaS, which includes transport and information services, to MaaF (Mobility as a Feature), which includes a broader set of activities provided by private and public sectors. The benefits for users must be linked to concrete results in terms of sustainability achievable exclusively through behavioral changes with respect to users’ travel habits.
Some limitations in the literature are present, mainly in relation to barriers and enablers factors that, respectively, limit and promote the implementation of MaaS [12,13].
From the literature review, the necessity to produce greater insights into the influence of potential MaaS implementation on user behavior to measure the willingness to change one’s travel habits emerges. This requires the development of surveys to gain insights into current mobility behavior and the potential acceptance of a MaaS implementation. However, investigations can be expensive and complex. Therefore, it is essential to have some preliminary indications on the barriers and enablers to be investigated to measure people’s acceptance of MaaS towards achieving sustainable goals.
The main objective of this research is linked to the following question: how is it possible to support the design of an extended investigation aimed at the construction of TSMs aimed at evaluating the sustainability components?
It is essential to design an extended survey, identifying the main variables that characterize the supply system and user behavior. It is especially necessary in scenarios different from the current ones, to avoid waste of monetary resources and time and support the construction of TSMs. This is possible through the development of pilot surveys before the extended survey.
In this research context, this document proposes to design and combine several pilot projects in contiguous areas of the same territory, where it is possible to implement a single MaaS system, which has different characteristics (e.g., urban/extra-urban mobility; continuous/discontinuous territorial mobility; and different typology and frequency of services and methods).
The common and combined analysis allows analysts to better understand which factors to investigate in a large and non-homogeneous area (such as mobility and transport services) and which data are necessary for the construction of useful TSMs aimed at supporting the estimation of the effects on sustainability.
Section 2 and Section 3 are preparatory with respect to the literature but necessary for the construction of TSMs aimed at estimating sustainability. Section 2 describes the main MaaS enablers in a smart city context to increase sustainable mobility. Section 3 indicates the main quantitative methods for evaluating MaaS aimed at estimating user acceptance. Section 4 describes the main results of two pilot testing investigations relating to an urban and extra-urban area with or without physical barriers and the evaluation of sustainability indicators. The common aspects of the developed pilot projects are presented with estimates of sustainability indicators. Section 5 discusses and highlights the observed variables that require further investigation.

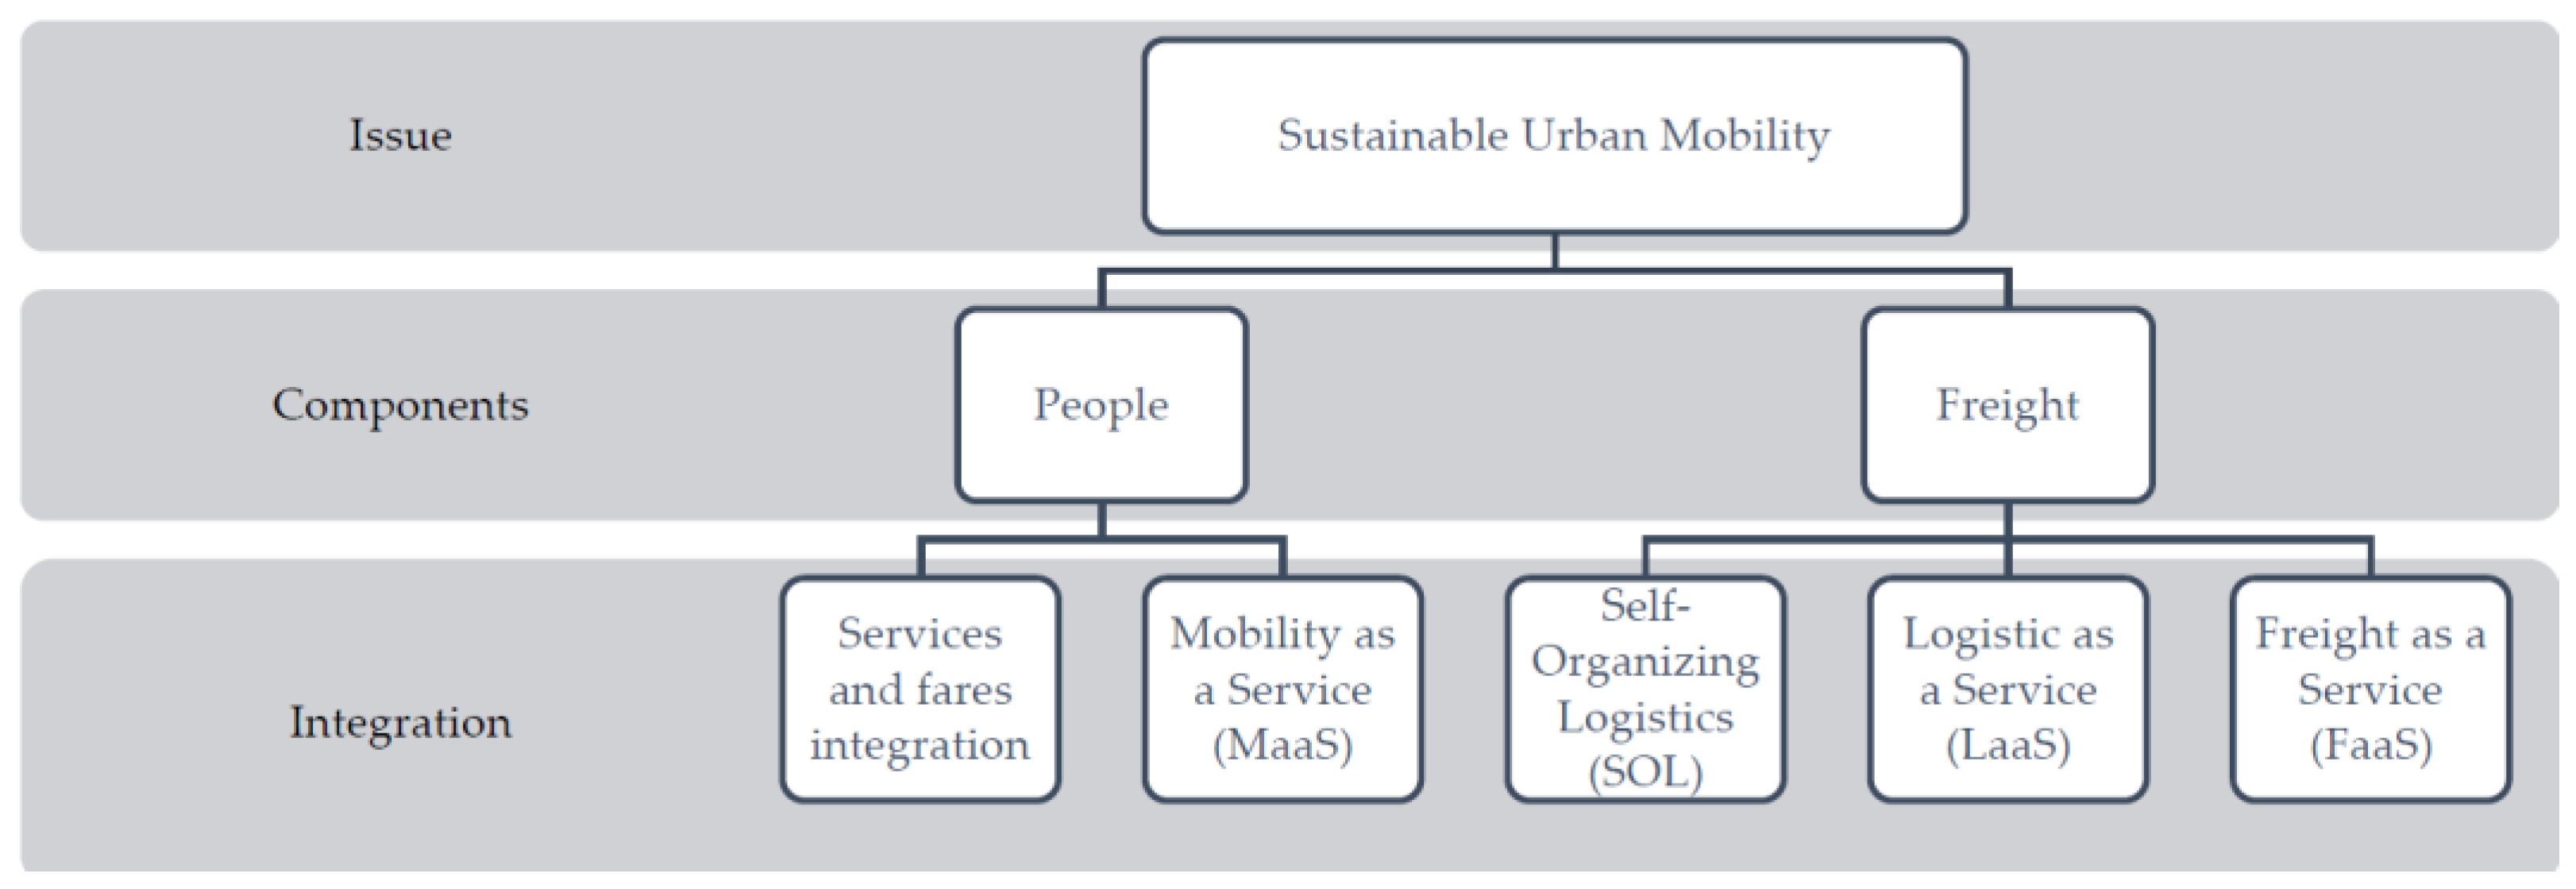
2. The MaaS Enablers

This section introduces the characteristics of the MaaS system (Section 2.1), the actors involved and the MaaS levels (Section 2.2), and the roles of TSMs useful for MaaS evaluation (Section 2.3).

2.1. The Smart City Context

Following the European approach, the smart city is based on three closely interconnected pillars [14] as follows:
  • The Information and Communication Technology (ICT) system;
  • The transport system, including infrastructure, services, and mobility needs (transport);
  • The system of production, distribution, and consumption of energy (energy).
The smart city integrates the three systems through the Sustainable Urban Mobility Plan (SUMP), a planning tool suggested by the European Commission to achieve directly and indirectly the various SDGs. MaaS represents an example of integration between the three systems within the smart city to improve people’s mobility. This implies the need to better understand the phenomenon of mobility and its interrelationships with ICTs and those for energy production and consumption.
MaaS is based on the integration of different information and mobility services, such as local public transport by road and rail, car sharing, ride sharing, bike sharing, and taxis presented to the user on a single platform travel option. Users can access, obtain information, and pay for services in a simple and flexible way, considering the option as a valid alternative to using their own vehicle (e.g., car) and/or on foot. This is possible not only thanks to the creation of a digital platform (an app or a website) but also to a correct design of the transport supply based on demand.
This mobility paradigm favors the use of public transport and the reduction in private traffic, contributing to increasing economic, environmental, and social sustainability. The correct implementation of MaaS promotes the reduction in traffic congestion. This has repercussions in terms of increases to the following:
  • Economic sustainability is measurable, for example, in terms of a reduction in the monetary costs for users;
  • Social sustainability is measurable, for example, in terms of the variations of accessibility perceived by MaaS users in terms of variations of the satisfaction variable between the current and the MaaS scenarios;
  • Environmental sustainability is measurable, for example, in terms of energy savings perceived by MaaS users.
MaaS guarantees promoting a more equitable transportation system and is equally significant in safeguarding transportation rights. The purchase and management of private means of transport are becoming increasingly costly in financial terms. Alternatively, MaaS can guarantee the right to mobility because it increases the possibilities of moving with greater freedom, even for the most disadvantaged members of the population.
In summary, MaaS contributes to the achievement of most of the SDGs indicated in the 2030 Agenda because it represents an innovative and sustainable solution to improve transport accessibility and the quality of life of citizens (Figure 2).
Achieving the goals, therefore, depends on the implementation of an integrated transport planning process that aims to create a sustainable mobility system within a smart city.
Further details are reported in [10].

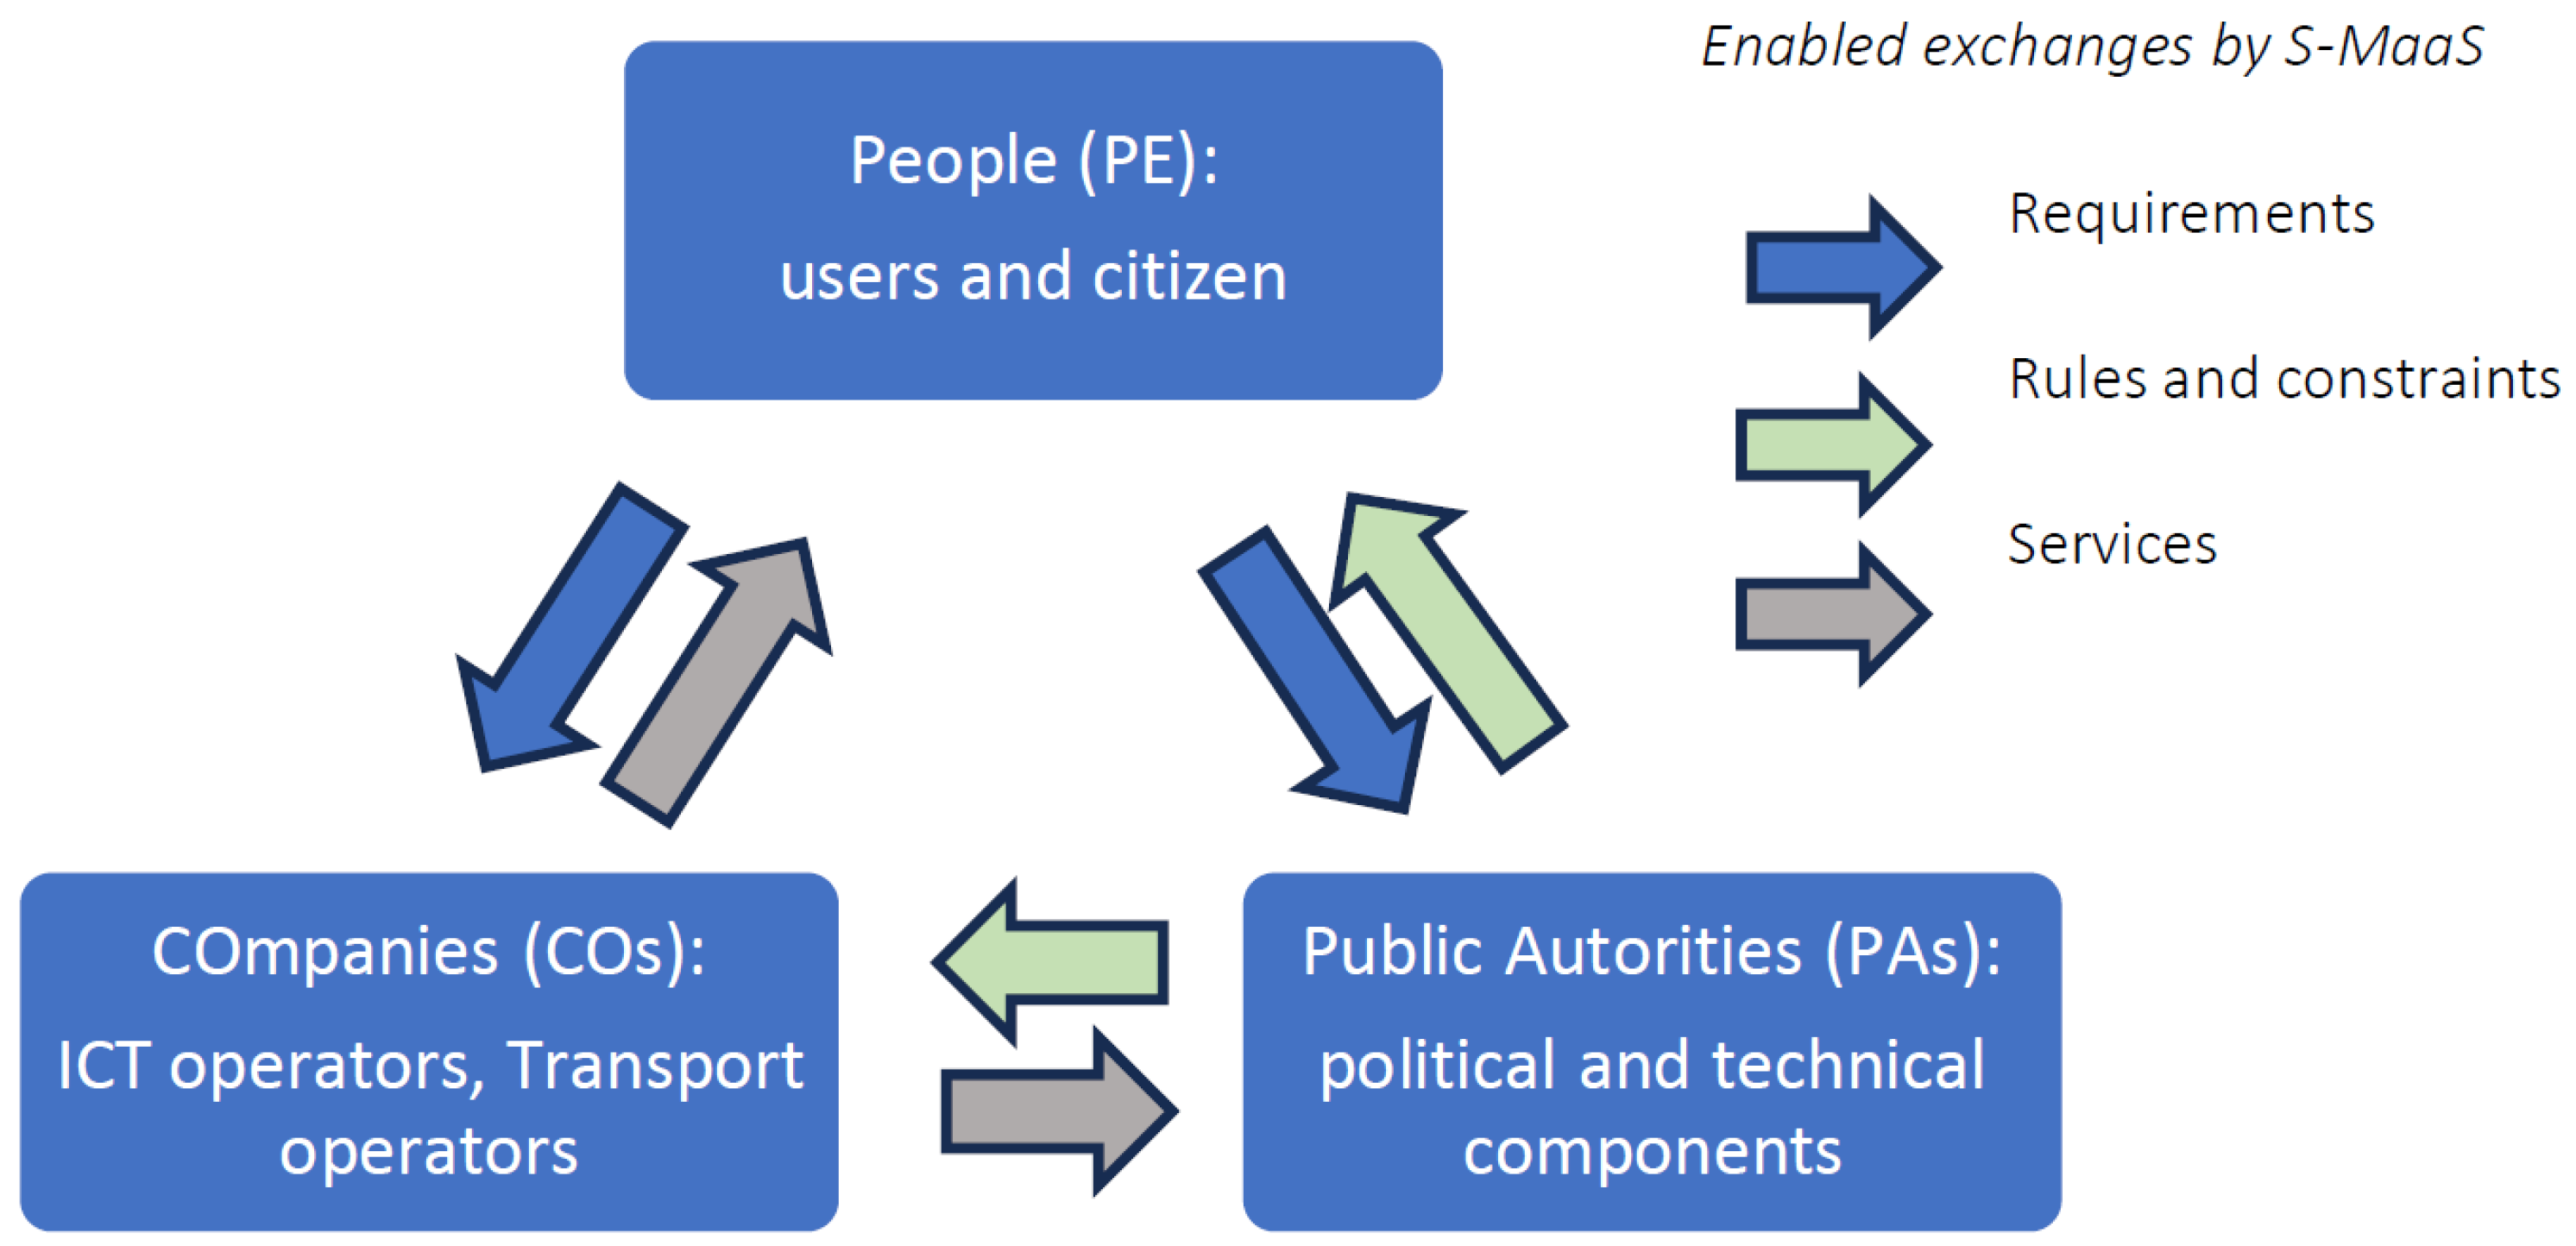
2.2. Involved Actors and Levels

The implementation of the MaaS paradigm implies a close connection between the population, the mobility components, and the components that characterize the decision-making process. This is possible by considering at least one of the following:
  • The mobility needs of users are placed at the center of the system design aimed at achieving sustainability goals and targets;
  • Mobility services are provided by various real operators and integrated by virtual operators;
  • Digital platforms integrated through ICT tools to offer users’ and operators’ information services (information, reservations, payments, monitoring, feedback, etc.).
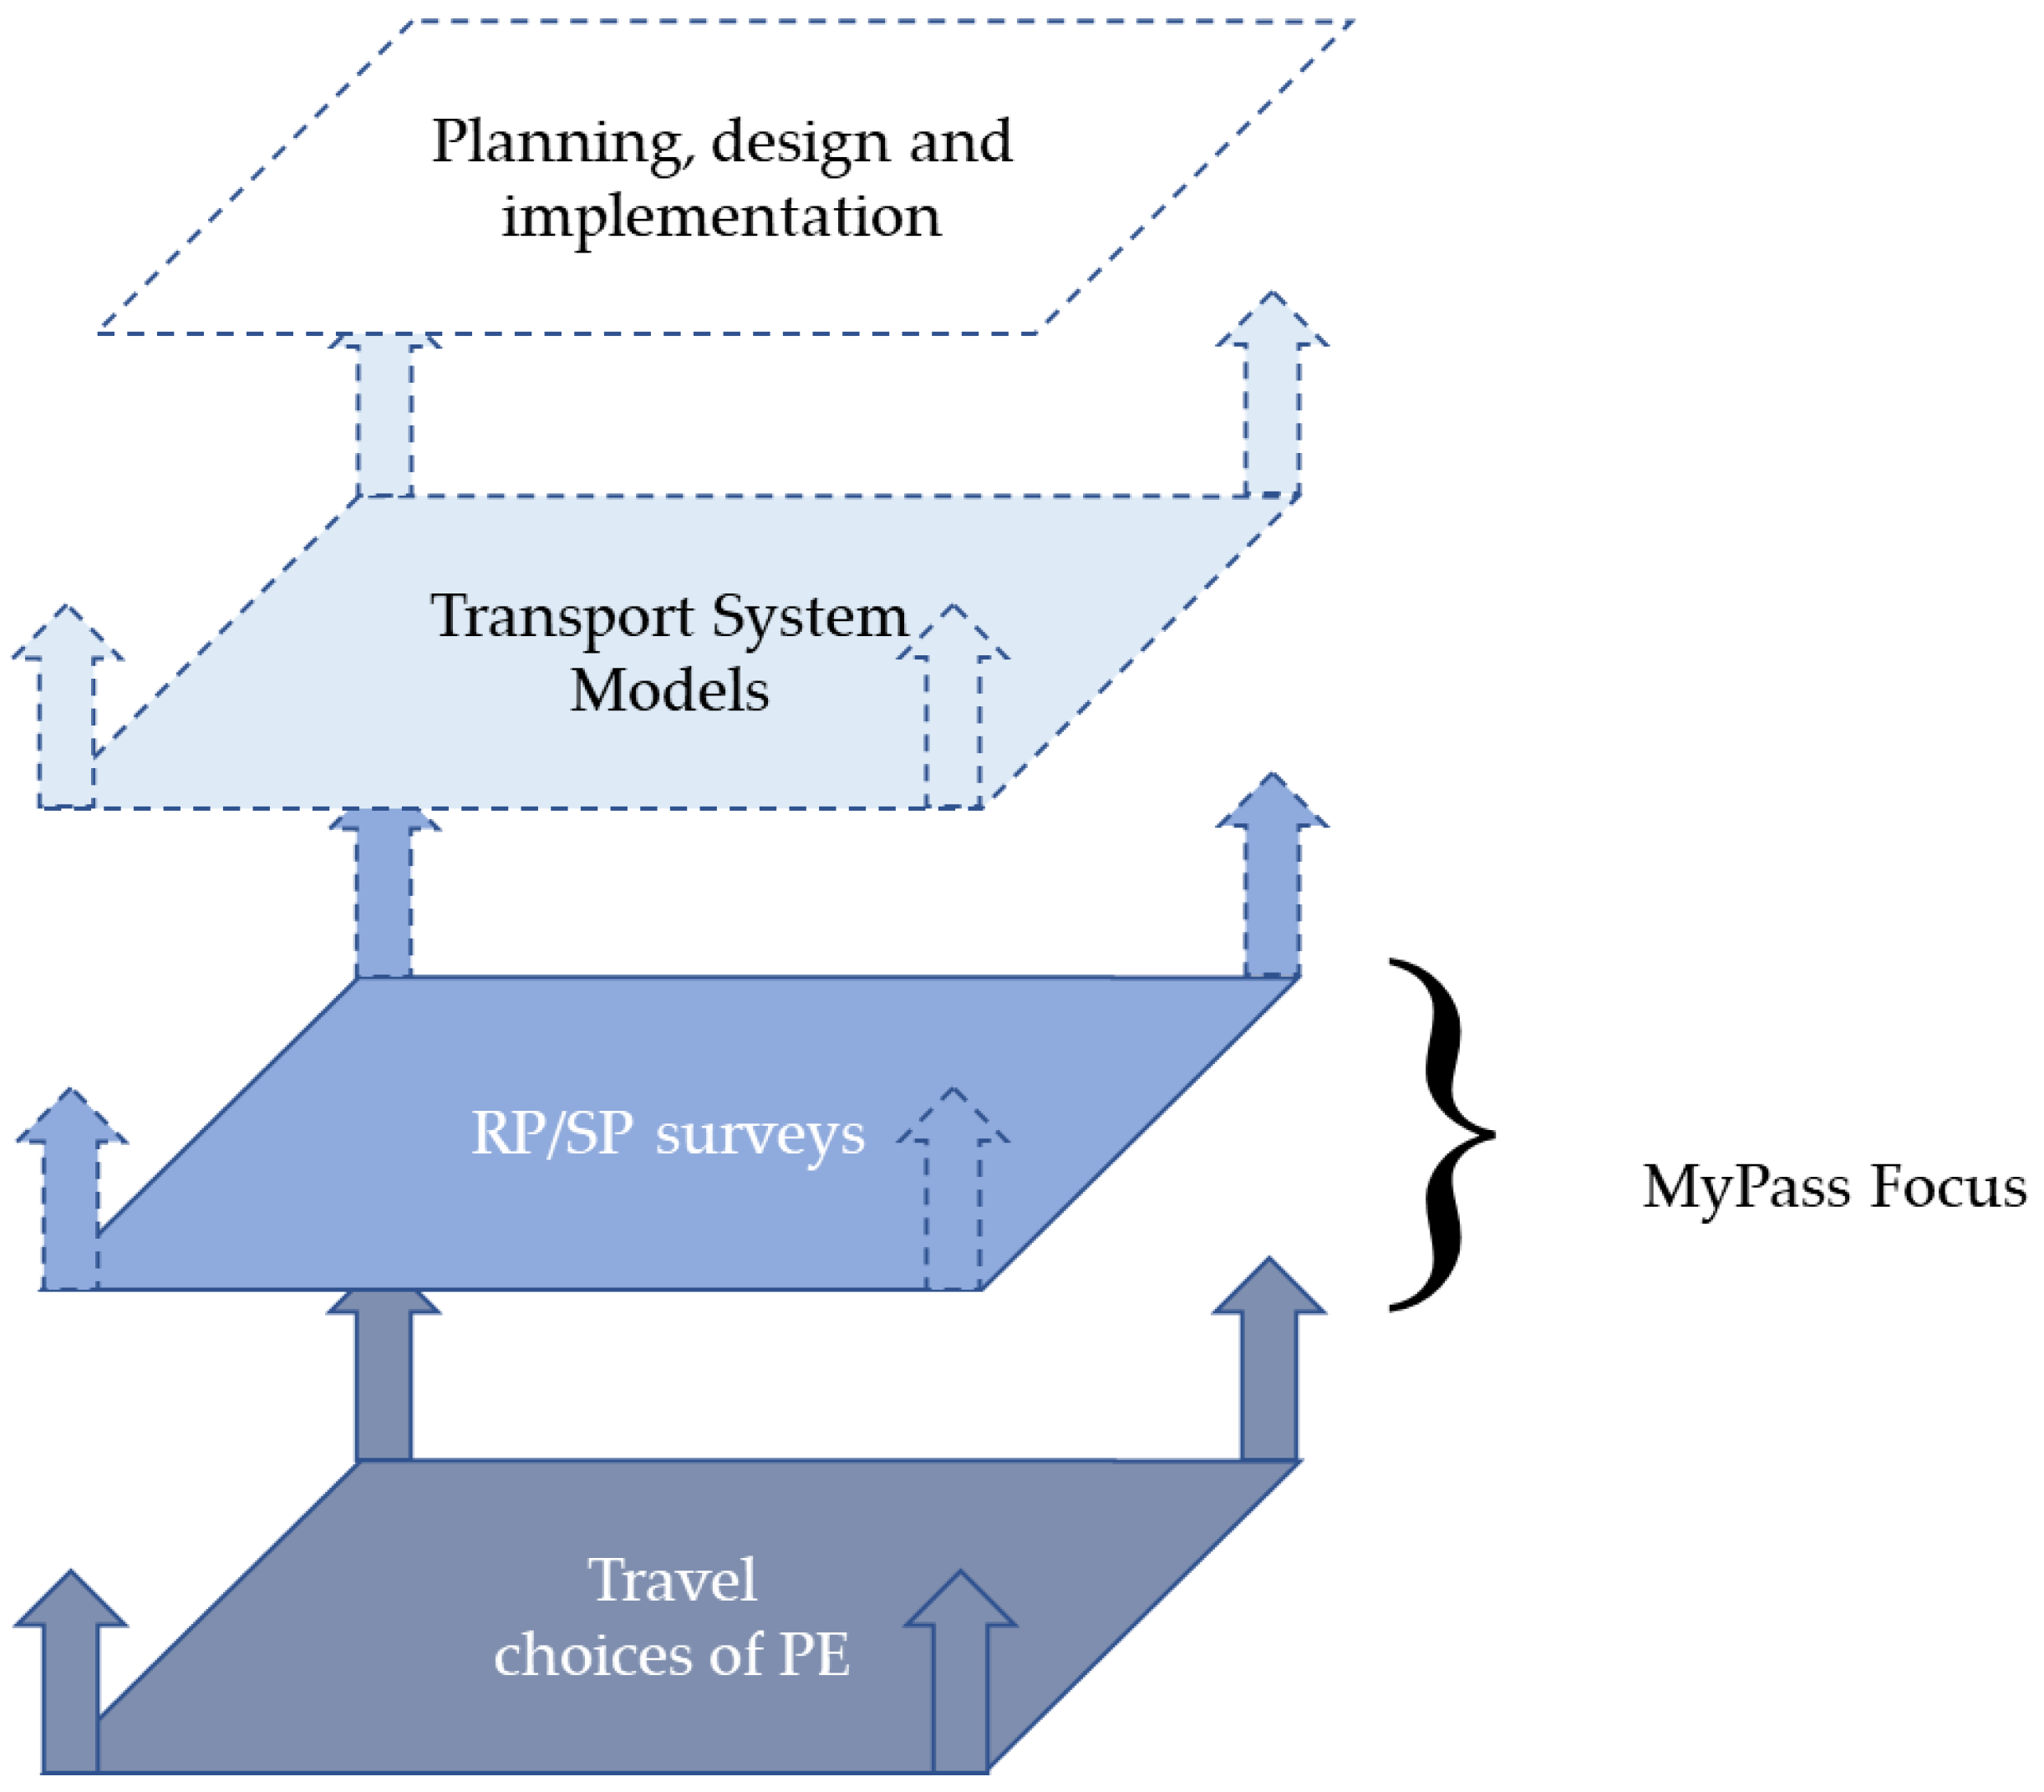
The integration of existing transport services and information or shared mobility services alone cannot be considered MaaS. The paradigm implies the need to create an ecosystem that involves different actors (Figure 3) who can be grouped mainly into three groups: People (PE), including users and citizens; Public Authorities (PAs), including political and technical components; and COmpanies (COs), including transport and ICT operators.
MaaS has different facets and evolutionary stages [15]. A set of transport services integrated with ICT tools represents the first level, defined as I-MaaS or MaaS 1.0. With the support of TSMs, integrated within the Decision Support System (DSS), it is possible to design the system, evolving into the second level, defined as T-MaaS, or MaaS 2.0. With the integration of the Environmental Impact Functions (EIFs) into the DSS, it is possible to evaluate the contribution of the MaaS implementation to the SDGs of the 2030 Agenda. The system evolves towards Sustainable MaaS (S-MaaS) or MaaS 3.0.
The S-MaaS paradigm, therefore, enables mutual exchanges between the mobility needs of PAs and PE and transport and information service operators (COs) (Figure 3). This means achieving a balance between the objectives of each component and respecting the constraints (regulatory, financial, and behavioral). The lack of technologies and/or models and methods limits exchanges and, therefore, represents a barrier to the sustainable development of mobility. To this end, it is necessary to use tools to assess the impacts produced by the mobility of people who are the subject of Section 2.

2.3. TSM Roles

Given the centrality of user needs in the implementation of the MaaS paradigm, it is necessary to resort to consolidated tools to collect information and data on users’ mobility choices. It is possible to refer to different sources of information and statistical tools for direct estimation and modeling estimation of travel choices. Motivational surveys can be designed and carried out aimed at collecting disaggregated information on travel choices relating to a sample of individuals. The tools offered by emerging ICTs allow this information to be acquired and accompanied by spatiotemporal data (e.g., positions in space and time of a traveling user). The type of survey and the size of the sample depend on the type of analysis, project, and therefore, model to be built (specify, calibrate, validate).
The surveys cannot only be of the TAM (Technology Acceptance Model) type [16]. Generally, the surveys are aimed at reconstructing users’ choices in the current transport configuration to estimate the transport demand in the current system configuration (Revealed Preferences or RP surveys). It is also possible to conduct surveys to reconstruct users’ choices in hypothetical scenarios linked to possible evolutions of the system (the so-called “scenarios”) to obtain forecasts of future demand (Stated Preferences or SP surveys). TSMs support decision makers in their ex ante evaluations of transport planning scenarios. More details are provided in Section 3.
The surveys are useful for the construction of TSMs (specify, calibrate, validate) and, therefore, subsequently, for the planning, design, and implementation of mobility services. The correct design of motivational surveys, therefore, has a fundamental role for the development of simulation models of transport systems and their support in the planning, design, and implementation of transport systems (Figure 4).

3. Measuring the Potential MaaS Acceptance

The evaluation of transport service acceptance is an important process for understanding how users perceive and adopt a certain service and for predicting the system state. There are several methods used to evaluate service acceptance, which allow you to obtain valuable information about user experience and overall satisfaction. This section introduces some of the methods that can be adopted (Figure 5, described in the sub-sections).
Starting from the definition of the characteristics of MaaS, it is possible to design (Section 3.1) specific motivational surveys (RP/SP) and TAMs (Section 3.2) by collecting the information in a database (Section 3.3). The results of the analyses can be represented through indicators that measure the potential level of MaaS acceptance.

3.1. Survey Designing

A survey of disaggregated data relating to user mobility can occur through direct observation of the trips of a sample of users. In the past, these surveys were carried out by operators; today, thanks to ICT tools, it has become much less expensive to carry out surveys.
With the technologies currently available, some characteristics of the trip can be determined autonomously (e.g., geolocation, use of means of transport). Other characteristics instead require direct interaction with the user, such as some transport choices (e.g., availability in the choice alternatives) and individual user characteristics (reasons for travel, socio-economic conditions, and desired arrival/departure time) via a survey form, which can also be submitted electronically. The survey form to be designed must, therefore, contain user and mobility characteristics that are directly and not directly observable automatically [17].
There are various sample extraction methodologies to which the survey form is subjected, including Simple Random Sampling (SRS), Stratified Random Sampling, and Cluster Sampling. Once data collection has been completed and the sample has been selected, the next step is the analysis phase.

3.2. Survey Analysis

The analysis of the data collected aims to understand the mobility phenomenon in the analyzed transport system. The analysis involves the application of quantitative and qualitative methods to understand users’ choices in real or hypothetical scenarios and the effects of transport services on mobility policies.
One of the main objectives of the analyses is to extract significant information from the collected data and use it to evaluate the performance of the transport system, identify problems and opportunities, evaluate the impacts of transport planning and policy decisions, and develop effective solutions to improve the sustainability of mobility before carrying out the interventions themselves.
A good analysis model, be it the TAM approach or the RP/SP approach, requires a process of survey, analysis, and “trial and error”, as well as the implementation of surveys with focus groups and pilot samples.

3.2.1. Technology Acceptance Model—TAM

The analysis using the TAM approach [16] evaluates the behavioral intention to understand the choices of acceptance of technologies by the users involved.
In its original formulation, the TAM approach is based on two classes of variables [16]: “The degree to which a person believes that using a particular system would enhance their job performance”, defined as Perceived Usefulness (PU), and “The degree to which a person believes that using a particular system would be free from effort”, defined as Perceived Ease of Use (PEU). PU represents the user’s belief that the use of technology will bring advantages and benefits in terms of improved efficiency, productivity, or satisfaction. PEU represents the user’s perception of the ease and comfort of using technology.
The TAM model is aimed at measuring the perception that users have of technology, evaluating, in general, the potential advantages in carrying out their daily activities.

3.2.2. Revealed and Stated Preferences (RP/SP) Surveys

To analyze user behavior for choices made or to be made in transport systems, user samples and two types of surveys can be used: SP, which is based on a real context already experienced by the user, and RP, which is based on a hypothetical context and which the user has not already experienced but can only make assumptions in hypothetical scenarios [18].
In RP surveys, a non-real/present (revealed) scenario is hypothesized and proposed to the sample of users. The user expresses preferences with respect to the real and current scenario. Compared to the SP model, the RP model allows the introduction of unavailable alternatives in the form of “initial hypotheses”. This methodology is particularly advantageous when new and untested scenarios are proposed to users and cannot be derived as evolutions of existing scenarios.
Each user can be subjected to multiple choice contexts, and it is possible to test multiple configurations and scenarios from which to select the most sustainable scenario.

3.2.3. Measurement Scale

Some questions submitted to users require a measurable response with a single quantitative variable (for example, georeferenced position, mode used, departure time, reason for travel).
When users express opinions on aspects that cannot be evaluated with unique quantitative variables, a qualitative indicator, such as the Likert scale, can be used. The Likert scale involves a set of statements to which individuals must express their degree of agreement or disagreement using an ordinal scale, usually with five or seven response levels. The scale is structured in such a way as to provide a wide range of response choices, ranging, for example, from “strongly disagree” to “strongly agree”. Often, a neutral point in the middle of the scale is also included, such as “neutral” or “no opinion”. The scores obtained through the Likert scale can be analyzed descriptively and statistically.
MaaS is the integrated union between a transport system and an ICT system. Therefore, a TAM and RP-SP, measured with quantitative variables and a Likert scale, are distinct concepts that can be used together to measure user acceptance and attitude towards a specific technology and transport service, such as MaaS.
For example, when measuring the perception of usefulness according to the TAM, a Likert scale could be used to evaluate the degree of user agreement with statements, such as “The use of this technology/app improves preferences travel?”; “Does this technology/app offer significant advantages in the choice of transport service compared to previously adopted systems?”; and “Is this technology/app easier to use for choosing the transport service to use than the systems adopted previously?”.

3.3. Evaluation Models

To evaluate a MaaS service, it is better to use a TAM and an RP/SP approach rather than using a TAM alone. The analysis must evaluate the acceptance of transport technologies and services. The MaaS paradigm considers the user at the center of the system, and its main objective is to move users in transport systems in a sustainable way; therefore, the survey will have to mainly focus on the analysis of the preference of MaaS transport services compared to individual and/or traditional ones. In the transport sector, the acceptance of transport services as a whole and not just the ICT component must be evaluated.
The evaluation of the results obtained can take place through the following:
  • Descriptive statistics (e.g., absolute and percentage values, frequency diagrams, mean, standard deviation, etc.);
  • Inferential statistics (e.g., confidence intervals, maximum likelihood);
  • Sustainable indicators (economic, societal, environmental).
1. In descriptive statistics, the data collected in the database are processed into explanatory indicators (e.g., percentage of declared preferences of the MaaS acceptance, statistics for user categories, …).
2. In the inferential statistics, with Random Utility [19] preference models, it is assumed that (i) each user has two alternatives (the model can be easily extended to considering a number of alternatives greater than two) available [20] and prefers MaaS (yes) or not (no); (ii) for each alternative, the user perceives a random utility, Uyes and Uno, respectively; and (iii) the probability to prefer MaaS is equal to the following:
p(yes) = probability(Uyes ≥ Uno)
Assuming the perceived utilities are identical and independently Gumbel distributed with parameters θ, Vyes, and Vno, respectively, the expected values of Uyes and Uno and the Logit model are obtained as follows:
p(yes) = eVyes/θ/(eVyes/θ + eVno/θ)
3. Furthermore, estimating the potential users who would be willing to use MaaS services allows us to evaluate the potential impacts on the main components of sustainability through appropriate indicators. It is possible to compare the current scenario and the one characterized by the presence of MaaS through changes in sustainability indicators.

4. Pilot Survey Tests

The methodology presented in Section 3 is tested through two pilot tests carried out in two areas of Reggio Calabria, a city in southern Italy: a part of the Messina Strait area, to the south, and the Gioia Tauro Area, to the north. The city is part of the vast area of the Strait of Messina and is separated from the sea, which constitutes a physical barrier [21]. In this area, there are infrastructures and services of each transport mode and, therefore, it presents a different potential for developing the MaaS paradigm.
The two tests represent the preparatory activities for an extensive survey within the MyPass project financed by the Italian Ministry of Research. The pilot sample was adopted before the survey project. Through the analysis of pilot samples, preliminary and statistical information regarding users’ choices is obtained. This information is used to design the survey, reported in the next sub-section. Small samples (between 10 and 30) in the pilot and exploratory studies have the advantages of the economy and simplicity of calculation. The pilot sample size is 47 users in the Strait of Messina and 21 users in the Gioia Tauro area, for a total of 68 users.

4.1. Survey Designing

The main characteristics of the two areas considered for carrying out the pilot tests are shown in Table 1. The two areas have different characteristics in terms of transport services, territorial characteristics, population density, and mobility characteristics. The choice of areas with different characteristics is adopted to test the pilot survey in different contexts and the robustness of the method.
The survey design consists of defining the potential characteristics of MaaS in the two study areas. The following sub-sections describe the hypothetical MaaS scenarios presented to the interviewees: user characteristics, current travel characteristics (SP), and potential MaaS travel characteristics (RP). Table 2 summarizes the scenarios, sub-scenarios, and survey characteristics for the two areas. The MaaS scenarios in the two study areas are described in the next sub-sections.
The surveys and characteristics are specified for the two focused areas in the next two sub-sections: Messina Strait (Section 4.1.1) and the Gioia Tauro area (Section 4.1.2).

4.1.1. Messina Strait

The Strait of Messina is a discontinuous area, comprising two metropolitan cities, separated by the sea, with a minimum maritime distance of approximately 4 km. The area has around one million inhabitants in an area of around two thousand square kilometers.
Mobility services consist of road services, rail services, and maritime services. Road services include buses, car sharing, and bike sharing. City street bus services are operated by two different city companies, one for each city. One company operates rail services. Private and public companies operate maritime services. There is no tariff integration, with fare reduction, between different collective transport companies nor between different collective or semi-collective service modes.
The transport service in the Strait of Messina area could improve not only for journeys relating to the mainland (both on the Calabrian and Sicilian sides) but above all, it could increase and improve the quality of journeys for users who move from one region to another. Most trips made from Calabria to Sicily and vice versa take place for work and/or study reasons. It was necessary to carry out a survey of the main services present in the area, starting from which the MaaS subscriptions offered to users during the interview were built.
Four scenarios are considered as follows:
  • Two scenarios relate to trips carried out on the mainland, i.e., carried out on a portion of territory located on one of the two sides of the Strait.
    -
    Scenario 1, without parking costs;
    -
    Scenario 2, with costs due to parking.
  • Two scenarios relate to trips carried out crossing the Strait of Messina.
    -
    Scenario 3, without cars on board the ship;
    -
    Scenario 4, with cars on board the ship.
For all scenarios, the user was presented with three sub-scenarios (A, B, and C) containing the same type of service but varying in terms of the quantity of services offered and the price of the travel package (bundle).
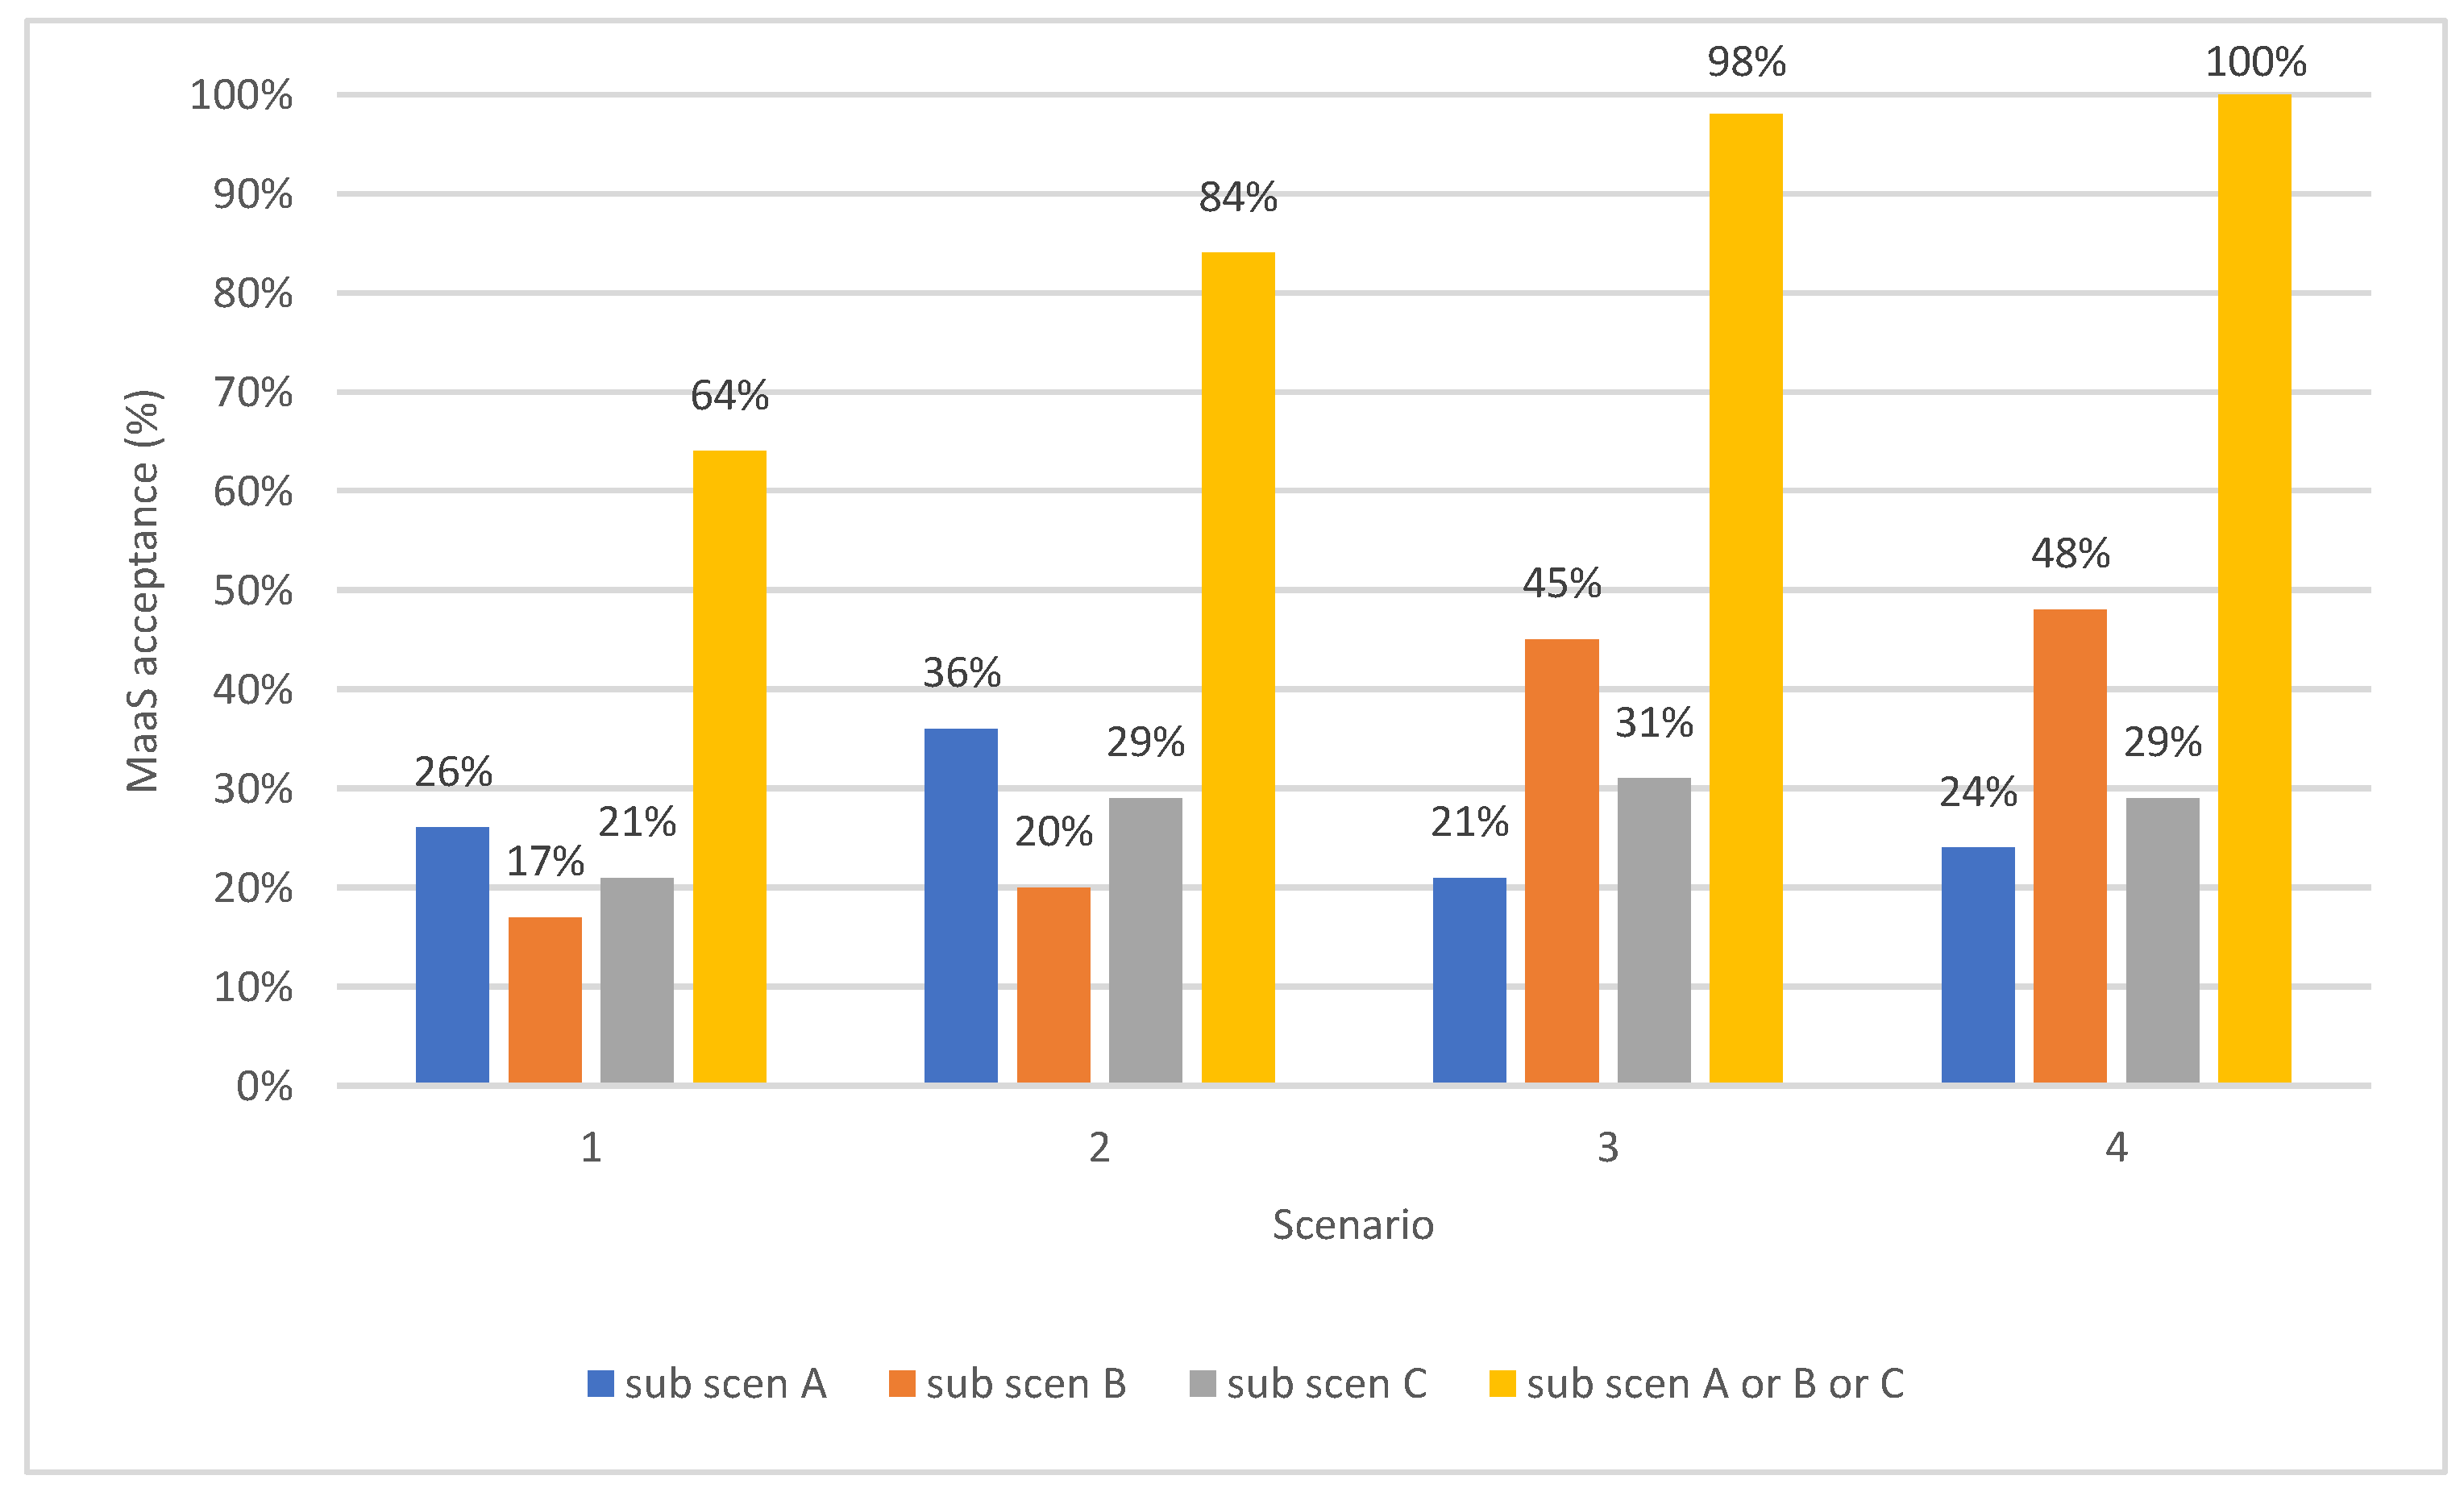
  • Sub-scenario A, reducing the number of services by 50% and the price of the bundle by 25% compared to sub-scenario B;
  • Sub-scenario B, considered as a basic reference, with the services reported in Table 2 (for details, see [22]) and the price of the bundle considering a price reduced by 33% compared to the real tariff referring to single services; sub-scenario B, considered as a basic reference, with the services reported in Table 2 (for further details, see [22]) and the price of the bundle considering a reduced price 33% compared to the real rate referring to individual services;
  • Sub-scenario C, increases the number of services by 50% and the price of the bundle by 25% compared to sub-scenario B.

4.1.2. Gioia Tauro Area

The second territorial context analysis in the experiment regards the area of Gioia Tauro in the Metropolitan City of Reggio Calabria in southern Italy.
It is a continuous area comprising 33 municipalities; it has around one hundred and fifty thousand inhabitants in an area of around one thousand square kilometers.
Mobility services consist of road services and railway services. Road services include buses, car sharing, and bike sharing. Around 15 companies operate road bus services. One company operates rail services. The transportation systems in the area are low frequency. In some time slots, it is not possible to reach a destination with collective transport. There is no tariff integration between different collective transport companies or between different collective or semi-collective service modes.
For this reason, it was decided to study the possible introduction of the MaaS system in the area and the analysis of user preferences.
Three scenarios are considered as follows:
  • One scenario involves long (urban) distances.
    -
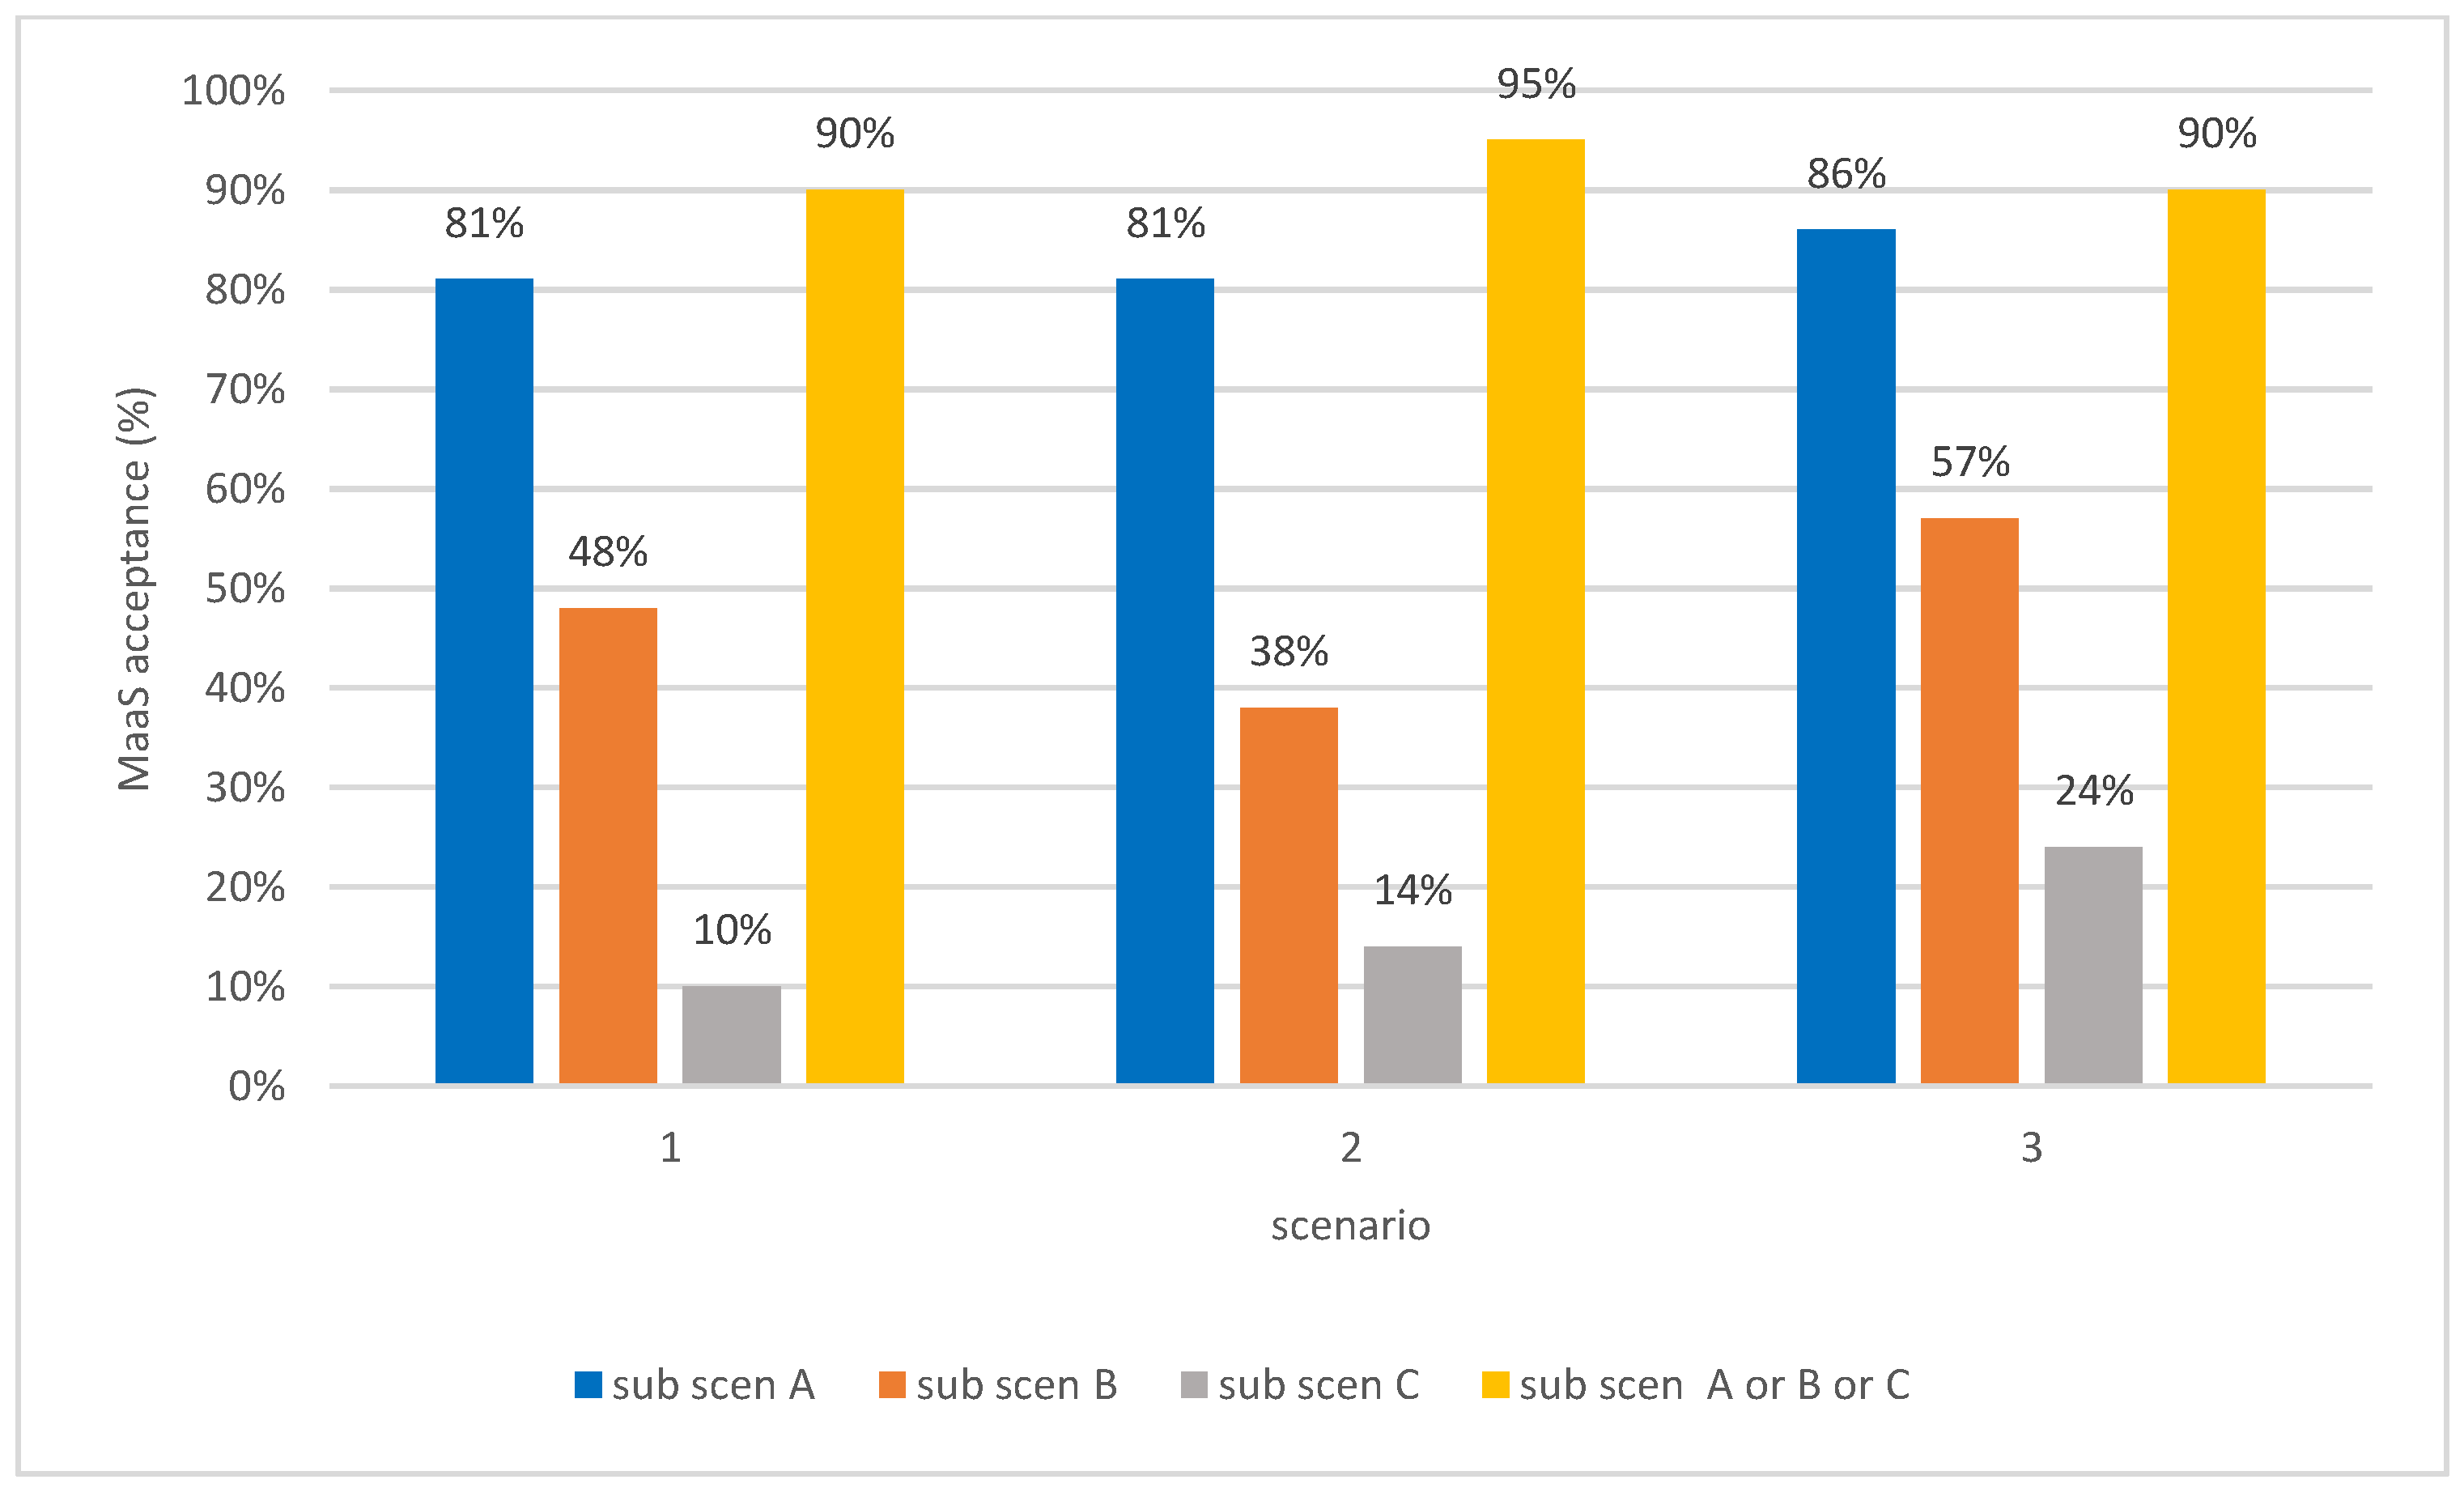
    Scenario 1, travel only in the Gioia Tauro plain area with semi-individual and collective transport.
  • Two scenarios concern long (extra-urban) distances (from the Gioia Tauro area to the Metropolitan City of Reggio Calabria and vice versa).
    -
    Scenario 2, access/exit to the Gioia Tauro area, Gioia Tauro–Reggio Calabria, and access/exit to the Metropolitan City of Reggio Calabria (without parking costs at the destination);
    -
    Scenario 3, access/exit to the Gioia Tauro area, Gioia Tauro–Reggio Calabria, and access/exit to the Metropolitan City of Reggio Calabria (with parking costs at the destination).
For scenarios 1, 2, and 3, the user was presented with three sub-scenarios (A, B, and C) built following the same criterion adopted in Section 4.1.1.

4.2. Survey Analysis

The two pilot surveys were implemented in the year 2022. The main statistical results obtained from the two surveys in the two areas are described in the following subparagraphs.
After questions regarding personal data and the most frequent travel, the operator showed a first scenario, hypothesizing a certain travel method and offering some services at a certain price/bundle (sub-scenario A). Subsequently, the user was asked whether he would accept purchasing the MaaS package offered or whether he would accept the package or not if the frequencies and costs of the services were modified (sub-scenarios B and C). The same procedure was followed for all the designed scenarios and related sub-scenarios.
In cases where the user considered multiple sub-scenarios to be valid, they were also asked to indicate their degree of preference.
The survey carried out is direct and based on dialogue between the interviewer and user.
The relevant analyses are specified for the two focused areas: the Strait of Messina (Section 4.2.1) and the Gioia Tauro area (Section 4.2.2).

4.2.1. Messina Strait

In the Strait of Messina, the survey was carried out on a pilot sample of 47 users.
In the Strait of Messina area, approximately 47% of the sample is between 18 and 40 years old; 34% belong to a family unit of up to three people; and 98% own a road vehicle, of which 62% have exclusive use.

4.2.2. Gioia Tauro Area

In the Gioia Tauro area, the survey was carried out on a pilot sample of 21 users.
In the area, approximately 53% of the sample is between 18 and 40 years old; 38% belong to a family unit of up to three people; and 95% own a road vehicle, 65% of which have exclusive use. The percentages are similar to those of the Strait of Messina area.

4.3. Evaluation Models

The data obtained from the interviews allowed us to carry out the following:
  • Descriptive statistics, i.e., it is possible to obtain the frequency distributions of the responses provided by users and the highest percentage of favorable opinions emerges;
  • Inferential statistics, i.e., capable of understanding the reasons for user preferences;
  • Sustainable indicators, i.e., the measurement of the perceived travel costs (economic sustainability), accessibility (social sustainability), and energy consumption (environmental sustainability).
The evaluation models are specified for the two focused areas: descriptive statistics for Messina Strait (Section 4.3.1); descriptive statistics for the Gioia Tauro area (Section 4.3.2); and inferential statistics for the Gioia Tauro area (Section 4.3.3).

4.3.1. Descriptive Statistics for Messina Strait

For the Strait of Messina, the indicators calculated relating to the descriptive statistics underline the role of some socio-economic characteristics. For instance, age influences MaaS preferences. At the same time, the low quality and quantity of services offered in the current situation negatively influence the acceptance of MaaS. Users declared that they are not able to use collective services because these have a low efficiency.
Acceptance of MaaS is measured in relation to the declared willingness to purchase the bundle for similar trips performed in the current scenario. Figure 6 illustrates the MaaS acceptance percentage resulting from the survey conducted in the Strait of Messina. Note that the level of acceptance of MaaS increases when travel involves higher generalized costs. For example, in the mainland scenarios (1, 2), the acceptance of MaaS for scenario 1 (“without parking cost”) is lower than scenario 2 (“with parking cost”). This is most evident when comparing the mainland (1, 2) and strait (3, 4) scenarios. If the trip involves crossing the Strait of Messina, 100% of those interviewed said they would accept MaaS.

4.3.2. Descriptive Statistics for the Gioia Tauro Area

For the Gioia Tauro area, for scenario 1, 14% of respondents with an average age greater than 45 years would not purchase the option 1A package, 86% would not purchase the option 1B package, and none would purchase the option C package. For scenario 2, 14% of respondents with an average age over 45 would not choose the option 2A package, 43% would not purchase option 2B, and none would purchase the option C package. For scenario 3, 43% (again of interviewed people with an average age above 45) would not purchase package 3A, 86% would not purchase the package 3B, and no one would purchase package 3C. The availability to purchase the bundle is shown in Figure 7, and more details about statistics are reported in [20].

4.3.3. Inferential Statistics for the Gioia Tauro Area

For the Gioia Tauro area, a behavioral model is specified, calibrated, and validated by the pilot sample [20]. For each scenario (1, 2, or 3), users have declared their preferences for sub-scenarios A, B, or C. Starting from the declared preferences, a binomial logit is specified considering the alternatives that the user accepts (yes) or declines (no) a sub-scenario. The specification chosen from those reported in [20] has the following linear specification for the ratio between the expected value of the utility and the parameter of the Gumbel distribution as follows:
  • Yes, alternative with attributes.
    • Price of the bundle in the specific sub-scenario, with parameter βcost;
    • One, with parameter βconstant.
  • No, alternative with attributes.
    • The sum of the access or exit time, the waiting time, and the travel time from the origin area to the destination area for the user’s usual journey, with parameter βtime.
The model used is calibrated with the likelihood method. The values of the calibrated parameter for the three scenarios are as follows:
  • Scenario 1, βcost = −0.52 (Util month/EUR); βconstant = 5.573 (Util); βtime = −1.706 (Util/h);
  • Scenario 2, βcost = −0.042 (Util month/EUR); βconstant = 6.137 (Util); βtime = −0.203 (Util/h);
  • Scenario 3, βcost = −0.093 (Util month/EUR); βconstant = 6.479 (Util); βtime = −2.213 (Util/h).

4.4. Sustainability Indicators for the Gioia Tauro Area

The models estimate the indicators of acceptance of MaaS services in relation to the three components of economic, social, and environmental sustainability. Many indicators can be adopted to evaluate the components of sustainability.
In this application, some indicators have been adopted that can be obtained using the calibrated and validated model, which models user behavior, in the three hypothetical scenarios. Therefore, the reported analysis cannot be considered exhaustive but representative of the phenomenon.
(i) Regarding economic sustainability, by applying the calibrated models, the potential reductions in monetary costs perceived by MaaS users are estimated. Figure 8a reports the estimate of the monetary cost savings perceived by users in relation to travel distances in urban (scenario 1) and extra-urban contexts (scenarios 2 and 3). The monetary cost savings are calculated by comparing the costs connected to a single trip to be covered with variable distance as follows:
∆c = cc − cs
with the following:
  • cc is the current monetary cost, for a single trip, in car mode;
  • cs is the scenario monetary cost, for a single trip, with the available alternatives included in MaaS that are weighed with respect to preference probability.
Figure 8. Estimation of sustainability impacts for the potential MaaS users.
Information 15 00333 g008
Figure 8a shows the monetary cost savings in relation to distances for travel in urban contexts (scenario 1) and extra-urban contexts (scenarios 2 and 3).
(ii) Regarding social sustainability, by applying the calibrated models, the variations of accessibility perceived by MaaS users in terms of variations of the satisfaction variable between the current and MaaS scenarios are estimated. The satisfaction variation has the following form [18]:
∆s = ss − sc
with the following:
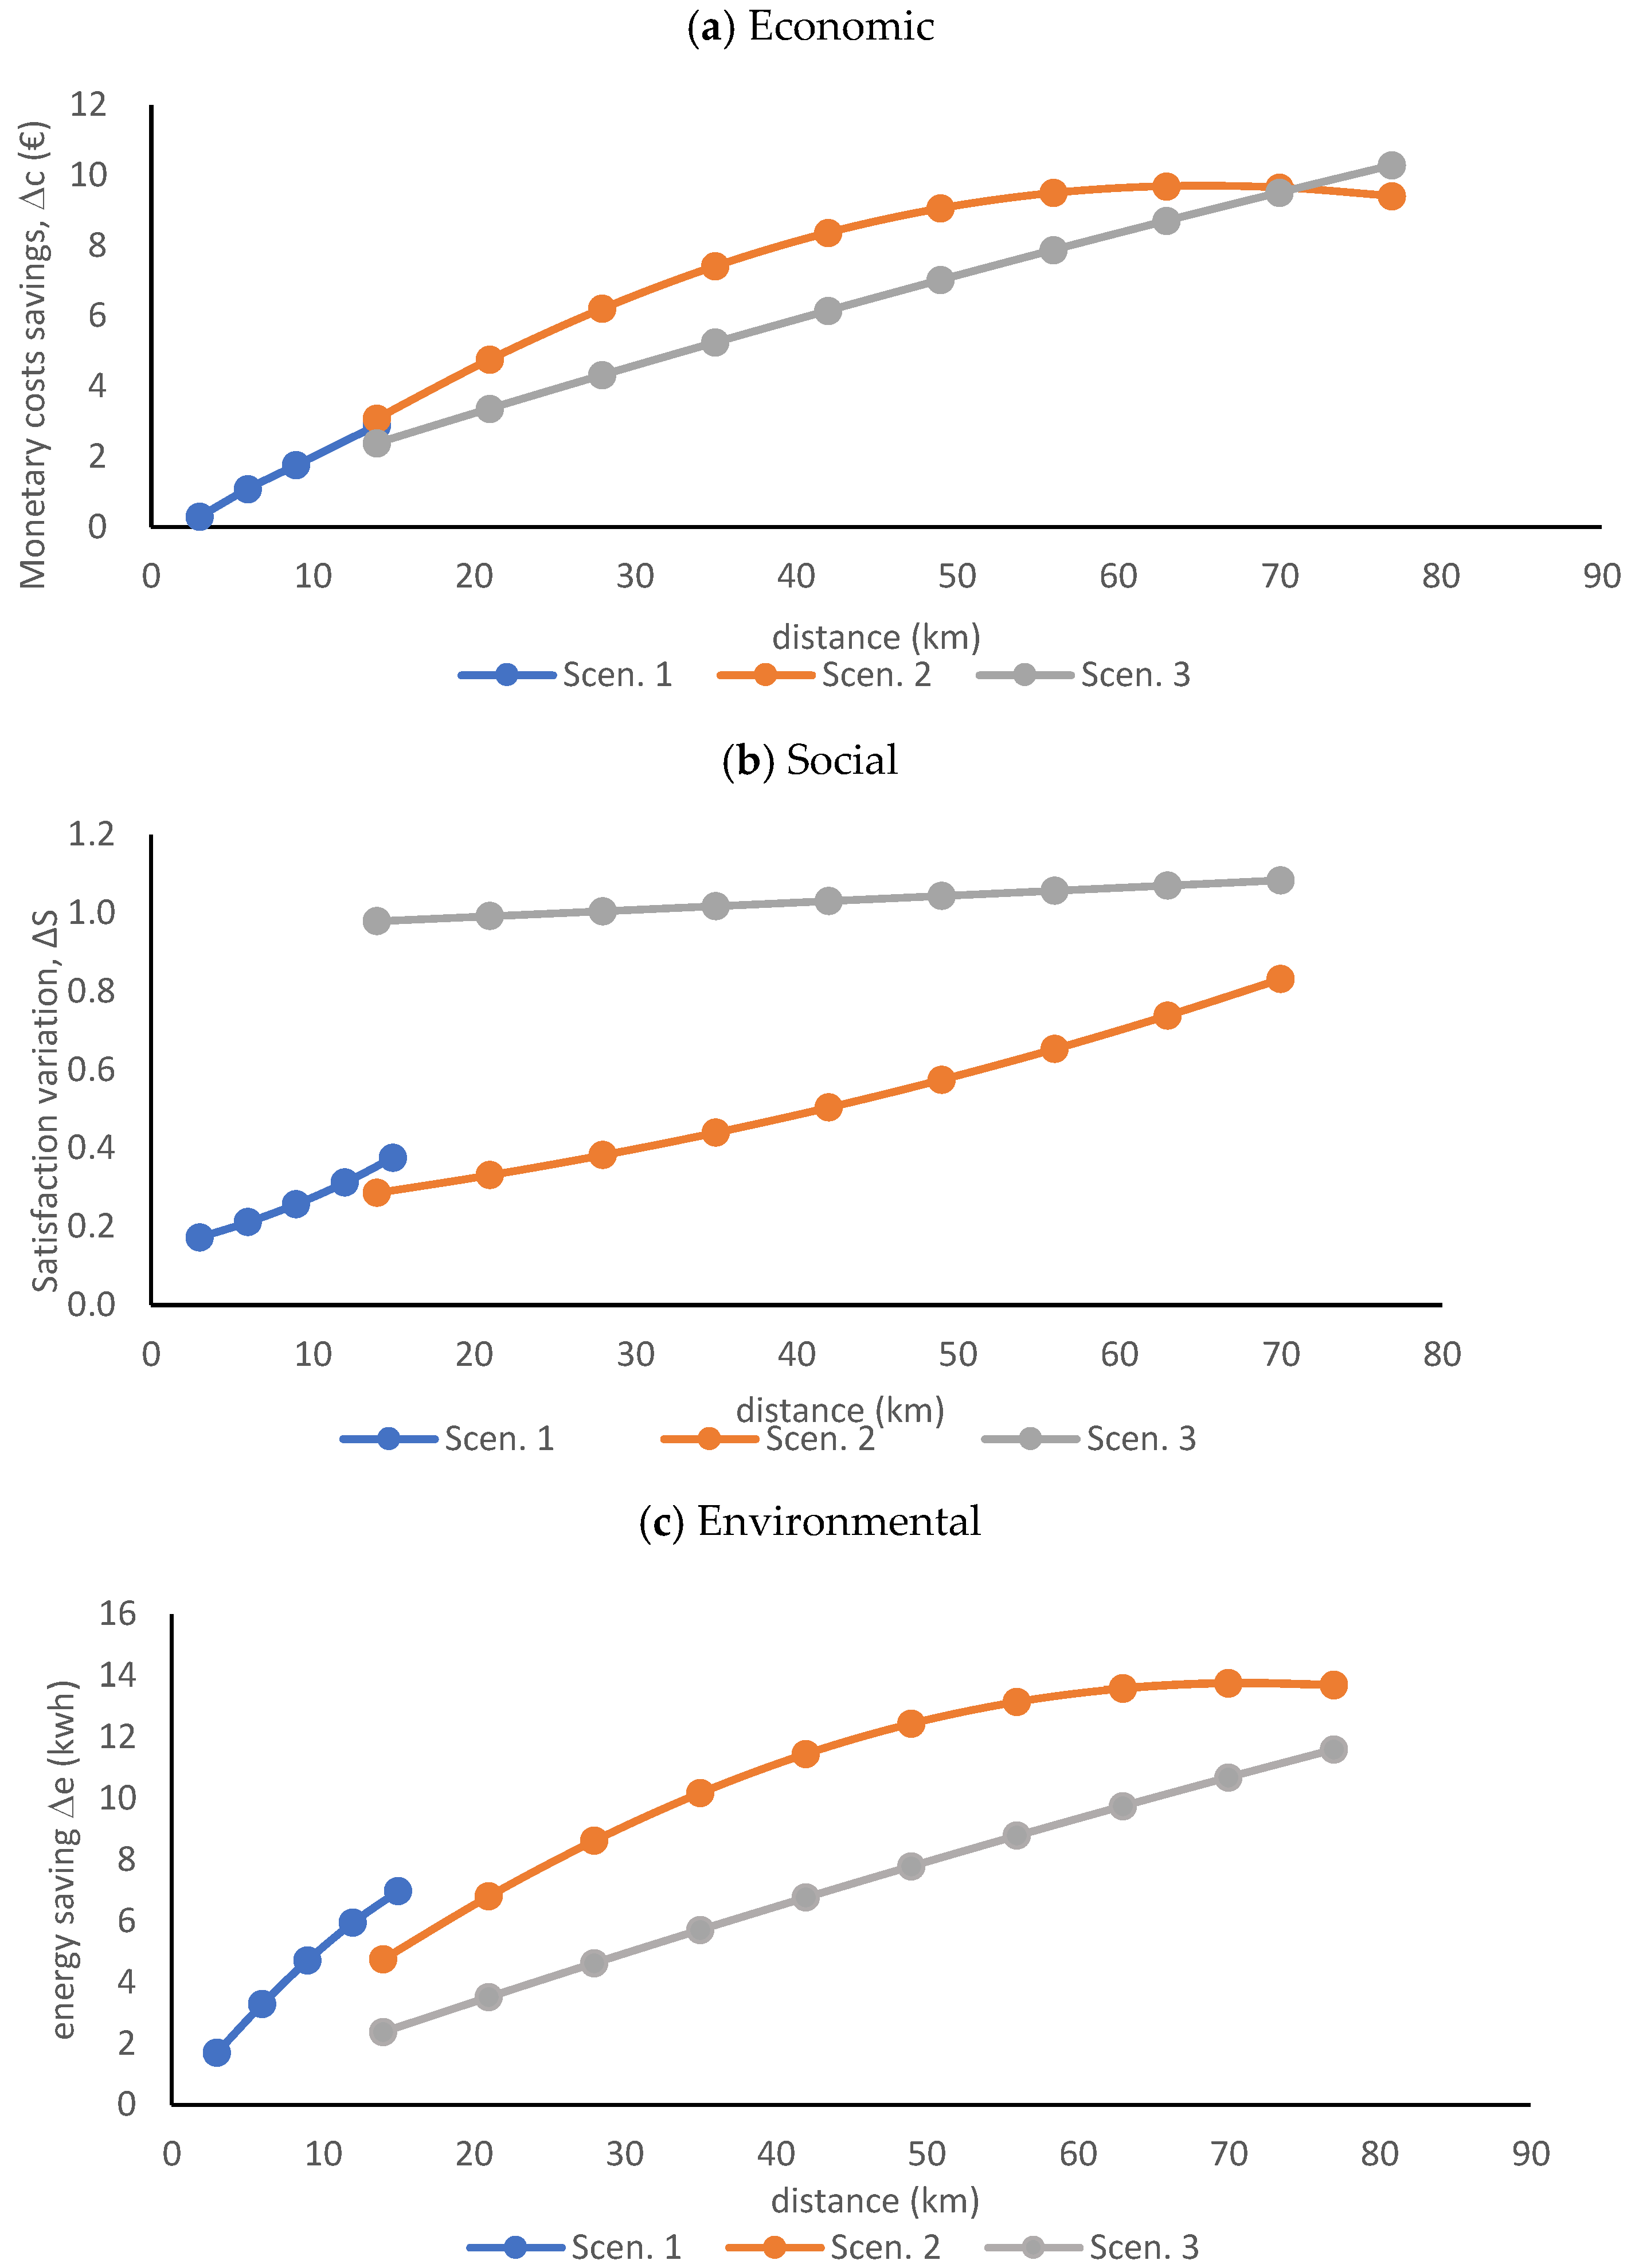
  • sc is satisfaction, for a single trip, with a private car;
  • ss is satisfaction, for a single trip, with the available alternatives included in MaaS and weighed against preference probability.
It can be evaluated in a closed form, considering that the behavioral model has a logit specification. Figure 8b reports the estimate of variation of satisfaction in relation to the distances.
(iii) Regarding environmental sustainability, by applying the calibrated models, the energy savings perceived by MaaS users are estimated. Figure 8c shows the estimate of energy savings in relation to travel distances in urban (scenario 1) and extra-urban (scenarios 2 and 3) contexts. Savings are calculated by comparing the energy consumptions linked to a single trip to cover a certain distance as follows:
∆e = ec − es
with the following:
  • ec is the energy consumption, for a single trip, in car mode;
  • es is the energy consumption, for a single trip, with the available alternatives included in MaaS and weighed with respect to preference probability.
Figure 8c reports the estimate of energy variation in relation to the distances.

5. Discussions

The MaaS paradigm represents a perspective for increasing sustainable mobility in compliance with shared goals on a global scale. However, there are barriers that limit the implementation of the paradigm but also enabling factors that could accelerate the implementation process. Among these, it is relevant to evaluate the level of perception of potential users of the information and mobility services offered by MaaS. To this end, it is necessary to conduct surveys to collect information on potential user behavior in the case of a MaaS implementation. However, such surveys can be expensive. In this paper, an alternative method is proposed which, through the design and implementation of pilot surveys, would allow the acquisition of general information about the level of user acceptance regarding the potential implementation of MaaS services. The added value of the proposed method concerns the possibility of estimating user behavior models to estimate the level of acceptance with reference to the three components of sustainability.
The experiments conducted with the methodology show encouraging results for the potential implementation of MaaS in territorial contexts lacking integrated information and transport services. There is a greater willingness of users to use MaaS services as an alternative to private vehicles where transport costs, energy consumption, and accessibility levels increase in urban and extra-urban territorial contexts.
In both cases, the results show an increase in preference to change travel mode for the benefit of MaaS services, where the move involves the use of multiple ways to cross the strait (for example, cars and maritime transport services).
In the case of the Gioia Tauro area, the results confirm that there is a greater propensity to use MaaS services in the case of medium-distance trips. The savings in travel times and energy consumption are felt more in the case of travel on a metropolitan and regional scale.
The results obtained from the surveys show that the acceptance of MaaS grows with the increase in generalized transport costs. In the Strait area, MaaS acceptance is higher than 98% for scenarios that imply the use of maritime services (Figure 6). In the Gioia Tauro area, the MaaS acceptance is higher than 90% for extra-urban mobility (Figure 7). In the two areas, the acceptance of urban mobility does not overcome 40% (Figure 6 and Figure 7). Figure 8a–c underline the perceived benefits by users in relation to economic, social, and environmental sustainability, estimated with the calibrated models by TSMs. The benefits in terms of monetary costs, accessibility, and energy savings connected to a potential single trip increase with the traveled distance using the MaaS with respect to the current situation. The variations are increasing by comparing trips in urban and extra-urban contexts.

6. Conclusive Remarks and Future Perspectives

The implementation of the MaaS paradigm depends on numerous enabling factors that can help overcome current barriers. This paper analyses factors related to the potential level of user acceptance of MaaS services. In this context, surveys and TSMs play an important role in understanding in advance what can be explored when intending to introduce a new service from a MaaS perspective. It is necessary to design specific motivational and TAM surveys. Since these are new services compared to the current context, it is necessary to integrate the TAM and the SP/RP surveys.
Based on the results obtained, this section answers the research question stated in Section 1.
From the results obtained, the role of investing in surveys to measure the acceptance of MaaS by potential people emerges. Qualitative assessments based, for example, on a Likert scale, provide limited support to public and private decision makers. Descriptive statistics can be calculated (from RP/SP or TAMs) but they provide partial answers regarding the potential effects on user behavior. Survey results are useful for building (specifying, calibrating, and validating) TSMs. However, considering the complexity of the resources needed for the design and implementation of the surveys, it is possible to carry out preliminary pilot tests in different parts of the same study area. Pilot projects could be a key to the success of MaaS application because they guide the development of in-depth surveys and the process of building TSMs to estimate MaaS effects in terms of sustainability.
The pilot tests carried out demonstrate that users have a greater propensity to use MaaS services where the trip involves higher generalized travel costs.
The obtained results confirm the need to design MaaS services, considering as priorities the needs of users and their perceptions of the attributes of the service level, with reference to the three components of mobility. The pilot projects developed provide some preliminary data and useful indications for identifying the barriers and enablers related to people’s acceptance of MaaS. However, it is important to underline the limitations of this work, mainly linked to the quantity of interviewees that make up the sample.
In the future, it will be necessary to develop some directions for this research.
First of all, it is necessary to extend the investigations both in space and time. This extension implies the involvement of a greater number of users included in the sample to confirm the results obtained through the pilot investigations. It is essential to design and implement RUM-type models, aimed at estimating the effects produced by future configurations of transport infrastructure and services. It is essential to evaluate the contribution of MaaS to sustainability using TSM results.
Secondly, there is a need to produce more investigations into new tools and forms for survey development. In relation to the new tools, it is necessary to produce greater insights into the potential of ICT for the implementation of low-cost investigations aimed at the construction of TSMs.
In the future, it is necessary to further investigate the possible integrations between TAMs and motivational surveys. Mutual exchanges can help to increase knowledge about perception levels of a potential MaaS implementation.
Finally, it is necessary to experiment with further behavioral models to better understand users’ travel choices and how they could change in a context richer in information and mobility services integrated into space and time.

Author Contributions

Conceptualization, A.V. and C.R.; methodology, A.V.; validation, A.V.; formal analysis, C.R.; investigation; data curation, C.R.; writing—original draft preparation, C.R.; writing—review and editing, A.V.; visualization, C.R.; supervision, A.V.; project administration, A.V. All authors have read and agreed to the published version of the manuscript.

Funding

This research was partially supported by the Dipartimento di ingegneria dell’Informazione, delle Infrastrutture e dell’Energia Sostenibile, Università Mediterranea di Reggio Calabria and by the project “La Mobilità per i passeggeri come Servizio—MyPasS”, Fondi PON R&I 2014–2020 e FSC “Avviso per la presentazione di Progetti di Ricerca Industriale e Sviluppo Sperimentale nelle 12 aree di Specializzazione individuate dal PNR 2015–2020”, codice identificativo ARS01_01100.

Data Availability Statement

The data are not available for privacy reasons.

Conflicts of Interest

The authors declare no conflicts of interest.

References

  1. Hensher, D.A. Understanding Mobility as a Service (MaaS): Past, Present and Future; Elsevier: Amsterdam, The Netherlands; Cambridge, MA, USA, 2020; ISBN 978-0-12-820044-5. [Google Scholar]
  2. Alyavina, E.; Nikitas, A.; Njoya, E.T. Mobility as a Service (MaaS): A Thematic Map of Challenges and Opportunities. Res. Transp. Bus. Manag. 2022, 43, 100783. [Google Scholar] [CrossRef]
  3. Cirianni, F.M.M.; Comi, A.; Quattrone, A. Mobility Control Centre and Artificial Intelligence for Sustainable Urban Districts. Information 2023, 14, 581. [Google Scholar] [CrossRef]
  4. Reck, D.J.; Hensher, D.A.; Ho, C.Q. MaaS Bundle Design. Transp. Res. Part Policy Pract. 2020, 141, 485–501. [Google Scholar] [CrossRef]
  5. United Nation. UN Sustainable Development Goals (SDG). Available online: https://sdgs.un.org/goals (accessed on 7 May 2023).
  6. Comi, A.; Russo, F. Emerging Information and Communication Technologies: The Challenges for the Dynamic Freight Management in City Logistics. Front. Future Transp. 2022, 3, 887307. [Google Scholar] [CrossRef]
  7. Butler, L.; Yigitcanlar, T.; Paz, A. Barriers and Risks of Mobility-as-a-Service (MaaS) Adoption in Cities: A Systematic Review of the Literature. Cities 2021, 109, 103036. [Google Scholar] [CrossRef]
  8. Maas, B. Literature Review of Mobility as a Service. Sustainability 2022, 14, 8962. [Google Scholar] [CrossRef]
  9. Ho, C.Q.; Hensher, D.A.; Reck, D.J.; Lorimer, S.; Lu, I. MaaS bundle design and implementation: Lessons from the Sydney MaaS trial. Transp. Res. Part A: Policy Pract. 2021, 149, 339–376. [Google Scholar] [CrossRef]
  10. Russo, F. Sustainable Mobility as a Service: Dynamic Models for Agenda 2030 Policies. Information 2022, 13, 355. [Google Scholar] [CrossRef]
  11. Hensher, D.A.; Hietanen, S. Mobility as a Feature (MaaF): Rethinking the Focus of the Second Generation of Mobility as a Service (MaaS). Transp. Rev. 2023, 43, 325–329. [Google Scholar] [CrossRef]
  12. Alonso-González, M.J.; Hoogendoorn-Lanser, S.; Van Oort, N.; Cats, O.; Hoogendoorn, S. Drivers and Barriers in Adopting Mobility as a Service (MaaS)—A Latent Class Cluster Analysis of Attitudes. Transp. Res. Part Policy Pract. 2020, 132, 378–401. [Google Scholar] [CrossRef]
  13. Hauslbauer, A.L.; Verse, B.; Guenther, E.; Petzoldt, T. Access over Ownership: Barriers and Psychological Motives for Adopting Mobility as a Service (MaaS) from the Perspective of Users and Non-Users. Transp. Res. Interdiscip. Perspect. 2024, 23, 101005. [Google Scholar] [CrossRef]
  14. Deakin, M. Creating Smart-Er Cities; Routledge: London, UK, 2013; ISBN 978-1-317-98117-6. [Google Scholar]
  15. Musolino, G. Sustainable Mobility as a Service: Demand Analysis and Case Studies. Information 2022, 13, 376. [Google Scholar] [CrossRef]
  16. Davis, F.D. Perceived Usefulness, Perceived Ease of Use, and User Acceptance of Information Technology. MIS Q. 1989, 13, 319. [Google Scholar] [CrossRef]
  17. Campisi, T.; Basbas, S.; Skoufas, A.; Akgün, N.; Ticali, D.; Tesoriere, G. The Impact of COVID-19 Pandemic on the Resilience of Sustainable Mobility in Sicily. Sustainability 2020, 12, 8829. [Google Scholar] [CrossRef]
  18. Cascetta, E. Transportation Systems Engineering Theory and Methods; Springer Science & Business Media: Berlin, Germany, 2013; ISBN 978-1-4757-6873-2. [Google Scholar]
  19. Discrete Choice Analysis: Theory and Application to Travel Demand; Transportation studies; The MIT Press: Cambridge, MA, USA, 2018; ISBN 978-0-262-53640-0.
  20. Franco, A.; Vitetta, A. Preference Model in the Context of Mobility as a Service: A Pilot Case Study. Sustainability 2023, 15, 4802. [Google Scholar] [CrossRef]
  21. Birgillito, G.; Rindone, C.; Vitetta, A. Passenger Mobility in a Discontinuous Space: Modelling Access/Egress to Maritime Barrier in a Case Study. J. Adv. Transp. 2018, 1–3. [Google Scholar] [CrossRef]
  22. Musolino, G.; Rindone, C.; Vitale, A.; Vitetta, A. Pilot Survey of Passengers’ Preferences in Mobility as a Service (MaaS) Scenarios: A Case Study. Transp. Res. Procedia 2023, 69, 328–335. [Google Scholar] [CrossRef]
Figure 1. Sustainable urban mobility: issue, components, and integration.
Information 15 00333 g001
Figure 2. Smart city contributions to Agenda 2030 by means of SUMP.
Information 15 00333 g002
Figure 3. Enabled interchanges with MaaS implementation.
Information 15 00333 g003
Figure 4. Role of the survey in MaaS.
Information 15 00333 g004
Figure 5. Proposed procedure for measuring MaaS acceptance.
Information 15 00333 g005
Figure 6. Descriptive statistics for Messina Strait: availability to purchase the bundle.
Information 15 00333 g006
Figure 7. Descriptive statistics for the Gioia Tauro area: availability to purchase the bundle.
Information 15 00333 g007
Table 1. The study area context.
Messina Strait Gioia Tauro Area
Territorial
characteristics
Discontinuous land (barrier for mobility)
Two metropolitan cities, minimum aerial distance of 4 km
Residents: 1,000,000 inhabitants
Surface: 2000 km2
Continuous land
33 towns in 50 km
Residents: 150,000 inhabitants
Surface: 1000 km2
Transport
services
characteristics
Road services (car sharing, bike sharing; urban, regional, and national bus services)
Rail services (regional and national)
Maritime services (high speed and ro-ro)
Air services (national)
Bike and car sharing
Road services (car sharing, bike sharing; urban, regional, and national bus services)
Rail services (regional and national)
Table 2. The survey characteristics for the two areas.
SectionScenario Information
I—User characteristicsPRESENT Age, profession, number of household members, vehicle availability, type of vehicle ownership, number of vehicles owned in the household
II—Current travel characteristics (RP)Origin, destination, hours, frequency, purpose, mode
III –MaaS potential travel characteristics (SP)Scenariosub-scenariosIncluded services in the bundle
1, 2, 3, 4 MESSINA
Strait
1A, 1B, 1C: Mainland, without parking cost
2A, 2, 2C: Mainland, with parking cost
Taxi, bike sharing, car sharing, train, urban bus, extra-urban bus
3A, 3B, 3C: Strait, with car
4A, 4B, 4C: Strait, without car
High-speed and ro-ro maritime services
1, 2, 3
GIOIA
TAURO
Area
1A, 1B, 1C: UrbanBike sharing, car sharing, dial and ride, urban bus
2A, 2B, 2C: Extra-urban, without parking cost
3A, 3B, 3C: Extra-urban, with parking cost
Included services in the bundle:
bike sharing, car sharing, train, urban bus, extra-urban bus
Disclaimer/Publisher’s Note: The statements, opinions and data contained in all publications are solely those of the individual author(s) and contributor(s) and not of MDPI and/or the editor(s). MDPI and/or the editor(s) disclaim responsibility for any injury to people or property resulting from any ideas, methods, instructions or products referred to in the content.

