Article

A Study of Delayed Competitive Influence Propagation Based on Shortest Path Calculation

1
State Information Center, Beijing 100045, China
2
Department of Cyberspace Security, Beijing Electronic Science and Technology Institute, Beijing 100070, China
*
Author to whom correspondence should be addressed.
Information 2024, 15(7), 370; https://doi.org/10.3390/info15070370
Submission received: 14 May 2024 / Revised: 2 June 2024 / Accepted: 7 June 2024 / Published: 26 June 2024

Abstract

:
In social network applications, competitive influence propagation often exhibits a certain degree of time lag. In the scenario of positive and negative competitive propagation studied in this paper, under the premise that negative nodes are activated first, how to find a set of positive seed nodes to participate in competitive propagation is studied, aiming to minimize the spread of negative influence. In the current study, the time complexity of the improved algorithms based on greedy strategies is high, which limits their scope of application in practical scenarios; some heuristic algorithms achieve better scalability, but there is still much room for improvement. Therefore, this paper proposes a new method to solve the influence propagation problem of delayed competition, also known as a heuristic propagation factor evaluation algorithm (HeuPFE). The main process is as follows: (1) We build a shortest path snapshot for the nearest propagation region of negative nodes and reduce the search space of competing nodes. (2) Then, we construct a node propagation factor evaluation method based on this shortest negative-oriented node path snapshot to reduce computational complexity. Comparing results with those of traditional heuristic algorithms, we carry out experiments on real datasets and verify the effectiveness of the proposed method.

1. Introduction

1.1. Delayed Competition Propagation Overview

Competition propagation is widely observed in social networks such as Twitter, Facebook, and Weibo. These platforms have become essential for marketing and political releases, increasingly drawing attention from both industry and academia. This trend has extended new scenarios and challenges. In real world, the spread of rumors, viral dissemination, and similar phenomena often begin unnoticed and are only identified after a while before competition propagation is initiated to suppress their spread. Therefore, how to choose appropriate competitive strategies in the case of time delays is of important practical significance.

1.2. Delayed Competition Propagation Problem

First, we review the information propagation models on social networks. In a social network graph, the nodes represent the users of the social network and the edges represent the relationships between these users. By using a specific propagation model, we can simulate and calculate the spread of information across the entire network. In the original Independent Cascade Model (IC model), the propagation typically involves single pieces of information, wherein an edge (u, v) indicates that the information can be transmitted from node u to node v. Once node u is activated, it has a certain probability of activating its neighbor v; if successful, v becomes activated and continues to attempt to activate its neighboring nodes. If unsuccessful, v remains inactive and u will not attempt to activate v again.
In the context of competition propagation, the scenario is no longer about the spread of a single piece of information. Assuming there are two types of information engaging in positive and negative competition, it becomes necessary to extend the original Independent Cascade model (IC model) to what is known as the Competitive Independent Cascade model (CIC model). The idea is to allow each node to be activated negatively or positively, with each state determined by the current neighboring negative or positive nodes. If a node is attempted to be activated by both negative and positive nodes simultaneously, conventional inertia suggests that the negative influence will prevail. In a social network, there are two types of nodes participating in this competition: Negative Vertexes and Positive Vertexes. Each node can exist in one of three states: negatively activated, positively activated, or inactive. A negatively activated state means the node has been ‘infected’ and can propagate the virus or rumor to its neighbors; a positively activated state indicates that the node has been alerted and can continue to spread the alert to its neighbors; and an inactive state means the node is unaffected by either state. At time t, if node v is activated by either a negative or positive node, then at time t + 1, it has the opportunity to influence its neighbors with a negative probability p− or a positive probability p+. To ensure that the calculation of influence is monotonic, nodes that are not activated either positively or negatively during the propagation process will not participate in subsequent activation processes until the end of the current round of information spread and will remain inactive.
Our research focuses on the issue of competitive influence propagation under delay conditions. Therefore, taking binary positive and negative information competition as an example, given a social network graph (where nodes represent users and edges represent relationships between users) and a given competitive propagation model, nodes can be in states of positive activation, negative activation, or non-activation. After the negative information has propagated for time t (or has formed a significant cluster of negatively activated nodes, kN), the challenge is how to find a seed set of nodes of size kP that can competitively propagate positive information to maximize the spread of positive influence across all nodes in the social network, thereby reducing the spread of negative influence and ultimately mitigating the effects of negative impact.
Research work on delayed competition based on information models can form a good representation in micro-quantitative and macro-calculation analysis, and may become the mainstream research direction. Nevertheless, among the delayed competition research methods based on propagation models, the greedy strategy- and dynamic programming-based methods in early studies can obtain near-optimal solutions. However, their time complexity is high, which limits their practical application value. Subsequently, a series of heuristic methods were proposed, and scalability was gradually improved, but they are susceptible to the influence of datasets which can result in poor stability.

1.3. Main Work of This Paper

In this paper, we focus on how to find a positive node set to participate in delayed competition in the face of negative node propagation started earlier, so as to minimize the negative node propagation as much as possible. In summary, the main work of this paper is as follows: (1) We build a shortest path snapshot for the nearest propagation region of negative nodes and reduce the search space of competing nodes. (2) Then, we construct a node propagation factor evaluation method and reduce the computational complexity of the selection of positively competitive nodes. Compared with traditional heuristic algorithms, the computational performance is significantly improved. Experiments are carried out on real datasets and the effectiveness of the proposed method is verified.
Section 2 gives the progress of the related research work, Section 3 introduces the HeuPFE method proposed in this paper, Section 4 shows the experimental results and analysis, and Section 5 concludes and looks over the work of this paper.

2. Related Work

Competition between two or more entities (products or ideas) is common in the real world. Research on the propagation of time-delayed competition was initially carried out in the economic field. With the deepening of theoretical research and the simulation of quantitative calculation, the research of time-delayed competition between disease models and information models has been widely applied and discussed.

2.1. Delayed Competition Study Based on an Economic Model

The earliest study of time-delayed competition started in the field of economics with the Stackelberg model [1,2], in which the German economist Stackelberg’s “Marktform und Gleichgewicht”, published in 1934, described that the dominant firm (Leader) in a business market often occupies the first position in the market, and the following firm (Follower) needs to adjust to the optimal decision to maximize its profit according to the leader’s response to its choice. This is similar to the delayed competition scenario in information propagation; in the face of the first start of information dissemination, how does the set of nodes initiated by the posterior order choose competitive strategies to maximize its own propagation? Bharathi et al. [3] proposed an approximation algorithm for the posterior order start node strategy, an early approach applied to the delayed competition problem of information propagation. Kostka et al. [4] believed that the finding algorithm of leading nodes is an NP-Hard problem. Clark and Poovendran [5] argued that the objective function based on the Markov diffusion model has a submodularity property. Hemmati et al. [6] and Taninmis et al. [7] studied the timing competition problem based on a two-layer model and argued that the selection strategy of backward nodes can be improved by using a heuristic algorithm. These earlier economic models have inspired and informed the study of competition in information propagation and provided a reference for research around applying competition strategies for backward nodes.

2.2. Delayed Competition Study Based on the Disease Model

Researchers have extended their studies around the spread control of viral models, most commonly using immunization strategies to control the spread of epidemics. Pastor-Satorras et al. [8] analyzed target immunization strategies based on the properties of scale-free networks and Cohen et al. [9] studied acquaintance immunization strategies from a local topology. A subset of researchers focused on the perspective of node immunization: Kitsak et al. [10] argued that influential nodes are often located at the core layer of the network, and a series of central immunization strategies [11,12] were proposed subsequently. Zhang et al. [13,14] explored how to select a set of nodes to inhibit the spread of disease. The identification of key nodes in a network topology was resolved by Lv et al. [15]. Other researchers who have explored lightweight immunization approaches, including Kimura et al. [16,17], Tong et al. [18], Kuhlman et al. [19], and Khalil et al. [20], have focused on how edge-level immunization strategies can be oriented; they found that the interactions between nodes and the propagation rate were effectively reduced. The extended research on disease-oriented models has been applied empirically in competitive propagation, especially by using node-level and edge-level oriented immunization strategies to provide trend analysis and methodological references for competitive propagation. However, further research is still needed on the micro-quantitative level.

2.3. Delayed Competition Study Based on the Information Model

In the study of competitive influence maximization [21], if the initiation strategy of a prior node is not given, the problem does not have a submodularity property and it is difficult to determine the computation of the optimal solution [22].
In the initial study of delayed competition, Carnes et al. [23] extended the independent cascade model based on the distance-based and wave propagation models, respectively, which showed that the optimal policy for the first-order node is the node with a high number of heights. The selection policy for the second-order node was shown to belong to the set of NP-Hard problems, but the model’s settings limited the scope of application in practical scenarios. Bharathi et al. [3] extended and proposed the CP (Competing Processes) model based on the independent cascade model. However, the optimal dynamic planning method of first-mover only applied to tree diagrams.
Subsequently, researchers continued to improve and optimize. Chen et al. [24] proposed the IC-M model for competitive propagation, considering the time lag phenomenon of information propagation in real scenarios. They introduced an “encounter” probability for each edge (v, w) to express the likely influence propagation between two nodes. Lin et al. [25] proposed a Q-based learning model to evaluate the optimal policies of competing parties. Bozorgi et al. [26] proposed a community perspective to select the set of nodes for backorder initiation. Li et al. [27] proposed a greedy strategy, considering the effects of time constraints and delays on information propagation. Pham et al. [28] proposed a polling approximation algorithm under finite time conditions and their experiments showed good scalability. Chen et al. [29] proposed the least-cost influence maximization algorithm by combining time-shifting factors.
Other researchers have taken the perspective of suppressing influence propagation. Budak et al. [30] from the university of California first extended the independent cascade model in 2011, studied how to choose the optimal strategy to spread authoritative information to suppress the spread of rumors when the rumor information has spread on a network for a certain time, and proved that the problem of suppression of rumor spreading is a NP-Hard problem, with submodularity and monotonicity, for which a greedy algorithm can be used to obtain an approximately optimal solution. Nguyen et al. [31] studied how to suppress the spread of misinformation in social networks by finding an initial set of nodes to participate in positive competition in time t, which eventually reduces the spread of misinformation to a given proportion. Wang et al. [32] and Rawale, et al. [33] studied a dynamic blocking algorithm. Yan et al. [34] argued that the policy selection of the post-order node set needs to consider also the minimum cost problem under the threshold limit.
Research on delayed competition based on information models can be explored theoretically and tested experimentally through micro-quantitative and macro-calculation approaches. Moreover, as the scenario demands continue to expand, this paper will continue along the research trajectory of information propagation models to carry out quantitative calculations and further explore heuristic methods to enhance performance.

3. The Method Proposed in This Paper

3.1. Main Ideas

In delayed competition research methods based on the propagation model, the greedy strategy and dynamic programming methods in the earlier research can obtain an approximately optimal solution, but the time complexity is high, which limits the practical application value. Subsequently, a series of heuristic methods were proposed and the scalability was gradually improved, but they were vulnerable to the influence of datasets, resulting in poor stability. Therefore, in this paper, we hope to analyze the propagation influence factors of negative nodes and carry out the quantitative evaluation of competitive nodes to improve the computational performance of competitive propagation along the heuristic strategy.

3.2. Variable Representation

A social network is modeled using an undirected graph G = (V, E), where node v represents the users in the network and edge e represents the association between users. Table 1 lists the important variables used in this paper.
S, as the selected set of nodes, is used to maximize the spread of its influence, and also called a seed set. SimCas(S) represents a stochastic process based on the spread of the influence of node set S. The algorithm in this paper uses graph G, negative node set SN, and positive node size kP as inputs to find a seed set S of positive nodes that maximize participation in the competition to suppress the spread of negative influence on a given competitive model.

3.3. Node Evaluation

3.3.1. Find the Nearest Propagation Region

Social network nodes, according to relationship, function, and geographical factors, can form different communities; a series of such “communities” or “groups” form the whole network and the nodes in each community are closely linked. We consider communities as the nearest propagation areas for nodes; thus, community detection will help us find meaningful community structures. Common community detection methods include K-means, divisive, agglomerative, and spectral analysis [35], all of which have high time complexity. To enhance the scalability of the algorithms in this paper, we use the label propagation method proposed by Raghavan et al. [36] as the computational benchmark for our community detection. This algorithm can achieve community detection in linear time, providing a reference for quantitative assessment in competitive propagation under delay conditions.

3.3.2. Build the Shortest Path Snapshot

In the nearest propagation region of the negative node u (that is, the current community), the shortest path to other nodes in the current community can be found by constructing the adjacency matrix of negative node u in the current community, and the negative node u is taken as the starting node. Considering the dynamic nature of information propagation and the change of environment, the propagation path of information propagation may not be unique in the actual scene. Therefore, this paper sets the edge weight to 1 uniformly to build the weighted network structure and uses Monte Carlo simulation to find all the shortest paths in the adjacency matrix by randomly disturbing the node numbers, so as to build the shortest path snapshot starting from the negative node u.

3.3.3. Evaluate Competitive Influence Factors

In the shortest path snapshot starting from negative node u, factors such as distance size, passing frequency, and cascade range may play a large role in propagation influence; that is, they can play a greater role in participating in competitive propagation. Therefore, we consider that the propagation factor evaluation (PFE) is influenced by three factors; namely, the negative shortest distance, the shortest path frequency, and the adjacency degree measure, which are calculated as follows:
The negative shortest distance reflects the calculation of the shortest distance between negative node u and the current node v. The smaller the distance, the greater the role of the current node v in the propagation influence, as shown in Formula (1).
N S D ( u , v ) u , v C u = 1 s d ( u , v ) × M A X ( n s d )
The shortest path frequency reflects the shortest path frequency of negative node u through the current node v. The greater the frequency, the greater the role of the current node v in the propagation influence, as shown in Formula (2).
S P F ( u , v ) u , v C u = v C u s p ( u , v ) M A X ( s p f )
The adjacency degree measure reflects the cascade propagation breadth of negative node u through the current node v. The greater the measure, the greater the role of the current node v in the propagation influence, as shown in Formula (3).
A D M ( u , v ) u , v C u = D e g r e e ( v ) M A X ( a d m )
Therefore, when the negative node u starts to cascade propagation, if the current node v participates in the propagation competition, the propagation factor evaluation PFE(u,v) can be calculated by the above three factors, as shown in Formula (4).
P F E ( v ) = N S D ( u ,   v ) × S P F ( u ,   v ) × A D M ( u ,   v )
Among these variables, u represents the starting negative node, v represents other nodes in the community where node u is located, sd(u,v) represents the shortest distance from node u to node v, sp(u,v) represents the shortest path from node u to v, and degree (v) represents the degree of node v.

3.4. Algorithm Definition

3.4.1. Node Evaluation Method Based on Shortest Path Snapshot

In this paper, we hope to propose a heuristic algorithm for the nearest propagation region of negative nodes. Firstly, in order to facilitate comparative evaluation, a negative node set with pre-propagation is given. Secondly, we build the nearest propagation region of negative nodes according to community division. Then, the shortest path snapshot is constructed for the negative nodes and the nodes that may participate in the competition on the shortest path are traversed. Finally, we sort the evaluation nodes that may participate in the positive competition and find the optimal top-kP set of positive nodes.

3.4.2. Algorithm Input and Output Pseudo-Code

The algorithm in this paper is shown in Algorithm 1.
Algorithm 1: HeuPFE, a heuristic finding algorithm based on propagation factor evaluation
Input: Graph: G, the number of negative seeds: kN
Output: Top-kP vertices
1: initialize S = Ø, SG = Ø
2: select kN vertices as the negatives seeds
3: community partition and get z candidate communities which contain negative seed vertices: C1, C2, …, Cz
4: for i = 1 to z do
5:  in current community Ci, Sv = 0
6:  construct the vertex pair index of primitive topology, and add to the array AP
7: for j = 1 to r do
8:    disturb randomly the sequence of primitive topology, and add to the array AS
9:    generate the adjacency matrix of array AS, and add to the matrix M
10:  find the shortest path snapshot from the vertex u, and add to the queue Q
11:  assess the PFE of every v for negative vertex u based on the shortest path snapshot
    which is based on Formula (4) then Sv+ = PFE (v,u)
12:  end for
13:  compute average PFE for every vertex v except the negative vertices: PFE(v,u) = Sv/r
14:  for j = 1 to t do
15:  SP = SP ∪ {argmax v ϵ Ci\SP {PFE(v,u)}}
16:  end for
17: end for
18: return SP
Line 1 initializes the node-set.
Line 2 constructs the set of negative nodes after t time.
Line 3 performs community division and selects communities that contain negative nodes.
Lines 5–11 evaluate the propagation influence of nodes on the shortest path snapshot, line 6 construct the node pair index of the original topology, line 8 disturbs randomly the sequence of topology, line 9 generates an adjacency matrix, line 10 finds the shortest path snapshot, and line 11 assesses the propagation factor of nodes quantitatively.
Line 13 computes the average propagation factor for each node in the community.
Lines 14–16 calculate the top-t positive nodes in the current shortest path snapshot.

3.4.3. Introduction of Each Function of the Algorithm

Complexity analysis: line 3 consumes O(M), line 4 starts and line 17 ends the main loop, and z loops need to be executed. Lines 7–12 consume O(rMCNC) and lines 14–16 consume O(NC), so the overall time complexity of this paper = O(M) + O(zrMCNC) + O(zNC) and the optimal complexity is also O(zrMCNC).

4. Experimental Analysis

4.1. Experimental Setup

4.1.1. Experimental Environment

OS: Windows 10, Processor: Intel(R) i5 1.8 GHz, Memory: 32 G.

4.1.2. Experimental Dataset

The experimental data were obtained from the arXiv dataset [37], where a node represents a paper published by the user and an edge represents a joint publication by two users. We extracted the structure of four types of paper collaboration networks from the arXiv literature, where each node represents an author and each edge represents two authors collaborating in a paper. The structure of the four classes of networks is shown in Table 2. The dataset is as follows:
Dblp: DBLP academic paper collaboration dataset, where the number of nodes is about 14,485 and the number of edges is 37,026.
GrQc: A collaborative dataset of papers in general relativity and quantum cosmology, where the number of nodes is about 5242 and the number of edges is 14,485.
Hep: A collaborative dataset of papers in high energy physics where the number of nodes is about 15,233 and the number of edges is 31,380.
Phy: A collaborative dataset of papers in the field of physics where the number of nodes is about 14,997 and the number of edges is 57,866.

4.1.3. Experimental Model

In this paper, the algorithm uses the Competitive Independent Cascade model (CIC model) to simulate time-delayed competitive propagation in social networks and verify competitive propagation’s effect.
The range of propagation probabilities is set from 0 to 1. The probabilities in real social networks are often small, so we also restrict the range of propagation probabilities to 0 to 0.5. We choose three different combinations of probabilities to test the propagation range of competitive influence, where p− represents the negative propagation probability and p+ represents the positive propagation probability.
For p− > p+, we set p− = 0.4, p+ = 0.2;
For p− = p+, we set p− = 0.3, p+ = 0.3;
For p− < p+, we set p− = 0.2, p+ = 0.4.

4.1.4. Comparison Method

Random: As a basic comparison algorithm, k nodes are randomly selected in the graph G. Rand for short;
MaxDegree: As a comparison algorithm, one selects k nodes with a maximum degree based on their topology, referred to as HeuMD;
DegreeDiscount: Proposed in the literature [38], a degree discount heuristic algorithm, abbreviated in the figure as HeuDD, with the running time of O(klogN + M);
BetweennessCentrality: Proposed in the literature [39], a heuristic based on the node betweenness centrality, abbreviated as HeuBet in the graph, with an optimal running time of O(MN);
The method in this paper: Iterative discovery algorithm based on propagation snapshot, abbreviated as HeuPFE in the figure, with an optimal running time of O(zrMCNC).

4.1.5. Evaluation Indicators

Influence range: To facilitate a unified comparison of propagation range assessments under delayed competition, this paper sets the initial size of the negatively propagating node set at kN = 5. The size of the positively competing node set ranges from kP = (0–250). By gradually increasing the size of the positively competing nodes, we compare the different suppression effects on the spread of negative nodes [21,22]. We use Monte Carlo simulations, running 2000 iterations on the CIC model, to obtain a relatively stable propagation range. The smaller the spread of negative influence, the better the algorithm performs.
Runtime: We compare the influence propagation runtime found for set sizes of positive competitive nodes up to kP = 250. The smaller the running time, the better the algorithm performs.

4.2. Analysis of Results

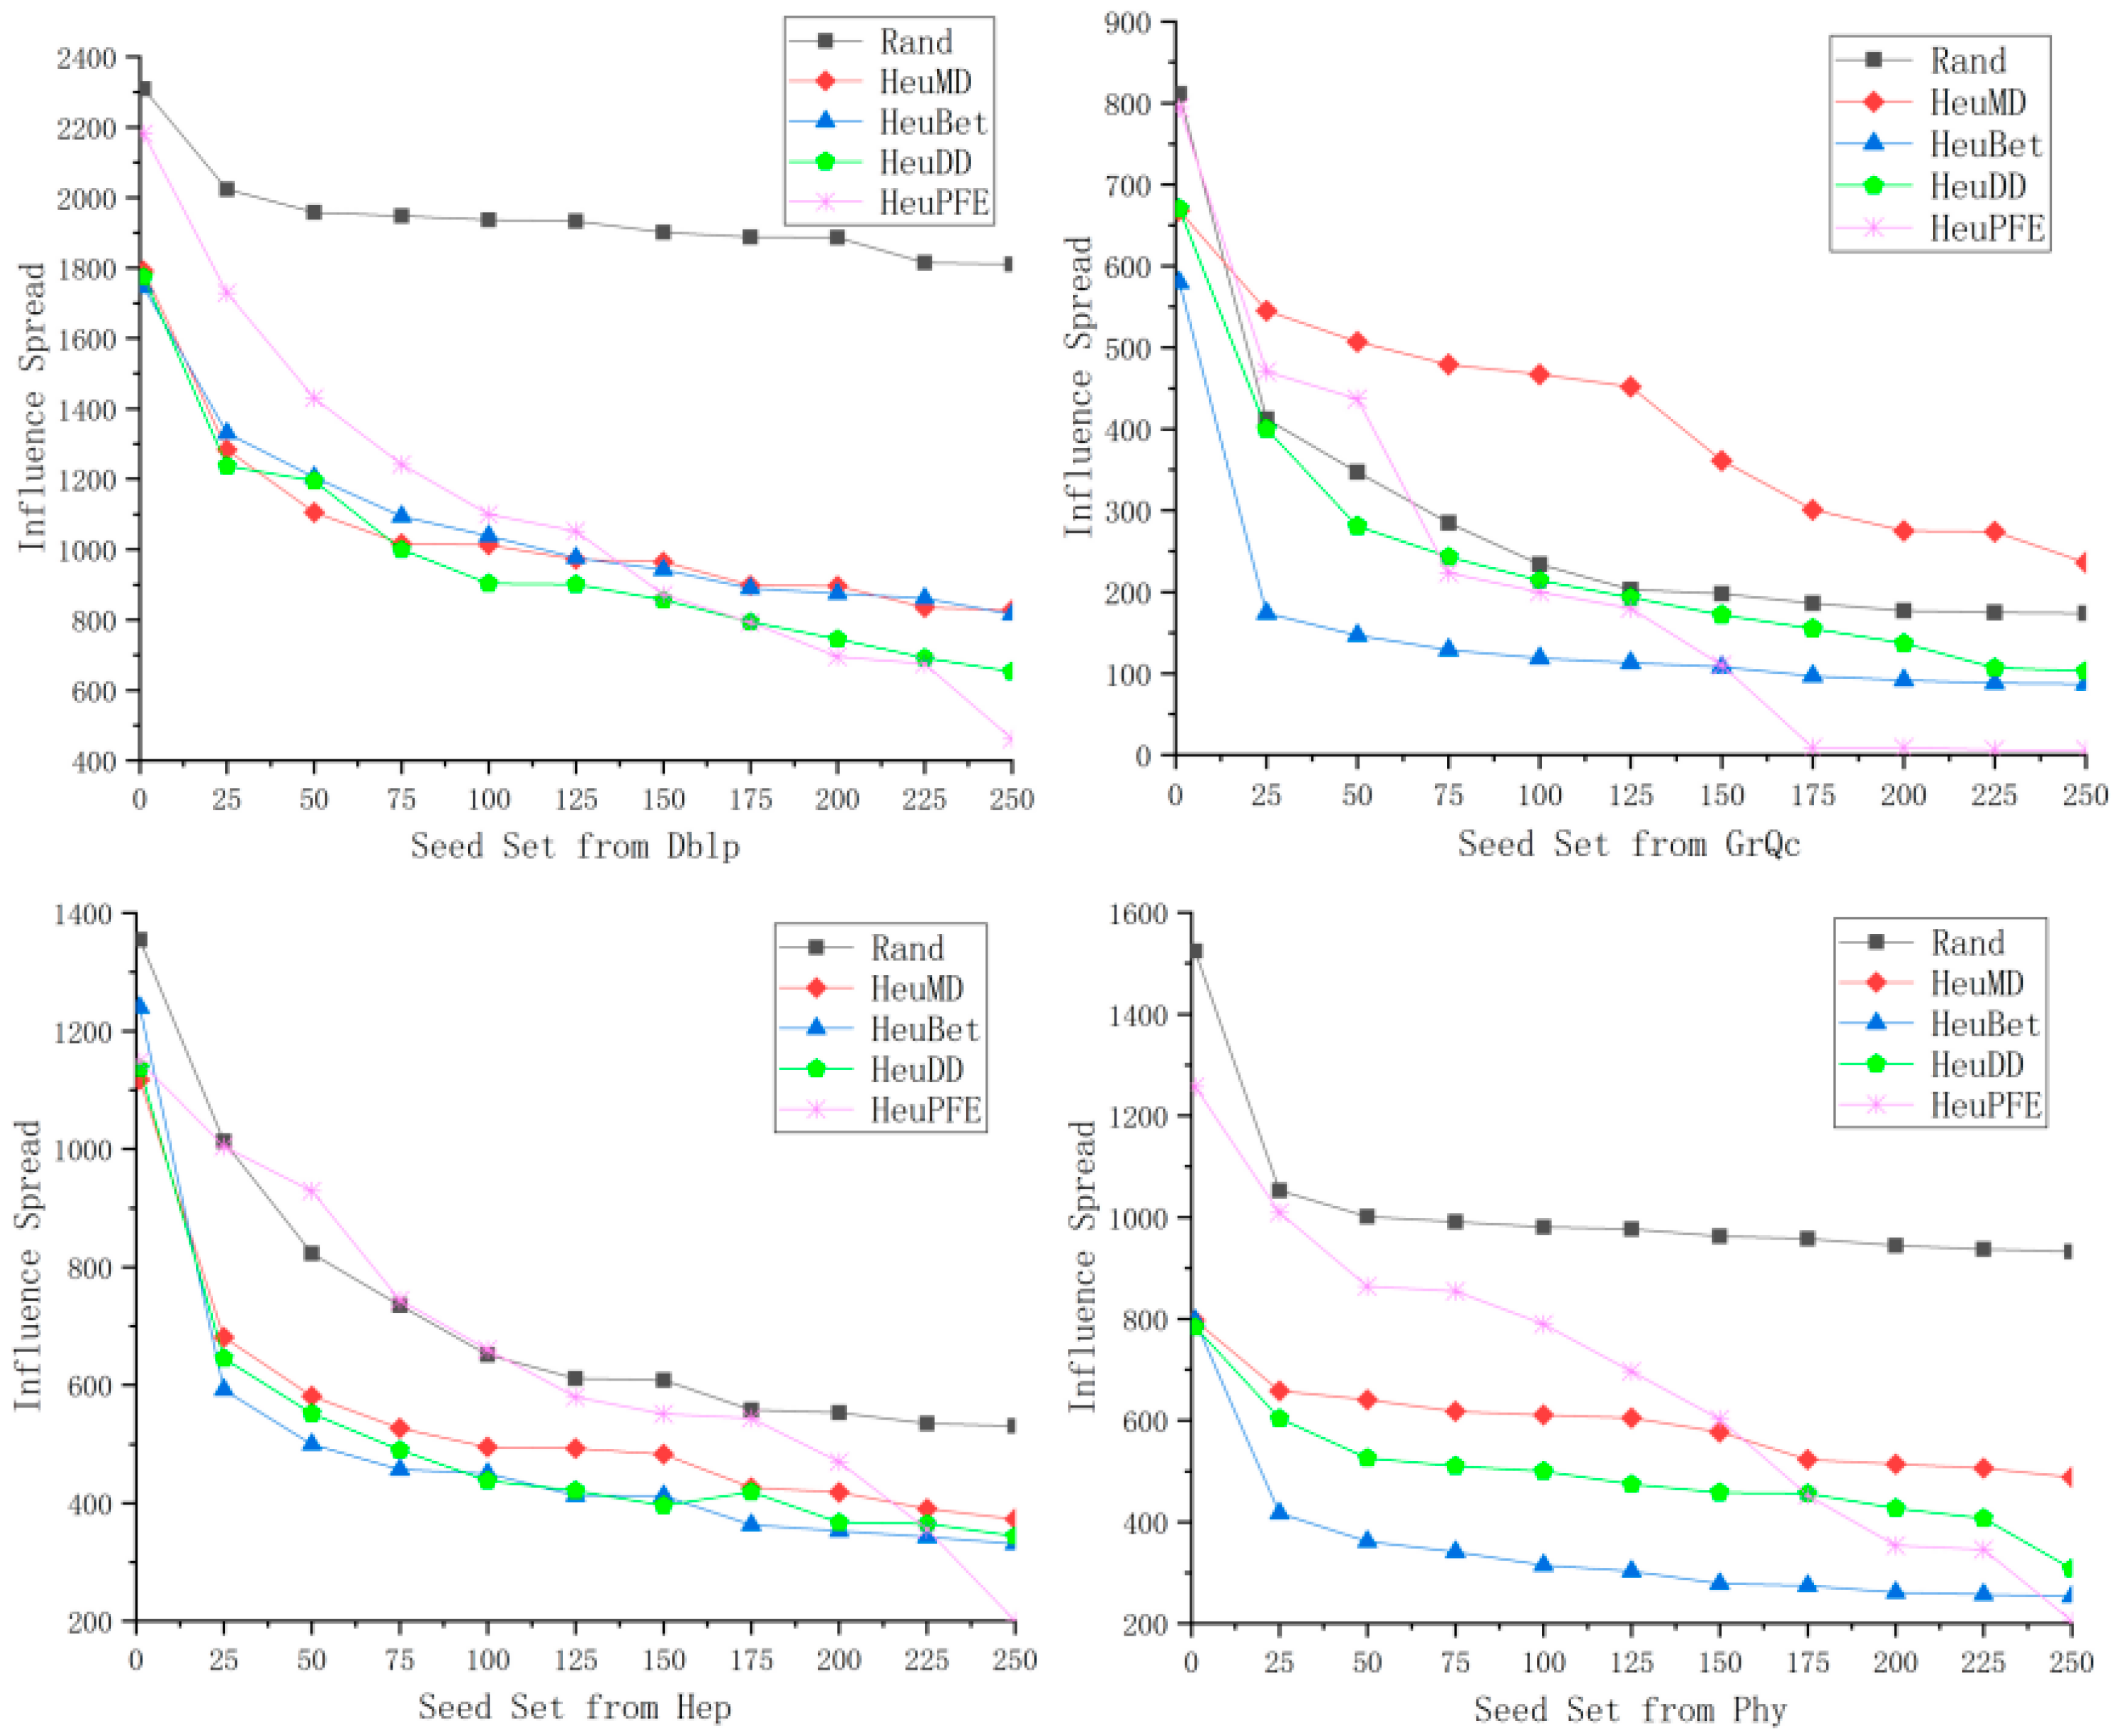
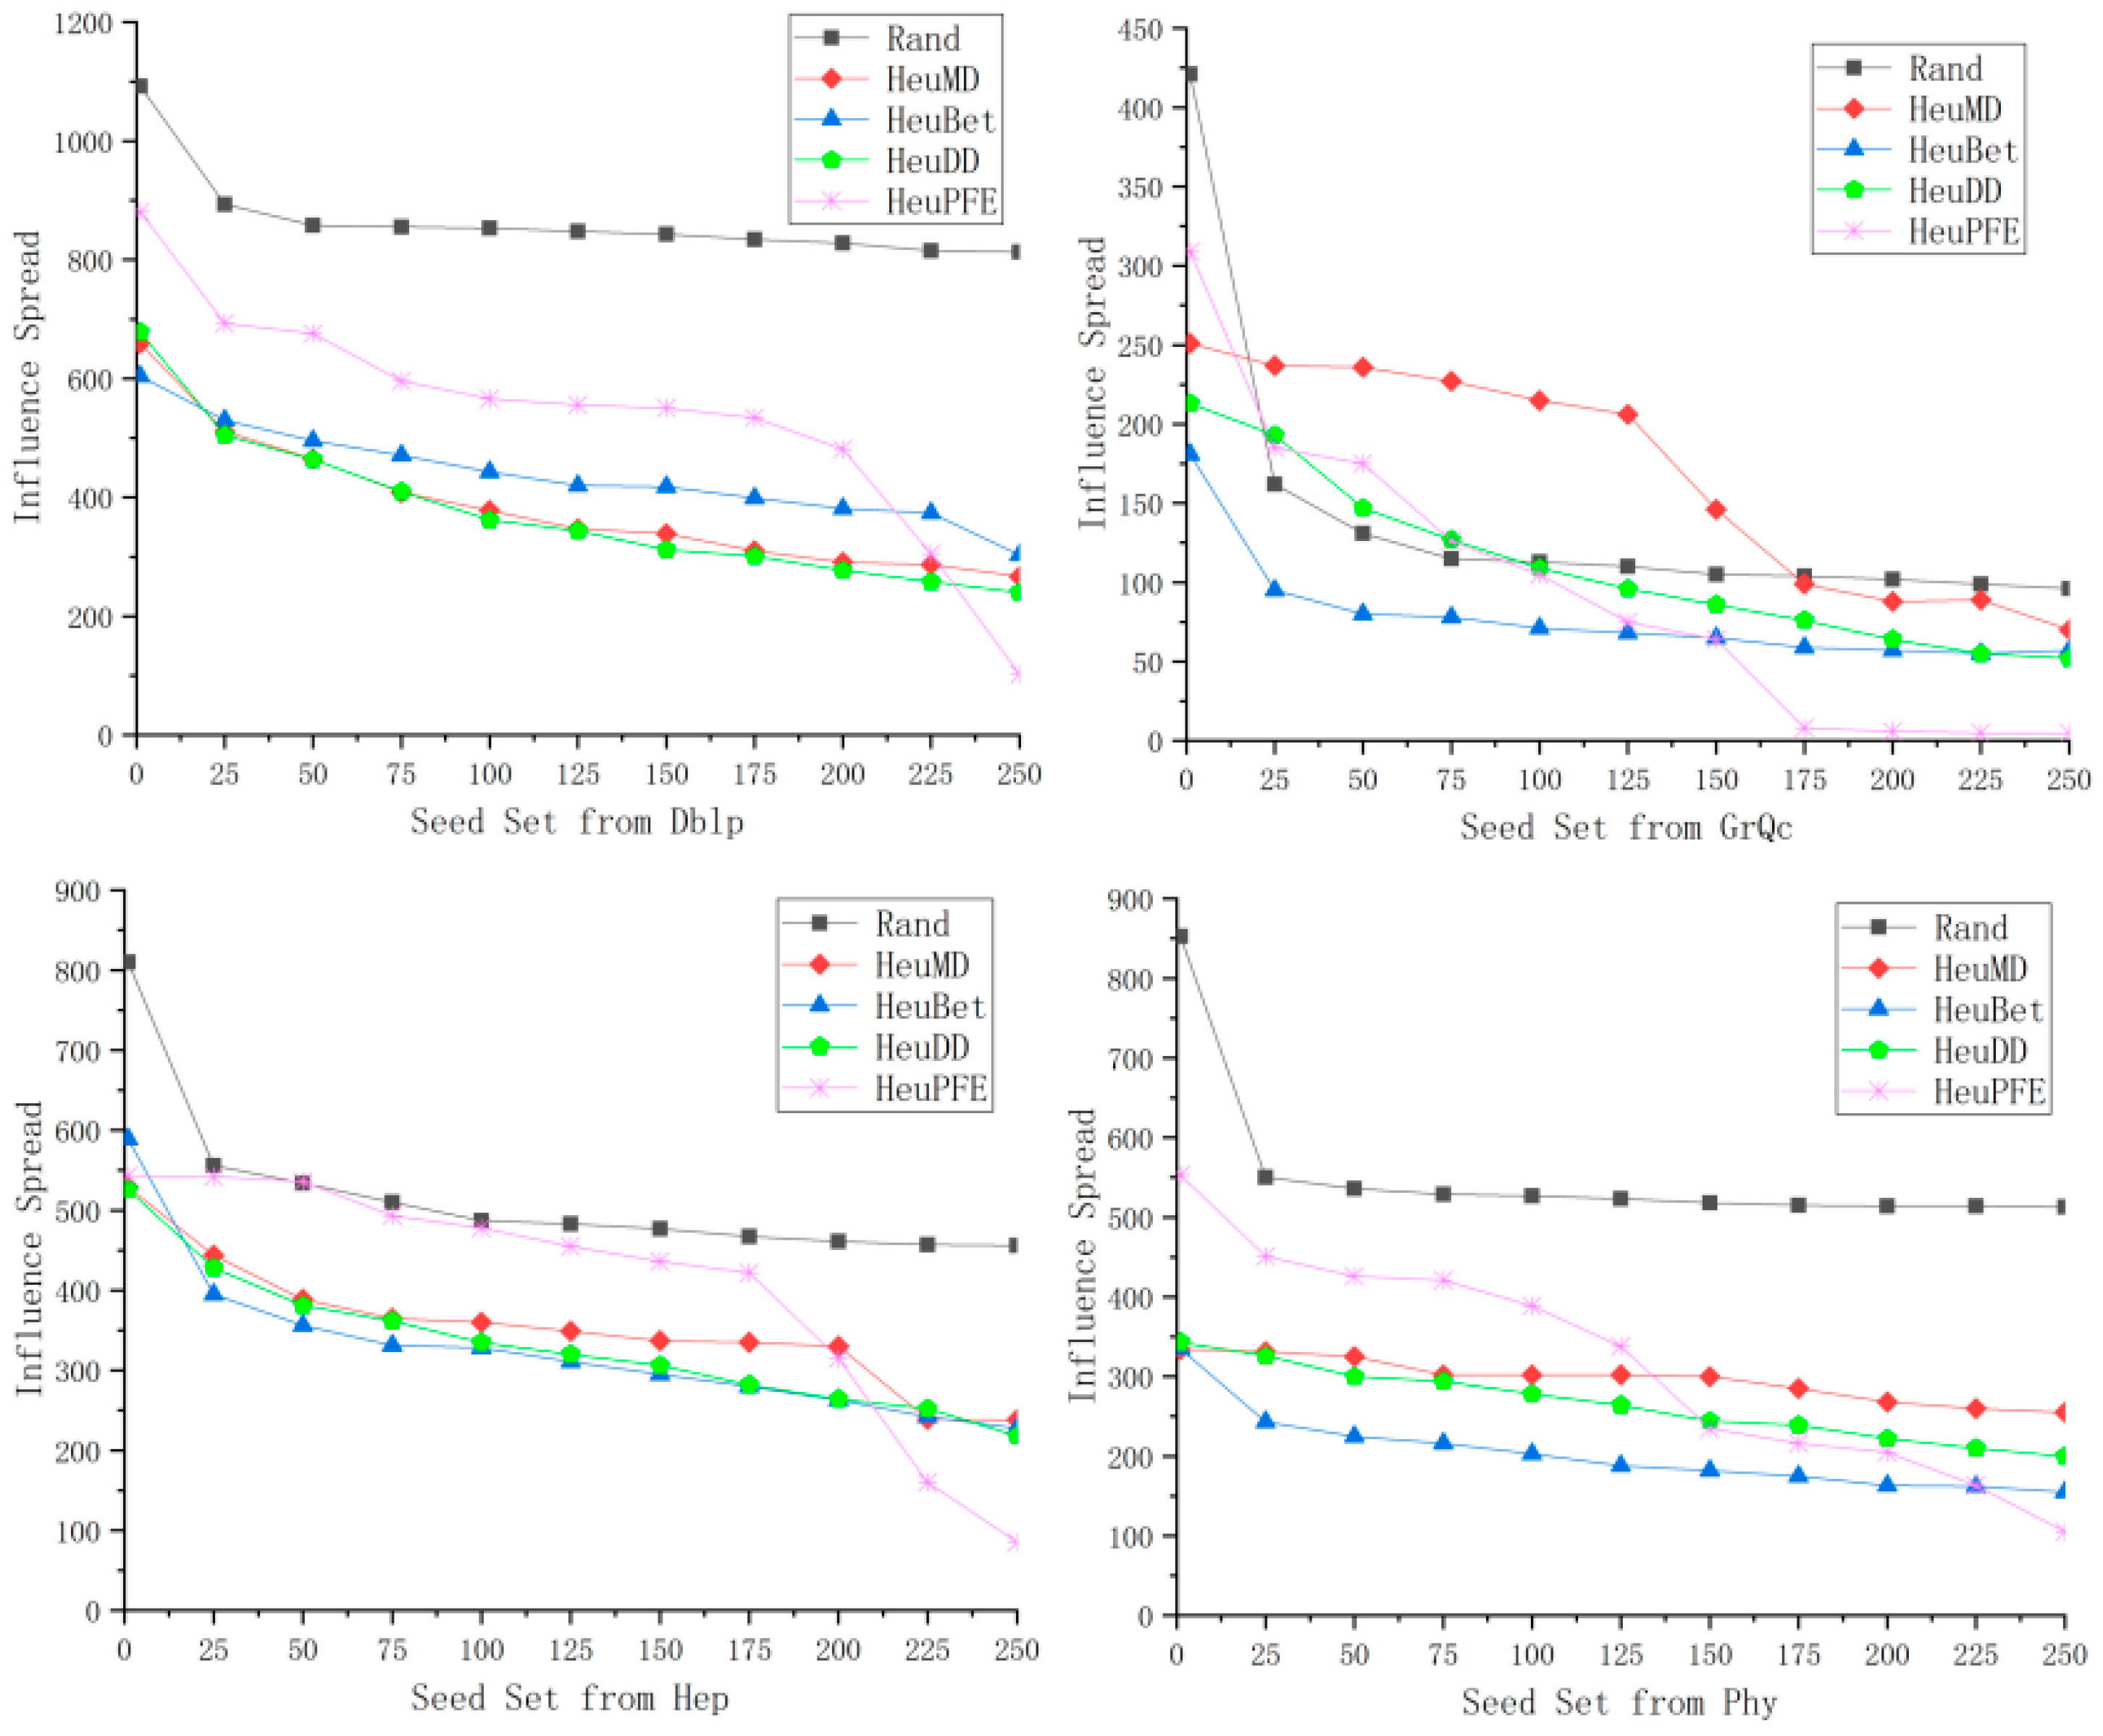
4.2.1. Experimental Results Demonstration

Propagation range: Figure 1, Figure 2 and Figure 3 show the change in the propagation range of the negative nodes for the corresponding graphs in the context of different datasets and propagation probabilities. The vertical axis represents the propagation range of the negative node set, the horizontal axis represents the cumulative increase in the size of the positive nodes, and the line graph indicates the decline in the propagation range of negative nodes across the entire network as the size of the positive node set increases. For ease of reading, the algorithms are sorted in the same top-down manner in the influence propagation legend to compare the change in influence up to kP = 250.
Running time: Figure 4 shows the algorithms’ running times for discovering kP = 250 positive seed nodes in the case of different datasets, and all computational results are measured from the efficiently running algorithm.

4.2.2. Analysis of Influence Scope

As shown in Figure 1, Figure 2 and Figure 3, we see the variation of the propagation range of the negative nodes based on four different datasets (Dblp, GrQc, Hep, and Phy), corresponding to different combinations of propagation probabilities: p− > p+, p− = p+, and p− < p+, respectively.
First, the top black color shows the results of the random strategy in the process of delayed competitive propagation, and although there are a few datasets where the random strategy reflects part of the competitive effect, in the actual process of competition, especially post-order competition, one must choose a targeted strategy to effectively participate in the competition and achieve the suppression of negative propagation.
Second, the traditional heuristics are shown. The maximum degree, betweenness centrality, and degree discount algorithms, corresponding to the red, blue, and green colors, respectively, show varying degrees of inhibition effect; however, they have certain limitations. In particular, the maximum degree algorithm does not work well on all four datasets when p− > p+ and p− = p+ (as shown in Figure 1 and Figure 2), which is based on the “preferential linking” property of the scale-free network where nodes with larger degrees tend to link together to limit the effectiveness of competition; when p− < p+, the positive probability has a clear advantage, as the suppressive effect of the maximum degree algorithm gradually comes into play with the cumulative effect of the positive node size.
Once again, the betweenness centrality and degree discounting algorithms, which correspond to the blue and green colors, respectively, show cross-consistency, superior performance on all four datasets, and relatively stable results in three probabilistic combinations of suppression. Nevertheless, for betweenness centrality as a global calculation strategy, its time complexity is relatively high, which cannot be directly applied to large-scale social network scenarios; in contrast, the degree discount algorithm is highly scalable and achieves a relatively stable suppression effect, and therefore also serves as the benchmark method for comparison in this paper.
Finally, the HeuPFE algorithm corresponds to the pink color and can greatly suppress the spread of negative influence. It shows better performance on all four datasets. With the number of the positive competing nodes set as kP = 250, we compare the negative influence propagation scale corresponding to the different algorithms. Compared with the betweenness centrality, it improves 43.5%, 93.1%, 39.6%, and 19.0% when p− > p+; 66.3%, 91.2%, 62.7%, and 32.3% when p− = p+; and 83.2%, 85.2%, 79.0%, and 69.6% when p− < p+, respectively. Compared with the degree discount algorithm, the improvement is 29.4%, 94.2%, 41.9%, and 33.4% when p− > p+; 57.5%, 90.3%, 61.0%, and 47.5% when p− = p+; and 71.0%, 82.1%, 78.8%, and 68.8% when p− < p+, respectively.
We conducted experimental comparisons on all four datasets with three sets of competing probabilities, and all algorithms further improve their suppression effect as the positive propagation probability increases; meanwhile, the global calculation strategy tends to show some advantages when the size of positive nodes is small. However, as the size of positive nodes increases cumulatively, local calculation strategies start to show a significant advantage, such as HeuDD and HeuPFE. In contrast, the HeuPFE algorithm proposed in this problem shows a better suppression effect.

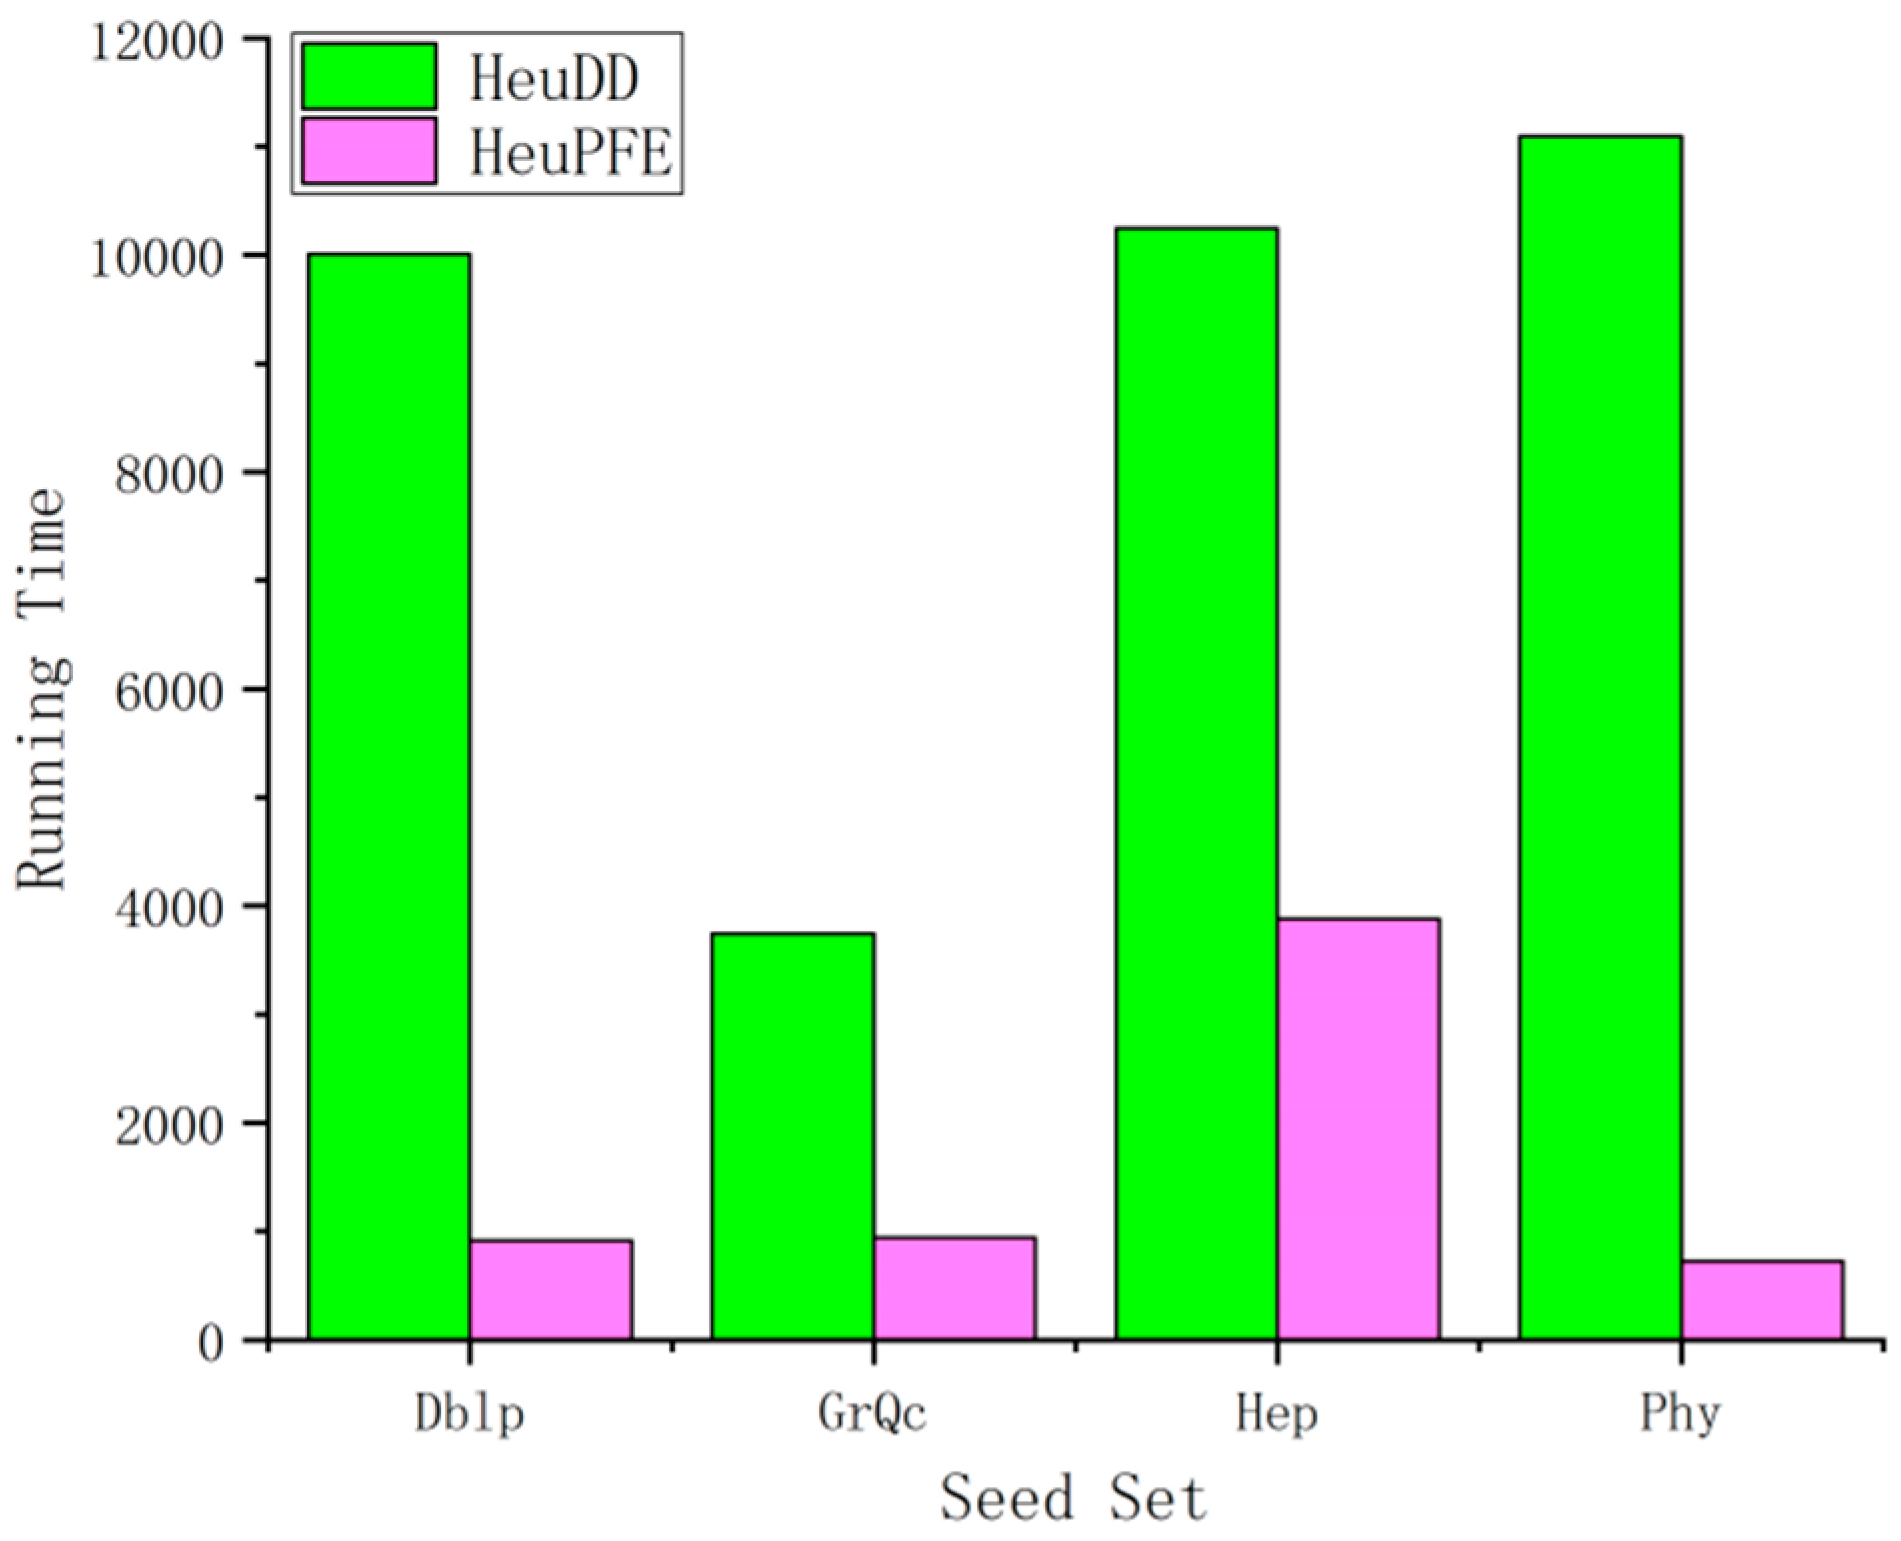
4.2.3. Running Time Analysis

In Figure 4, we can see the algorithm running times based on four different datasets.
Based on the analysis of the propagation range the HeuMD algorithm causes unstable performance with a change of datasets and the influence of competition probability, and the HeuBet algorithm involves whole-network calculation, which results in too much time complexity. Currently, the HeuDD algorithm can achieve a good balance between the range of suppressed propagation and scalability; therefore, we compare the proposed algorithm with it in runtime.
Both the HeuDD algorithm and the HeuPFE algorithm proposed in this paper maintain good stability with different datasets. Compared with HeuDD, the HeuPFE algorithm saves 90.9%, 74.8%, 62.1%, and 93.5% of the running time on the four datasets, which also reflects the computational loss of the propagation path in the topology of the different datasets.

5. Conclusions and Outlook

The study of delayed competitive influence in social networks has significant practical implications. We further propose a heuristic shortest path algorithm to identify the set of positive nodes. Experimental results on four datasets show that our method effectively reduces time complexity by narrowing the search space, significantly suppressing the influence spread of negative nodes. Compared to existing methods, it achieves a better balance of performance and scalability.
Nonetheless, there is much room to enhance our research efforts in the future; for example, with attenuation modeling, uncertain information sources, cross-network propagation, and other perspectives on delayed competitive influence that may provide more scalable research.

Author Contributions

Conceptualization, Y.L. and Z.W.; methodology, Y.L.; software, Z.W.; validation, Y.L. and Z.W.; formal analysis, Z.W.; investigation, Y.L.; resources, Z.W.; data curation, Z.W.; writing—original draft preparation, Y.L.; writing—review and editing, Y.L.; visualization, Y.L.; supervision, Z.W.; project administration, Y.L.; funding acquisition, Y.L. All authors have read and agreed to the published version of the manuscript.

Funding

The research work of this paper was supported by the General Project of the National Social Science Foundation of China (19BXW107).

Informed Consent Statement

Not applicable.

Data Availability Statement

The experimental data were obtained from the arXiv dataset [37].

Acknowledgments

The research work of this paper was supported by the General Project of the National Social Science Foundation of China (19BXW107).

Conflicts of Interest

The authors declare no conflict of interest.

References

  1. Stackelberg Model [EB/OL]. 1934. Available online: https://wiki.mbalib.com/wiki/ (accessed on 30 August 2008).
  2. Higgins, R.S. An economic theory of leader choice in Stackelberg models. J. Econ. Stud. 1996, 23, 79–95. [Google Scholar] [CrossRef]
  3. Bharathi, S.; Kempe, D.; Salek, M. Competitive influence maximization in social networks. In International Workshop on Web and Internet Economics; Springer: Berlin/Heidelberg, Germany, 2007; pp. 306–311. [Google Scholar]
  4. Kostka, J.; Oswald, Y.A.; Wattenhofer, R. Word of mouth: Rumor dissemination in social networks. In International Colloquium on Structural Information and Communication Complexity; Springer: Berlin/Heidelberg, Germany, 2008; pp. 185–196. [Google Scholar]
  5. Clark, A.; Poovendran, R. Maximizing influence in competitive environments: A Gametheoretic Approach. In International Conference on Decision and Game Theory for Security; Springer: Berlin/Heidelberg, Germany, 2011; pp. 151–162. [Google Scholar]
  6. Hemmati, M.; Smith, J.C.; Thai, M.T. A cutting-plane algorithm for solving a weighted influence interdiction problem. Comput. Optim. Appl. 2014, 57, 71–104. [Google Scholar] [CrossRef]
  7. Taninmis, K.; Aras, N.; Altinel, I.K. Influence Maximization With Deactivation In Social Networks. Eur. J. Oper. Res. 2019, 278, 105–119. [Google Scholar] [CrossRef]
  8. Pastor-Satorras, R.; Vespignani, A. Immunization of complex networks. Phys. Rev. E 2002, 65, 036104. [Google Scholar] [CrossRef] [PubMed]
  9. Cohen, R.; Havlin, S.; Ben-Avraham, D. Efficient immunization strategies for computer networks and populations. Phys. Rev. Lett. 2003, 91, 247901. [Google Scholar] [CrossRef] [PubMed]
  10. Kitsak, M.; Gallos, L.K.; Havlin, S.; Liljeros, F.; Muchnik, L.; Stanley, H.E.; Makse, H.A. Identification of influential spreaders in complex networks. Nat. Phys. 2010, 6, 888–893. [Google Scholar] [CrossRef]
  11. Hou, B.; Yao, Y.; Liao, D. Identifying all-around nodes for spreading dynamics in complex networks. Phys. A Stat. Mech. Its Appl. 2012, 391, 4012–4017. [Google Scholar] [CrossRef]
  12. Liu, J.G.; Ren, Z.M.; Guo, Q. Ranking the spreading influence incomplex networks. Phys. A Stat. Mech. Its Appl. 2013, 392, 4154–4159. [Google Scholar] [CrossRef]
  13. Zhang, Y.; Prakash, B.A. Dava: Distributing vaccines over networks under prior information. In Proceedings of the 2014 SIAM International Conference on Data Mining, Philadelphia, PA, USA, 24–26 June 2014; pp. 46–54. [Google Scholar]
  14. Zhang, Y.; Adiga, A.; Saha, S.; Vullikanti, A.; Prakash, B.A. Near-optimal algorithms for controlling propagation at group scale on networks. IEEE Trans. Knowl. Data Eng. 2016, 28, 3339–3352. [Google Scholar] [CrossRef]
  15. Chen, L.D.; Ren, X.L.; Zhang, Q.M.; Zhang, Y.C.; Zhou, T. Vital nodes identification in complex networks. Phys. Rep. 2016, 650, 1–63. [Google Scholar] [CrossRef]
  16. Kimura, M.; Saito, K.; Motoda, H. Minimizing the spread of contamination by blocking links in a network. AAAI 2008, 8, 1175–1180. [Google Scholar]
  17. Kimura, M.; Saito, K.; Motoda, H. Blocking links to minimize contamination spread in a social network. ACM Trans. Knowl. Discov. Data (TKDD) 2009, 3, 9. [Google Scholar] [CrossRef]
  18. Tong, H.; Prakash, B.A.; Eliassi-Rad, T.; Faloutsos, M.; Faloutsos, C. Gelling and melting, large graphs by edge manipulation. In Proceedings of the 21st ACM International Conference on Information and Knowledge Management, Maui, HI, USA, 29 October–2 November 2012; pp. 245–254. [Google Scholar]
  19. Kuhlman, C.J.; Tuli, G.; Swarup, S.; Marathe, M.V.; Ravi, S.S. Blocking simple and comple contagion by edge removal. In Proceedings of the 2013 IEEE 13th International Conference on Data Mining, Dallas, TX, USA, 7–10 December 2013; pp. 399–408. [Google Scholar]
  20. Khalil, E.B.; Dilkina, B.; Song, L. Scalable diffusion-aware optimization of network topology. In Proceedings of the 20th ACM SIGKDD International Conference on Knowledge Discovery and Data Mining, New York, NY, USA, 24–27 August 2014; pp. 1226–1235. [Google Scholar]
  21. Liu, X. Research on Efficient Processing Techniques for Influence Maximization Problems in Large-Scale Social Networks. Ph.D. Thesis, National University of Defense Technology, Changsha, China, 2013; pp. 25–26. [Google Scholar]
  22. Zhang, J.; Wang, S.; Zhan, Q.; Yu, P.S. Interwined viral marketing in social networks. In Proceedings of the IEEE/ACM International Conference on Advances in Social Networks Analysis and Mining, San Francisco, CA, USA, 18–21 August 2016; pp. 239–246. [Google Scholar]
  23. Carnes, T.; Nagarajan, C.; Wild, S.M.; van Zuylen, A. Maximizing influence in a competitive social network: A follower’s perspective. In Proceedings of the Ninth International Conference on Electronic Commerce, Chicago, IL, USA, 8–12 July 2007; pp. 351–360. [Google Scholar]
  24. Chen, W.; Wei, L.; Zhang, N. Time-critical influence maximization in social networks with time-delayed diffusion process. In Proceedings of the 26th AAAI Conference on Artificial Intelligence, Melbourne, Australia, 19–25 August 2012. [Google Scholar]
  25. Lin, S.-C.; Lin, S.-D.; Che, M.-S.N. A learning-based framework to handle multi-round multi-party influence maximization on social networks. In Proceedings of the 21th ACM SIGKDD International Conference on Knowledge Discovery and Data Mining, Sydney, Australia, 10–13 August 2015; pp. 695–704. [Google Scholar]
  26. Bozorgi, A.; Samet, S.; Kwisthout, J.; Wareham, T. Community-based influence maximization in social networks under a competitive linear threshold model. Knowl.-Based Syst. 2017, 134, 149–158. [Google Scholar] [CrossRef]
  27. Li, H.; Pan, L.; Wu, P. Dominated competitive influence maximization with time-critical and timedelayed diffusion in social networks. J. Comput. Sci. 2018, 28, 318–327. [Google Scholar] [CrossRef]
  28. Pham, C.V.; Duong, H.V.; Hoang, H.X. Competitive Influence Maximization within Time and Budget Constraints in Online Social Networks: An Algorithmic Approach. Appl. Sci. 2019, 9, 2274. [Google Scholar] [CrossRef]
  29. Chen, B.-L.; Sheng, Y.-Y.; Ji, M.; Liu, J.-W.; Yu, Y.-T.; Zhang, Y. Competitive Influence Maximization on Online Social Networks under Cost Constraint. KSII Trans. Internet Inf. Syst. 2021, 15, 1263–1274. [Google Scholar] [CrossRef]
  30. Budak, C.; Agrawal, D.; EL Abbadi, A. Limiting the spread of misinformation in social networks. In Proceedings of the 20th International Conference on World Wide Web, Hyderabad, India, 28 March–1 April 2011; ACM: New York, NY, USA, 2011; pp. 665–674. [Google Scholar]
  31. Nguyen, N.P.; Yan, G.; Thai, M.T.; Eidenbenz, S. Containment of misinformation spread in online social networks. In Proceedings of the 4th ACM Web Science (WebSci’ 12), Evanston, IL, USA, 22–24 June 2012; ACM: New York, NY, USA, 2012. [Google Scholar]
  32. Wang, B.; Chen, G.; Fu, L.; Song, L.; Wang, X. Drimux: Dynamic rumor influence minimization with user experience in social networks. IEEE Trans. Knowl. Data Eng. 2016, 29, 2168–2181. [Google Scholar] [CrossRef]
  33. Rawale, S.; Birkure, S.; Hiray, K.; Deshmukh, D. Detection and Minimization Influence of Rumor in Social Network. Int. Res. J. Eng. Technol. (IRJET) 2017, 4, 757–761. [Google Scholar]
  34. Yan, R.; Zhu, Y.; Li, D.; Ye, Z. Minimum cost seed set for threshold influence problem under competitive models. World Wide Web 2018, 22, 2977–2996. [Google Scholar] [CrossRef]
  35. Gu, H.; Xi, J.; Wu, J. Community division algorithm based on association coefficient. Microcomput. Appl. 2015, 34, 17–19. [Google Scholar]
  36. Raghavan, U.N.; Albert, R.; Kumara, S. Near linear time algorithm to detec community structures in large-scale networks. Phys. Rev. E 2007, 76, 036106. [Google Scholar] [CrossRef] [PubMed]
  37. High Energy Physics [EB/OL]. 2003. Available online: http://www.arxiv.org/archive/hep (accessed on 5 June 2003).
  38. Chen, W.; Wang, Y.; Yang, S. Efficient influence maximization in social networks. In Proceedings of the 15th ACM SIGKDD conference on Knowledge Discovery and Data Mining, New York, NY, USA, 28 June–1 July 2009; pp. 199–208. [Google Scholar]
  39. Barthelemy, M. Betweenness centrality in large complex networks. Eur. Phys. J. B 2004, 38, 163–168. [Google Scholar] [CrossRef]
Figure 1. Influence spread based on dataset when p− > p+.
Information 15 00370 g001
Figure 2. Influence spread based on dataset when p− = p+.
Information 15 00370 g002
Figure 3. Influence spread based on dataset when p− < p+.
Information 15 00370 g003
Figure 4. Running time based on dataset.
Information 15 00370 g004
Table 1. Variables used in this paper.
VariablesDescriptions
NThe number of vertices
MThe number of edges
SNThe set of negative seed
kNThe number of negative seeds
kPThe number of positive seeds
RThe simulation times of propagation in algorithm
RThe simulation times of matrix in algorithm
SimCas(S)The spread process of set S
SThe set of selected seed
SGThe candidate vertices set for algorithm
MGvThe marginal gain of vertex v which is added to set S
PFEvThe propagation factor evaluation of vertex v
ZThe number of communities
NCThe number of vertices in community
MCThe number of edges in community
NsdThe shortest distance from the negative vertex u to v
SpfThe shortest path frequency through vertex v
AdmThe adjacency degree measure of vertex v
Table 2. Statistics of four real-world networks.
DataSet#Vertices#Edges
Dblp14,48537,026
GrQc524214,485
Hep15,23331,380
Phy14,99757,866
Disclaimer/Publisher’s Note: The statements, opinions and data contained in all publications are solely those of the individual author(s) and contributor(s) and not of MDPI and/or the editor(s). MDPI and/or the editor(s) disclaim responsibility for any injury to people or property resulting from any ideas, methods, instructions or products referred to in the content.

