Abstract
Recent advances in machine learning (ML) have shown great promise in detecting heart disease. However, to ensure the clinical adoption of ML models, they must not only be generalizable and robust but also transparent and explainable. Therefore, this research introduces an approach that integrates the robustness of ensemble learning algorithms with the precision of Bayesian optimization for hyperparameter tuning and the interpretability offered by Shapley additive explanations (SHAP). The ensemble classifiers considered include adaptive boosting (AdaBoost), random forest, and extreme gradient boosting (XGBoost). The experimental results on the Cleveland and Framingham datasets demonstrate that the optimized XGBoost model achieved the highest performance, with specificity and sensitivity values of 0.971 and 0.989 on the Cleveland dataset and 0.921 and 0.975 on the Framingham dataset, respectively.
1. Introduction
Cardiovascular diseases (CVDs) are the leading cause of death worldwide [1]. The World Health Organization (WHO) attributes over 17.9 million deaths yearly to CVDs. Among these deaths, 32% are caused by coronary heart disease (CHD). The early detection of heart disease risk is crucial for effective treatment and prevention [2,3]. In recent years, machine learning, a subset of artificial intelligence (AI), has shown promise in improving the accuracy of heart disease prediction [4,5,6]. Ensemble classifiers have been widely used to achieve improved performance by combining the predictions of multiple individual classifiers. However, the performance of ensemble algorithms is heavily dependent on their hyperparameters, such as the number of trees, learning rate, and depth of the trees [7,8]. Therefore, tuning these hyperparameters is crucial to enhance the model’s performance.
Furthermore, ML models are often considered “black boxes” due to their lack of interpretability and transparency, i.e., the decision-making process of the models is not easily understandable to humans [9]. Recently, the SHAP technique was proposed by Lundberg and Lee [10] to achieve model interpretability—a breakthrough in Explainable AI (XAI). SHAP is an approach based on game theory that is used to explain the output of ML models by assigning each feature an important value. The importance of SHAP values in the context of heart disease prediction lies in their ability to provide detailed insights into how each feature influences the model’s prediction. This is particularly important in healthcare, where understanding the rationale behind a prediction is as crucial as the prediction’s accuracy [11,12].
SHAP values assist in identifying which features are most important for a model’s decision, enabling the development of more interpretable and trustworthy models. By quantifying the impact of each feature on the prediction using SHAP values, practitioners can gain a deeper understanding of the model’s behavior, identify potential biases, and ensure that the model aligns with clinical knowledge and ethical standards [13,14]. Therefore, this study proposes an approach for heart disease prediction using ensemble classifiers, Bayesian optimization, and the SHAP technique. The ensemble classifiers used include random forest, XGBoost, and AdaBoost. These algorithms were selected because of their proven effectiveness in a variety of ML tasks. The Bayesian optimization technique is introduced to tune each classifier’s hyperparameters to maximize performance while minimizing overfitting.
Meanwhile, the SHAP approach will be used to interpret the predictions made by the ensemble classifiers. The introduction of SHAP is aimed at gaining insight into which features are most influential in the prediction of heart disease, providing valuable information for clinicians and researchers. The proposed approach will be evaluated on two publicly available datasets containing various clinical and demographic features of patients, such as age, gender, cholesterol levels, and blood pressure. The performance of the ensemble classifiers with Bayesian optimization will be compared with the standard classifiers without optimization.
2. Background
The field of heart disease prediction using ML has been explored in the literature, with numerous studies demonstrating the performance of various ensemble methods. Ensemble classifiers have been utilized due to their high accuracy and robustness against overfitting. For instance, Yang et al. [15] and Mahesh et al. [16] have employed random forest and AdaBoost, respectively, to successfully identify key predictors of cardiovascular diseases in large patient datasets. These studies indicate the potential of ensemble models to enhance heart disease prediction performance using the strengths of multiple learning algorithms.
Similarly, Mienye et al. [4] proposed an ensemble approach for heart disease prediction. The study employed the classification and regression tree (CART) algorithm to build multiple base models from randomly partitioned subsets of data. The accuracy-based weighted-aging classifier was used to combine the various base models, achieving a strong homogeneous ensemble classifier, which obtained an accuracy of 93% on the Cleveland dataset and 91% on the Framingham dataset. Gao et al. [17] developed an ensemble approach for heart disease detection. The study employed a bagging ensemble of decision trees combined with two feature selection techniques, including principal component analysis and linear discriminant analysis, achieving state-of-the-art performance on the Cleveland dataset.
Furthermore, the integration of hyperparameter optimization strategies, such as Bayesian optimization, has been shown to significantly enhance model performance by tuning model parameters. Shi et al. [18] demonstrated how Bayesian optimization could be applied to XGBoost to optimize its parameters, leading to substantial improvements in predictive accuracy compared to using default settings. Additionally, interpretability in ML models has gained significant attention, and it is crucial for clinical acceptance and decision-making as it provides transparency regarding the decision-making processes of the models. Asan et al. [19] studied the impact of human trust in healthcare AI and noted that transparency is particularly important in healthcare settings, where understanding the rationale behind a model’s predictions can impact patient outcomes, improve physician trust, and facilitate regulatory compliance.
Meanwhile, within the context of interpretability, the SHAP technique was recently introduced to explain the output of ML models. The work of Debjit et al. [20] highlights how SHAP values can explain the contribution of each feature to the prediction made by complex models, thereby offering insights into model behavior that are both comprehensive and understandable to clinicians. Therefore, this study proposes a hybrid approach that integrates ensemble classifiers with Bayesian optimization to develop an accurate heart disease prediction model, with SHAP values providing insights into the decision-making process of the models, making the predictions transparent and understandable to healthcare professionals.
3. Materials and Methods
3.1. Heart Disease Datasets
The Cleveland Heart Disease dataset is comprised of 14 attributes collected from patients undergoing testing for heart disease at the Cleveland Clinic Foundation [21]. The dataset includes a mix of patient demographic information, blood test results, and results from various cardiovascular tests. Each row corresponds to a patient, and the goal typically involves predicting the presence of heart disease based on these attributes. Table 1 shows a description of the dataset’s features. Meanwhile, the Framingham Heart Study dataset is derived from an influential cardiovascular study initiated in 1948 in Framingham, Massachusetts [22]. It aimed to identify common factors or characteristics contributing to cardiovascular disease. The study initially enrolled 5209 persons aged 30 to 62 years and has been expanded to include subsequent generations, providing a wealth of data spanning several decades. The dataset typically utilized for cardiovascular disease prediction includes variables such as age, sex, smoking status, blood pressure, cholesterol levels, diabetes status, and body mass index (BMI), among others. These variables are used to model and predict the 10-year risk of developing CHD, offering vital insights for preventative healthcare strategies. Table 2 provides a description of the dataset.

Table 1.
Description of the Cleveland Heart Disease dataset.
Table 2.
Framingham Heart Study Dataset.
3.2. Ensemble Classifiers
3.2.1. Random Forest
Random forest (RF) is an ensemble learning method that operates by constructing a multitude of decision trees at training time and outputting the class that is the mode of the classes for classification problems [23,24]. The fundamental concept behind RF is to combine the predictions of several decision trees constructed on different subsets of the dataset to improve the model’s generalization ability. Suppose we have a dataset D consisting of n instances and m attributes; the random forest algorithm builds each tree by selecting a random subset of instances and a random subset of attributes at each node to split on. This randomness ensures that the trees are diverse. For a new instance, each tree in the forest votes for that instance to belong to the most frequent class. Therefore, the random forest prediction, , can be represented as follows:
where T is the number of trees in the forest and is the prediction of the ith tree [25]. For regression tasks, the mean prediction of all trees is considered. The random forest is robust to overfitting, can handle high dimensional data, and can model complex nonlinear relationships, which are often present in medical datasets [26,27]. This makes it suitable for heart disease prediction.
3.2.2. XGBoost
XGBoost is an advanced implementation of the gradient boosting algorithm known for its efficiency and performance [28,29]. XGBoost improves upon the traditional gradient boosting technique by introducing a more regularized model formalization to control over-fitting, making it a powerful algorithm for complex predictive modeling tasks such as heart disease prediction. The core idea of XGBoost is to iteratively refine predictions through an ensemble of decision trees. Each new tree attempts to correct errors made by the previously built trees [30]. The prediction, , for an instance, i, after T rounds of boosting is given by the following:
where represents the tth tree’s contribution, and is the feature vector of the ith instance. The objective function that XGBoost optimizes is as follows:
where l is a differentiable convex loss function that measures the difference between the predicted and the actual outcomes for the ith instance and is the regularization term, which penalizes the complexity of the model, including the number of leaves and the magnitude of the leaf weights in tree , to prevent overfitting. Meanwhile, to achieve optimal performance, XGBoost requires careful tuning of several hyperparameters, such as the learning rate and the depth of trees [31,32]. This process can be significantly enhanced by employing techniques like Bayesian optimization, which systematically searches the hyperparameter space by considering the past evaluation results and aims to find the set of hyperparameters that minimizes the validation error.
3.2.3. AdaBoost
AdaBoost is a powerful ensemble technique that combines multiple weak learners, typically decision trees, to create a strong classifier [33]. It mainly fits a sequence of weak learners (i.e., models that are slightly better than random guessing) on repeatedly modified versions of the data. The predictions from all of them are then combined through a weighted majority vote to produce the final prediction [34]. This approach allows the algorithm to focus more on the instances that are harder to predict, thereby increasing the overall model’s predictive performance on complex problems such as heart disease prediction. AdaBoost starts with equal weights for all instances in the dataset and iteratively adjusts these weights. After each classifier is trained, the weights are updated to increase the importance of instances that were misclassified, guiding the algorithm to focus on misclassified instances in subsequent iterations [35]. The output of the AdaBoost algorithm is a weighted sum of the weak classifiers, defined mathematically as follows:
where T is the total number of weak classifiers, is the prediction of the tth classifier, and is the weight of the tth classifier, which is calculated based on its error rate [36]. The error rate of each classifier is given by the following:
where is the weight of the ith instance, is the actual label, and I is an indicator function that returns 1 when and 0 otherwise.
3.3. Shapley Additive Explanations
Shapley Additive Explanations values are derived from game theory and offer a unified measure of feature importance that is both theoretically sound and consistent [37]. SHAP values explain the prediction of an instance by computing the contribution of each feature to the difference between the current prediction and the average prediction across all instances [38,39]. This approach provides an interpretable and detailed decomposition of a model’s output, making it a powerful technique for understanding complex ML models, including ensemble classifiers like random forest, XGBoost, and AdaBoost. The foundation of SHAP values is the Shapley value, a concept from cooperative game theory that allocates payouts to players based on their contribution to the total payout [40]. In the context of machine learning, features are considered “players”, and the “payout” is the prediction output of the model. The Shapley value for feature i is calculated as follows:
where F is the set of all features, S is a subset of features excluding i, is the cardinality of set S, is the total number of features, is the prediction when only the features in set S are used, and is the prediction when the features in S along with feature i are used. The SHAP value thus represents the average marginal contribution of feature i over all possible combinations of features [10].
3.4. Proposed Heart Disease Prediction Approach
The proposed approach for heart disease prediction integrates the robustness of ensemble learning techniques, specifically random forest, AdaBoost, and XGBoost, with Bayesian optimization to effectively optimize each model’s hyperparameters. The initial phase of the methodology involves splitting the dataset into distinct training and testing sets. This separation facilitates the unbiased evaluation of each model. For each classifier, a defined hyperparameter space is established. Bayesian optimization is then applied to navigate this space efficiently, aiming to identify the optimal hyperparameters that maximize the area under the ROC curve (AUC). In this study, the Bayesian optimization process employs a 5-fold cross-validation method within the training dataset to ensure rigorous evaluation of hyperparameter sets. Here, the training dataset is divided into five smaller subsets, or folds. For each set of hyperparameters tested, the model is trained on four of these folds and validated on the remaining one. This procedure is rotated so that each fold serves as the validation data once. This cross-validation method ensures assessing how the hyperparameters perform across different subsets of the data, thereby reducing variability and providing a more generalized performance estimate. The proposed approach is represented in Algorithm 1.
| Algorithm 1 Proposed Heart disease prediction approach. |
|
Once the optimal models are trained and validated using this cross-validation approach, the model that demonstrates superior performance, measured through the highest AUC on the test set, is selected as the best model. This model then undergoes a thorough interpretability analysis using SHAP values, which elucidate how each feature contributes to individual predictions. This interpretability is crucial, particularly in a clinical setting, as it aids healthcare professionals in understanding the decision-making process of the model, thereby enhancing trust and actionable insights.
3.5. Performance Evaluation Metrics
To evaluate the performance of the heart disease prediction models, it is essential to consider a variety of metrics that capture different aspects of model performance. The following metrics provide a comprehensive assessment: accuracy, sensitivity, specificity, and F1 score. Accuracy measures the proportion of true results (both true positives and true negatives) among the total number of cases examined [4,41]. Although accuracy is intuitive, it may not provide a complete picture in imbalanced datasets where one class significantly outnumbers the other. Sensitivity, also known as Recall, measures the proportion of actual positives correctly identified by the model, and it is more suitable for imbalance classification tasks. It is particularly important in medical applications where missing a positive case (e.g., a disease) can have serious implications [42]. Meanwhile, specificity, also known as the true negative rate (TNR), measures the proportion of actual negatives correctly identified and is crucial for ensuring that the model is not overly sensitive to positives [43]. Lastly, the F1 score is the harmonic mean of precision and sensitivity, providing a balance between the two metrics. It is useful when the class distribution is uneven. They are defined as follows:
where TP, TN, FP, and FN represent the number of true positives, true negatives, false positives, and false negatives, respectively [44]. Meanwhile, precision, often referred to as the positive predictive value (PPV), measures the accuracy of the positive predictions made by a model [45]. It is defined as the proportion of true positive outcomes to the total predicted positive outcomes. It can be expressed mathematically as follows:
4. Results and Discussion
This section presents and discusses the experimental results, showing the performance of the ensemble classifiers before and after applying the Bayesian optimization. First, Table 3 and Table 4 show the optimal hyperparameters after applying Bayesian optimization using the Cleveland and Framingham datasets, respectively. Table 5 shows the performance of the models using the Cleveland dataset. The optimized versions of Random Forest, AdaBoost, and XGBoost are benchmarked with the standard random forest, AdaBoost, and XGBoost, and they are evaluated based on accuracy, specificity, sensitivity, and F-measure. Using the Cleveland dataset, the standard XGBoost significantly outperforms the non-optimized classifiers across all metrics. Its high sensitivity (0.937) and F-measure (0.896) demonstrate its ability to accurately identify patients with heart disease and balance precision and recall effectively.
Table 3.
Optimal parameters for Cleveland dataset.
Table 4.
Optimal parameters for Framingham dataset.
Table 5.
Classifier performances on the Cleveland dataset.
Also, the optimized versions of RF, AdaBoost, and XGBoost show performance improvements. The optimized RF and optimized AdaBoost demonstrate notable increases in specificity and F-measure, indicating enhanced overall performance and reliability in accurately identifying both positive and negative cases. The optimized XGBoost achieves the highest accuracy (0.984), specificity (0.971), sensitivity (0.989), and F-measure (0.985) among all models tested. This level of performance suggests that with appropriate parameter tuning and optimization, XGBoost can offer exceptional predictive capabilities, making it highly suitable for critical applications such as heart disease prediction. Meanwhile, the performance of the classifiers on the Framingham dataset is tabulated in Table 6. The RF classifier achieved a balance across all metrics, indicating its effectiveness and potential as a comprehensive model for disease prediction. AdaBoost, with an accuracy of 0.860, achieved a lower sensitivity (0.790). Meanwhile, the XGBoost was exceptional, with the highest accuracy (0.917) among the base classifiers, alongside impressive specificity (0.899) and sensitivity (0.920).
Table 6.
Classifier performances on the Framingham dataset.
Furthermore, the optimized classifiers show notable improvements over the standard classifiers. The optimized versions of RF and AdaBoost demonstrate significant increases in specificity and sensitivity. However, the optimized XGBoost obtained the highest scores across all evaluated metrics, including a near-perfect sensitivity (0.975). This indicates its exceptional capability in identifying true positive cases, an essential attribute for healthcare applications. The findings from the Framingham dataset also reveal the substantial impact of parameter optimization in enhancing the predictive performance of the ensemble classifier.
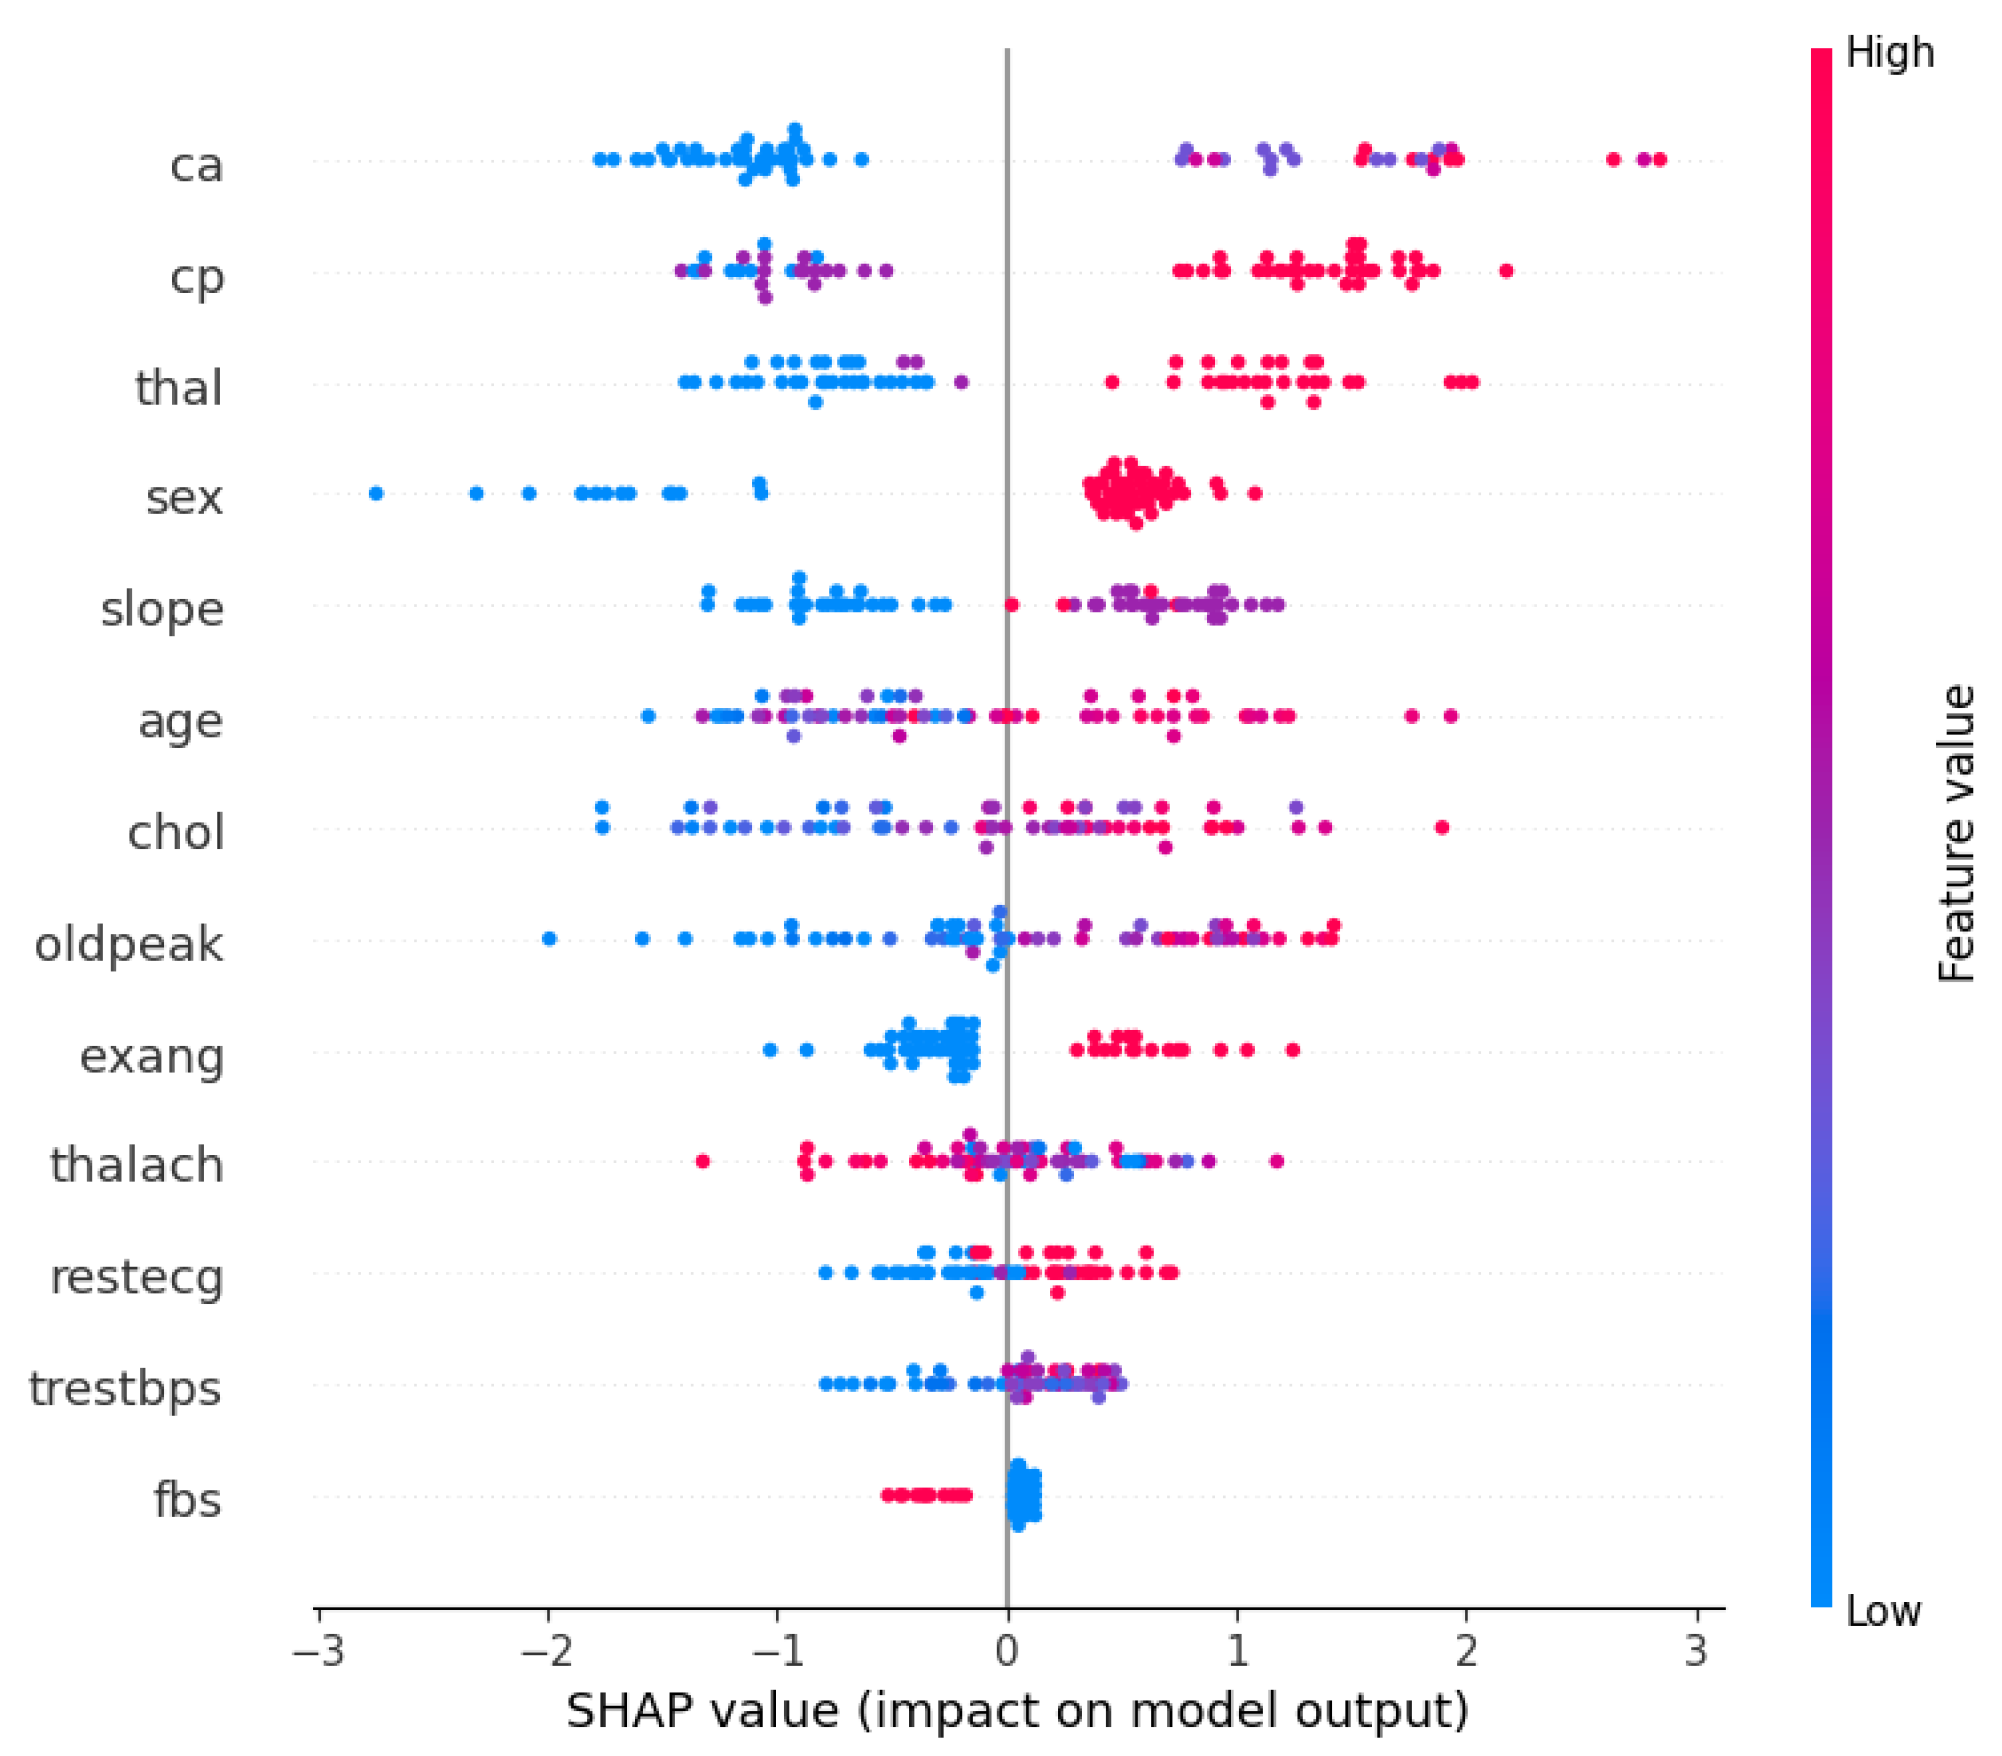
Furthermore, with the optimized XGBoost achieving the best performance in both the Cleveland and Framingham heart study datasets, it would be beneficial to understand what features contributed the most to the decision-making process. Therefore, Figure 1 and Figure 2 show the XGBoost’s model interpretation using the SHAP technique for the Cleveland dataset. Figure 1 shows the summary plot, indicating the impact of every feature on the classifier output for each sample in the dataset. Each point represents a SHAP value for a feature and a data point. Meanwhile, the features are listed along the y-axis, and their SHAP values are on the x-axis. The color indicates the feature value, with red being high and blue being low.
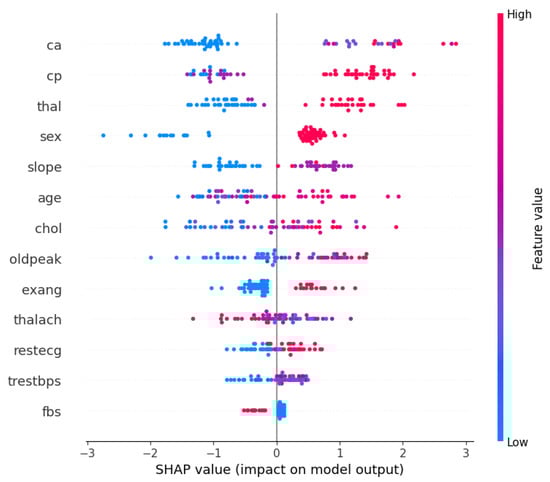
Figure 1.
SHAP summary plot: XGBoost on the Cleveland dataset.

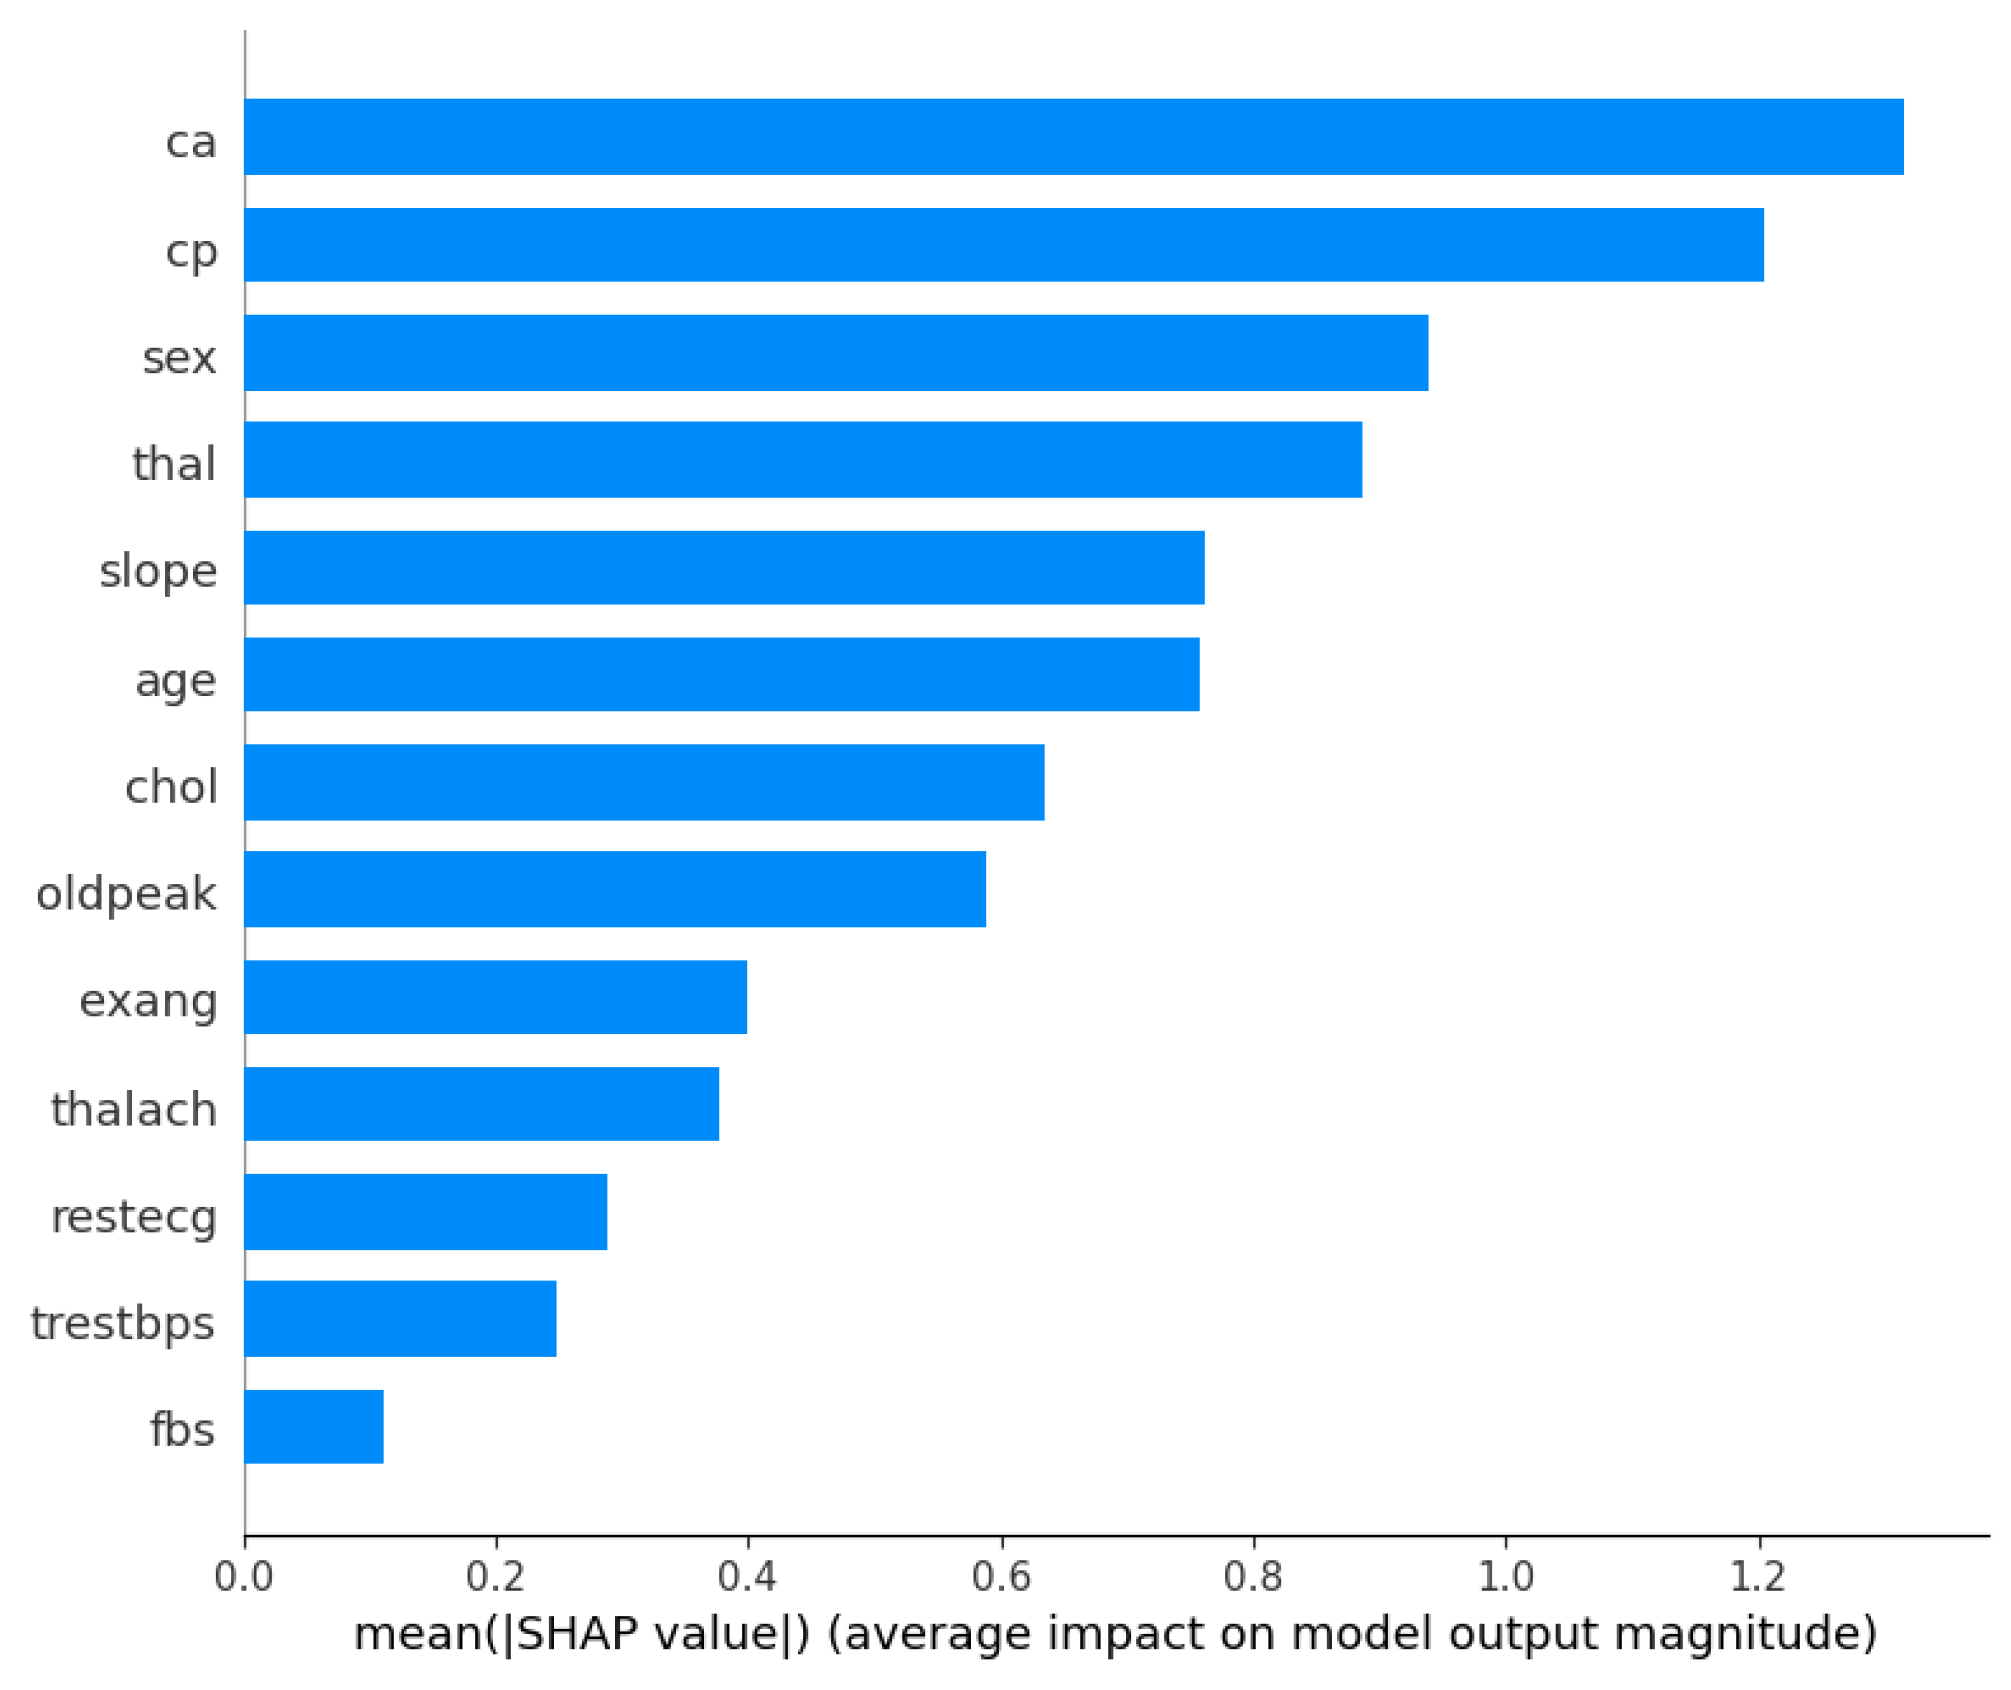
Figure 2.
Mean absolute SHAP values: XGBoost on the Cleveland dataset.
From the visualizations, it can be seen that the ‘ca’ (i.e., number of major vessels colored by fluoroscopy) and ‘thal’ (i.e., thalassemia) attributes are vital factors influencing the model’s predictions for heart disease using the Cleveland dataset. The ‘cp’ (chest pain type) and ‘sex’ features also have substantial impacts on the model’s decisions, suggesting that they are important predictors of the outcome. However, ‘fbs’ (fasting blood sugar) and ‘trestbps’ (resting blood pressure) seem to have a much smaller effect on the model’s predictions. Meanwhile, Figure 2 presents a bar chart that simplifies the previous summary by taking the mean of the absolute SHAP values for each feature across all samples, providing an aggregate measure of feature importance. From the bar chart, ‘ca’ is the most important feature, followed by ‘cp’, ‘sex’, and ‘thal’, as indicated by the length of the bars; and ‘fbs’ (fasting blood sugar) appears to be the least important feature in terms of the average impact on the model’s output.
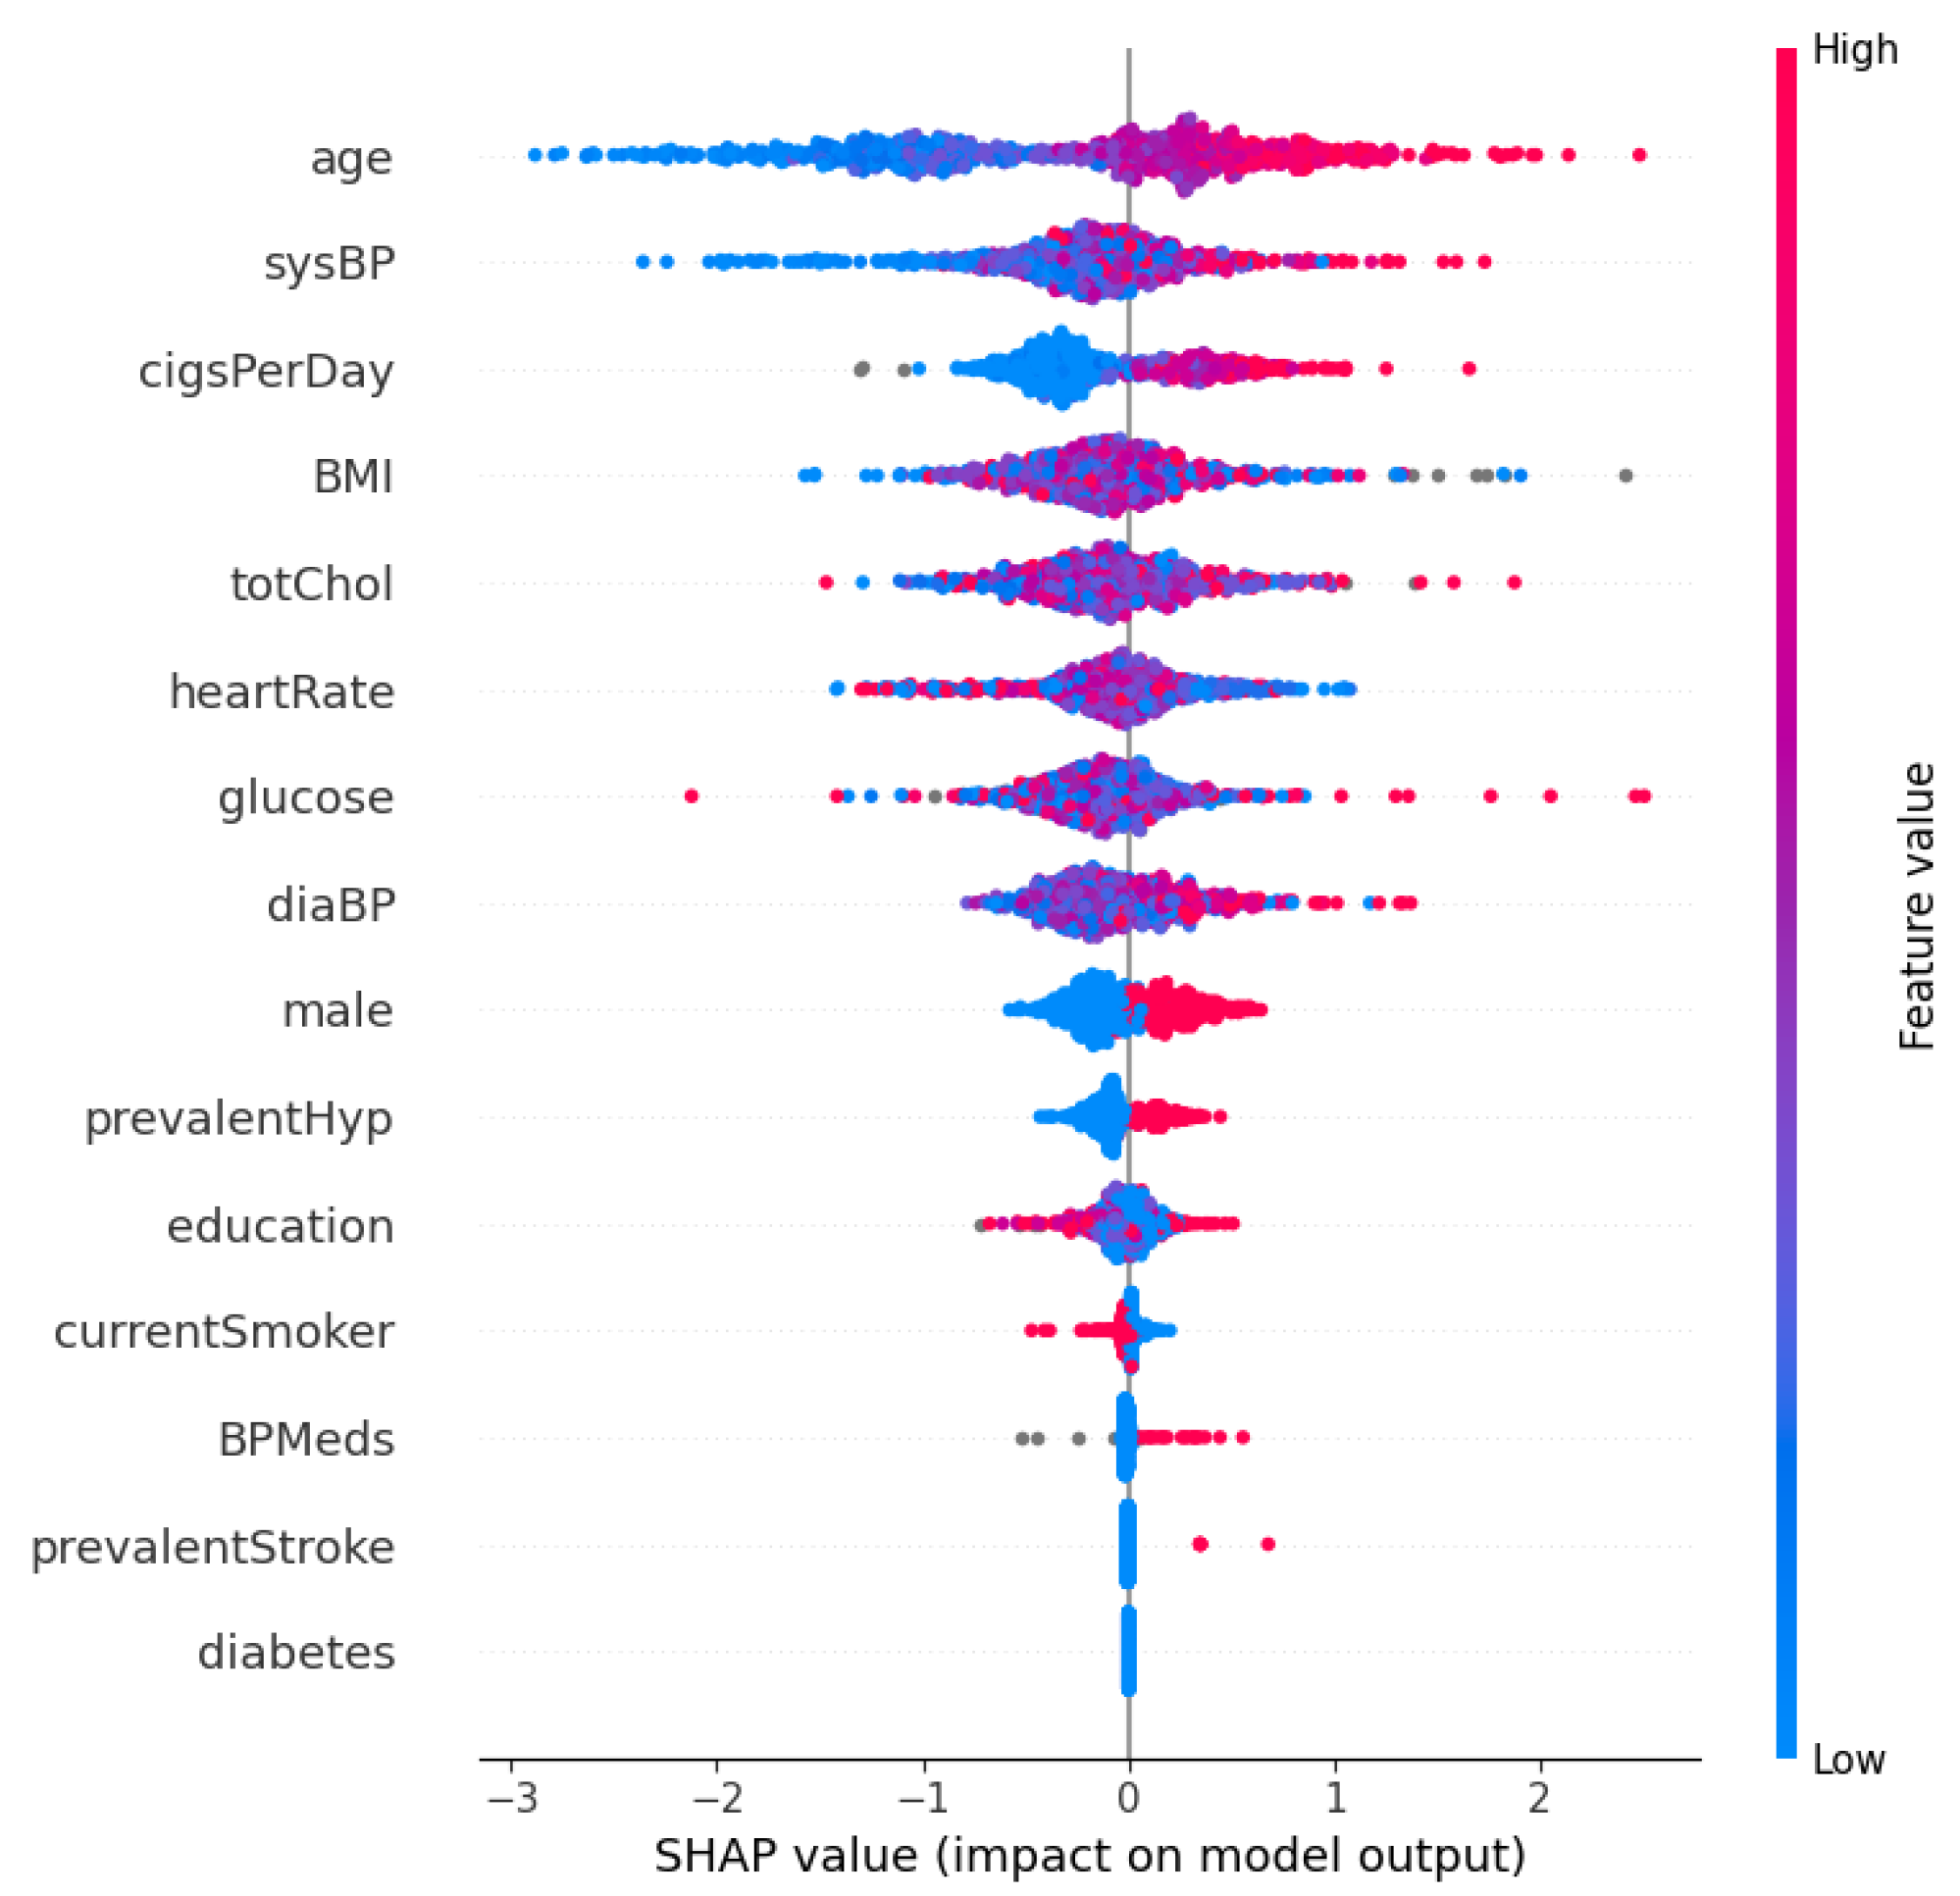
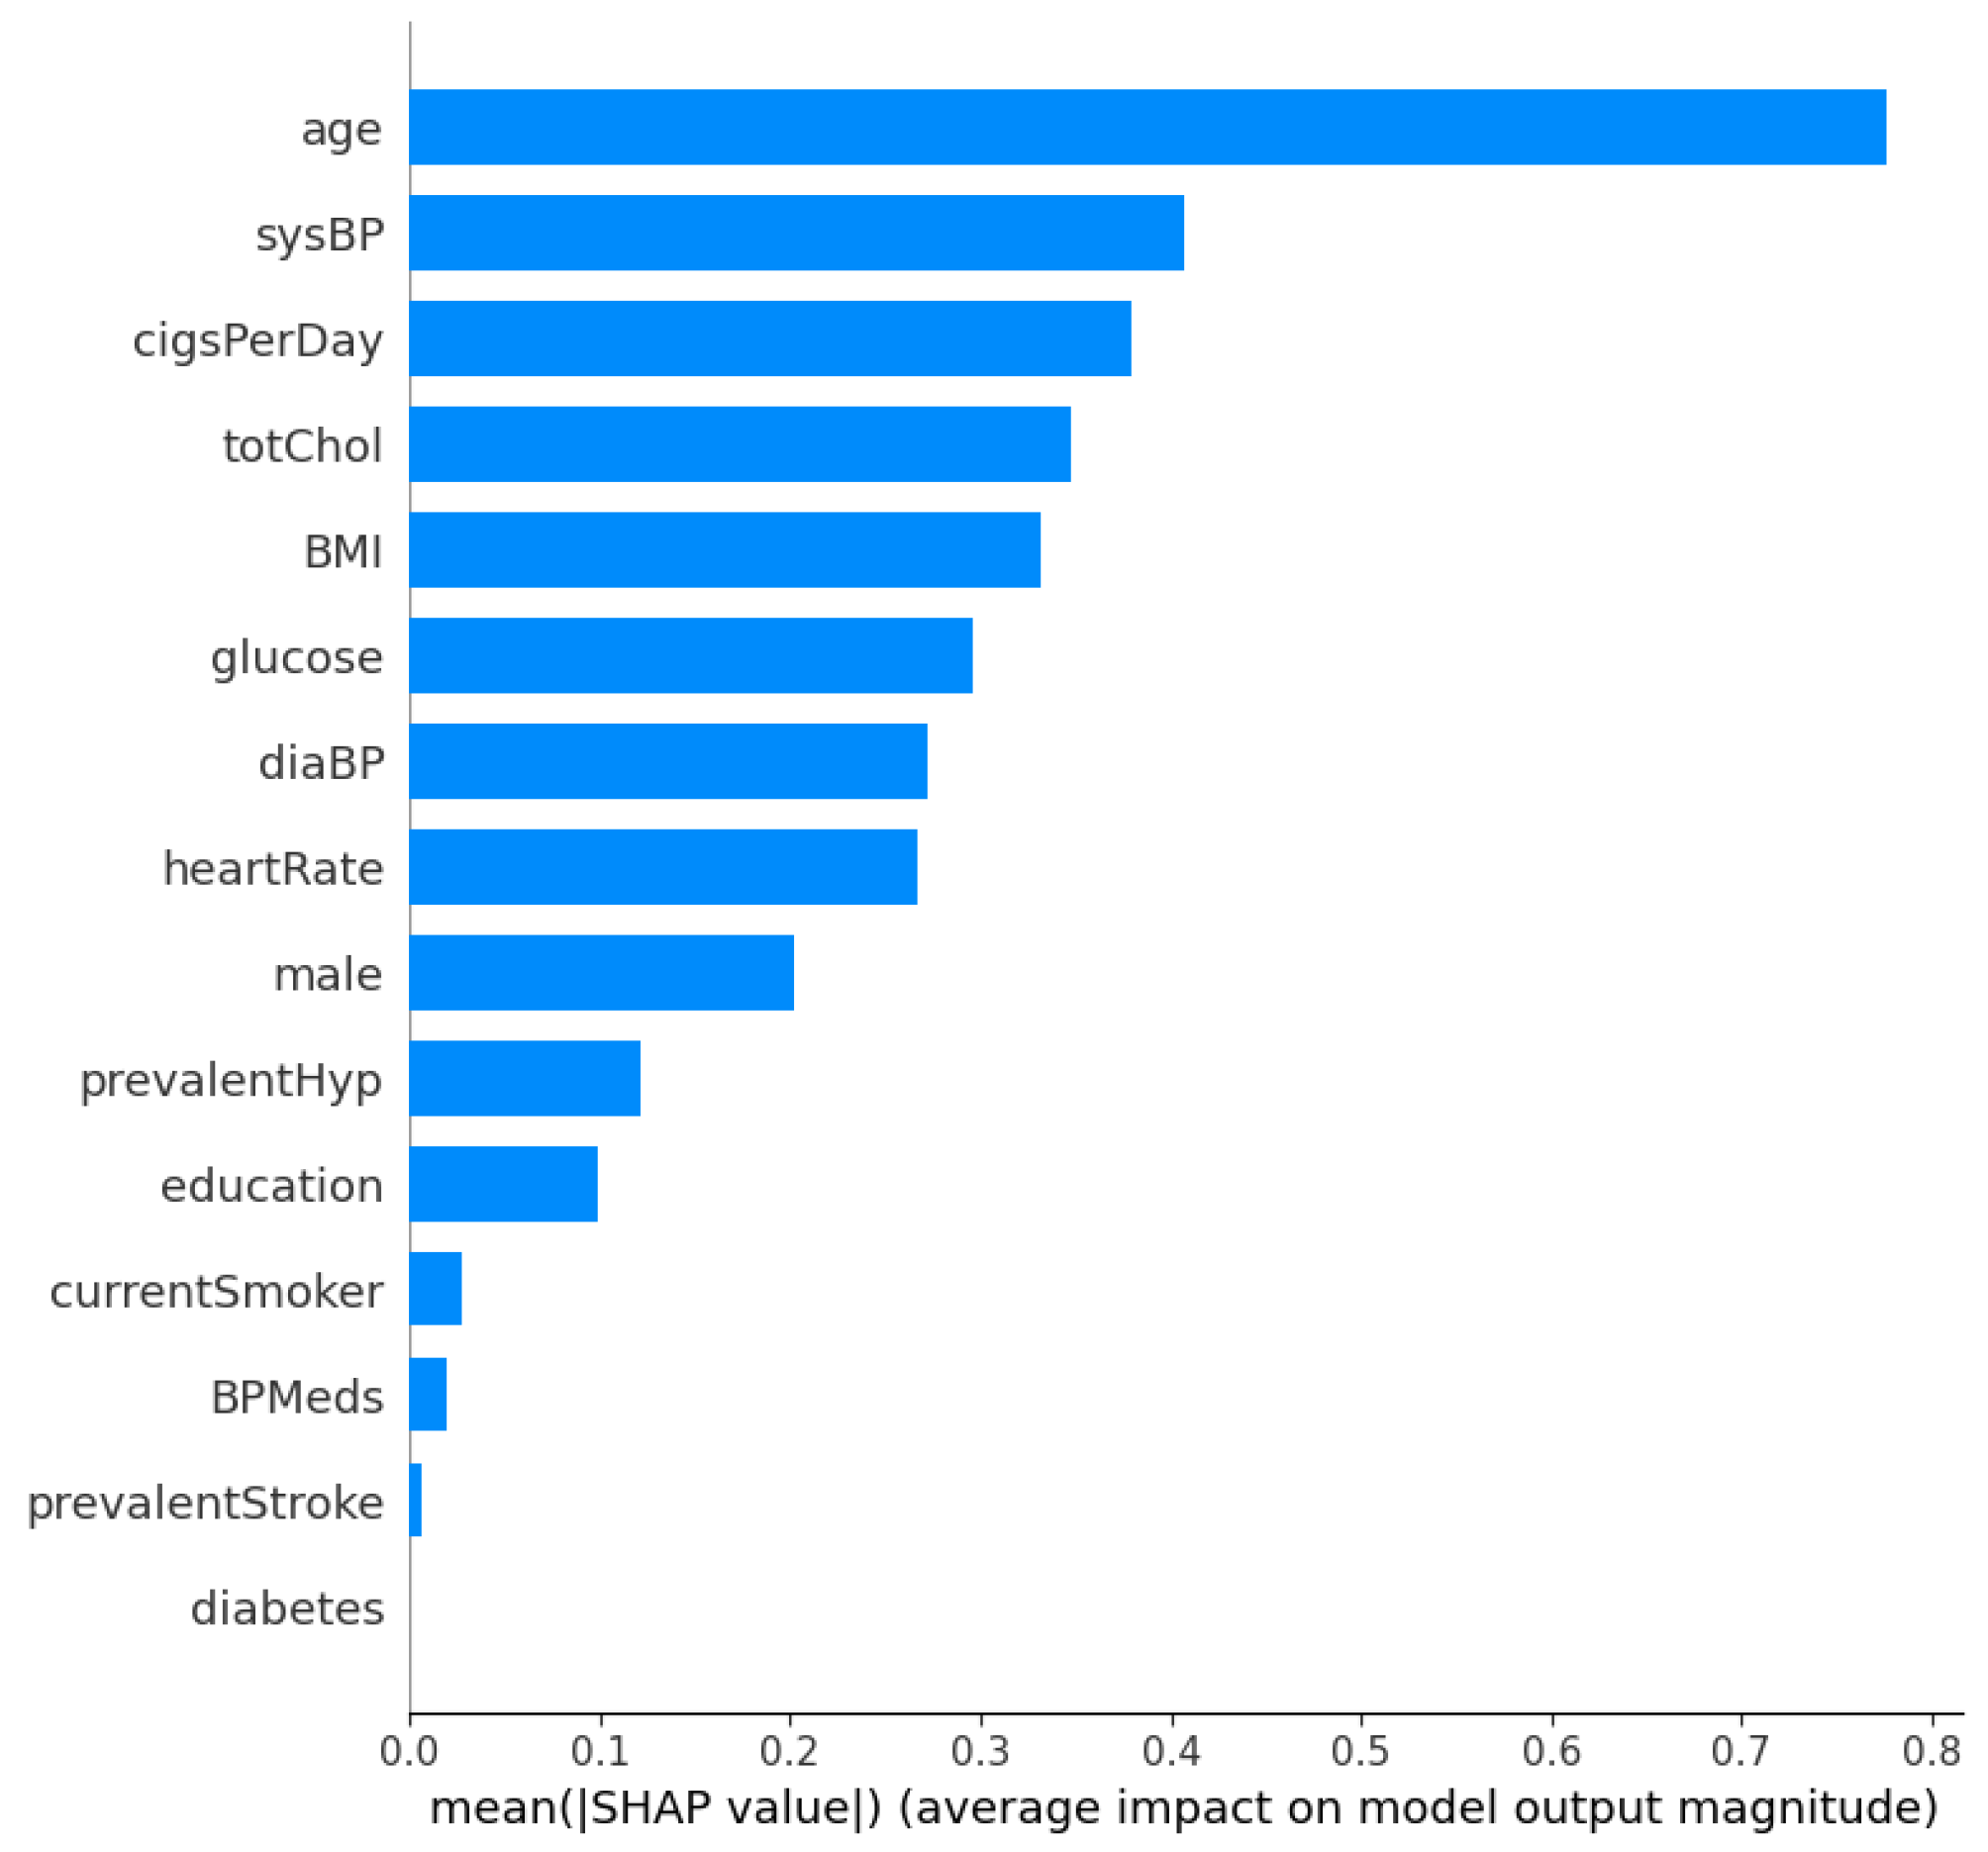
Figure 3 and Figure 4 show the SHAP summary plot and mean absolute SHAP values for the XGBoost model using the Framingham dataset. In this instance, the ‘Age’ feature has the highest mean absolute SHAP value, which indicates that it is the most important feature in terms of average impact on the classifier’s output. Other significant features include ‘sysBP’ and ‘cigsPerDay’, suggesting that blood pressure and smoking habits are key indicators the model uses to predict heart disease risk. The features ‘diabetes’ and ‘prevalentStroke’ have the least impact on the model’s predictions, as shown by the shorter bars. Additionally, in order to further validate the robustness of the proposed approach, a performance comparison is conducted with other methods in the literature. This comparison is shown in Table 7. From Table 7, the proposed optimized XGBoost model achieves a high accuracy of 0.984, which is comparable to the highest accuracies reported in the literature, such as the 0.987 and 0.988 achieved by [46] and [47], respectively. Additionally, the optimized XGBoost model demonstrates superior sensitivity (0.989) compared to the other methods, indicating its effectiveness in correctly identifying positive cases of heart disease. This high sensitivity is crucial for clinical applications where missing a true positive case could have severe consequences. Furthermore, the specificity of our model (0.971) highlights its capability to accurately identify negative cases, thereby reducing the likelihood of false positives and ensuring reliable performance across diverse patient populations.
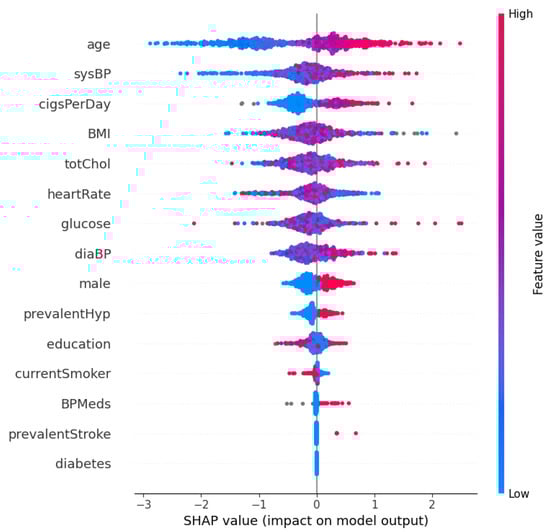
Figure 3.
SHAP summary plot: XGBoost on the Framingham dataset.

Figure 4.
Mean absolute SHAP values: XGBoost on the Framingham dataset.
Table 7.
Comparison with other methods in recent studies.
In comparison with other techniques, it is evident that some studies lacked detailed specificity and sensitivity metrics. For example, refs. [48,50,52,62] report accuracy values; however, the absence of specificity and sensitivity data makes it difficult to assess their overall clinical utility. Additionally, more advanced methods such as CNN [60], Bi-LSTM [47], and deep learning ensemble [59] also show high performance. Nonetheless, our optimized XGBoost model stands out by providing a balanced performance with comprehensive metrics, thus demonstrating both its robustness and reliability. Meanwhile, the implementation of XAI techniques is now a critical feature in clinical ML applications. Our study distinguishes itself not only by achieving high predictive performance but also by incorporating the SHAP technique for interpretability. This ensures that the model’s decisions are transparent and understandable to clinicians, addressing a critical need for clinical adoption.
Discussion
The experimental results presented in this study indicate the effectiveness of integrating Bayesian optimization with ensemble learning techniques for heart disease prediction. Through optimizing the hyperparameters of AdaBoost, RF, and XGBoost models, this study achieved notable improvements in the performance of these models on both the Cleveland and Framingham datasets. The enhanced performance, particularly in the specificity and sensitivity metrics, reflects the importance of effective fine-tuning of model parameters, thus leading to more reliable and robust classifiers. When compared with recent studies, our optimized XGBoost model demonstrates a high accuracy of 0.984, which is comparable to the highest accuracies reported, such as 0.987 by [46] and 0.988 by [47]. The proposed model’s sensitivity of 0.989 highlights its effectiveness in accurately identifying positive cases of heart disease, outperforming the methods in the other studies. The proposed model’s balanced performance across the various metrics demonstrates its robustness and clinical relevance.
Furthermore, the utilization of SHAP values for interpreting the optimized XGBoost provides necessary insights into the classifier’s decision-making processes. This interpretability is essential for clinical applications, where understanding the factors influencing model predictions can significantly impact patient management and treatment planning. The SHAP analysis revealed key risk factors and their contributions to the predictions. For instance, features such as ‘ca’ (number of major vessels colored by fluoroscopy) and ‘thal’ (thalassemia) were identified as significant predictors in the Cleveland dataset, aligning with clinical understandings of their roles in heart disease. Additionally, the optimized XGBoost model, which showed superior performance across both datasets, highlights the robustness of combining ensemble learning techniques with hyperparameter optimization. Its high sensitivity and specificity indicate its potential in clinical settings to accurately identify patients at risk of heart disease, thereby ensuring early intervention.
5. Conclusions and Future Work
This research studied the use of ensemble classifiers, Bayesian optimization, and SHAP in heart disease prediction. The aim of the study was to combine these techniques to create more accurate and interpretable models that can aid in the early detection and treatment of heart disease, ultimately saving lives and improving patient outcomes. The optimized XGBoost achieved the best results among the ensemble techniques, outperforming the optimized AdaBoost, optimized random forest, and the other standard models. Furthermore, the optimized XGBoost model obtained comparable performance with other well-performing methods in recent studies and provides balanced and interpretable predictions. This combination of high performance and explainability makes it a promising approach for heart disease prediction in clinical settings.
Future work will focus on the deployment of this model in real-world healthcare settings. The first step will involve creating a robust pipeline that integrates seamlessly with hospital databases, enabling real-time data processing and predictions. This requires collaboration with IT departments within healthcare institutions to ensure compatibility with existing electronic health record systems. Additionally, extensive validation and pilot studies will be necessary to ensure the model’s reliability and effectiveness in diverse clinical environments. These pilot studies will help refine the model based on feedback from healthcare professionals and actual patient outcomes. Furthermore, future efforts will focus on expanding the model’s capabilities to predict other cardiovascular diseases and conditions. We aim to enhance its predictive power and adaptability to different patient populations by continuously updating and validating the model with new data.
Author Contributions
Conceptualization, I.D.M. and N.J.; methodology, I.D.M. and N.J.; software, I.D.M.; validation, I.D.M. and N.J.; formal analysis, I.D.M.; investigation, I.D.M.; writing—original draft preparation, I.D.M. and N.J.; writing—review and editing, I.D.M. and N.J.; visualization, I.D.M.; supervision, I.D.M. and N.J. All authors have read and agreed to the published version of the manuscript.
Funding
This research received no external funding.
Institutional Review Board Statement
Not applicable.
Informed Consent Statement
Not applicable.
Data Availability Statement
The data presented in this study are available on request from the corresponding author.
Conflicts of Interest
The authors declare no conflicts of interest.
Abbreviations
The following abbreviations are used in this manuscript:
| AI | artificial intelligence |
| ANN | artificial neural network |
| BiLSTM | bidirectional long short-term memory |
| BMI | body mass index |
| CHD | coronary heart disease |
| CNN | convolutional neural network |
| CVD | cardiovascular disease |
| DL | deep learning |
| DT | decision tree |
| XAI | explainable AI |
| GA | genetic algorithm |
| KNN | k-nearest neighbor |
| LASSO | least absolute shrinkage and selection operator |
| ML | machine learning |
| PCA | principal component analysis |
| RF | random forest |
| RFE | recursive feature elimination |
| SVM | support vector machine |
| SMOTE | synthetic minority oversampling technique |
| SMOTE-ENN | synthetic minority oversampling technique—edited nearest neighbor |
| XGBoost | extreme gradient boosting |
References
- Rahman, A.U.; Alsenani, Y.; Zafar, A.; Ullah, K.; Rabie, K.; Shongwe, T. Enhancing heart disease prediction using a self-attention-based transformer model. Sci. Rep. 2024, 14, 514. [Google Scholar] [CrossRef]
- Rani, P.; Kumar, R.; Jain, A.; Lamba, R.; Sachdeva, R.K.; Kumar, K.; Kumar, M. An Extensive Review of Machine Learning and Deep Learning Techniques on Heart Disease Classification and Prediction. Arch. Comput. Methods Eng. 2024. [Google Scholar] [CrossRef]
- Atimbire, S.A.; Appati, J.K.; Owusu, E. Empirical exploration of whale optimisation algorithm for heart disease prediction. Sci. Rep. 2024, 14, 4530. [Google Scholar] [CrossRef] [PubMed]
- Mienye, I.D.; Sun, Y.; Wang, Z. Improved predictive sparse decomposition method with densenet for prediction of lung cancer. Int. J. Comput. 2020, 1, 533–541. [Google Scholar] [CrossRef]
- Pathak, A.K.; Arul Valan, J. A Predictive Model for Heart Disease Diagnosis Using Fuzzy Logic and Decision Tree. In Advances in Intelligent Systems and Computing; Springer: Singapore, 2019; pp. 131–140. [Google Scholar] [CrossRef]
- Manikandan, G.; Pragadeesh, B.; Manojkumar, V.; Karthikeyan, A.; Manikandan, R.; Gandomi, A.H. Classification models combined with Boruta feature selection for heart disease prediction. Inform. Med. Unlocked 2024, 44, 101442. [Google Scholar] [CrossRef]
- Shahhosseini, M.; Hu, G.; Pham, H. Optimizing ensemble weights and hyperparameters of machine learning models for regression problems. Mach. Learn. Appl. 2022, 7, 100251. [Google Scholar] [CrossRef]
- O’Halloran, T.; Obaido, G.; Otegbade, B.; Mienye, I.D. A deep learning approach for Maize Lethal Necrosis and Maize Streak Virus disease detection. Mach. Learn. Appl. 2024, 16, 100556. [Google Scholar] [CrossRef]
- Obaido, G.; Achilonu, O.; Ogbuokiri, B.; Amadi, C.S.; Habeebullahi, L.; Ohalloran, T.; Chukwu, C.W.; Mienye, E.D.; Aliyu, M.; Fasawe, O.; et al. An Improved Framework for Detecting Thyroid Disease Using Filter-Based Feature Selection and Stacking Ensemble. IEEE Access 2024, 12, 89098–89112. [Google Scholar] [CrossRef]
- Lundberg, S.M.; Lee, S.I. A unified approach to interpreting model predictions. Adv. Neural Inf. Process. Syst. 2017, 30. [Google Scholar]
- Nohara, Y.; Matsumoto, K.; Soejima, H.; Nakashima, N. Explanation of machine learning models using shapley additive explanation and application for real data in hospital. Comput. Methods Programs Biomed. 2022, 214, 106584. [Google Scholar] [CrossRef]
- Sixian, L.; Imamura, Y.; Ahmed, A. Application of Shapley Additive Explanation towards Determining Personalized Triage from Health Checkup Data. In Pervasive Computing Technologies for Healthcare; Tsanas, A., Triantafyllidis, A., Eds.; Springer: Cham, Switzerland, 2023; pp. 496–509. [Google Scholar]
- Mehrabi, N.; Morstatter, F.; Saxena, N.; Lerman, K.; Galstyan, A. A survey on bias and fairness in machine learning. ACM Comput. Surv. (CSUR) 2021, 54, 1–35. [Google Scholar] [CrossRef]
- Mienye, I.D.; Ainah, P.K.; Emmanuel, I.D.; Esenogho, E. Sparse noise minimization in image classification using Genetic Algorithm and DenseNet. In Proceedings of the 2021 Conference on Information Communications Technology and Society (ICTAS), Durban, South Africa, 10–11 March 2021; pp. 103–108. [Google Scholar]
- Yang, L.; Wu, H.; Jin, X.; Zheng, P.; Hu, S.; Xu, X.; Yu, W.; Yan, J. Study of cardiovascular disease prediction model based on random forest in eastern China. Sci. Rep. 2020, 10, 5245. [Google Scholar] [CrossRef] [PubMed]
- Mahesh, T.; Kumar, V.D.; Kumar, V.V.; Asghar, J.; Geman, O.; Arulkumaran, G.; Arun, N. AdaBoost ensemble methods using K-fold cross validation for survivability with the early detection of heart disease. Comput. Intell. Neurosci. 2022, 2022, 9005278. [Google Scholar] [CrossRef] [PubMed]
- Gao, X.Y.; Amin Ali, A.; Shaban Hassan, H.; Anwar, E.M. Improving the accuracy for analyzing heart diseases prediction based on the ensemble method. Complexity 2021, 2021, 66634550. [Google Scholar] [CrossRef]
- Shi, R.; Xu, X.; Li, J.; Li, Y. Prediction and analysis of train arrival delay based on XGBoost and Bayesian optimization. Appl. Soft Comput. 2021, 109, 107538. [Google Scholar] [CrossRef]
- Asan, O.; Bayrak, A.E.; Choudhury, A. Artificial intelligence and human trust in healthcare: Focus on clinicians. J. Med. Internet Res. 2020, 22, e15154. [Google Scholar] [CrossRef] [PubMed]
- Debjit, K.; Islam, M.S.; Rahman, M.A.; Pinki, F.T.; Nath, R.D.; Al-Ahmadi, S.; Hossain, M.S.; Mumenin, K.M.; Awal, M.A. An improved machine-learning approach for COVID-19 prediction using Harris Hawks optimization and feature analysis using SHAP. Diagnostics 2022, 12, 1023. [Google Scholar] [CrossRef] [PubMed]
- Tama, B.A.; Im, S.; Lee, S. Improving an intelligent detection system for coronary heart disease using a two-tier classifier ensemble. BioMed Res. Int. 2020, 2020, 9816142. [Google Scholar] [CrossRef] [PubMed]
- Andersson, C.; Johnson, A.D.; Benjamin, E.J.; Levy, D.; Vasan, R.S. 70-year legacy of the Framingham Heart Study. Nat. Rev. Cardiol. 2019, 16, 687–698. [Google Scholar] [CrossRef]
- Sagi, O.; Rokach, L. Explainable decision forest: Transforming a decision forest into an interpretable tree. Inf. Fusion 2020, 61, 124–138. [Google Scholar] [CrossRef]
- Lee, S.J.; Tseng, C.H.; Yang, H.Y.; Jin, X.; Jiang, Q.; Pu, B.; Hu, W.H.; Liu, D.R.; Huang, Y.; Zhao, N. Random rotboost: An ensemble classification method based on rotation forest and adaboost in random subsets and its application to clinical decision support. Entropy 2022, 24, 617. [Google Scholar] [CrossRef] [PubMed]
- Mienye, I.D.; Jere, N. A Survey of Decision Trees: Concepts, Algorithms, and Applications. IEEE Access 2024, 12, 86716–86727. [Google Scholar] [CrossRef]
- Sarica, A.; Cerasa, A.; Quattrone, A. Random forest algorithm for the classification of neuroimaging data in Alzheimer’s disease: A systematic review. Front. Aging Neurosci. 2017, 9, 329. [Google Scholar] [CrossRef] [PubMed]
- Garcia-Carretero, R.; Holgado-Cuadrado, R.; Barquero-Pérez, Ó. Assessment of classification models and relevant features on nonalcoholic steatohepatitis using random forest. Entropy 2021, 23, 763. [Google Scholar] [CrossRef] [PubMed]
- Meng, Y.; Yang, N.; Qian, Z.; Zhang, G. What Makes an Online Review More Helpful: An Interpretation Framework Using XGBoost and SHAP Values. J. Theor. Appl. Electron. Commer. Res. 2021, 16, 466–490. [Google Scholar] [CrossRef]
- Zhang, P.; Jia, Y.; Shang, Y. Research and application of XGBoost in imbalanced data. Int. J. Distrib. Sens. Netw. 2022, 18, 15501329221106935. [Google Scholar] [CrossRef]
- Ogunleye, A.; Wang, Q.G. XGBoost Model for Chronic Kidney Disease Diagnosis. IEEE/ACM Trans. Comput. Biol. Bioinform. 2020, 17, 2131–2140. [Google Scholar] [CrossRef]
- Budholiya, K.; Shrivastava, S.K.; Sharma, V. An optimized XGBoost based diagnostic system for effective prediction of heart disease. J. King Saud Univ.-Comput. Inf. Sci. 2022, 34, 4514–4523. [Google Scholar] [CrossRef]
- Dalal, S.; Seth, B.; Radulescu, M.; Secara, C.; Tolea, C. Predicting Fraud in Financial Payment Services through Optimized Hyper-Parameter-Tuned XGBoost Model. Mathematics 2022, 10, 4679. [Google Scholar] [CrossRef]
- Shahraki, A.; Abbasi, M.; Haugen, Ø. Boosting algorithms for network intrusion detection: A comparative evaluation of Real AdaBoost, Gentle AdaBoost and Modest AdaBoost. Eng. Appl. Artif. Intell. 2020, 94, 103770. [Google Scholar] [CrossRef]
- Ding, Y.; Zhu, H.; Chen, R.; Li, R. An efficient AdaBoost algorithm with the multiple thresholds classification. Appl. Sci. 2022, 12, 5872. [Google Scholar] [CrossRef]
- Hatwell, J.; Gaber, M.M.; Atif Azad, R.M. Ada-WHIPS: Explaining AdaBoost classification with applications in the health sciences. BMC Med. Inform. Decis. Mak. 2020, 20, 250. [Google Scholar] [CrossRef] [PubMed]
- Schapire, R.E. Explaining adaboost. In Empirical Inference: Festschrift in Honor of Vladimir N. Vapnik; Springer: Berlin/Heidelberg, Germany, 2013; pp. 37–52. [Google Scholar]
- Vega García, M.; Aznarte, J.L. Shapley additive explanations for NO2 forecasting. Ecol. Inform. 2020, 56, 101039. [Google Scholar] [CrossRef]
- Baptista, M.L.; Goebel, K.; Henriques, E.M. Relation between prognostics predictor evaluation metrics and local interpretability SHAP values. Artif. Intell. 2022, 306, 103667. [Google Scholar] [CrossRef]
- Sahlaoui, H.; Nayyar, A.; Agoujil, S.; Jaber, M.M. Predicting and interpreting student performance using ensemble models and shapley additive explanations. IEEE Access 2021, 9, 152688–152703. [Google Scholar] [CrossRef]
- Heuillet, A.; Couthouis, F.; Díaz-Rodríguez, N. Collective explainable AI: Explaining cooperative strategies and agent contribution in multiagent reinforcement learning with shapley values. IEEE Comput. Intell. Mag. 2022, 17, 59–71. [Google Scholar] [CrossRef]
- Richens, J.G.; Lee, C.M.; Johri, S. Improving the accuracy of medical diagnosis with causal machine learning. Nat. Commun. 2020, 11, 3923. [Google Scholar] [CrossRef] [PubMed]
- Obaido, G.; Ogbuokiri, B.; Chukwu, C.W.; Osaye, F.J.; Egbelowo, O.F.; Uzochukwu, M.I.; Mienye, I.D.; Aruleba, K.; Primus, M.; Achilonu, O. An Improved Ensemble Method for Predicting Hyperchloremia in Adults with Diabetic Ketoacidosis. IEEE Access 2024, 12, 9536–9549. [Google Scholar] [CrossRef]
- Mienye, I.D.; Sun, Y. A Machine Learning Method with Hybrid Feature Selection for Improved Credit Card Fraud Detection. Appl. Sci. 2023, 13, 7254. [Google Scholar] [CrossRef]
- Mienye, I.D.; Obaido, G.; Aruleba, K.; Dada, O.A. Enhanced prediction of chronic kidney disease using feature selection and boosted classifiers. In International Conference on Intelligent Systems Design and Applications; Springer: Cham, Switzerland, 2021; pp. 527–537. [Google Scholar]
- Whiting, D.; Fazel, S. How accurate are suicide risk prediction models? Asking the right questions for clinical practice. BMJ Ment Health 2019, 22, 125–128. [Google Scholar] [CrossRef]
- Gárate-Escamila, A.K.; Hajjam El Hassani, A.; Andrès, E. Classification models for heart disease prediction using feature selection and PCA. Inform. Med. Unlocked 2020, 19, 100330. [Google Scholar] [CrossRef]
- Nancy, A.A.; Ravindran, D.; Raj Vincent, P.M.D.; Srinivasan, K.; Gutierrez Reina, D. IoT-Cloud-Based Smart Healthcare Monitoring System for Heart Disease Prediction via Deep Learning. Electronics 2022, 11, 2292. [Google Scholar] [CrossRef]
- Shah, D.; Patel, S.; Bharti, S.K. Heart Disease Prediction using Machine Learning Techniques. SN Comput. Sci. 2020, 1, 345. [Google Scholar] [CrossRef]
- Katarya, R.; Meena, S.K. Machine Learning Techniques for Heart Disease Prediction: A Comparative Study and Analysis. Health Technol. 2020, 11, 87–97. [Google Scholar] [CrossRef]
- Singh, A.; Kumar, R. Heart Disease Prediction Using Machine Learning Algorithms. In Proceedings of the 2020 International Conference on Electrical and Electronics Engineering (ICE3), Gorakhpur, India, 14–15 February 2020; pp. 452–457. [Google Scholar] [CrossRef]
- Rani, P.; Kumar, R.; Ahmed, N.M.O.S.; Jain, A. A decision support system for heart disease prediction based upon machine learning. J. Reliab. Intell. Environ. 2021, 7, 263–275. [Google Scholar] [CrossRef]
- Kavitha, M.; Gnaneswar, G.; Dinesh, R.; Sai, Y.R.; Suraj, R.S. Heart Disease Prediction using Hybrid machine Learning Model. In Proceedings of the 2021 6th International Conference on Inventive Computation Technologies (ICICT), Coimbatore, India, 20–22 January 2021; pp. 1329–1333. [Google Scholar]
- Ayon, S.I.; Islam, M.M.; Hossain, M.R. Coronary Artery Heart Disease Prediction: A Comparative Study of Computational Intelligence Techniques. IETE J. Res. 2020, 68, 2488–2507. [Google Scholar] [CrossRef]
- Fitriyani, N.L.; Syafrudin, M.; Alfian, G.; Rhee, J. HDPM: An Effective Heart Disease Prediction Model for a Clinical Decision Support System. IEEE Access 2020, 8, 133034–133050. [Google Scholar] [CrossRef]
- Dutta, A.; Batabyal, T.; Basu, M.; Acton, S.T. An efficient convolutional neural network for coronary heart disease prediction. Expert Syst. Appl. 2020, 159, 113408. [Google Scholar] [CrossRef]
- Yadav, A.L.; Soni, K.; Khare, S. Heart Diseases Prediction using Machine Learning. In Proceedings of the 2023 14th International Conference on Computing Communication and Networking Technologies (ICCCNT), Delhi, India, 6–8 July 2023; pp. 1–7. [Google Scholar] [CrossRef]
- Bizimana, P.C.; Zhang, Z.; Hounye, A.H.; Asim, M.; Hammad, M.; El-Latif, A.A.A. Automated heart disease prediction using improved explainable learning-based technique. Neural Comput. Appl. 2024. [Google Scholar] [CrossRef]
- Guleria, P.; Naga Srinivasu, P.; Ahmed, S.; Almusallam, N.; Alarfaj, F.K. XAI Framework for Cardiovascular Disease Prediction Using Classification Techniques. Electronics 2022, 11, 4086. [Google Scholar] [CrossRef]
- Ali, F.; El-Sappagh, S.; Islam, S.R.; Kwak, D.; Ali, A.; Imran, M.; Kwak, K.S. A smart healthcare monitoring system for heart disease prediction based on ensemble deep learning and feature fusion. Inf. Fusion 2020, 63, 208–222. [Google Scholar] [CrossRef]
- Mehmood, A.; Iqbal, M.; Mehmood, Z.; Irtaza, A.; Nawaz, M.; Nazir, T.; Masood, M. Prediction of Heart Disease Using Deep Convolutional Neural Networks. Arab. J. Sci. Eng. 2021, 46, 3409–3422. [Google Scholar] [CrossRef]
- Bharti, R.; Khamparia, A.; Shabaz, M.; Dhiman, G.; Pande, S.; Singh, P. Prediction of Heart Disease Using a Combination of Machine Learning and Deep Learning. Comput. Intell. Neurosci. 2021, 2021, 8387680. [Google Scholar] [CrossRef] [PubMed]
- Ashri, S.E.A.; El-Gayar, M.M.; El-Daydamony, E.M. HDPF: Heart Disease Prediction Framework Based on Hybrid Classifiers and Genetic Algorithm. IEEE Access 2021, 9, 146797–146809. [Google Scholar] [CrossRef]
- Mienye, I.D.; Sun, Y. Effective Feature Selection for Improved Prediction of Heart Disease. In Pan-African Artificial Intelligence and Smart Systems; Ngatched, T.M.N., Woungang, I., Eds.; Springer: Cham, Switzerland, 2022; pp. 94–107. [Google Scholar]
- Hossain, M.M.; Ali, M.S.; Ahmed, M.M.; Rakib, M.R.H.; Kona, M.A.; Afrin, S.; Islam, M.K.; Ahsan, M.M.; Raj, S.M.R.H.; Rahman, M.H. Cardiovascular disease identification using a hybrid CNN-LSTM model with explainable AI. Inform. Med. Unlocked 2023, 42, 101370. [Google Scholar] [CrossRef]
Disclaimer/Publisher’s Note: The statements, opinions and data contained in all publications are solely those of the individual author(s) and contributor(s) and not of MDPI and/or the editor(s). MDPI and/or the editor(s) disclaim responsibility for any injury to people or property resulting from any ideas, methods, instructions or products referred to in the content. |
© 2024 by the authors. Licensee MDPI, Basel, Switzerland. This article is an open access article distributed under the terms and conditions of the Creative Commons Attribution (CC BY) license (https://creativecommons.org/licenses/by/4.0/).