Abstract
A digital microscope plays a crucial role in the better and faster diagnosis of an abnormality using various techniques. There has been significant development in this domain of digital pathology. Sickle cell disease (SCD) is a genetic disorder that affects hemoglobin in red blood cells. The traditional method for diagnosing sickle cell disease involves preparing a glass slide and viewing the slide using the eyepiece of a manual microscope. The entire process thus becomes very tedious and time consuming. This paper proposes a semi-automated system that can capture images based on a predefined program. It has an XY stage for moving the slide horizontally or vertically and a Z stage for focus adjustments. The case study taken here is of SCD. The proposed hardware captures SCD slides, which are further used to classify them with respect to normal. They are processed using deep learning models such as Darknet-19, ResNet50, ResNet18, ResNet101, and GoogleNet. The tested models demonstrated strong performance, with most achieving high metrics across different configurations varying with an average of around 97%. In the future, this semi-automated system will benefit pathologists and can be used in rural areas, where pathologists are in short supply.
1. Introduction
Sickle cell disease is a genetic disorder that affects the hemoglobin present in red blood cells. The Hemoglobin Subunit Beta (HBB) gene, present in chromosome 11, allows hemoglobin S to mature [1,2]. Hemoglobin S changes a red blood cell’s shape from a disk to a sickle, clogging the blood vessels. It is less efficient in carrying oxygen throughout the body, thereby leading to pain, organ dysfunction, and tissue damage [3]. Sickle cell disease causes a shortage of blood vessels, resulting in anemia.
Patients with SCD produce other abnormal hemoglobins, such as hemoglobin C or hemoglobin F. Infants as well as young children have hemoglobin F [4,5]. Hemoglobin C is derived from the HBB gene. These variants of abnormal hemoglobin determine the severity of SCD.
Sickle cell disease is inherited in an autosomal recessive pattern, with the fetus inheriting two gene copies affected by SCD, one from each parent. If only one copy is inherited, they are referred to as carriers and they typically exhibit no symptoms. If both parents are carriers, there is a 25 percent chance of becoming carriers, a 25 percent chance of being normal, and a 50 percent chance of being affected [6].
Africa has the highest population in terms of the percentage suffering from SCD, with more than half of the 0.2 to 0.3 million children suffering from SCD [7,8]. After Africa, America is the most impacted country, with several people suffering from SCD. In Hispanic America, among 16,300 newborn babies, one baby suffers from SCD. India, North Africa, Southern Europe, and West Asia have a lower percentage of their populations affected by SCD [9].
The diagnosis of sickle cells using automated methods helps in dealing with problems related to overlapping, subjectivity, proneness to human error, and expert pathologist requirements [10]. Hence, automated CAD-based methods have come into the picture. Digital pathology is acquiring, managing, sharing, and interpreting pathology slides in the digital environment. The microscope, which existed many years ago, has now changed completely [11]. The lengthy process includes the manual diagnosis of sickle cells. To reduce the time consumption of the pathologist, a motor and digital camera were installed in the microscope [12]. Digital slides prevent the breakage of glass slides and barcoding allows the location of pathology slides in a digital environment [13]. It is possible to include notes in digital slides that can be used for teaching, education, and research [14]. Pathologists can view slides from different angles.
Glass slides/pathology specimens are examined through a digital monitor instead of a microscope [15]. The main elements in digital pathology are devices that digitize the images: a digital camera and a digital slide scanner. Digital slide scanners capture multiple images from a glass slide. Deep learning is an artificial neural network where the digital data captured by the recent pathology equipment is processed and analyzed [16]. The datasets are applied and the model learns from them to produce the desired output. Deep learning is a group of machine learning, which is also a group of artificial intelligence. Datasets are trained, validated, and then tested using previously unseen data. Neural networks have one input layer, many hidden layers, and one output layer [17]. A convolutional neural network is one in which the matrix convolves with the image to produce the desired output. It is the main feature extraction layer. One of its types is transfer learning, which uses a pre-trained network where datasets are fine-tuned to produce the desired output [18].
Figure 1 depicts a typical workflow associated with a digital pathology-based system. Digital slide scanners are part of the acquisition system, which gives out a high-resolution digital image. It also has the option to set the magnification level. The more we magnify, the more images we capture.
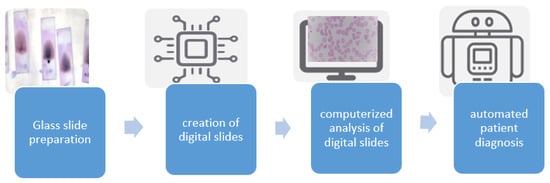
Figure 1.
Digital pathology workflow.
Compared to the traditional workflow of sample preparation and analysis under a microscope, the digitized workflow requires extra instruments, a well-trained pathologist, and certain quality control measures. These additional requirements necessitate better information technology and departmental resources. There are various benefits of shifting to a digital workflow, including the ability to easily share slides and send them to other pathologists for a second opinion, standardization of teaching, organizing records of digital slides, and extraction of histopathology slides through a specialized scanner [19].
2. Literature Review
Many researchers are interested in whole slide imaging and developing a virtual slide system. A few studies in that direction have been discussed here.
2.1. Disease Diagnosis Using Whole Slide Imaging and Other Techniques
QuPath (v0.5.1) is an open-source software used to analyze digital images. There was 40 GB of uncompressed data used. Blood cell counts, including white blood cells, red blood cells, and platelets were all written in the QuPath software, and accordingly, the type of anemia was predicted. The Kalpan–Meir method was used to display the graph. Finally, a two-dimensional image was shown [20].
iPath software (v4.0) was developed to support diagnostic consultation among all patients. Telepathology has a telecommunication facility, hence it is possible to transmit medical images electronically from one hospital to another. iPath software uses various equipment to support telepathology [21]. Telecytology means practicing cytology while maintaining a distance using a digital image. There is a problem that the tiny region of interest is not seen sometimes. To solve the problem, the robotic microscope is there, but the robotic microscope works slowly. The problem is that sometimes it is impossible to upload the digital images [22].
2.2. Virtual Microscopy
Virtual microscopy has been used to teach cell organization, tissues, and organs. Thereby, optical microscopes as well as glass slides in histology are replaced. A virtual image file sharing website permits many pathologists to obtain access to digital images. Using a virtual microscopy database in school is free of charge [23]. Laboratory medicine programs are designed to prepare students for a career in diagnostic pathology. The program includes histotechnology, transfusion, and clinical chemistry. The teaching slide was captured using a NanoZoomer digital slide scanner and uploaded to the University of South Australia’s website. Live lectures were recorded using Panopto software (v15.0) and uploaded to the Moodle site weekly. Web 2 tools assisted students in learning [24].
Digital image analysis allows the diagnosis, grading, and classification of diseases. The steps of digital image analysis include image digitalization, image detection, image segmentation, image editing, and feature extraction [25].
2.3. Sickle Cell Classification Using Deep Learning
Estimating clinical status means counting types of cells according to the feature. It is necessary to have a quicker method for classifying cells that is superior to human inspection [26]. The features are extracted from segmented images by calculating the gray level statistics and algebraic moment invariants. The extracted features can be analyzed to quantify the potential differentiation of blood cells as normal or abnormal [27]. Non-overlapping cells were eliminated using the canny edge detection mechanism. Canny edge detection makes use of a multi-stage algorithm for detecting edges in images. It follows Gaussian filtering, intensity gradient identification, non-maximum suppression, double threshold, and hysteresis [28].
Sickle cell retinopathy is asymptomatic at the beginning, especially during the growth stage, and may cause vision loss because of vitreous hemorrhage or tractional retinal detachments [29]. The application of artificial intelligence to sickle cell retinopathy is the understanding of automated ultra-widefield fundus photographs for enhancing access to disease screening. Automatic artificial intelligence algorithms based on point-of-care fundus photography can be produced either in primary care centers or hematology departments. Under diabetic retinopathy, deep learning was utilized to prove that baseline 7-field fundus photographs anticipate a decline in early treatment, followed by severity at one year with 91% sensitivity and 65% specificity. Fluorescein angiography is invasive, time consuming, and resource intensive compared to fundus photography [30].
A highly qualified classifier that can determine the suitable dose for sickle cell disorder patients from nine classes needs to be obtained. Machine learning classifiers based on a performance evaluation matrix were applied to examine the sickle cell dataset. Among all classifiers, the Naïve Bayes classifier showed poor results. The Levenberg–Marquardt neural network showed good accuracy of 0.93, 0.96 during the training phase and 0.84, 0.87 during the testing phase. This technology is used to analyze healthcare factors such as patient administration, provide treatment, and more importantly disease progression prediction. Machine learning has abundant classification techniques such as logistic regression, quadratic discriminant classifier, Naïve Bayes classifier, and Levenberg–Marquardt neural network [31]. According to one paper, classification algorithms such as support vector machine, k-nearest neighbor algorithm, logistic regression, decision tree classifier, and random forest algorithm were used to classify sickle cells. The system is estimated with respect to accuracy and log loss to prove the technique’s performance [32]. Detection of elliptocytosis, sickle, and burr cells depends upon the shape signature. Hence, circular Hough transform, watershed segmentation, and morphological methods can be utilized to enhance and prepare tested images. The performance of the proposed algorithm was achieved accurately by testing 45 colorful microscopic images of patients suffering from anemia. Support vector machines, back propagation, and self-organizing map neural networks were used to analyze facts about anemia. The variables used are area, convex area, perimeter, eccentricity, solidity, ratio, absolute deviations, and variables of absolute subtraction between input and signature values. Accuracy, specificity, and sensitivity are calculated using parameters such as true positive, true negative, false positive, and false negative [33]. Fuzzy C-means clustering is used to identify normal and sickle cells. Morphological operations are also applied to images. Images are tested using the K-nearest neighbor, support vector machine, and extreme learning machine classifiers. The methods used were image acquisition, pre-processing, segmentation, morphological operations, feature extraction, and geometrical feature [34].
Red blood contains millions of cells, so manually classifying and counting them will inevitably lead to errors. To improve the results, the feature extractor model was used, followed by an error-correcting output code classifier. The model was built using a Directed Acyclic Graph (DAG). DAG is a deep learning neural network with more complex architectures involving layers with multiple inputs and outputs [34].
Automated hierarchical RBC extraction detects the RBC region and then separates sticky RBCs from the region of interest using an improved random walk method. Masked RBC patch size normalization was used to convert the alternative size of the segmented RBC into a uniform size. A deep convolutional neural network was used to classify RBCs. The alternating convolution and pooling operation deals with non-linear and complex patterns. The specific shape factor quantification was studied for classifying RBC image data for developing general multiscale shape analysis. A number of experiments were performed on raw microscopy image datasets of eight sickle cell disease patients through fivefold cross-validation for oxygenated and deoxygenated RBC, resulting in a high accuracy classification of sickle cells. Medical imaging and computerized image processing provide a tool for observing the condition of sickle cell disorder patients [35].
2.4. Diagnosing Sickle Cell Using Explainable AI (XAI)
Artificial intelligence has been applied to hematology that will automatically diagnose blood disease and predict treatment outcomes. Explainable AI can be used to determine which region or features the model uses to classify an abnormality. It generates heat maps that help us determine which region is responsible for the detected category [36]. Based on this, the pathologist can determine whether the model is trustworthy or not in assisting them with the diagnosis process.
Wearable devices, smartphones, and mobile monitoring sensors can be controlled through deep learning. Applying artificial intelligence to hematology reduces healthcare costs [37]. Sickle cell disease is a serious and life-threatening disease that affects 25% of the population in Central and West Asia. Current methods for diagnosing SCD are time consuming. Point-of-care platforms provide cost effectiveness and flexibility, allowing the diagnosing of millions of people in a few countries [38].
The following are the major contributions in the paper:
- Dual-mode system design (Joystick and XY System with Z Stage): The system is designed to operate in dual mode, incorporating both a joystick and an XY system. The addition of a Z stage enables the precise capture of sickle cell images in patches. This design enhances the flexibility and accuracy of image acquisition, facilitating better diagnostic outcomes.
- Deep learning models with explainability: Developed deep learning models that not only classify sickle cell abnormalities with high accuracy, but also provide explainability. The use of explainable AI (XAI) ensures that the models generate interpretable results, allowing pathologists to understand which features and regions the models focus on for classification. This transparency builds trust in AI-driven diagnostics and aids in the validation of the models’ decisions.
These contributions demonstrate the innovative approach of combining advanced imaging systems with state-of-the-art deep learning techniques to improve the diagnosis and classification of sickle cell disease. The dual-mode system design enhances the precision of image capture, while the incorporation of explainable AI ensures that the deep learning models are not only accurate, but also transparent and trustworthy in their decision-making process.
3. Materials and Methods
The proposed method introduces a digital system for digitizing the glass slide sample information into digital format. The system consists of an integrated microscopic arrangement, a camera, and a controlling electronic circuit.
3.1. Digitization of a Sickle Cell Sample in a Glass Slide Workflow
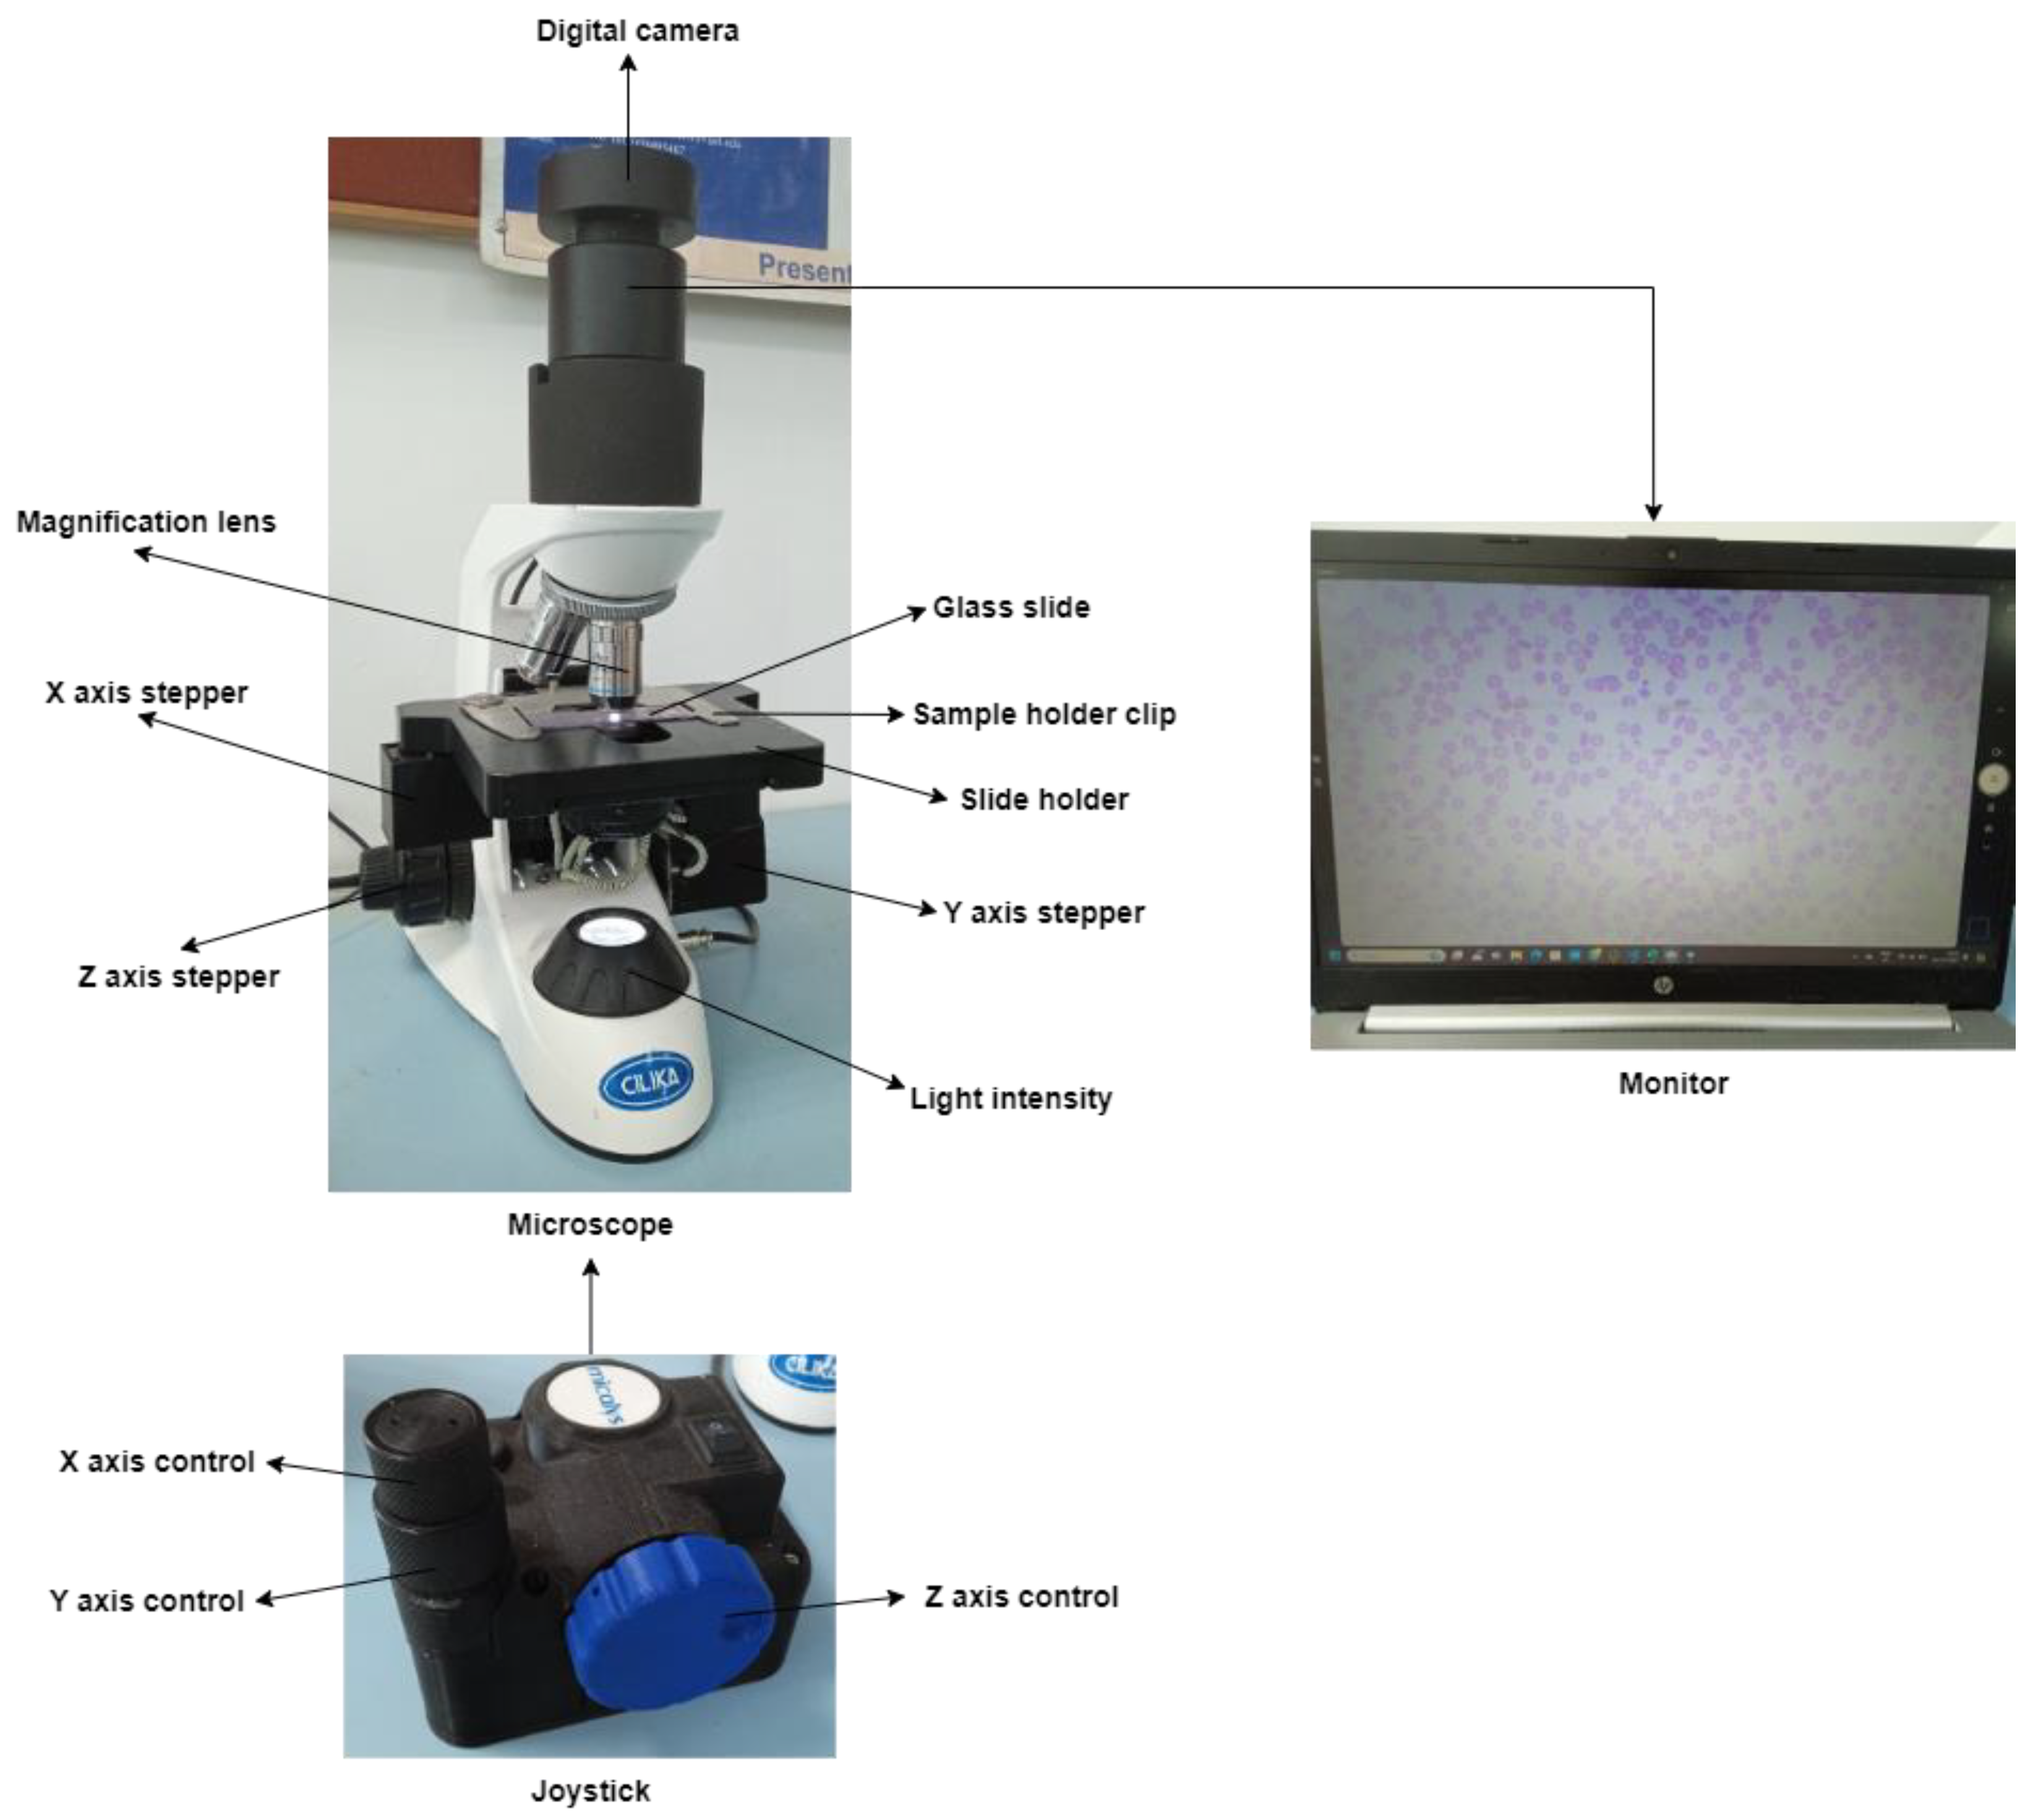
Figure 2 depicts the major elements used in the construction of the system. The sickle cell samples collected from the patients are placed on a glass slide, which is further examined under a microscope. The 8 MP USB video device class (UVC) camera, a digital camera, captures the glass slide and then converts it into a displayable digital image. A motorized slide holder is a unit consisting of a stepper motor. Three stepper motors are used: one for controlling the horizontal motion (X-axis), one for controlling the vertical motion (Y-axis), and one for controlling the focus (Z-axis). Belts and pulley systems are attached to the stepper motor that converts rotary motion into linear motion, and accordingly, the microscopic slide will move in horizontal and vertical directions. The slide is supposed to move at a 1 mm distance so that the digital camera can capture the region of interest according to the pathologist’s choice. So, the precision should be less than 1 mm. This is interfaced with the STM32F microcontroller, which controls the motion of the stepper motor. The stepper motor cannot rotate independently; it must be interfaced with STM32F. The stepper motor has four bipolar stator windings, which will rotate the motor. The minimum voltage and current required to rotate the stepper motor are 24 V and 0.6 A, respectively. However, the microcontroller STM32F supplies a maximum current of 0.1 A and a voltage range from 1.8 V to 3.8 V. So, in order to supply additional voltage and current, the stepper motor driver TMC5130a is there. TMC5130a will supply additional voltage ranging from 4.6 V to 46 V and an additional current of 2 A. Once the program is uploaded to the STM32F development board, it is stored in the flash memory of the STM32F development board so it can work through a 12 V power. The glass slide is divided into blocks, then the slide will move a few steps on the X-axis, one step on the Y-axis, again the same number of steps backward on the X-axis, and so on. Each time, the digital camera will capture the block. Once the digital camera finishes capturing one block, the slide will move next, and this process continues. With these iterations, the entire glass slide is scanned then this process is stopped. The number of digital images coming one after the other is stored on the computer. The system is made in dual mode with a joystick. Joystick has three knobs; X-knob, Y-knob, and Z-knob. The X-knob controls the movement of the slide on the X-axis. Y-knob controls the movement of the slide on the Y-axis. The Z-knob adjusts the focus of the image.
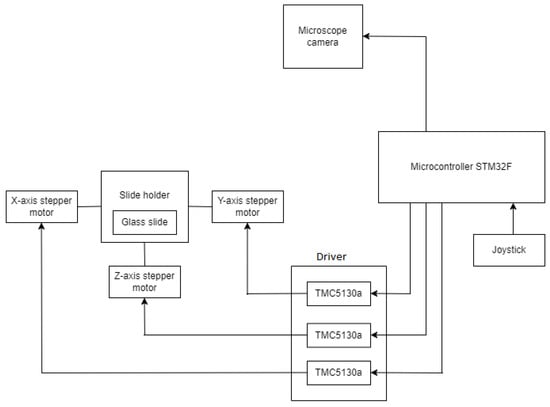
Figure 2.
Microcontroller-based system for acquiring the digital slide.
3.2. XYZ Microscope Slide Scanner
This prototype is capable of capturing multiple images thereby covering the whole slide. The entire slide image can be created from many digital images. For tile-based, the number of images captured increases. Irrespective of the type, the movement of the slide is from top to bottom and bottom to top in a 1 cm × 1 cm distance and at a 1 mm interval. The stepper motor controls the movement of the slide. The rotary motion of the stepper motor is converted into linear motion through a linear ball bearing mechanism. This makes the slide move a certain number of steps from the X-axis toward the right direction. After this, the second stepper motor comes into action, which rotates and moves the slide one step in the Y-axis. To carry on further, the movement of the slide is changed from the X-axis in the forward direction to the backward direction. When the entire image is captured, the movement of the slide is stopped.
3.3. Algorithm
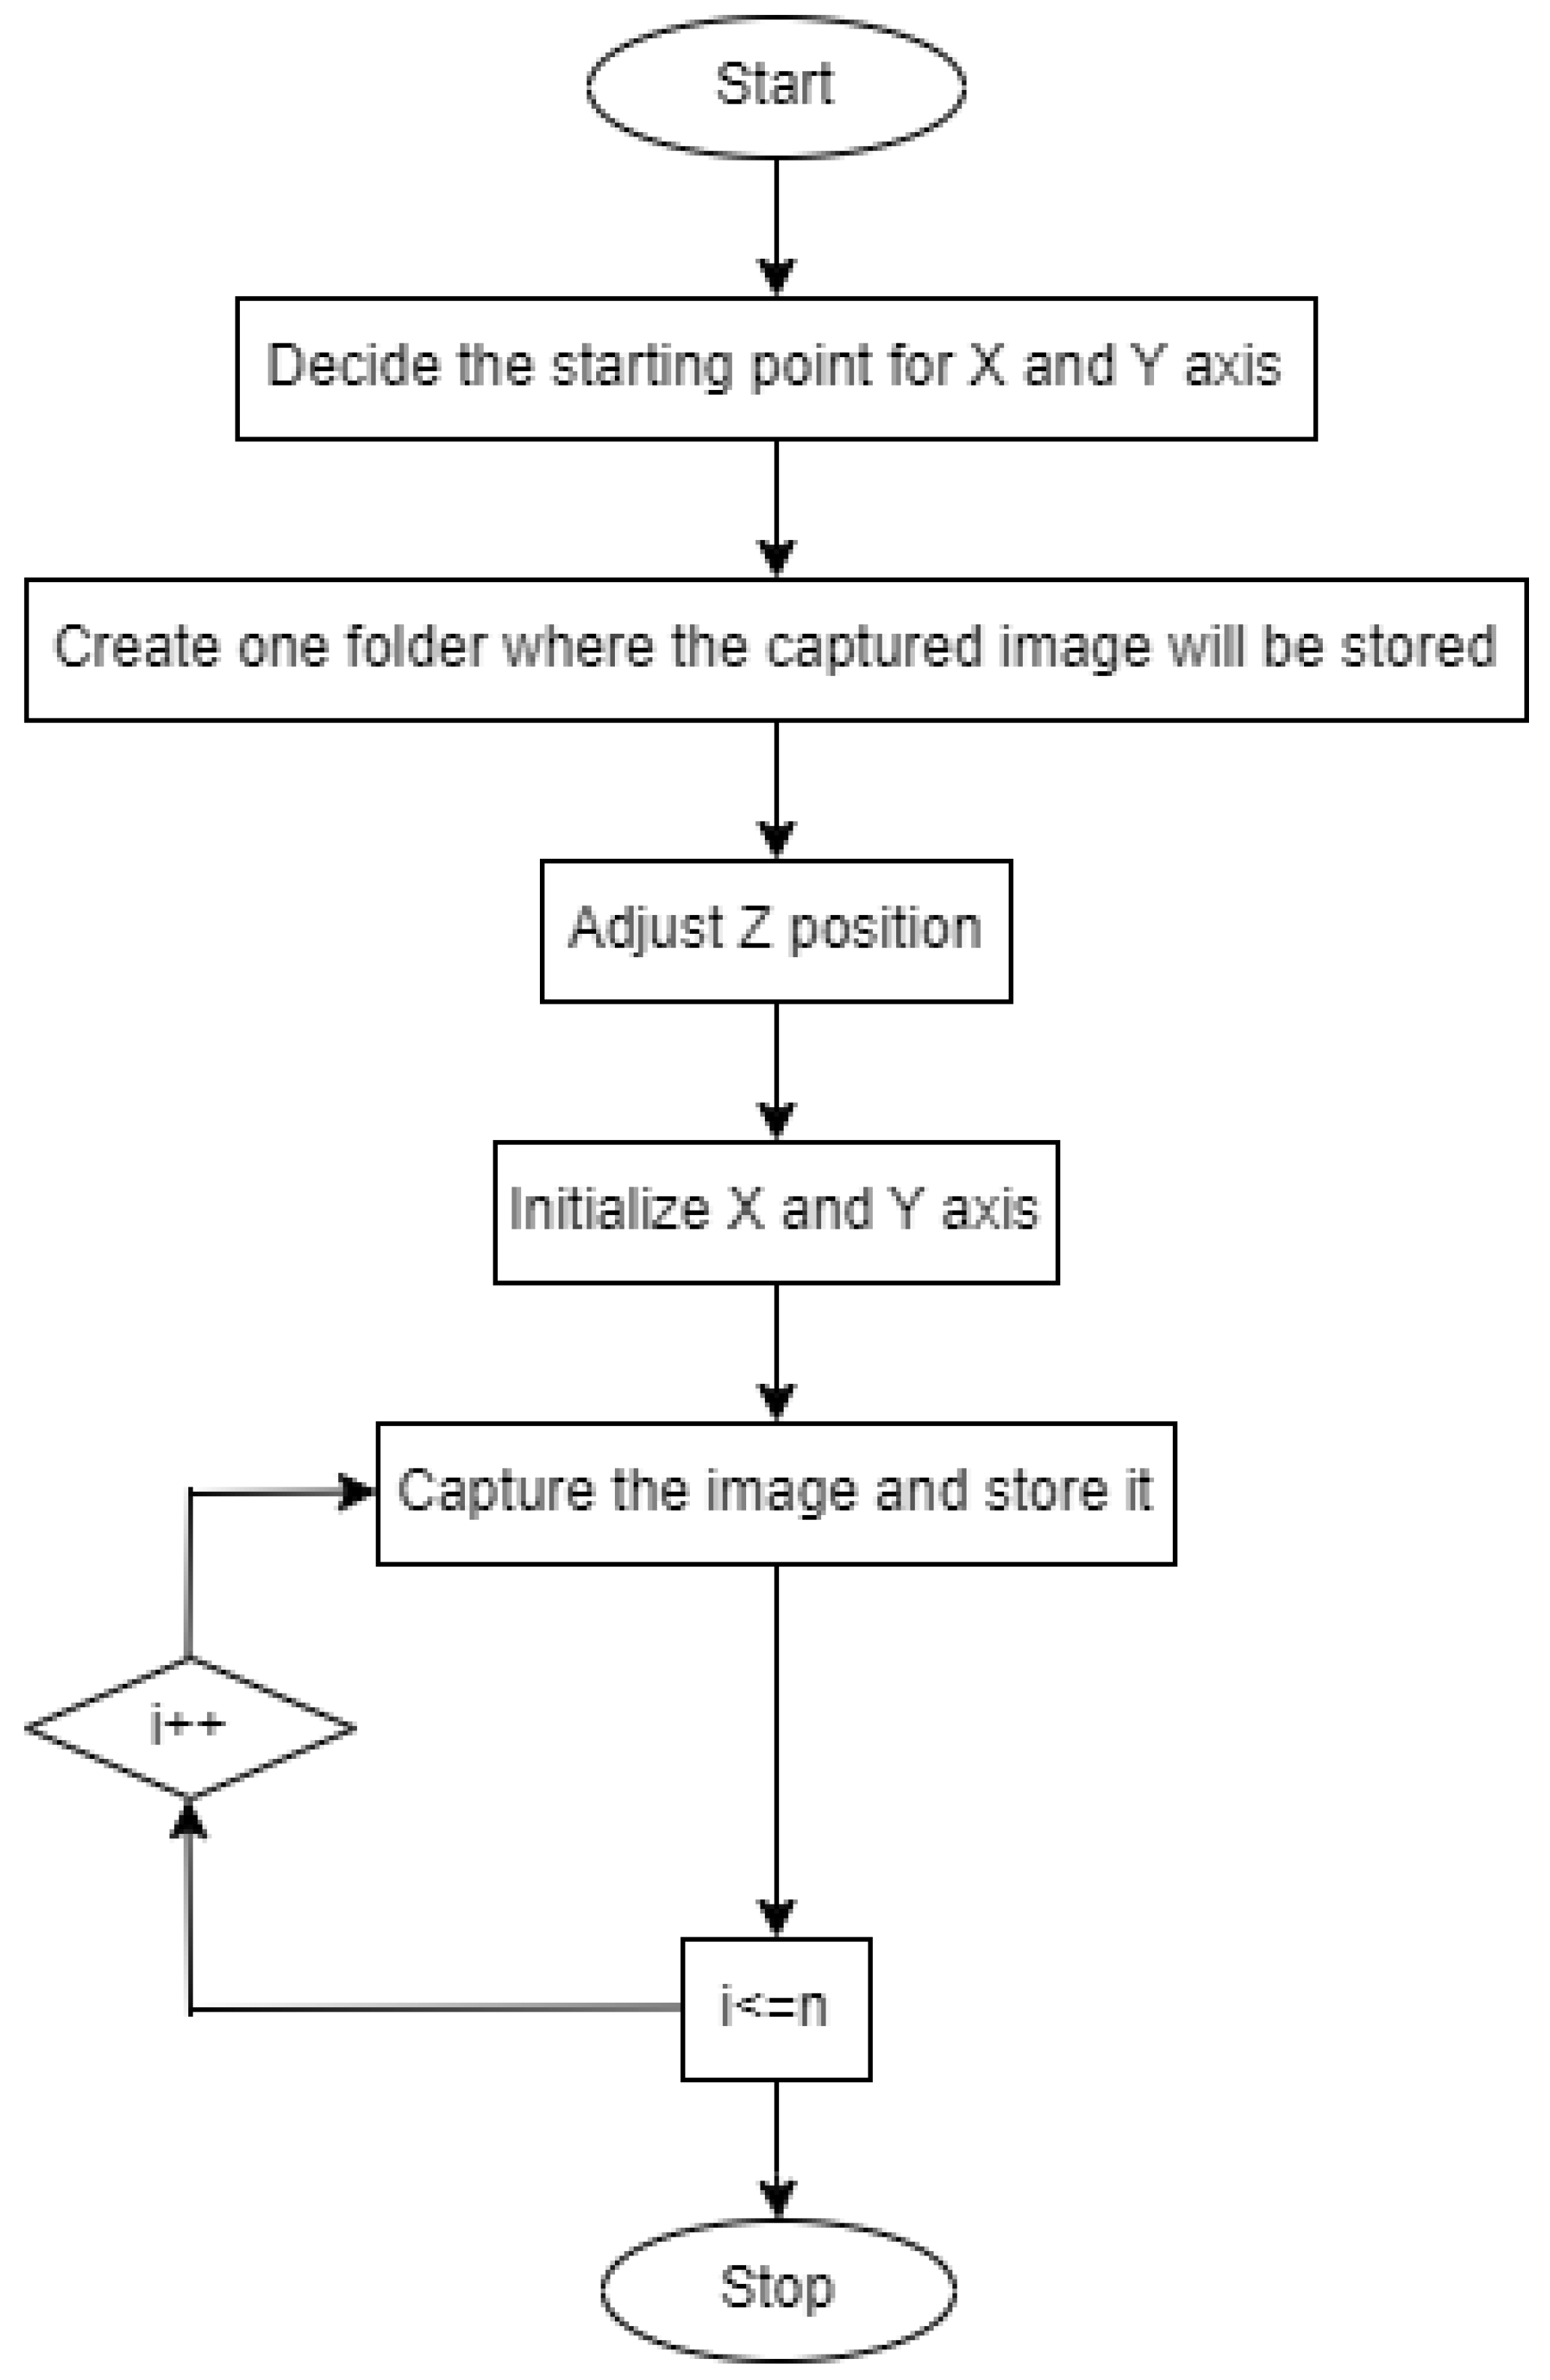
Figure 3 depicts the flowchart for controlling the XYZ stage.

Figure 3.
Flowchart for controlling XYZ stage.
- Set the starting position for the X-axis and Y-axis.
- Create a folder where the captured image will be stored.
- Adjust the Z position.
- Initialize the X-axis and Y-axis.
- Capture the image and proceed.
- Move the slide in the XY direction.
- Continue this process until the entire glass slide is scanned.
Figure 4 depicts an automated XYZ stage attached to the microscope. The user-designed slide mounting chamber replaced the traditional slide mounting chamber. Three supporting chambers are incorporated to support the three stepper motors for X-, Y-, and Z-axis.

Figure 4.
Automated XYZ stage attached to a microscope.
3.4. Deep Learning for the Classification of Sickle Cell
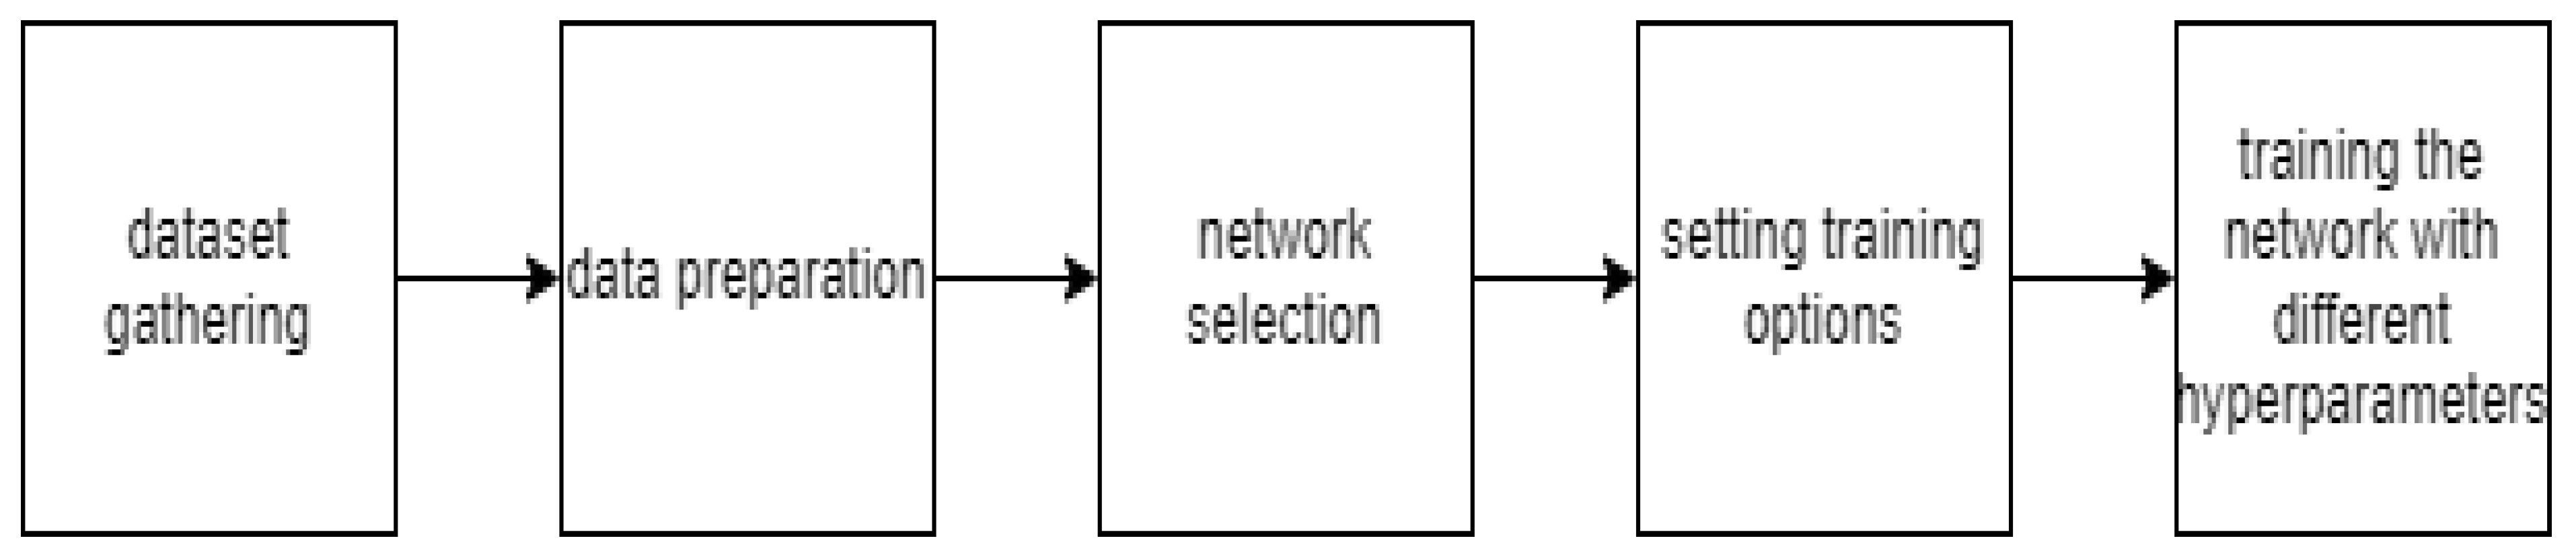
Figure 5 depicts the workflow of sickle cell classification using deep learning.
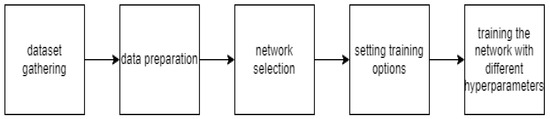
Figure 5.
Analysis of a blood smear datasets using deep learning.
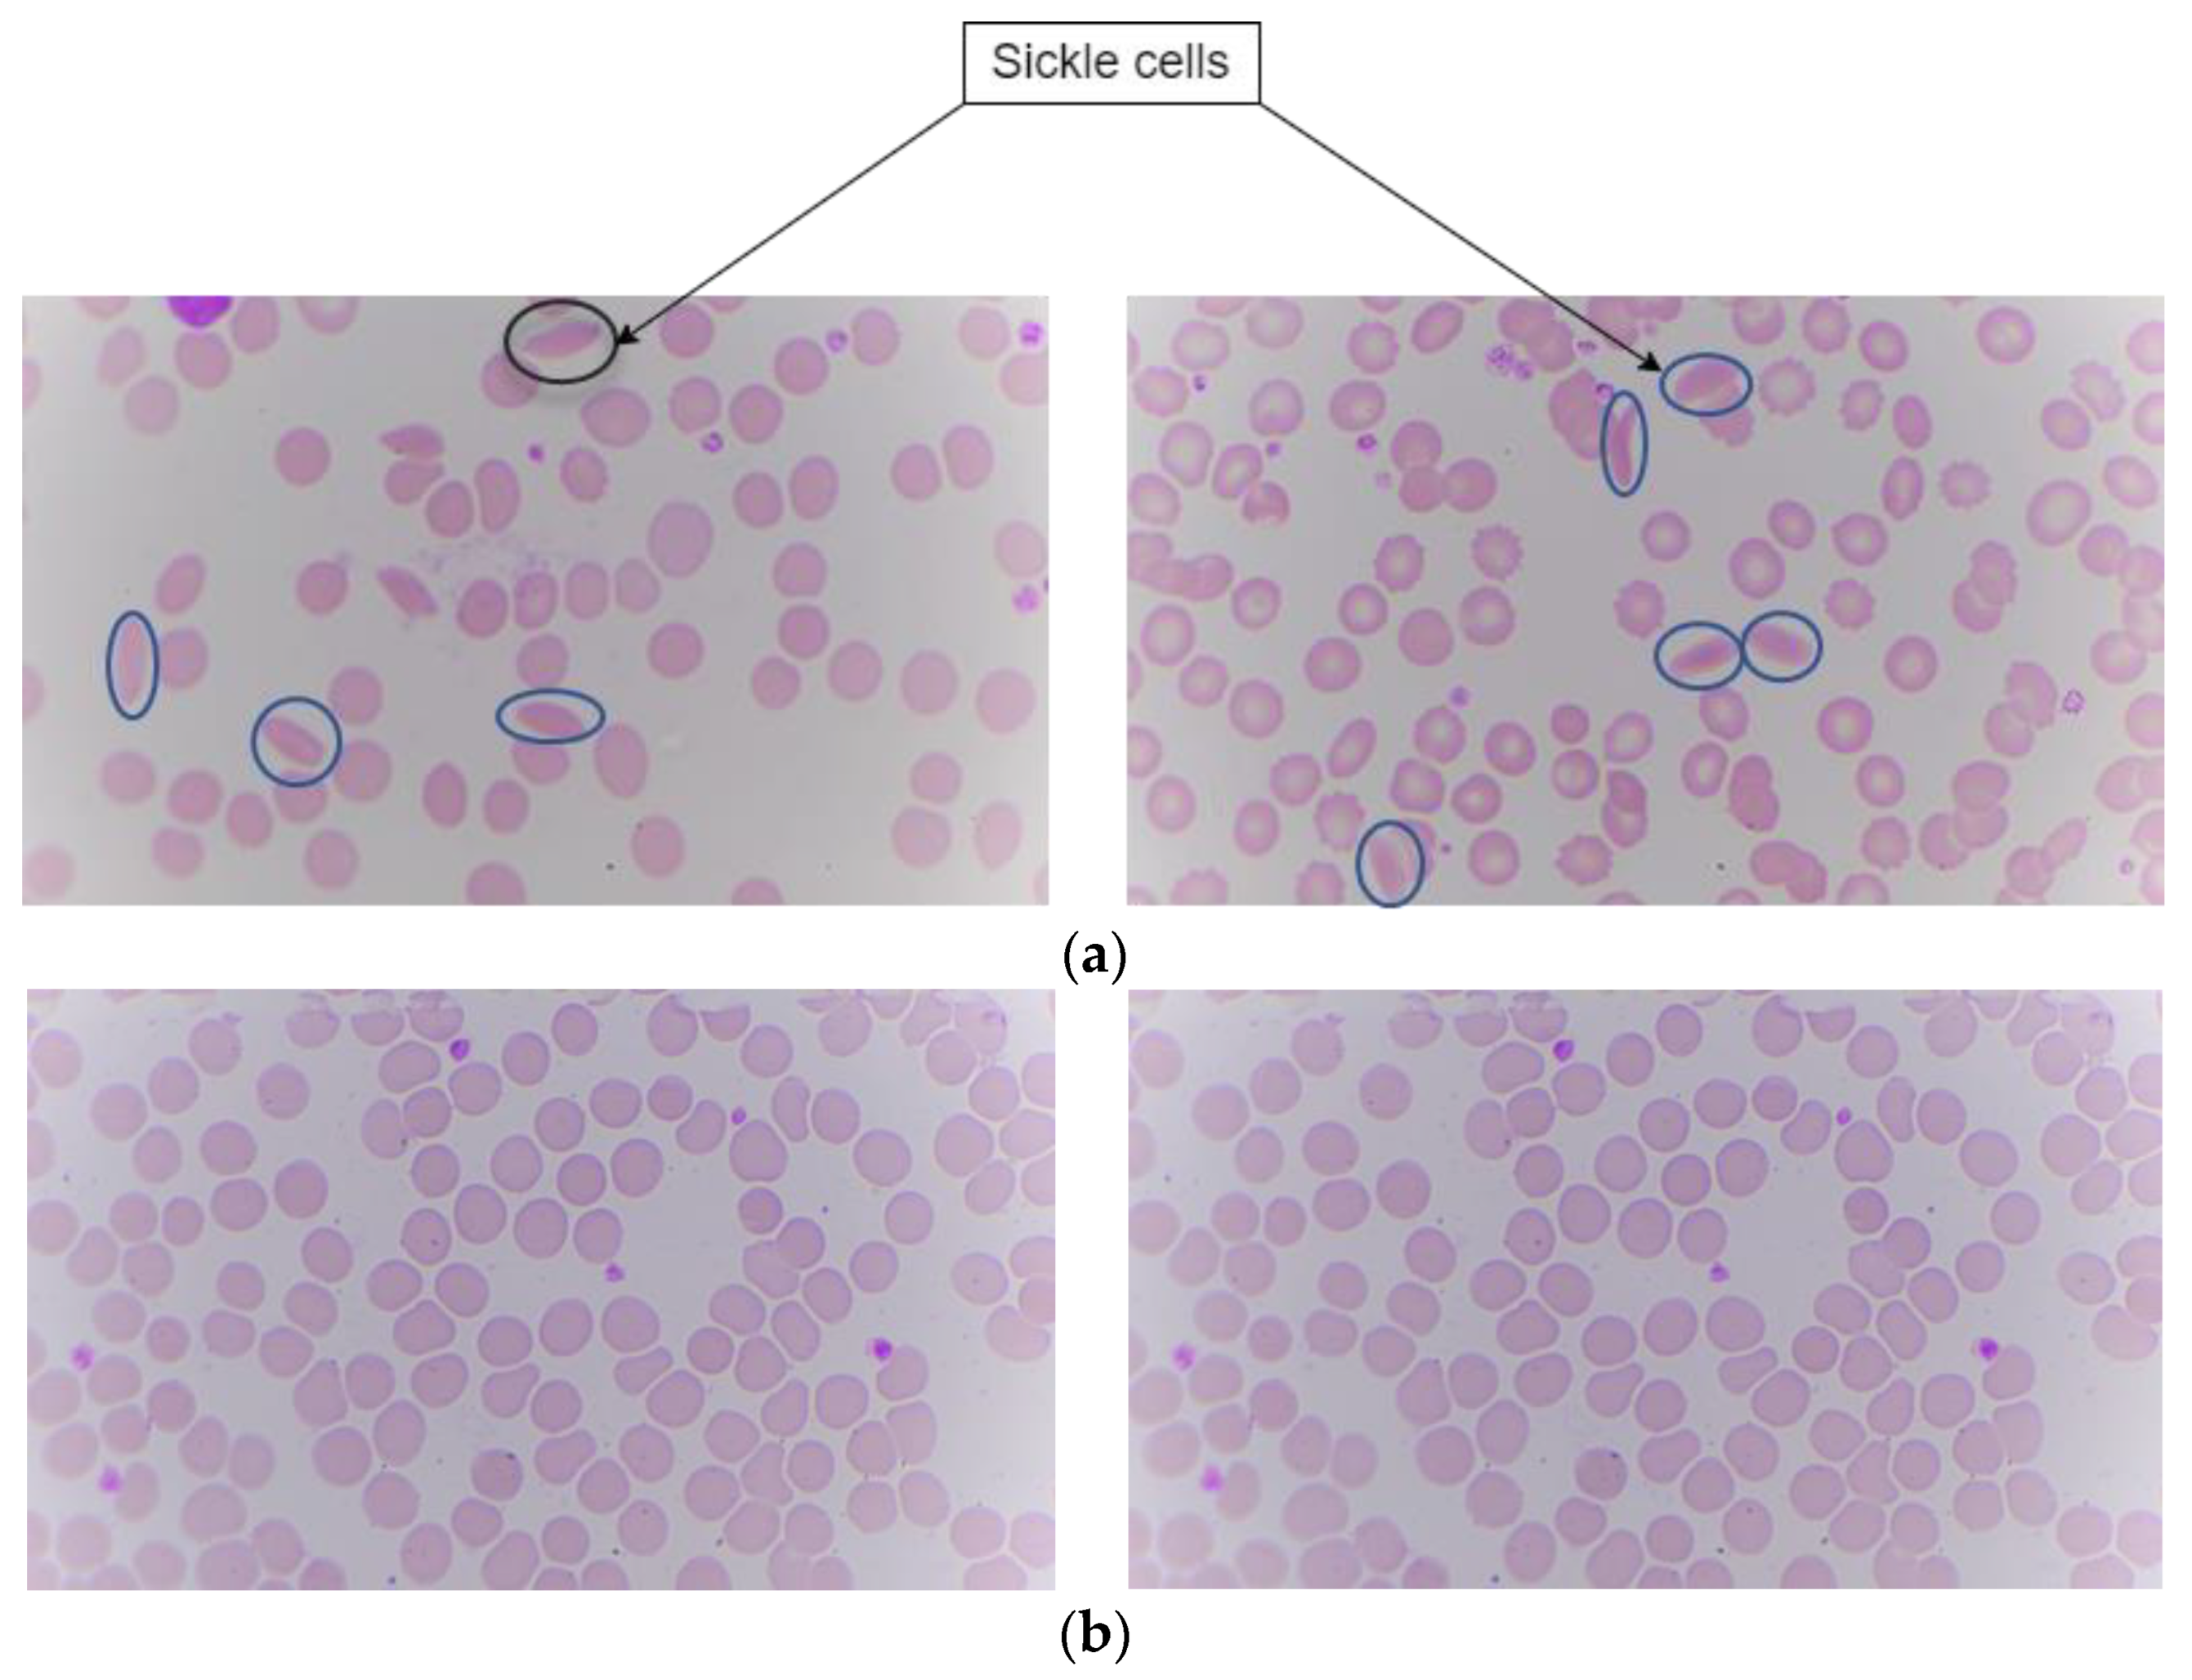
Sample slides are taken from Kasturba Medical College (KMC), Manipal. The digital images of these slides are captured using the proposed hardware system in the paper. Images are captured using a microscope with specifications of a 100× magnification camera which captures colored images and an XY stage which is motorized for positioning the sample. Z stage is used for adjusting the focus of the image. This dataset contains digital images of blood samples of healthy individuals and patients suffering from SCD. After capturing the digital images with this microscope, they were fed into the deep learning algorithm for classification. There are a total of 191 images. Among those images, 95 are labeled as sickle cells and 96 as normal cells. The split ratio for training is around 70:30 ratio. In this the 70% i.e., 164 images were for both training and validation. The images having both sickle and normal class were 27 in number. Figure 6 shows the sickle and normal cell images.
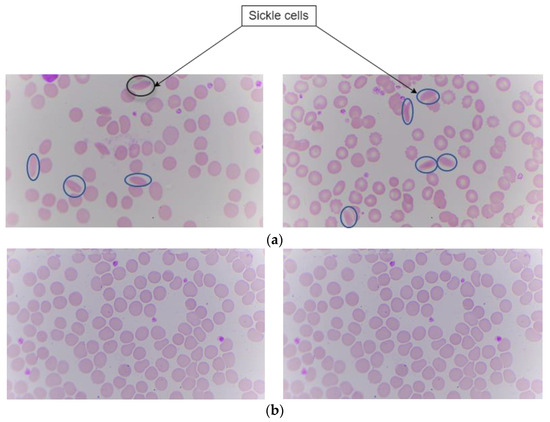
Figure 6.
Peripheral blood smear image showing sickle and normal. (a) Sickle cells. (b) Normal.
To select a suitable neural network for classifying images, deep convolutional neural networks are chosen and then fine-tuned.
3.4.1. Experimental Setup
Transfer learning uses a pre-trained network where datasets are fine-tuned to obtain the best validation accuracy [39,40]. The pre-trained network used were ResNet18, ResNet50, ResNet101, Darknet-19, and GoogleNet which are trained on a large dataset. The output units of a fully connected layer depend upon the number of classes. Hence, sickle cell class and normal class are modified.
During the transfer learning process, the pre-trained model is frozen and only weights of a new fully connected layer and a new convolutional layer were improved at the time of training. Transfer learning allows the model to support features from a pre-trained network. This approach was anticipated to benefit the model by minimizing the amount of data required for training as well as improving the model’s performance.
We employ MATLAB’s R2023b for better visual graphics for the evaluation of performance. MATLAB has the advantage of giving confidence to users for coding. It has various built-in tools for the deep learning domain, which include dataset preprocessing, design of a models, result analysis and visualization, etc. MATLAB outperforms Python in terms of visual representation. Other toolboxes and libraries such as TensorFlow, PyTorch, and Caffe are also capable of deep learning allowing applicants to integrate into MATLAB workflows.
3.4.2. Training
Out of 191 images, 164 images are used for training and validation while 27 images are used for testing.
Optimizer: The model is trained using the solver sgdm, which is stochastic gradient descent with momentum having advantages like accelerated convergence, a smooth optimization path, and noise rejection. This is used in deep learning tasks where gradient optimization is necessary.
Minimum batch size: The smallest number of samples that can be prepared on time. It relies on the availability of GPU systems.
Maximum epoch: This is the number of times the dataset is passed through the model for training. We tried on 30 and 50 epochs to obtain the best validation accuracy.
Initial learn rate: Refers to how much the model learns in one step. It is the magnitude of the improvement achieved to the model’s parameter at the time of every optimization. The optimal value for the classification task is 0.001 which is a standard for each and every trial [34].
A GPU system was used for experimenting using the CUDA platform with NVIDIA T400 4 GB Graphics card, reducing the time required for training.
3.4.3. Evaluation Metrics
For evaluating the model’s performance for each class, the following parameters are calculated,
4. Results
Sickle cell images captured using a microscope at 100× magnification are processed in deep learning for classification.
4.1. Selection of Best Trials for Testing
The best trial indicates the optimum epoch, batch size, and other hyperparameters. Various models such as ResNet50, ResNet18, ResNet101, DarkNet19, and GoogleNet were used for training purpose. On doing so the results show the importance of learning rate setting, with a learn rate of 0.01 and 0.001 and epochs of 30 and 50. Table 1 shows the different iterations of all of the models with different hyperparameter settings and their corresponding evaluation metrices.

Table 1.
Results obtained by deep learning models.
From the table it, can be noticed that models with a learning rate of 0.001 consistently show exceptional performance across all metrics, indicating they are highly accurate and reliable. On an average accuracy of Darknet19 was found to be around 99% with various hyperparameter conditions.
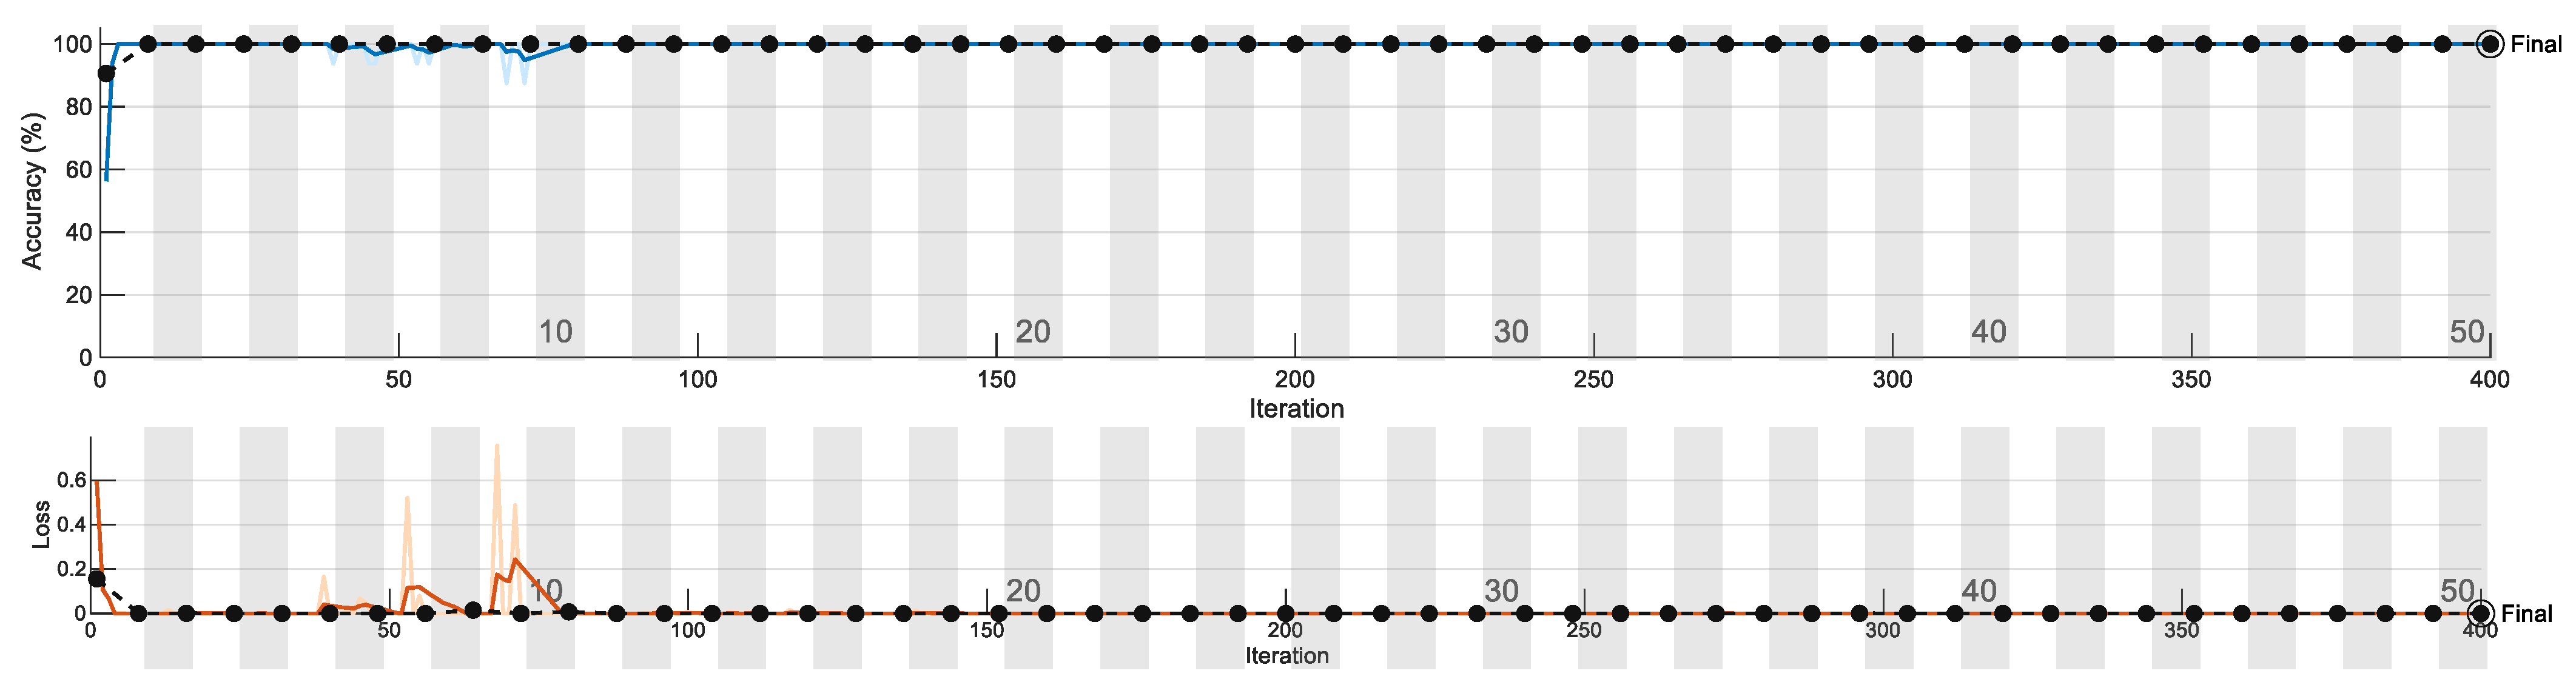
Figure 7 shows one of the training plots. We observe the training plot of this particular network to gain insight into its performance. The blue line indicates training accuracy, which gradually reached 100%. The black dotted line indicates validation accuracy. Points indicate where the model has performed validation. The validation frequency is adjusted along with the number of epochs. The second graph indicates a loss plot, which shows the error obtained from the model. A very high value leads to an indication of overfitting. Figure 7 shows the training/validation accuracy and loss plot.
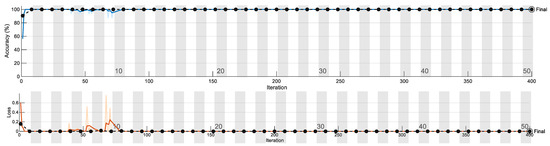
Figure 7.
Training/validation accuracy and loss plot.
To quantitatively analyze performance, a confusion matrix for each and every trial using an identical parameter is plotted. We test the model to obtain the confusion matrix and we can give the required number of anticipated classes. It has four sections: true positive, true negative, false positive, and false negative. Figure 8 shows one of the confusion matrix of the various trained models, i.e., Darknet19 with 50 epoch, 16 batch size and a learn rate of 0.001. In this, all test case datasets were correctly identified.
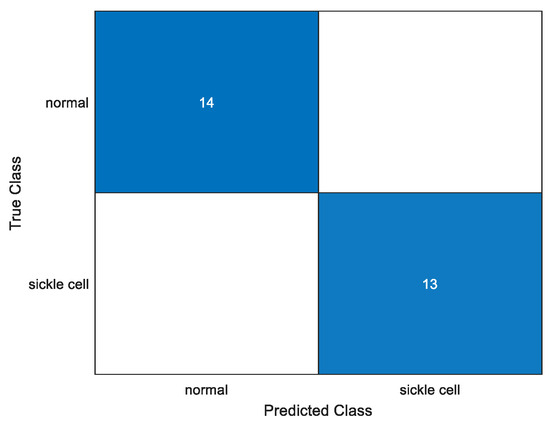
Figure 8.
Confusion matrix.
4.2. XAI
Explainable artificial intelligence, when applied to SCD, affects the model’s decision as to whether cells appear sickle or normal. Transparency is essential for instilling confidence in the model and ensuring its dependability in clinics. It operates by calculating the gradient of the deep learning model’s output with respect to the activation values in the last convolutional layer. Gradient refers to each pixel in the feature map. Grad-CAM, which is gradient weighted class activation mapping, identifies the most important region for classification in the image [41]. Figure 9 depicts the Grad-CAM of a sickle cell image. From the Grad-CAM image, the red color identifies the most important region for classification.
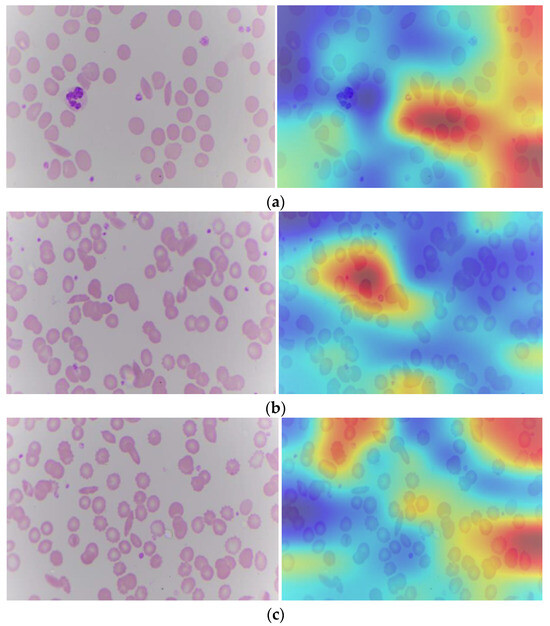
Figure 9.
Sickle cell images (a–c): Original and with Grad-CAM.
The blood cell image contains raw visual information of the blood cells, including various types of cells and their morphological features. The GRAD-CAM image is generated by overlaying a heat map on the original blood cell image. The heat map highlights the regions that have the most significant impact on the model’s prediction. These highlighted areas correspond to the features and regions that the model has learned to associate with specific classifications (e.g., normal vs. abnormal cells). By providing a visual explanation of the model’s decision, Grad-CAM makes the deep learning model’s predictions more interpretable. Pathologists can see which parts of the blood cell image the model is focusing on, helping them understand the basis of the model’s decision and verify its accuracy. This is particularly important in a clinical setting where the accuracy and reliability of diagnostic tools are paramount. It ensures that the model is not making arbitrary or unfounded predictions but is instead focusing on medically relevant features.
5. Discussion
In the hospital, the pathologist collects blood samples from the patients and places them on the glass slide, which is kept under the microscope. The pathologists acquire the different blocks of the samples manually. This takes up a lot of pathologists’ time. Not only time, but it also results in many errors relating to overlapping, missing areas, etc. Hence, a semi-automated system that acquires and digitizes the entire process needs to be developed. Stepper motors are interfaced with the STM32F microcontroller. Belts and pulley systems are attached to the stepper motor to convert rotary motion into linear motion through a linear ball bearing mechanism.
The microscope slide motion is predefined and fixed, according to which the X-axis and Y-axis move accordingly. The Z stage is used to focus the image. A digital camera in the microscope will capture the glass slides. The digital camera will capture each block of glass slides, which can then be stitched to obtain the whole slide image. Stitching individual image patches into a single whole image provides a complete view of the glass slide. This comprehensive image is essential for a thorough examination and analysis of the entire sample, ensuring no regions are overlooked. By capturing multiple high-resolution patches and stitching them together, we can create a detailed and high-resolution composite image. This method preserves fine details and features that might be lost in a single low-resolution image, which is crucial for accurate diagnosis. The samples that are captured can be utilized to perform analysis/diagnosis for detecting any abnormality.
SCD is an auto-immune disease that causes a reduction in oxygen-carrying capacity, making a person weak, paralyzed, or even lead to death. This is because of the change in the shape and size of the RBC. Manual diagnosis is a tedious task for pathologists. Secondly, it causes inaccuracy and might be subjective. Different orientations cause errors. The main objective here is to provide an aid to the pathologist in the diagnosis of sickle cells using this particular model. When training with a learn rate of 0.001 as compared to 0.01, the results seemed to improve exceptionally, proving the importance of setting a lesser step size for the model to learn well. This adjustment allows the model to fine-tune its parameters more effectively, leading to better generalization and higher performance metrics.
Explainable AI is one of the helpful tools that will give pathologists confidence to believe in the deep learning classification task. It highlights the region that is most responsible for contributing to the abnormality. It can provide great assistance to them along with saving time to see the entire region to find the abnormality. For example, if there are sickle cells in the sample, the region that has sickle cells in the image is darker red in color. The pathologist can just focus on that region to confirm the diagnosis using the deep learning model.
There have been studies that were performed along similar lines. Gao et al., designed the automated microscope with a UV camera for fungal detection. The time required here was very short, i.e., 65 s, but performance with respect to automated diagnosis is one of the limitations here [35]. Secondly, a unique approach was utilized by De Hann by using a smartphone as a replacement. This becomes a very handy and portable device. But the camera specifications are a challenge that has been dealt with but still needs more attention. Another interesting approach is making a DIY microscope that is automated and has an autofocusing feature and auto diagnosis as well. It is cost effective, but the time consumption for WSI is higher [37]. Table 2 summarizes the existing literature on the automation of the microscope to make it faster and cost effective. This also includes the automated analysis component, which detected abnormalities in the sample.
Table 2.
Comparison of existing literature.
The proposed method deals with creating a semi-automated microscope that uses stepper motors to convert the rotatory motion to linear motion for the movement of the XY stage of the microscope. Each stepper motor has four stator windings. Those stator windings rotate the stepper motor when interfaced with STM32F. The digital camera is directly connected to the computer. The image can be captured in automated mode or there is a provision to do it using a joystick that is attached to it. It has become one of the novel approaches.
Along with this, the classification of sickle cells using the proposed microscope sets up an application point of view for the microscope. This is conducted through the transfer learning methods, which is relatively a faster and better approach to train as the weights are pre-trained on the ImageNet dataset. We custom train by utilizing and fine-tuning the weights.
Here, there has been the utilization of XAI, a novel approach along with this hardware system. This gives confidence and transparency to the pathologist. One of the limitations here is that it has been only trained for sickle cell classification purposes. Moreover, the dataset for sickle cells is a challenge to obtain. Hence, the model was trained on a smaller number of datasets.
The paper provides an end-to-end process for a sample that is obtained for examination. This can be beneficial in rural areas where there is a shortage of pathologists. It can provide and aid in the diagnosis.
6. Conclusions and Future Scope
As per statistics, 70 percent of the population resides in a rural area, while 30 percent of the population resides in an urban area. This system solves the problem that pathologists might face while manually doing such a tedious task, which requires a lot of focus and concentration.
Along with the proposed semi-automated microscope system with XYZ stages, deep learning methodology has been incorporated here. It assists pathologists for diagnosis. A strong model can make a pathologist’s job easier. The pre-trained networks are used for predicting the abnormally shaped sickle cells. It helps detect sickle cells’ presence in a blood smear and classify them.
Deep learning approaches for cell categorizing have demonstrated significant promise in transforming the realm of cell scrutiny and identifying medical conditions. Ongoing progress in advanced deep learning models, the accessibility of extensively annotated datasets, and the collaboration between artificial intelligence specialists and professionals specializing in specific domains offer a potential pathway to enhancing the precision, effectiveness, and particularity of cell classification through deep learning techniques in the future. Nevertheless, certain challenges persist. These include the requirement for rigorous validation, the resolution of problems tied to class imbalance, interpretability concerns, and adherence to regulatory requirements. Ethical aspects including safeguarding patient privacy, reducing bias, ensuring courtesy, and ensuring transparency, warrant meticulous attention when applying deep learning in classifying cell endeavors.
In the future, the developed XYZ stage will be used, especially in rural areas, where pathologists are scarce to facilitate diagnostic consultations. Once the images are digitized, artificial intelligence (AI) can be added to the system to enhance its classification, identification, and analysis of any pathological abnormality. Given the limited number of sickle cell cases found in India, it is challenging to obtain a comprehensive dataset. However, this emphasizes the need for ongoing efforts to collect more data. We are expanding our dataset to enhance the robustness and reliability of our analysis, and future work will focus on acquiring additional samples to support our research further. It is also possible to have the entire scanning process conducted in real time. Furthermore, it can be remotely transmitted to any workstation accessed by expert pathologists to give their remarks.
7. Ethical Clearance
Datasets were collected from KMC after the approval of ethical clearance. “IEC1—365- Design of a digital framework to acquire digital slide for the remote analysis of a tissue smear”.
Author Contributions
N.G.G.: software, original draft; N.S.: conceptualization, methodology, and project administration; G.M.B.: resources, review and editing, and supervision; A.G.: data curation, software; D.D.B.S.: resources; S.B.: validation and investigation. All authors have read and agreed to the published version of the manuscript.
Funding
We would like to thank the Manipal Academy of Higher Education and UGC (India) for providing the grants for conducting our research.
Institutional Review Board Statement
Not applicable.
Informed Consent Statement
Not applicable.
Data Availability Statement
Data are available with the corresponding author.
Conflicts of Interest
The authors declare no conflicts of interest.
References
- Ashley-Koch, A.; Yang, Q.; Olney, R.S. Sickle hemoglobin (Hb S) allele and sickle cell disease: A HuGE review. Am. J. Epidemiol. 2000, 151, 839–845. [Google Scholar] [CrossRef]
- Tebbi, C.K. Sickle cell disease, a review. Hemato 2022, 3, 341–366. [Google Scholar] [CrossRef]
- Kato, G.J.; Piel, F.B.; Reid, C.D.; Gaston, M.H.; Ohene-Frempong, K.; Krishnamurti, L.; Smith, W.R.; Panepinto, J.A.; Weatherall, D.J.; Costa, F.F.; et al. Sickle cell disease. Nat. Rev. Dis. Primers 2018, 4, 18010. [Google Scholar] [CrossRef]
- Bender, M.A.; Hulihan, M.; Dorley, M.C.; Aguinaga, M.D.P.; Ojodu, J.; Yusuf, C. Newborn screening practices for beta-thalassemia in the United States. Int. J. Neonatal Screen. 2021, 7, 83. [Google Scholar] [CrossRef]
- Nkya, S.; Mwita, L.; Mgaya, J.; Kumburu, H.; Van Zwetselaar, M.; Menzel, S.; Mazandu, G.K.; Sangeda, R.; Chimusa, E. Identifying genetic variants and pathways associated with extreme levels of fetal hemoglobin in sickle cell disease in Tanzania. BMC Med. Genet. 2020, 21, 125. [Google Scholar] [CrossRef]
- Neel, J.V. The inheritance of sickle cell anemia. Science 1949, 110, 64–66. [Google Scholar] [CrossRef]
- Gallo, A.M.; Wilkie, D.; Suarez, M.; Labotka, R.; Molokie, R.; Thompson, A.; Hershberger, P.; Johnson, B. Reproductive decisions in people with sickle cell disease or sickle cell trait. West. J. Nurs. Res. 2010, 32, 1073–1090. [Google Scholar] [CrossRef]
- de Haan, K.; Ceylan Koydemir, H.; Rivenson, Y.; Tseng, D.; Van Dyne, E.; Bakic, L.; Karinca, D.; Liang, K.; Ilango, M.; Gumustekin, E.; et al. Automated screening of sickle cells using a smartphone-based microscope and deep learning. NPJ Digit. Med. 2020, 3, 76. [Google Scholar] [CrossRef]
- Data. Statistics on Sickle Cell Disease. 2019; CDC. Available online: https://www.cdc.gov/sickle-cell/data/index.html (accessed on 2 May 2020).
- Shaikh, M.; Bhat, N.; Shetty, R. Automated Red Blood Cells Count. Ph.D. Dissertation, University of Mumbai, Mumbai, India, 2014. [Google Scholar]
- Jahn, S.W.; Plass, M.; Moinfar, F. Digital pathology: Advantages, limitations, and emerging perspectives. J. Clin. Med. 2020, 9, 3697. [Google Scholar] [CrossRef]
- Gupta, M.; Soeny, K. Algorithms for rapid digitalization of prescriptions. Vis. Inform. 2021, 5, 54–69. [Google Scholar] [CrossRef]
- Hanna, M.G.; Ardon, O.; Reuter, V.E.; Sirintrapun, S.J.; England, C.; Klimstra, D.S.; Hameed, M.R. Integrating digital pathology into clinical practice. Mod. Pathol. 2022, 35, 152–164. [Google Scholar] [CrossRef]
- Rocha, R.; Vassallo, J.; Soares, F.; Miller, K.; Gobbi, H. Digital slides: Present status of a tool for consultation, teaching, and quality control in pathology. Pathol. Res. Pract. 2009, 205, 735–741. [Google Scholar] [CrossRef]
- Mukhopadhyay, S.; Feldman, M.D.; Abels, E.; Ashfaq, R.; Beltaifa, S.; Cacciabeve, N.G.; Nicolas, G.; Cathro, H.P.; Cheng, L.; Cooper, K.; et al. Whole slide imaging versus microscopy for primary diagnosis in surgical pathology: A multicenter blinded randomized noninferiority study of 1992 cases (pivotal study). Am. J. Surg. Pathol. 2018, 42, 39–52. [Google Scholar] [CrossRef]
- Pallua, J.; Brunner, A.; Zelger, B.; Schirmer, M.; Haybaeck, J. The future of pathology is digital. Pathol.-Res. Pract. 2020, 216, 153040. [Google Scholar] [CrossRef]
- LeCun, Y.; Bengio, Y.; Hinton, G. Deep learning. Nature 2015, 521, 436–444. [Google Scholar] [CrossRef]
- Habibi Aghdam, H.; Jahani Heravi, E.; Habibi Aghdam, H.; Jahani Heravi, E. Convolutional Neural Networks; Springer: Cham, Switzerland, 2017. [Google Scholar]
- Aeffner, F.; Zarella, M.D.; Buchbinder, N.; Bui, M.M.; Goodman, M.R.; Hartman, D.J.; Lujan, G.M.; Molani, M.A.; Parwani, A.V.; Lillard, K.; et al. Introduction to digital image analysis in whole slide imaging: A white paper from the digital pathology association. J. Pathol. Inform. 2019, 10, 9. [Google Scholar] [CrossRef]
- Bankhead, P.; Loughrey, M.B.; Fernández, J.A.; Dombrowski, Y.; McArt, D.G.; Dunne, P.D.; McQuaid, S.; Gray, R.T.; Murray, L.J.; Coleman, H.G.; et al. QuPath: Open source software for digital pathology image analysis. Sci. Rep. 2017, 7, 16878. [Google Scholar] [CrossRef]
- Hitchcock, L. The future of telepathology for the developing world. Arch. Pathol. Lab. Med. 2011, 135, 211–214. [Google Scholar] [CrossRef]
- Thrall, M.; Pantanowitz, L.; Khalbuss, W. Telecytology: Clinical applications, current challenges, and future benefits. J. Pathol. Inform. 2011, 2, 51. [Google Scholar] [CrossRef]
- Lee, L.M.; Goldman, H.M.; Hortsch, M. The virtual microscopy database—Sharing digital microscope images for research and education. Anat. Sci. Educ. 2018, 11, 510–515. [Google Scholar] [CrossRef]
- Caruso, M.C. Virtual microscopy and other technologies for teaching histology during COVID-19. Anat. Sci. Educ. 2021, 14, 19. [Google Scholar] [CrossRef]
- Dey, P.; Dey, P. Digital image analysis and virtual microscopy in pathology. In Basic and Advanced Laboratory Techniques in Histopathology and Cytology; Springer: Singapore, 2018; pp. 185–192. [Google Scholar]
- Sinha, N.; Ramakrishnan, A. Automation of differential blood count. In Proceedings of the TENCON 2003. Conference on Convergent Technologies for Asia-Pacific Region, Bangalore, India, 15–17 October 2003; pp. 547–551. [Google Scholar]
- Veluchamy, M.; Perumal, K.; Ponuchamy, T. Feature extraction and classification of blood cells using artificial neural network. Am. J. Appl. Sci. 2012, 9, 615. [Google Scholar]
- Vicent, M.; Simon, K.; Yonasi, S. An algorithm to detect overlapping red blood cells for sickle cell disease diagnosis. IET Image Process. 2022, 16, 1669–1677. [Google Scholar] [CrossRef]
- Bharath, A.; Scott, A.W.; Ong, S.S. Sickle cell retinopathy. In Retinal and Choroidal Vascular Diseases of the Eye; Elsevier: Amsterdam, The Netherlands, 2024; pp. 449–463. [Google Scholar]
- Cai, S.; Han, I.C.; Scott, A.W. Artificial intelligence for improving sickle cell retinopathy diagnosis and management. Eye 2021, 35, 2675–2684. [Google Scholar] [CrossRef]
- Dheyab, H.F.; Ucan, O.N.; Khalaf, M.; Mohammed, A.H. Implementation a various types of machine learning approaches for biomedical datasets based on sickle cell disorder. In Proceedings of the 2020 4th International Symposium on Multidisciplinary Studies and Innovative Technologies (ISMSIT), Istanbul, Turkey, 22–24 October 2020; pp. 1–6. [Google Scholar]
- Yeruva, S.; Sharada, V.M.; Pavan, G.B.; Hari, C.Y.; Prasad, P.K. Identification of sickle cell anemia using deep neural networks. Emerg. Sci. J. 2021, 5, 200–210. [Google Scholar] [CrossRef]
- Elsalamony, H.A. Detection of anaemia disease in human red blood cells using cell signature, neural networks, and SVM. Multimed. Tools Appl. 2018, 77, 15047–15074. [Google Scholar] [CrossRef]
- Patgiri, C.; Ganguly, A. Adaptive thresholding technique based classification of red blood cell and sickle cell using Naïve Bayes Classifier and Knearest neighbor classifier. Biomed. Signal Process. Control 2021, 68, 102745. [Google Scholar] [CrossRef]
- Alzubaidi, L.; AlShamma, O.; Fadhel, M.A.; Farhan, L.; Zhang, J. Classification of red blood cells in sickle cell anemia using deep convolutional neural network. In Proceedings of the Intelligent Systems Design and Applications: 18th International Conference on Intelligent Systems Design and Applications (ISDA 2018), Vellore, India, 6–8 December 2018; Volume 1, pp. 550–559. [Google Scholar]
- van der Velden, B.H.; Kuijf, H.J.; Gilhuijs, K.G.; Viergever, M.A. Explainable artificial intelligence (XAI) in deep learningbased medical image analysis. Med. Image Anal. 2022, 79, 102470. [Google Scholar] [CrossRef]
- Xu, M.; Papageorgiou, D.P.; Abidi, S.Z.; Dao, M.; Zhao, H.; Karniadakis, G.E. A deep convolutional neural network for classification of red blood cells in sickle cell anemia. PLoS Comput. Biol. 2017, 13, e1005746. [Google Scholar] [CrossRef]
- Gedefaw, L.; Liu, C.-F.; Ip, R.K.L.; Tse, H.-F.; Yeung, M.H.Y.; Yip, S.P.; Huang, C.-L. Artificial intelligence-assisted diagnostic cytology and genomic testing for hematologic disorders. Cells 2023, 12, 1755. [Google Scholar] [CrossRef]
- Ilyas, S.; Simonson, A.E.; Asghar, W. Emerging point-of-care technologies for sickle cell disease diagnostics. Clin. Chim. Acta 2020, 501, 85–91. [Google Scholar] [CrossRef]
- Butt, M.; de Keijzer, A. Using Transfer Learning to Train a Binary Classifier for Lorrca Ektacytometery Microscopic Images of Sickle Cells and Healthy Red Blood Cells. Data 2022, 7, 126. [Google Scholar] [CrossRef]
- Alzubaidi, L.; Fadhel, M.A.; AlShamma, O.; Zhang, J.; Duan, Y. Deep learning models for classification of red blood cells in microscopy images to aid in sickle cell anemia diagnosis. Electronics 2020, 9, 427. [Google Scholar] [CrossRef]
- Gao, W.; Li, M.; Wu, R.; Du, W.; Zhang, S.; Yin, S.; Chen, Z.; Huang, H. The design and application of an automated microscope developed based on deep learning for fungal detection in dermatology. Mycoses 2021, 64, 245–251. [Google Scholar] [CrossRef]
- Salido, J.; Toledano, P.T.; Vallez, N.; Deniz, O.; Ruiz-Santaquiteria, J.; Cristobal, G.; Bueno, G.; Vallez, J. MicroHikari3D: An automated DIY digital microscopy platform with deep learning capabilities. Biomed. Opt. Express 2021, 12, 7223–7243. [Google Scholar] [CrossRef]


Disclaimer/Publisher’s Note: The statements, opinions and data contained in all publications are solely those of the individual author(s) and contributor(s) and not of MDPI and/or the editor(s). MDPI and/or the editor(s) disclaim responsibility for any injury to people or property resulting from any ideas, methods, instructions or products referred to in the content. |
© 2024 by the authors. Licensee MDPI, Basel, Switzerland. This article is an open access article distributed under the terms and conditions of the Creative Commons Attribution (CC BY) license (https://creativecommons.org/licenses/by/4.0/).