
Extended Isolation Forest for Intrusion Detection in Zeek Data

Abstract
:1. Introduction
2. Related Works
Gaps in the Literature
- Optimization of Isolation Level: While many studies have demonstrated the efficacy of EIF in various contexts, there is a lack of comprehensive research focusing on the optimization of isolation levels within the algorithm. Isolation levels are crucial as they directly influence the algorithm’s ability to accurately detect anomalies. Our research addresses this gap by systematically exploring and determining the optimal isolation levels for the EIF algorithm, thus improving its performance in detecting malicious activities in network traffic.
- Real-Time Application in High-Dimensional, Large-Scale Datasets: Although some studies have applied EIF to high-dimensional datasets, the focus on real-time application in large-scale network traffic data remains limited. Our research leverages the Apache Spark framework and Hadoop Distributed File System (HDFS) to handle and analyze extensive network data in real time, demonstrating the practicality and scalability of EIF in such contexts.
- Specific Focus on Network Traffic Anomalies: Previous works have often focused on broader applications of EIF without a concentrated effort on network traffic anomalies, particularly those associated with IoT devices. Our study uniquely targets this area by using the UWF-ZeekDataFall22 dataset and focusing on critical adversary tactics, such as Reconnaissance, Discovery, and Resource Development, as defined by the MITRE ATT&CK framework.
3. Background
3.1. What Is an Anomaly
3.2. Anomaly Score
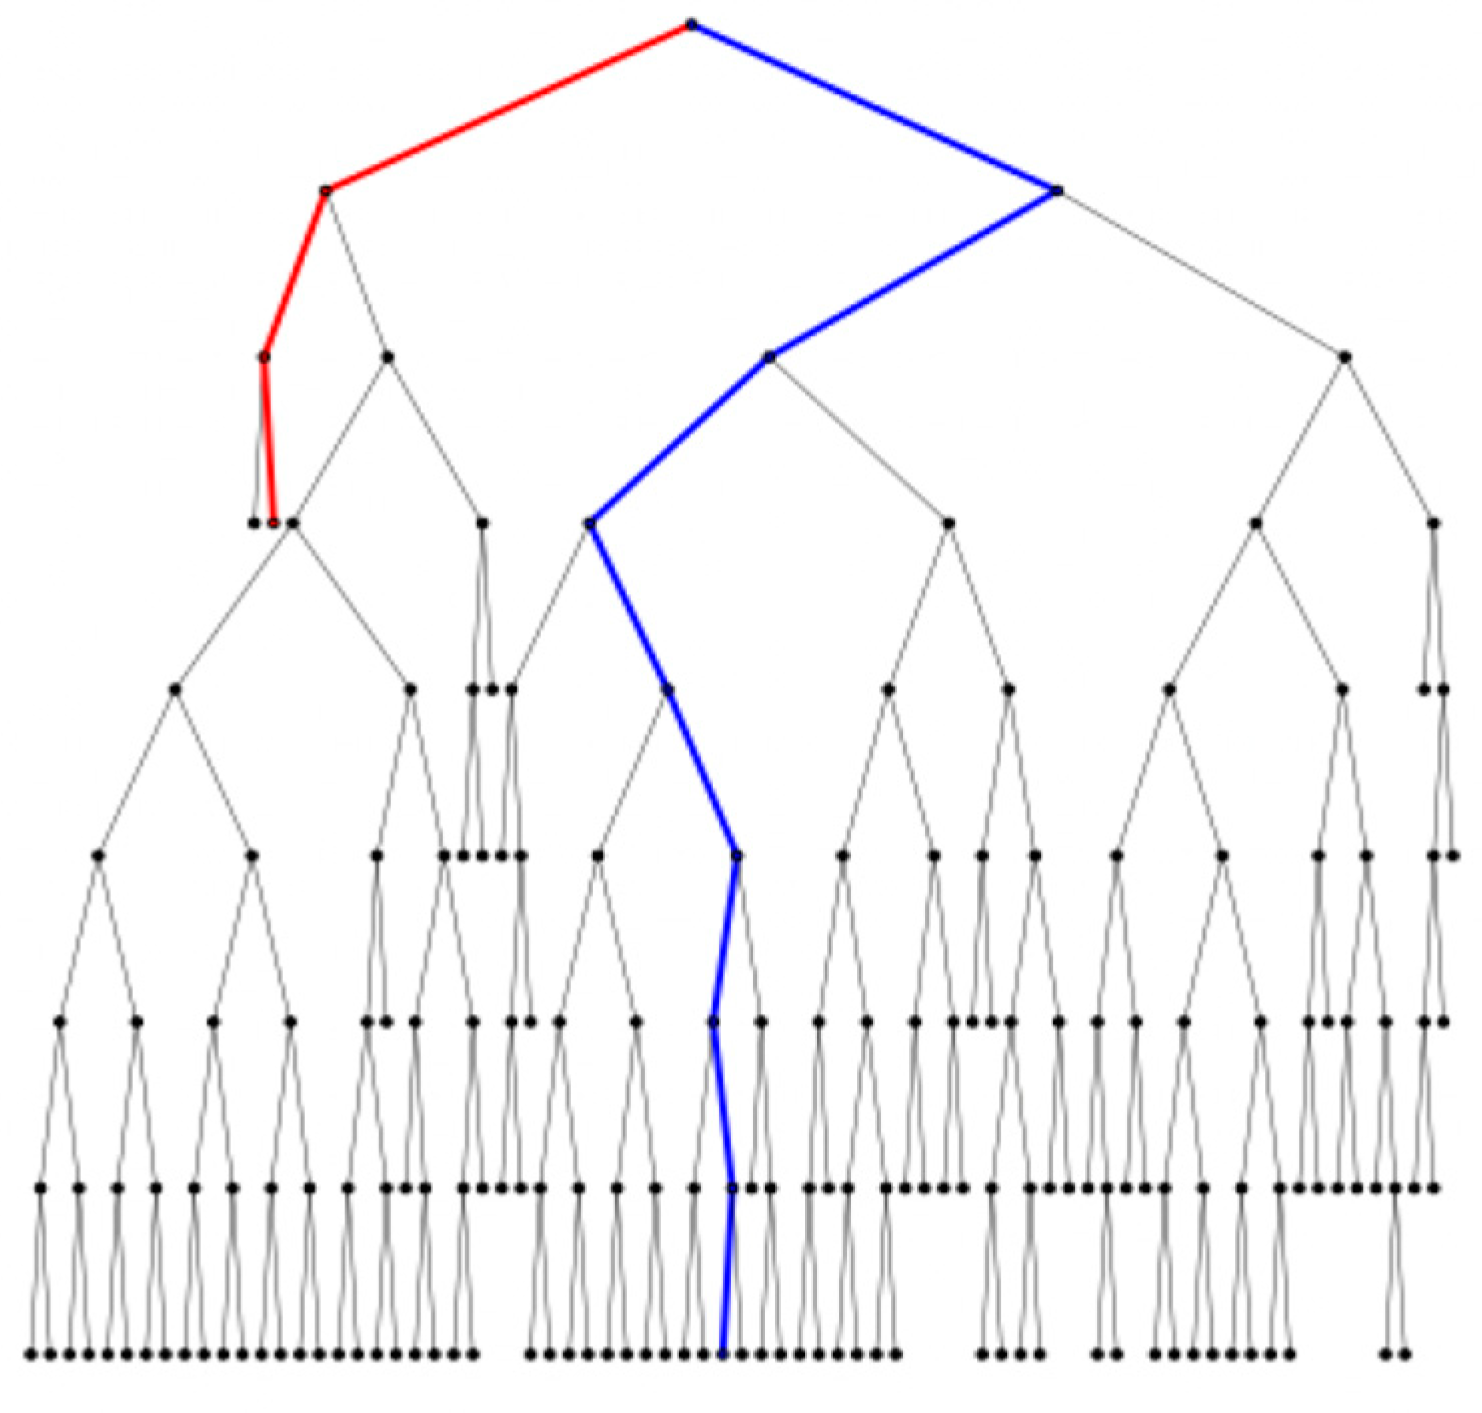
3.3. Isolation Forest
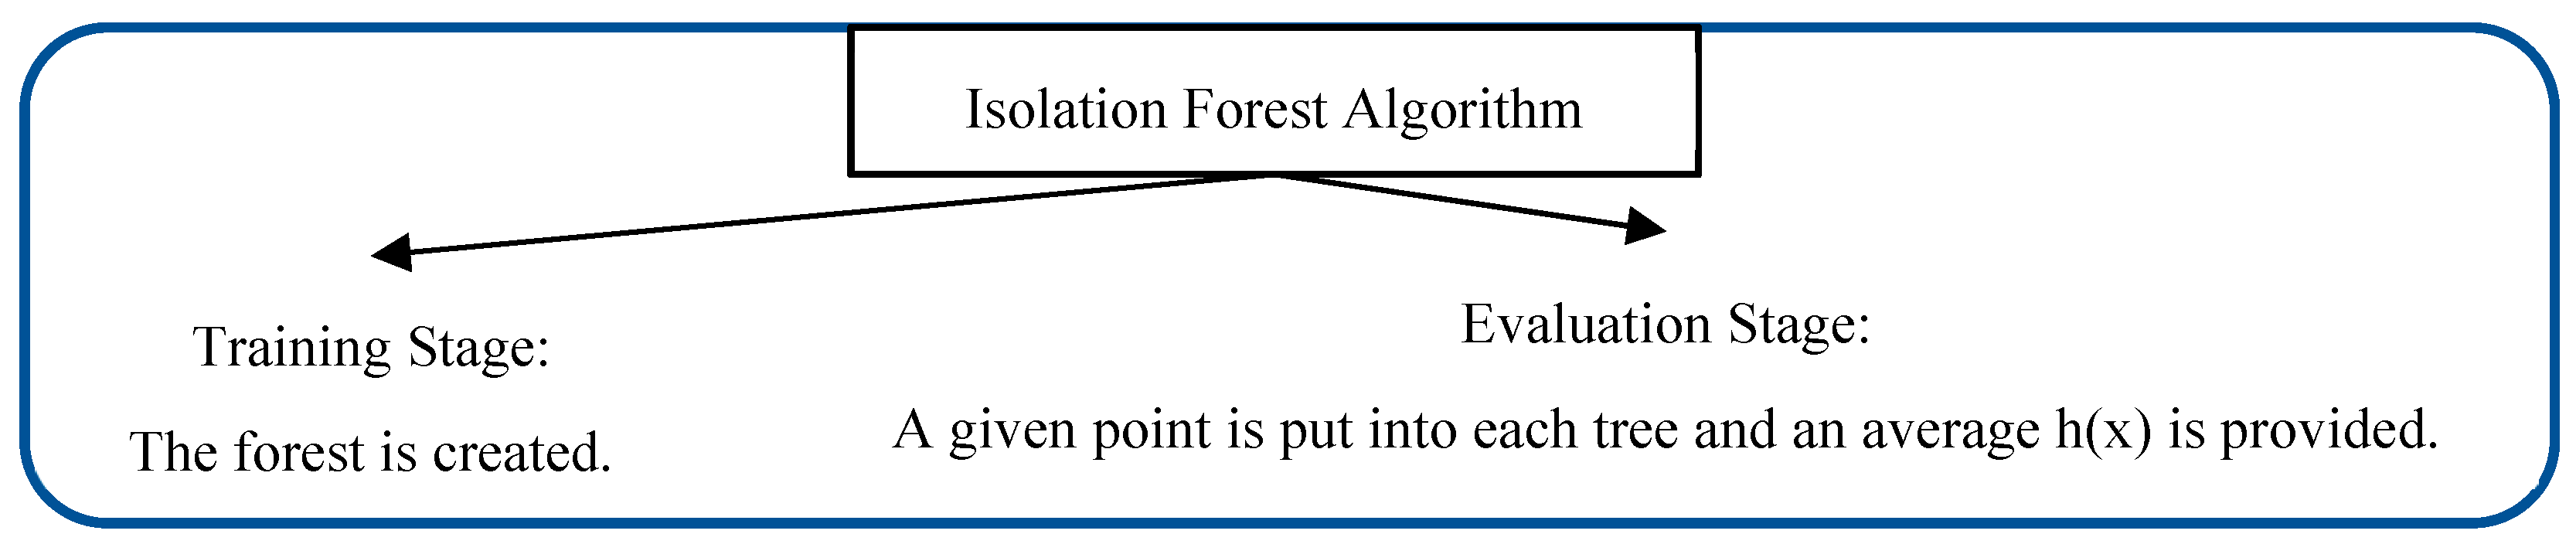
3.3.1. Algorithm
Training Stage
| Algorithm 1. iForest(X, t, ψ) |
| .Require: X—input data, t—number of trees, ψ—sub-sampling size |
| Ensure: a set of t iTrees |
| 1: Initialize Forests |
| 2: set height limit l = ceiling(log2 ψ) |
| 3: for i = 1 to t do |
| 4: X′ ← sample(X, ψ) |
| 5: Forest ← Forest ∪ iTree(X′, 0, 1) |
| 6: end for |
| 7: return Forest |
| Algorithm 2. iTree(X, e, l) |
| Require: X—input data, e—current tree height, l—height limit |
| Ensure: an iTree |
| 1: if e ≥ l or |X| ≤ 1 then |
| 2: return exNode{Size ← |X|} |
| 3: else |
| 4: let Q be a list of attributes in X |
| 5: randomly select an attribute q ∊ Q |
| 6: randomly select a split point p from max and min values of attribute q in X |
| 7: Xl ← filter(X, q ≤ p) |
| 8: Xl ← filter(X, q > p) |
| 9: return inNode{Left ← iTree(Xl, e + 1, l), Right ← iTree(Xr, e + 1, l), SplitAtt ← q, SplitValue ← p} |
| 10: end if |
Evaluation Stage
| Algorithm 3. PathLength(, T, e) |
| Require: —an instance, T—an iTree, e—current path length; to be initialized to zero when first called |
| Ensure: path length of |
| 1: if T is an external node then |
| 2: return e + c(T.size) |
| 3: end if |
| 4: a ← T.splitAtt |
| 5: if xa ≤ T.splitValue then |
| 6: return PathLength(, T.left, e + 1) |
| 7: else xa > T.splitValue |
| 8: return PathLength(, T.right, e + 1) |
| 9: end if |
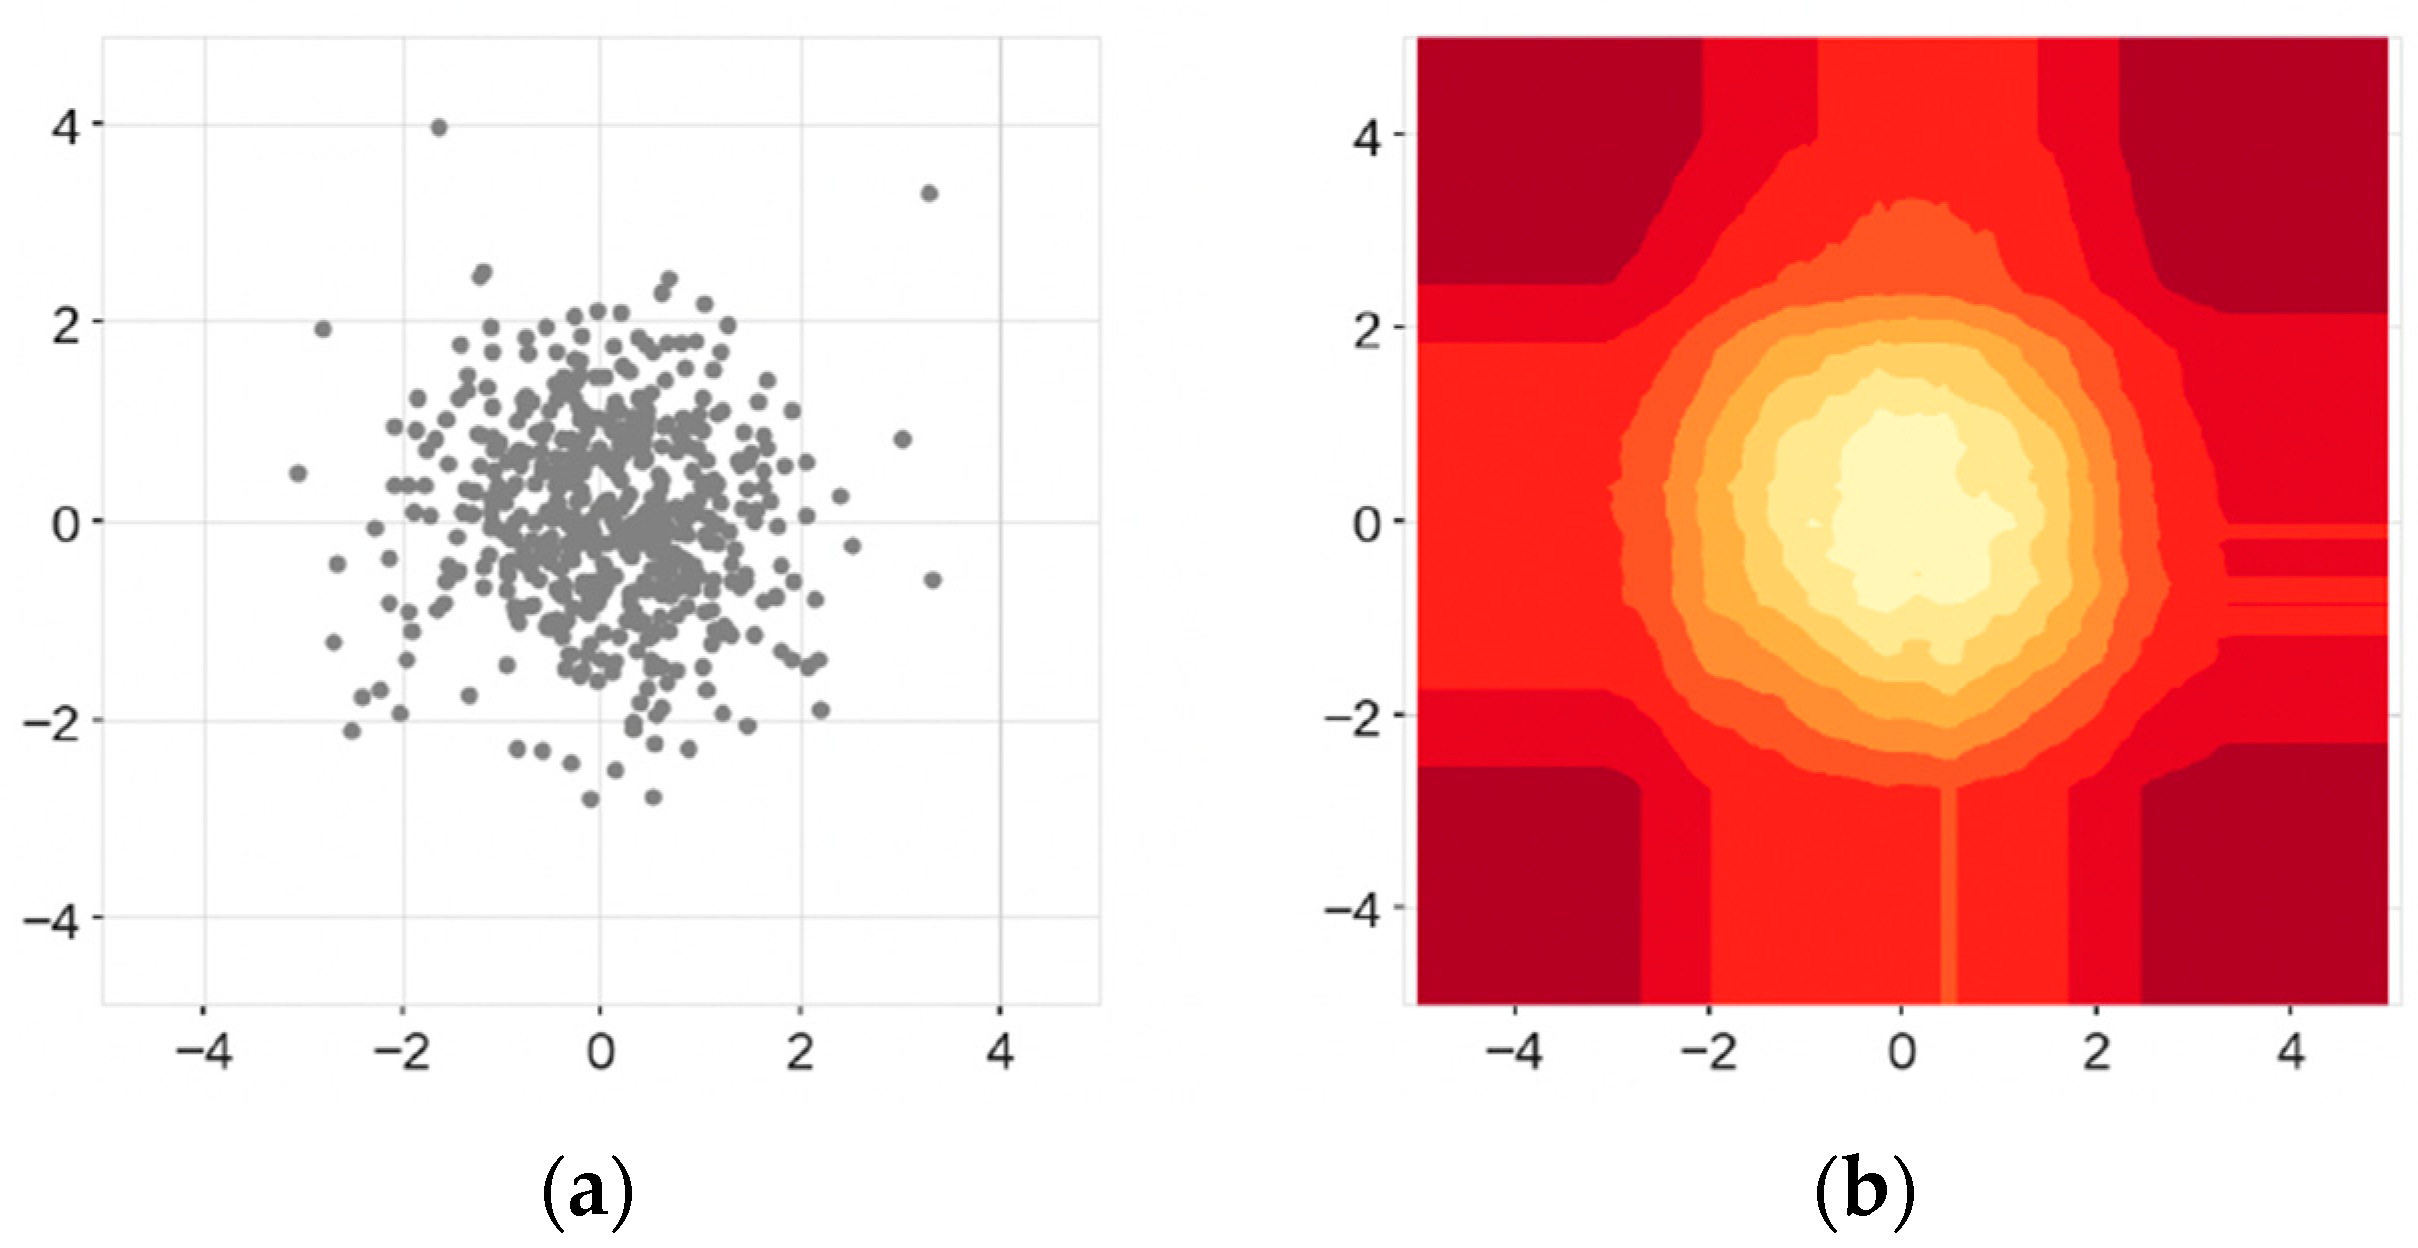
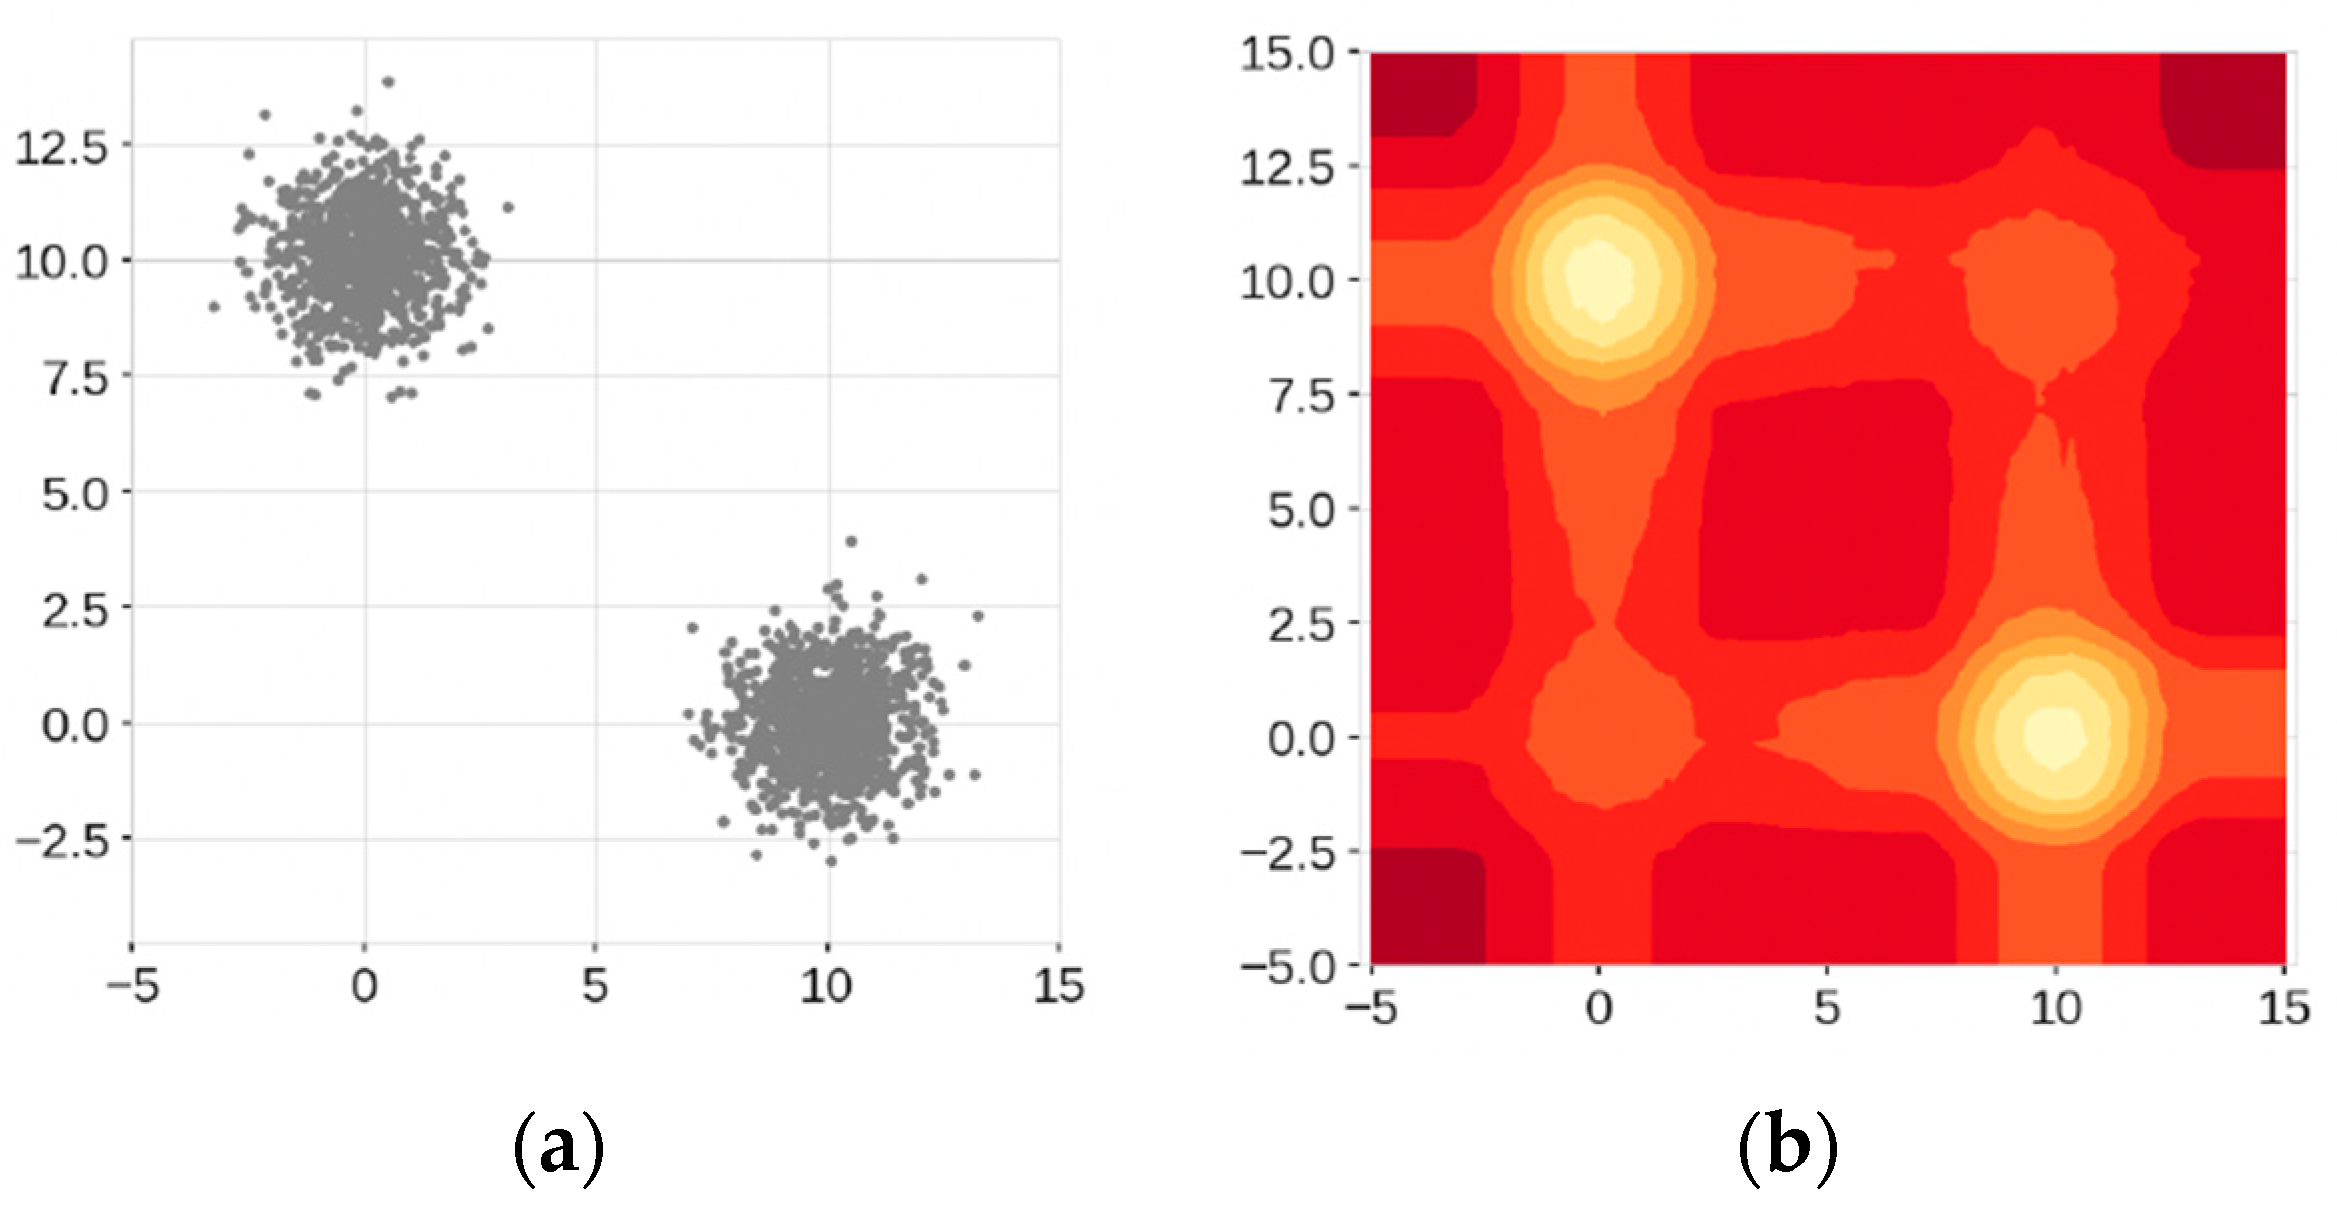
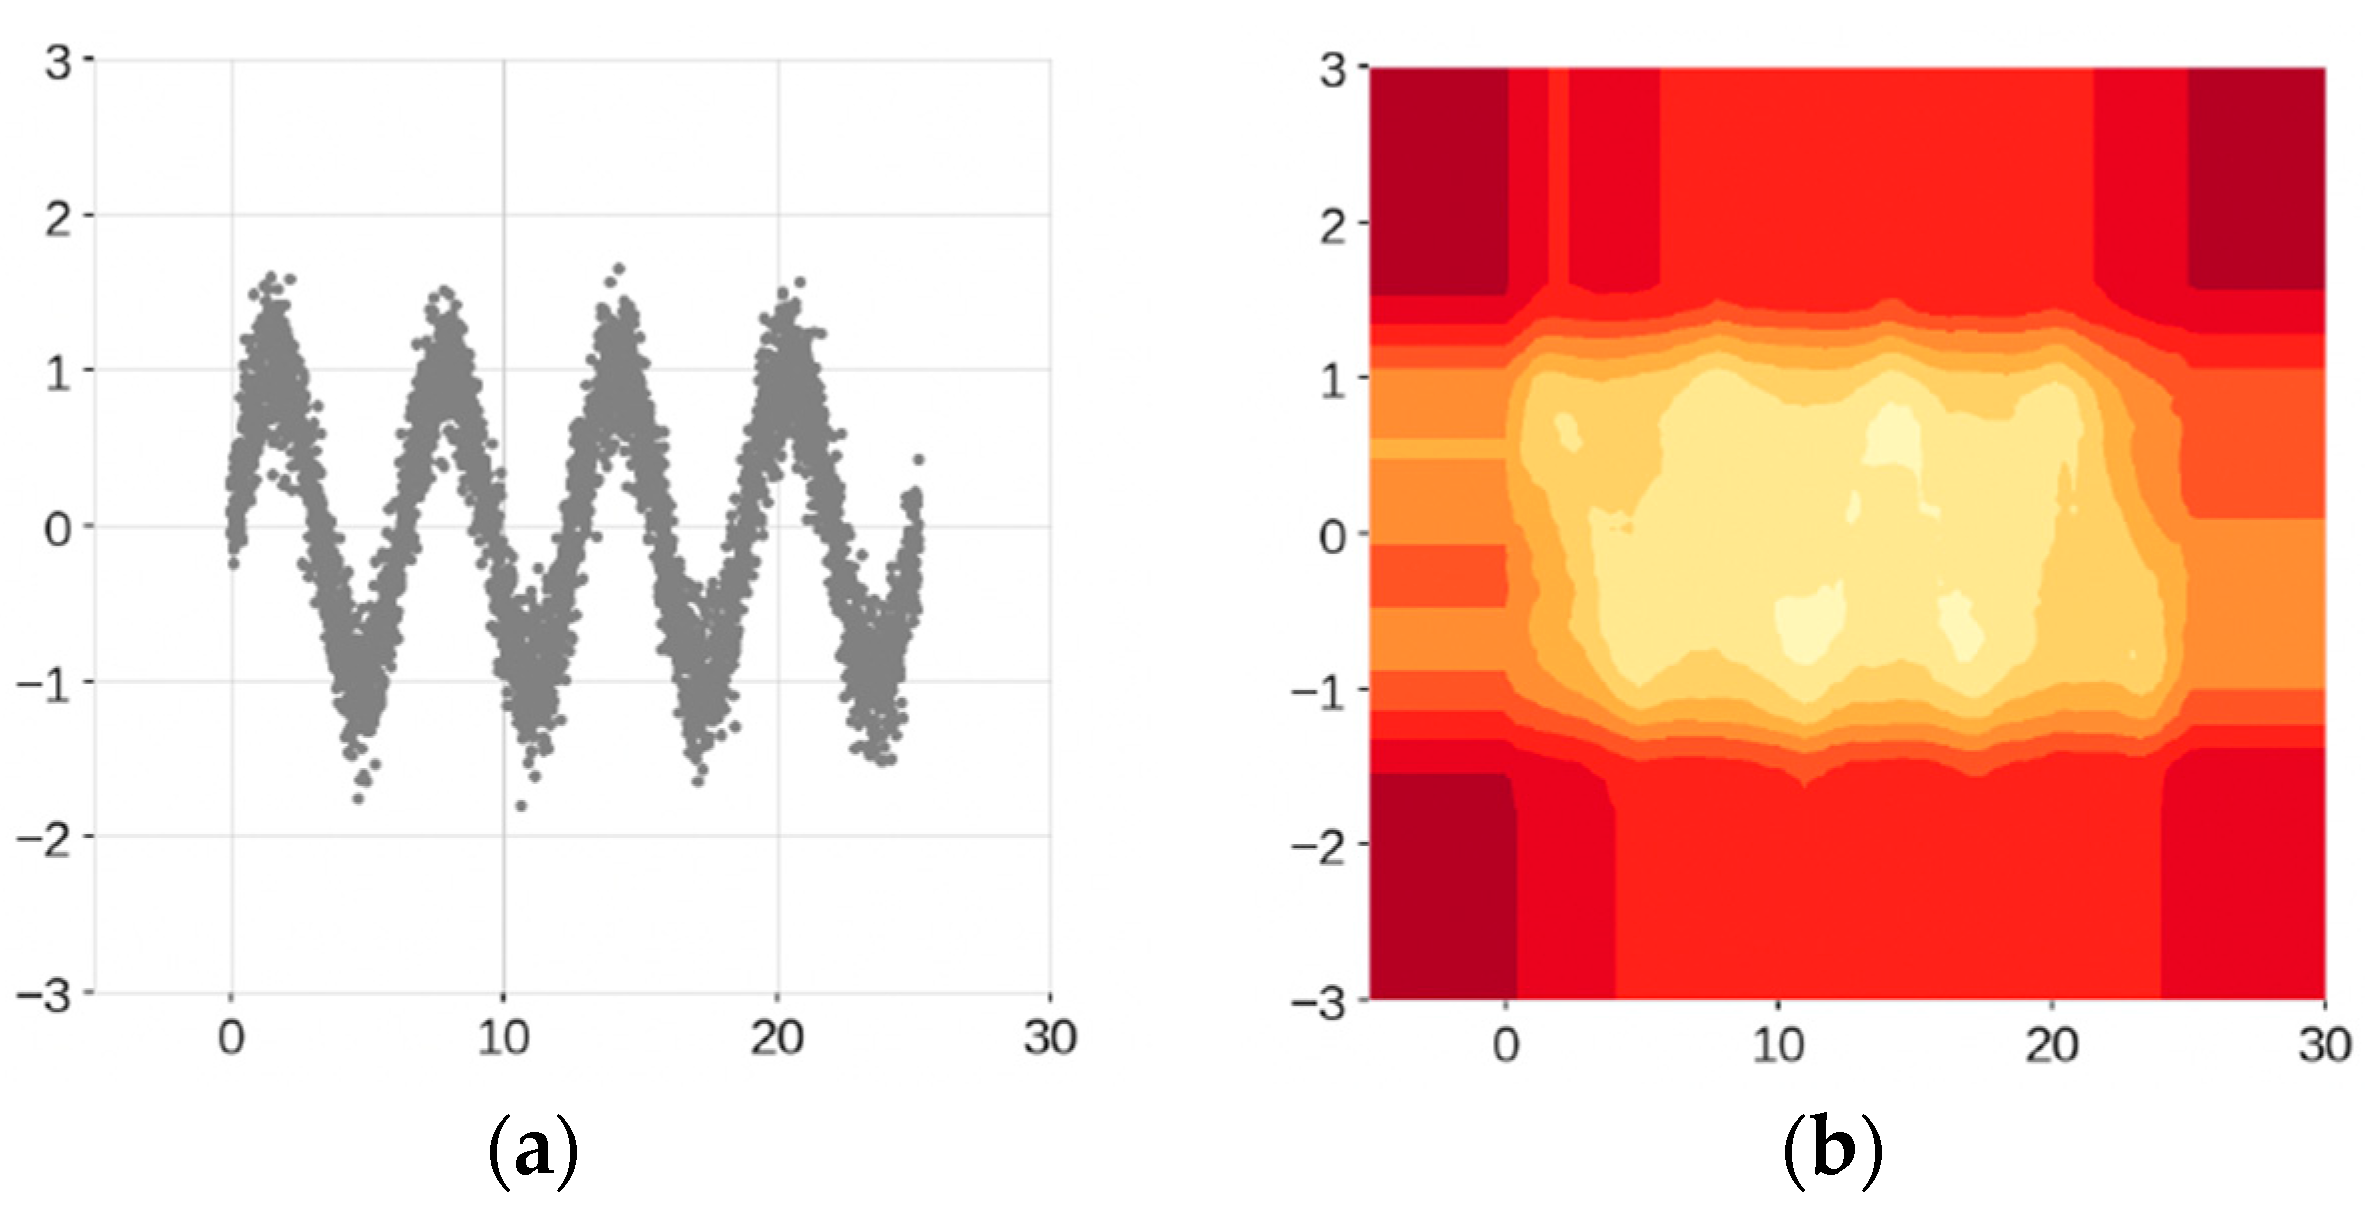
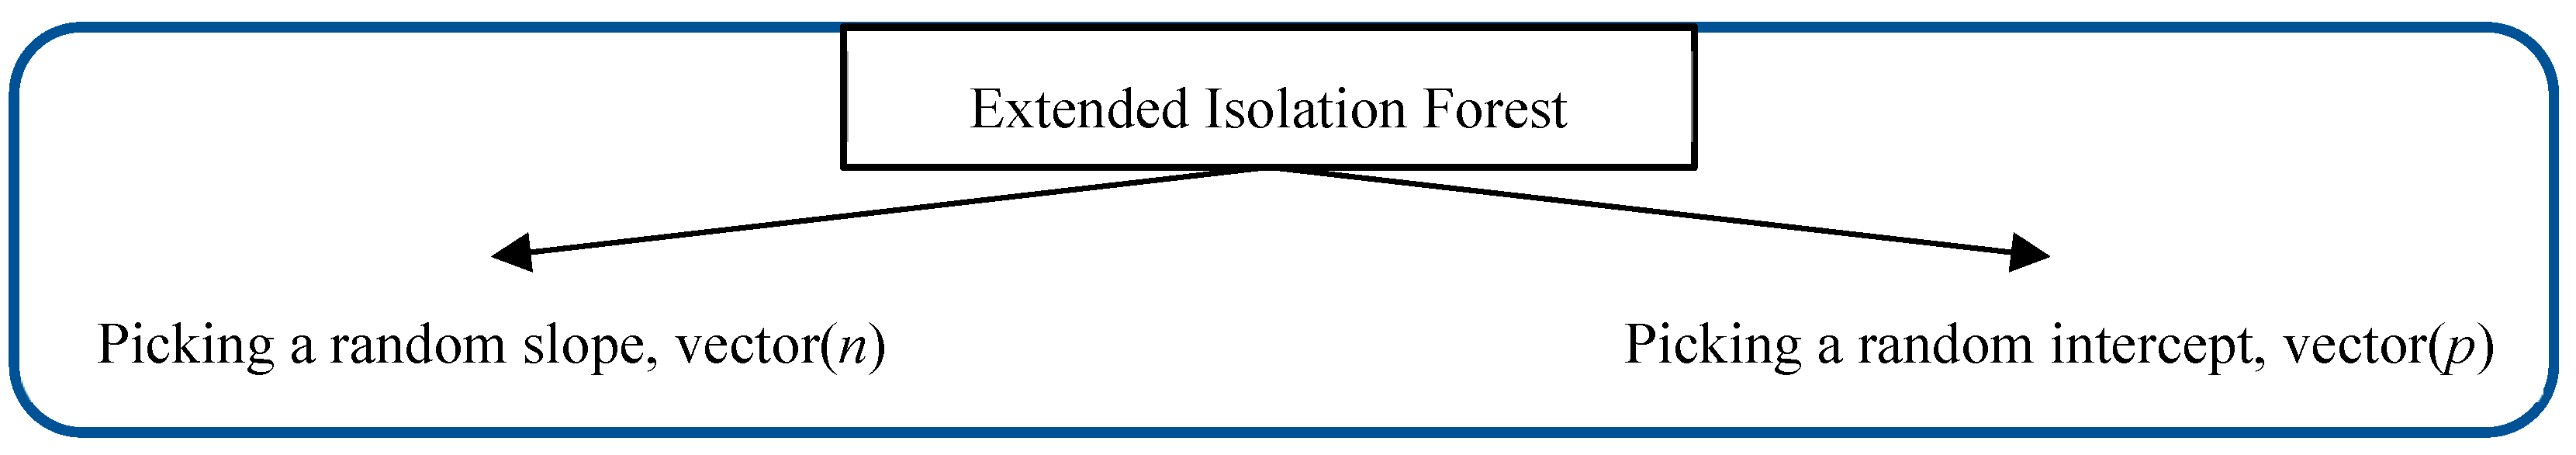
3.4. Extended Isolation Forest
- Improved Detection of Complex Anomalies: EIF can better isolate outliers in high-dimensional data, which is common in network traffic. This is because the random slopes in the cuts allow the algorithm to adapt to complex structures in the data, making it more effective at identifying subtle anomalies that might be missed by traditional methods [21].
- Reduction of False Positives: By mitigating the bias inherent in the branching process of traditional Isolation Forests, EIF reduces the occurrence of false positives. This is crucial in network traffic analysis where high false positive rates can lead to unnecessary alerts and increased workload for security analysts [21].
- Scalability and Efficiency: Like the traditional Isolation Forest, EIF is computationally efficient and scalable. This makes it suitable for real-time intrusion detection systems that need to process large volumes of network traffic quickly [21].
3.4.1. Branching in Extended Isolation Forest
3.4.2. Extension Levels
3.5. Our Extended Isolation Forest Algorithm
3.5.1. Training Stage
3.5.2. Evaluation Stage
4. The Data: UWF-ZeekDataFall22
- Reconnaissance (T1590): This initial phase involves gathering information about potential targets through activities like OSINT, vulnerability scanning, and probing for weaknesses. Analyzing reconnaissance data provides early warning signs of cyber threats and helps fortify defenses.
- Resource Development (T1589): In this stage, attackers acquire tools, techniques, and infrastructure required for the attack, such as custom malware and command-and-control (C2) infrastructure. Analyzing resource development data reveals the types of tools and methods used by attackers, aiding in identifying potential threat vectors.
- Discovery (T1087): After the initial compromise, attackers explore the target environment to understand its layout and locate sensitive information. Activities in this stage include system enumeration, scanning for network shares, and probing for vulnerable services. Analyzing discovery data detects unauthorized access attempts and lateral movement within the network.
4.1. Data Description
4.2. Preprocessing
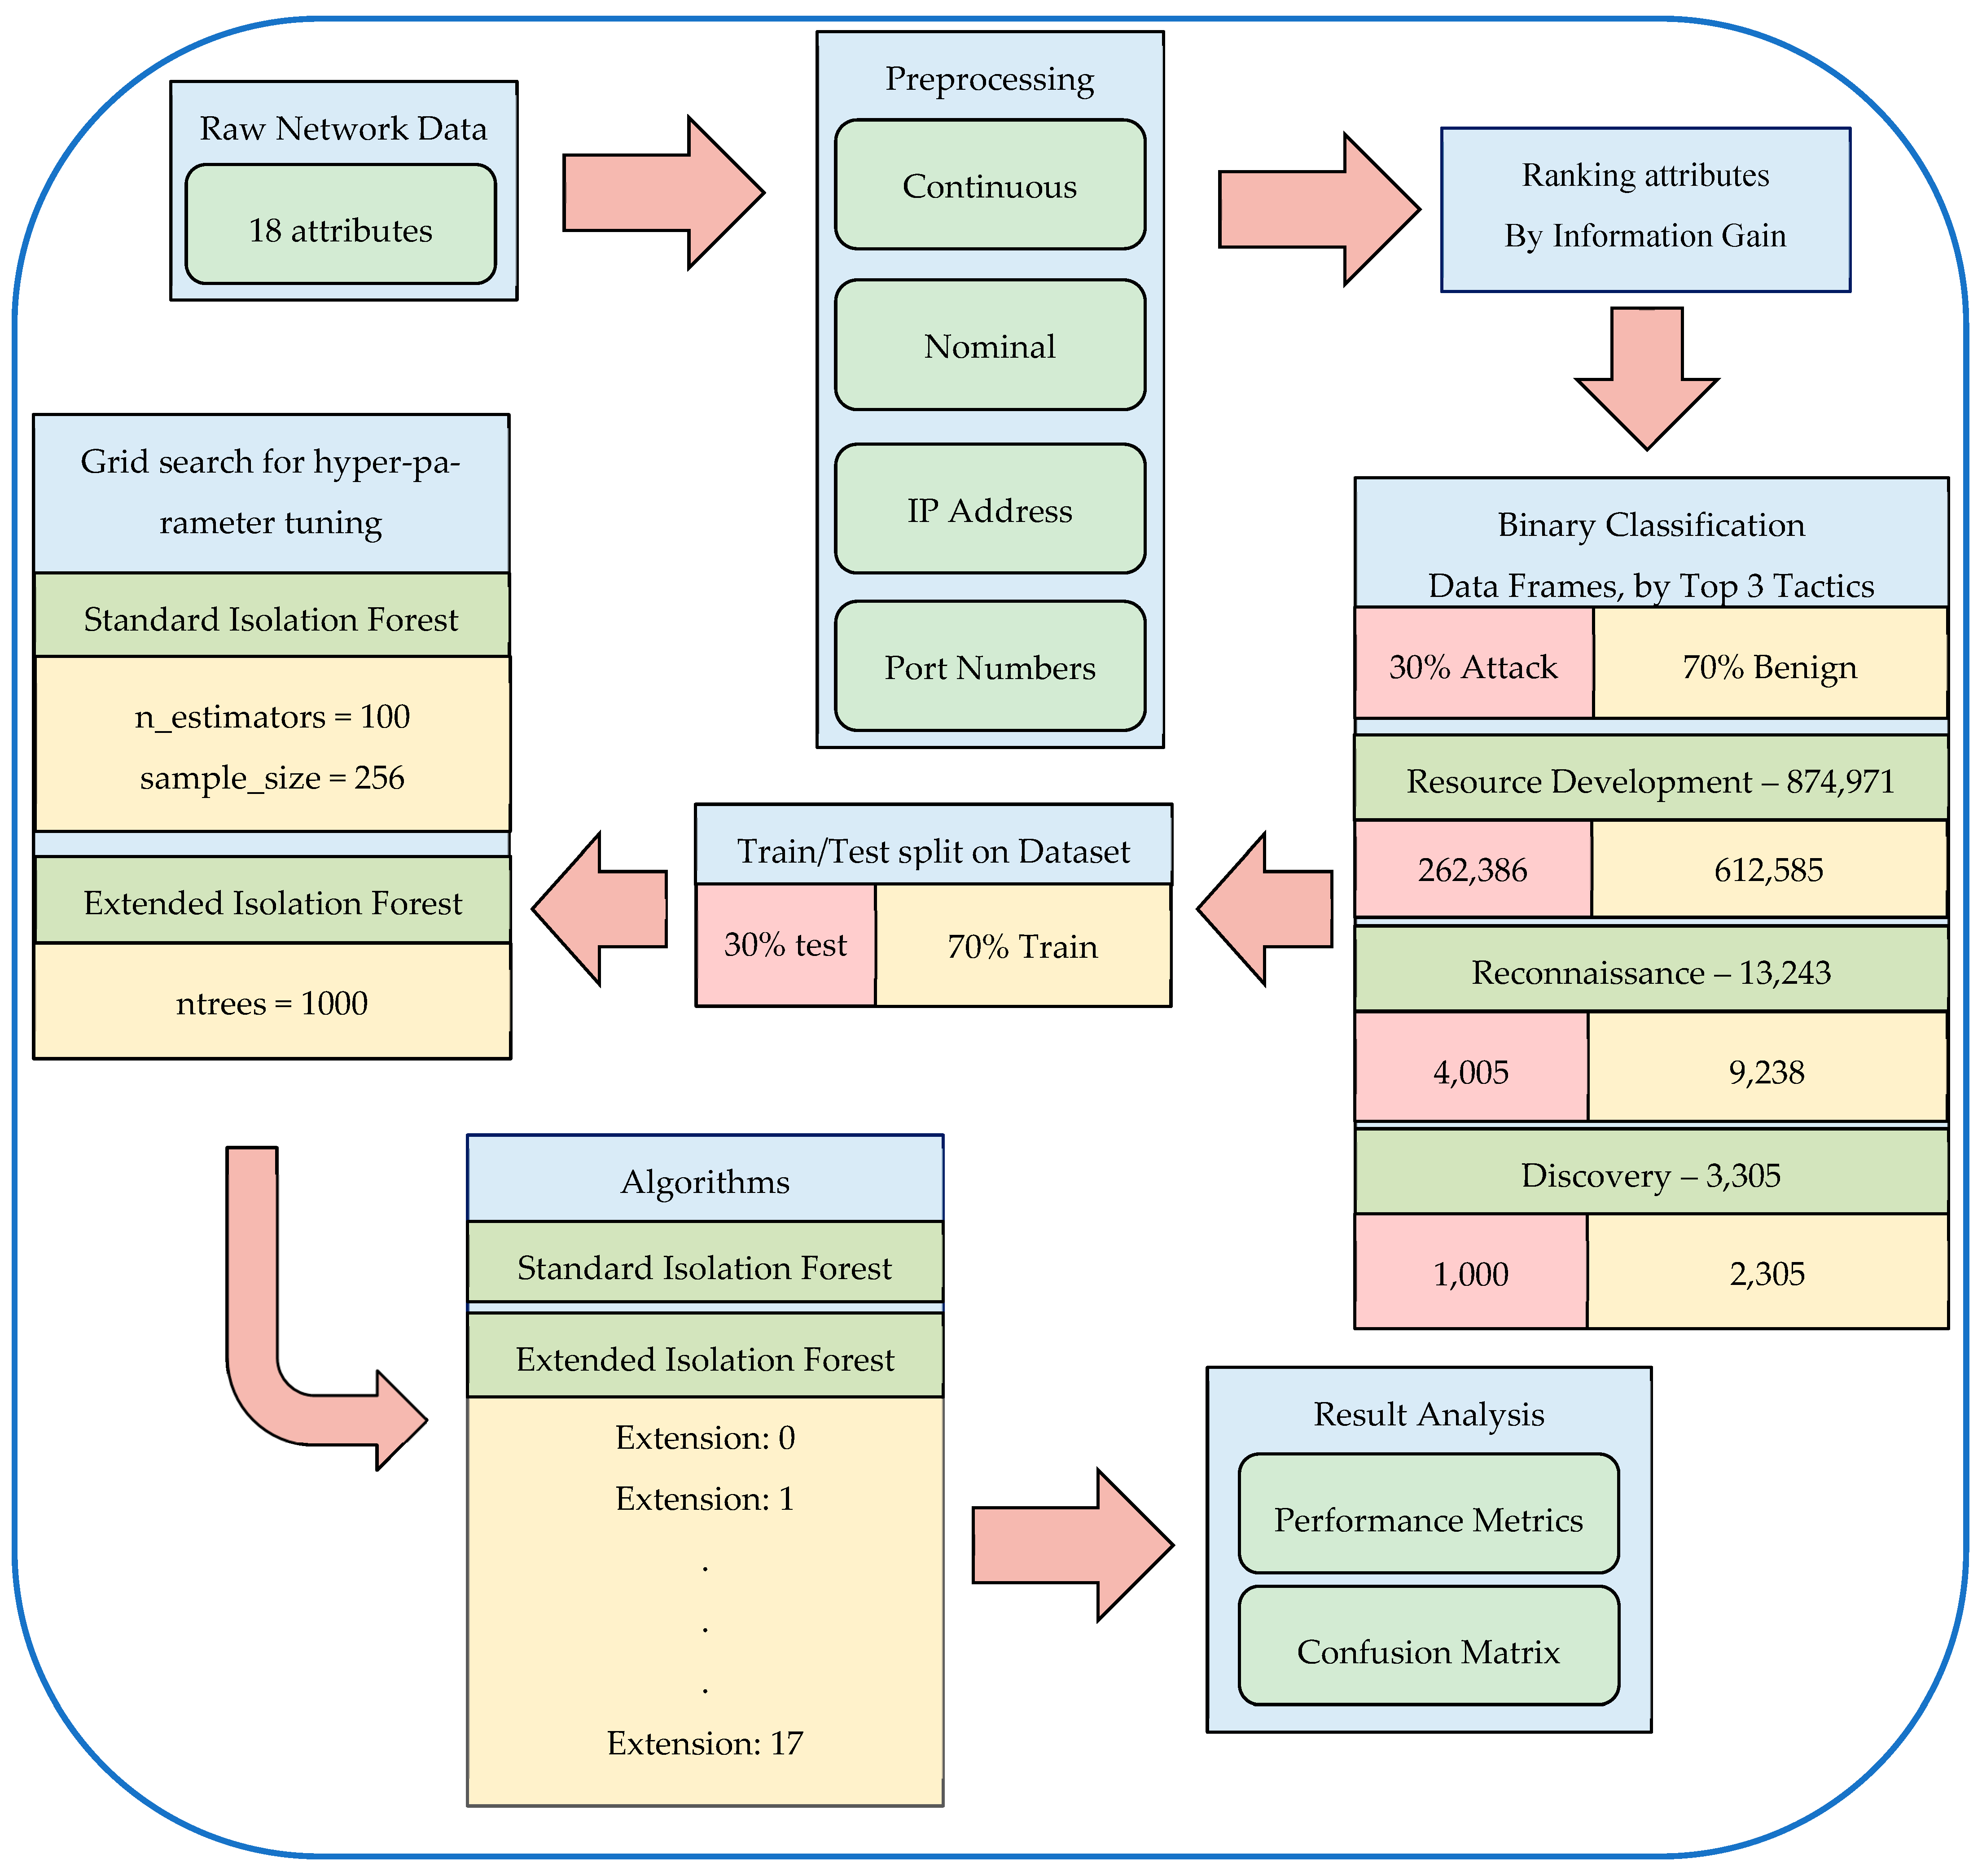
5. Methodology
5.1. Libraries
5.2. Hyperparameter Tuning
5.3. Varying Extension Level
6. Results
6.1. Performance Metrics
6.1.1. Accuracy
6.1.2. Precision (Positive Predictive Value)
6.1.3. Recall (Sensitivity, True Positive Rate (TPR))
6.1.4. F1 Score
6.1.5. Specificity (True Negative Rate (TNR))
6.2. Results
6.2.1. Resource Development
6.2.2. Reconnaissance
6.2.3. Discovery
7. Conclusions
8. Future Work
Author Contributions
Funding
Institutional Review Board Statement
Informed Consent Statement
Data Availability Statement
Conflicts of Interest
References
- University of West Florida UWF-ZeekData22. Available online: https://datasets.uwf.edu/ (accessed on 2 August 2023).
- Trellix What Is the MITRE ATT&CK Framework? Available online: https://www.trellix.com/en-us/security-awareness/cybersecurity/what-is-mitre-attack-framework.html (accessed on 1 October 2023).
- Reconnaissance, Tactic TA0043—Enterprise|MITRE ATT&CK®. Available online: https://attack.mitre.org/tactics/TA0043/ (accessed on 8 October 2023).
- Discovery, Tactic TA0007—Enterprise|MITRE ATT&CK®. Available online: https://attack.mitre.org/tactics/TA0007/ (accessed on 8 October 2023).
- Resource Development, Tactic TA0042—Enterprise|MITRE ATT&CK®. Available online: https://attack.mitre.org/tactics/TA0042/ (accessed on 8 October 2023).
- Guller, M. Big Data Analytics with Spark: A Practitioner’s Guide to Using Spark for Large Scale Data Analysis; Apress: New York, NY, USA, 2015. [Google Scholar]
- Configuration—SPArK 3.3.0 Documentation. Available online: https://spark.apache.org/docs/3.3.0/configuration.html (accessed on 20 September 2023).
- Liu, F.T.; Ting, K.M.; Zhou, Z.-H. Isolation Forest. In Proceedings of the 2008 Eighth IEEE International Conference on Data Mining, Pisa, Italy, 15–19 December 2008. [Google Scholar] [CrossRef]
- Chen, T.; Ren, K.; Wu, S. Time Series Anomaly Detection with Isolation Forest. In Proceedings of the IEEE International Conference on Big Data, Los Angeles, CA, USA, 9–12 December 2019. [Google Scholar]
- Sharma, A.; Madhav, N.; Sharma, S.K.; Chen, Y. Extended Isolation Forest for Advanced Persistent Threat Detection. In Proceedings of the IEEE Symposium on Security and Privacy Workshops (SPW), San Francisco, CA, USA, 22–26 May 2022. [Google Scholar]
- Li, S.; Zhang, J.; Liu, Y.; Jiang, X. Extended Isolation Forest. In Proceedings of the ACM SIGKDD International Conference on Knowledge Discovery and Data Mining (KDD), Halifax, NS, Canada, 13–17 August 2017. [Google Scholar]
- Fan, S.; Qin, Y.; Yao, J. An Anomaly Detection Method for Network Security Based on Improved Isolation Forest and SOM Clustering Algorithm. IEEE Access 2021, 9, 13944–13954. [Google Scholar]
- Zhou, L.; Ding, B.; Xiong, W.; Zhu, Y. An Intrusion Detection Method Based on Extended Isolation Forest Algorithm in Industrial Control Systems. In Proceedings of the 14th IEEE Conference on Industrial Electronics and Applications (ICIEA), Xi’an, China, 19–21 June 2019. [Google Scholar]
- Thangaraj, P.; Gopalakrishnan, S.; Letchumanan, K. Enhanced Extended Isolation Forest for Intrusion Detection in Software Defined Networks. Procedia Comput. Sci. 2020, 173, 1750–1756. [Google Scholar]
- Huang, M.; Wu, S.; Chen, T. An Efficient Random Forest Extended Isolation Algorithm for Anomaly Detection. IEEE Access 2019, 7, 1127244–1127256. [Google Scholar]
- Liu, T.; Zhou, Z.; Yang, L. Layered isolation forest: A multi-level subspace algorithm for improving isolation forest. J. Big Data 2024, 11, 34. [Google Scholar] [CrossRef]
- Wu, Z.; Niu, W.; Zhao, Y.; Fan, H. Application of extended isolation forest in avionics equipment fault diagnosis. IEEE Trans. Aerosp. Electron. Syst. 2024, 60, 78–90. [Google Scholar]
- Chandola, V.; Banerjee, A.; Kumar, V. Anomaly detection: A survey. ACM Comput. Surv. CSUR 2009, 41, 1–58. [Google Scholar] [CrossRef]
- Hodge, V.J.; Austin, J. A survey of outlier detection methodologies. Artif. Intell. Rev. 2004, 22, 85–126. [Google Scholar] [CrossRef]
- Liu, F.T.; Ting, K.M.; Zhou, Z.H. Isolation-based anomaly detection. ACM Trans. Knowl. Discov. Data TKDD 2012, 6, 1–39. [Google Scholar] [CrossRef]
- Hariri, S.; Kind, M.; Brunner, R.J. Extended Isolation Forest. In Proceedings of the 2019 IEEE International Conference on Data Mining (ICDM), Beijing, China, 8–11 November 2019; pp. 398–406. [Google Scholar]
- Bagui, S.; Mink, D.; Bagui, S.; Ghosh, T.; McElroy, T.; Paredes, E.; Khasnavis, N.; Plenkers, R. Detecting Reconnaissance and Discovery Tactics from the MITRE ATT&CK Framework in Zeek Conn Logs Using Spark’s Machine Learning in the Big Data Framework. Sensors 2022, 22, 7999. [Google Scholar] [CrossRef] [PubMed]
- Han, J.; Pei, J.; Tong, H. Data Mining: Concepts and Techniques, 3rd ed.; Morgan Kaufmann: Burlington, MA, USA, 2022. [Google Scholar]

| Tactics | Count |
|---|---|
| None (benign data) | 3,509,406 |
| Resource Development | 262,386 |
| Reconnaissance | 4005 |
| Discovery | 1000 |
| Execution | 5 |
| Command and Control | 2 |
| Lateral Movement | 2 |
| Defense Evasion | 2 |
| Persistence, Priv… | 2 |
| Initial Access | 1 |
| Attribute No. | Attribute | Info Gain |
|---|---|---|
| 1 | History | 0.827 |
| 2 | Protocol | 0.77 |
| 3 | Service | 0.726 |
| 4 | Orig_bytes | 0.724 |
| 5 | Dest_ip | 0.674 |
| 6 | Orig_pkts | 0.655 |
| 7 | Orig ip bytes | 0.572 |
| 8 | Local_resp | 0.524 |
| 9 | Dest_port | 0.486 |
| 10 | Duration | 0.386 |
| 11 | Conn_state | 0.166 |
| 12 | Resp_pkts | 0.085 |
| 13 | Resp_ip_bytes | 0.065 |
| 14 | Src_port | 0.008 |
| 15 | Resp_bytes | 0.008 |
| 16 | Src_ip | 0.007 |
| 17 | Local_orig | 0.002 |
| 18 | missed bytes | 0 |
| Scores | IF | EIF-0 | EIF-1 | EIF-2–17 |
|---|---|---|---|---|
| Accuracy | 0.592 | 0.823 | 0.702 | 0.5599 |
| Precision | 0.298 | 0.704 | 0.503 | 0.2663 |
| Recall (TPR) | 0.266 | 0.705 | 0.503 | 0.2664 |
| F1 Score | 0.281 | 0.705 | 0.503 | 0.2663 |
| Specificity (TNR) | 0.732 | 0.873 | 0.787 | 0.6856 |
| Scores | IF | EIF-0 | EIF-1,2 | EIF-3,4 | EIF-5–17 |
|---|---|---|---|---|---|
| Accuracy | 0.5302 | 0.8221 | 0.8158 | 0.6526 | 0.5258 |
| Precision | 0.2169 | 0.7075 | 0.697 | 0.4251 | 0.2137 |
| Recall (TPR) | 0.212 | 0.7019 | 0.6914 | 0.4217 | 0.212 |
| F1 Score | 0.2144 | 0.7047 | 0.6942 | 0.4234 | 0.2128 |
| Specificity (TNR) | 0.2169 | 0.7075 | 0.697 | 0.697 | 0.4251 |
| Scores | IF | EIF 0,1 | EIF 2–17 |
|---|---|---|---|
| Accuracy | 0.531 | 0.783 | 0.5305 |
| Precision | 0.206 | 0.6263 | 0.2059 |
| Recall (TPR) | 0.211 | 0.642 | 0.211 |
| F1 Score | 0.209 | 0.6341 | 0.2084 |
| Specificity (TNR) | 0.661 | 0.8413 | 0.6628 |
Disclaimer/Publisher’s Note: The statements, opinions and data contained in all publications are solely those of the individual author(s) and contributor(s) and not of MDPI and/or the editor(s). MDPI and/or the editor(s) disclaim responsibility for any injury to people or property resulting from any ideas, methods, instructions or products referred to in the content. |
© 2024 by the authors. Licensee MDPI, Basel, Switzerland. This article is an open access article distributed under the terms and conditions of the Creative Commons Attribution (CC BY) license (https://creativecommons.org/licenses/by/4.0/).
Share and Cite
Moomtaheen, F.; Bagui, S.S.; Bagui, S.C.; Mink, D. Extended Isolation Forest for Intrusion Detection in Zeek Data. Information 2024, 15, 404. https://doi.org/10.3390/info15070404
Moomtaheen F, Bagui SS, Bagui SC, Mink D. Extended Isolation Forest for Intrusion Detection in Zeek Data. Information. 2024; 15(7):404. https://doi.org/10.3390/info15070404
Chicago/Turabian StyleMoomtaheen, Fariha, Sikha S. Bagui, Subhash C. Bagui, and Dustin Mink. 2024. "Extended Isolation Forest for Intrusion Detection in Zeek Data" Information 15, no. 7: 404. https://doi.org/10.3390/info15070404