Article

Bridging Behavioral Insights and Automated Trading: An Internet of Behaviors Approach for Enhanced Financial Decision-Making

National School of Applied Sciences Khouribga, Sultan Moulay Slimane University, Khouribga 25000, Morocco
*
Author to whom correspondence should be addressed.
Information 2025, 16(5), 338; https://doi.org/10.3390/info16050338
Submission received: 5 March 2025 / Revised: 30 March 2025 / Accepted: 8 April 2025 / Published: 23 April 2025
(This article belongs to the Special Issue Artificial Intelligence and Decision Support Systems)

Abstract

:
Effective investment decision-making in today’s volatile financial market demands the integration of advanced predictive analytics, alternative data sources, and behavioral insights. This paper introduces an innovative Internet of Behaviors (IoB) ecosystem that integrates real-time data acquisition, advanced feature engineering, predictive modeling, explainability, automated portfolio management, and an intelligent decision support engine to enhance financial decision-making. Our framework effectively captures complex temporal dependencies in financial data by combining robust technical indicators and sentiment-driven metrics—derived from BERT-based sentiment analysis—with a multi-layer LSTM forecasting model. To enhance the model’s performance and transparency and foster user trust, we apply XAI methods, namely, TimeSHAP and TIME. The IoB ecosystem also proposes a portfolio management engine that translates the predictions into actionable strategies and a continuous feedback loop, enabling the system to adapt and refine its strategy in real time. Empirical evaluations demonstrate the effectiveness of our approach: the LSTM forecasting model achieved an RMSE of 0.0312, an MAE of 0.0250, an MSE of 0.0010, and a directional accuracy of 95.24% on TSLA stock returns. Furthermore, the portfolio management algorithm successfully transformed an initial balance of USD 15,000 into a final portfolio value of USD 21,824.12, yielding a net profit of USD 6824.12. These results highlight the potential of IoB-driven methodologies to revolutionize financial services by enabling more personalized, transparent, and adaptive investment solutions.

1. Introduction

Effective investment decision-making has become a critical challenge in today’s complex and rapidly evolving financial landscape. Investors are confronted with many choices in volatile market conditions and an ever-expanding pool of data sources [1]. Traditional methods, such as technical analysis based on historical price trends and fundamental analysis leveraging macroeconomic indicators, have long been the backbone of trading and investment strategies. However, these approaches often fall short when dealing with sudden market shifts or the subtleties of investor sentiment [2]. Consequently, there is a pressing need for innovative frameworks that integrate advanced predictive modeling, alternative data sources, and behavioral analytics to empower investors with more accurate, transparent, and adaptive decision-making tools [3,4]. Recent advancements in machine learning (ML) have paved the way for a paradigm shift in financial forecasting. Deep learning (DL) architectures, notably Long Short-Term Memory (LSTM) networks, have demonstrated remarkable proficiency in modeling time-series data, capturing intricate patterns traditional methods may overlook. Coupled with sentiment analysis powered by models like Bidirectional Encoder Representations from Transformers (BERT), these techniques provide a dual advantage: precise numerical forecasting and incorporating qualitative market sentiment derived from social media and other alternative sources [2]. This integration not only enhances predictive accuracy—by correlating sentiment scores with market trends—but also enables a more comprehensive understanding of the forces shaping stock movements [5,6]. The emergence of the Internet of Behaviors (IoB) further accentuates the potential of this integrated approach [7]. Collecting and analyzing behavioral data in real time, an IoB framework can reveal subtle investor patterns and market responses that traditional analytics might miss [8]. This research introduces a novel IoB ecosystem tailored specifically for financial portfolio management and trading. The multi-layered proposed system comprises stages for data acquisition and preprocessing, predictive analytics, dynamic portfolio management, and an intelligent decision support engine. Such an architecture enables the continuous refinement of investment strategies, incorporating automated techniques—such as stop-loss and take-profit mechanisms—to adapt swiftly to market changes while mitigating risk [9]. A key innovation of our approach lies in adopting Explainable Artificial Intelligence (XAI) frameworks. While complex models like LSTM and BERT can provide high predictive performance, they often operate as “black boxes”, leaving users uncertain about the underlying rationale of their forecasts [10]. XAI methods address this issue by elucidating the factors driving model predictions, fostering transparency and building trust among investors. This transparency is particularly crucial in the financial domain, where understanding the interplay between market data and investor sentiment can significantly impact decision-making processes [11]. Moreover, integrating behavioral data analytics into this ecosystem acknowledges the profound influence of cognitive biases and psychological factors on investment decisions [my finance ref]. Research in behavioral finance has shown that biases such as overconfidence and loss aversion can skew investor judgment, leading to suboptimal outcomes. By incorporating real-time behavioral indicators and sentiment metrics—derived from platforms like Twitter (despite its recent rebranding to “X”, we will still be referring to it as Twitter)—the proposed system can dynamically adjust portfolio strategies to better align with market sentiments and investor behaviors. Such a synthesis of quantitative and qualitative analyses optimizes financial returns and enhances investor confidence by demystifying the decision-making process [12].
The originality of this paper is in the proposal a novel, comprehensive IoB ecosystem that synergizes advanced deep learning models, sentiment analysis, XAI, and behavioral data analytics to revolutionize financial forecasting and portfolio management. By bridging the gap between raw market data and the nuanced realm of investor psychology, our approach aspires to deliver a robust, transparent, and adaptive decision support system. This system aims to improve the accuracy of financial predictions and the overall quality of investment decision-making, ultimately contributing to more resilient financial strategies in an increasingly data-driven world [2]. The remainder of this paper is structured as follows: Section 2 presents a literature review. Section 3 describes the methodology of this study, including the key phases (e.g., IoB ecosystem workflow, data collection process, BERT-based sentiment analysis, feature engineering, model design, and XAI process). Section 4 presents the results of our study and thoroughly discusses them. Section 5 concludes our paper by summarizing its insights and proposing potential future research directions.

2. Literature Review

Time-series analysis plays a pivotal role in financial forecasting by enabling the identification of trends and patterns in historical data [13]. However, the inherent complexity of financial data presents significant challenges in accurately predicting stock prices. In response, DL models have gained considerable attention for stock market prediction due to their superior predictive performance across various domains. The integration of these models with advanced data analytics and sentiment analysis techniques, such as BERT, has further enhanced their capability to forecast market trends [2,4]. Several studies have explored stock market predictions using social media data, combining sentiment analysis with historical price information to enhance forecasting accuracy. For instance, a study [14] investigated the performance of LSTM and BiLSTM models in conjunction with sentiment analysis. The results indicated that traditional LSTM outperformed BiLSTM when sentiment analysis was incorporated into the dataset, and in the absence of sentiment analysis, BiLSTM exhibited superior performance. Researchers have extracted valuable insights from various online platforms, including Yahoo’s message boards [15], blogs [16], Twitter [17], and Reddit [18]. Notably, the sentiment of Twitter users has been found to correlate significantly with movements in the Dow Jones Industrial Average (DJIA) [19]. Building upon this, [20] aimed to address existing challenges by leveraging the sentiment analysis of tweets to predict stock prices. Natural language processing (NLP) and DL models—including CNNs, RNNs, LSTMs, and BiLSTMs—were employed for stock price prediction. Among these, LSTM and BiLSTM achieved the highest accuracy. The effectiveness of various ML and DL models in financial forecasting has been widely studied. Researchers have examined artificial neural networks (ANN), support vector machines (SVM), and LSTM networks, emphasizing their unique characteristics and practical applications in shaping investment strategies [21]. One study [22] demonstrated that LSTM-based models achieved over 90% accuracy in stock price prediction, outperforming traditional time-series forecasting methods. Similarly, comparative analyses of multiple ML and DL algorithms consistently identified LSTM as the most efficient model for financial forecasting. Social media platforms have also been investigated for their impact on stock price forecasting. The authors of [23] analyzed StockTwits data using ML techniques, including Naïve Bayes, LR, and SVM, to extract economic sentiment and evaluate its effect on stock prices. Their findings underscore the relevance of sentiment analysis in enhancing financial market predictions. In addition to predictive modeling, recent research has emphasized the importance of explainability in financial time-series forecasting. The application of XAI in financial time-series analysis has shown promise in providing insights into the decision-making mechanisms of deep learning models [24]. The authors of [25] explored various XAI techniques, including feature relevance analysis, layer-wise relevance propagation, and local interpretable model-agnostic explanations (LIME), to elucidate deep learning model predictions. Their results highlighted that the effectiveness of XAI methods depends on the nature of the data and the specific research objectives. Similarly, another study [26] conducted a comprehensive review of XAI techniques applied to time-series data, assessing the strengths and limitations of methods such as SHAP (SHapley Additive exPlanations), LIME, and Integrated Gradients. The study emphasized that selecting an appropriate XAI technique requires careful consideration of the research context and data characteristics.

3. Materials and Methods

3.1. IoB Ecosystem Workflow and Methodology Description

Our IoB ecosystem, depicted in Figure 1, is designed as an end-to-end solution that integrates real-time data acquisition, advanced feature engineering, predictive modeling, explainability, and automated portfolio management to influence and enhance financial decision-making in a robust, transparent, and user-centric manner. The journey begins with the collection of market data (stock prices, trading volumes) and behavioral signals from social media, which are then processed through a feature engineering pipeline. Here, technical indicators such as the 20-day moving average, z-score, and momentum are computed alongside sentiment-driven metrics like sentiment volatility and lagged sentiment. These engineered features feed into a multi-layer LSTM model that forecasts future returns, capturing the complex temporal dependencies inherent in financial data. To ensure transparency and trust, XAI methods—including TimeSHAP and Temporal Importance Model Explanation (TIME)—are applied to interpret the model’s decisions, offering both global and local insights into feature contributions over time. Additionally, the XAI-derived insights will be used to reconstruct the LSTM model with only key features contributing to its performance. The forecasting output drives the portfolio management engine, which generates trading signals through strategies such as mean reversion, momentum, and sentiment-driven approaches, while employing dynamic risk management techniques—including stop-loss, take-profit, and trailing stop-loss mechanisms based on historical volatility—and validating performance via backtesting using metrics like RMSE and directional accuracy. This coherent framework not only supports automated trading, but also provides clear, interpretable visualizations, enabling financial customers to make informed decisions. The overall system—from data ingestion and model prediction to actionable trading strategies—forms the backbone of a broader IoB ecosystem that not only optimizes portfolio performance, but also actively fosters customer engagement. The decision support engine component incorporates a feedback loop where customers’ behavioral responses (e.g., trade adjustments, risk preferences) continuously refine the predictive model and trading strategies, ensuring an adaptive and comprehensive financial management and trading solution. Moreover, by delivering clear visual explanations and performance metrics via interactive dashboards and interfaces, the system empowers financial customers to understand and trust the decision-making process, thereby enhancing their engagement. This synthesis of predictive modeling, explainability, and automated portfolio management not only drives superior financial performance, but also transforms the customer experience, making it more personalized, transparent, and responsive—key objectives within an IoB framework.

3.2. Data Collection

The data used in this study are a combination of two datasets: one of stock market data and the second containing tweets. Financial data were gathered from Yahoo Finance from 30 September 2021 to 30 September 2022, including stock market price and volume data for the corresponding tweets’ stocks (e.g., ‘TSLA’, ‘MSFT’, ‘PG’, ‘META’, ‘AMZN’, ‘GOOG’, ‘AMD’, ‘AAPL’). The tweets dataset contains 80,793 tweets in total and 64,479 unique values for the top 25 most watched stock tickers from 30 September 2021 to 30 September 2022. Table 1 presents the columns in each dataset and their description. Tweets are distributed as follows: Tesla, Inc. (TSLA), 46%; Taiwan Semiconductor Manufacturing Company Limited (TSM), 14%; and the other stocks represent altogether 40% of the dataset. Figure 2 represents the distribution of stocks in the dataset. Therefore, we chose to continue our study with Tesla’s stock since it had the largest volume in the dataset (37,422 tweets, all non-null).

3.3. BERT-Based Sentiment Analysis

BERT, an open-source model that has been trained on a vast dataset encompassing millions of words from the Wikipedia corpus, utilizes a bidirectional transformer encoder. This transformer-based architecture incorporates a self-attention mechanism, allowing it to grasp sentence context and discern relationships between words effectively. BERT applies sub-word tokenization while simultaneously analyzing sentence structure and word interactions. Additionally, it has been pre-trained on social media data and is capable of processing text in both forward and backward directions. In practice, a BERT model fine-tuned for sentiment analysis takes a sentence, processes it with its bidirectional approach, and outputs a sentiment score that quantifies the overall emotion behind the text. It reads the words both before and after each word to understand the intended meaning. For example, when processing the sentence “The bank will close soon”, BERT considers the full context to determine whether “bank” refers to a financial institution or the side of a river. On the other hand, sentiment scores are a way to measure the emotion or attitude conveyed in a sentence on a numerical scale. We assign scores between −1 and 1, where −1 means very negative, 0 means neutral, and 1 means very positive. For the sentence “I absolutely love the current Tesla policy”, the sentiment analysis might assign a score of +0.9, indicating strong positive sentiment, whereas the sentence “I really dislike how Tesla is approaching their customers”, might receive a score of −0.8, reflecting strong negative sentiment. In this research, BERT was selected over NLTK and TextBlob due to its demonstrated superiority in sentiment analysis, as validated by previous studies [27,28], and for its adequacy to the task. Nevertheless, a notable drawback of BERT is its substantial computational demand. Our BERT-based sentiment analysis required 5 min and 54 s on a cloud-based GPU T4 × 2. Using BERT, we preprocessed the selected TSLA tweets and calculated their sentiment scores. Figure 3 represents a sample of tweets with their sentiment scores, and Figure 4 showcases the distribution of daily sentiment scores.
After calculating the sentiment score for a tweet, we add it to our stock dataset as a new column, matching each data row with its corresponding sentiment score based on dates. Table 2 presents a sample of the final dataset that will be used.

3.4. Exploratory Data Analysis

We used exploratory data analysis (EDA) to further analyze and investigate the dataset, visually explore seasonality, trends, and sentiment distribution, and analyze sentiment scores over time. This is also important for feature engineering and model interpretability. Figure 5 depicts the stock prices and sentiment scores, respectively, over time, while Figure 6 illustrates the sentiment scores’ distribution in the dataset. The x-axis represents sentiment values, while the y-axis denotes the frequency of occurrences for each sentiment range. The overlaid density curve indicates that the sentiment values approximately follow a normal distribution, centered around a slightly negative mean. This suggests a tendency towards neutral to slightly negative sentiment in the analyzed data.
The distribution is relatively symmetrical but exhibits minor variations, reflecting the presence of both positive and negative sentiment instances.

3.5. Feature Engineering and Selection

To capture the complex dynamics driving TSLA stock prices, we engineered a range of features from both historical price data and market sentiment derived from tweets processed with BERT. From the technical analysis side, we computed a 20-day moving average (ma_20) of closing price to smooth out short-term volatility and reveal the underlying trend. The z-score is calculated as the difference between the current close and the 20-day moving average, normalized by the 7-day rolling standard deviation of the close; this normalization helps identify significant deviations and potential overbought or oversold conditions, as presented in Figure 7. In addition, the momentum indicator is defined as the difference between the current closing price and the closing price from 10 days prior, providing a measure of the strength and direction of price movement. Figure 8 depicts the momentum and sentiment scores over time; we can see that their directions correlate. To capture the dynamics of future price movements, we further engineered several lagged return features by computing the percentage change in price over different horizons (1, 3, 5, 7, and 14 days). These features offer multiple perspectives on short- and medium-term trends, enabling the model to learn temporal dependencies at different scales. On the sentiment side, two key features were integrated. First, sentiment volatility, computed as the 3-day rolling standard deviation of the sentiment scores, reflects the uncertainty or stability in market sentiment. Second, a lagged sentiment feature incorporates the previous day’s sentiment score, capturing any delayed market reactions. The correlation matrix in Figure 9 indicates that while certain features, such as future return lags, exhibit high intercorrelation, others like momentum and sentiment volatility provide distinct, complementary signals. The 7th-day future return is our target variable, and based on the correlation matrix, we chose to omit the 5th-day future return and the lagged sentiment.
Skewness is a measure of the asymmetry of a distribution. To further ensure that our data were well prepared for our model, we calculated the sentiment score skewness. We calculated a skewness value of 0.01258, indicating that the distribution of the sentiment scores is nearly symmetric and the data are normally distributed. Therefore, there is no need for log transformation or other normalization techniques, as the data do not have a noticeable long tail on either side. To further understand the sharpness (tailedness) of the distribution, we evaluated kurtosis. The calculated kurtosis value for our data is 0.45205, indicating a platykurtic distribution and confirming that the data values are relatively consistent, without many sharp spikes or extreme deviations.

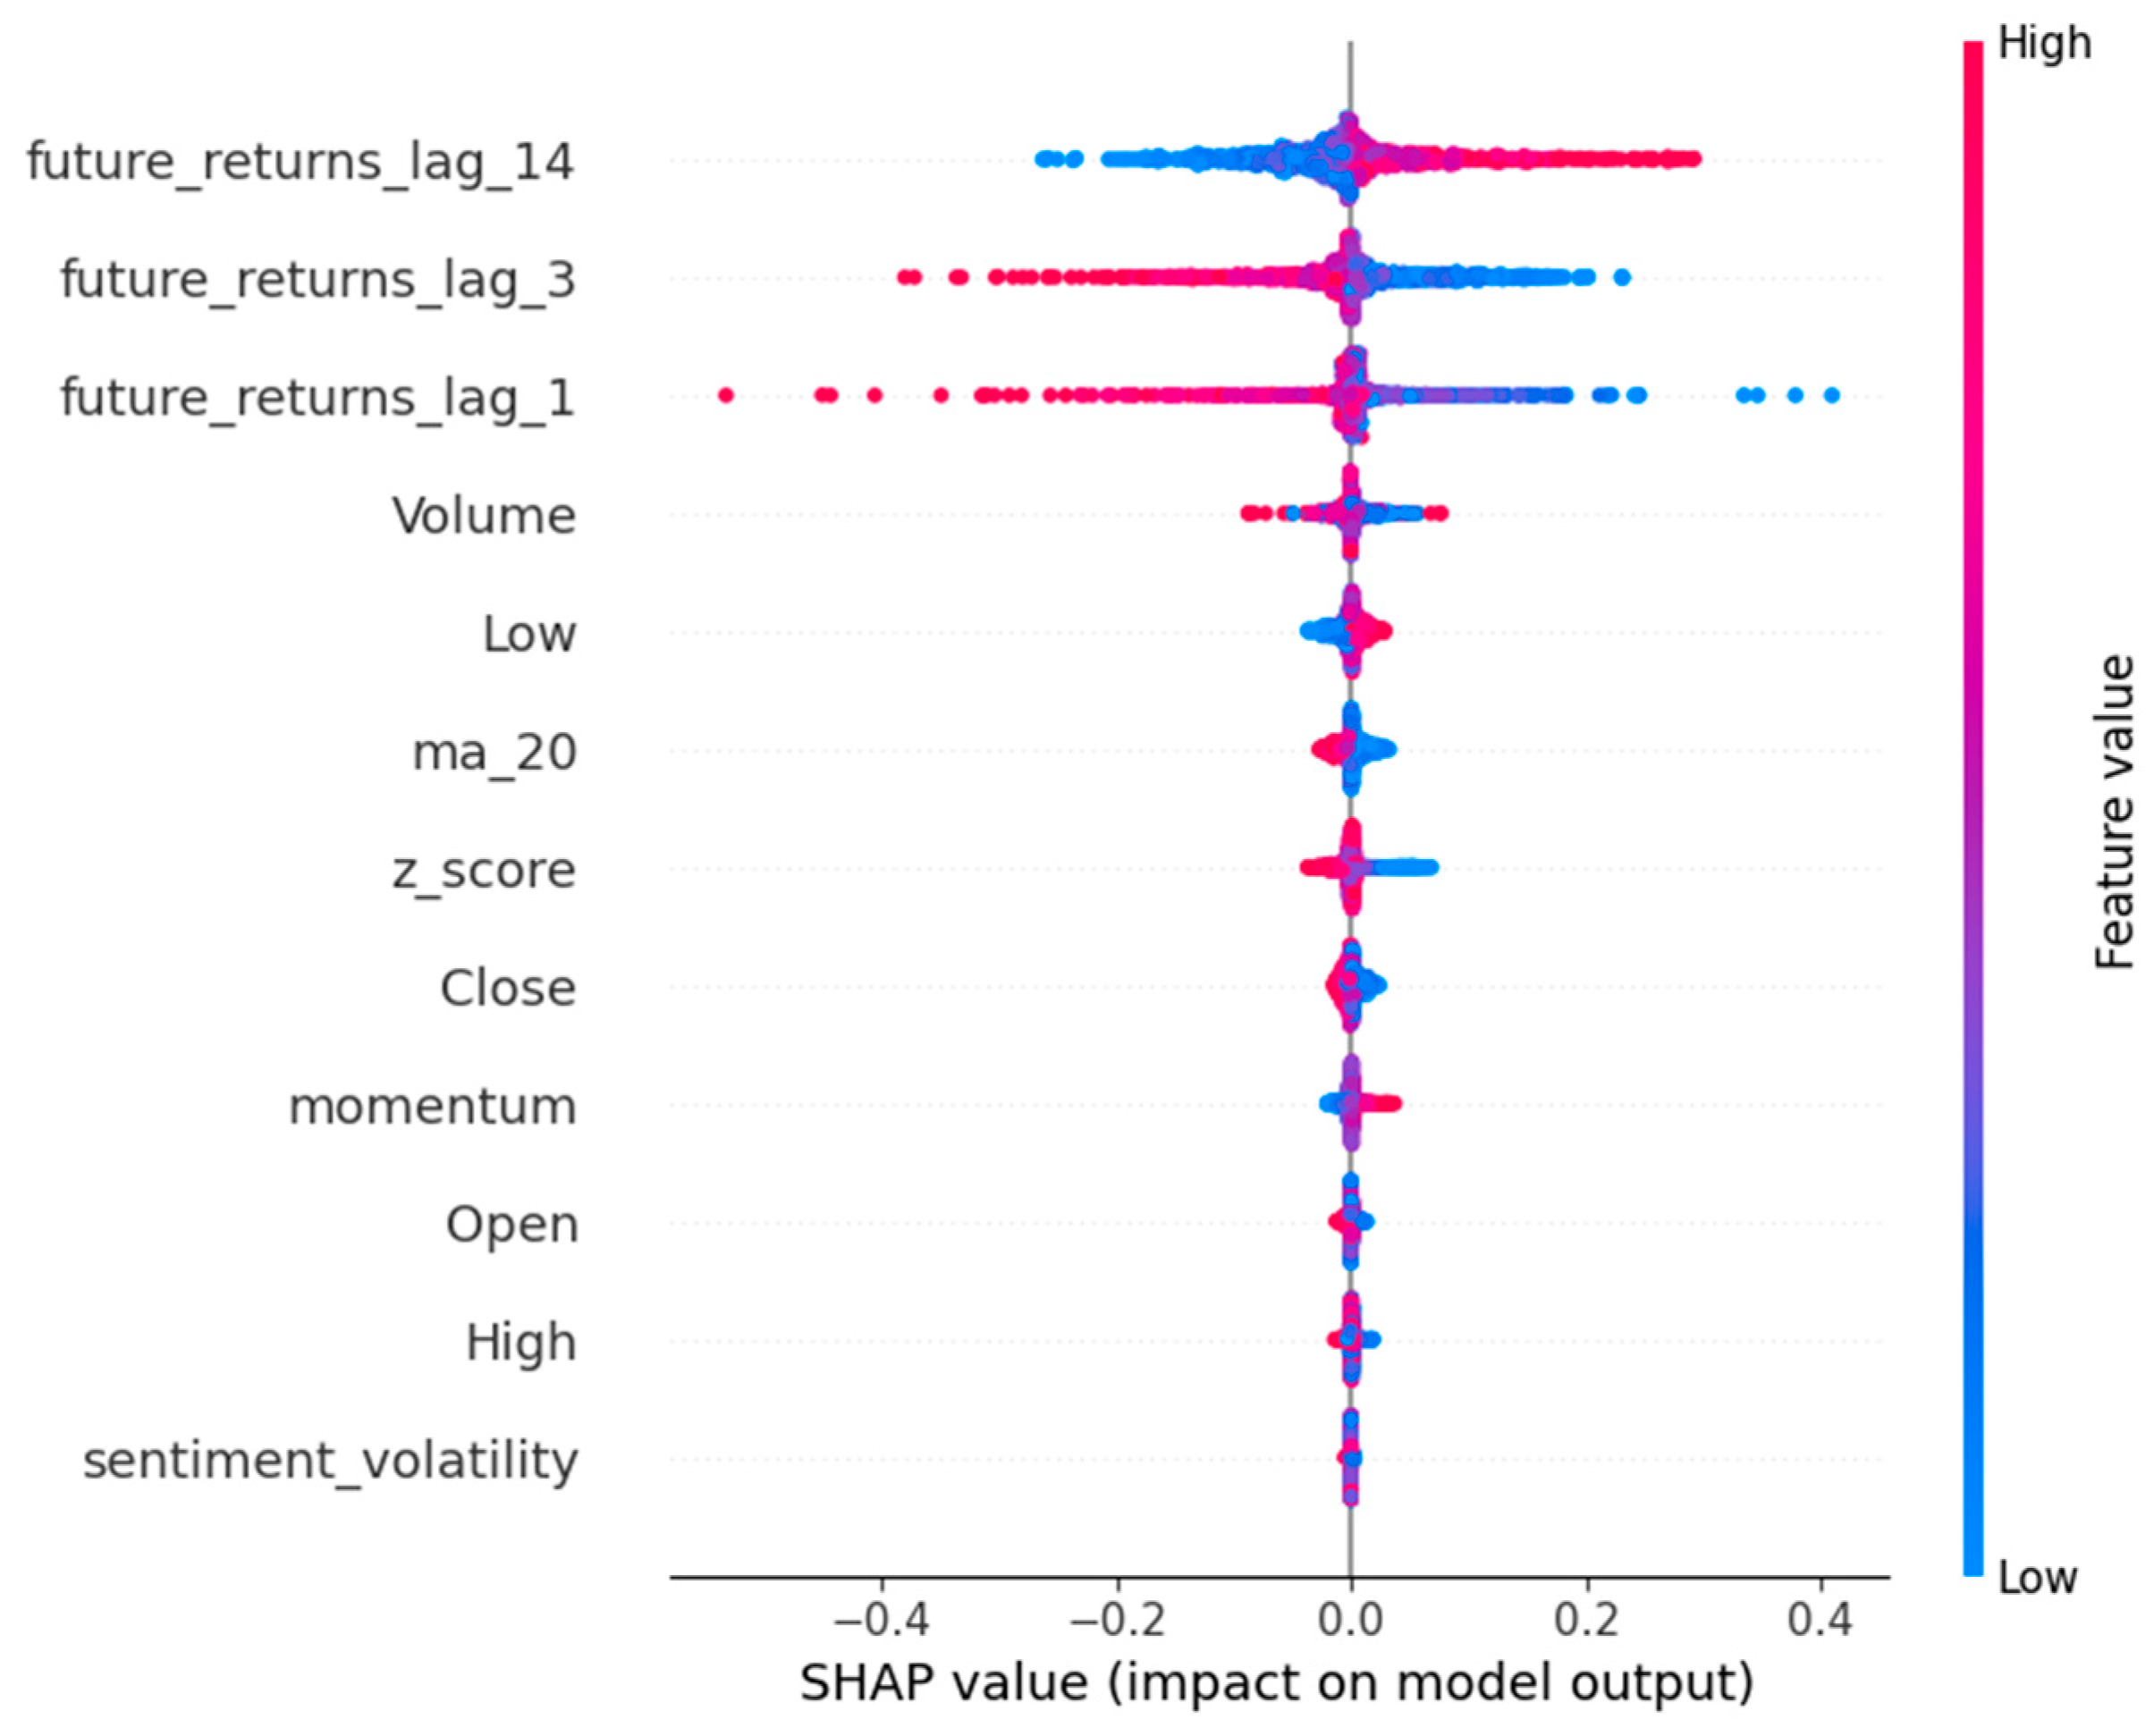
3.6. Time-Series XAI

Our approach leverages advanced XAI techniques specifically tailored for time-series data to uncover and communicate the internal decision-making processes of our LSTM forecasting model. In particular, we employ TimeSHAP and TIME to provide both local and global interpretability. The TimeSHAP analysis reveals that key features substantially influence the predictions over different time steps, while the TIME visualization further elucidates how these features’ importance evolves temporally. TimeSHAP extends the conventional SHAP framework to temporal domains by computing Shapley values for sequential inputs; this allows us to attribute the influence of individual features—such as technical indicators (e.g., z-score, momentum) and sentiment-based metrics—to the model’s predictions over different timesteps. Complementing this, to provide a model-independent global explanation, TIME utilizes a permutation-based method to evaluate the sensitivity of the model’s output by selectively perturbing individual time steps. This yields a temporal importance matrix that highlights which segments of the input sequence are most critical for accurate forecasting. Together, these methods not only facilitate transparency by visually conveying the contribution of each feature and timestep as in Figure 10, but also help us build a more robust and performant model, since only key features contributing the most to the prediction will be used.
These explainability tools validate our feature engineering process, improve the prediction model performance, and contribute to transparency, an essential requirement in an IoB ecosystem. This comprehensive XAI strategy is integral to our broader IoB ecosystem, ensuring that automated portfolio management decisions are both data-driven and interpretable, thereby enhancing customer trust and enabling informed decision-making.

3.7. Model Design

Our forecasting model employs a multi-layer LSTM network to predict TSLA stock returns by integrating both technical and sentiment-based features. The model’s architecture is designed to capture the temporal dependencies inherent in financial time-series data. Specifically, the input to the network consists of sequences of 20 timesteps, where each time step is represented by a 12-dimensional feature vector. These features include traditional price indicators, such as open, high, low, close, and volume; technical indicators, such as a 20-day moving average (ma_20) and the corresponding z-score (computed as the deviation from the moving average, normalized by a 7-day rolling standard deviation); and additional variables such as momentum (the difference between the current close and the close 10 days earlier), along with sentiment-driven metrics, including future returns (lagged over 1, 3, and 14 days) and sentiment volatility. This feature selection is guided by XAI insights, the correlation matrix, and by domain knowledge, and it was validated through backtesting. The LSTM model itself consists of two layers with a hidden dimension of 64 units per layer and a dropout rate of 0.2 to mitigate overfitting. The network processes the input sequence and outputs a single prediction, which corresponds to the 7-day future return. Training is performed using a mean squared error (MSE) loss function optimized with the Adam algorithm at a learning rate of 0.001 over 100 epochs, with the dataset split into 80% training and 20% testing and a batch size of 64. Table 3 summarizes the key hyperparameters and architecture details of our LSTM model.

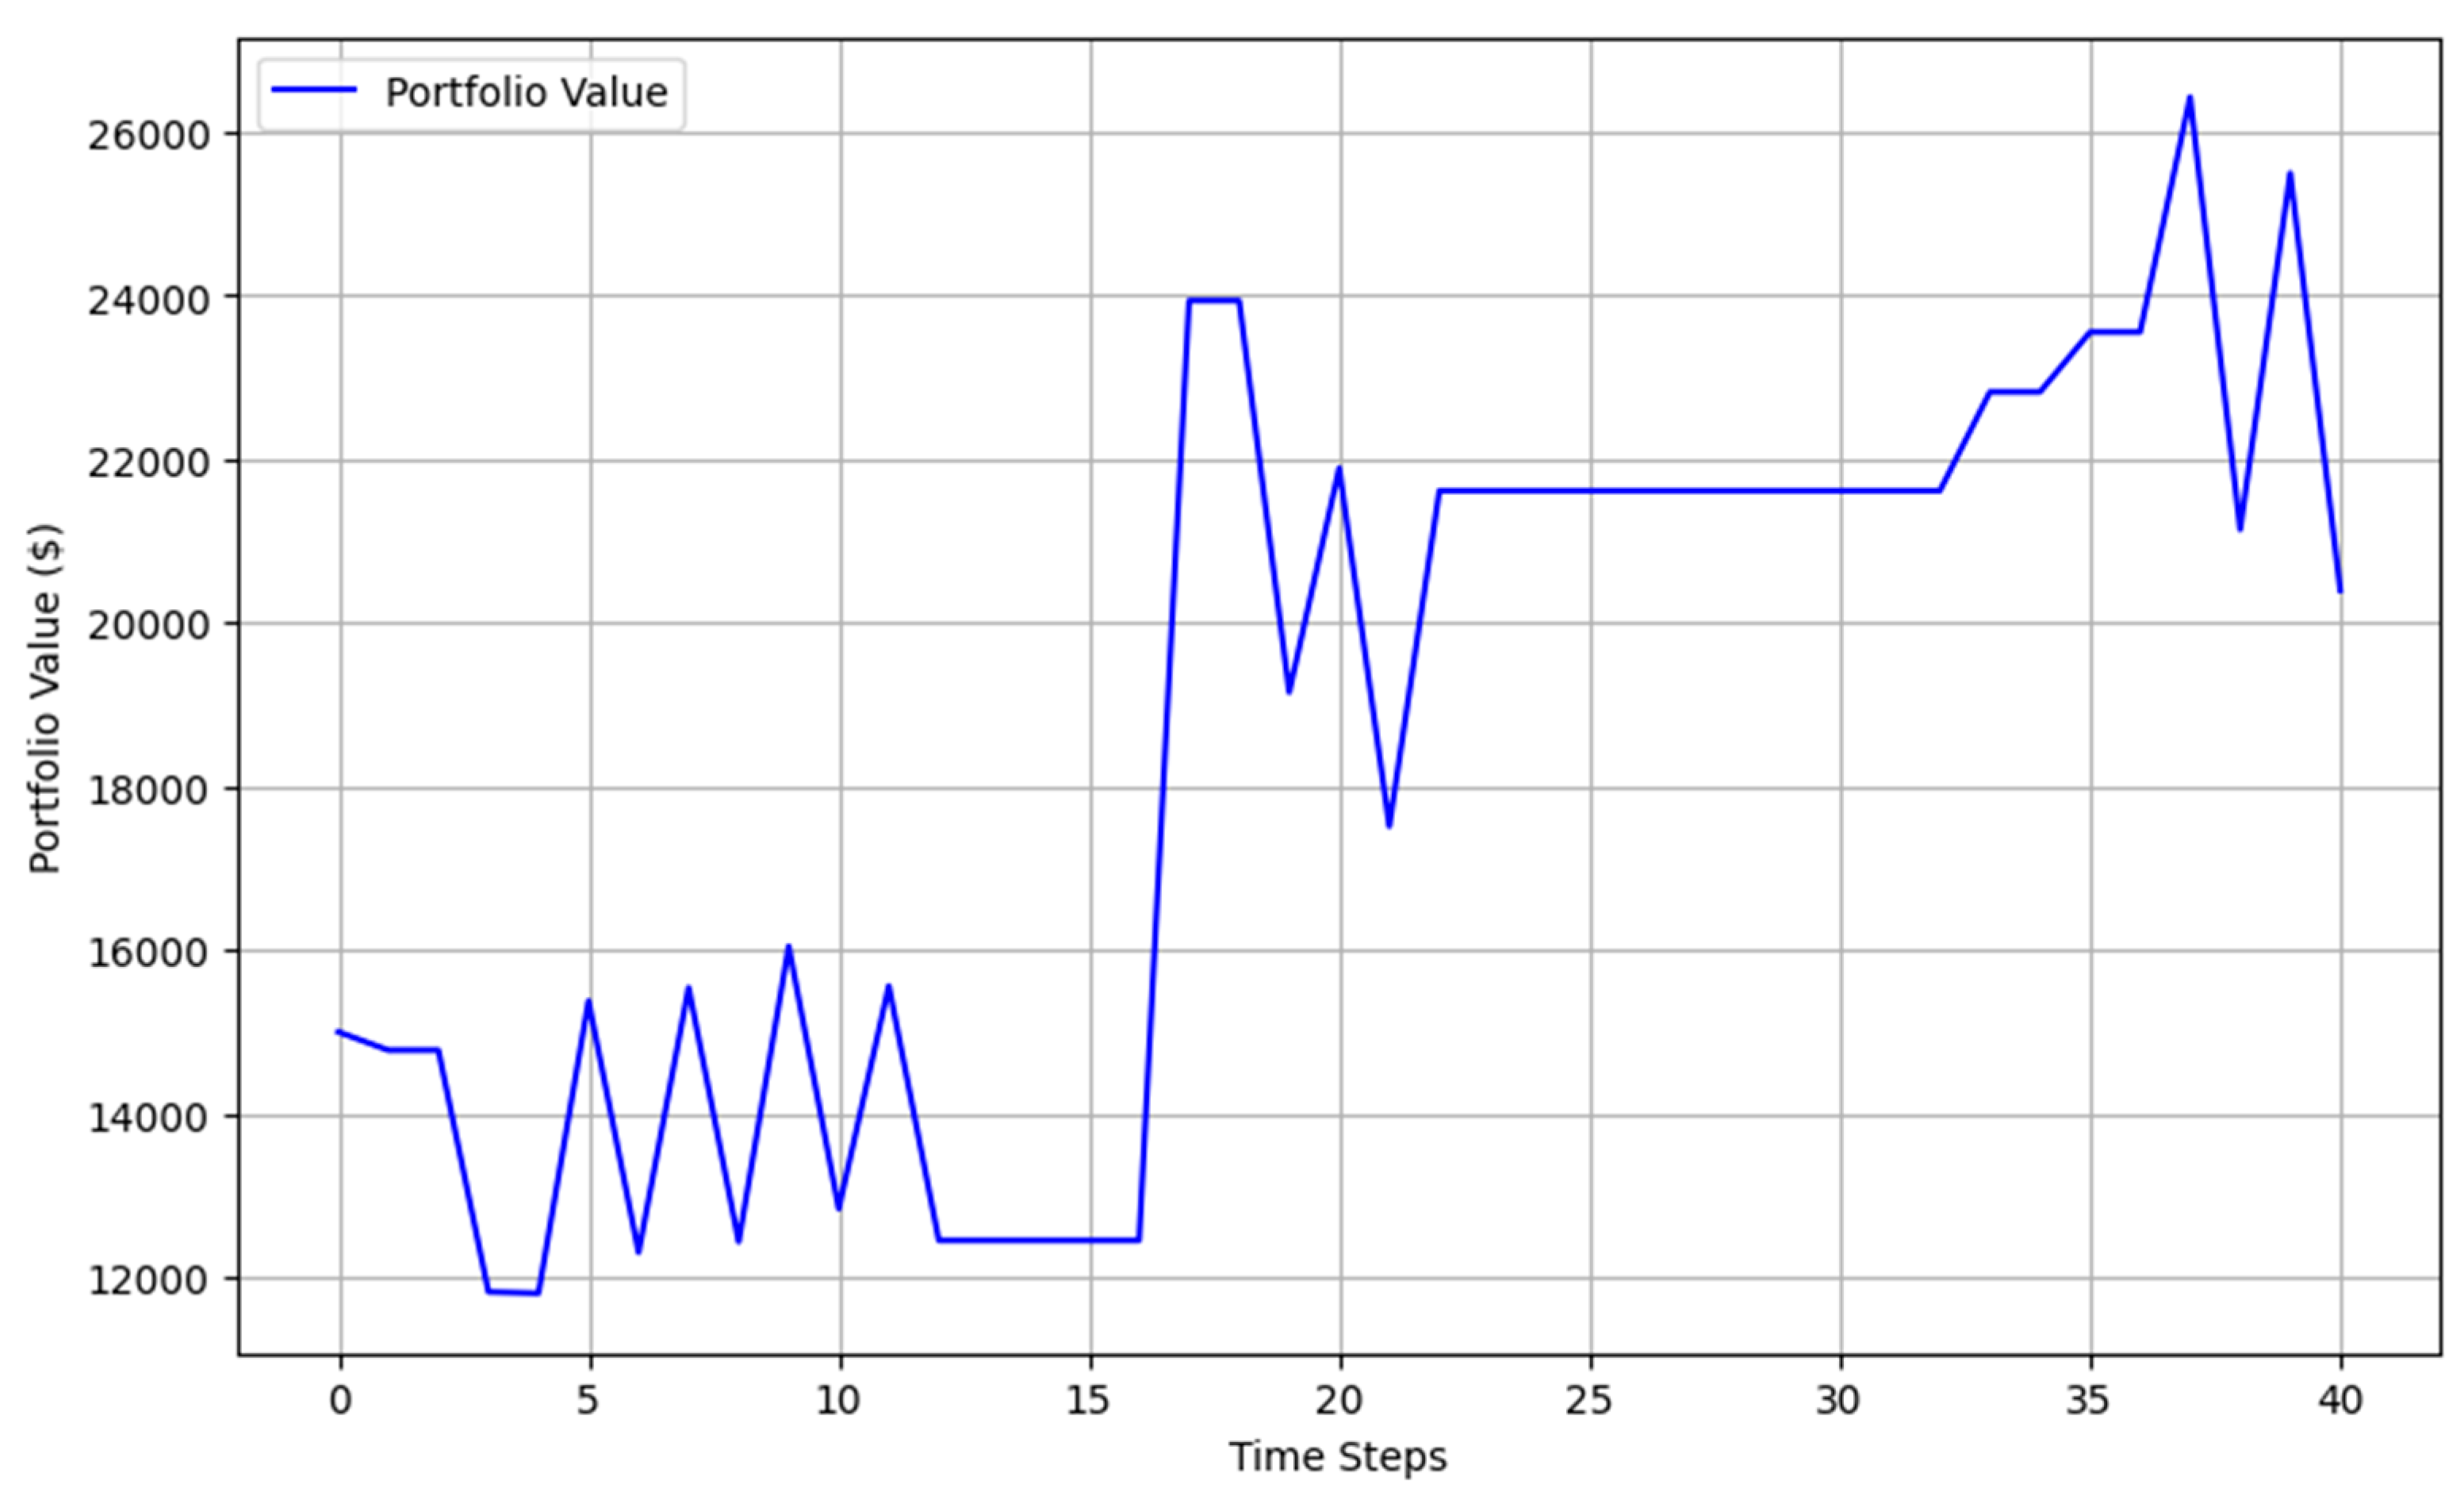
3.8. Portfolio Management

The proposed portfolio management algorithm integrates several trading strategies to automatically adjust a customer’s portfolio based on the model’s predictions. The initial balance represents the starting capital available for trading, while the risk fraction determines the percentage of the balance allocated to each trade. The dynamic threshold—the maximum between a fixed threshold (2%) and a volatility-adjusted measure based on historical price standard deviation—is used to determine whether to enter a trade. When no position is held, a buy signal is generated if the smoothed predicted price change exceeds this threshold, leading to a long position where 10% of the available balance is invested. Conversely, if the predicted change is below the negative of this threshold, a short-selling signal is generated. The strategy incorporates risk management through stop-loss and take-profit levels, set at 3% and 6% away from the entry price, respectively. These levels ensure that positions are closed automatically to either prevent excessive losses or lock in gains. Additionally, a trailing stop-loss mechanism (set at 3%) is implemented for long positions to dynamically adjust the exit threshold as the price moves favorably. For long positions, if the current price falls to the stop-loss level or rises to the take-profit level, the position is closed, thereby limiting losses or locking in gains. Similar rules apply for short positions, where the position is reversed when adverse price movements trigger stop-loss or take-profit conditions. Throughout the trading period, the portfolio value—computed as the sum of the cash balance and the value of any open positions—is updated. This integrated approach leverages elements of mean reversion (via the z-score indicator), momentum (through the momentum feature), and sentiment-driven strategies (by incorporating sentiment volatility and lagged sentiment), thereby providing a robust framework that is both predictive and adaptive. The algorithm is designed to operate seamlessly within the ecosystem, and users would interact with the system through a personalized interface within the IoB ecosystem, which simplifies configuration and execution. The user interface will allow individuals to define key preferences such as risk tolerance, investment amount, and trading strategy selection, without needing in-depth knowledge of the algorithm’s mechanics. Based on these inputs, the system automatically adjusts parameters such as the dynamic threshold for trade execution, the risk fraction per trade, and the stop-loss and take-profit levels, ensuring an optimal balance between risk and reward. Such a system is highly relevant within an IoB ecosystem, where explainable automated portfolio management based on real-time data can enhance financial decision-making and customer trust. The pseudo-code of Algorithm 1 summarizes the core logic of the proposed trading strategy.
Algorithm 1: Portfolio Management Algorithm
Information 16 00338 i001Information 16 00338 i002

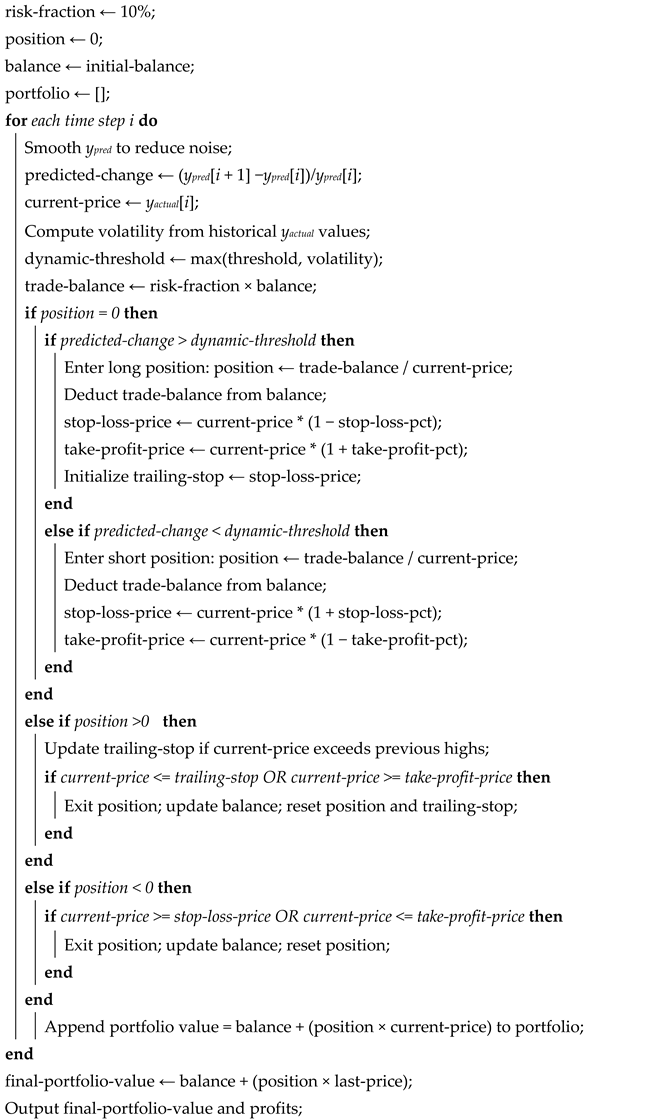
4. Results and Discussion

The experimental results in Table 4 indicate that the reconstructed LSTM forecasting model—after keeping only the key features indicated by XAI—achieves strong performance in predicting TSLA stock returns, with a test RMSE of 0.0312, an MAE of 0.0250, and an MSE of 0.0010, accompanied by an impressive directional accuracy of 95.24%. Although the high MAPE suggests that absolute error percentages remain elevated—likely due to the intrinsic volatility of financial time series—the model reliably captures the directional movements critical for trading decisions. This directional accuracy highlights the model’s ability to capture market trends effectively, which is particularly important in financial time-series forecasting, where directional movement is a key decision-making factor. Compared to the original model with all features, the reconstructed model presents better performance in terms of all metrics. Improvements in the metrics of the restructured model may stem from mitigating the effects of multicollinearity and excluding variables that introduced noise in the original model by narrowing down the explanatory variables to only the important ones. Figure 11 presents the actual and predicted values plot of the reconstructed model and visually demonstrates its alignment with real-world price movements. The predicted values closely follow actual fluctuations, with minor deviations during extreme price swings, indicating that the model successfully captures macro-level trends while short-term noise is challenging. This could be improved in future research by incorporating additional market contexts, such as order book depth or macroeconomic indicators, to refine local trend forecasting.
XAI techniques (i.e., TimeSHAP and TIME) provide granular insights into the model’s internal dynamics. The TIME heatmap in Figure 12 illustrates the temporal dependencies of key input features, where lagged future returns (e.g., future_returns_lag_14 and future_returns_lag_1) exhibit the highest influence on predictions. This aligns with financial market behavior, where recent historical price movements are strong indicators of future trends.
Furthermore, variables such as momentum, moving averages (ma_20), and volatility-related sentiment scores played a crucial role, demonstrating that the model integrates both technical indicators and sentiment-driven features to refine its predictions. The TimeSHAP summary plot presented in Figure 13 further confirms these findings, where SHAP values indicate that past return lags had the most significant impact on the model’s output. The separation of red (high feature values) and blue (low feature values) suggests that high past returns contributed positively to future return predictions, while lower past returns had an inverse effect. Additionally, volume, z-score, and sentiment volatility exhibited moderate yet consistent influence, reinforcing the model’s reliance on both market structure and behavioral factors.
The portfolio performance illustrated in Figure 14 demonstrates the effectiveness of the proposed IoB-driven trading strategy in dynamically responding to market conditions. The strategy incorporates both long and short positions, leveraging stop-loss and take-profit mechanisms to optimize risk-adjusted returns. The initial phase of trading exhibits volatility, with multiple entries and exits leading to fluctuations in portfolio value. However, a significant portfolio appreciation is observed around the midpoint of the time steps, attributed to a series of well-timed short-selling and covering positions, particularly at lower price levels (e.g., 0.01 short-sell and cover cycles). These entries and exits are exposed in Figure 15, depicting the execution log of the portfolio management of Algorithm 1 presented previously. Starting from an initial balance of USD 15,000, the final portfolio value is USD 21,824.12, representing a net profit of USD 6824.12, which indicates a substantial return on investment, demonstrating the efficacy of the proposed framework. By seamlessly synchronizing these components, our IoB ecosystem not only automates portfolio management, but also enhances customer engagement and trust through transparent, explainable decision-making.
Future enhancements could include the integration of additional data streams, such as macroeconomic indicators and other alternative data sources, since sentiment analysis from social media may not capture all nuances of market sentiment, as well as the exploration of hybrid models that combine LSTM with attention mechanisms. We can explore return maps for feature extraction and expand our alternative data sources by analyzing Reddit and StockTwits discussions and Google trends (i.e., search volume for company names/tickers). Moreover, although the portfolio management algorithm includes risk management techniques like stop-loss and take-profit, these strategies are relatively simplistic, and better risk management approaches could be explored in future studies to enhance resilience during market downturns. These improvements are expected to boost predictive accuracy further and enrich the decision-support framework, ultimately driving more effective financial outcomes in an IoB-enabled environment.

5. Conclusions

In conclusion, this research introduces an innovative IoB ecosystem that integrates real-time data acquisition, advanced feature engineering, predictive modeling, explainability, and automated portfolio management to enhance financial decision-making. Our framework effectively captures the complex temporal dependencies in financial data by combining robust technical indicators and sentiment-driven metrics with a multi-layer LSTM forecasting model. Applying XAI methods, namely TimeSHAP and TIME, not only provides transparency into the model’s predictions, but also enhances the model’s performance and builds trust with end users by offering both global and local interpretability of the feature contributions. The portfolio management engine translates these predictions into actionable trading signals, incorporating robust risk management strategies to safeguard investments. The ecosystem also provides a continuous feedback loop to capture user behavior and enable the system to adapt and refine its strategy in alignment with individual preferences and market dynamics. Empirical evaluations demonstrate the ecosystem’s efficacy in improving decision-making and financial outcomes for users. The LSTM forecasting model achieved strong predictive performance on TSLA stock returns, registering a test RMSE of 0.0312, an MAE of 0.0250, and an MSE of 0.0010, along with an impressive directional accuracy of 95.24%. Furthermore, the portfolio management algorithm successfully transformed an initial balance of USD 15,000 into a final portfolio value of USD 21,824.12, resulting in a net profit of USD 6824.12. This work underscores the potential of IoB-driven approaches in revolutionizing financial services, paving the way for more personalized and responsive investment solutions and laying the groundwork for advanced, data-driven financial management systems.

Author Contributions

Conceptualization, methodology, software, formal analysis, data curation, and writing—original draft preparation, I.M.; validation, writing—review and editing, supervision, and project administration, N.G. All authors have read and agreed to the published version of the manuscript.

Funding

This research received no external funding.

Data Availability Statement

Dataset available on request from the authors.

Conflicts of Interest

The authors declare no conflicts of interest.

References

  1. Kusuma, R.M.I.; Ho, T.-T.; Kao, W.-C.; Ou, Y.-Y.; Hua, K.-L. Using Deep Learning Neural Networks and Candlestick Chart Representation to Predict Stock Market. arXiv 2019, arXiv:1903.12258. [Google Scholar]
  2. Jain, R.; Vanzara, R. Emerging Trends in AI-Based Stock Market Prediction: A Comprehensive and Systematic Review. Eng. Proc. 2023, 56, 254. [Google Scholar] [CrossRef]
  3. Altuner, A.B.; Kilimci, Z.H. A Novel Deep Reinforcement Learning Based Stock Direction Prediction using Knowledge Graph and Community Aware Sentiments. Turk. J. Electr. Eng. Comput. Sci. 2021, 30, 1506–1524. [Google Scholar] [CrossRef]
  4. Wang, S.; Bai, Y.; Fu, K.; Wang, L.; Lu, C.-T.; Ji, T. ALERTA-Net: A Temporal Distance-Aware Recurrent Networks for Stock Movement and Volatility Prediction. In Proceedings of the International Conference on Advances in Social Networks Analysis and Mining, Kusadasi, Turkiye, 6–9 November 2023; ACM: New York, NY, USA, 2023; pp. 538–542. [Google Scholar] [CrossRef]
  5. Li, M.; Zhang, Y. Integrating Social Media Data and Historical Stock Prices for Predictive Analysis: A Reinforcement Learning Approach. Int. J. Adv. Comput. Sci. Appl. 2023, 14, 26. [Google Scholar] [CrossRef]
  6. Tarsi, M.; Douzi, S.; Marzak, A. Forecasting financial market dynamics: An in-depth analysis of social media data for predicting price movements in the next day. Soc. Netw. Anal. Min. 2024, 14, 169. [Google Scholar] [CrossRef]
  7. Moustati, I.; Gherabi, N.; Saadi, M. Building an IoB ecosystem for influencing energy consumption in smart cities. Data Metadata 2024, 3, 441. [Google Scholar] [CrossRef]
  8. Moustati, I.; Gherabi, N.; El Massari, H.; Saadi, M. From The Internet of Things (IoT) to The Internet of Behaviors (IoB) for Data Analysis. In Proceedings of the 2023 7th IEEE Congress on Information Science and Technology (CiSt), Essaouira, Morocco, 16–23 December 2023; IEEE: Piscataway, NJ, USA, 2023; pp. 634–639. [Google Scholar] [CrossRef]
  9. Moustati, I.; Gherabi, N.; Saadi, M. Leveraging the internet of behaviours and digital nudges for enhancing customers financial decision-making. Int. J. Comput. Appl. Technol. 2024, 74, 208–221. [Google Scholar] [CrossRef]
  10. Moustati, I.; Gherabi, N.; Saadi, M. Time-Series Forecasting Models for Smart Meters Data: An Empirical Comparison and Analysis. J. Eur. Des Systèmes Autom. 2024, 57, 1419–1427. [Google Scholar] [CrossRef]
  11. Černevičienė, J.; Kabašinskas, A. Explainable artificial intelligence (XAI) in finance: A systematic literature review. Artif. Intell. Rev. 2024, 57, 216. [Google Scholar] [CrossRef]
  12. Teti, E.; Dallocchio, M.; Aniasi, A. The relationship between twitter and stock prices. Evidence from the US technology industry. Technol. Forecast. Soc. Change 2019, 149, 119747. [Google Scholar] [CrossRef]
  13. Sezer, O.B.; Gudelek, M.U.; Ozbayoglu, A.M. Financial Time Series Forecasting with Deep Learning: A Systematic Literature Review: 2005–2019. Appl. Soft Comput. 2020, 90, 106181. [Google Scholar] [CrossRef]
  14. Mujhid, A.; Charisma, R.A.; Girsang, A.S. Comparative Algorithms for Stock Price Prediction Based on Market Sentiment Analysis. In Proceedings of the 2023 6th International Seminar on Research of Information Technology and Intelligent Systems (ISRITI), Batam, Indonesia, 11–12 December 2023; IEEE: Piscataway, NJ, USA, 2023; pp. 530–535. [Google Scholar] [CrossRef]
  15. Das, S.R.; Chen, M.Y. Yahoo! for Amazon: Sentiment Extraction from Small Talk on the Web. Manag. Sci. 2007, 53, 1375–1388. [Google Scholar] [CrossRef]
  16. De Choudhury, M.; Sundaram, H.; John, A.; Seligmann, D.D. Can blog communication dynamics be correlated with stock market activity? In Proceedings of the Nineteenth ACM Conference on Hypertext and Hypermedia, Pittsburgh, PA, USA, 19–21 June 2008; ACM: New York, NY, USA, 2008; pp. 55–60. [Google Scholar] [CrossRef]
  17. Xu, Y.; Cohen, S.B. Stock Movement Prediction from Tweets and Historical Prices. In Proceedings of the 56th Annual Meeting of the Association for Computational Linguistics (Volume 1: Long Papers), Melbourne, Australia, 15–20 July 2018; Association for Computational Linguistics: Stroudsburg, PA, USA, 2018; pp. 1970–1979. [Google Scholar] [CrossRef]
  18. Long, S.; Lucey, B.; Xie, Y.; Yarovaya, L. ‘I just like the stock’: The role of Reddit sentiment in the GameStop share rally. Financ. Rev. 2023, 58, 19–37. [Google Scholar] [CrossRef]
  19. Anshul, M.; Arpit, G. Stock Prediction Using Twitter Sentiment Analysis. 2012. Available online: https://cs229.stanford.edu/proj2011/GoelMittal-StockMarketPredictionUsingTwitterSentimentAnalysis.pdf (accessed on 4 March 2025).
  20. Al-Amri, R.M.; Hadi, A.A.; Mousa, A.H.; Hasan, H.F.; Kadhim, M.S. The Development of a Deep Learning Model for Predicting Stock Prices. J. Adv. Res. Appl. Sci. Eng. Technol. 2023, 31, 208–219. [Google Scholar] [CrossRef]
  21. Chhajer, P.; Shah, M.; Kshirsagar, A. The applications of artificial neural networks, support vector machines, and long–short term memory for stock market prediction. Decis. Anal. J. 2022, 2, 100015. [Google Scholar] [CrossRef]
  22. Nabipour, M.; Nayyeri, P.; Jabani, H.; Mosavi, A.; Salwana, E.; S., S. Deep Learning for Stock Market Prediction. Entropy 2020, 22, 840. [Google Scholar] [CrossRef] [PubMed]
  23. Gupta, R.; Chen, M. Sentiment Analysis for Stock Price Prediction. In Proceedings of the 2020 IEEE Conference on Multimedia Information Processing and Retrieval (MIPR), Shenzhen, China, 6–8 August 2020; IEEE: Piscataway, NJ, USA, 2020; pp. 213–218. [Google Scholar] [CrossRef]
  24. Theissler, A.; Spinnato, F.; Schlegel, U.; Guidotti, R. Explainable AI for Time Series Classification: A Review, Taxonomy and Research Directions. IEEE Access 2022, 10, 100700–100724. [Google Scholar] [CrossRef]
  25. Schlegel, U.; Oelke, D.; Keim, D.A.; El-Assady, M. An Empirical Study of Explainable AI Techniques on Deep Learning Models for Time Series Tasks. arXiv 2020. [Google Scholar]
  26. Jakubiak, N. Analysis of Explainable Artificial Intelligence on Time Series Data. Master’s Thesis, Universitat Politècnica de Catalunya, Barcelona, Spain, 2022. [Google Scholar]
  27. Ccoya, W.; Pinto, E. Comparative Analysis of Libraries for the Sentimental Analysis. arXiv 2023, arXiv:2307.14311. [Google Scholar]
  28. Saha, S.; Showrov, M.I.H.; Rahman, M.M.; Majumder, M.Z.H. VADER vs. BERT: A Comparative Performance Analysis for Sentiment on Coronavirus Outbreak. In Proceedings of the International Conference on Machine Intelligence and Emerging Technologies, Noakhali, Bangladesh, 23–25 September 2022; pp. 371–385. [Google Scholar] [CrossRef]
Figure 1. The IoB ecosystem workflow.
Information 16 00338 g001
Figure 2. The distribution of stocks.
Information 16 00338 g002
Figure 3. Sample of tweets along with their sentiment scores.
Information 16 00338 g003
Figure 4. Visualization of the distribution of daily sentiment score.
Information 16 00338 g004
Figure 5. Visualizing Tesla stock prices and sentiment scores over time.
Information 16 00338 g005
Figure 6. Visualizing the distribution of sentiment scores.
Information 16 00338 g006
Figure 7. The z-score for TSLA prices.
Information 16 00338 g007
Figure 8. Visualizing the momentum and sentiment scores.
Information 16 00338 g008
Figure 9. Correlation matrix with improved features.
Information 16 00338 g009
Figure 10. Visualizing the aggregated feature importance over time.
Information 16 00338 g010
Figure 11. Visualizing the model’s performance through actual and predicted values over time.
Information 16 00338 g011
Figure 12. Visualizing the temporal feature importance (TIME explainability).
Information 16 00338 g012
Figure 13. TimeSHAP summary plot.
Information 16 00338 g013
Figure 14. Visualizing the portfolio’s performance over time.
Information 16 00338 g014
Figure 15. Visualizing the portfolio management algorithm execution log.
Information 16 00338 g015
Table 1. The datasets and their description.
ColumnDescription
The tweets datasetDateDate and time of the tweet
TweetFull text of the tweet
Stock nameFull stock ticker name for which the tweet was scraped
Company nameFull company name for corresponding tweet and stock ticker
The stock market datasetOpenThe opening price for the corresponding day
HighThe highest price for the corresponding day
LowThe lowest price for the corresponding day
CloseThe closing price for the corresponding day
Adj closeThe adjusted close price for the corresponding day
VolumeThe volume for the corresponding day
Stock nameThe stock name
Table 2. A sample of stock market data rows after adding the sentiment score.
DateOpenHighLowCloseAdj CloseVolumeStock NameSentiment Score
30 September 2021260.3333263.0433258.3333258.4933258.493353,868,000TSLA−0.124677
1 October 2021259.4666260.2600254.5299258.4066258.406651,094,200TSLA−0.057836
4 October 2021265.5000268.9899258.7066260.5100260.510091,449,900TSLA−0.113931
5 October 2021261.6000265.7699258.0666260.1966260.196655,297,800TSLA−0.106666
6 October 2021258.7333262.2200257.7399260.9166260.916643,898,400TSLA−0.023411
Table 3. LSTM model architecture and hyperparameters.
ParameterValueDescription
Input Sequence Length20Number of timesteps per input sequence
Input Dimension12Number of engineered features per timestep
Hidden Dimension64Number of hidden units in each LSTM layer
Number of LSTM Layers2Stacked LSTM layers for capturing complex dynamics
Dropout Rate0.2Fraction of units to drop for regularization
Output Dimension1Single-step prediction (future_returns_lag_7)
Loss FunctionMSERegression loss for forecasting
OptimizerAdamAdaptive optimizer with learning rate 0.001
Number of Epochs100Training iterations
Batch Size64Number of samples per gradient update
Table 4. The model’s prediction performance.
MetricRoot Mean Squared Error (RMSE)Mean Absolute Error (MAE)Mean Squared Error (MSE)Mean Absolute Percentage Error (MAPE)Directional Accuracy
Reconstructed model0.03120.02500.00101.023895.24%
Original model0.37590.30100.14131.152390.48%
Disclaimer/Publisher’s Note: The statements, opinions and data contained in all publications are solely those of the individual author(s) and contributor(s) and not of MDPI and/or the editor(s). MDPI and/or the editor(s) disclaim responsibility for any injury to people or property resulting from any ideas, methods, instructions or products referred to in the content.

